Article

An Enhanced Smartphone Indoor Positioning Scheme with Outlier Removal Using Machine Learning

1
State Key Laboratory of Information Engineering in Surveying, Mapping and Remote Sensing, Wuhan University, Wuhan 430079, China
2
Collaborative Innovation Center for Geospatial Technology, Wuhan 430079, China
3
Department of Remote Sensing and Photogrammetry and The Center of Excellence in Laser Scanning Research, Finnish Geospatial Research Institute, 02430 Masala, Finland
*
Author to whom correspondence should be addressed.
Remote Sens. 2021, 13(6), 1106; https://doi.org/10.3390/rs13061106
Submission received: 11 January 2021 / Revised: 20 February 2021 / Accepted: 5 March 2021 / Published: 14 March 2021
(This article belongs to the Section Engineering Remote Sensing)

Abstract

:
In smartphone indoor positioning, owing to the strong complementarity between pedestrian dead reckoning (PDR) and WiFi, a hybrid fusion scheme of them is drawing more and more attention. However, the outlier of WiFi will easily degrade the performance of the scheme, to remove them, many researches have been proposed such as: improving the WiFi individually or enhancing the scheme. Nevertheless, due to the inherent received signal strength (RSS) variation, there still exist some unremoved outliers. To solve this problem, this paper proposes the first outlier detection and removal strategy with the aid of Machine Learning (ML), so called WiFi-AGNES (Agglomerative Nesting), based on the extracted positioning characteristics of WiFi when the pedestrian is static. Then, the paper proposes the second outlier detection and removal strategy, so called WiFi-Chain, based on the extracted positioning characteristics of WiFi, PDR, and their complementary characteristics when the pedestrian is walking. Finally, a hybrid fusion scheme is proposed, which integrates the two proposed strategies, WiFi, PDR with an inertial-navigation-system-based (INS-based) attitude heading reference system (AHRS) via Extended Kalman Filter (EKF), and an Unscented Kalman Filter (UKF). The experiment results show that the two proposed strategies are effective and robust. With WiFi-AGNES, the minimum percentage of the maximum error (MaxE) is reduced by 66.5%; with WiFi-Chain, the MaxE of WiFi is less than 4.3 m; further the proposed scheme achieves the best performance, where the root mean square error (RMSE) is 1.43 m. Moreover, since characteristics are universal, the proposed scheme integrated the two characteristic-based strategies also possesses strong robustness.

Graphical Abstract

1. Introduction

In recent years, location-based services (LBS) have become increasingly important due to their potential applications such as parcel or vehicle tracking, parking service, emergency responders, social networking, and mobile commerce [1]. To obtain a high-quality LBS, trustworthy positioning is highly demanding. At present, the accurate positioning has been perfectly provided by Global Navigation Satellite Systems (GNSS) in the outdoor open-sky environment, while the indoor positioning is still an unsolved problem due to the unavailability or degradation of GNSS signals [2,3], etc. Therefore, various excellent indoor positioning technologies have been designed and developed, such as Bluetooth Low Energy (BLE) [4,5], WiFi RTT [6,7], Light [8], Acoustic [9], Radio Frequency Identification (RFID) [10], Ultra-Wideband (UWB) [11], Magnetic Matching (MM) [12], Visual [13,14], Pedestrian Dead Reckoning (PDR) [15,16,17,18,19,20,21,22,23], and IEEE 802.11WLAN (WiFi) [24,25,26,27,28,29,30,31,32,33,34,35,36,37,38,39,40,41,42,43,44,45,46,47,48,49]. Since each technology has its advantages and disadvantages, the hybrid fusion scheme has become the mainstream research direction. Among these schemes, owing to the strong complementarity between PDR and WiFi, the fusion of them has gained plenty of attention [50,51,52,53,54,55,56], and therefore becomes the research content of this paper.
For PDR technology, it contains three critical procedures: azimuth estimation, step detection, and step length estimation [16]. Various algorithms are designed for azimuth estimation based on the micro-electro-mechanical system (MEMS) inertial-measurement-unit (IMU) built-in smartphone. And various algorithms are designed for step detection such as peak detection, zero-crossing, and auto/cross-correlation, etc. Further, the step length is estimated by some models, such as Weinberg model, Kim model, and Scarlet model, etc. Although a Robust Adaptive Kalman Filter (RAKF) [20] or a Robust PDR (R-PDR) algorithm [21] can enhance the positioning performance and maintain the accuracy in the short-term, due to the low quality of smartphones’ built-in MEMS IMU, the accumulative error inevitably exists without upper bounds.
For WiFi technology, many studies have developed different positioning approaches, such as the time of arrival (TOA) [57], time difference of arrival (TDOA) [58], and angle of arrival (AOA) [59]. However, these approaches require special hardware, which may not be feasible for a smartphone [25]. As an alternative, the received signal strength (RSS) which can be directly observed by smartphones has been utilized for positioning in two approaches: trilateration [60] and fingerprinting [24]. The trilateration approach converts RSS into distances between access points (APs) and a smartphone, therefore, it needs to know the locations of at least three APs. Compared to the trilateration approach, the fingerprinting approach has gained plenty of attention because it is infrastructure-free and can provide a more excellent performance [25]. Therefore, we only focus on the fingerprinting-based approach in this paper. The fingerprinting approach consists of two phases: offline and online phase. In the offline phase, a radio map is established to describe the relationship between the RSS and the reference points (RPs) within the area of interest. In the online phase, the positioning coordinate will be estimated by matching the real-time RSS measurement received from the smartphone with the established radio map. Previous researches have demonstrated that the fingerprinting approach possesses an accuracy of approximately 5 m [26]. Moreover, due to the inherent RSS variation, there inevitably exist some outliers in WiFi technology.
Based on the abovementioned situation, the hybrid fusion scheme integrated PDR and WiFi exists a significant problem: the outlier of WiFi will easily degrade the performance of the scheme. To solve this problem, from the authors’ point of view, there are two main types of solutions:
  • Improving the WiFi individually: Five nearest neighbor (NN)-based algorithms are compared based on the same radio map named Database2 in [28], which contains 100 RPs and the distance between adjacent RPs is about 2.4 m. A physical distance of the RSS algorithm is proposed in [29] to estimate the positioning coordinate and achieves a root mean square error (RMSE) of 4.49 m and a maximum error (MaxE) of about 10 m. An affinity propagation clustering (APC) algorithm is proposed in [30] and achieves an RMSE of 4.90 m and a MaxE of about 10 m. An optimal weight KNN (OWKNN) algorithm which employs the Euclidean distance is proposed in [31] and achieves an RMSE of 5.54 m and a MaxE of about 10 m. ZiLoc is proposed in [32] which employs the Manhattan distance and achieves an RMSE of 5.88 m and a MaxE of about 10 m. An approximate-position-distance-based WKNN (APD-WKNN) algorithm is proposed in [28] and achieves an RMSE of 3.52 m and a MaxE of about 10 m. In summary, although many excellent algorithms have been proposed, due to the inherent RSS variation, the outliers of WiFi inevitably exist in WiFi technology, which has become a challenge for the hybrid fusion scheme.
  • Enhance the hybrid fusion scheme: Li [50] proposed a robustly constrained Kalman filter (KF) scheme. The integrated WiFi of the scheme achieves a MaxE of over than 13 m. To lessen the effect of outliers, a chi-square test which based on Gaussian assumption is employed. However, the Gaussian assumption is not easy to be guaranteed in practical applications due to the RSS variation caused by the signal refraction, reflection, scattering, and multi-path fading. Thus, the unremoved outliers will degrade the performance of the scheme. Hu [51] proposed a Segment-based PDR/WiFi scheme. In the scheme, although the AP whose RSS less than -80 dBm is deleted in the online phase, the integrated WiFi achieves a mean error (ME) of 5.3 m and a MaxE of over 20 m, which demonstrates that there still exist many outliers. Moreover, the scheme defines a fixed size window and utilizes the averaged coordinate of the WiFi in the window to realize the fusion. However, the WiFi positioning coordinates will concentrate on a small area sometimes [52]. Therefore, the averaged coordinate may be an outlier and further will degrade the performance of the scheme. Chen [53] proposed an INS/WiFi scheme. The scheme employs a pre-processing technique to enhance the WiFi signal quality and a Multi-dimensional Dynamic Time Warping (MDTW) to improve the WiFi. However, the improved WiFi achieves a ME of 6.33 m and a MaxE of 11.78 m on handheld motion in the first experiment, which demonstrates that there still exist many outliers. Although the scheme automatically adjusts the weighting coefficients of WiFi, the unremoved outliers will still be integrated into the scheme and inevitably degrade the performance of the scheme. In summary, although many excellent hybrid fusion schemes have been proposed, due to the inherent RSS variation, the outliers of WiFi still exist and has become a challenge for the hybrid fusion scheme.
The outlier inevitably exists in WiFi technology due to the inherent RSS variation, moreover, the unremoved outliers will easily degrade the performance of the scheme. To this end, in this paper, we proposed two strategies to realize the outlier detection and removal. The proposed rationale is: the strategy comes from the sufficient mining and utilization of the positioning characteristics of PDR and WiFi and the complementarity between them. A noteworthy difference from the existing schemes is that the existing schemes only utilize the complementarity to fuse PDR and WiFi and unexpectedly ignore the capacity of the complementarity in outlier detection and removal, which is sufficiently utilized in this paper. The contributions of this paper are summarized as follows:
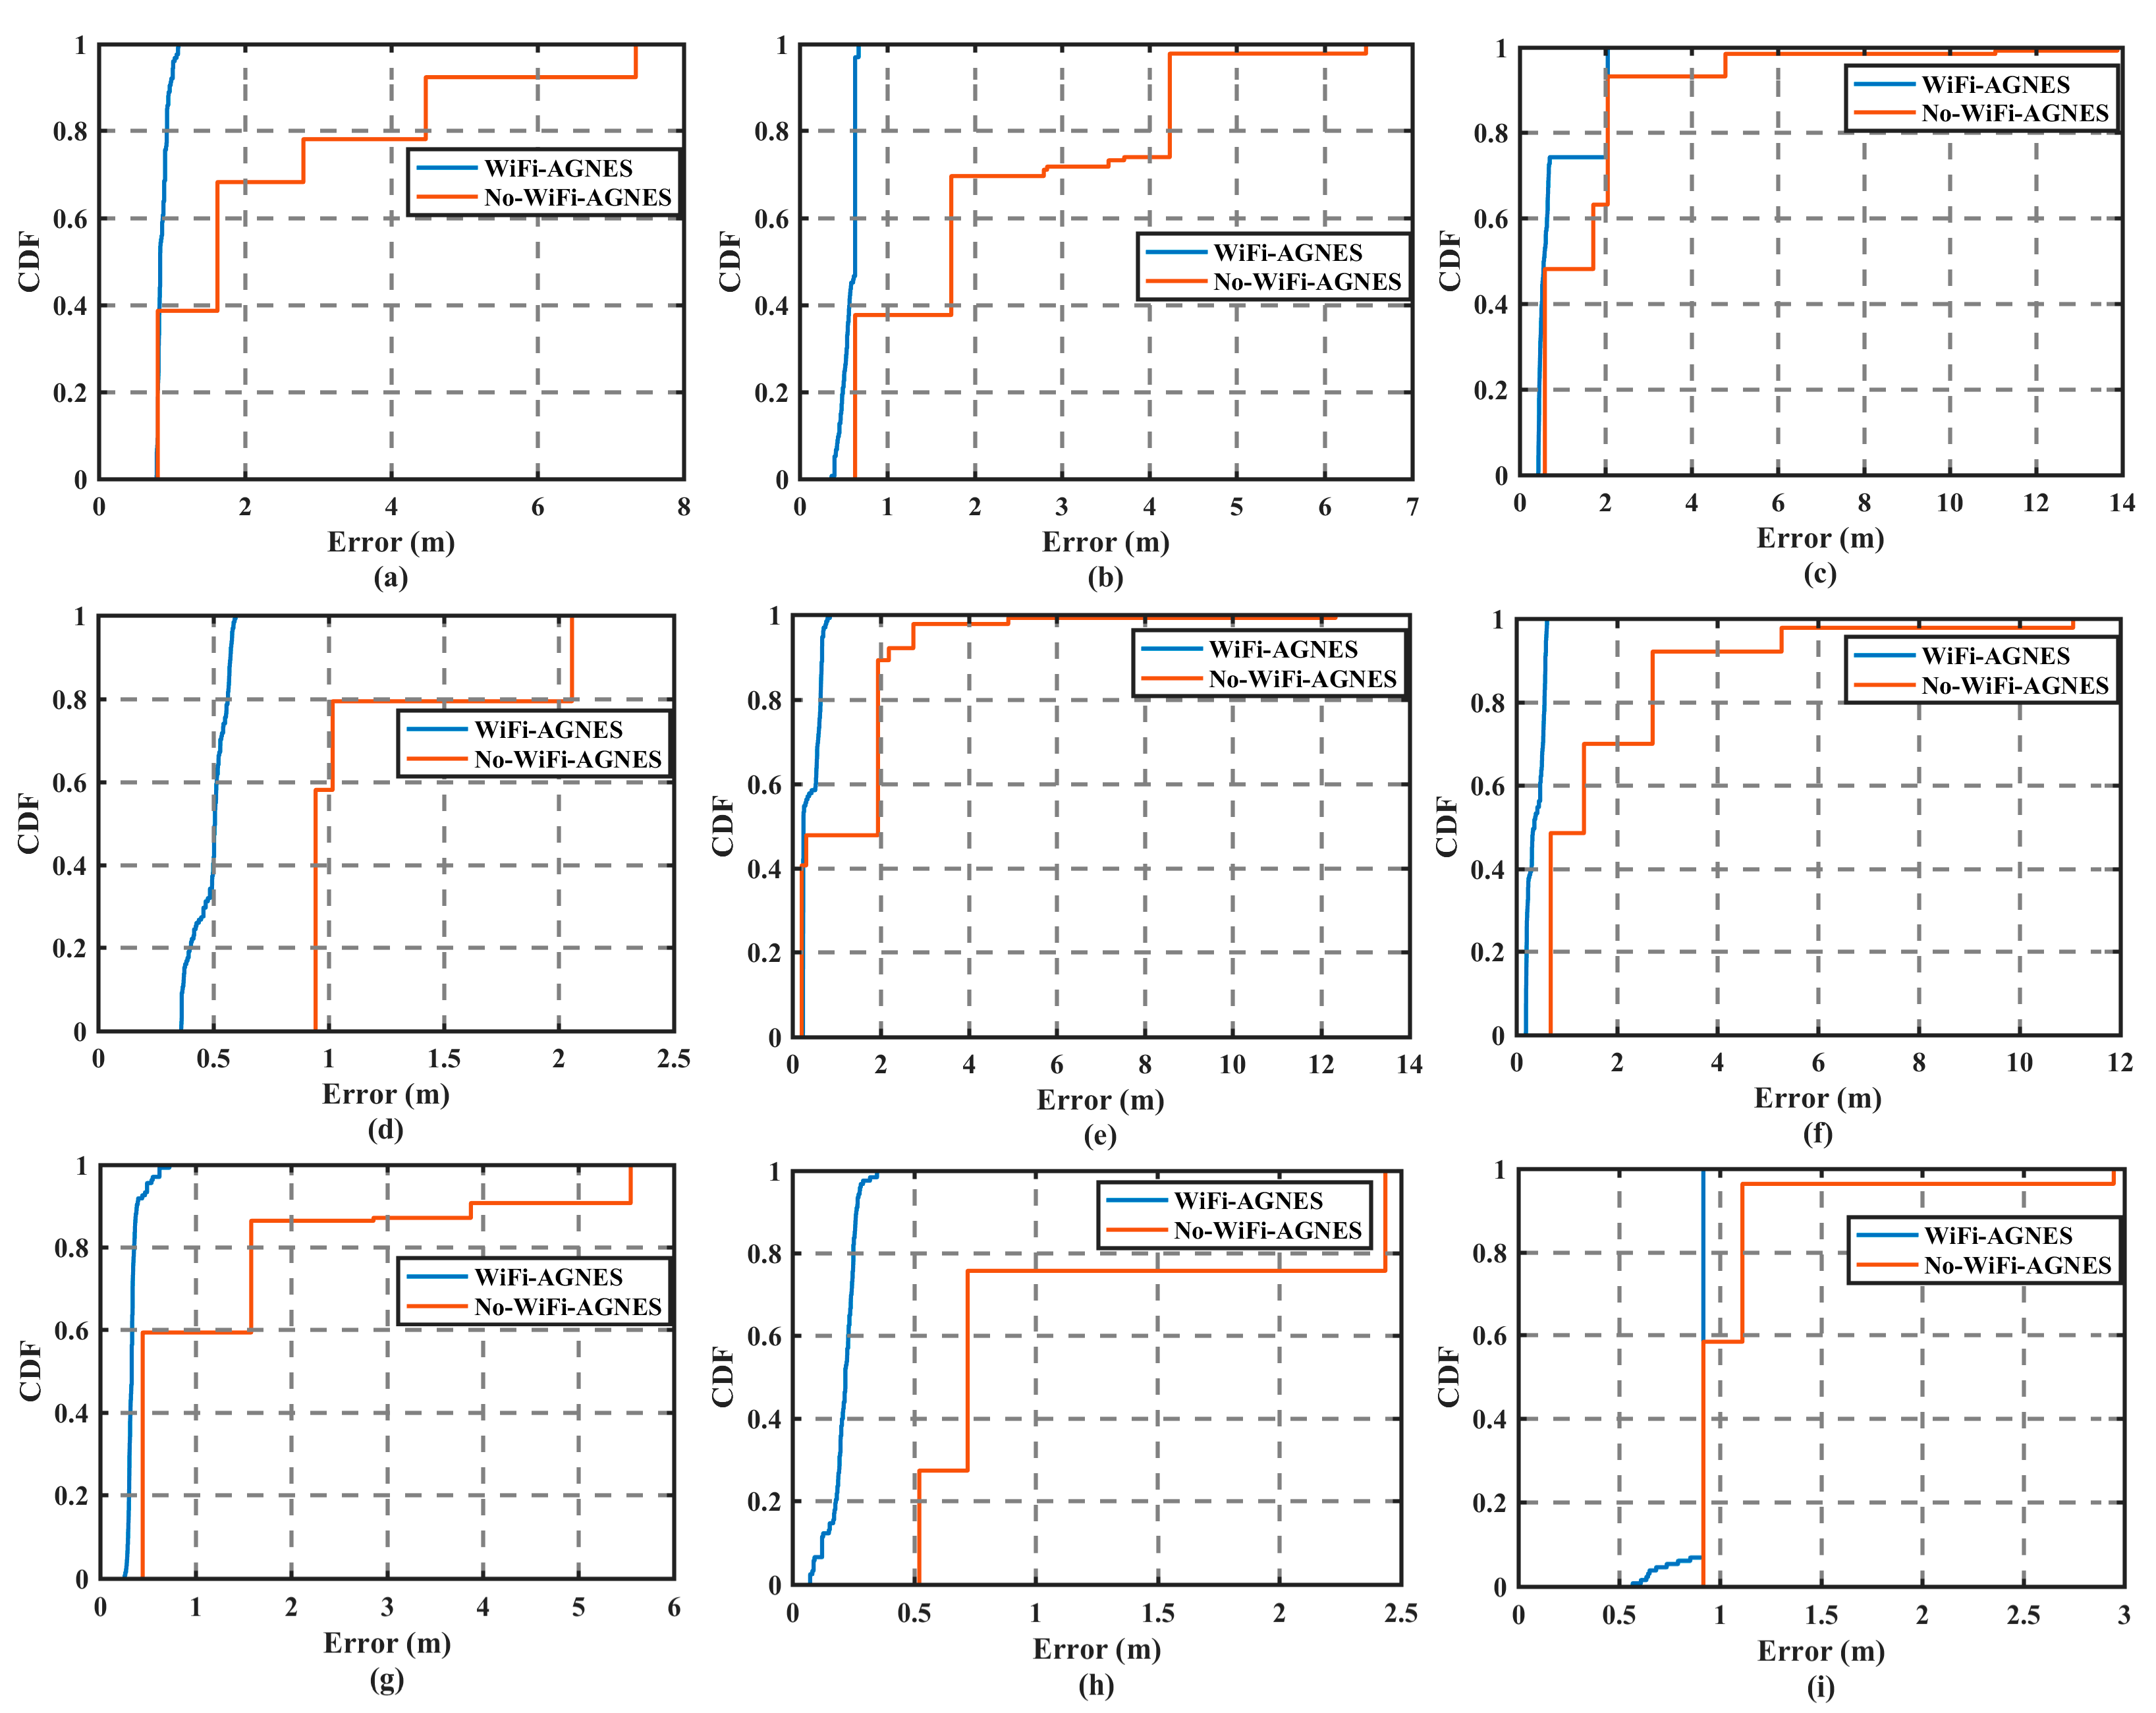
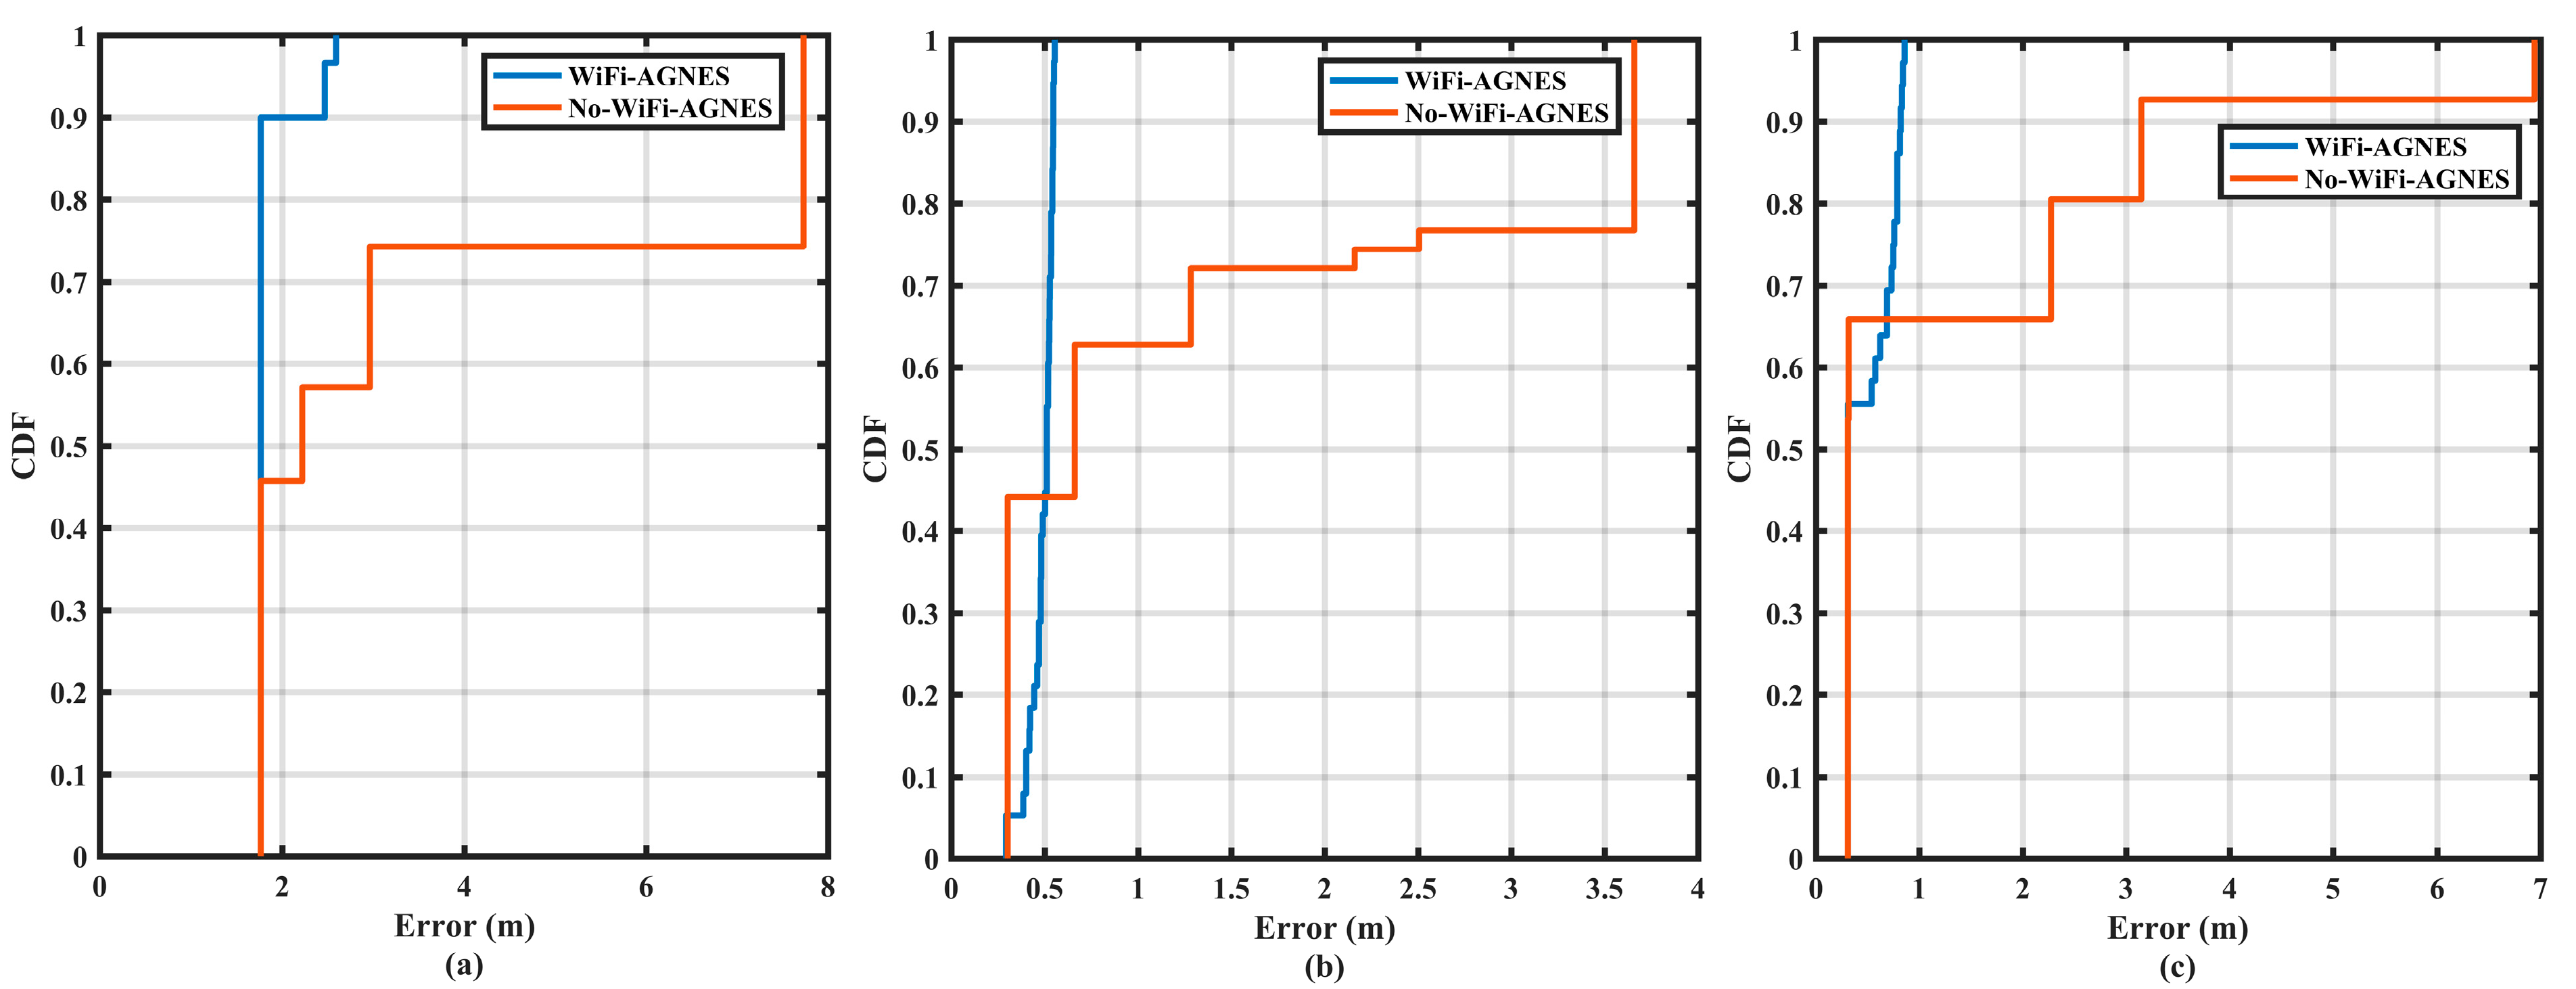
  • We reasonably assume that the motion state of the pedestrian in smartphone indoor positioning comprises static and walking, then based on the extracted positioning characteristics of WiFi when the pedestrian is static, we proposed the first outlier detection and removal strategy using Machine Learning (ML) named WiFi-AGNES (Agglomerative Nesting).
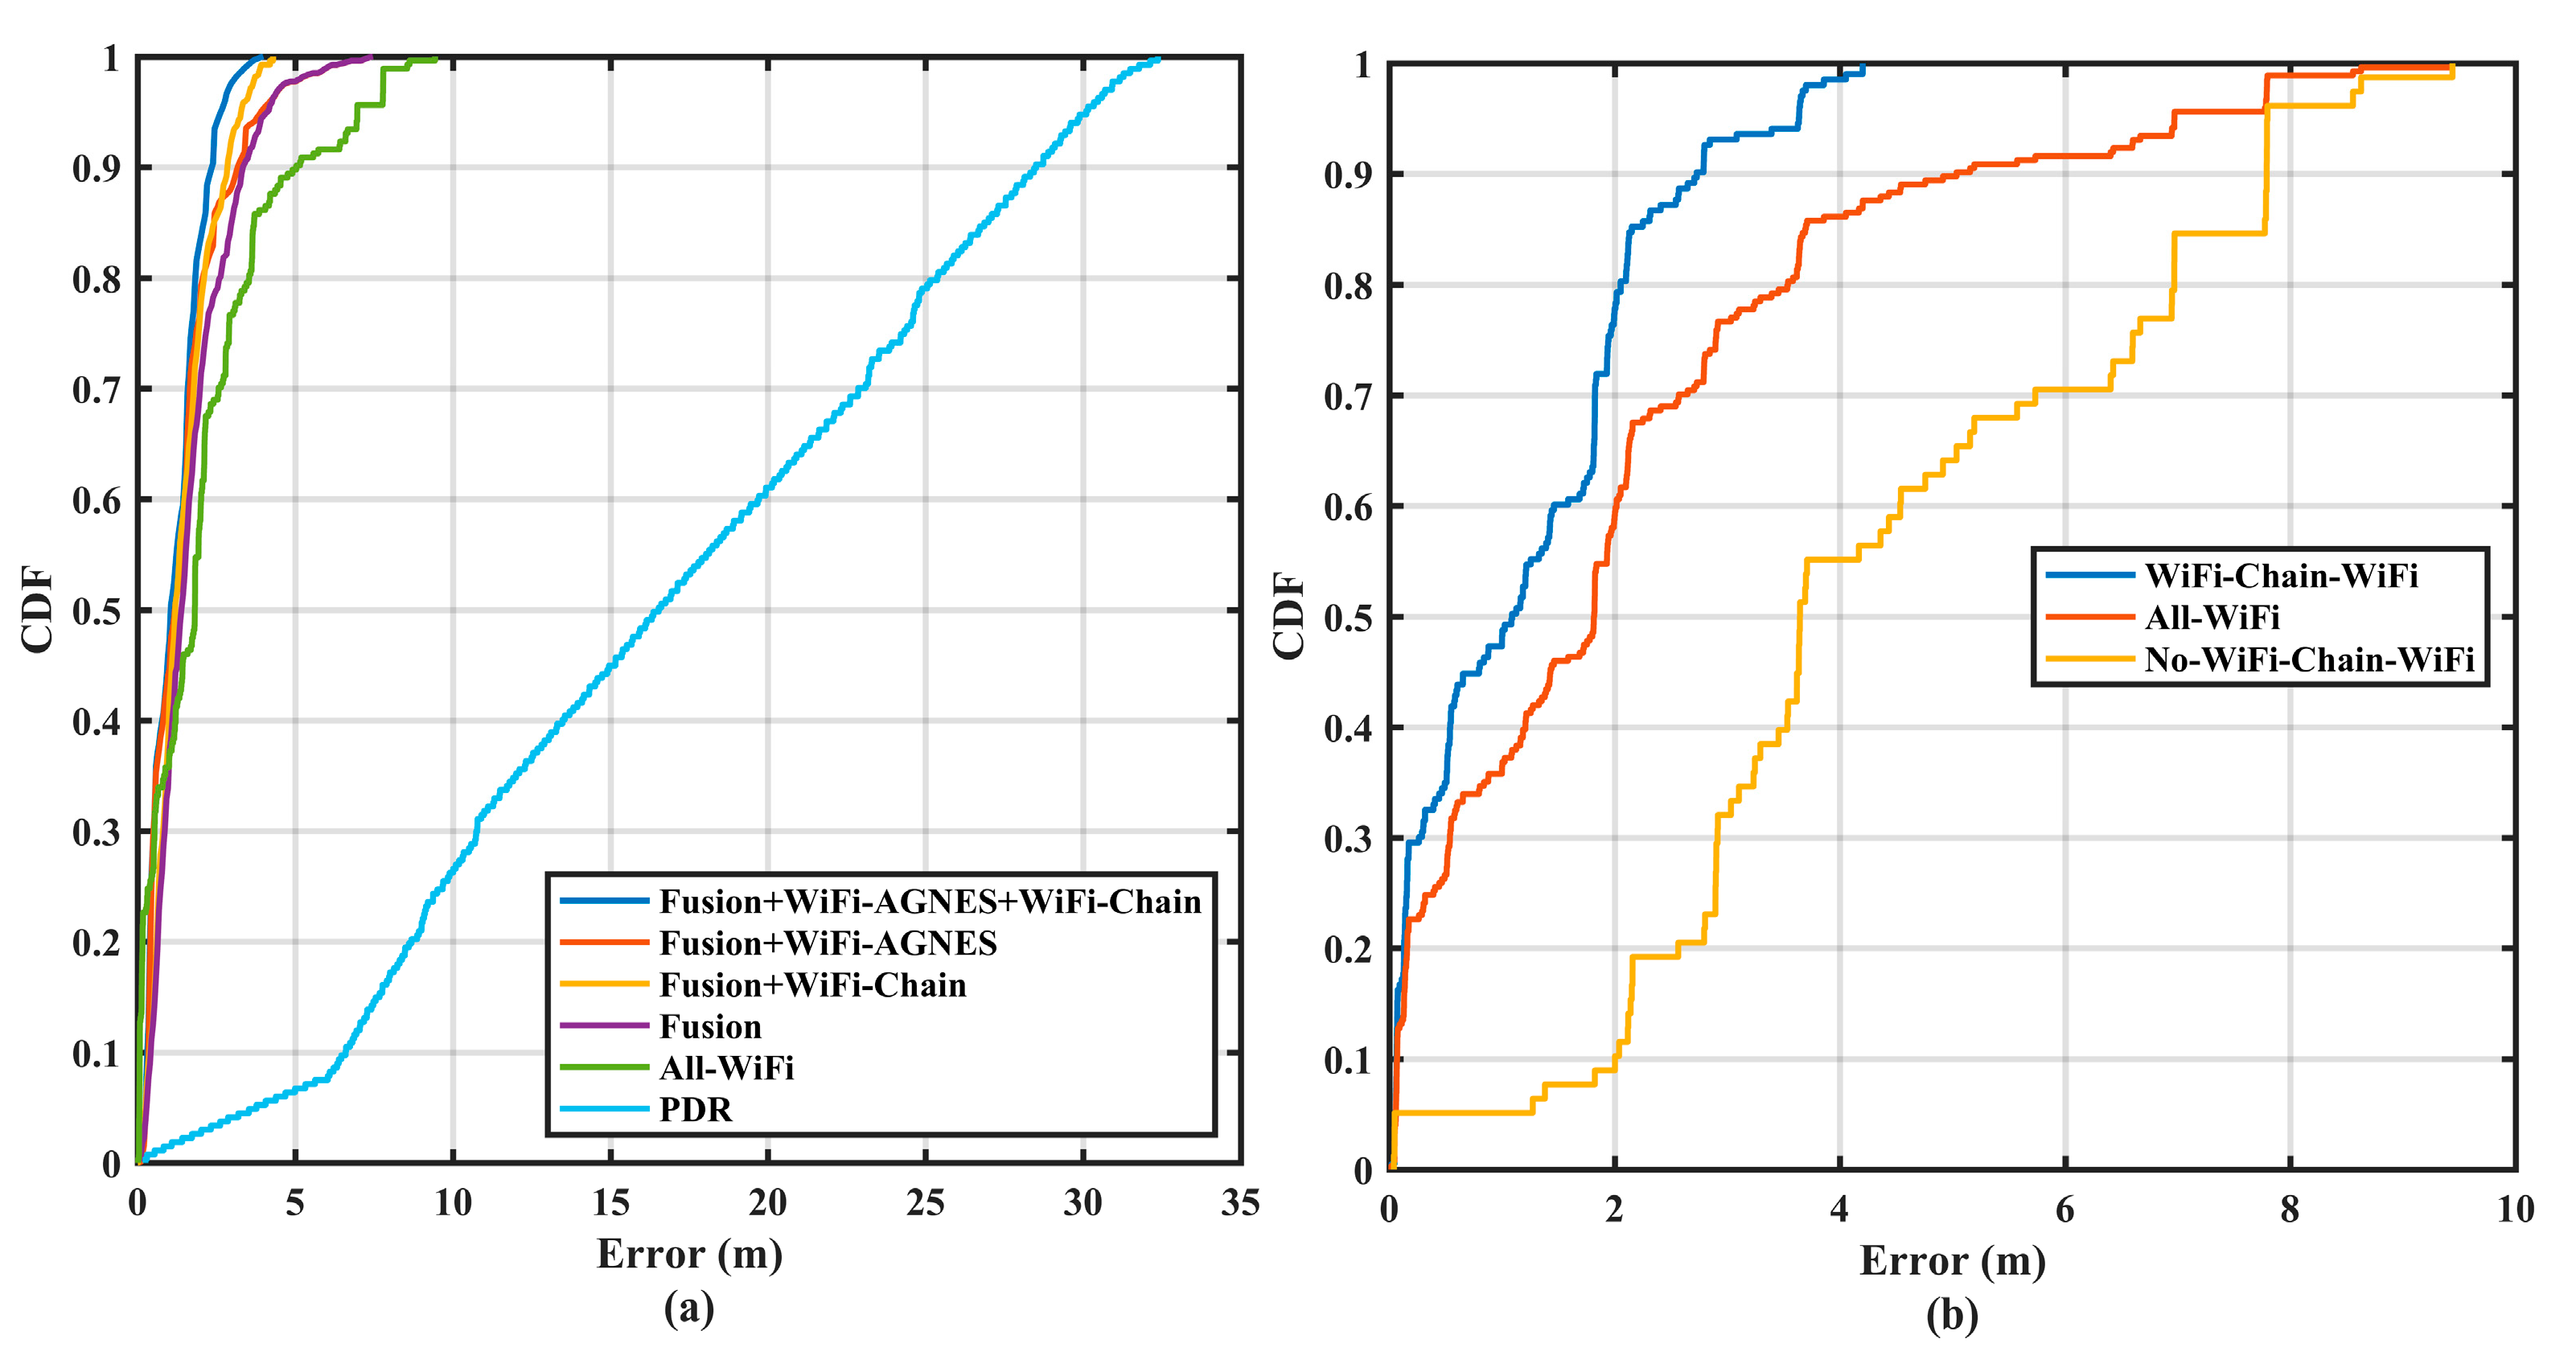
  • Based on the extracted positioning characteristics of PDR and WiFi and the complementary characteristics when the pedestrian is walking, we proposed the second outlier detection and removal strategy named WiFi-Chain.
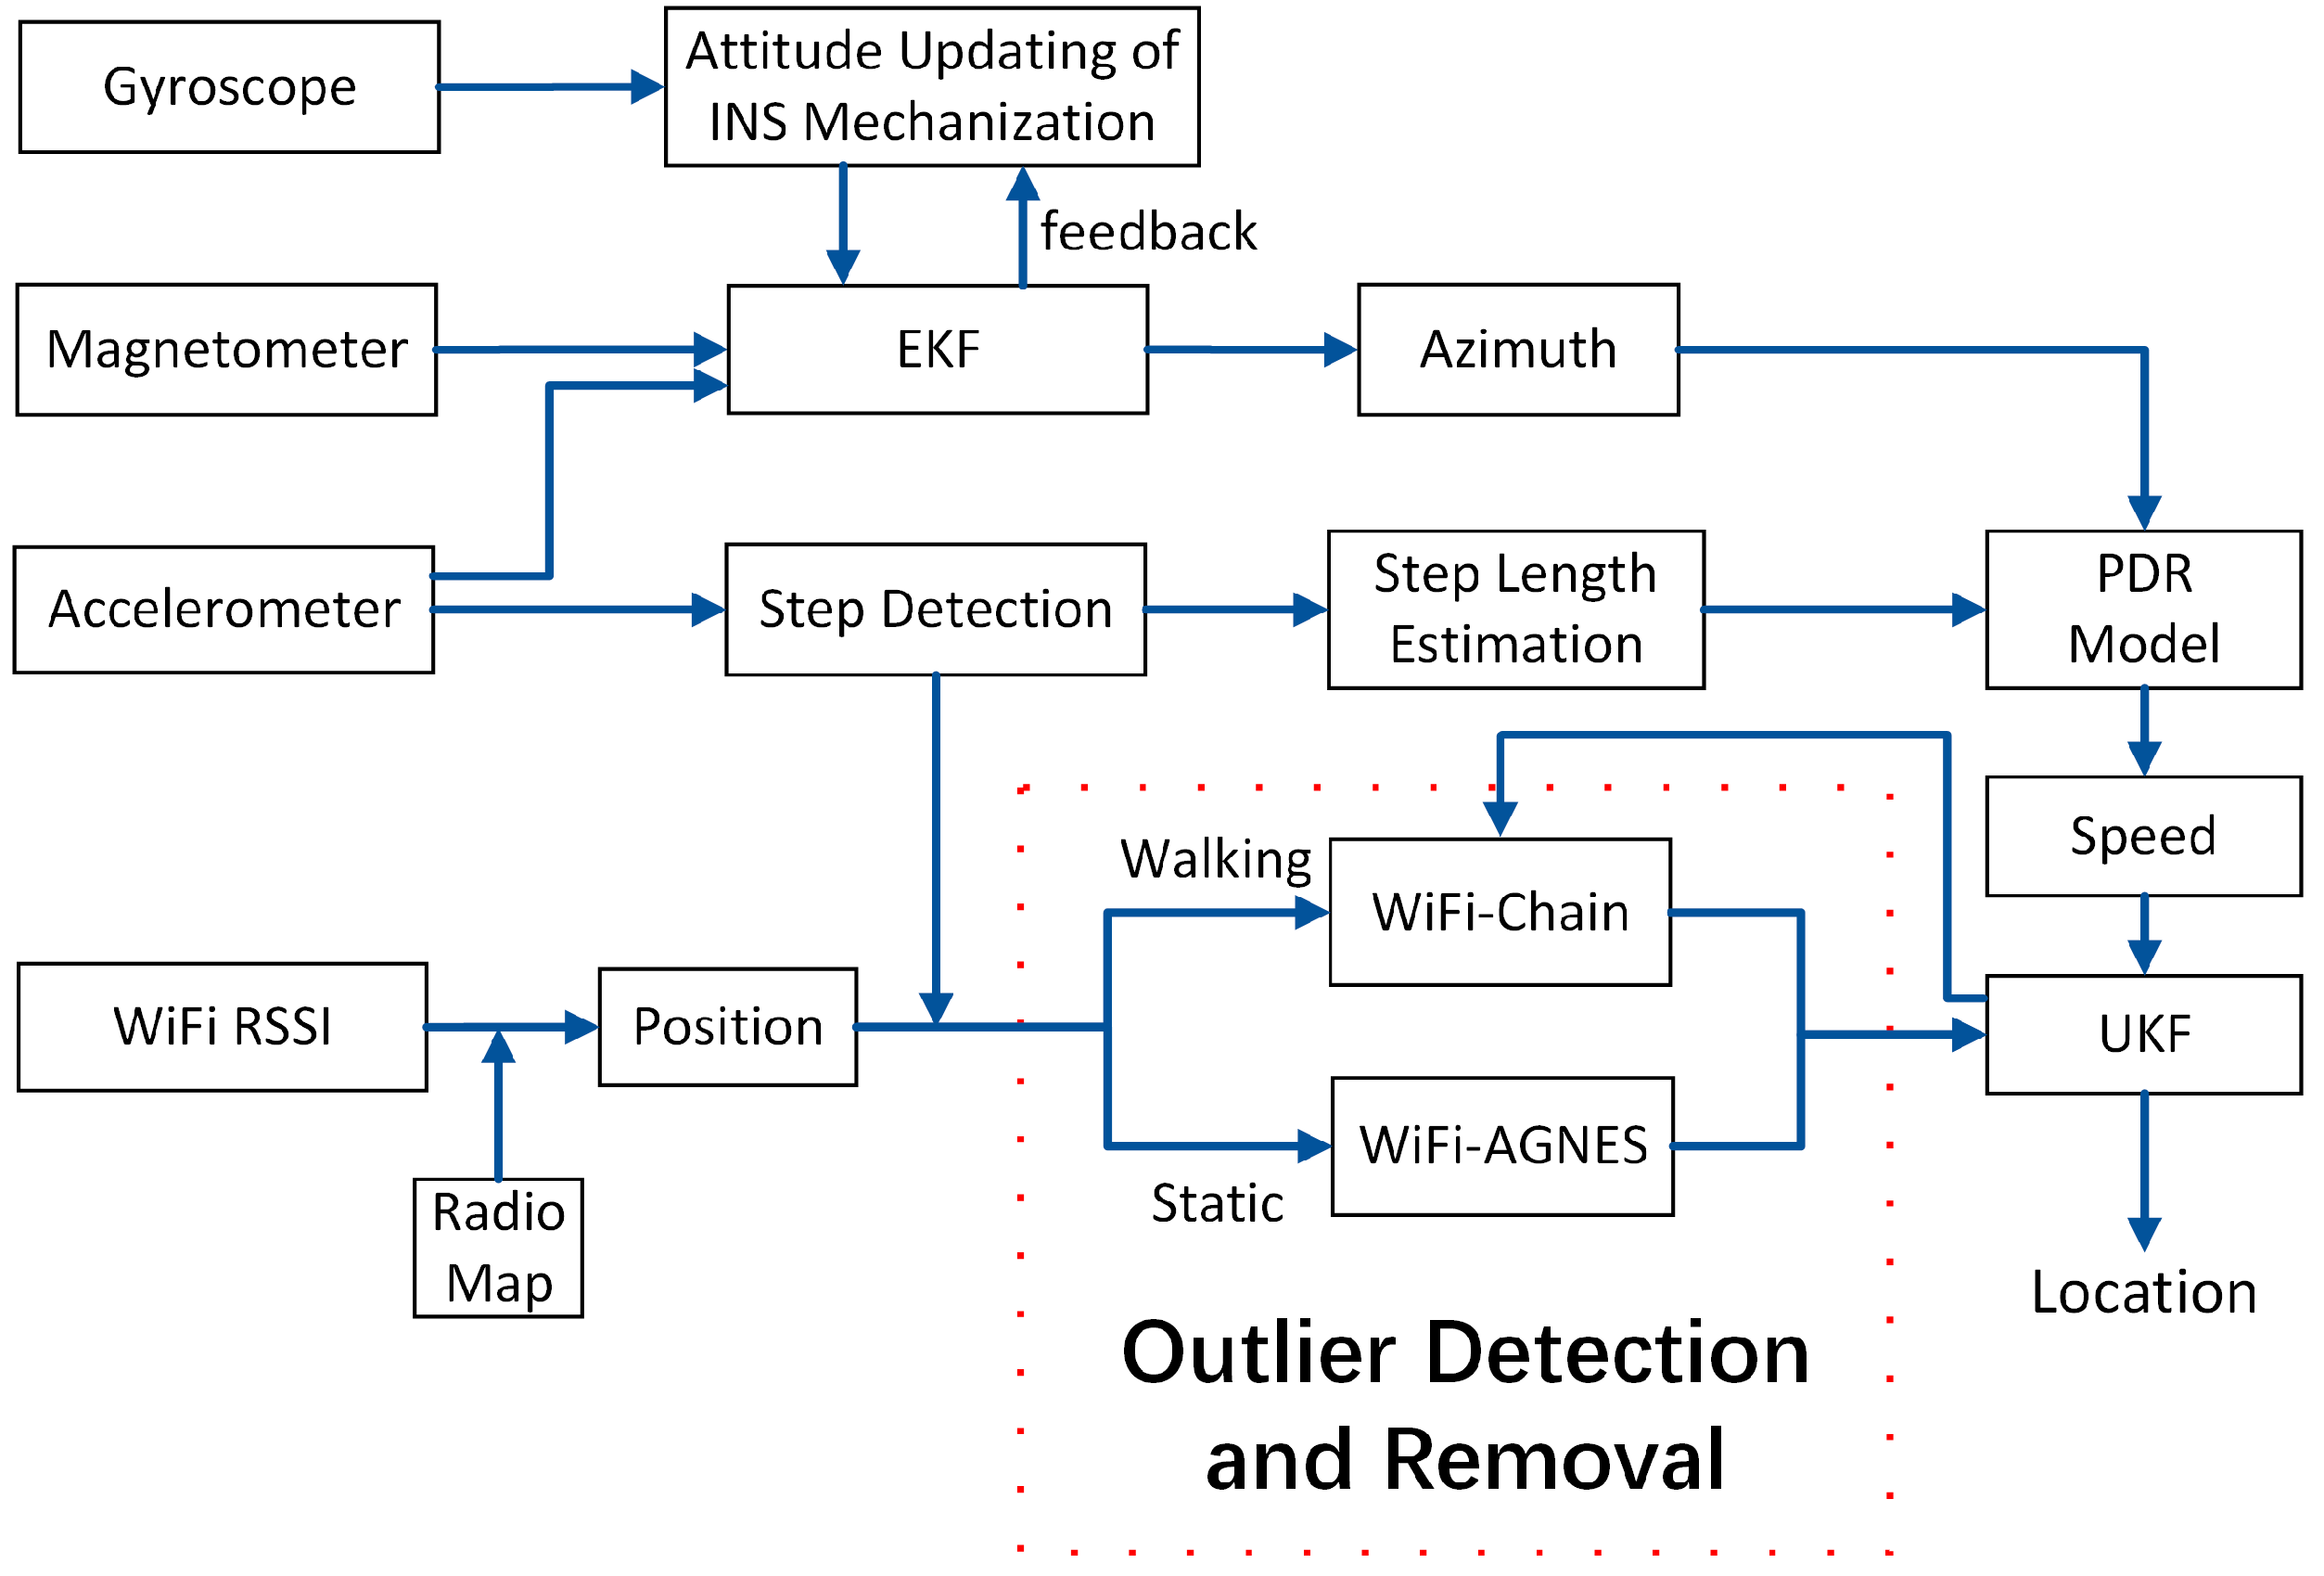
  • We proposed a hybrid fusion scheme which integrates the two proposed strategies, fingerprinting-based WiFi, PDR with an inertial-navigation-system-based (INS-based) attitude heading reference system (AHRS) via Extended Kalman Filter (EKF) for the azimuth estimation of PDR and an Unscented Kalman Filter (UKF) for the final fusion.
The remainder of this paper is organized as follows: Related works are discussed in Section 2. In Section 3, we present the proposed two outlier detection and removal strategies, and Section 4 introduces the proposed hybrid fusion scheme for smartphone indoor positioning. In Section 5, we discuss the experiments and results. Section 6 provides the conclusion of this paper and presents some potential future researches.

2. Related Works

The hybrid fusion scheme integrated PDR and WiFi has been extensively researched over the past decade. In contrast, the outlier of WiFi is still a challenge for the scheme. Here, we only focus on the related work concerning the above two solutions in terms of the challenge.
For improving the WiFi individually: From the authors’ point of view, the previously proposed algorithms can be roughly divided into four types: the NN-based algorithms, the probability-based algorithms, the AutoEncoder (AE)-based algorithms, and the deep learning-based algorithms. In the first type, RADAR [27] is the first RSS-based fingerprinting algorithm which employs the KNN algorithm and achieves a 50% error of 2.94 m and a MaxE of over than 20 m; a WKNN algorithm is proposed in [33] and achieves a ME of 3.06 m and a MaxE of about 10 m; an improved semi-supervised affinity propagation-based WKNN (WKNN-SAP) algorithm is proposed in [34] and achieves a ME of 2.5 m and a MaxE of over than 20 m in the entire environment; a feature scaling based KNN (FS-KNN) is proposed in [35] to improve the positioning performance and achieves a ME of 1.93 m and a MaxE of about 6.5 m; a signal weighted Euclidean distance-based WKNN (SWED-WKNN) algorithm is proposed in [36] and achieves an RMSE of 2.74 m and a MaxE of about 10 m. In the second type, a Kernel-Based Bayesian algorithm is proposed in [37] and achieves an RMSE of 2.71 m and a MaxE of about 12 m; a Weibull-Bayesian density model is proposed in [25] to improve the positioning performance and achieves an RMSE of 2.59 m and a MaxE of about 9 m on the second floor; a pairwise signal strength differences (PSSD) strategy is proposed in [26] and achieves an RMSE of 3.0 m and a MaxE of about 11 m on Honor 8 smartphone. In the third type, three algorithms are compared in [28] based on the same radio map named Database2. The AE based Multi-Layer Perceptron (MLP) algorithm is proposed in [39] which achieves an RMSE of 4.94 m and a MaxE of about 9 m; an AE based Extreme Learning Machine (ELM) algorithm is proposed in [40] which achieves an RMSE of 4.35 m and a MaxE of about 9.5 m; a Stacked Denoising Autoencoder (SDAE) based MLP algorithm is proposed in [41] which achieves an RMSE of 3.89 m and a MaxE of about 9 m. In the last type, a deep neural network (DNN) utilized the data augmentation scheme is proposed in [42] and achieves a ME of 2.54 m and a MaxE of about 9 m; In [43], three deep learning-based algorithms are compared, on the office testing with data from 30 RPs, a Semi-supervised Deep Extreme Learning Machine (SDELM) algorithm proposed in [44] achieves a ME of 2.16m and a MaxE of about 6 m; a Stacked Denoising Autoencoder based DNN (SDA-DNN) algorithm proposed in [45] achieves a ME of 2.23 m and a MaxE of about 9.5 m; a local feature-based deep long short-term memory (LF-DLSTM) algorithm proposed in [43] achieves a ME of 1.75 m and a MaxE of about 10 m. It is obvious that some algorithms achieve an improved performance, however, the outliers still exist in each algorithm due to the inherent RSS variation.
Meanwhile, there are also some algorithms which achieve much excellent performance in their experiments, such as the best bin fast based WKNN (BBF-WKNN) algorithm proposed in [46] achieves a ME of 1.5 m and a MaxE of over 6 m; a DNN based algorithm CellinDeep is proposed in [47] which achieves a ME of 0.78 m and a MaxE of about 5.7 m; a Bisecting K-means (BKM) algorithm proposed in [48] achieves a ME of 1.51 m and a MaxE of about 10 m. Although these algorithms achieve much excellent performance, the established radio map is too heavy to be practical. Moreover, the outliers exist in these algorithms as well. Further, it is worth noting that the abovementioned performances are tested on the static state, which means that the performance will be worse and the outliers will be more distinct when the pedestrian is walking in smartphone indoor positioning.
For enhancing the hybrid fusion scheme: Li [54] proposed an improved dead-reckoning (DR)/WiFi/MM scheme. The scheme employs QC Level #1 and QC Level #2 to remove the outliers of WiFi and set the weight of WiFi, respectively. However, the performance of WiFi achieves an RMSE of 5.9 m and a MaxE of over 10 m in the handheld motion of test group #1 after QC Level #1, which demonstrates that there still exist many outliers. Further, the rationale behind QC Level #2 is adjusting the weight via comparing the distance between the current WiFi coordinate and the previous fusion coordinate with the predefined threshold. However, the distance cannot effectively reflect the uncertainty of the current WiFi coordinate for the accuracy of the previous fusion coordinate is uncertain in the filter. Therefore, an improper weight of an outlier will easily degrade the performance of the scheme. Zhou [55] proposed a PDR/WiFi scheme in which a variable-size sliding window is employed to improve the scheme of [51] in the turning point. The integrated WiFi achieves a ME of 3.72 m, which demonstrates that there exist some outliers. Similar to [51], the averaged coordinate may be an outlier and further will degrade the performance of scheme. Deng [56] proposed a PDR/WiFi/Landmarks scheme. To improve the WiFi, the scheme employs the previous fusion coordinate as a trusted area to limit the search area of WiFi and proposes a strategy to remove the outliers. However, the performance of the improved WiFi achieves a ME of 2.43 m and a MaxE of over 10 m, which demonstrates that there still exist many outliers. Moreover, a kernel density estimation-based model is utilized to adaptively measurement the measurement noise statistics of WiFi, which means that all of the WiFi positioning coordinates including the unremoved outliers will be integrated into the scheme, thus the performance of the scheme will inevitably be degraded.
According to the previous work, the inherent RSS variation will inevitably result in the outliers in the WiFi algorithm and further the unremoved outliers will easily degrade the performance of the scheme. Nevertheless, PDR and WiFi possess some distinct positioning characteristics, which can be utilized to remove the outliers out. Moreover, the complementarity between PDR and WiFi can be utilized to not only fuse them but also realize the outlier detection and removal, however, the latter is unexpectedly ignored in the existing schemes to the best of our knowledge. Therefore, we proposed two strategies named WiFi-AGNES and WiFi-Chain based on the positioning characteristics and the complementary characteristics in terms of the positioning level and these strategies have never been addressed before to the best of our knowledge.

3. Outlier Detection and Removal Strategy

In this section, we detail the two proposed outlier detection and removal strategies. The proposed rationale is: strategy comes from the sufficient mining and utilization of the positioning characteristics of PDR, WiFi, and the complementarity between them. Therefore, it is a prerequisite to analyze the positioning characteristics and complementarity. Since different motion states possess different characteristics, we reasonably assume that the motion state of the pedestrian in smartphone indoor positioning comprises static and walking, which is recognized via the step detection of PDR in this paper. Then, the characteristics are analyzed at each state and further the strategies are proposed accordingly.

3.1. Strategy for Static State

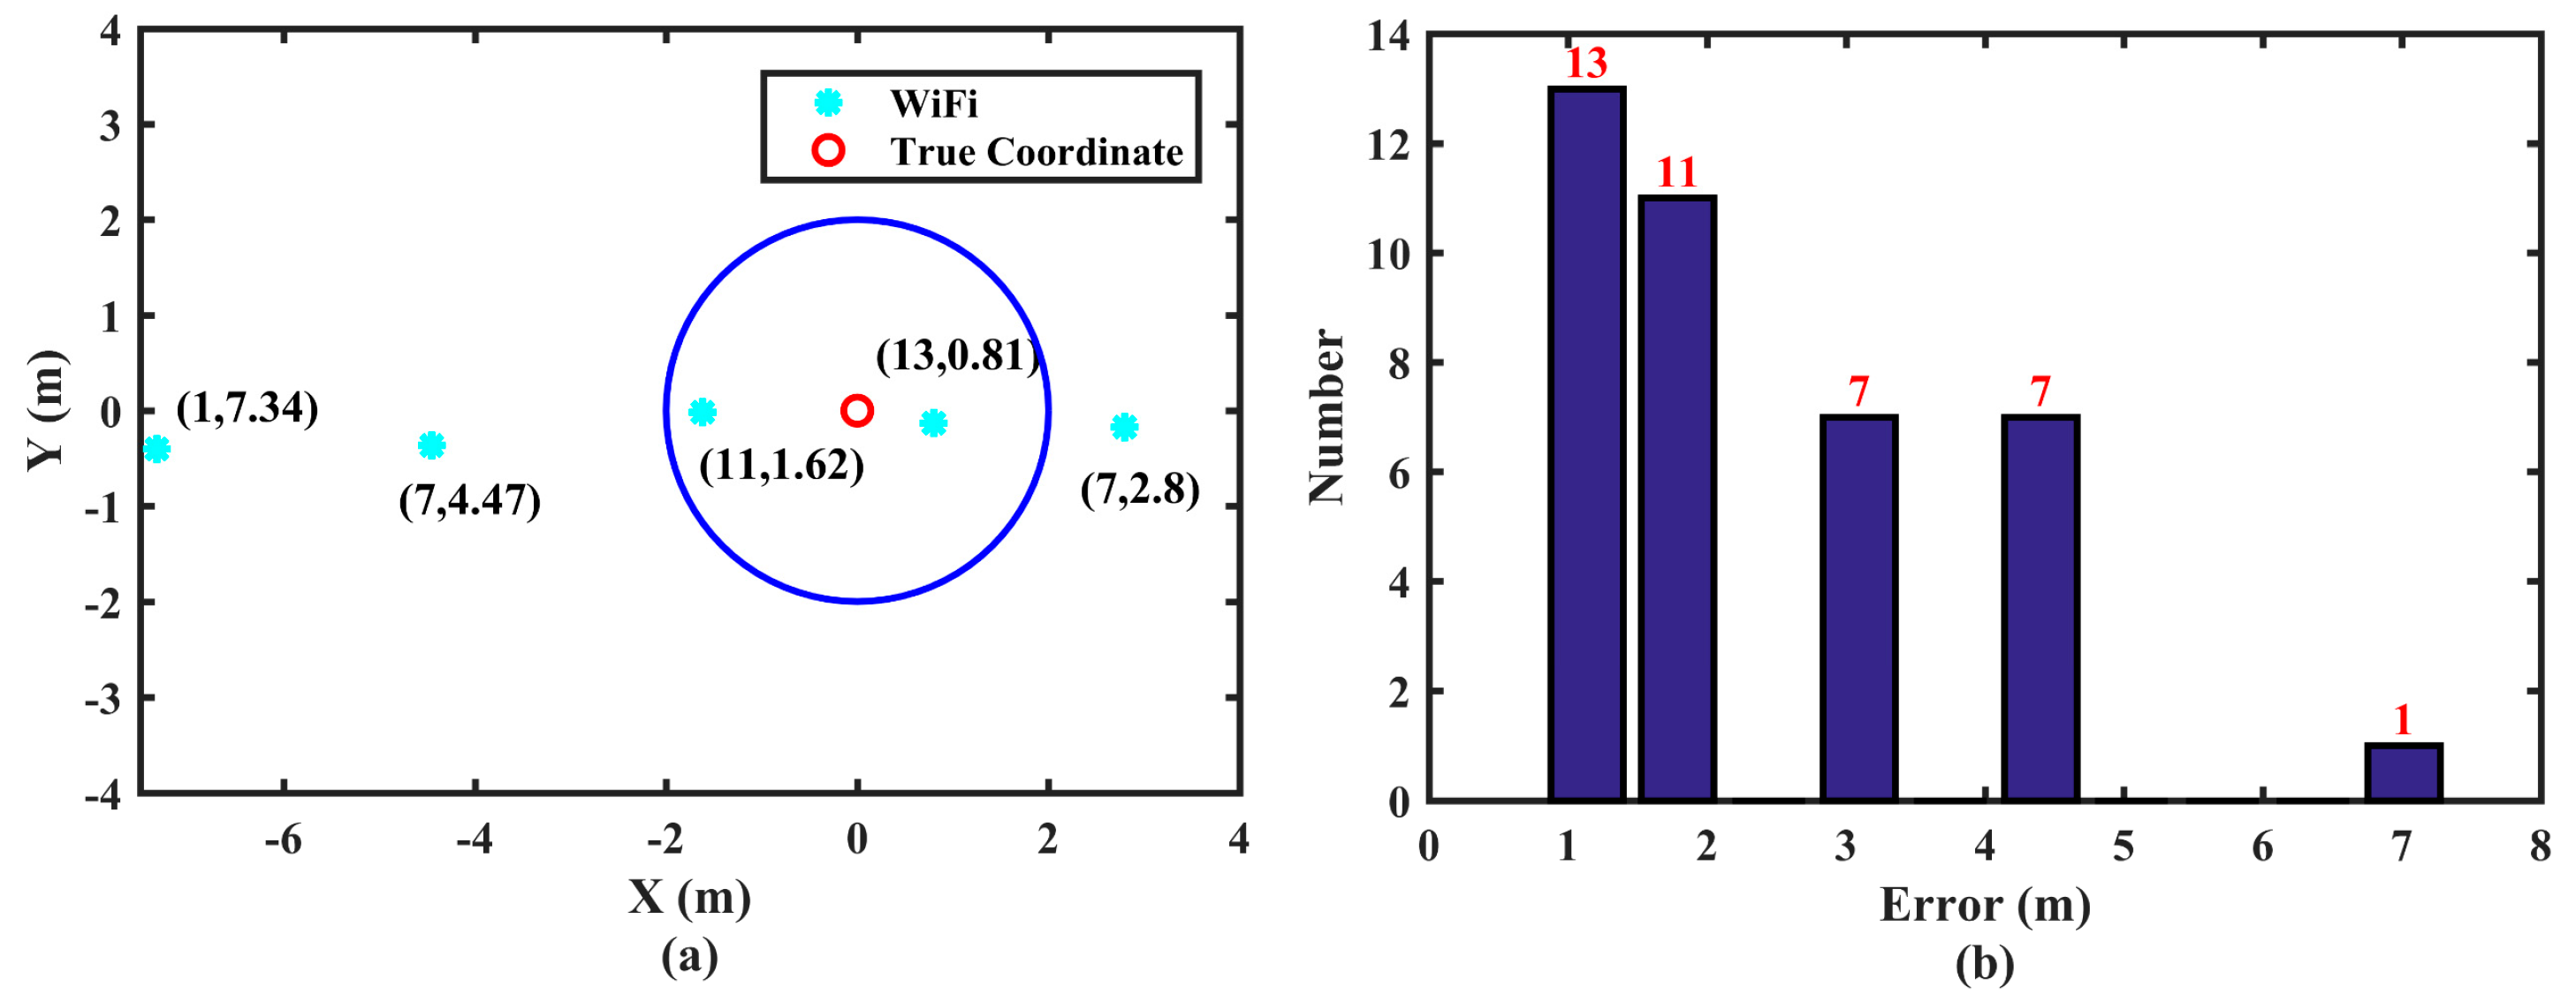
3.1.1. Positioning Characteristics of WiFi

When the pedestrian is static, since there is no step detected, therefore we just analyze the positioning characteristics of WiFi. A one-minute experiment is implemented, in which the employed WiFi technology has been executed individually for about one minute in the static state, and the experiment results are shown in Figure 1:
From Figure 1, we can extract four positioning characteristics of WiFi:
  • Any two WiFi are independent with each other, which indicates that there is no cumulative error.
  • Among the received WiFi, relatively, some are approximately accurate and therefore close to the true coordinate, while the others are jumping and therefore far from the true coordinate.
  • Among the received WiFi, taking the radius of the blue circle as a threshold, in the sense of Euclidean distance, the approximately accurate WiFi coordinates fall in the circle and form a cluster, while the jumping WiFi are scattered and not formed a cluster.
  • Among the received WiFi, the quantity of WiFi inside the circle is more than that outside.
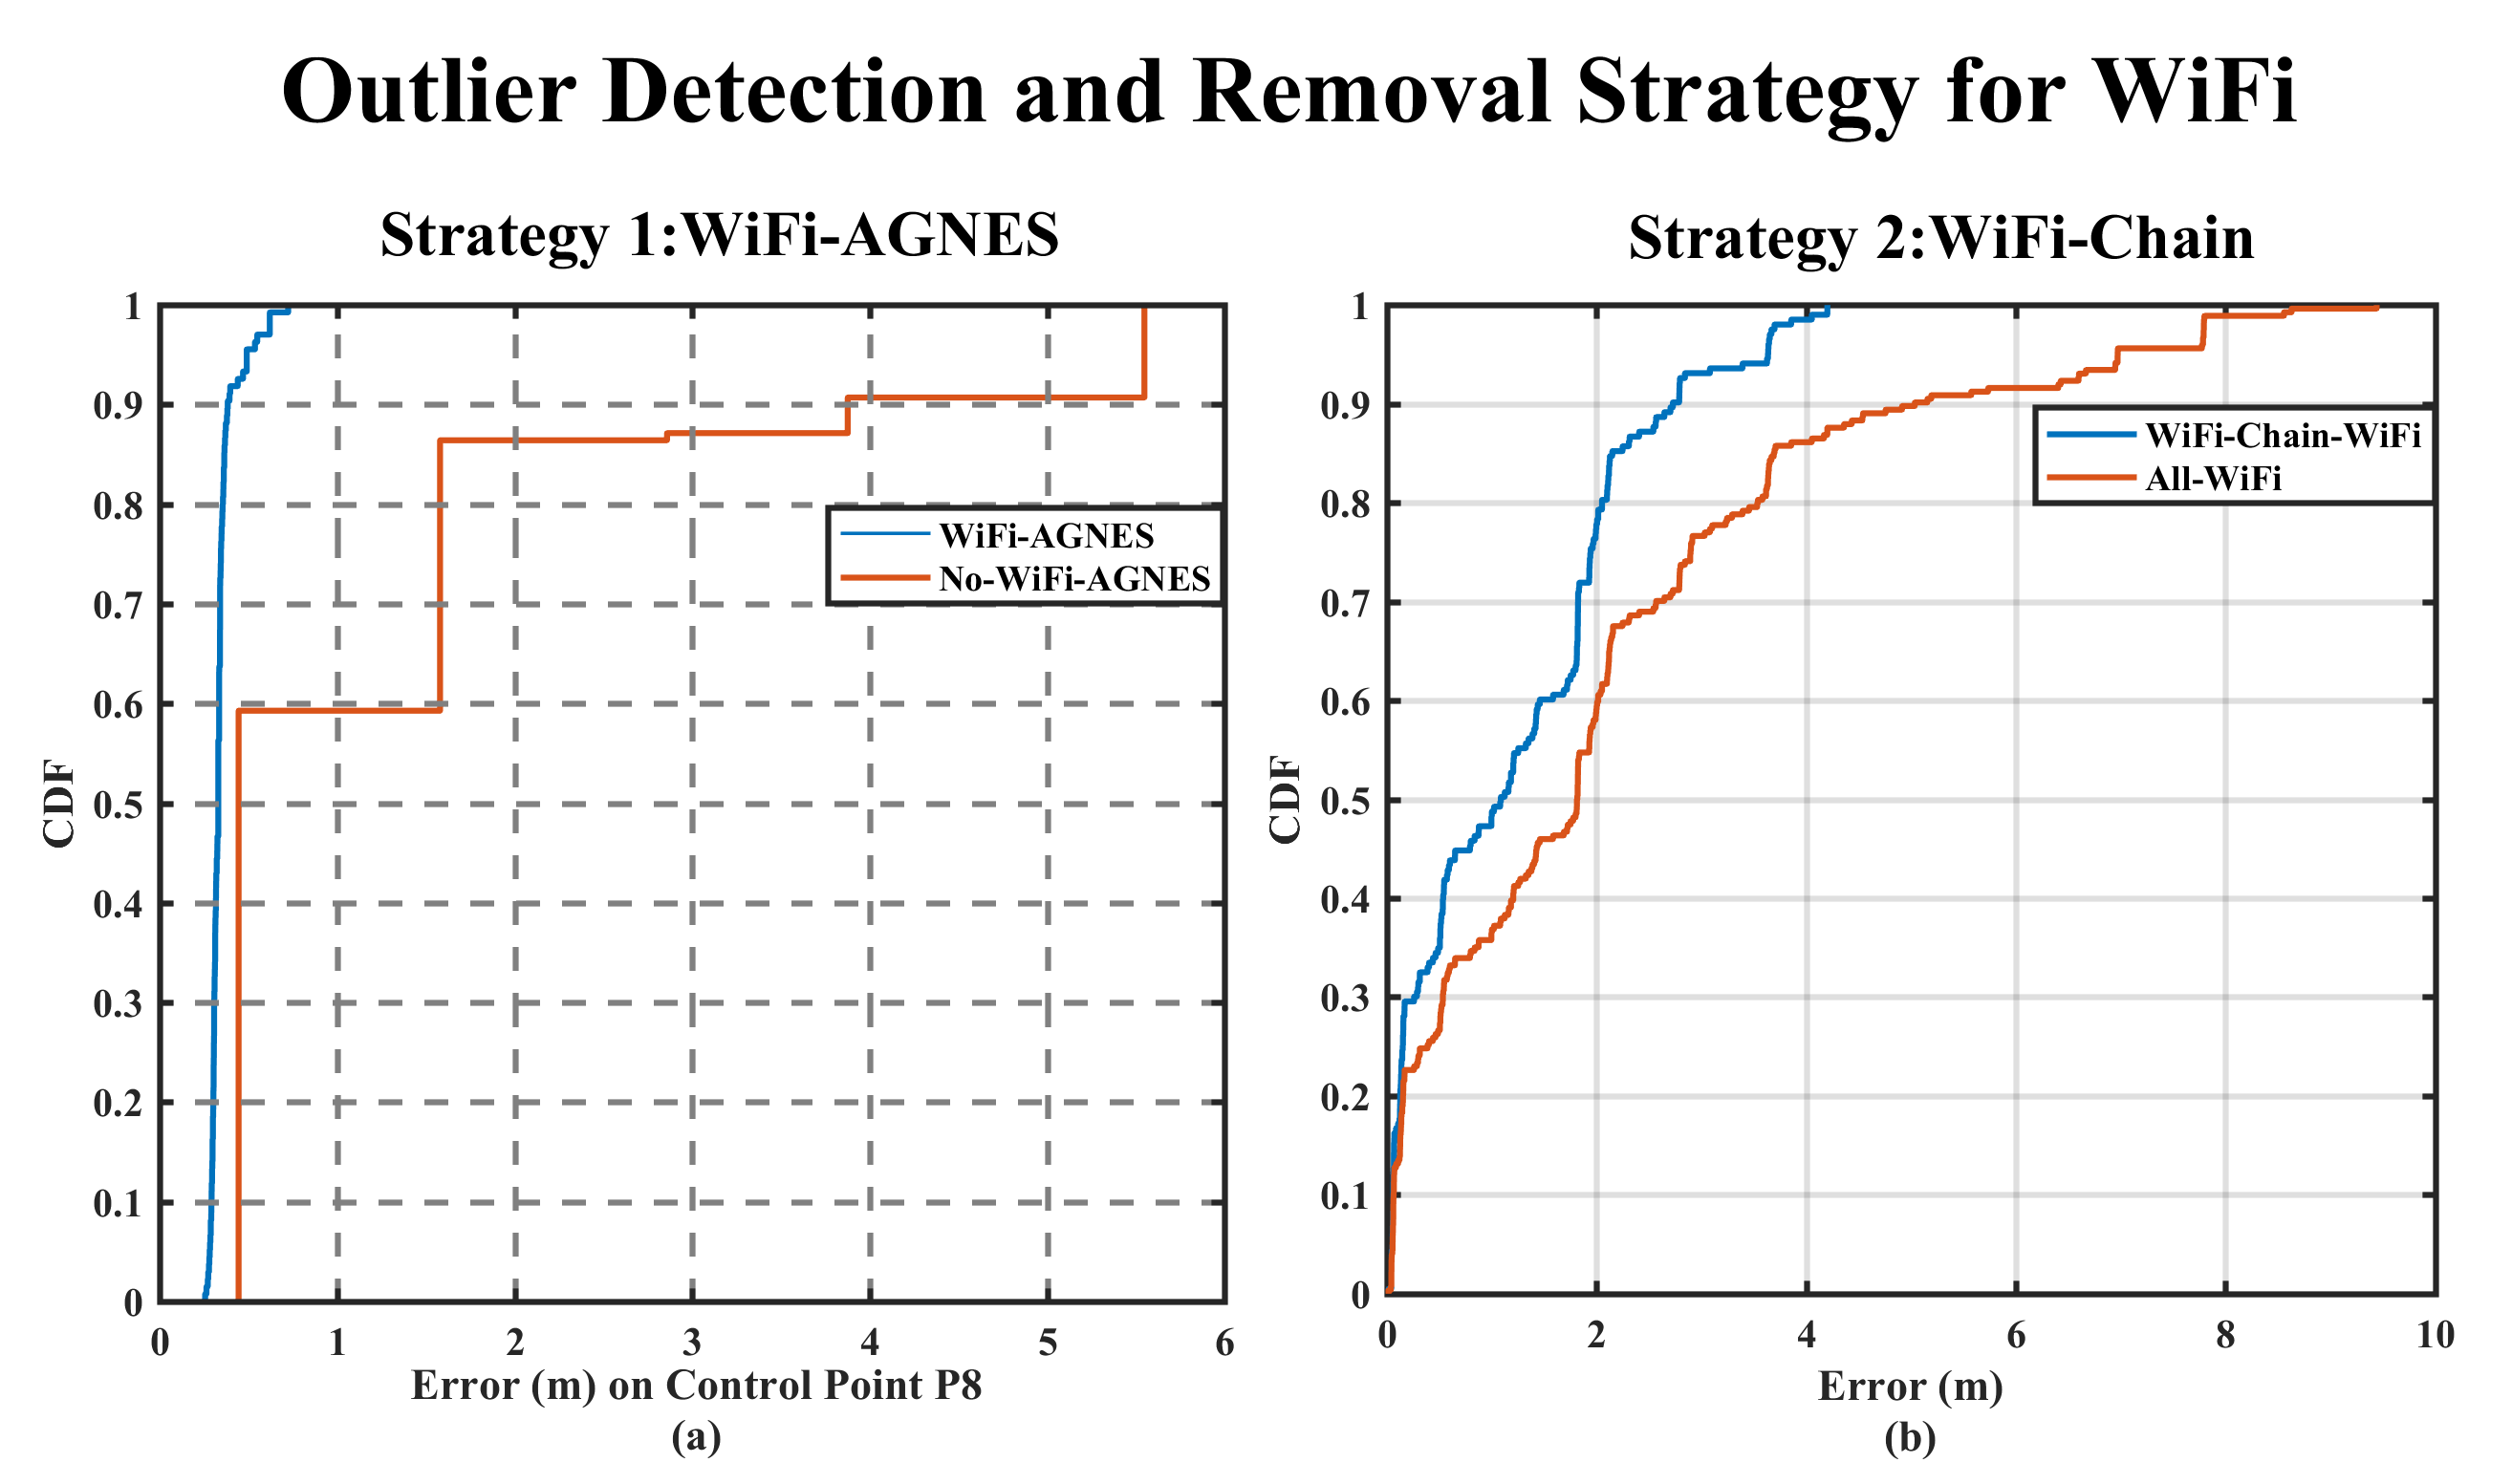
3.1.2. WiFi-AGNES

Based on the above-extracted positioning characteristics of WiFi, the idea of WiFi-AGNES can be detailed as follows:
In the smartphone indoor positioning, the approximately accurate WiFi described in the second characteristic is what we desire certainly. To obtain them, based on the third characteristic, the significant difference between the approximately accurate WiFi and the jumping WiFi is that the former forms a cluster while the latter is not in the sense of Euclidean distance when giving a predefined threshold, such as the blue circle shown in Figure 1a, that is, if we obtain the cluster, we will obtain the approximately accurate WiFi. This is an obvious clustering problem and further reminds us of the unsupervised hierarchical clustering algorithm in ML [61], which will generate a dendrogram. Then, by taking the predefined threshold as the distance of clusters, a bunch of clusters can be obtained from the dendrogram. The bunch of clusters contains not only the desired cluster, but also the clusters formed by the jumping WiFi. To pick out the desired cluster, based on the fourth characteristic, the significant difference between the desired cluster and the others is that the former possesses the largest quantity of WiFi, that is, if we pick out the cluster which possesses the largest quantity of WiFi, we will obtain the desired cluster, and the cluster contains the approximately accurate WiFi we desire. Based on this idea, the specific workflow of WiFi-AGNES is detailed as follows:
Firstly: In static, a series of WiFi are received in chronological order such as:
T = { ( x 1 , y 1 ) ( x t n , y t n ) ( x t , y t ) }
where T represents a set which contains the received WiFi, ( x t n , y t n ) represents the WiFi coordinate received at t n .
Second: We adopt the average-linked AGNES as the unsupervised hierarchical clustering algorithm of ML and initialize the AGNES as follows:
C t n = { ( x t n , y t n ) } C T = { C 1 C t n C t }
where C t n represents an initial cluster containing one sample which is obtained from the set T and is the WiFi received at t−n in Equation (1), and the coordinate of the WiFi is regarded as the feature of the sample, CT represents a set which contains all of the current clusters.
Third: An obvious prerequisite to start AGNES is that there should be a certain number of clusters in CT, therefore when Equation (3) is satisfied, we start AGNES and calculate the linked metric of AGNES as follows:
t THR 1
M [ m , n ] = d avg ( C m , C n ) = 1 | C m | | C n | i C m j C n d ij   ( m n , 1 m , n t )
where C m and C n represent two different clusters, d avg ( C m , C n ) represents the average distance between C m and C n , M represents the linked metric, where the entry in the m th row and n th column equals d avg ( C m , C n ) , | C m | and | C n | represent the sample size of C m and C n , respectively, i and j represent a sample in C m and C n , respectively, THR 1 represents a predefined threshold of the number of clusters in C T and can be empirically determined, d ij represents the Euclidean distance between i and j , which can be calculated as follows:
d ij = ( x i x j ) 2 + ( y i y j ) 2
where ( x i , y i ) and ( x j , y j ) represent the feature of the sample i and j , respectively.
Then based on the AGNES algorithm, an iterative aggregation calculation will be executed until the number of clusters in C T equals 1, and the abovementioned dendrogram can be generated.
Fourth: Taking the predefined threshold as the distance of clusters, and obtaining the bunch of clusters within the threshold from the dendrogram as follows:
S = { C p | D ( C p ) < THR 2 }
where S represents a set which contains the bunch of clusters, C p represents a cluster in the dendrogram, D ( C p ) represents the distance of clusters of C p , which can be obtained from the linked metric M , and THR 2 represents the predefined threshold of the clusters determination and can be determined based on the interval of the RPs in the established radio map.
Fifth: Pick out the desired cluster from S as follows:
C des = arg max Q ( S )
where C des represents the desired cluster which contains the approximately accurate WiFi, arg max Q ( S ) represents picking out the cluster which possesses the most quantity of WiFi from S .
Finally: Based on C des , calculating the current coordinate as follows:
( x cur , y cur ) = ( 1 | C des | q C des x q , 1 | C des | q C des y q )
where ( x cur , y cur ) represents the current coordinate via WiFi-AGNES, | C des | represents the sample size of C des , q represents the q th sample in C des , ( x q , y q ) represents the coordinate of the q th sample.
So far, based on the extracted positioning characteristics of WiFi in static, the strategy named WiFi-AGNES is proposed using ML, and with which we realize the outlier detection and removal and obtain the approximately accurate WiFi and the current coordinate ( x cur , y cur ) simultaneously. Since characteristics are universal, the characteristic-based WiFi-AGNES is robust. Further, we will integrate the WiFi-AGNES into the proposed hybrid fusion scheme to mitigate the effect of outliers of WiFi and improve the performance of the scheme when the pedestrian is static. The details of the unsupervised hierarchical clustering algorithm of ML and the AGNES are shown in [61,62].

3.2. Strategy for Walking State

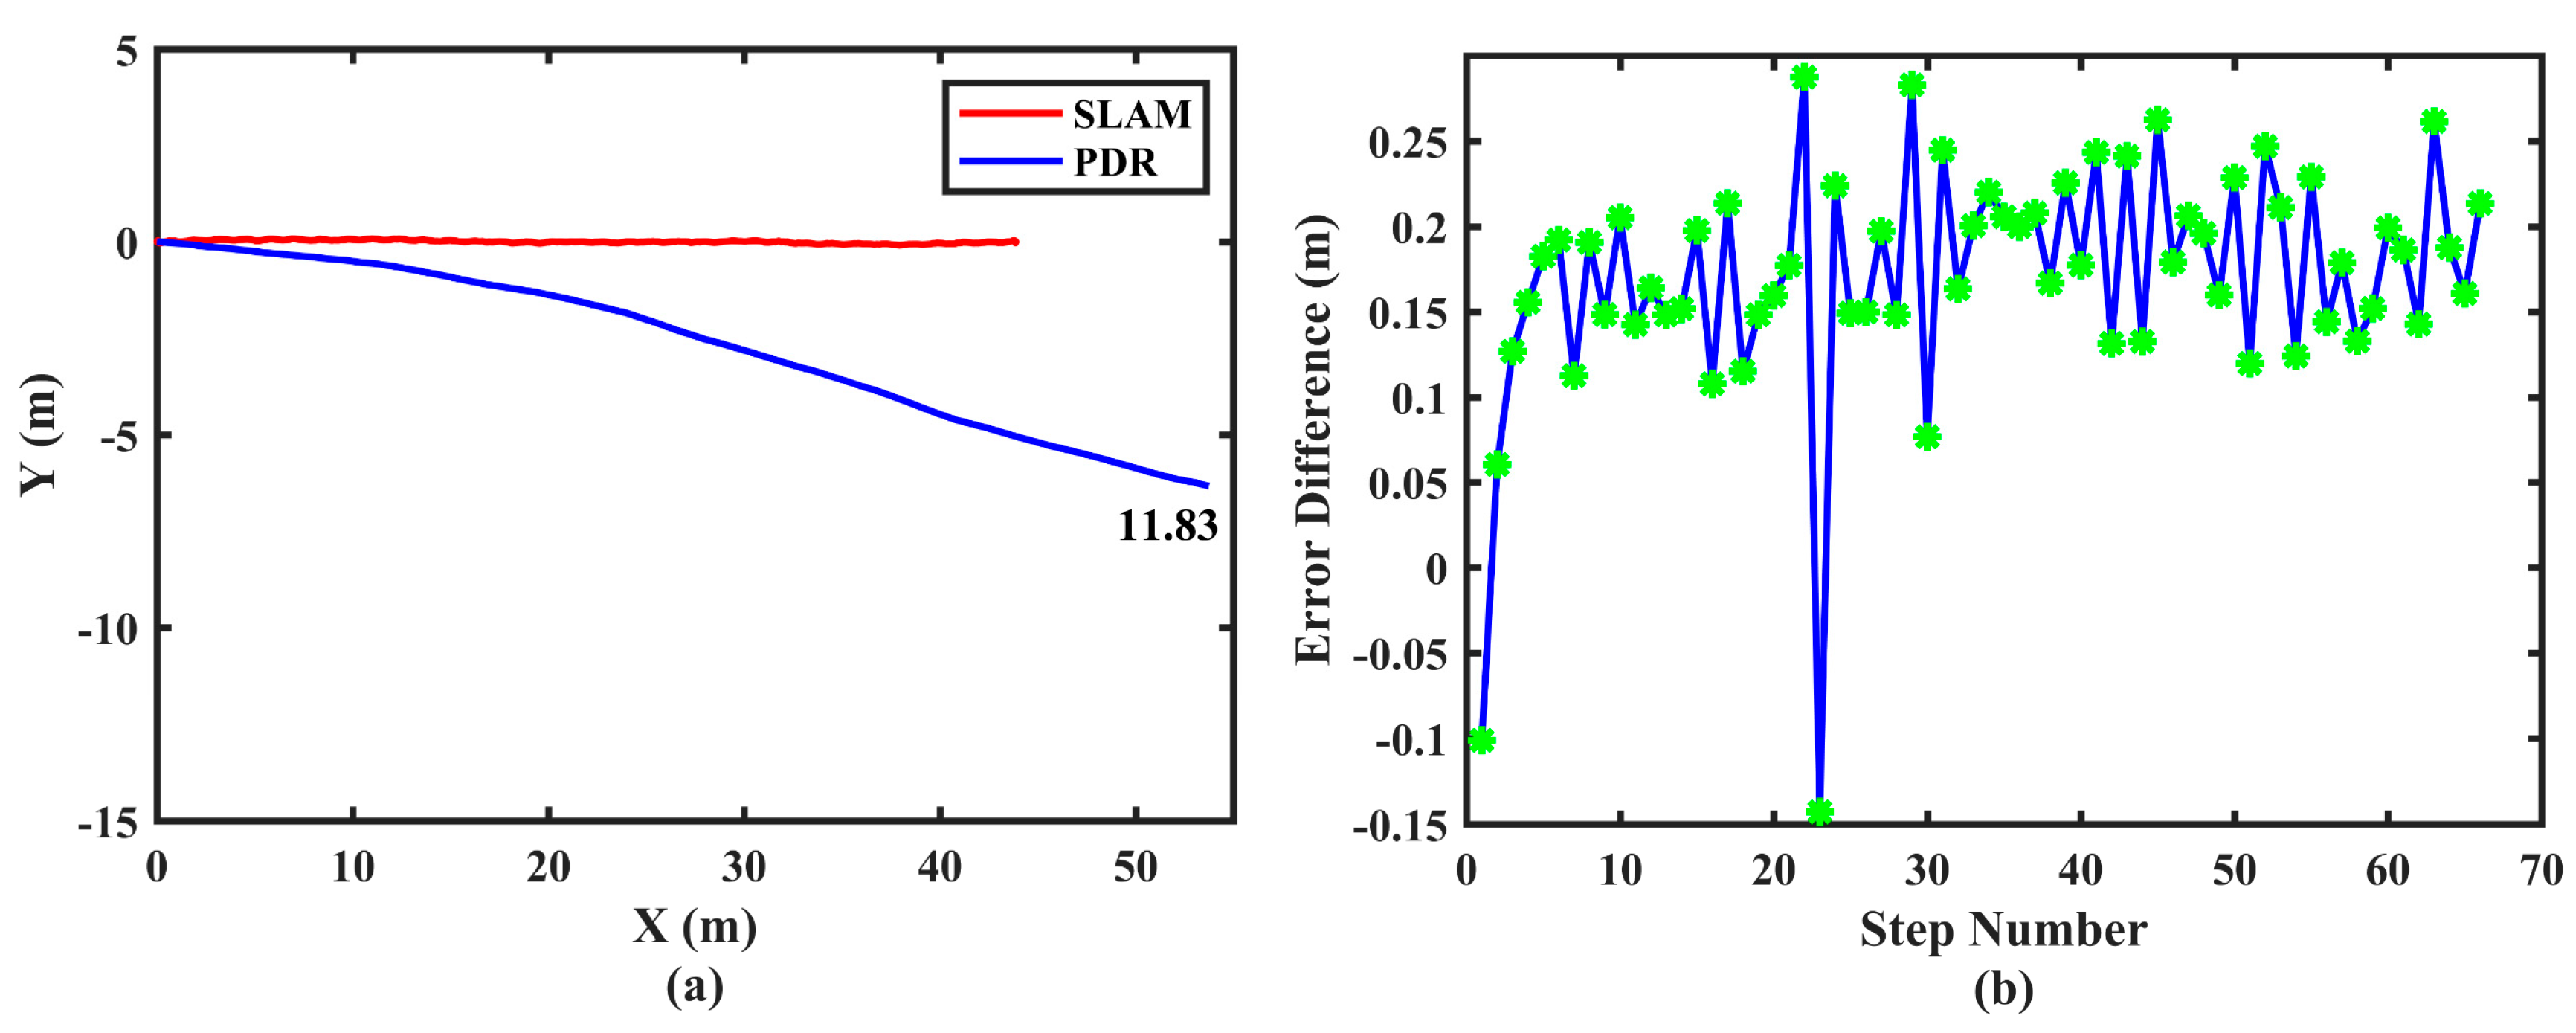
3.2.1. Positioning Characteristics of PDR and WiFi

When the pedestrian is walking, an experiment is implemented, in which we have executed the PDR technology and the employed WiFi technology simultaneously for about forty seconds, and the experiment results are shown in Figure 2 and Figure 3:
From Figure 2, we can extract two positioning characteristics of PDR:
  • The maximum error difference of PDR does not exceed 0.3 m, which indicates that the relative accuracy of PDR is high, regardless of the absolute error.
  • On the basis that there is no absolute error in the first step, the absolute error of the last step reaches 11.83 m, which indicates that PDR has a cumulative error in the long term.
From Figure 3, we can extract five positioning characteristics of WiFi:
  • Any two WiFi are independent with each other, which indicates that there is no cumulative error.
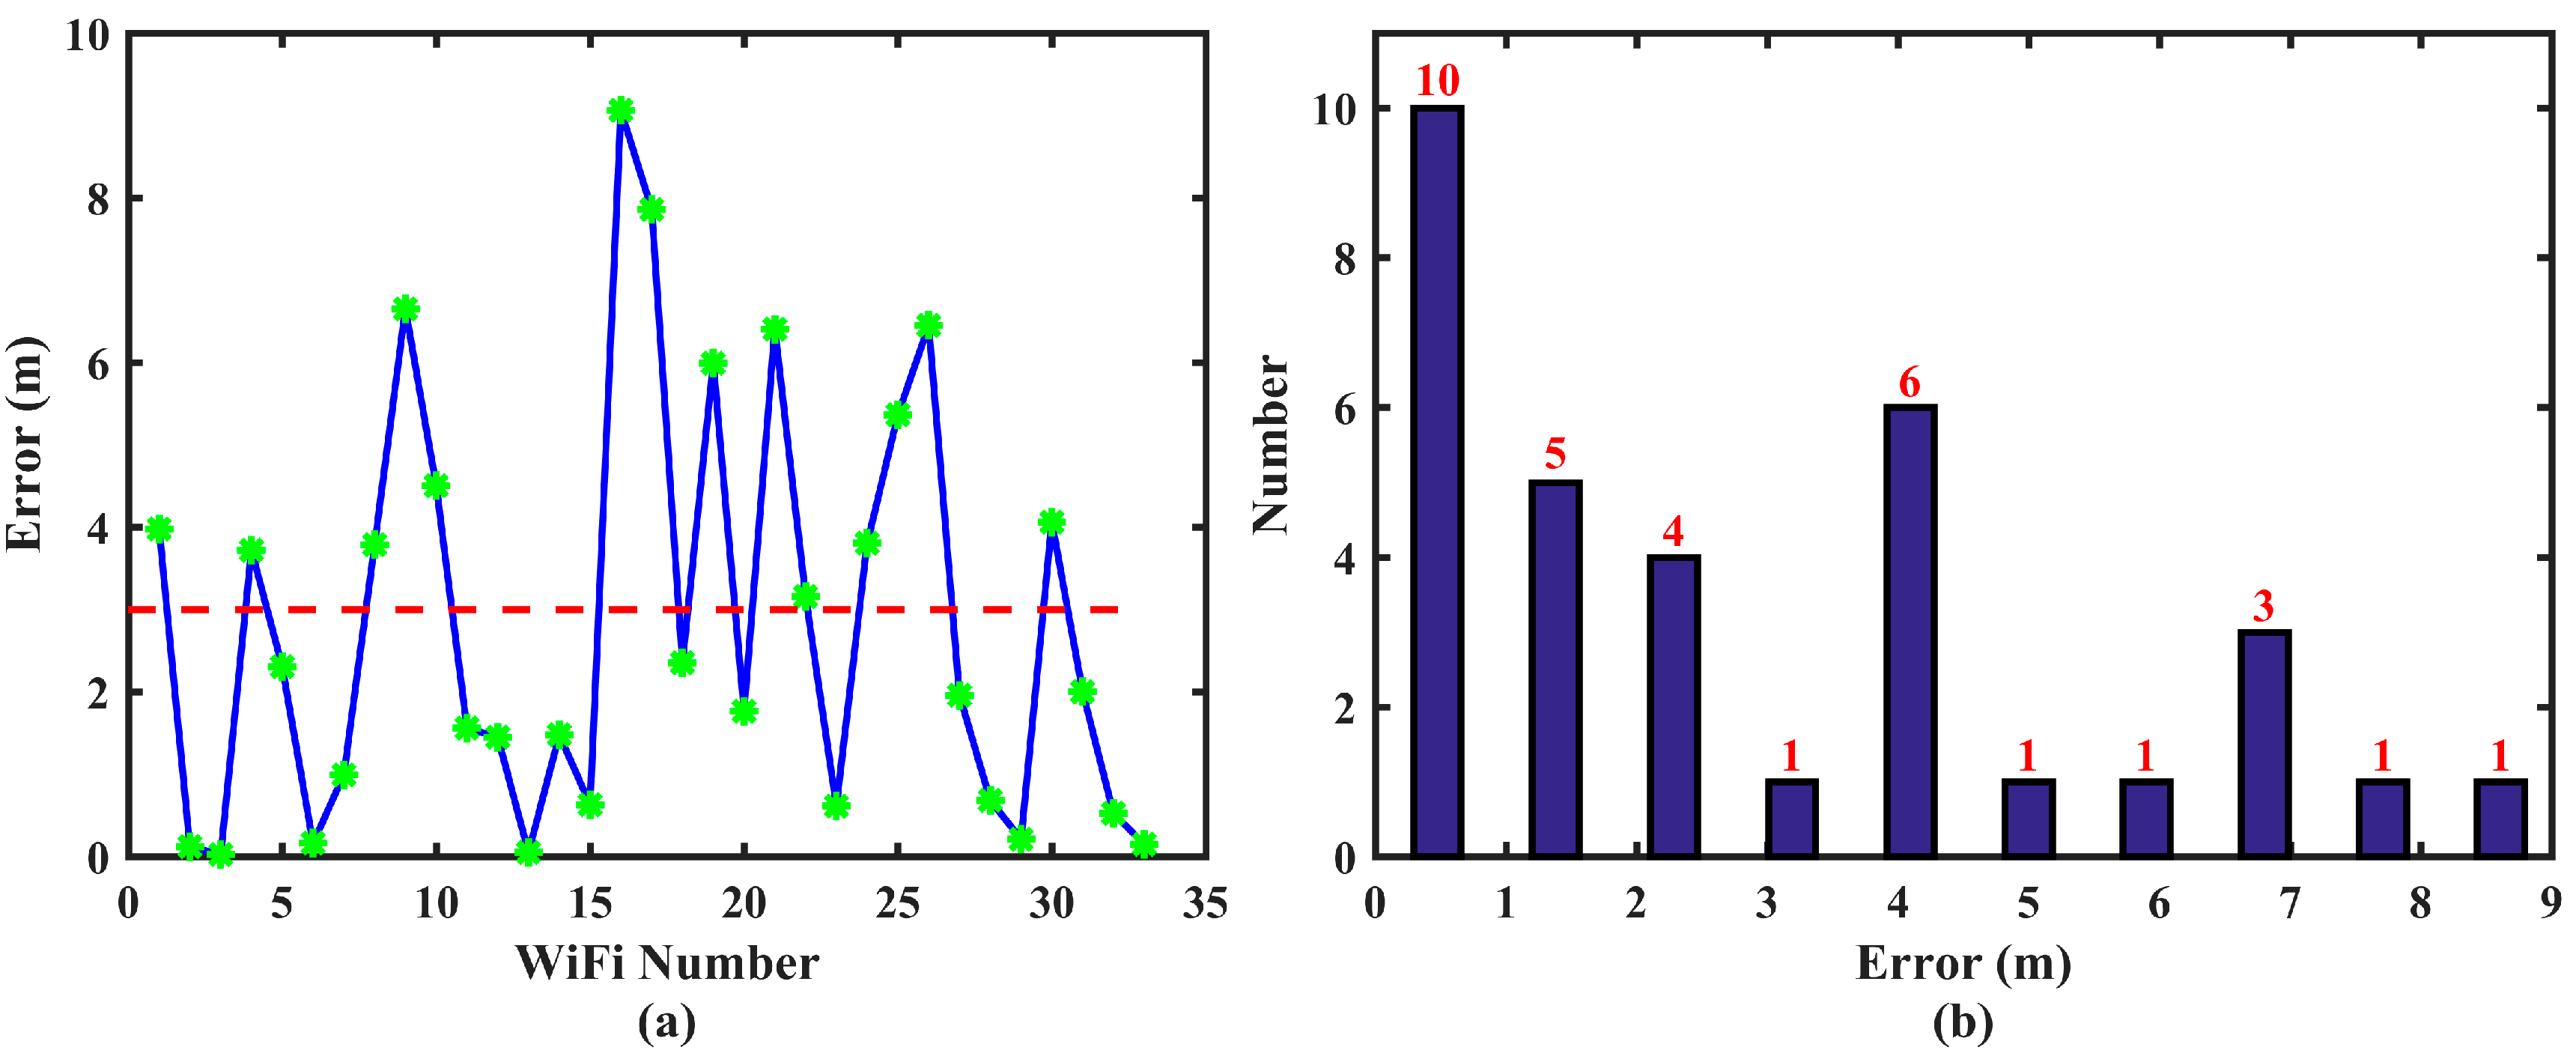
  • Among the received WiFi, relatively, some are approximately accurate, while the others are jumping.
  • Among the received WiFi, assuming that we take 3 m as the dividing line, the number of approximately accurate WiFi is more than the jumping.
  • Due to the inherent RSS variation, there is a randomness in the jumping WiFi.
  • Among the received WiFi, the jumping WiFi is received intermittently.

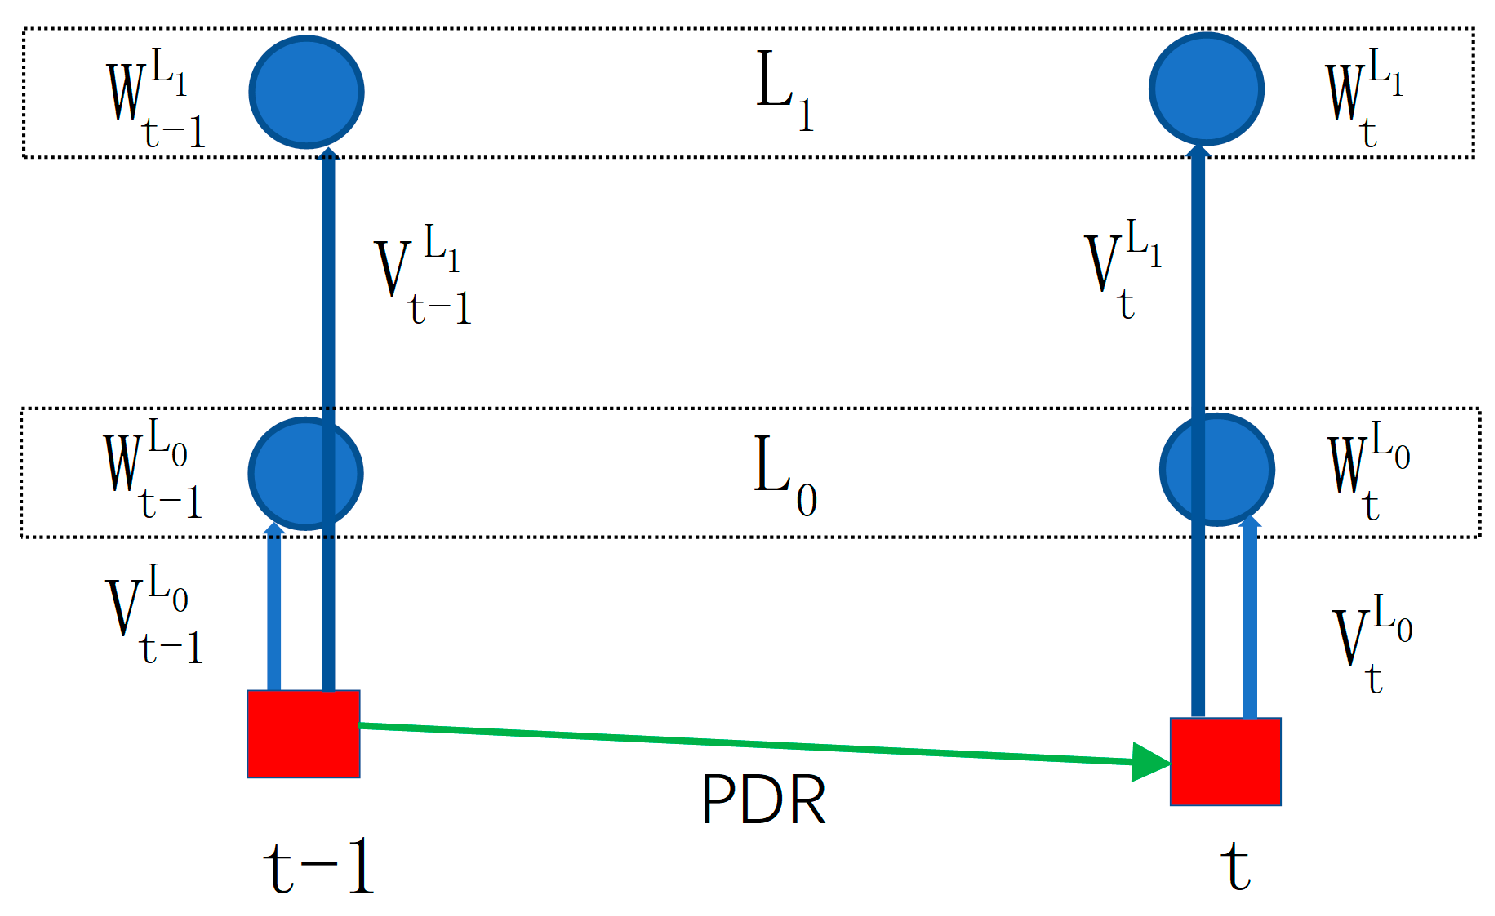
3.2.2. Complementary Characteristics between PDR and WiFi

According to the above-extracted positioning characteristics, it is obvious that there exists a strong complementarity between PDR and WiFi: the cumulative error of PDR can be revised by WiFi and the jumping of WiFi can be restrained by PDR simultaneously. Moreover, the complementarity also has a capacity in outlier detection and removal which is sufficiently utilized in WiFi-Chain. To this end, we couple PDR and WiFi by means of the vector at first as follows:
V t 1 pre = [ x ˜ t 1 x t 1 pre y ˜ t 1 y t 1 pre ]   V t post = [ x ˜ t x t post y ˜ t y t post ]
where ( x t 1 pre , y t 1 pre ) and ( x t post , y t post ) represent the coordinate of the scheme before and after the time update of PDR at t 1 and t , respectively, ( x ˜ t 1 , y ˜ t 1 ) and ( x ˜ t , y ˜ t ) represent the coordinate of received WiFi at t 1 and t , respectively, V t 1 pre and V t post represent the coupled vector.
Then, based on the second and fourth characteristics of WiFi, the error level of the received WiFi at one moment can be relatively divided into two levels: approximately accurate L 0  and jumping L 1 , and let’s consider any two adjacent moments when the pedestrian is walking as shown in Figure 4.
Based on the first positioning characteristic of PDR and WiFi, an obvious complementary characteristic can be extracted from Figure 4: with a predefined threshold, if the two Wi-Fi received at any two adjacent moments possess different error levels, then the two corresponding coupled vectors will be very different, otherwise, the two vectors will be approximately equal such as follows:
V t L i V t 1 L i 2 THR 3
where 2 represents the Euclidean norm, THR 3 represents the predefined threshold of the complementary characteristic determination and can be determined based on the 68% error of the WiFi technology.
We summarize all cases of the two coupled vectors and the corresponding complementary characteristics for any two adjacent moments as shown in Table 1:

3.2.3. WiFi-Chain

So far, based on the positioning characteristics of PDR, WiFi and the complementary characteristics of them, the idea of WiFi-Chain can be detailed as follows:
In the smartphone indoor positioning, based on the fifth positioning characteristic of WiFi, the three cases will occur alternately. Whereas only Case1 which contains two approximately accurate WiFi is what we want certainly. To obtain Case1, the significant difference between Case1 and the others is that Case1 occurs more often based on the third positioning characteristic of WiFi, therefore we can accumulate the number of occurrences of Case1 by first picking it out based on the difference of the complementary characteristic between Case1 and Case3. Although Case1 and Case2 possess the same complementary characteristic, Case2 will easily transform into Case3 due to the fourth positioning characteristic of WiFi and further can be separated from Case1 base on the complementary characteristic as well. Based on this idea, the specific workflow of WiFi-Chain is detailed as follows:
Firstly: Initialization. We define a combined variable Num , V , and initialize it when receiving the first WiFi W t 0 L i as follows:
Num , V = 1 , V t 0 L i   s . t .   Num > = 1
where the minimum value of Num is 1, and V t 0 L i represents the coupled vector of W t 0 L i by Equation (9).
Second: For the next received WiFi such as W t j L i , we calculate the coupled vector V t j L i at first, then if V and V t j L i is approximately equal, we add 1 to Num , and let V equals V t j L i , otherwise, we subtract 1 from Num while ensuring that its value is not less than 1, and let V equal V t j L i only when Num equals 1.
In this workflow, with the number of received WiFi increases, V represents the coupled vector of the approximately accurate WiFi for the third positioning characteristic of WiFi, Num represents the number of WiFi with the error level represented by the coupled vector V more than the WiFi with the other error level. Further based on the third positioning characteristic of WiFi, the current WiFi will be regarded as the approximately accurate WiFi when Num exceeds a certain threshold such as follows:
Num > THR 4
where THR 4 represents the predefined threshold of the cumulative number of Num and can be empirically determined.
In summary, in WiFi-Chain, we sufficiently utilize the complementarity of PDR and WiFi by coupling them in a way of vector, and based on the extracted positioning characteristic and the complementary characteristics, we obtain the approximately accurate WiFi even if the error level of the initial WiFi is unknown, and achieve the outlier detection and removal simultaneously. Since characteristics are universal, the characteristic-based WiFi-Chain is robust. Further, we will integrate the WiFi-Chain into the proposed hybrid fusion scheme to mitigate the effect of outliers of WiFi and improve the performance of the scheme when the pedestrian is walking.

4. Proposed Hybrid Fusion Scheme

4.1. System Overview

Figure 5 overviews the architecture of the proposed hybrid fusion scheme for smartphone indoor positioning. In the scheme, we integrated the two proposed outlier detection and removal strategies, and considering the effect of the pitch, roll, magnetic inclination, and magnetic declination on azimuth, we design an INS-based AHRS via EKF to estimate the azimuth of PDR, and a UKF is designed to fuse the PDR and WiFi ultimately. Moreover, although the smartphone contains four basic poses, i.e., handheld, swinging, calling, and pocket [16], this paper only considers the most common handheld pose.

4.2. PDR Technology

PDR is a recursive positioning technology which contains three critical procedures: azimuth estimation, step detection, and step length estimation. The principle of PDR can be expressed as follows:
P t = P t 1 + D t · [ sin ( ψ t ) cos ( ψ t ) ]
where P t = ( x t , y t ) and P t 1 = ( x t 1 , y t 1 ) represent the pedestrian’s coordinate at t and t 1 , respectively, D t and ψ t represent the estimated step length and azimuth at t , respectively.

4.2.1. Azimuth Estimation

Attitude Updating of INS Mechanization
The basic idea of the attitude updating in INS Mechanization is that the attitude can be obtained by integrating the angular rates provided by the triple-axis gyroscope. Due to the low quality of smartphones’ built-in MEMS IMU, we have neglected certain small error correction terms (i.e., rotation of the Earth) of the INS mechanization for their slight improvement in navigation performance. The discrete attitude updating algorithm of INS mechanization with a unit quaternion can be expressed as follows:
Q b ( t ) n c = Q b ( t 1 ) n c Q b ( t ) b ( t 1 ) Q b ( t ) b ( t 1 ) = [ cos ( Δ θ t 2 ) Δ θ t Δ θ t 2 sin ( Δ θ t 2 ) ] Δ θ t = ( ω ˜ ib b ε g b ) Δ t
where ω ˜ ib b represents the angular rate measurement vector from triple-axis gyroscope, ε g b represents the drift vector of the triple-axis gyroscope, Δ t is the time interval between two adjacent moments, Q b n c is the quaternion rotation from the body coordinate system (i.e., b -frame) to the computed navigation coordinate system (i.e., n c -frame).
The transformation from the quaternion rotation Q b n c = [ q 1 , q 2 , q 3 , q 4 ] to the rotation matrix C b n c can be expressed as follows:
C b n c = [ q 1 2 + q 2 2 q 3 2 q 4 2 2 ( q 2 q 3 q 1 q 4 ) 2 ( q 2 q 4 + q 1 q 3 ) 2 ( q 2 q 3 + q 1 q 4 ) q 1 2 q 2 2 + q 3 2 q 4 2 2 ( q 3 q 4 q 1 q 2 ) 2 ( q 2 q 4 q 1 q 3 ) 2 ( q 3 q 4 + q 1 q 2 ) q 1 2 q 2 2 q 3 2 + q 4 2 ]
System Model
As the low-grade MEMS IMU in the smartphone has large gyroscope drift, which will degrade the accuracy of AHRS, an EKF is usually utilized to fuse multi-measurement information to improve the performance. The state variables are defined as:
δ x = [ ( ϕ ) 1 × 3   ( ε g b ) 1 × 3 ]
where ϕ represents the attitude error vector in the n-frame, ε g b represents the drift of the triple-axis gyroscope.
The discrete linearization of the system error model can be expressed as follows:
{ δ x t , t 1 = Φ t 1 δ x t 1 , t 1 + w t δ z t = H t δ x t , t 1 + v t
where δ x t 1 , t 1 represents the previous error state vector, δ x t , t 1 represents the predicted error state vector, δ z t represents the measurement misclosure vector, H t represents the design matrix, w t and v t represent the system process noise and measurement noise, respectively, and Φ t 1 represents the 6 × 6 state transition matrix:
Φ t 1 = [ I 3 × 3 C b ( t ) n c Δ t 0 3 × 3 I 3 × 3 ]
where Δ t is the time interval between two adjacent moments.
The rotation matrix C ^ b n from the body coordinate system (i.e., b-frame) to the true navigation coordinate system (i.e., n-frame) can be calculated via feedback as follows:
C ^ b n = ( 1 + ϕ × ) C b n c
The estimated azimuth ψ t for PDR can be calculated as follows:
ψ t = { atan 2 ( C 12 , C 22 ) , i f   | C 32 | 0.999999 0 i f   | C 32 | > 0.999999
where C ij is the element at the i th row and j th column of C ^ b n .
The azimuth rate ψ ˙ t can be calculated as follows:
ψ ˙ t = C ^ b n ( ω ˜ ib b ε g b ) 3
where   3 represents taking the third coordinate.
Measurement Model
Regarding Earth gravity sensing ability, the triple-axis accelerometers are usually utilized to update the AHRS in the absence of external acceleration. The absolute value of the difference between the triple-axis accelerometer measurement vector and Earth’s gravity is utilized to determine whether external acceleration exists, which can be expressed as:
| f ˜ b 2 f n 2 | THR 5
where f ˜ b and f n = [ 0 0 g ] represent the triple-axis accelerometer measurement vector and the Earth gravity vector, respectively, THR 5 represents the predefined threshold of the external acceleration determination and can be empirically determined.
Then, the accelerometer measurement model can be expressed as follows:
δ z a = [ f ˜ b f ˜ b 2 f ˜ ins b f ˜ ins b 2 ] = [ f ˜ b f ˜ b 2 ( C ^ b n ) T f n f n 2 ] = H t 1 × δ x + v 1 = [ C n c b ( f n f n 2 × ) 0 3 × 3 ] [ ϕ ε g b ] + v 1
where f ˜ b represents the accelerometer reading vector, v 1 represents the measurement noise.
Regarding geomagnetic field sensing ability, the triple-axis magnetometers are usually utilized to update the AHRS in the absence of any external magnetic field interference. Whereas, there are frequent magnetic field disturbances caused by the man-made infrastructure in indoor environments, to mitigate the effect of the disturbance, the weight for the magnetometer measurements was set at a very small value in our model. Moreover, to avoid the effect of horizontal angle error, the triple-axis magnetometer readings rather than the absolute azimuth are utilized by means of tight coupling. The magnetometer measurement model can be expressed as follows:
δ z m = [ m ˜ b m ˜ b 2 m ˜ ins b m ˜ ins b 2 ] = [ m ˜ b m ˜ b 2 C ^ n b C m n H m H m 2 ] = H t 2 × δ x + v 2 = [ C n c b ( ( C m n H m H m 2 ) × ) 0 3 × 3 ] [ ϕ ε g b ] + v 2
where m ˜ b represents the triple-axis magnetometer measurement vector, v 2 represents the measurement noise. H m = [ 0 H 0 ] represents the geomagnetic field in the magnetic coordinate system (i.e., m-frame), and C m n represents the rotation matrix from the m-frame to the n-frame and can be expressed as follows:
C m n = [ cos ( η z ) cos ( η x ) sin ( η z ) sin ( η x ) sin ( η z ) sin ( η z ) cos ( η x ) cos ( η z ) sin ( η x ) cos ( η z ) 0 sin ( η x ) cos ( η x ) ]
where η x = 47.22 and η z = 4.68 represent the magnetic inclination angle and declination angle in WuHan, respectively, which can be calculated from the IGRF model [63,64].
Based on the system model and measurement model, the AHRS can be executed according to Figure 6.

4.2.2. Step Detection and Step Length Estimation

We employ the peak detection algorithm to detect the step due to its small computation and high success rate, and the Weinberg model to estimate the step length due to its practicability [15]. Weinberg model assumes that the step length D is proportional to the vertical movement of the human hip and can be expressed as follows:
D = K · a z max a z min 4
where a z max and a z min represent the maximum and minimum value of the vertical acceleration in one step period, respectively, K represents the predefined parameter to obtain the appropriate step length and can be empirically determined.

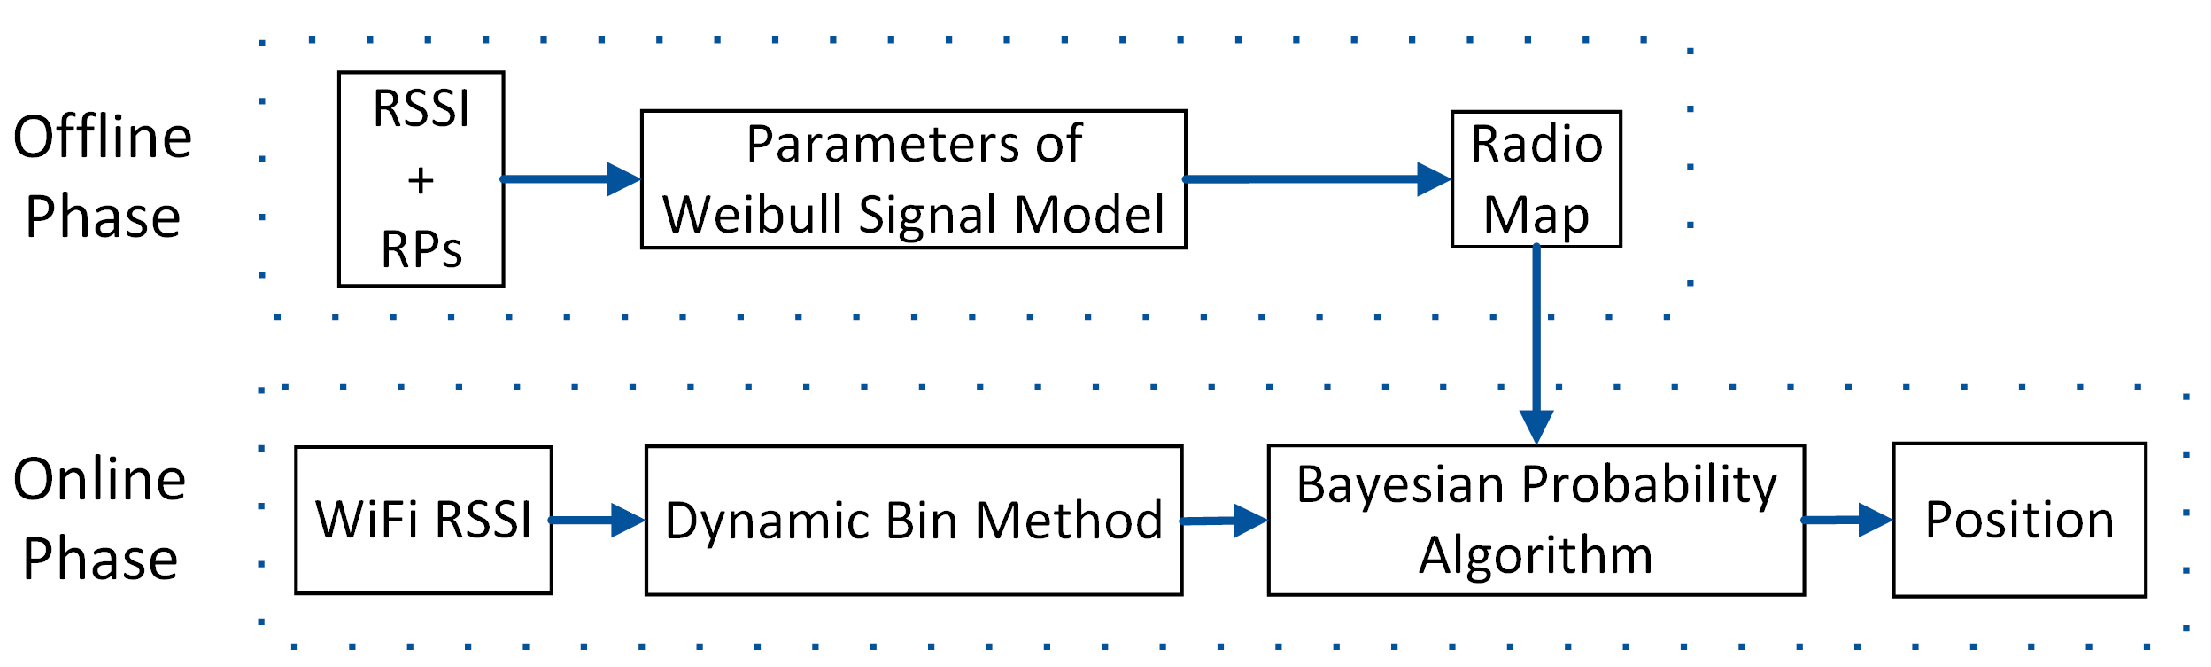
4.3. WiFi Technology

In this paper, a probabilistic algorithm of fingerprinting positioning technology named Weibull probability density function fingerprinting algorithm based on the Weibull-Bayesian density model with dynamic bin is employed, since the algorithm not only possesses an excellent positioning accuracy, but also reduces the workload in establishing the radio map [25], Figure 7 presents an overview of the architecture of the employed WiFi technology.

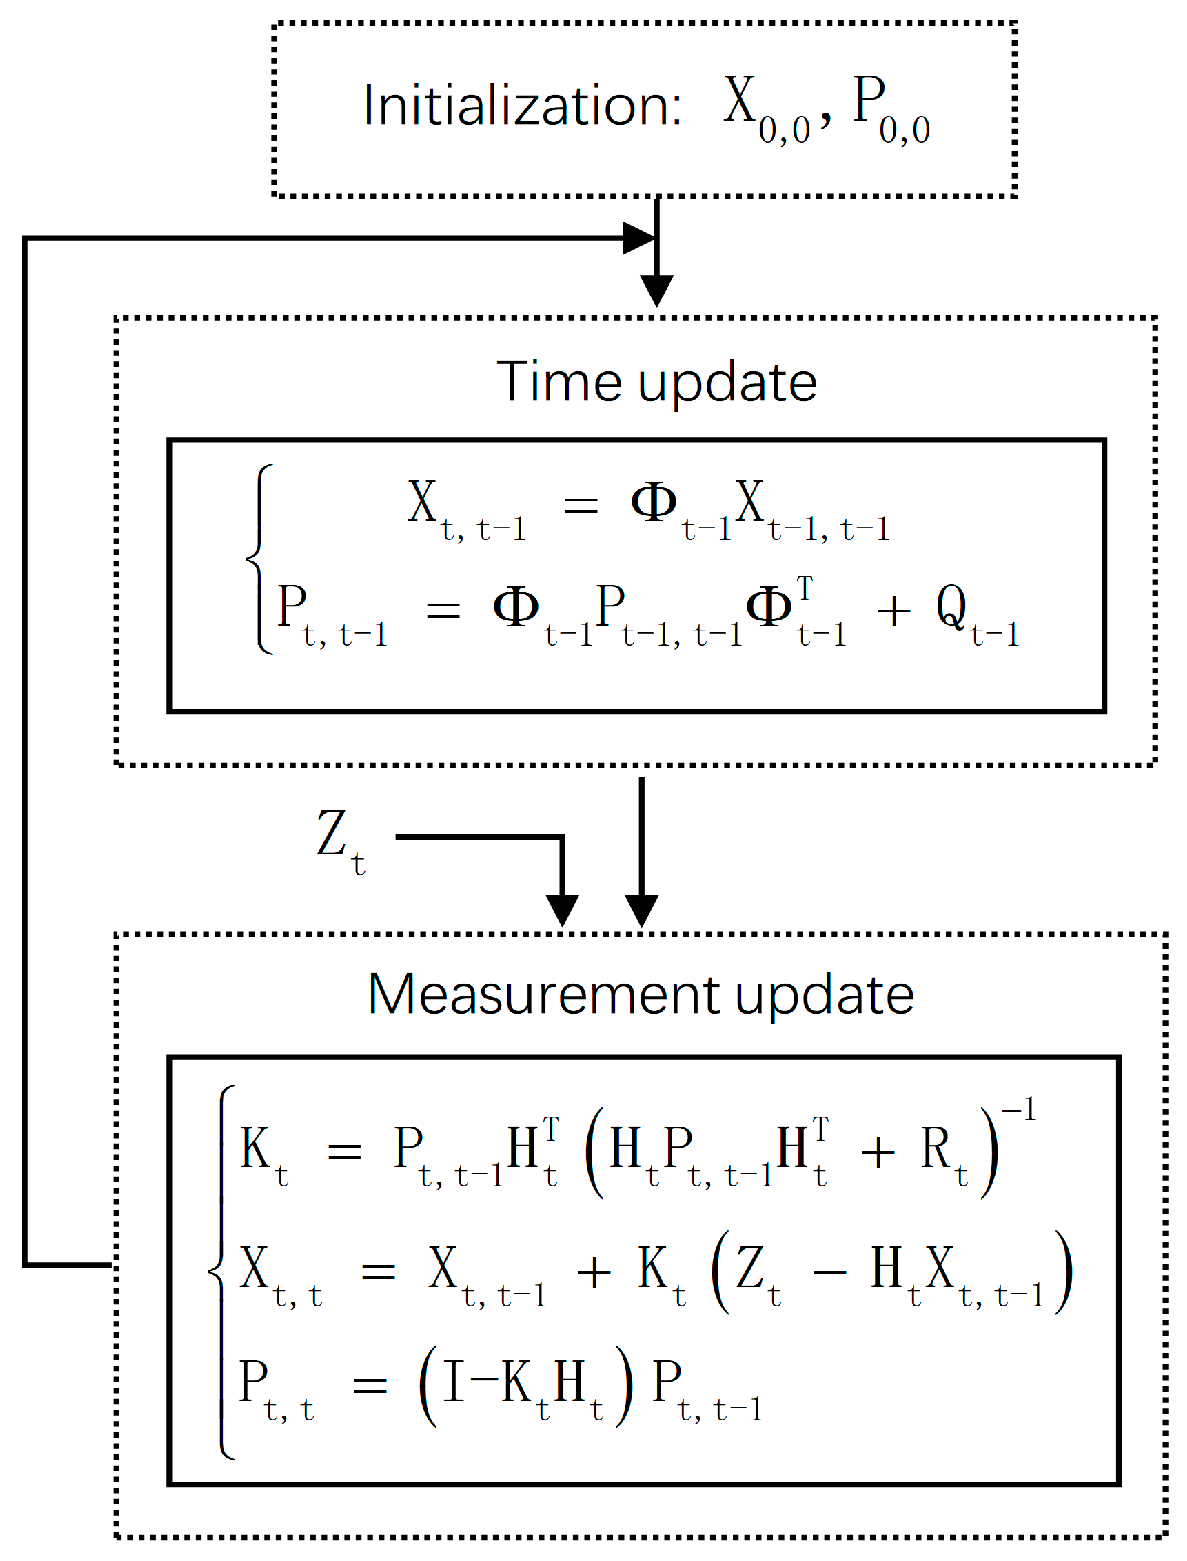
4.4. Hybrid Fusion via UKF

Although many researchers adopt different filters to fusion PDR and WiFi, such as KF, EKF, and Particle filter (PF) [65,66], in this paper, the UKF which is a non-linear filtering algorithm based on the unscented transform is adopted for the following considerations:
  • There exists a non-linear in the proposed hybrid fusion scheme when considering the azimuth as a state variable. In this situation, KF is inapplicable for its linear nature. EKF is also inapplicable for its linearization error and hence will degrade the positioning accuracy [52].
  • Compared with PF, UKF is a lighter filter that is more suitable for real-time positioning on the resource-limited smartphone.
The state equation of UKF is designed as follows:
X t = [ x t y t s t ψ t ψ ˙ t ] = [ x t 1 + s t · Δ t · sin ( ψ t ) y t 1 + s t · Δ t · cos ( ψ t ) s t 1 ψ t 1 + ψ ˙ t · Δ t ψ ˙ t 1 ] + w t
where ( x t , y t ) , s t , ψ t , and ψ ˙ t represent the two-dimensional coordinate, speed, azimuth and azimuth rate, respectively, Δ t represents the time interval between two adjacent moments, and w t represents the system process noise with the covariance matrix Q t = E ( w t w t T ) , and Q t can be empirically determined.
The measurement equation of UKF is designed as follows:
Z t = [ x t y t s t ψ t ψ ˙ t ] T = H t X t + v t
where ( x t , y t ) represents the two-dimensional measurement coordinate from WiFi, s t = D t / Δ t represents the measurement speed from PDR, ψ t and ψ ˙ t represent the measurement azimuth and azimuth rate from AHRS, H t represents the design matrix and is a five-dimensional identity matrix I 5 × 5 , v t represents the measurement noise with the covariance matrix R t = E ( v t v t T ) , and R t can be empirically determined.
The implementation of the UKF algorithm is detailed in [52].

5. Experimental Evaluation

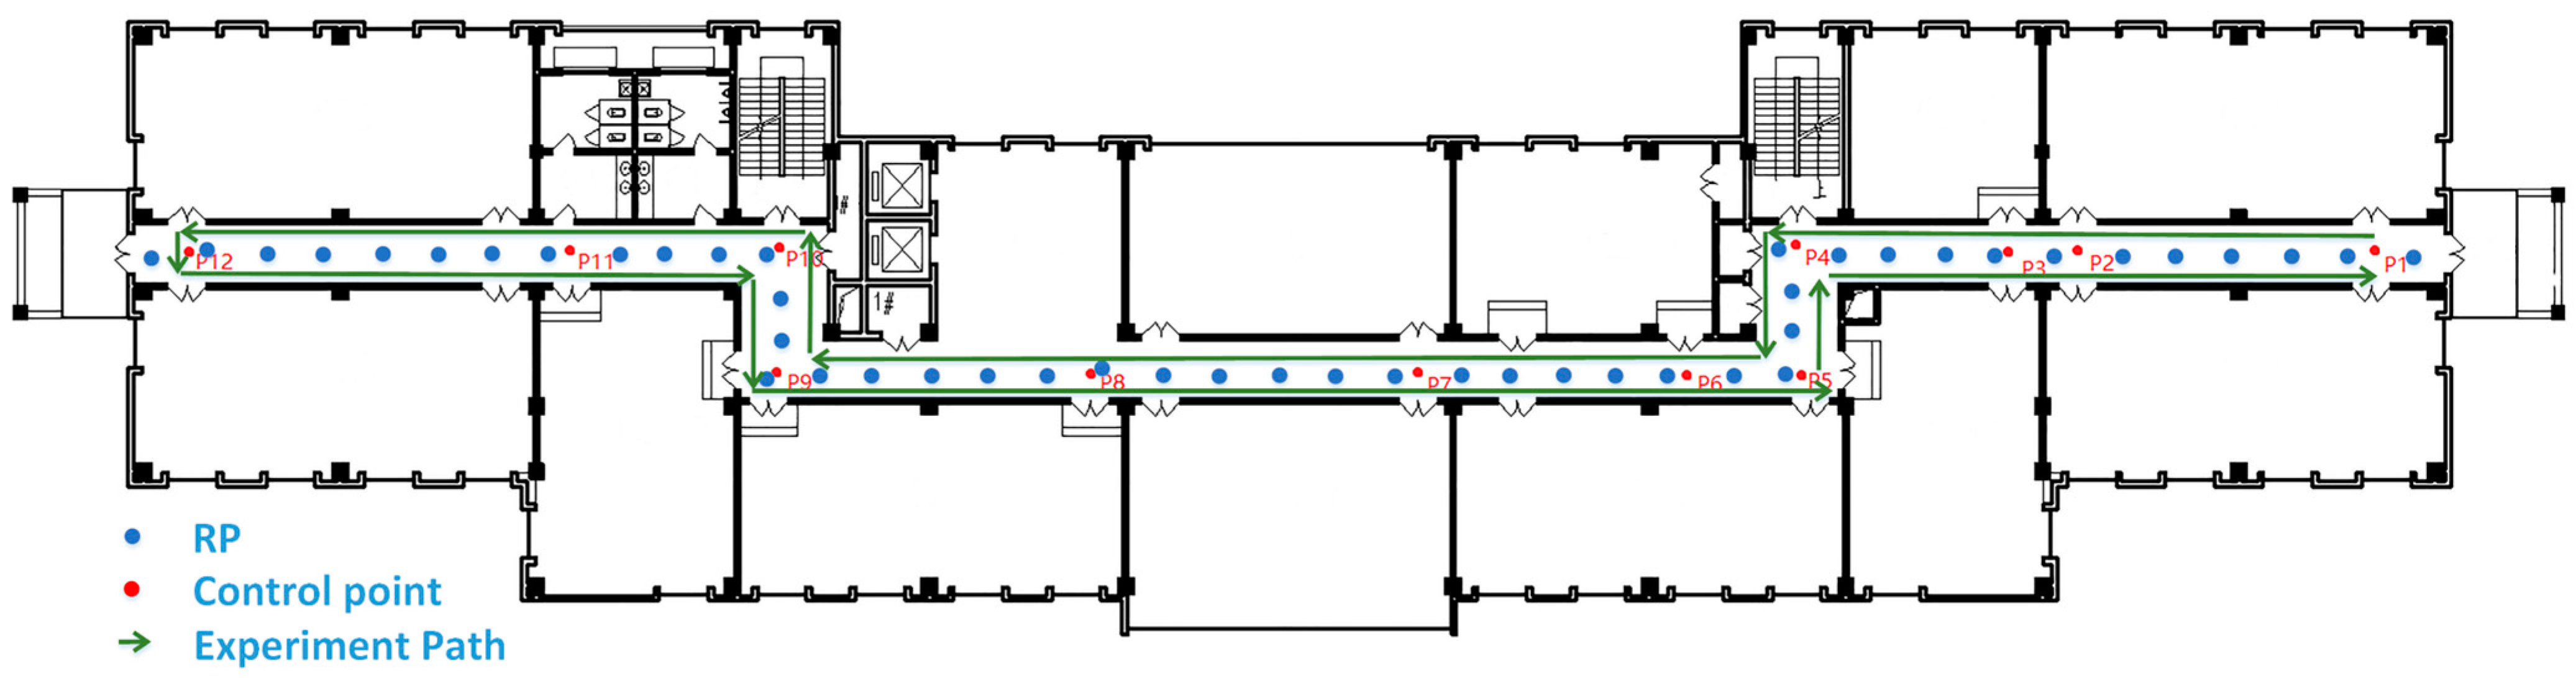
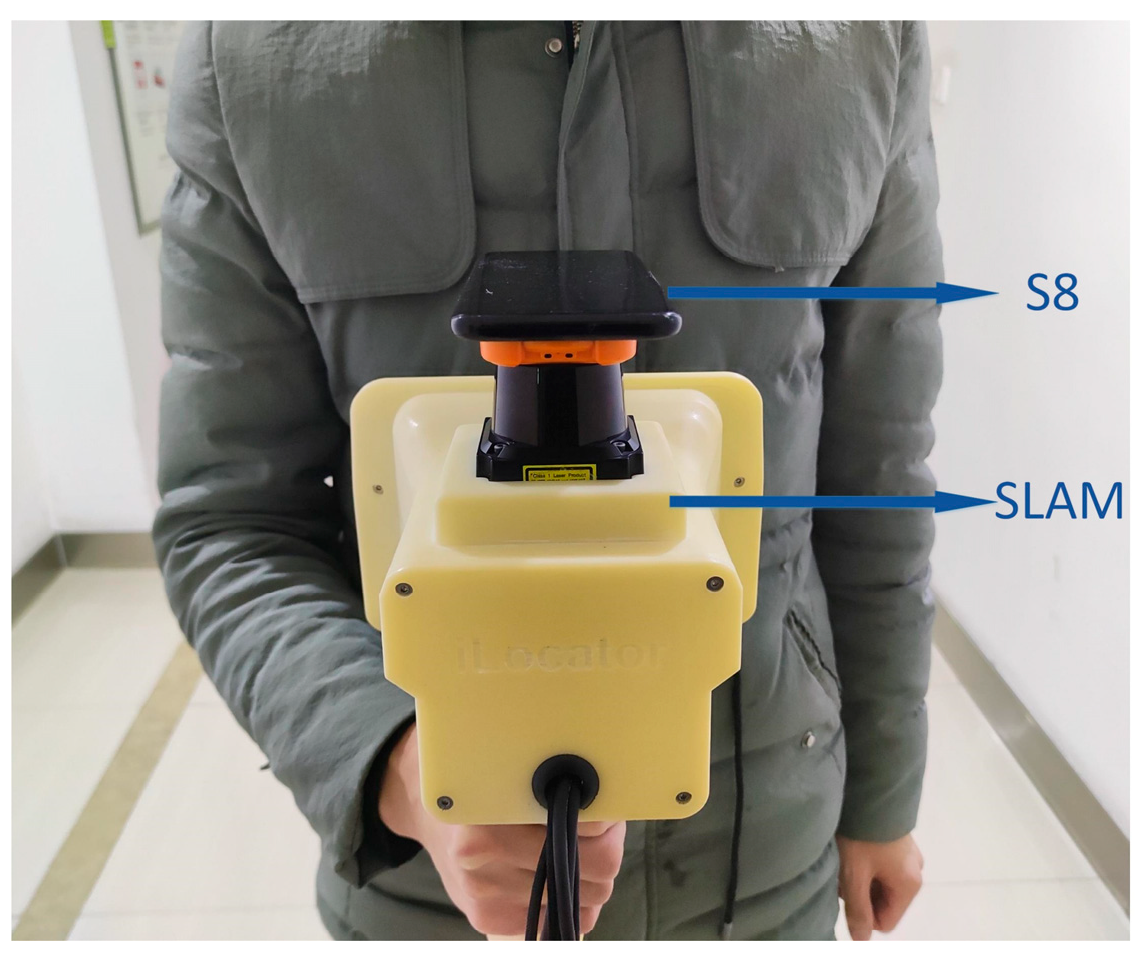
5.1. Experimental Environment Deployment

The experimental environment is provided by Siriandhorn Research Center at Wuhan University, which is a typical office environment. Figure 8 shows the layout of the experimental site, the experimental path, and the RPs. The site is about 90 m in length and contains 12 control points with known coordinates in terms of CGCS2000 [67]. To establish the radio map, 47 RPs were established on a grid map at intervals of approximately 2.5 m, and 30 sets of RSS samples were collected at each RP via a Samsung Galaxy S8 smartphone with the Android 8.0 operation system to estimate the parameters of the Weibull signal model [25].
The smartphone is also employed as the positioning device which outputs the positioning coordinates of the proposed hybrid fusion scheme at a frequency of 50 Hz, and the raw data sampling frequency of WiFi, accelerometer, gyroscope, and magnetometer are 0.72 Hz, 50 Hz, 50 Hz, and 50 Hz, respectively. Another positioning device is a handheld SLAM which comprises a single scan lidar with a frequency at 40 Hz and an IMU with a frequency at 100 Hz, the SLAM can output the local coordinates with a frequency at 50 Hz by executing an algorithm named Cartographer SLAM of Google [68]. The output local coordinates can be transformed into the coordinates in terms of CGCS2000 and further be utilized to evaluate the positioning performance of the smartphone. Figure 9 shows the two employed devices.
Besides, in this paper, we predefined the value of THR1, THR4, THR5, and THR6 as 6, 3, 0.05 m/s2, and 0.556 based on our testing results, respectively, the value of THR2 as 3 m based on the interval of RPs which is approximately 2.5 m in our established radio map, and the value of THR3 as 2.5 m based on the 68% error of the employed WiFi technology [25]; further, the value of Q t and the initial value of R t in UKF is predefined as follows:
Q t = [ 2 e 3 0 0 0 0 0 2 e 3 0 0 0 0 0 5 e 5 0 0 0 0 0 0.01 0 0 0 0 0 0.01 ]     R t = [ 3 0 0 0 0 0 3 0 0 0 0 0 0.02 0 0 0 0 0 16 0 0 0 0 0 9 ]
Finally, based on the abovementioned deployed environment, the running time for once filtering is approximately 8 ms on the employed smartphone.

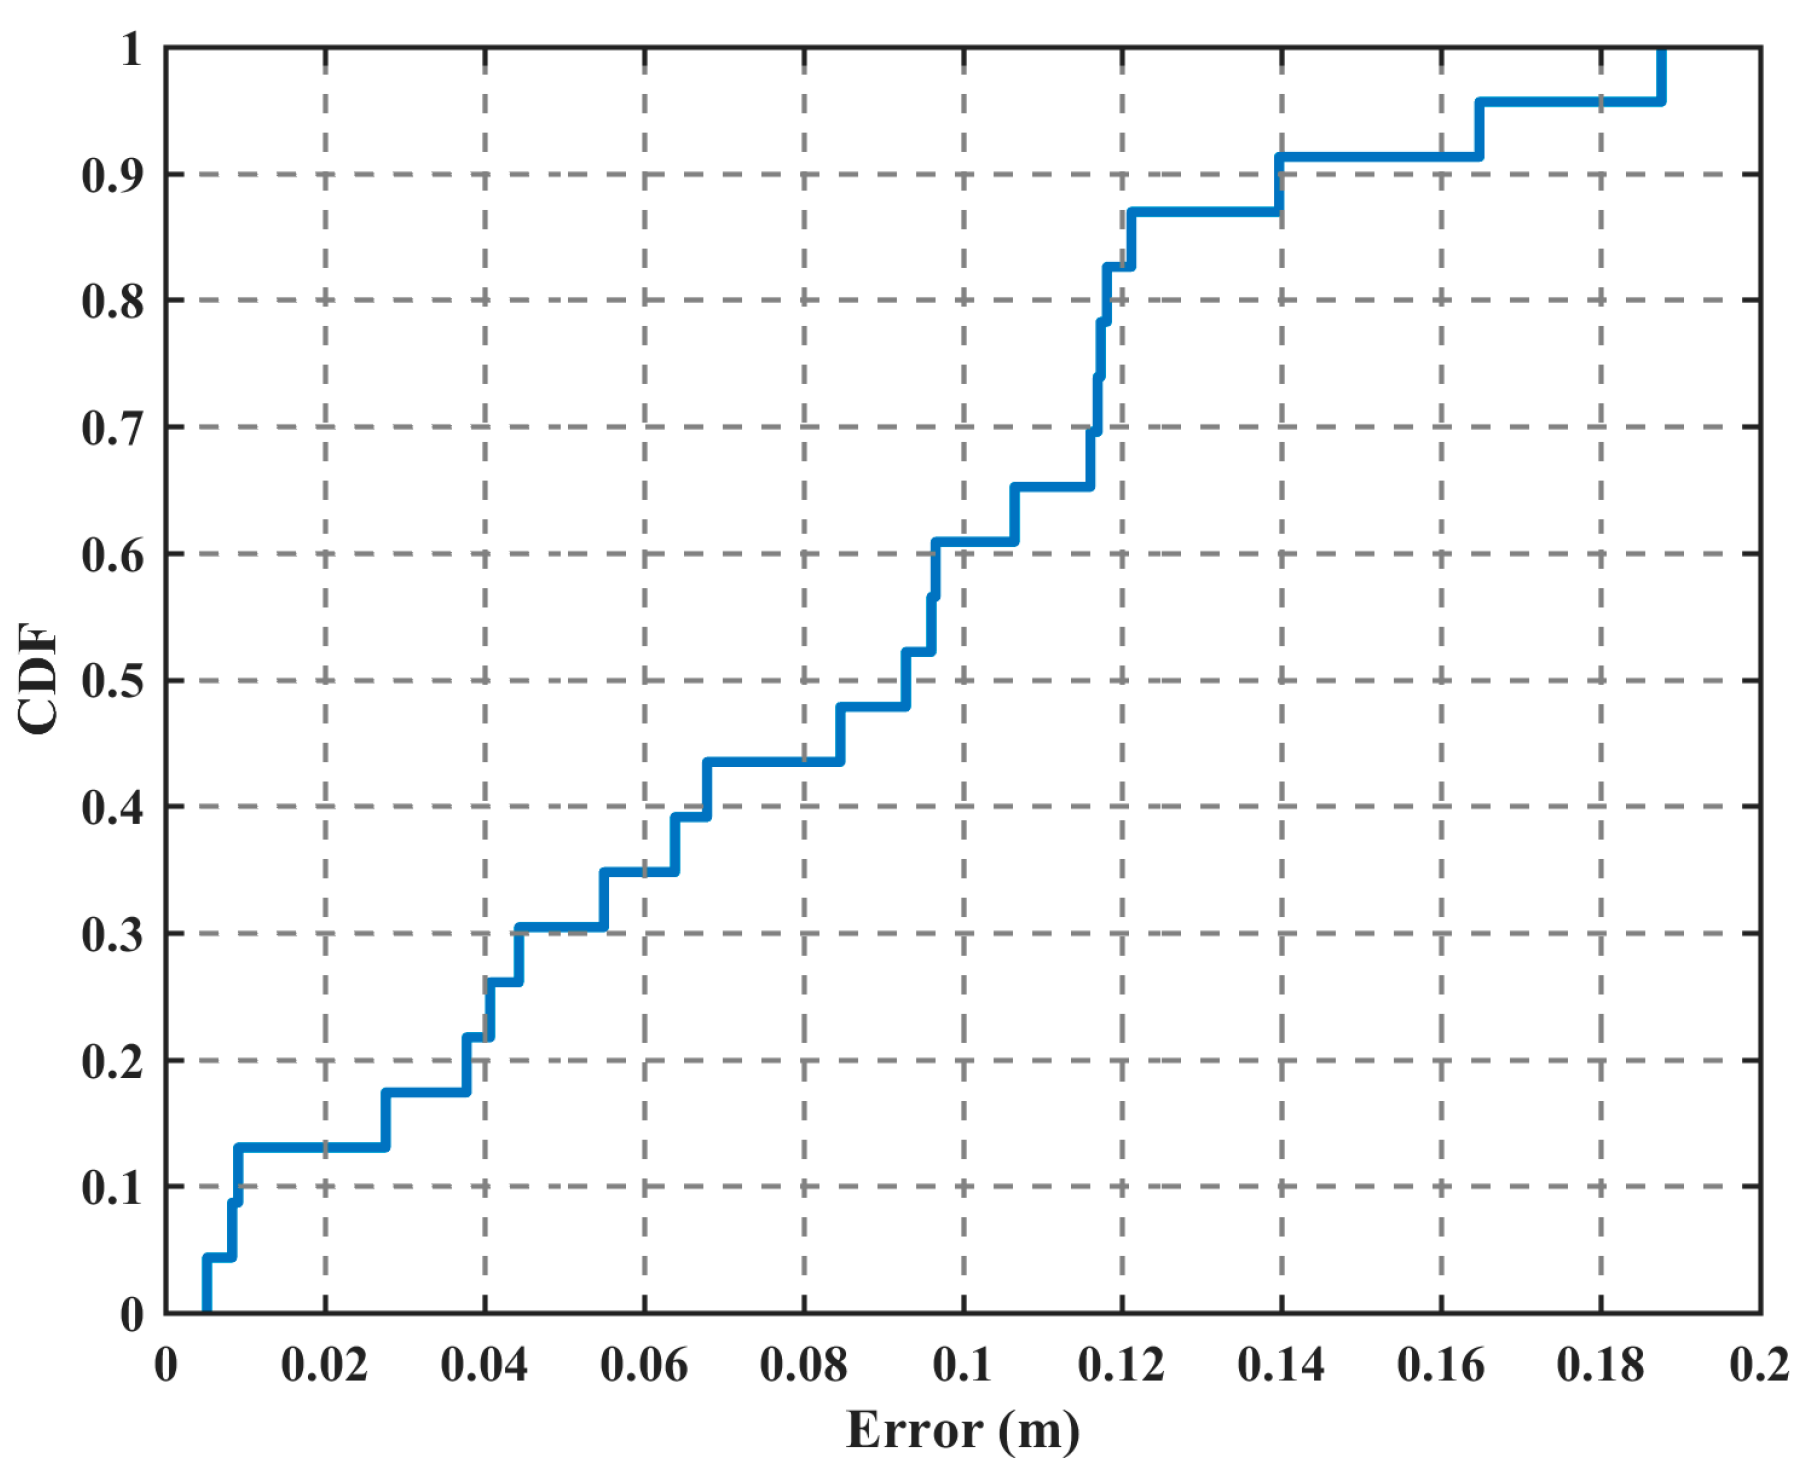
5.2. Experimental Setup and Performance

We set three experiments, and the performance can be evaluated as follows:
E = P true P loc 2 ,
where P true and P loc represent the two-dimensional true coordinates and the to be evaluated positioning coordinates, respectively, E represents the positioning error.
The first experiment is designed to demonstrate the capacity of the handheld SLAM device in evaluating the positioning performance of the smartphone. We run the device along the experimental path shown in Figure 8 with a normal walking speed of approximately 1 m/s and then transform the output local coordinates into the coordinates in terms of CGCS2000 via a planar four-parameter coordinate transformation model [69]. Further taking the known coordinates of control points as the true coordinates, the performance of the transformed coordinates can be evaluated by Equation (30).
Figure 10 shows the cumulative distribution function (CDF) of the transformed coordinates for the handheld SLAM device. The RMSE, 95% error, 68% error, ME, MaxE, and Minimum error are 0.097 m, 0.165 m, 0.116 m, 0.083 m, 0.188 m, and 0.005 m, respectively. This performance is much more accurate than the meter-level positioning performance of the smartphone, therefore the handheld SLAM device is competent to evaluate the positioning performance of the smartphone.
The second experiment is designed to evaluate the performance of WiFi-AGNES. We randomly select 9 control points in Figure 8, and the employed WiFi technology is executed individually for about four minutes at each control point in the static state. When Equation (3) is satisfied, we will execute WiFi-AGNES. Further taking the coordinates of the control points as the true coordinates, the performance of the WiFi technology with and without WiFi-AGNES can be evaluated by Equation (30), respectively.
Table 2 and Figure 11 show the various statistical results and the CDF for the evaluated 9 control points, respectively. Where AGNES and NO-AGNES represent the positioning of WiFi technology with and without WiFi-AGNES, respectively. In Table 2, compared to the 68% error of NO-AGNES which are 1.62 m, 1.73 m, 2.05 m, 1.02 m, 1.94 m, 1.35 m, 1.58 m, 0.72 m, and 1.11 m at the 9 control points, respectively, the MaxE are 7.34 m, 6.47 m, 13.89 m, 2.06 m, 12.32 m, 11.06 m, 5.55 m, 2.44 m, and 2.95 m, respectively, which demonstrates that there are many outliers of WiFi technology at each control point and verifies the extracted characteristics in Section 3.1.1; with AGNES, the MaxE are 1.09 m, 0.67 m, 2.05 m, 0.60 m, 0.85 m, 0.61 m, 0.72 m, 0.35 m, and 0.92 m at the 9 control points, respectively, compared to NO-AGNES, the improved percentages are 85.1%, 89.6%, 85.2%, 70.9%, 93.1%, 94.5%, 87.0%, 85.7%, and 68.8%, respectively, which demonstrates that the proposed strategy WiFi-AGNES can effectively achieve the outlier detection and removal. Moreover, the RMSE of AGNES are 0.87 m, 0.58 m, 1.14 m, 0.50 m, 0.45 m, 0.41 m, 0.35 m, 0.22 m, and 0.90 m at the 9 control points, respectively, which are more excellent than NO-AGNES of 2.96 m, 2.6 m, 2.33 m, 1.27m, 1.89 m, 2.54 m, 2.06 m, 1.33 m, and 1.13 m, respectively, the improved percentages are 70.6%, 77.7%, 51.1%, 60.6%, 76.2%, 83.9%, 83.0%, 83.5%, and 20.4%, respectively; further taking P7 as an example, the RMSE, 95% error, 68% error, ME, MaxE, and Minimum error of AGNES are 0.41 m, 0.59 m, 0.52 m, 0.38 m, 0.61 m, and 0.19 m, respectively, which are better than the corresponding values 2.54 m, 5.27 m, 1.35 m, 1.76 m, 11.06 m, and 0.69 m of NO-AGNES, the improved percentages are 83.9%, 88.8%, 61.5%, 78.4%, 94.5%, and 72.5%, respectively. Moreover, it is worth noting that except for P6, we even reduced the Minimum error at other control points by AGNES, which are 0.79 m, 0.36 m, 0.44 m, 0.36 m, 0.19 m, 0.26 m, 0.07 m, and 0.57 m, respectively, while the Minimum error of NO-AGNES are 0.81m, 0.63 m, 0.59 m, 0.94 m, 0.69 m, 0.44 m, 0.52 m, and 0.92 m, respectively, the improved percentages are 2.5%, 42.9%, 25.4%, 61.7%, 72.5%, 40.9%, 86.5% and 38.0%, respectively, these improvements come from the average of the coordinates of the selected cluster via Equation (8) in WiFi-AGNES. These performances demonstrate that the proposed strategy WiFi-AGNES is effective. Figure 11 verifies the above performance from another perspective.
The third experiment is designed to evaluate the performance of the proposed strategy WiFi-Chain and the proposed hybrid fusion scheme which integrates the two proposed outlier detection and removal strategies. We take the experiment along the experimental path showed in Figure 8 with a normal walking speed of approximately 1 m/s, and a snapshot is showed in Figure 9. To evaluate the performance of WiFi-Chain, we record the WiFi which satisfies both Equation (10) and Equation (12), and to evaluate the performance of WiFi-AGNES again, considering the requirement of evaluation and time costs, we will stand at each of the remaining three control points (i.e., P3, P9, and P12) for about 1 minute (i.e., about 40 WiFi coordinates will be received at each control point) during the experiment. Further taking the transformed coordinates of the handheld SLAM device as the true coordinates of the scheme and WiFi-Chain, and the coordinates of the control points as the true coordinates of WiFi-AGNES, the performance can be evaluated via Equation (30).
Table 3 and Figure 12a show the various statistical results and the CDF of the positioning error, respectively. Where Fusion represents the fusion scheme with neither WiFi-AGNES nor WiFi-Chain, Fusion+WiFi-AGNES and Fusion+WiFi-Chain represent the fusion scheme which only integrates WiFi-AGNES and WiFi-Chain, respectively, Fusion+WiFi-AGNES+WiFi-Chain represents the proposed hybrid fusion scheme which integrates both WiFi-AGNES and WiFi-Chain. In Table 3, compared to Fusion, which achieves an RMSE, 95% error, 68% error, ME, MaxE, and Minimum error of 2.08 m, 4.12 m, 1.93 m, 1.67 m, 7.47 m, and 0.04 m, respectively, the improved percentages of Fusion+WiFi-Chain are 18.8%, 20.6%, 9.3%, 15.0%, 42.4%, and 50.0%, respectively, the improved percentages of Fusion+WiFi-AGNES are 9.1%, 5.1%, 16.1%, 13.8%, 0.0%, and 0.0%, respectively, and the improved percentages of Fusion+WiFi-AGNES+WiFi-Chain are 31.3%, 35.9%, 19.2%, 28.7%, 46.6%, and 50.0%, respectively. It is obvious that the proposed hybrid fusion scheme achieves the best performance, which demonstrates that the two proposed strategies are effective in outlier detection and removal. Figure 12a verifies the above performance from another perspective.
Table 3, Figure 12b, and Figure 13 show the various statistical results, the CDF of the positioning error, and the frequency distribution histogram, respectively. Where All-WiFi represents the total received WiFi during the third experiment, WiFi-Chain-WiFi and No-WiFi-Chain-WiFi represent the WiFi which satisfies and dissatisfies WiFi-Chain, respectively. In Table 3, compared to All-WiFi, which achieves an RMSE, 95% error, 68% error, ME, MaxE, and Minimum error of 2.97 m, 6.97 m, 2.25 m, 2.10 m, 9.44 m, and 0.02 m, respectively, the improved percentages of WiFi-Chain-WiFi are 44.8%, 47.8%, 19.1%, 41.4%, 55.5%, and 0.0%, respectively. As shown in Figure 13b, there are totally 274 WiFi received during the third experiment, which possesses the characteristics extracted in Section 3.2.1, and we have picked out 203 WiFi which satisfy WiFi-Chain as shown in Figure 13a, the maximum error of WiFi-Chain-WiFi is less than 4.3 m. Moreover, we showed the WiFi which dissatisfies WiFi-Chian in Figure 13c, which includes all WiFi with an error greater than 4.3 m. The abovementioned results demonstrate that the proposed strategy WiFi-Chian possesses an excellent performance in outlier detection and removal. Figure 12b verifies the above performance from another perspective.
Figure 14 shows the performance of WiFi-AGNES for the evaluated 3 control points during the third experiment. Compared to NO-WiFi-AGNES, which achieves a MaxE of 7.72 m, 3.65 m, and 6.94 m for P3, P9, and P12, respectively, WiFi-AGNES achieves a MaxE of 2.59 m, 0.55 m, and 0.86 m, respectively, the improved percentages are 66.5%, 84.9%, and 87.6%, respectively. This performance again demonstrates that the proposed strategy WiFi-AGNES possesses an excellent capacity in outlier detection and removal.

6. Conclusions

In this paper, based on the extracted positioning characteristics of WiFi when the pedestrian is static, we proposed the first outlier detection and removal strategy using ML named WiFi-AGNES, and based on the extracted positioning characteristics of PDR, WiFi, and the complementarity between them when the pedestrian is walking, we proposed the second outlier detection and removal strategy named WiFi-Chain, further, a hybrid fusion scheme integrated the two proposed strategies is proposed. The designed experiment result shows that the RMSE of the proposed scheme is 1.43 m, which is 31.3% higher than the fusion with neither WiFi-AGNES nor WiFi-Chain. This performance demonstrates that the proposed two strategies possess an excellent performance in outlier detection and removal. Furthermore, since characteristics are universal, the characteristic-based strategies are robust, and the proposed scheme integrated the two characteristic-based strategies also possesses strong robustness.
In the future, we will integrate other smartphone indoor positioning technologies, such as MM and Visual, etc., into our proposed hybrid fusion scheme to provide more excellent performance.

Author Contributions

Conceptualization, Z.Z.; methodology, Z.Z.; software, Z.Z.; validation, Z.Z.; formal analysis, Z.Z.; investigation, Z.Z.; resources, Z.Z. and X.G.; data curation, Z.Z. and S.Y.; writing—original draft preparation, Z.Z.; writing—review and editing, Z.Z., J.L., L.W., G.G., and X.Z.; visualization, Z.Z. and G.H.; supervision, J.L.; project administration, J.L.; funding acquisition, J.L. All authors have read and agreed to the published version of the manuscript.

Funding

This research was funded in part by the National Key Research Development Program of China, grant number 2016YFB0502204, in part by the Natural Science Fund of China, grant number 41874031 and 61872431, in part by the Technology Innovation Program of Hubei Province, grant number 2018AAA070, in part by the Natural Science Fund of Hubei Province, grant number 2018CFA007, in part by the Postdoctoral Research Foundation of China, grant number 2020M682480, and in part by the Fundamental Research Funds for the Central Universities. The APC was funded by 2016YFB0502204.

Acknowledgments

We are grateful to professor Xiaoji Niu, and professor Gongmin Yan for their theoretical support.

Conflicts of Interest

The authors declare no conflict of interest.

References

  1. Liu, J.; Chen, R.; Chen, Y.; Pei, L.; Chen, L. iParking: An Intelligent Indoor Location-Based Smartphone Parking Service. Sensors 2012, 12, 14612–14629. [Google Scholar] [CrossRef]
  2. Pei, L.; Chen, R.; Chen, Y.; Leppäkoski, H.; Perttula, A. Indoor/Outdoor Seamless Positioning Technologies Integrated on Smart Phone. In Proceedings of the 2009 First International Conference on Advances in Satellite and Space Communications, Washington, DC, USA, 20–25 July 2009; pp. 141–145. [Google Scholar]
  3. Wang, L.; Chen, R.; Shen, L.; Qiu, H.; Li, M.; Zhang, P.; Pan, Y. NLOS Mitigation in Sparse Anchor Environments with the Misclosure Check Algorithm. Remotesensing 2019, 11, 773. [Google Scholar] [CrossRef] [Green Version]
  4. Chen, L.; Pei, L.; Kuusniemi, H.; Chen, Y.; KroGer, T.; Chen, R. Bayesian Fusion for Indoor Positioning Using Bluetooth Fingerprints. Wirel. Pers. Commun. 2013, 70, 1735–1745. [Google Scholar] [CrossRef]
  5. Ye, F.; Chen, R.; Guo, G.; Peng, X.; Liu, Z.; Huang, L. A Low-Cost Single-Anchor Solution for Indoor Positioning Using BLE and Inertial Sensor Data. IEEE Access 2019, 7, 162439–162453. [Google Scholar] [CrossRef]
  6. Yu, Y.; Chen, R.; Chen, L.; Guo, G.; Liu, Z. A Robust Dead Reckoning Algorithm Based on Wi-Fi FTM and Multiple Sensors. Remote Sens. 2019, 11, 504. [Google Scholar] [CrossRef] [Green Version]
  7. Guo, G.; Chen, R.; Ye, F.; Peng, X.; Liu, Z.; Pan, Y. Indoor Smartphone Localization: A Hybrid WiFi RTT-RSS Ranging Approach. IEEE Access 2019, 7, 176767–176781. [Google Scholar] [CrossRef]
  8. Xie, B.; Tan, G.; He, T. SpinLight: A High Accuracy and Robust Light Positioning System for Indoor Applications. In Proceedings of the 13th ACM Conference on Embedded Networked Sensor Systems, Seoul, Korea, 1–4 November 2015; pp. 211–223. [Google Scholar]
  9. Liu, Z.; Chen, R.; Ye, F.; Guo, G.; Li, Z.; Qian, L. Improved TOA Estimation Method for Acoustic Ranging in a Reverberant Environment. IEEE Sens. J. 2020, 1. [Google Scholar] [CrossRef]
  10. Ruiz, A.R.J.; Granja, F.S.; Honorato, J.C.P.; Rosas, J.I.G. Accurate Pedestrian Indoor Navigation by Tightly Coupling Foot-Mounted IMU and RFID Measurements. IEEE Trans. Instrum. Meas. 2012, 61, 178–189. [Google Scholar] [CrossRef] [Green Version]
  11. Pengzhan, C.; Ye, K.; Xiaoyue, C. A UWB/Improved PDR Integration Algorithm Applied to Dynamic Indoor Positioning for Pedestrians. Sensors 2017, 17, 2065. [Google Scholar]
  12. Kuang, J.; Niu, X.; Zhang, P.; Chen, X. Indoor Positioning Based on Pedestrian Dead Reckoning and Magnetic Field Matching for Smartphones. Sensors 2018, 18, 4142. [Google Scholar] [CrossRef] [PubMed] [Green Version]
  13. Liao, X.; Chen, R.; Li, M.; Guo, B.; Niu, X.; Zhang, W. Design of a Smartphone Indoor Positioning Dynamic Ground Truth Reference System Using Robust Visual Encoded Targets. Sensors 2019, 19, 1261. [Google Scholar] [CrossRef] [Green Version]
  14. Teng, W.; Jingbin, L.; Zheng, L.; Keke, L.; Beini, X. Accurate Smartphone Indoor Visual Positioning Based on a High-Precision 3D Photorealistic Map. Sensors 2018, 18, 1974. [Google Scholar]
  15. Jimenez, A.R.; Seco, F.; Prieto, C.; Guevara, J. A comparison of Pedestrian Dead-Reckoning algorithms using a low-cost MEMS IMU. In Proceedings of the 2009 IEEE International Symposium on Intelligent Signal Processing, Budapest, Hungary, 26–28 August 2009; pp. 37–42. [Google Scholar]
  16. Tian, Q.; Salcic, Z.; Wang, I.K.; Pan, Y. A Multi-Mode Dead Reckoning System for Pedestrian Tracking Using Smartphones. IEEE Sens. J. 2016, 16, 2079–2093. [Google Scholar] [CrossRef]
  17. Jiuchao, Q.; Jiabin, M.; Rendong, Y.; Peilin, L.; Ling, P. An improved indoor localization method using smartphone inertial sensors. In Proceedings of the International Conference on Indoor Positioning and Indoor Navigation, Montbeliard, France, 28–31 October 2013; pp. 1–7. [Google Scholar]
  18. Qiu, S.; Wang, Z.; Zhao, H.; Qin, K.; Li, Z.; Hu, H. Inertial/magnetic sensors based pedestrian dead reckoning by means of multi-sensor fusion. Inf. Fusion 2017, 39, 108–119. [Google Scholar] [CrossRef] [Green Version]
  19. Alzantot, M.; Youssef, M. UPTIME: Ubiquitous pedestrian tracking using mobile phones. In Proceedings of the 2012 IEEE Wireless Communications and Networking Conference (WCNC), Paris, France, 1–4 April 2012; pp. 3204–3209. [Google Scholar]
  20. Fan, Q.; Zhang, H.; Pan, P.; Zhuang, X.; Jia, J.; Zhang, P.; Zhao, Z.; Zhu, G.; Tang, Y. Improved Pedestrian Dead Reckoning Based on a Robust Adaptive Kalman Filter for Indoor Inertial Location System. Sensors 2019, 19, 294. [Google Scholar] [CrossRef] [PubMed] [Green Version]
  21. Xiao, Z.; Wen, H.; Markham, A.; Trigoni, N. Robust Indoor Positioning With Lifelong Learning. IEEE J. Sel. Areas Commun. 2014, 33, 2287–2301. [Google Scholar] [CrossRef]
  22. Wang, L.; Chen, R.; Chen, L.; Shen, L.; Zhang, P.; Pan, Y.; Li, M. A Robust Filter for TOA Based Indoor Localization in Mixed LOS/NLOS Environment. In Proceedings of the 2018 Ubiquitous Positioning, Indoor Navigation and Location-Based Services (UPINLBS), Wuhan, China, 22–23 March 2018; pp. 1–9. [Google Scholar]
  23. Guo, G.; Chen, R.; Ye, F.; Chen, L.; Pan, Y.; Liu, M.; Cao, Z. A Pose Awareness Solution for Estimating Pedestrian Walking Speed. Remote Sens. 2019, 11, 55. [Google Scholar] [CrossRef] [Green Version]
  24. Liu, J.; Chen, R.; Pei, L.; Chen, W.; Tenhunen, T.; Kuusniemi, H.; Kröger, T.; Chen, Y. Accelerometer assisted robust wireless signal positioning based on a hidden Markov model. In Proceedings of the IEEE/ION Position, Location and Navigation Symposium, Indian Wells, CA, USA, 4–6 May 2010; pp. 488–497. [Google Scholar]
  25. Li, Z.; Liu, J.; Yang, F.; Niu, X.; Li, L.; Wang, Z.; Chen, R. A Bayesian Density Model Based Radio Signal Fingerprinting Positioning Method for Enhanced Usability. Sensors 2018, 18, 4063. [Google Scholar] [CrossRef] [PubMed] [Green Version]
  26. Yang, F.; Xiong, J.; Liu, J.; Wang, C.; Chen, R. A Pairwise SSD Fingerprinting Method of Smartphone Indoor Localization for Enhanced Usability. Remote Sens. 2019, 11, 566. [Google Scholar] [CrossRef] [Green Version]
  27. Bahl, P.; Padmanabhan, V.N. RADAR: An in-building RF-based user location and tracking system. In Proceedings of the IEEE INFOCOM 2000, Conference on Computer Communications. Nineteenth Annual Joint Conference of the IEEE Computer and Communications Societies (Cat. No.00CH37064), Tel Aviv, Israel, 26–30 March 2000; pp. 775–784. [Google Scholar]
  28. Wang, B.; Gan, X.; Liu, X.; Yu, B.; Jia, R.; Huang, L.; Jia, H. A Novel Weighted KNN Algorithm Based on RSS Similarity and Position Distance for Wi-Fi Fingerprint Positioning. IEEE Access 2020, 8, 30591–30602. [Google Scholar] [CrossRef]
  29. Weixing, X.; Xianghong, H.; Qingquan, L.; Kegen, Y.; Weining, Q.; Baoding, Z.; Kai, C. A New Weighted Algorithm Based on the Uneven Spatial Resolution of RSSI for Indoor Localization. IEEE Access 2018, 6, 26588–26595. [Google Scholar]
  30. Jingxue, B.; Yunjia, W.; Xin, L.; Hongxia, Q.; Hongji, C.; Shenglei, X. An Adaptive Weighted KNN Positioning Method Based on Omnidirectional Fingerprint Database and Twice Affinity Propagation Clustering. Sensors 2018, 18, 2502. [Google Scholar]
  31. Xuming, F.; Zonghua, J.; Lei, N.; Lijun, C. Optimal weighted K-nearest neighbour algorithm for wireless sensor network fingerprint localisation in noisy environment. IET Commun. 2018, 12, 1171–1177. [Google Scholar]
  32. Jianwei, N.; Banghui, L.; Long, C.; Yu, G.; Lei, S. ZiLoc: Energy efficient WiFi fingerprint-based localization with low-power radio. In Proceedings of the 2013 IEEE Wireless Communications and Networking Conference (WCNC), Shanghai, China, 7–10 April 2013; pp. 4558–4563. [Google Scholar]
  33. Brunato, M.; Battiti, R. Statistical learning theory for location fingerprinting in wireless LANs. Comput. Netw. 2005, 47, 825–845. [Google Scholar] [CrossRef] [Green Version]
  34. Hu, X.; Shang, J.; Gu, F.; Han, Q. Improving Wi-Fi Indoor Positioning via AP Sets Similarity and Semi-Supervised Affinity Propagation Clustering. Int. J. Distrib. Sens. Netw. 2015, 2015, 1–11. [Google Scholar] [CrossRef]
  35. Li, D.; Zhang, B.; Yao, Z.; Li, C. A feature scaling based k-nearest neighbor algorithm for indoor positioning system. In Proceedings of the 2014 IEEE Global Communications Conference, Austin, TX, USA, 8–12 December 2014; pp. 436–441. [Google Scholar]
  36. Wang, B.; Liu, X.; Yu, B.; Jia, R.; Gan, X. An Improved WiFi Positioning Method Based on Fingerprint Clustering and Signal Weighted Euclidean Distance. Sensors 2019, 19, 2300. [Google Scholar] [CrossRef] [PubMed] [Green Version]
  37. Kushki, A.; Plataniotis, K.N.; Venetsanopoulos, A.N. Kernel-Based Positioning in Wireless Local Area Networks. IEEE Trans. Mob. Comput. 2007, 6, 689–705. [Google Scholar] [CrossRef] [Green Version]
  38. Yu, F.; Jiang, M.H.; Liang, J.; Qin, X.; Hu, M.; Peng, T.; Hu, X.R. An Indoor Localization of WiFi Based on Support Vector Machines. Adv. Mater. Res. 2014, 926–930, 2438–2441. [Google Scholar] [CrossRef]
  39. Xu, C.; Jia, Z.; Chen, P.; Wang, B. CSI-based autoencoder classification for Wi-Fi indoor localization. In Proceedings of the 2016 Chinese Control and Decision Conference (CCDC), Yinchuan, China, 28–30 May 2016; pp. 6523–6528. [Google Scholar]
  40. Khatab, Z.E.; Hajihoseini, A.; Ghorashi, S.A. A Fingerprint Method for Indoor Localization Using Autoencoder Based Deep Extreme Learning Machine. IEEE Sens. Lett. 2018, 2, 1–4. [Google Scholar] [CrossRef]
  41. Wang, R.; Li, Z.; Luo, H.; Zhao, F.; Wang, Q. A Robust Wi-Fi Fingerprint Positioning Algorithm Using Stacked Denoising Autoencoder and Multi-Layer Perceptron. Remote Sens. 2019, 11, 1293. [Google Scholar] [CrossRef] [Green Version]
  42. Sinha, R.S.; Lee, S.M.; Rim, M.; Hwang, S.H. Data Augmentation Schemes for Deep Learning in an Indoor Positioning Application. Electronics 2019, 8, 554. [Google Scholar] [CrossRef] [Green Version]
  43. Chen, Z.; Zou, H.; Yang, J.F.; Jiang, H.; Xie, L. WiFi Fingerprinting Indoor Localization Using Local Feature-Based Deep LSTM. IEEE Syst. J. 2020, 14, 3001–3010. [Google Scholar] [CrossRef]
  44. Gu, Y.; Chen, Y.; Liu, J.; Jiang, X. Semi-supervised deep extreme learning machine for Wi-Fi based localization. Neurocomputing 2015, 166, 282–293. [Google Scholar] [CrossRef]
  45. Zhang, W.; Liu, K.; Zhang, W.; Zhang, Y.; Gu, J. Deep Neural Networks for wireless localization in indoor and outdoor environments. Neurocomputing 2016, 194, 279–287. [Google Scholar] [CrossRef]
  46. Liu, G.; Qian, Z.; Wang, X. An Indoor WLAN Location Algorithm Based on Fingerprint Database Processing. Int. J. Pattern Recognit. Artif. Intell. 2019, 34, 1–18. [Google Scholar] [CrossRef]
  47. Rizk, H.; Torki, M.; Youssef, M. CellinDeep: Robust and Accurate Cellular-based Indoor Localization via Deep Learning. Ieee Sens. J. 2018, 19, 2305–2312. [Google Scholar] [CrossRef]
  48. Chen, Y.; Liu, W.; Zhao, H.; Cao, S.; Fu, S.; Jiang, D. Bisecting k-means based fingerprint indoor localization. Wirel. Netw. 2020, 1–10. [Google Scholar] [CrossRef]
  49. Liu, J.; Chen, R.; Pei, L.; Guinness, R.; Kuusniemi, H. A Hybrid Smartphone Indoor Positioning Solution for Mobile LBS. Sensors 2012, 12, 17208–17233. [Google Scholar] [CrossRef] [PubMed]
  50. Li, Z.; Zhao, L.; Qin, C.; Wang, Y. WiFi/PDR integrated navigation with robustly constrained Kalman filter. Meas. Sci. Technol. 2020, 31, 084002. [Google Scholar] [CrossRef]
  51. Hu, Y.; Liao, X.; Lu, Q.; Xu, S.; Zhu, W. A segment-based fusion algorithm of WiFi fingerprinting and pedestrian dead reckoning. In Proceedings of the 2016 IEEE/CIC International Conference on Communications in China (ICCC), Chengdu, China, 27–29 July 2016; pp. 1–6. [Google Scholar]
  52. Guoliang, C.; Xiaolin, M.; Yunjia, W.; Yanzhe, Z.; Peng, T.; Huachao, Y. Integrated WiFi/PDR/Smartphone Using an Unscented Kalman Filter Algorithm for 3D Indoor Localization. Sensors 2015, 15, 24595–24614. [Google Scholar]
  53. Jian, C.; Gang, O.; Ao, P.; Lingxiang, Z.; Jianghong, S. An INS/WiFi Indoor Localization System Based on the Weighted Least Squares. Sensors 2018, 18, 1458. [Google Scholar]
  54. Li, Y.; Zhuang, Y.; Zhang, P.; Lan, H.; Niu, X.; El-Sheimy, N. An improved inertial/wifi/magnetic fusion structure for indoor navigation. Inf. Fusion 2017, 34, 101–119. [Google Scholar] [CrossRef]
  55. Zhou, N.-X.; Fan, X.-Y.; Xia, P.-C.; Zhou, F. A Sliding Window Fusion Location Algorithm Based on WI-FI/PDR. In Proceedings of the Communications, Signal Processing, and Systems, Singapore, Singapore, 20–22 July 2019; pp. 2608–2615. [Google Scholar]
  56. Deng, Z.A.; Wang, G.; Qin, D.; Na, Z.; Yang, C.; Chen, J. Continuous Indoor Positioning Fusing WiFi, Smartphone Sensors and Landmarks. Sensors 2016, 16, 1427. [Google Scholar] [CrossRef] [Green Version]
  57. Ke, M.; Xu, Y.; Anpalagan, A.; Liu, D.; Zhang, Y. Distributed TOA-Based Positioning in Wireless Sensor Networks: A Potential Game Approach. IEEE Commun. Lett. 2018, 22, 316–319. [Google Scholar] [CrossRef]
  58. Napoleon, S.A.; Omar, A.S.; Elramly, S.H.; Khamis, S.A.; Nasr, M.E. C5. Time difference of arrival by IEEE 802.11a, g based on practical estimation. In Proceedings of the 2012 29th National Radio Science Conference (NRSC), Cairo, Egypt, 10–12 April 2012; pp. 185–190. [Google Scholar]
  59. Chuang, S.; Wu, W.; Liu, Y. High-Resolution AoA Estimation for Hybrid Antenna Arrays. IEEE Trans. On Antennas Propag. 2015, 63, 2955–2968. [Google Scholar] [CrossRef]
  60. Fang, S.; Cheng, Y.; Chien, Y. Exploiting Sensed Radio Strength and Precipitation for Improved Distance Estimation. IEEE Sens. J. 2018, 18, 6863–6873. [Google Scholar] [CrossRef]
  61. Mazarbhuiya, F.A.; AlZahrani, M.Y.; Georgieva, L. Anomaly Detection Using Agglomerative Hierarchical Clustering Algorithm. In Proceedings of the Information Science and Applications 2018, Singapore, Singapore, 25–27 June 2018; pp. 475–484. [Google Scholar]
  62. Alvarenga, S.C.D.; Barbon, S.; Miani, R.S.; Cukier, M.; Zarpelo, B.B. Process mining and hierarchical clustering to help intrusion alert visualization. Comput. Secur. 2017, 73, 474–491. [Google Scholar] [CrossRef]
  63. Chambodut, A. Geomagnetic Field, IGRF. In Encyclopedia of Solid Earth Geophysics; Gupta, H.K., Ed.; Springer: Dordrecht, The Netherlands, 2011; pp. 379–380. [Google Scholar]
  64. Chambodut, A. Geomagnetic Field, IGRF. Encycl. Earth Sci. 2015, 379–380. [Google Scholar]
  65. Cui, Y.; Zhang, Y.; Huang, Y.; Wang, Z.; Fu, H. Novel WiFi/MEMS integrated indoor navigation system based on two-stage EKF. Micromachines 2019, 10, 198. [Google Scholar] [CrossRef] [Green Version]
  66. Evennou, F.; Franois, M. Advanced Integration of WiFi and Inertial Navigation Systems for Indoor Mobile Positioning. Eurasip J. Adv. Signal Process. 2006, 2006, 086706. [Google Scholar] [CrossRef] [Green Version]
  67. Yuanxi, Y. Chinese geodetic coordinate system 2000. Chin. Sci. Bull. 2009, 2714–2721. [Google Scholar]
  68. Hess, W.; Kohler, D.; Rapp, H.; Andor, D. Real-time loop closure in 2D LIDAR SLAM. In Proceedings of the 2016 IEEE International Conference on Robotics and Automation (ICRA), Stockholm, Sweden, 16–21 May 2016; pp. 1271–1278. [Google Scholar]
  69. Youkun, W.; Zhangrong, Y.U.; Junhua, Z.; Shengchun, S.H.I. Precision analysis and control method of inverse calculation of plane four parameter. Bull. Surv. Mapp. 2020, 10, 63–67. [Google Scholar]
Figure 1. Experiment results in the static state. (a) The label next to the WiFi represents the received number and error, respectively, the blue circle represents a circle with a center at the true coordinate and a radius of 2 m; (b) The error histogram of WiFi.
Remotesensing 13 01106 g001
Figure 2. PDR results in the walking state. (a) The trajectory of PDR and SLAM (the truth value); (b) The error difference of PDR.
Remotesensing 13 01106 g002
Figure 3. WiFi results in the walking state. (a) The error of WiFi; (b) The error histogram of WiFi.
Remotesensing 13 01106 g003
Figure 4. Coupled PDR and WiFi for any two adjacent moments. The left and right red rectangle represent the coordinate ( x t 1 pre , y t 1 pre ) and ( x t post , y t post ) in Equation (9), respectively, the circle labelled with W j L i represents the received WiFi with the error level L i at j , the upward line segment labelled with V j L i represents the coupled vector by Equation (9), the green segment represents the time update of the scheme via PDR.
Remotesensing 13 01106 g004
Figure 5. The architecture of the proposed hybrid fusion scheme.
Remotesensing 13 01106 g005
Figure 6. KF Algorithm.
Remotesensing 13 01106 g006
Figure 7. The architecture of the employed fingerprinting-based WiFi algorithm.
Remotesensing 13 01106 g007
Figure 8. Experimental environment deployment.
Remotesensing 13 01106 g008
Figure 9. Two employed devices.
Remotesensing 13 01106 g009
Figure 10. CDF for the handheld SLAM device.
Remotesensing 13 01106 g010
Figure 11. CDF for the evaluated 9 control points. (a) P1; (b) P2; (c) P4; (d) P5; (e) P6; (f) P7; (g) P8; (h) P10; (i) P11.
Remotesensing 13 01106 g011
Figure 12. CDF of positioning error. (a) CDF of fusion, PDR and WiFi; (b) the performance of WiFi-Chain.
Remotesensing 13 01106 g012
Figure 13. Histogram of WiFi-Chain-WiFi, All-WiFi, and No-WiFi-Chain-WiFi. (a) WiFi-Chain-WiFi; (b) All-WiFi; (c) No-WiFi-Chain-WiFi.
Remotesensing 13 01106 g013
Figure 14. CDF for the evaluated 3 control points during the third experiment. (a) P3; (b) P9; (c) P12.
Remotesensing 13 01106 g014
Table 1. Cases and Complementary Characteristics.
Complementary
Characteristics
CaseTwo Coupled Vectors
Case1 [ V t L 0 , V t 1 L 0 ]
Case2 [ V t L 1 , V t 1 L 1 ]
Case3 [ V t L 0 , V t 1 L 1 ] [ V t L 1 , V t 1 L 0 ]
Table 2. Various statistical results for the evaluated 9 control points.
Control Point & StrategyError (m)
RMS95%68%MeanMaximumMinimum
P1AGNES0.8770.6% *1.0286.1% *0.8945.1% *0.8761.7% *1.0985.1% *0.792.5% *
NO-AGNES2.967.341.622.277.340.81
P2AGNES0.5877.7% *0.6385.1% *0.6363.6% *0.5772.6% *0.6789.6% *0.3642.9% *
NO-AGNES2.64.231.732.086.470.63
P4AGNES1.1451.1% *2.0557.1% *0.6767.3% *0.9341.9% *2.0585.2% *0.4425.4% *
NO-AGNES2.334.782.051.613.890.59
P5AGNES0.5060.6% *0.5871.8% *0.5348.0% *0.4958.8% *0.6070.9% *0.3661.7% *
NO-AGNES1.272.061.021.192.060.94
P6AGNES0.4576.2% *0.6775.5% *0.5671.1% *0.4069.0% *0.8593.1% *0.210.0% *
NO-AGNES1.892.741.941.3312.320.21
P7AGNES0.4183.9% *0.5988.8% *0.5261.5% *0.3878.4% *0.6194.5% *0.1972.5% *
NO-AGNES2.545.271.351.7611.060.69
P8AGNES0.3583.0% *0.4991.2% *0.3478.5% *0.3475.2% *0.7287.0% *0.2640.9% *
NO-AGNES2.065.551.581.375.550.44
P10AGNES0.2283.5% *0.2888.5% *0.2466.7% *0.2180.6% *0.3585.7% *0.0786.5% *
NO-AGNES1.332.440.721.082.440.52
P11AGNES0.9020.4% *0.9217.1% *0.9217.1% *0.9015.1% *0.9268.8% *0.5738.0% *
NO-AGNES1.131.111.111.062.950.92
* The degree of performance improvement of AGNES compared to NO-AGNES.
Table 3. Various statistical results.
AlgorithmError (m)
RMS95%68%MeanMaximumMinimum
Fusion
+WiFi-AGNES+WiFi-Chain
1.432.641.561.193.990.02
Fusion+WiFi-AGNES1.893.911.621.447.470.04
Fusion+WiFi-Chain1.693.271.751.424.300.02
Fusion2.084.121.931.677.470.04
PDR18.8330.1022.3116.8732.370.25
All-WiFi2.976.972.252.109.440.02
WiFi-Chain-WiFi1.643.641.821.234.20.02
No-WiFi-Chain-WiFi4.967.795.194.399.440.04
Publisher’s Note: MDPI stays neutral with regard to jurisdictional claims in published maps and institutional affiliations.

