Abstract
Since the late 1990s, extensive outbreaks of native bark beetles (Curculionidae: Scolytinae) have affected coniferous forests throughout Europe and North America, driving changes in carbon storage, wildlife habitat, nutrient cycling, and water resource provisioning. Remote sensing is a crucial tool for quantifying the effects of these disturbances across broad landscapes. In particular, Landsat time series (LTS) are increasingly used to characterize outbreak dynamics, including the presence and severity of bark beetle-caused tree mortality, though broad-scale LTS-based maps are rarely informed by detailed field validation. Here we used spatial and temporal information from LTS products, in combination with extensive field data and Random Forest (RF) models, to develop 30-m maps of the presence (i.e., any occurrence) and severity (i.e., cumulative percent basal area mortality) of beetle-caused tree mortality 1997–2019 in subalpine forests throughout the Southern Rocky Mountains, USA. Using resultant maps, we also quantified spatial patterns of cumulative tree mortality throughout the region, an important yet poorly understood concept in beetle-affected forests. RF models using LTS products to predict presence and severity performed well, with 80.3% correctly classified (Kappa = 0.61) and R2 = 0.68 (RMSE = 17.3), respectively. We found that ≥10,256 km2 of subalpine forest area (39.5% of the study area) was affected by bark beetles and 19.3% of the study area experienced ≥70% tree mortality over the twenty-three year period. Variograms indicated that severity was autocorrelated at scales < 250 km. Interestingly, cumulative patch-size distributions showed that areas with a near-total loss of the overstory canopy (i.e., ≥90% mortality) were relatively small (<0.24 km2) and isolated throughout the study area. Our findings help to inform an understanding of the variable effects of bark beetle outbreaks across complex forested regions and provide insight into patterns of disturbance legacies, landscape connectivity, and susceptibility to future disturbance.
1. Introduction
Native bark beetles (Curculionidae: Scolytinae) are key drivers of ecosystem structure and function in Earth’s temperate and boreal forests [1,2,3]. Bark beetles can cause extensive tree mortality through coordinated mass attacks, altering important ecosystem services such as carbon storage, wildlife habitat, nutrient cycling, and water resource provisioning [4,5,6]. For instance, in the western U.S., c. 3.8 × 10⁹ trees were killed by bark beetles since the late 1990s [7], nearly twice that killed by wildfire during the same period [8]. Yet despite the ubiquity of these insects and their importance for forest dynamics, characterizing even basic attributes such as the affected area and severity of effects remains challenging, particularly at relatively fine (c. 30 m) spatial grains and across broad extents. While the spatial patterns of ecological disturbances are known to influence vegetation dynamics and a wide range of ecosystem processes [9,10,11], the spatial patterns of bark beetle outbreaks have rarely been explored, particularly across regions with irruptions of multiple beetle species. Improved mapping efforts that combine detailed field data and remotely sensed products are critical to refining understanding of the extent, severity, and spatial patterns of outbreaks.
Most bark beetles are specialist herbivores that target only a single host-tree species or genus [12,13,14]. Typically, bark beetles persist at low population levels and attack damaged or weakened trees (i.e., endemic conditions); outbreaks are initiated by population irruptions that require abundant susceptible hosts as well as suitable climate conditions [3,15,16]. Beetles in the genera Dendroctonus and Dryocoetes, which are responsible for much of the recent tree mortality in U.S. Rocky Mountain forests, preferentially target denser stands with larger trees, higher stem density, and greater host-tree abundance [17,18,19,20]. Given a suitable landscape, outbreaks may be incited by warm temperatures and drought conditions which increase tree susceptibility to attack and enhance larval development and overwinter survival [20,21,22,23]. Further climate warming is expected to amplify bark beetle activity [24,25], but with the potential for negative feedbacks as beetle attacks and climatic limitations deplete suitable host trees [26,27,28]. Climate, tree species composition, and forest structure vary dynamically across mountainous regions, and these factors establish the template for spatially heterogeneous patterns of bark beetle outbreaks.
Remote sensing techniques are the most effective means of mapping insect-caused tree mortality across large areas [29,30]. One such approach is the US Forest Service Aerial Detection Survey (ADS), an airborne monitoring program in which trained observers manually identify areas with tree damage, defoliation, or mortality [31,32]. Though ADS data are widely used to monitor coarse-scale patterns of insect activity [7,33], locational error, uncertain locations of tree mortality within mapped perimeters, and temporal gaps in data acquisition limit their utility for detailed fine-grain mapping of bark beetle outbreaks. To address this need, a number of semi-automated remote sensing approaches have been used to quantify the presence and severity of bark beetle attack. Landsat imagery has emerged as the most widely used data for these purposes because of their extended temporal record and relatively fine spatial grain [29]. In particular, Landsat image time series (LTS), which combine data from successive time steps, are increasingly used to characterize the effects of bark beetles and defoliators [34,35,36]. Annual LTS products can be used to effectively quantify the progression of outbreaks [22,37]. Temporal segmentation or post-classification correction of LTS products can also reduce image irregularities in individual scenes and help to isolate the effects of specific mortality agents [35,36,38]. While past LTS-based approaches have proven effective for mapping bark beetle outbreaks, the use of multispectral ensembles [39], inclusion of spatial context surrounding individual pixels [40,41], and high-quality field validation have not been widely used in past studies, but are likely to improve mapping efforts.
To quantify the extent, severity, and spatial patterns of recent (c. 1997–2019) bark beetle outbreaks throughout the Southern Rocky Mountains, USA (SRM; EPA Level III Ecoregion 21; Figure 1), we used extensive field data, LTS-based mapping products, and Random Forest models to map bark beetle-caused tree mortality at a regional scale. We focused on subalpine forests in the SRM, where bark beetle-caused mortality has been the most severe and widespread [7,21,22]. Our specific objectives were to: (1) develop and evaluate models to predict the presence and severity of bark beetle-caused tree mortality from spectral characteristics, (2) use these models to create maps of beetle-caused mortality at a regional extent and 30-m resolution, and (3) quantify the spatial patterns of bark beetle attack. Our study advances prior research because of the inclusion of a robust field validation dataset (n = 239 plots), the focus on the cumulative effects of multiple bark beetle species rather than a single mortality agent, and the characterization of patch-size distributions and spatial autocorrelation of beetle-caused tree mortality across a broad, heterogeneous region.

Figure 1.
Study area and the locations of 239 field plots used to inform remotely sensed estimates of cumulative tree mortality due to bark beetle attack (1997–2019) in the Southern Rocky Mountains, USA. We focused specifically on subalpine forests dominated by Engelmann spruce, limber pine, lodgepole pine, and/or subalpine fir. Background shading (light grey [absent] to black [prevalent]) illustrates the abundance of these subalpine tree species [42].
2. Methods
2.1. Study Area, Bark Beetles, and Host Tree Species
This study focuses on the effects of tree-killing bark beetles in subalpine forests of the SRM, a mountainous area with complex topography (elevations 1450 to 4400 m) spanning 145,000 km2 in southern Wyoming, Colorado, and northern New Mexico, USA (Figure 1). The SRM has a temperate continental climate with warm summers (mean [range] July maximum temperature 24.1 °C [12.5 to 32.9]), cold winters (January minimum temperature −12.3 °C [−21.3 to −5.4]), and a bimodal distribution of precipitation (annual precipitation 625 mm [214 to 1875]), with peaks in March-May and July-August [43]. Forests cover 55% of the SRM [44] and subalpine forests lie at the highest forested elevations c. 2700–3600 m [45,46], making up 51% of the total forest area (40,000 km2) [47]. Common tree species in subalpine forests include Engelmann spruce (Picea engelmannii Parry ex Engelm.), lodgepole pine (Pinus contorta Dougl. ex. Loud.), quaking aspen (Populus tremuloides Michx.), subalpine fir (Abies lasiocarpa (Hook.) Nutt.), and five-needle pines (i.e., bristlecone pine–Pinus aristata Engelm., limber pine–Pinus flexilis James, and southwestern white pine–Pinus strobiformis Engelm.) [42], though composition varies throughout the region. In subalpine forests, the most important tree-killing bark beetles are the mountain pine beetle (MPB; Dendroctonus ponderosae Hopkins), spruce beetle (SB; Dendroctonus rufipennis (Kirby)), and western balsam bark beetle (WBBB; Dryocoetes confusus Swaine) (Table S1). The primary hosts for MPB include lodgepole pine and five-needle pines, Engelmann spruce is commonly attacked by SB, and subalpine fir is attacked by WBBB [13]. Other insects and pathogens have contributed to more limited tree mortality in the SRM (Table S1) and were not a focus of our analyses.
To restrict analyses to subalpine forests that may have been affected by bark beetles, we defined the study area using the following criteria: (1) within 500 m of ADS-mapped tree mortality attributed to bark beetles (subalpine tree species hosts only) from 1997 to 2019 [48], (2) forested areas in the 1992 National Land Cover Dataset (NLCD) [49] and any vegetation type in 2016 NLCD [44], (3) at least 1 m2 ha−1 combined basal area of the dominant subalpine conifer species [42], (4) having no recorded fires [50,51] or timber harvests [52,53] from 1996 to 2019, and (5) within US Forest Service boundaries, where records of timber harvest are most complete (Supplementary Materials). Following these restrictions, our final study area was 25,946 km2 at a 30-m grain size. While removing burned and harvested areas and restricting analyses to US Forest Service Lands excludes c. 30% of subalpine forests in the SRM that may have experienced bark beetle outbreaks, these restrictions were necessary to limit the influence of tree mortality due to other causes (Supplementary Materials).
2.2. Data Sources—Field Data and Image Interpretation
To inform remotely sensed estimates of the extent and severity of bark beetle attack throughout the study area, we compiled data from 239 field plots throughout the SRM (Figure 1 and Figure 2, Table S3). Field data were collected from 2010 to 2019 in previous studies of tree mortality, forest structure, and tree regeneration following bark beetle outbreaks in the subalpine zone [20,38,54,55,56,57,58]. Because all field plots had evidence of bark beetle presence (i.e., 0.7–99.7% basal area mortality), we also supplemented the 239 field plots with an equal number of ‘control’ points, in which we used interpretation of aerial imagery, Landsat image time series (LTS), and ancillary spatial data describing the locations of fire and timber harvest to identify forested sites with the absence of visible tree mortality from bark beetles or other causes from 1996 to 2019. Using field data, we quantified the severity of tree mortality within each plot as the percentage of pre-disturbance live basal area for all tree species killed c. 1990s–2010s. Because of incomplete records of the causal agents of tree mortality in a subset of field plots (Table S3), we included a small amount of mortality unrelated to bark beetles (e.g., competition, drought stress). However, where causes were identified, beetles were the primary tree mortality agent, driving >90% of total basal area mortality in plots with severe outbreaks [57,59]. Thus, we assumed that the majority of the tree mortality identified in the field plots and final maps could be attributed to bark beetles.

Figure 2.
Flowchart of image processing and statistical modeling steps involved in developing regional maps of the presence and severity of bark beetle attack in the SRM. Steps performed in Google Earth Engine [60] are represented with dashed boxes, and steps performed in the R environment [61] are represented with solid boxes. LandTrendr (Landsat-based detection of trends in disturbance and recovery) is a pixel-based temporal segmentation algorithm used to identify homogeneous periods of spectral increase, stability, and decline [62,63].
2.3. Data Sources—Landsat Time Series
We used LTS to quantify spectral changes indicative of tree mortality in subalpine forests throughout the SRM (Figure 2). First, we extracted and processed all Landsat Tier 1 Surface Reflectance scenes from 1996–2019 (i.e., the 1997–2019 study period and 1996 to capture initial conditions) using Google Earth Engine (GEE) [60]. These data included imagery from the Landsat 5 Thematic Mapper (TM), Landsat 7 Enhanced Thematic Mapper Plus (ETM+), and Landsat 8 Operation Land Imager (OLI); ETM+ images collected 2003–2019 were excluded to remove striping artifacts in final maps (Figure S2). To account for wavelength differences among sensors, OLI-derived images were harmonized to TM/ETM+ equivalents using coefficients from [64]. In each scene, we used the CFMask-derived quality assurance band to remove pixels obstructed by clouds, shadows, snow, and surface water [65]. We then developed annual image composites for the summer growing season (June 1–September 30) using the multi-dimensional median of all unmasked pixels [66]. From annual image composites, we extracted values from TM-equivalent bands 1–5, and 7, and calculated nine spectral indices sensitive to plant photosynthesis and foliar moisture content (Figure 2, Table 1). Because spectral indices from the winter season may help to isolate the signals of mortality and growth of evergreen conifers [67,68,69], we also developed annual composites of the Normalized Difference Vegetation Index (NDVI) from December 1focal yr to April 1focal yr+1 (Table 1; Supplementary Materials).

Table 1.
Description of individual spectral bands and indices used in developing Landsat time series. Note that all formulas and band numbers refer to Landsat TM (Thematic Mapper) equivalents.
To develop predictors of bark beetle activity from yearly time series of the selected spectral bands and indices, we used the GEE implementation of LandTrendr (Landsat-based detection of trends in disturbance and recovery), a temporal segmentation algorithm that partitions LTS into homogeneous periods of spectral increase, stability, and decline [62,63] (Figure 2). For each band and index, we used LandTrendr to identify spectral decline events (i.e., disturbance segments) from 1996 to 2019, and calculated the total magnitude of all declines, consistent with our focus on cumulative tree mortality throughout the study period. To limit the effects of tree mortality unrelated to bark beetles, we used a maximum slope filter following [36] to exclude spectral declines that occurred with a greater rate of change than is typical of bark beetle attack (Table S5). Because LandTrendr is a pixel-based algorithm that does not incorporate spatial context from the surrounding area, we developed three additional predictors from each band and index that incorporated neighborhood information (Figure 2). Specifically, we used Simple Non-Iterative Clustering [70] at three different spatial scales (5-, 10-, and 20-pixel spacing of seed locations) to perform an object-based smoothing of annual band/index values prior to constructing yearly time series and using LandTrendr (Figure S1). In total, we developed four LTS predictors from each of the 16 spectral bands and indices (for a total of 64 predictors), one using raw values from annual maps, and three using spatial smoothing at a range of scales prior to temporal segmentation using LandTrendr. For comparison with field data, we extracted values of each LTS predictor at each plot center location. Though the footprints of our field plots sometimes intersected multiple pixels, this approach maintains raw values in the LTS data.
2.4. Objectives 1 and 2—Predicting Presence and Severity of Bark Beetle-Caused Tree Mortality
We developed two Random Forest (RF) models to link field data to LTS predictors (Figure 2). The response variables in RF models were the presence (i.e., any tree mortality due to bark beetles) and severity of bark beetle-caused tree mortality (i.e., the percent of cumulative tree basal area loss c. 1990s to 2010s). While presence models are useful for identifying areas most likely to have been affected, severity models provide insight into the ranges of potential ecological effects. We used Variable Selection Using Random Forests (VSURF) [71] to identify a parsimonious subset of c. 10 LTS predictors for inclusion in each RF model and tested for multicollinearity using the ‘rfUtilities’ package [72]. With the VSURF-selected predictors, we fit final RF models using the ‘ranger’ package [73] and used 10-fold cross-validation in the ‘caret’ package [74] to optimize hyperparameters. To compare the relative influences of different bands and indices in final models, we calculated variable importance using the permutation-based mean decrease in accuracy statistic. Because RF regression can reduce predicted values toward the mean of the response, biasing predictions of extreme values [75,76], we corrected RF predictions of severity using the following equation:
where ŷunc and ŷc are the predicted pixel values at a given field plot, before and after bias correction, respectively. μrf and μobs are the means and σrf and σobs are the standard deviations of RF-predicted and observed pixel values across all field plots in 10-fold cross-validation (Supplementary Materials). Finally, we assessed the influences of potential confounding variables not included in RF models such as pre-outbreak forest density, data contributor, bark beetle species, and co-occurring outbreaks of defoliating insects (i.e., non-lethal defoliation of conifers), by comparing RF model residuals with field data. Following model fitting and evaluation, we used final RF models and LTS products to make predictive maps of the presence and severity of bark beetle attack at a 30-m grain size throughout the study area. All variable selection, model fitting, validation, and spatial predictions were performed in R v. 3.6.0 [61].
2.5. Objective 3—Quantifying Spatial Patterns of Beetle-Caused Tree Mortality
We used the newly developed maps of bark beetle presence and severity to quantify spatial patterns of bark beetle-induced tree mortality throughout the study area. To describe the spatial relationships of severity with distance, we created empirical variograms in the ‘gstat’ package [77] in R. For computational feasibility in variogram calculations, we used a sample of 100,000 individual pixels (mean [min] nearest neighbor distance = 301 [30] m). We used an omnidirectional variogram with a lag width of 150 m (a minimum of 12,096 point pairs in the smallest bin) and a maximum distance cutoff of 300 km (approximately 1/3 of the maximum diagonal of the bounding box) [78]. To characterize patch-size distributions of more severely affected forests, we calculated the cumulative proportion of total area with ≥50%, ≥60%, ≥70%, ≥80%, and ≥90% basal area mortality in patches of different sizes (using eight-neighbor connectivity).
2.6. Additional Information
Additional information regarding research methods is provided in the Supplementary Materials. Additionally, all field data, spatial data, statistical code, and model outputs are available through Dryad Digital Repository [79].
3. Results
3.1. Objective 1—Models of the Presence and Severity of Bark Beetle-Caused Tree Mortality
Using predictors derived from LTS, RF models were able to predict field-derived measures of the presence and severity of tree mortality due to bark beetle attack. Based on 10-fold cross-validation, the RF presence model had a classification accuracy of 80.3% and Cohen’s Kappa of 0.61; the RF severity model had an R2 value of 0.68 and a root-mean-squared-error (RMSE) of 17.3. LTS predictors in final models included shortwave infrared bands (TM-equivalent B5 and B7), spectral indices sensitive to foliar moisture (NBR, NDMI), Tasseled Cap indices (TCA, TCB, TCW), and winter NDVI (Figure 3). LTS variables without spatial segmentation were the highest-ranked predictors, though predictors that included spatial segmentation of annual maps were also retained in each RF model (Figure 3). Importantly, there were no substantial biases in RF predictions based on pre-outbreak forest density, data contributor, or dominant bark beetle species (Supplementary Materials). Non-lethal defoliation by other insect species led to modest overestimates of the severity of beetle-caused tree mortality (Supplementary Materials), but these effects were only notable at the highest defoliation intensities, and defoliation attributed to any agent (e.g., Choristoneura freemani Razowski, Malacosoma spp.) was present in just 15.5% of the study area [48]. Overall, RF presence and severity models appeared robust for use in predictions throughout the SRM.
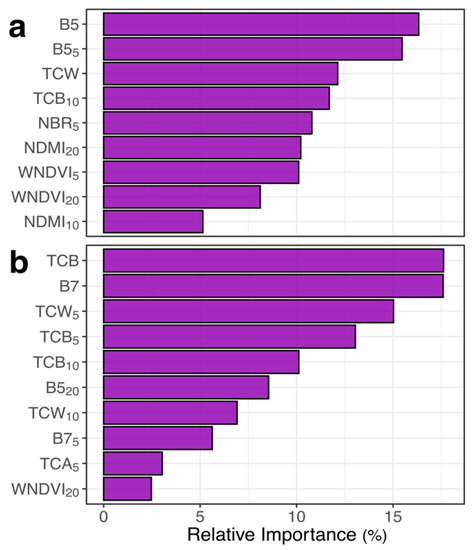
Figure 3.
Variable importance plots for final Random Forest models of (a) presence and (b) severity of bark beetle-induced tree mortality in the Southern Rocky Mountains, USA. Individual predictors, representing the magnitude of spectral decline from specific Landsat bands or spectral indices 1996–2019, are ordered based on their contribution to model performance. Definitions of each band or spectral index are provided in Table 1. Subscripts refer to the scale of spatial segmentation (i.e., 5-, 10-, and 20-pixel seed spacing in Simple Non-Iterative Clustering) of annual maps prior to temporal segmentation, where higher values refer to a coarser-scale segmentation with larger image objects. Variables without subscripts were not spatially segmented, and thus represent the total disturbance in a 30-m voxel without accounting for neighborhood context.
3.2. Objective 2—Mapping Beetle-Caused Tree Mortality across the SRM
Maps derived from RF models and LTS products identified coarse-scale patterns in bark beetle-caused tree mortality throughout the SRM (Figure 4a,c) but also provided insight into subregional and local variation in the effects of attack (Figure 4e–g). Beetle-caused tree mortality was most widespread in northern Colorado, southern Wyoming, and southwestern Colorado, and less common in central Colorado (Figure 4a,c). The map of bark beetle presence identified 39.5% (10,256 km2) of the total study area as affected by bark beetles (Figure 4a,c). However, detection of lower-severity attack was difficult using LTS. For example, omission error was just 9.6% in field plots with at least 40% basal area mortality, as compared to 70.6% omission for plots below 40% basal area mortality. Thus, many places classified as bark beetle absence may have low or moderate levels of tree mortality. The map of bark beetle severity indicates substantial variation in tree mortality throughout the SRM (Figure 4b,d). Lower levels (0–30%), moderate levels (30–70%), and higher levels of tree mortality (70–100%) were predicted across 29.6% (7674 km2), 51.1% (13,245 km2), and 19.3% (5017 km2) of the study area, respectively (Figure 4b,d). Therefore, low and moderate levels of tree mortality were widespread throughout the region, but higher levels were more limited, primarily constrained to forests affected by mountain pine beetle and spruce beetle in northern Colorado and southern Wyoming, and forests affected by spruce beetle in southwestern Colorado.
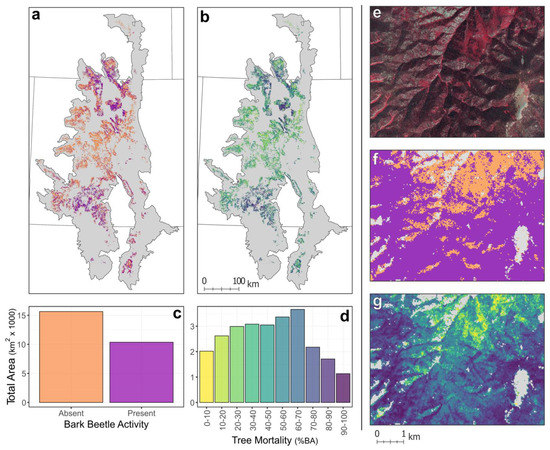
Figure 4.
Maps of the (a) presence and (b) severity (i.e., percent basal area loss) of bark beetle-caused tree mortality from 1997 to 2019 throughout the Southern Rocky Mountains, USA. Barplots showing the (c) total area of presence/absence and (d) total area with different outbreak severities summarize maps (a,b), respectively. (e–g) Inset maps give an example of an area that experienced a high-severity spruce beetle outbreak c. 2010 (37.75 N and 106.91 W). (e) A false-color composite of 1-m aerial photography from the National Agriculture Imagery Program from 2019 alongside maps of (f) presence and (g) severity in the same area, shows the ability of maps to identify within-stand variation in beetle-caused tree mortality. In (e) the false-color composite, red represents live vegetation while grey represents standing dead trees or a lack of vegetation.
3.3. Objective 3—Spatial Patterns of Beetle-Caused Tree Mortality
Spatial patterns of bark beetle-caused tree mortality throughout subalpine forests in the SRM reflect the complex and heterogeneous nature of these biotic disturbances (Figure 5). The severity of beetle-caused tree mortality was most strongly autocorrelated at lag distances of 0–5 km. However, 30-m pixels were increasingly dissimilar up to distances of 250 km, indicating spatial dependence in patterns of tree mortality across extremely broad extents (Figure 5a). Cumulative patch-size distributions varied markedly for forests exceeding different mortality thresholds in the SRM (Figure 5b). For example, while half of the area exceeding 50% tree mortality was contained in patches larger than 7.74 km2, half of the area exceeding 90% tree mortality was in patches smaller than 0.24 km2. Thus, areas exceeding 50% tree mortality were relatively large, widespread, and contiguous, but areas exceeding 90% mortality (i.e., with a near-total loss of the overstory tree canopy) tended to be small and disconnected throughout the region.
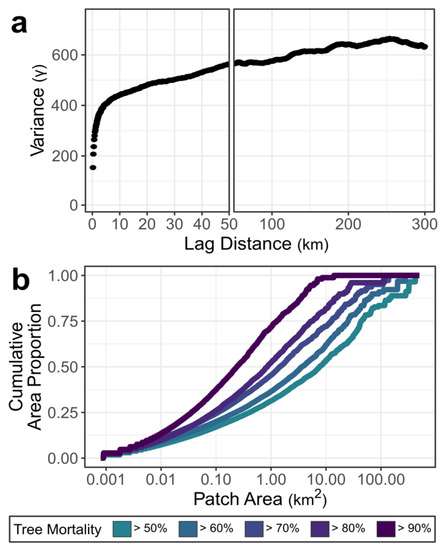
Figure 5.
Spatial patterns of bark beetle-caused tree mortality in the Southern Rocky Mountains, USA. (a) Sample variogram shows the relationship of tree mortality (i.e., percent basal area loss) among sites at distances from 0 to 300 km, where higher values on the y-axis indicate greater dissimilarity among sites at a given distance. Note that the x-axis in (a) is broken with different scales for greater interpretability from 0 to 50 km. (b) The cumulative patch-size distribution gives the proportion of the total area exceeding different mortality thresholds contained within patches of different sizes. In (b), a convex line shape indicates that the majority of the area is contained within small patches (e.g., ≥90% basal area loss), while a concave shape indicates that large patches are more common (e.g., ≥50% basal area loss).
4. Discussion
We integrated field data and remotely sensed products to develop seamless maps of the presence and severity of bark beetle outbreaks in the subalpine zone of the SRM, an area that has experienced extensive tree mortality since the late 1990s. The methods used in the present study provide a framework that can be extended to other regions by leveraging freely available spatial data (e.g., Landsat imagery, land cover maps, insect and disease surveys) and existing field datasets to quantify the effects of biotic disturbances on forest structure and landscape pattern. Herein, we noted four key findings: (1) the presence and severity of bark beetle outbreaks of multiple species could be reliably mapped across a complex region using remotely sensed data, (2) at least 10,256 km2 of subalpine forests (39.5% of the study area) experienced bark beetle-caused tree mortality from 1997 to 2019, (3) low to moderate levels of tree mortality (i.e., <70% basal area loss) were the most common in the SRM, while the most heavily affected areas were primarily in northern and southwestern Colorado, and (4) severity was autocorrelated at broad distances of up to 250 km, and areas with ≥ 90% tree mortality were relatively small (<0.24 km2) and isolated.
4.1. Implications for Remotely Sensed Detection of Tree Mortality
Previous studies using LTS have effectively quantified the presence and severity of bark beetle-caused tree mortality in a range of contexts, with reported accuracies ranging 75–90% (i.e., classification accuracy in presence/absence models) and R2 values ranging from 0.6 to 0.8 (i.e., observed vs. predicted values in severity models) [34,35,36,37,38]. Accuracies for our models were within the reported ranges of these prior studies (i.e., presence accuracy c. 80%; severity R2 c. 0.7), which is notable considering the large, heterogeneous study area and our focus on multiple insect species with differing spectral signals. Still, separating low-severity tree mortality from unaffected areas remains a difficult challenge when using LTS and other remotely sensed data [34,80,81]. For example, the timing and occurrence of spruce beetle outbreaks are difficult to identify when <35% of a Landsat pixel is affected [82]. Similarly, here, we found that field plots with <40% basal area mortality were erroneously omitted at much higher rates in presence maps. Our use of widespread field data in model fitting and validation also allowed us to evaluate potential confounding factors that are not typically assessed in broad-scale mapping efforts, including pre-outbreak stand density, bark beetle species, and co-occurring outbreaks of defoliators (Supplementary Materials). RF presence and severity models appeared robust to many of these factors, though we demonstrated that severe defoliation can lead to overestimates of beetle-caused tree mortality, aligning with prior work that has demonstrated confusion among insect agents [35]. Thus, non-lethal defoliation events should be considered in the future development of maps characterizing tree mortality.
This study also provides insight into methods used in future regional and national disturbance mapping efforts. We found that shortwave-infrared bands (i.e., B5 and B7) and spectral indices that incorporate them (e.g., NBR, NDMI, TCW) were particularly sensitive to tree mortality, in agreement with prior research of bark beetles and other agents [29,39,83,84,85,86]. We also found that incorporating spatial context in the development of LTS predictors led to modest improvements in final RF models. Though we used spatial segmentation of annual maps to reduce within-stand spectral noise in LTS, object-based approaches may also be helpful for change attribution because they can be used to quantify the size and shape of events [87,88]. Still, a combined spatial and temporal segmentation approach may be less effective in bark beetle-affected forests where tree mortality can unfold gradually over several years [37,82], than in forests affected by discrete events such as wildfire and timber harvest. Finally, NDVI during the winter period was retained as a predictor in each of the final RF models, as opposed to summer NDVI, which had low predictive ability. Thus, winter imagery is a valuable resource for mapping the mortality and regrowth of evergreen conifers in temperate forests [67,68,69].
4.2. Patterns of Bark Beetle-Caused Tree Mortality in the SRM
Recent bark beetle outbreaks have altered forest ecosystems in the SRM and similar ecosystems throughout the Northern Hemisphere [2,21,22,89,90]. By developing a mapping approach that links field data with LTS products, we found that over 10,000 km2 of subalpine forest area has been affected by three important bark beetle species—mountain pine beetle, spruce beetle, and western balsam bark beetle—in just two decades. Furthermore, the total affected area is probably much higher because of omission error in stands with <40% mortality. The total extent of this bark beetle-caused tree mortality is striking, yet regional maps of severity also illustrate notable variability in the effects of outbreaks throughout the region, likely attributed to past disturbances, tree species composition, stand structure, landscape connectivity, topography, and climate [21,22,27,91,92].
The spatial patterns of cumulative tree mortality reflect the heterogeneous nature of bark beetle attack throughout the SRM, as shaped by factors influencing outbreak initiation and spread. Using maps of the severity of bark beetle attack, we found that individual 30-m pixels were autocorrelated at broad distances of up to 250 km, but were most closely related at distances of 0–5 km. For individual beetle species, regional drivers such as drought and warm temperatures can lead to the synchronous development of outbreaks that extend far beyond the dispersal limits of individual populations [93,94], leading to correlated outbreak dynamics at distances of 80–900 km or more [21,22,95,96]. Yet, stand-scale variation in the effects of bark beetle outbreaks is also promoted by the abundance of host trees and landscape connectivity [21,89]. These same drivers, of broad-scale climate, and local-scale structure and composition, may also shape patterns of the cumulative effects of multiple bark beetle species in the SRM. Interestingly, we found that areas of ≥90% basal area mortality were relatively small and isolated throughout the region, with more than 50% of that area contained in patches smaller than 0.24 km2. In contrast, c. 50% of the forest area burned at high severity (>90–95% basal area mortality) in recent fires throughout the Northern Rocky Mountains, USA, was in patch sizes larger than 10 km2 [97], a difference of over an order of magnitude when compared with similarly severe patches caused by outbreaks presented here. In addition, even in the areas most severely affected by beetle-caused tree mortality, seedlings and smaller trees typically survive beetle outbreaks, resulting in a divergent post-disturbance response when compared to stand-replacing fires [57,98,99,100,101]. Fire and bark beetles, the two dominant disturbance types in subalpine forests throughout the SRM [102], have fundamentally different impacts on these important ecosystems.
The extensive bark beetle-caused tree mortality in forests throughout the SRM raises questions about trajectories of these ecosystems in a warmer future. Following bark beetle outbreak, abundant advance regeneration and new seedling establishment suggest that many forest stands have the potential to return to a similar structural state within a few decades [99,103,104]. Still, the composition and density of post-outbreak stands are highly variable due to outbreak severity, topography, weather, local microclimatic conditions, and prior disturbance by fire or blowdown that influence regeneration dynamics [57,101,105,106,107,108]. Many of these same factors can also cause differences in individual-level growth [57], leading to broad-scale variation in rates of post-disturbance recovery that may influence susceptibility to future disturbance [27,109]. While warming climate conditions have the potential to amplify bark beetle activity in the future, these effects will also be moderated by the depletion of suitable host trees, shifts in species composition, and variable rates of recovery across the landscape [26,28]. Maps of the effects of recent bark beetle outbreaks, such as those developed in the present study, can help to inform expectations of future forest dynamics in the SRM and similar regions, but future work is needed to tie this information to records of post-outbreak successional trajectories, tree growth, and the potential for subsequent disturbances.
4.3. Study Limitations
While the maps of the presence and severity of bark beetle outbreaks developed here provide a useful resource for understanding the effects of recent biotic disturbances throughout the SRM, important limitations of these data should also be recognized. Unlike active remote sensing products (e.g., lidar, radar) and other data capable of capturing three-dimensional forest structure (e.g., structure-from-motion), Landsat imagery characterizes the spectral reflectance of the visible overstory canopy and is limited in its ability to monitor subcanopy effects [110,111]. Thus, it is likely that some mortality of subcanopy trees has been omitted in our maps, though subcanopy trees are not commonly targeted by aggressive bark beetles [12,112] and represent just a small percentage of stand basal area. Restricting analyses to US Forest Service lands without recent fires or timber management activities was necessary to focus on the effects of bark beetle attack. However, these restrictions may have led to slight underestimates of patch sizes due to edge effects in spatial pattern analyses. While we infer that bark beetles were the primary mortality agent in regional maps, we could not fully exclude factors such as competition and drought stress, sudden aspen decline, white pine blister rust, and root disease that are important in parts of the SRM [58,113,114]. Forested landscapes with a diverse array of structural conditions and tree species compositions are likely to be influenced by a wide range of mortality agents, which complicates change attribution.
5. Conclusions
A warming climate is accelerating tree mortality due to bark beetle outbreaks, wildfire, and other drought-mediated forest disturbances. Because disturbances play an important role in the structure, composition, and spatial patterns of vegetation, an understanding of their effects is critical to understanding future trajectories of forest ecosystems. To this end, remote sensing and field inventories are two of the most important tools for understanding ecosystem dynamics at broad spatial scales. In the present study, we combined extensive field surveys of tree mortality in stands attacked by bark beetles c. 1997–2019 and LTS products to predict the presence and severity of bark beetle attack at a c. 30-m resolution throughout the SRM, USA. Bark beetles have driven extensive tree mortality in these ecosystems, but their effects were highly variable across the study area. Still, the legacies of recent bark beetle outbreaks may influence forest dynamics for decades to centuries in subalpine forests, with crucial implications for wildlife habitat, carbon budgets, and other important ecosystem services.
Supplementary Materials
The following are available online at https://www.mdpi.com/2072-4292/13/6/1089/s1: Additional descriptions of research methods, Figure S1: Example of image segmentation effects on annual maps, Figure S2: A comparison of Random Forest model results when including and excluding Landsat ETM+ imagery, Figure S3: Example of maximum slope thresholds for beetle-caused tree mortality, fire, and timber harvest, Figure S4: Observed vs. predicted values from the Random Forest model of severity with and without bias correction, Table S1: Summary of total mapped area from US Forest Service Aerial Detection Surveys from 1997 to 2019, Table S2: US Forest Service Aerial Detection Survey damage agent and host combinations used to restrict analyses, Table S3: Summary of field datasets, data contributor, and collection protocols, Table S4: Summary of forest structure variables and Random Forest model accuracies for the different field datasets, Table S5: Maximum slope thresholds used to exclude disturbances that occurred with a greater rate of change than beetle-caused tree mortality.
Author Contributions
Conceptualization, K.C.R. and S.J.H.; Methodology, K.C.R. and S.J.H.; Software, K.C.R.; Validation, K.C.R.; Formal Analysis, K.C.R.; Investigation, K.C.R., R.A.A., C.L.B., T.B.C., N.S.G., B.J.H., D.K., N.J.T., T.T.V., and S.J.H.; Resources, S.J.H.; Data Curation, K.C.R., R.A.A., T.B.C., N.S.G., B.J.H., D.K., T.T.V., and S.J.H.; Writing—Original Draft Preparation, K.C.R. and S.J.H.; Writing—Review & Editing, K.C.R., R.A.A., C.L.B., T.B.C., N.S.G., B.J.H., D.K., N.J.T., T.T.V., and S.J.H.; Visualization, K.C.R.; Supervision, K.C.R. and S.J.H.; Project Administration, K.C.R. and S.J.H.; Funding Acquisition, B.J.H., D.K., T.T.V., S.J.H. All authors have read and agreed to the published version of the manuscript.
Funding
This research was funded by National Science Foundation awards, 1262687, 1262691, 1634163, 1637686, and 1853520, National Aeronautics and Space Administration award NNX16AH58G, an NSF Graduate Research Fellowship, and a David H. Smith Conservation Research Fellowship.
Institutional Review Board Statement
Not applicable.
Informed Consent Statement
Not applicable.
Data Availability Statement
All field data, spatial data, statistical code, and model outputs are available through Dryad Digital Repository at https://doi.org/10.5061/dryad.1rn8pk0sn (accessed on 1 February 2021) [79].
Acknowledgments
Support for this research was also provided by the University of Wisconsin–Madison, Office of the Vice Chancellor for Research and Graduate Education with funding from the Wisconsin Alumni Research Foundation. The authors would like to thank the four anonymous reviewers for helpful feedback that led to improvements of this manuscript.
Conflicts of Interest
The authors declare no conflict of interest.
References
- Sommerfeld, A.; Senf, C.; Buma, B.; D’Amato, A.W.; Després, T.; Díaz-Hormazábal, I.; Fraver, S.; Frelich, L.E.; Gutiérrez, Á.G.; Hart, S.J.; et al. Patterns and drivers of recent disturbances across the temperate forest biome. Nat. Commun. 2018, 9, 4355. [Google Scholar] [CrossRef]
- Biedermann, P.H.W.; Müller, J.; Grégoire, J.C.; Gruppe, A.; Hagge, J.; Hammerbacher, A.; Hofstetter, R.W.; Kandasamy, D.; Kolarik, M.; Kostovcik, M.; et al. Bark beetle population dynamics in the Anthropocene: Challenges and solutions. Trends Ecol. Evol. 2019, 34, 914–924. [Google Scholar] [CrossRef] [PubMed]
- Raffa, K.F.; Aukema, B.H.; Bentz, B.J.; Carroll, A.L.; Hicke, J.A.; Turner, M.G.; Romme, W.H. Cross-scale drivers of natural disturbances prone to anthropogenic amplification: The dynamics of bark beetle eruptions. Bioscience 2008, 58, 501. [Google Scholar] [CrossRef]
- Morris, J.L.; Cottrell, S.; Fettig, C.J.; DeRose, R.J.; Mattor, K.M.; Carter, V.A.; Clear, J.; Clement, J.; Hansen, W.D.; Hicke, J.A.; et al. Bark beetles as agents of change in social–ecological systems. Front. Ecol. Environ. 2018, 16, S34–S43. [Google Scholar] [CrossRef]
- Thom, D.; Seidl, R. Natural disturbance impacts on ecosystem services and biodiversity in temperate and boreal forests. Biol. Rev. Camb. Philos. Soc. 2016, 91, 760–781. [Google Scholar] [CrossRef] [PubMed]
- Edburg, S.L.; Hicke, J.A.; Brooks, P.D.; Pendall, E.G.; Ewers, B.E.; Norton, U.; Gochis, D.; Gutmann, E.D.; Meddens, A.J.H. Cascading impacts of bark beetle-caused tree mortality on coupled biogeophysical and biogeochemical processes. Front. Ecol. Environ. 2012, 10, 416–424. [Google Scholar] [CrossRef]
- Hicke, J.A.; Xu, B.; Meddens, A.J.H.; Egan, J.M. Characterizing recent bark beetle-caused tree mortality in the western United States from aerial surveys. For. Ecol. Manag. 2020, 475, 118402. [Google Scholar] [CrossRef]
- Berner, L.T.; Law, B.E.; Meddens, A.J.H.; Hicke, J.A. Tree mortality from fires, bark beetles, and timber harvest during a hot and dry decade in the western United States (2003–2012). Environ. Res. Lett. 2017, 12, 065005. [Google Scholar] [CrossRef]
- Levin, S.A. The problem of pattern and scale in ecology. Ecology 1992, 73, 1943–1967. [Google Scholar] [CrossRef]
- Watt, A.S. Pattern and process in the plant community. J. Ecol. 1947, 35, 1–22. [Google Scholar] [CrossRef]
- Turner, M.G. Disturbance and landscape dynamics in a changing world. Ecology 2010, 91, 2833–2849. [Google Scholar] [CrossRef]
- Safranyik, L.; Carroll, A.L. The biology and epidemiology of the mountain pine beetle in lodgepole pine forests. In The Mountain Pine Beetle: A Synthesis of Biology, Management, and Impacts on Lodgepole Pine; Safranyik, L., Wilson, W.R., Eds.; Natural Resources Canada, Canadian Forest Service, Pacific Forestry Centre: Victoria, BC, Canada, 2006; pp. 3–66. [Google Scholar]
- Bentz, B.J.; Logan, J.; MacMahon, J.; Allen, C.D.; Ayres, M.; Berg, E.; Carroll, A.L.; Hansen, M.C.; Hicke, J.A.; Joyce, L.; et al. Bark beetle outbreaks in western North America: Causes and consequences. In Proceedings of the Bark Beetle Symposium; University of Utah Press: Snowbird, UT, USA, 2009. [Google Scholar]
- Jenkins, M.J.; Hebertson, E.G.; Munson, A.S. Spruce beetle biology, ecology and management in the Rocky Mountains: An addendum to Spruce Beetle in the Rockies. Forests 2014, 5, 21–71. [Google Scholar] [CrossRef]
- Weed, A.S.; Ayres, M.P.; Hicke, J.A. Consequences of climate change for biotic disturbances in North American forests. Ecol. Monogr. 2013, 83, 441–470. [Google Scholar] [CrossRef]
- Koontz, M.J.; Latimer, A.M.; Mortenson, L.A.; Fettig, C.J.; North, M.P. Cross-scale interaction of host tree size and climatic water deficit governs bark beetle-induced tree mortality. Nat. Commun. 2021, 12, 129. [Google Scholar] [CrossRef]
- Buonanduci, M.S.; Morris, J.E.; Agne, M.C.; Harvey, B.J. Neighborhood context mediates probability of host tree mortality in a severe bark beetle outbreak. Ecosphere 2020, 11, e03236. [Google Scholar] [CrossRef]
- Negrón, J.F. Within-stand distribution of tree mortality caused by mountain pine beetle, Dendroctonus ponderosae Hopkins. Insects 2020, 11, 112. [Google Scholar] [CrossRef] [PubMed]
- Hart, S.J.; Veblen, T.T.; Kulakowski, D. Do tree and stand-level attributes determine susceptibility of spruce-fir forests to spruce beetle outbreaks in the early 21st century? For. Ecol. Manag. 2014, 318, 44–53. [Google Scholar] [CrossRef]
- Harvey, B.J.; Andrus, R.A.; Battaglia, M.A.; Negrón, J.F.; Orrego, A.; Veblen, T.T. Droughty times in mesic places: Factors associated with forest mortality vary by scale in a temperate subalpine region. Ecosphere 2021, 12, 3318. [Google Scholar] [CrossRef]
- Chapman, T.B.; Veblen, T.T.; Schoennagel, T. Spatiotemporal patterns of mountain pine beetle activity in the Southern Rocky Mountains. Ecology 2012, 93, 2175–2185. [Google Scholar] [CrossRef]
- Kolb, T.E.; Ayres, M.P.; Stewart, J.E. Observed and anticipated impacts of drought on forest insects and diseases in the United States. For. Ecol. Manag. 2016, 380, 321–334. [Google Scholar] [CrossRef]
- Hart, S.J.; Veblen, T.T.; Schneider, D.; Molotch, N.P. Summer and winter drought drive the initiation and spread of spruce beetle outbreak. Ecology 2017, 98, 2698–2707. [Google Scholar] [CrossRef]
- Bentz, B.J.; Régnière, J.; Fettig, C.J.; Hansen, E.M.; Hayes, J.L.; Hicke, J.A.; Kelsey, R.G.; Negrón, J.F.; Seybold, S.J. Climate change and bark beetles of the western United States and Canada: Direct and indirect effects. Bioscience 2010, 60, 602–613. [Google Scholar] [CrossRef]
- DeRose, R.J.; Bentz, B.J.; Long, J.N.; Shaw, J.D. Effect of increasing temperatures on the distribution of spruce beetle in Engelmann spruce forests of the Interior West, USA. For. Ecol. Manag. 2013, 308, 198–206. [Google Scholar] [CrossRef]
- Temperli, C.; Veblen, T.T.; Hart, S.J.; Kulakowski, D.; Tepley, A.J. Interactions among spruce beetle disturbance, climate change and forest dynamics captured by a forest landscape model. Ecosphere 2015, 6, 1–20. [Google Scholar] [CrossRef]
- Hart, S.J.; Veblen, T.T.; Mietkiewicz, N.; Kulakowski, D. Negative feedbacks on bark beetle outbreaks: Widespread and severe spruce beetle infestation restricts subsequent infestation. PLoS ONE 2015, 10, e0127975. [Google Scholar] [CrossRef]
- Foster, A.C.; Shuman, J.K.; Shugart, H.H.; Negron, J. Modeling the interactive effects of spruce beetle infestation and climate on subalpine vegetation. Ecosphere 2018, 9, e02437. [Google Scholar] [CrossRef]
- Senf, C.; Seidl, R.; Hostert, P. Remote sensing of forest insect disturbances: Current state and future directions. Int. J. Appl. Earth Obs. Geoinf. 2017, 60, 49–60. [Google Scholar] [CrossRef]
- Trumbore, S.; Brando, P.; Hartmann, H. Forest health and global change. Science (80-) 2015, 349, 814–818. [Google Scholar] [CrossRef] [PubMed]
- Johnson, E.W.; Wittwer, D. Aerial detection surveys in the United States. Aust. For. 2008, 71, 212–215. [Google Scholar] [CrossRef]
- Coleman, T.W.; Graves, A.D.; Heath, Z.; Flowers, R.W.; Hanavan, R.P.; Cluck, D.R.; Ryerson, D. Accuracy of aerial detection surveys for mapping insect and disease disturbances in the United States. For. Ecol. Manag. 2018, 430, 321–336. [Google Scholar] [CrossRef]
- Meddens, A.J.H.; Hicke, J.A.; Ferguson, C.A. Spatiotemporal patterns of observed bark beetle-caused tree mortality in British Columbia and the western United States. Ecol. Appl. 2012, 22, 1876–1891. [Google Scholar] [CrossRef]
- Bright, B.C.; Hudak, A.T.; Meddens, A.J.H.; Egan, J.M.; Jorgensen, C.L. Mapping multiple insect outbreaks across large regions annually using Landsat time series data. Remote Sens. 2020, 12, 1655. [Google Scholar] [CrossRef]
- Senf, C.; Pflugmacher, D.; Wulder, M.A.; Hostert, P. Characterizing spectral-temporal patterns of defoliator and bark beetle disturbances using Landsat time series. Remote Sens. Environ. 2015, 170, 166–177. [Google Scholar] [CrossRef]
- Meigs, G.W.; Kennedy, R.E.; Gray, A.N.; Gregory, M.J. Spatiotemporal dynamics of recent mountain pine beetle and western spruce budworm outbreaks across the Pacific Northwest Region, USA. For. Ecol. Manag. 2015, 339, 71–86. [Google Scholar] [CrossRef]
- Meddens, A.J.H.; Hicke, J.A. Spatial and temporal patterns of Landsat-based detection of tree mortality caused by a mountain pine beetle outbreak in Colorado, USA. For. Ecol. Manag. 2014, 322, 78–88. [Google Scholar] [CrossRef]
- Hart, S.J.; Veblen, T.T. Detection of spruce beetle-induced tree mortality using High- and Medium-resolution Remotely Sensed Imagery. Remote Sens. Environ. 2015, 168, 134–145. [Google Scholar] [CrossRef]
- Cohen, W.B.; Yang, Z.; Healey, S.P.; Kennedy, R.E.; Gorelick, N. A LandTrendr multispectral ensemble for forest disturbance detection. Remote Sens. Environ. 2018, 205, 131–140. [Google Scholar] [CrossRef]
- Hughes, M.J.; Douglas Kaylor, S.; Hayes, D.J. Patch-based forest change detection from Landsat time series. Forests 2017, 8, 166. [Google Scholar] [CrossRef]
- Yin, H.; Prishchepov, A.V.; Kuemmerle, T.; Bleyhl, B.; Buchner, J.; Radeloff, V.C. Mapping agricultural land abandonment from spatial and temporal segmentation of Landsat time series. Remote Sens. Environ. 2018, 210, 12–24. [Google Scholar] [CrossRef]
- Wilson, B.T.; Lister, A.J.; Riemann, R.I.; Griffith, D.M. Live tree species basal area of the contiguous United States (2000–2009). USDA Res. Data Arc. 2013. [Google Scholar] [CrossRef]
- PRISM Climate Group, Oregon State University. Thirty-Year Climate Normals. Available online: http://prism.oregonstate.edu (accessed on 25 February 2018).
- Homer, C.; Dewitz, J.; Jin, S.; Xian, G.; Costello, C.; Danielson, P.; Gass, L.; Funk, M.; Wickham, J.; Stehman, S.; et al. Conterminous United States land cover change patterns 2001–2016 from the 2016 National Land Cover Database. ISPRS J. Photogramm. Remote Sens. 2020, 162, 184–199. [Google Scholar] [CrossRef]
- Peet, R. Forest vegetation of the Colorado Front Range. Vegetatio 1981, 45, 3–75. [Google Scholar] [CrossRef]
- Romme, W.H.; Floyd, M.L.; Hanna, D.; Bartlett, E.J.; Crist, M.; Green, D.; Grissino-Mayer, H.D.; Lindsey, J.P.; McGarigal, K.; Redders, J.S. Historical Range of Variability and Current Landscape Condition Analysis: South Central Highlands Section, Southwestern Colorado & Northwestern New Mexico; Colorado Forest Restoration Institute: Fort Collins, CO, USA, 2009. [Google Scholar]
- Rollins, M.G. LANDFIRE: A nationally consistent vegetation, wildland fire, and fuel assessment. Int. J. Wildl. Fire 2009, 18, 235–249. [Google Scholar] [CrossRef]
- US Forest Service Insect and Disease Detection Surveys. Available online: https://www.fs.fed.us/foresthealth/applied-sciences/mapping-reporting/detection-surveys.shtml#idsdownloads (accessed on 15 March 2020).
- Wickham, J.D.; Stehman, S.V.; Smith, J.H.; Yang, L. Thematic accuracy of the 1992 National Land-Cover Dataset for the western United States. Remote Sens. Environ. 2004, 91, 452–468. [Google Scholar] [CrossRef]
- Geospatial Multi-Agency Coordinating Group (GeoMAC). Available online: https://rmgsc.cr.usgs.gov/outgoing/GeoMAC/ (accessed on 25 February 2020).
- Eidenshink, J.; Schwind, B.; Brewer, K.; Zhu, Z.; Quayle, B.; Howard, S.; Falls, S.; Falls, S. A project for monitoring trends in burn severity. Fire Ecol. 2007, 3, 3–21. [Google Scholar] [CrossRef]
- US Forest Service Geodata—Downloadable National Datasets. Available online: https://data.fs.usda.gov/geodata/edw/datasets.php (accessed on 20 May 2020).
- Caggiano, M.D. Front Range Round Table 2016 Interagency Fuel Treatment Database; Colorado Forest Restoration Institute: Fort Collins, CO, USA, 2017. [Google Scholar]
- Hart, S.J.; Veblen, T.T.; Eisenhart, K.S.; Jarvis, D.; Kulakowski, D. Drought induces spruce beetle (Dendroctonus rufipennis) outbreaks across northwestern Colorado. Ecology 2014, 95, 930–939. [Google Scholar] [CrossRef]
- Kulakowski, D.; Matthews, C.; Jarvis, D.; Veblen, T.T. Compounded disturbances in sub-alpine forests in western Colorado favour future dominance by quaking aspen (Populus tremuloides). J. Veg. Sci. 2013, 24, 168–176. [Google Scholar] [CrossRef]
- Gill, N.S.; Jarvis, D.; Veblen, T.T.; Pickett, S.T.A.; Kulakowski, D. Is initial post-disturbance regeneration indicative of longer-term trajectories? Ecosphere 2017, 8, e01924. [Google Scholar] [CrossRef]
- Andrus, R.A.; Hart, S.J.; Veblen, T.T. Forest recovery following synchronous outbreaks of spruce and western balsam bark beetle is slowed by ungulate browsing. Ecology 2020, 101, e02998. [Google Scholar] [CrossRef] [PubMed]
- Andrus, R.A.; Chai, R.K.; Harvey, B.J.; Rodman, K.C.; Veblen, T.T. Increasing rates of subalpine tree mortality linked to warmer and drier summers. J. Ecol. 2021. [Google Scholar] [CrossRef]
- Chapman, T.B.; Schoennagel, T.L.; Veblen, T.T.; Rodman, K.C. A Closed Cone is a Terrible Thing to Lose: Serotiny and Regeneration of Lodgepole Pine Following Fire and Beetle Disturbance in Colorado and Wyoming, USA. Unpublished Data.
- Gorelick, N.; Hancher, M.; Dixon, M.; Ilyushchenko, S.; Thau, D.; Moore, R. Google Earth Engine: Planetary-scale geospatial analysis for everyone. Remote Sens. Environ. 2017, 202, 18–27. [Google Scholar] [CrossRef]
- R Core Team. R: A Language and Environment for Statistical Computing; R Foundation for Statistical Computing: Vienna, Austria, 2018. [Google Scholar]
- Kennedy, R.E.; Yang, Z.; Cohen, W.B. Detecting trends in forest disturbance and recovery using yearly Landsat time series: 1. LandTrendr—temporal segmentation algorithms. Remote Sens. Environ. 2010, 114, 2897–2910. [Google Scholar] [CrossRef]
- Kennedy, R.E.; Yang, Z.; Gorelick, N.; Braaten, J.; Cavalcante, L.; Cohen, W.B.; Healey, S. Implementation of the LandTrendr algorithm on Google Earth Engine. Remote Sens. 2018, 10, 691. [Google Scholar] [CrossRef]
- Roy, D.P.; Kovalskyy, V.; Zhang, H.K.; Vermote, E.F.; Yan, L.; Kumar, S.S.; Egorov, A. Characterization of Landsat-7 to Landsat-8 reflective wavelength and normalized difference vegetation index continuity. Remote Sens. Environ. 2016, 185, 57–70. [Google Scholar] [CrossRef]
- Foga, S.; Scaramuzza, P.L.; Guo, S.; Zhu, Z.; Dilley, R.D.; Beckmann, T.; Schmidt, G.L.; Dwyer, J.L.; Joseph Hughes, M.; Laue, B. Cloud detection algorithm comparison and validation for operational Landsat data products. Remote Sens. Environ. 2017, 194, 379–390. [Google Scholar] [CrossRef]
- Flood, N. Seasonal composite Landsat TM/ETM+ images using the medoid (a multi-dimensional median). Remote Sens. 2013, 5, 6481–6500. [Google Scholar] [CrossRef]
- Baker, E.H.; Painter, T.H.; Schneider, D.; Meddens, A.J.H.; Hicke, J.A.; Molotch, N.P. Quantifying insect-related forest mortality with the remote sensing of snow. Remote Sens. Environ. 2017, 188, 26–36. [Google Scholar] [CrossRef]
- Vanderhoof, M.K.; Hawbaker, T.J.; Ku, A.; Merriam, K.; Berryman, E.; Cattau, M. Tracking rates of post-fire conifer regeneration distinct from deciduous vegetation recovery across the western USA. Ecol. Appl. 2020, eap.2237. [Google Scholar] [CrossRef]
- Stueve, K.M.; Housman, I.W.; Zimmerman, P.L.; Nelson, M.D.; Webb, J.B.; Perry, C.H.; Chastain, R.A.; Gormanson, D.D.; Huang, C.; Healey, S.P.; et al. Snow-covered Landsat time series stacks improve automated disturbance mapping accuracy in forested landscapes. Remote Sens. Environ. 2011, 115, 3203–3219. [Google Scholar] [CrossRef]
- Achanta, R.; Süsstrunk, S. Superpixels and polygons using simple non-iterative clustering. In Proceedings of the 2017 IEEE Conference on Computer Vision and Pattern Recognition (CVPR), Honolulu, HI, USA, 21–26 July 2017; Institute of Electrical and Electronics Engineers: Honolulu, HI, USA, 2017; pp. 4895–4904. [Google Scholar]
- Genuer, R.; Poggi, J.-M.; Tuleau-Malot, C. Package “VSURF”. Pattern Recognit. Lett. 2015, 31, 2225–2236. [Google Scholar] [CrossRef]
- Evans, J.S.; Murphy, M.A. rfUtilities: Random Forests Model Selection and Performance Evaluation. Available online: https://cran.r-project.org/package=rfUtilities (accessed on 1 September 2020).
- Wright, M.N.; Ziegler, A. Ranger: A fast implementation of random forests for high dimensional data. J. Stat. Softw. 2017, 77, 1–17. [Google Scholar] [CrossRef]
- Kuhn, M.; Wing, J.; Weston, S.; Williams, A.; Keefer, C.; Engelhardt, A.; Cooper, T.; Mayer, Z.; Team, R.C.; Bennesty, M.; et al. Caret: Classification and Regression Training. Available online: https://cran.r-project.org/package=caret (accessed on 15 September 2020).
- Zhang, G.; Lu, Y. Bias-corrected Random Forests in regression. J. Appl. Stat. 2012, 39, 151–160. [Google Scholar] [CrossRef]
- Parks, S.A.; Holsinger, L.M.; Koontz, M.J.; Collins, L.; Whitman, E.; Parisien, M.A.; Loehman, R.A.; Barnes, J.L.; Bourdon, J.F.; Boucher, J.; et al. Giving ecological meaning to satellite-derived fire severity metrics across North American forests. Remote Sens. 2019, 11, 1735. [Google Scholar] [CrossRef]
- Pebesma, E.J. Multivariable geostatistics in S: The gstat package. Comput. Geosci. 2004, 30, 683–691. [Google Scholar] [CrossRef]
- Bivand, R.S.; Pebesma, E.; Gómez-Rubio, V. Applied Spatial Data Analysis with R; Springer: New York, NY, USA, 2013. [Google Scholar]
- Rodman, K.C.; Andrus, R.A.; Butkiewicz, C.L.; Chapman, T.B.; Gill, N.S.; Harvey, B.J.; Kulakowski, D.; Tutland, N.J.; Veblen, T.T.; Hart, S.J. Data from: Effects of bark beetle outbreaks on forest landscape pattern in the Southern Rocky Mountains, U.S.A. Dryad Digit. Repos. 2021. [Google Scholar] [CrossRef]
- Coops, N.C.; Shang, C.; Wulder, M.A.; White, J.C.; Hermosilla, T. Change in forest condition: Characterizing non-stand replacing disturbances using time series satellite imagery. For. Ecol. Manag. 2020, 474, 118370. [Google Scholar] [CrossRef]
- Cohen, W.B.; Healey, S.P.; Yang, Z.; Stehman, S.V.; Brewer, C.K.; Brooks, E.B.; Gorelick, N.; Huang, C.; Hughes, M.J.; Kennedy, R.E.; et al. How similar are forest disturbance maps derived from different Landsat time series algorithms? Forests 2017, 8, 98. [Google Scholar] [CrossRef]
- Rodman, K.C.; Andrus, R.A.; Veblen, T.T.; Hart, S.J. Disturbance detection in Landsat time series is influenced by tree mortality agent and severity, not by prior disturbance. Remote Sens. Environ. 2021, 254, 112244. [Google Scholar] [CrossRef]
- Foster, A.C.; Walter, J.A.; Shugart, H.H.; Sibold, J.; Negron, J. Spectral evidence of early-stage spruce beetle infestation in Engelmann spruce. For. Ecol. Manag. 2017, 384, 347–357. [Google Scholar] [CrossRef]
- Healey, S.P.; Cohen, W.B.; Yang, Z.; Kenneth Brewer, C.; Brooks, E.B.; Gorelick, N.; Hernandez, A.J.; Huang, C.; Joseph Hughes, M.; Kennedy, R.E.; et al. Mapping forest change using stacked generalization: An ensemble approach. Remote Sens. Environ. 2018, 204, 717–728. [Google Scholar] [CrossRef]
- Cohen, W.B.; Healey, S.P.; Yang, Z.; Zhu, Z.; Gorelick, N. Diversity of algorithm and spectral band inputs improves Landsat monitoring of forest disturbance. Remote Sens. 2020, 12, 1673. [Google Scholar] [CrossRef]
- Senf, C.; Seidl, R. Mapping the forest disturbance regimes of Europe. Nat. Sustain. 2021, 4, 63–70. [Google Scholar] [CrossRef]
- Kennedy, R.E.; Yang, Z.; Braaten, J.; Copass, C.; Antonova, N.; Jordan, C.; Nelson, P. Attribution of disturbance change agent from Landsat time-series in support of habitat monitoring in the Puget Sound region, USA. Remote Sens. Environ. 2015, 166, 271–285. [Google Scholar] [CrossRef]
- Hermosilla, T.; Wulder, M.A.; White, J.C.; Coops, N.C.; Hobart, G.W. Regional detection, characterization, and attribution of annual forest change from 1984 to 2012 using Landsat-derived time-series metrics. Remote Sens. Environ. 2015, 170, 121–132. [Google Scholar] [CrossRef]
- Seidl, R.; Müller, J.; Hothorn, T.; Bässler, C.; Heurich, M.; Kautz, M. Small beetle, large-scale drivers: How regional and landscape factors affect outbreaks of the European spruce bark beetle. J. Appl. Ecol. 2016, 53, 530–540. [Google Scholar] [CrossRef]
- Sherriff, R.L.; Berg, E.E.; Miller, A.E. Climate variability and spruce beetle (Dendroctonus rufipennis) outbreaks in south-central and southwest Alaska. Ecology 2011, 92, 1459–1470. [Google Scholar] [CrossRef] [PubMed]
- Vorster, A.G.; Evangelista, P.H.; Stohlgren, T.J.; Kumar, S.; Rhoades, C.C.; Hubbard, R.M.; Cheng, A.S.; Elder, K. Severity of a mountain pine beetle outbreak across a range of stand conditions in Fraser Experimental Forest, Colorado, United States. For. Ecol. Manag. 2017, 389, 116–126. [Google Scholar] [CrossRef]
- Bebi, P.; Kulakowski, D.; Veblen, T.T. Interactions between fire and spruce beetles in a subalpine Rocky Mountain forest landscape. Ecology 2003, 84, 362–371. [Google Scholar] [CrossRef]
- Chen, H.; Jackson, P.L.; Ott, P.K.; Spittlehouse, D.L. A spatiotemporal pattern analysis of potential mountain pine beetle emergence in British Columbia, Canada. For. Ecol. Manag. 2015, 337, 11–19. [Google Scholar] [CrossRef]
- Creeden, E.P.; Hicke, J.A.; Buotte, P.C. Climate, weather, and recent mountain pine beetle outbreaks in the western United States. For. Ecol. Manag. 2014, 312, 239–251. [Google Scholar] [CrossRef]
- Aukema, B.H.; Carroll, A.L.; Zhu, J.; Raffa, K.F.; Sickley, T.A.; Taylor, S.W. Landscape level analysis of mountain pine beetle in British Columbia, Canada: Spatiotemporal development and spatial synchrony within the present outbreak. Ecography 2006, 29, 427–441. [Google Scholar] [CrossRef]
- Aukema, B.H.; Carroll, A.L.; Zheng, Y.; Zhu, J.; Raffa, K.F.; Moore, D.R.; Stahl, K.; Taylor, S.W. Movement of outbreak populations of mountain pine beetle: Influences of spatiotemporal patterns and climate. Ecography 2008, 31, 348–358. [Google Scholar] [CrossRef]
- Harvey, B.J.; Donato, D.C.; Turner, M.G. Drivers and trends in landscape patterns of stand-replacing fire in forests of the US Northern Rocky Mountains (1984–2010). Landsc. Ecol. 2016, 31, 2367–2383. [Google Scholar] [CrossRef]
- Rebertus, A.J.; Burns, B.R.; Veblen, T.T. Stand dynamics of Pinus flexilis-dominated subalpine forests in the Colorado Front Range. J. Veg. Sci. 1991, 2, 445–458. [Google Scholar] [CrossRef]
- Veblen, T.T.; Hadley, K.S.; Reid, M.S.; Rebertus, A.J. The response of subalpine forests to spruce beetle outbreak in Colorado. Ecology 1991, 72, 213–231. [Google Scholar] [CrossRef]
- Andrus, R.A.; Hart, S.J.; Tutland, N.J.; Veblen, T.T. Future dominance by quaking aspen expected following short-interval, compounded disturbance interaction. Ecosphere 2021, 12, e03345. [Google Scholar] [CrossRef]
- Gill, N.S.; Jarvis, D.; Rogan, J.; Kulakowski, D. Disturbance history modulates how litter and herbaceous cover influence conifer regeneration after fire. Int. J. Wildl. Fire 2020, 29, 519–529. [Google Scholar] [CrossRef]
- Baker, W.L.; Veblen, T.T. Spruce beetles and fires in the nineteenth-century subalpine forests of western Colorado, USA. Arct. Alp. Res. 1990, 22, 65–80. [Google Scholar] [CrossRef]
- Romme, W.H.; Knight, D.H.; Yavitt, J.B. Mountain pine beetle outbreaks in the Rocky Mountains: Regulators of primary productivity? Am. Nat. 1986, 127, 484–494. [Google Scholar] [CrossRef]
- Collins, B.J.; Rhoades, C.C.; Hubbard, R.M.; Battaglia, M.A. Tree regeneration and future stand development after bark beetle infestation and harvesting in Colorado lodgepole pine stands. For. Ecol. Manag. 2011, 261, 2168–2175. [Google Scholar] [CrossRef]
- Carlson, A.R.; Sibold, J.S.; Negrón, J.F. Canopy structure and below-canopy temperatures interact to shape seedling response to disturbance in a Rocky Mountain subalpine forest. For. Ecol. Manag. 2020, 472, 118234. [Google Scholar] [CrossRef]
- Andrus, R.A.; Harvey, B.J.; Rodman, K.C.; Hart, S.J.; Veblen, T.T. Moisture availability limits subalpine tree establishment. Ecology 2018, 99, 567–575. [Google Scholar] [CrossRef] [PubMed]
- Schapira, Z.; Stevens-Rumann, C.; Shorrock, D.; Hoffman, C.; Chambers, A. Beetlemania: Is the bark worse than the bite? Rocky Mountain subalpine forests recover differently after spruce beetle outbreaks and wildfires. For. Ecol. Manag. 2021, 482, 118879. [Google Scholar] [CrossRef]
- Pettit, J.M.; Burton, J.I.; DeRose, R.J.; Long, J.N.; Voelker, S.L. Epidemic spruce beetle outbreak changes drivers of Engelmann spruce regeneration. Ecosphere 2019, 10, e02912. [Google Scholar] [CrossRef]
- Kulakowski, D.; Veblen, T.T.; Beb, P. Fire severity controlled susceptibility to a 1940s spruce beetle outbreak in Colorado, USA. PLoS ONE 2016, 11, e0158138. [Google Scholar] [CrossRef]
- Hudak, A.T.; Lefsky, M.A.; Cohen, W.B.; Berterretche, M. Integration of lidar and Landsat ETM+ data for estimating and mapping forest canopy height. Remote Sens. Environ. 2002, 82, 397–416. [Google Scholar] [CrossRef]
- Bright, B.C.; Hudak, A.T.; Meddens, A.J.H.; Hawbaker, T.J.; Briggs, J.S.; Kennedy, R.E. Prediction of forest canopy and surface fuels from lidar and satellite time series data in a bark beetle-affected forest. Forests 2017, 8, 322. [Google Scholar] [CrossRef]
- Schmid, J.M.; Frye, R.H. Spruce Beetle in the Rockies. GTR RM-49; US Forest Service, Rocky Mountain Forest and Range Experiment Station: Fort Collins, CO, USA, 1977.
- Worrall, J.J.; Marchetti, S.B.; Egeland, L.; Mask, R.A.; Eager, T.; Howell, B. Effects and etiology of sudden aspen decline in southwestern Colorado, USA. For. Ecol. Manag. 2010, 260, 638–648. [Google Scholar] [CrossRef]
- Schoettle, A.W.; Sniezko, R.A. Proactive intervention to sustain high-elevation pine ecosystems threatened by white pine blister rust. J. For. Res. 2007, 12, 327–336. [Google Scholar] [CrossRef]
Publisher’s Note: MDPI stays neutral with regard to jurisdictional claims in published maps and institutional affiliations. |
© 2021 by the authors. Licensee MDPI, Basel, Switzerland. This article is an open access article distributed under the terms and conditions of the Creative Commons Attribution (CC BY) license (http://creativecommons.org/licenses/by/4.0/).