1. Introduction
Since the 1950s, the intensive use of ecosystems by humans has led to major changes in the biosphere [
1]. Most of the world’s biological diversity cannot adapt to such sudden transformations. In addition, mammal populations tend to decline drastically, particularly carnivores [
2,
3,
4]. Our study case, the cheetah (
Acinonyx jubatus), is classified as vulnerable with a total estimated population of 6674 mature individuals according to the International Union for Conservation of Nature’s Red List assessment [
5]. This number keeps declining [
6]. Nowadays, the majority of wild cheetahs live in southern and eastern Africa, mainly outside protected areas [
5]. Their current range is estimated at 10% of the historical range [
7]. The need for data to understand and monitor cheetah populations is therefore crucial.
Wildlife monitoring enables a better understanding of animal populations. However, it often requires direct contact with the studied animal. From the most intimate contact, such as fitting GPS collars, to the most distant, such as camera trapping, monitoring can affect the animals, potentially modifying their fitness [
8,
9]. The possibility of indirectly monitoring wild animals without disturbing them is of significant interest. Accomplishing this is to record indirect signs of presence. These signs include feces, territorial marks and tracks [
10]. Tracks are particularly interesting, because they have specific and differentiable characteristics that are related to the species, sex, age and even individual. This is highlighted by the ability of some traditional trackers to identify the species, age and sex of animals and/or individual wild animals through their tracks with a high degree of certainty [
11,
12]. For several years, study programs have been trying to use presence signs to monitor certain animal species. For tracks, successful attempts have been made, first using direct measurement [
13] and, more recently using digitized measurements, in particular the FIT (Footprint Identification Technique) program [
13,
14,
15]. Based on photographs of tracks, researchers were able to create individual identification algorithms for a wide range of mammal species [
13,
14,
15], with some emphasis on cheetah [
16].
The use of a three-dimensional (3D) recording technique is a recent advance in the field, which has been used on lions (
Panthera leo) [
17,
18,
19]. This new method allows the extraction of more information from the track (including depth), to decrease the manipulator bias and allow greater automation of both the recording and feature extraction processes. In order to extract information on the geometry of tracks, the 3D method uses geometric morphometrics analysis. Morphometrics is used to study the geometry of living organisms, their variations and covariations (Cucchi et al., 2015).
These techniques are based on the placement of landmarks, which are discrete points corresponding to anatomical loci that are homologous among the studied entities [
20]. As landmarks sometimes do not allow the characterization of all geometric information, particularly variations in curves and surfaces, morphometricians developed semilandmarks [
21]. These are discrete points that do not correspond to anatomical loci and are therefore able to slide along curves and surfaces [
22], hence their designation as curve or surface-sliders. The positions of the landmarks and semilandmarks are then subjected to a generalized procrustes analysis (GPA). This superimposition projects all the landmark coordinates into a non-linear space. It uses a least-squares superposition method to minimize the distance between all homologous landmarks in the sample and thus, to isolate the shape of the studied objects [
23]. The new coordinates are known as Procrustes coordinates [
21]. This process eliminates the effects of size, orientation and position using an iterative algorithm in order to keep only the true differences between tracks shapes [
21]. GPA creates a consensus object based on the mean position of the superimposed landmarks made out of the entire dataset. Shape variations between the objects are studied in relation to this consensus. In addition to shape, size is also analyzed by calculating the centroid size of each track. It is mathematically traduced by the square root of the sum of the squared distances to the centroid of the object and corresponds to all the information available on the size [
20]. The information added from the shape and the size refers to the form [
24]. The method of Marchal et al. [
17,
18] uses morphometrics to extract geometric information from tracks that can be used for individual identification. However, this method remains under development. Even if it successfully distinguished foot position, age and sex of lions, individual identification remains inaccurate [
18].
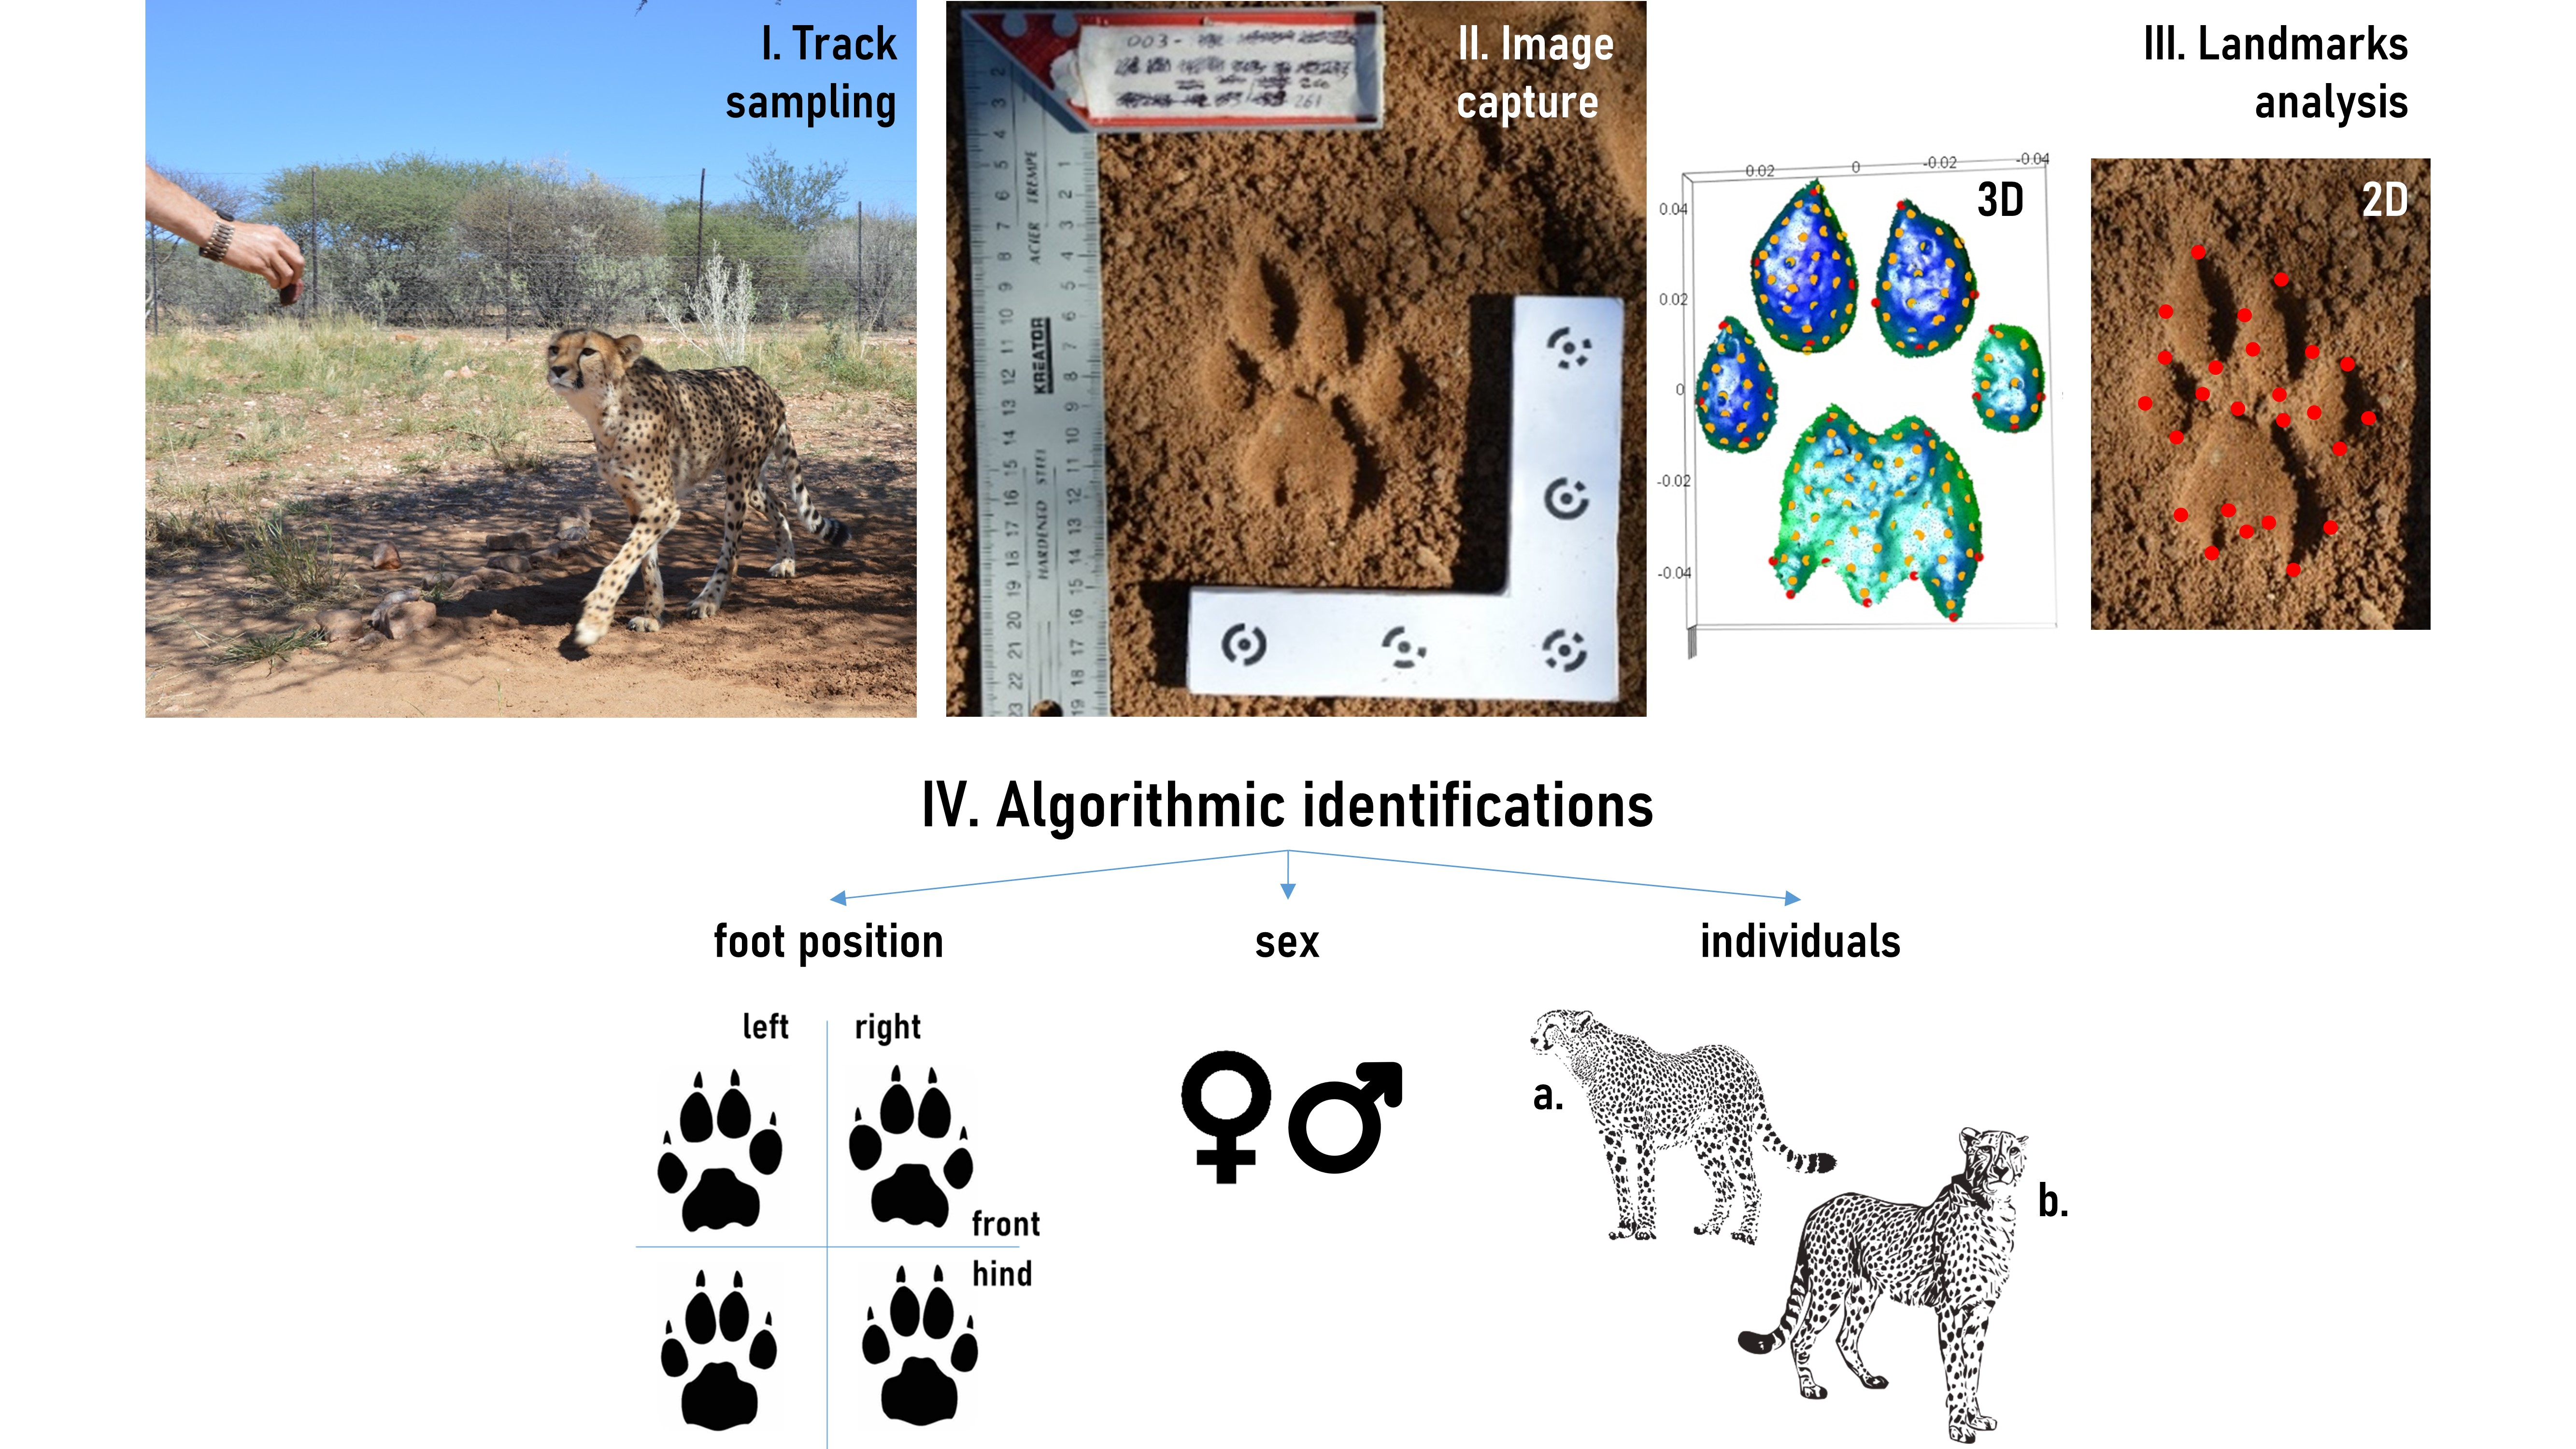
The objective of this study is to compare different combinations of features, such as recording medium, landmark configuration, type of extracted information and template, to implement an identification algorithm for cheetah tracks. The aim is to find the most suitable set of features to identify the foot position, sex and individual with the highest accuracy. In the end, this could become a reliable, user-friendly and cost-effective tool to identify and sex animals in a non-invasive way that would improve wildlife monitoring, and therefore conservation strategies.
4. Discussion
During this experiment, we achieved the identification of individual features of adult cheetahs using different combinations of modalities (
Figure 2). Firstly, differentiation of each foot was successfully accomplished. For 3D, about 98% of positions were correctly discriminated by LDA over the entire dataset. Such a high rate makes it possible to consider using a second identification step based on datasets divided by the previously found foot positions. Predictions on sex and identity remained imprecise for combinations using the entire track set (
Figure 6). This is certainly due to the difference in morphology between tracks.
Two factors are involved: the foot position and the size of the pads, which depends on right-left symmetry and the length of the paw impression on the substrate. Cheetahs’ front paws are wider, and their hind paws are larger and longer. We can observe that PC1 and PC2 separate right and left more efficiently than front and hind positions (
Figure 4). This is also probably due to the impression quality of the track on the ground. When the substrate is too soft, we noticed that the tracks appeared to be longer because of the weight transfer on the leg when the animal is moving, making front tracks look like hind track. Furthermore, sexual dimorphism also generates statistical noise, as males are larger than females (
Figure 5A, Marker et al. [
26]) and the front feet of a male can be mistaken for the hind feet of a female if the track impression is not optimal. The distinction between front and hind tracks for females is also more visually subtle because the hind track elongation is less pronounced.
Here, the quality of the used tracks was optimal due to the sampling conditions. In a natural environment, the tracks are prone to degrade quickly under the influence of many factors, such as humidity, substrate, the animal’s gait or weather conditions [
10]. During this study, the tracks were sampled in moistened and smoothed sand patches. Furthermore, sand aggregates falling inside the track were gently blown away. As this tool is intended to be used under real conditions, we recommend that future studies test different substrates and gaits to verify their impact on predictions. Besides the prediction accuracy, these factors can induce variability in the segmentation of tracks and thus on the positioning of landmarks. Loose impressions in the substrate or deformed tracks due to cheetah movement present poorly defined contours, especially for lower part of the main pad. The segmentation, even colored by depth, is then subjected to operator bias. In our case, we reduced the possible influence of this bias by working with a single operator.
To overcome the variability induced by the foot positions discussed above, we separated the dataset into four subsets depending on foot positions. The accuracy increased, because these datasets highlighted the variability between tracks from the same foot of different individuals, thus the variability related to sex and identity. A sex sub-division of these datasets was performed, but the identity identification results decreased. This may be due to the small number of cheetahs remaining in these datasets. Furthermore, we can observe that the best results were obtained with fixed landmarks coupled with surface-sliders (
Figure 6). The influence of the number of templates used is relatively limited and could indicate that the number of surface-sliders is too high. We believe that with more individuals implemented in the dataset, the differences would be more significant. Curve-sliders could also be placed on the edges of the tracks. Nevertheless, the edges are dependent of the depth of the track, making them relatively variable between tracks. In the same way, as 3D models are polygonal meshes, the manual removal of tracks can induce additional noise from the irregularities of the remaining mesh faces. We believe that using curve-sliders would have led to more statistical noise than usable information and made the method more tedious.
The graph of PCs 1 and 2 for the front right tracks (
Figure 5B) shows that some individuals are more clearly segregated from others. This separation seems to correspond to the general size of the individuals. For example, AM3 is the largest cheetah in this dataset. His tracks appear as a cluster distinct from the others. It would be interesting to test the relationship between the form of the track and the body condition of the animal in further studies. Links between track form and morphological features such as body mass are being investigated for different species and for estimation of features of extinct animals [
27]. This algorithm might allow a more precise estimation of the morphological parameters of cheetahs such as their overall size or weight. Such information would be valuable for scientists in charge of setting up conservation strategies specifically for elusive carnivores [
14,
15]. Besides, AM4 is a smaller male, and PC1 and PC2 hardly distinguish it from females.
In addition, it should be noted that for two of the three groups of cheetahs (AF1-AF2 and AF3-AF4-AM4) from the same litter, the scores of related individuals are juxtaposed or superimposed. As well, the cluster formed by AM3, not related to any other cheetah, is well segregated from the others. To some extent, it is conceivable that the morphology of the track is a hereditary trait and might be evidence of the animal’s genetics. Thus, this method could potentially assess the relatedness between cheetahs.
Differences among results using information from shape or form remain relatively small (
Table 2,
Figure 6). Therefore, size information seems to be of limited relevance for the morphometric study of adult cheetah tracks. Further analysis of size should include more individual cheetahs to assess the true impact of size on predictions, especially with different age groups. Size may have a significant influence when discriminating animal age. Methods implying size are already being used to estimate age and population age structure but sometimes remain imprecise [
19,
28]. Concerning the variation in the geometry of the tracks according to age, the track being dependent on the anatomy of the leg and foot, as well as the gait, the ontogeny of the animal can have an effect on its shape. The gait changes for the domestic cat (Felis catus) as the animal’s neuromuscular development change from plantigrade or semi-plantigrade to digitigrade as an adult [
29]. A similar development in cheetahs could influence the tracks left by animals of different age groups. This question could be answered by following different animals throughout their lives and comparing their tracks. However, geometric morphometry is a technique that eliminates the effects of size and only keeps the differences in pure geometry. Using only shape data, the differences according to age could be minimized, therefore enabling individual identification throughout the entire life of individuals. In addition, the use of the shape alone would make it possible to ignore the use of a scale, since GPA eliminates any effect of scale, position and orientation. Thus it simplifies fieldwork by removing the necessity of having a ruler. The user would then need only a camera, which is readily available thanks to the existence of smartphones.
Using photography and 3D models to differentiate and identify species or individuals is the main goal of both FIT and the method explained in this paper. FIT has already proven its efficacy in discriminating individual features in various mammals [
15]. However, some limitations might exist when it comes to tracks with limited geometrical variety. Indeed, morphometrics studies permit us to extract information related to the form of the track. As carnivores and rodents have complex tracks with digits and pads, the quantity of information extracted is considerably larger and the identification is more likely to be successful [
16,
30,
31]. In another way, other animal such as ungulate mammals tend to have simpler tracks from a geometrical point of view, and identification would then seem to be more challenging regarding the lack of mathematical information [
10]. However, it would be possible to determine morphological features such as age and sex thanks to size variations and sexual dimorphism. Here, we believe that 3D would be of great interest: depth information of the 3D model could be used to estimate features such as the body mass. In order to achieve that, the relationship between the tracks and body features of studied species is discussed in various studies [
27,
28,
30]. In this study, we did not have access to the weight of the animals. However, cheetahs are animals with a clear sexual dimorphism, the males being larger and heavier than the females [
26]. The efficiency of sex identification allows us to consider the possibility of estimating the weight of an individual based on its tracks. On the other hand, it is also possible that a significant variation in the weight of an individual can induce differences in the track and lead to misidentifications, as cheetahs are animals that can undergo significant weight variations due to their environment. In addition, substrate conditions such as composition or wetness can have an impact on the quality of the imprint and thus the geometry of the modelled tracks. Similarly, the tracks will be different depending on the gait of the animal. Tracks left during a run are unusable because of their poor quality. To overcome these problems, we used controlled conditions (i.e., prepared sand patch) to limit as much as possible the differences linked to the substrate. The cheetahs were always at a slow pace, following the operator in possession of the meat reward. At the end of the sampling, only good quality prints were kept. To overcome limitations related to track quality in the field, we recommend collecting cheetah tracks near riverbeds or on sandy roads, with little or no stones, or after rainy episodes. Wet soils allow for a better impression of the foot in the substrate. In addition, animals are more likely to walk slowly near water, for example to come and drink. The probability of finding good quality tracks therefore tends to be higher. Nevertheless, tracks variation depending on substrate conditions and animal’s gait still needs to be investigated.
The best identification algorithm allows 93.7% of individuals to be distinguished (
Figure 6B). By way of comparison, the FIT approach with cheetahs also has a success rate of more than 90% [
16]. However, FIT only uses the left hind tracks. The tool under development in this study can identify individuals based on any cheetah track. The FIT algorithm is also calibrated with more data (38 cheetahs sampled). A trial with as many individuals would be necessary to verify which technique is the most efficient. As LDA is a supervised classification method, a comparison with an unsupervised classification method would highlight the efficiency of geometric morphometrics studies to discriminate individual characteristics extracted from tracks. In addition,
Table 2 shows that front tracks facilitate the separation of sex, while hind tracks facilitate the separation of individuals (mean for sex predictions is 97.4% for front and 90.6% for hind tracks; mean for identity predictions is 90.8% for front and 92.6% for hind tracks). These observations are related to the sexual dimorphism of cheetah feet, as explained above. On the one hand, males have more massive paws than females. The variability explained by the PC incorporated in the LDA explains this difference. On the other hand, hind tracks are more similar between males and females. The variability thus emphasizes the individual differences.
Another major difference from FIT is the use of 3D models versus purely 2D photos. The FIT technique is therefore comparatively easier to apply. Nevertheless, the differences between our 2D and 3D algorithms show better predictions with 3D data. The principal limitations of the 3D approaches lie in the processing time for model reconstruction and manual segmentation. These steps are time-consuming, especially for large datasets. However, the possibility of using cloud computing would overcome the first limitation by providing access to computers powerful enough to make 3D reconstruction virtually instantaneous. The recent development of LiDAR sensors integrated in smartphones is also very promising as they allow instantaneous 3D perception. For segmentation, an approach using machine learning should be able to separate the tracks from the substrate. It would need to first recognize tracks based on their geometry and depth information, and segment them from the model. This technique is being developed for 2.5D by FIT [
32] with limited success. We believe that 3D would obtain better results. The positioning of landmarks could also be automated by using the geometry of the track. The placement of landmarks (type II) corresponds to the extrema curves of local structures that could be identified by trained algorithms [
23]. Ultimately, track recognition software such as a citizen-science smartphone application could be developed using only five track photos as input. The pictures could be geo-referenced thanks to the integrated GPS of the cellphone. The software would place the landmarks depending on the geometry of the track parts and allow for the identification of animals from different species, along with their sex and identity. It would provide accurate and valuable information to conservation scientists, inform tourists or local community members, and raise awareness about the status of identified animals.


