Article

Application of Combining YOLO Models and 3D GPR Images in Road Detection and Maintenance

1
Department of Roadway Engineering, School of Transportation, Southeast University, Nanjing 211189, China
2
Highway and Transportation Management Center, Jinhua 321000, China
3
Zhejiang Scientific Research Institute of Transport, Hangzhou 310023, China
*
Author to whom correspondence should be addressed.
Remote Sens. 2021, 13(6), 1081; https://doi.org/10.3390/rs13061081
Submission received: 10 February 2021 / Revised: 4 March 2021 / Accepted: 10 March 2021 / Published: 12 March 2021
(This article belongs to the Special Issue Trends in GPR and Other NDTs for Transport Infrastructure Assessment)

Abstract

:
Improving the detection efficiency and maintenance benefits is one of the greatest challenges in road testing and maintenance. To address this problem, this paper presents a method for combining the you only look once (YOLO) series with 3D ground-penetrating radar (GPR) images to recognize the internal defects in asphalt pavement and compares the effectiveness of traditional detection and GPR detection by evaluating the maintenance benefits. First, traditional detection is conducted to survey and summarize the surface conditions of tested roads, which are missing the internal information. Therefore, GPR detection is implemented to acquire the images of concealed defects. Then, the YOLOv5 model with the most even performance of the six selected models is applied to achieve the rapid identification of road defects. Finally, the benefits evaluation of maintenance programs based on these two detection methods is conducted from economic and environmental perspectives. The results demonstrate that the economic scores are improved and the maintenance cost is reduced by $49,398/km based on GPR detection; the energy consumption and carbon emissions are reduced by 792,106 MJ/km (16.94%) and 56,289 kg/km (16.91%), respectively, all of which indicates the effectiveness of 3D GPR in pavement detection and maintenance.

Graphical Abstract

1. Introduction

The quality parameters for structural layers of pavement are obtained through reasonable setpoint, drilled core on-site and laboratory testing in core sample detection. However, the inspection results cannot reflect the true conditions of the road at the scene because the setpoint is random and incidental [1,2]. In addition, the defect conditions of the road surface are acquired by manual-based patrol and judgement, which cannot detect the internal defects. These methods have the characteristics of low efficiency, poor presentation, and destructiveness that have led to a considerable increase in the cost of road maintenance. Thus, the traditional testing methods fail to meet the growing demands of road maintenance.
With the development of science and technology, new nondestructive testing (NDT) devices, such as ground-penetrating radar (GPR), the nuclear-free densitometer, laser detector, and ultrasonic depth finder have been used in fast nondestructive and precise testing. GPR is already well recognized for its role in improving the efficiency, security, and anti-interference [3,4]. Radar-collected data can provide the basis for recognizing hidden defects and be used to conduct the later maintenance and management of roads [5]. The development of 3D GPR further reinforces these effects [6]. Nevertheless, this technology has limitations, such as tedious data post-processing and a lack of evaluation criteria, which have resulted in a failure to provide automatic detection and quantitative evaluation of road testing and maintenance [7].
Recently, several efforts have been made in terms of the data processing of GPR inspection that includes signal processing and image recognition. Zhao et al. [8] proposed a nonlinear optimization method based on gradient descent to analyze the collected GPR signals in the thickness detection of asphalt pavement, which needs a prior knowledge of road structure. Liu et al. [9] used the frequency domain focusing technology of synthetic aperture radar (SAR) to aggregate scattered GPR signals for acquiring testing images. The noise of primordial signals was removed through the designed low-pass filter, and the profiles of detecting objects were extracted via the edge detection technique using the background information. Moreover, Mezgeen et al. [10] presented a formula relating the hidden crack width with the relative amplitude measured in the vertex of the hyperbola. However, a major drawback is that this research only considered regular single cracks.
As for image recognition of GPR detection, many researchers have tried to apply the complex manual processes to automatically inspect internal defects in a road, but this goal is difficult to realize [11,12]. It was not until the appearance of deep learning (DL), the real, efficient, automatic detection of concealed defects became possible in asphalt pavement [13,14]. As a result, the combination of deep convolutional neural network (CNN) models and GPR images has become a mainstream research direction. Tong et al. [15,16,17] used a CNN algorithm to achieve the automatic localization of internal cracking based on GPR testing images, which used the GPR signals as an input value to import into the CNNs.
However, although the region proposal types of CNN series models have the advantage of high accuracy, the limitation of detection speed loss has been reported. This limitation has promoted the development of more advanced DL models. Another regression method (also known as the one-stage method) substantially enhances the speed of defect detection by streamlining the workflow. This method primarily includes YOLO [18,19,20], RetinaNet [21], the single shot multibox detector (SSD) [22,23], and CenterNet [24]. Above all, YOLO version 3 (YOLOv3) is a mainstream method, and it has been widely used in remote sensing [25,26], agriculture [27], and energy [28]. It has also been successfully applied in transportation infrastructure, e.g., for the detection of pavement potholes and cracking [28,29,30]. Currently, the latest YOLO version 4 (YOLOv4) [31] and YOLO version 5 (YOLOv5) [32] have become more effective for object detection by integrating the most advanced methods.
On the other hand, researchers have performed many studies of the standardization of road testing and maintenance [33,34]. The group criteria of technical guidelines for ground-penetrating radar detection of the internal condition of highway asphalt pavement has been published by the China Highway and Transportation Society (CHTS) [35], which has provided a scientific reference for future exploration. However, these attempts are far from numerous. Therefore, in the present study, we developed a method for evaluating the maintenance benefits by comparing the traditional detection and GPR detection in asphalt pavement.
This work proposes a method for combining the YOLO series with GPR images to recognize the internal defects in asphalt pavement and compares the effectiveness of traditional detection and GPR detection by evaluating the maintenance benefits. The technical roadmap is shown in Figure 1. An introduction to the tested roads and traditional detection method are given in Section 2. In Section 3, the GPR detection process, which includes testing equipment, a testing scheme, data processing, and testing results, is elaborated. Moreover, the YOLOv3 and YOLOv5 models are applied to defect detection for better accuracy and efficiency. The fourth section discusses the maintenance programs and maintenance benefits based on two types of detection methods. Section 5 concludes the research.

2. Traditional Pavement Detection

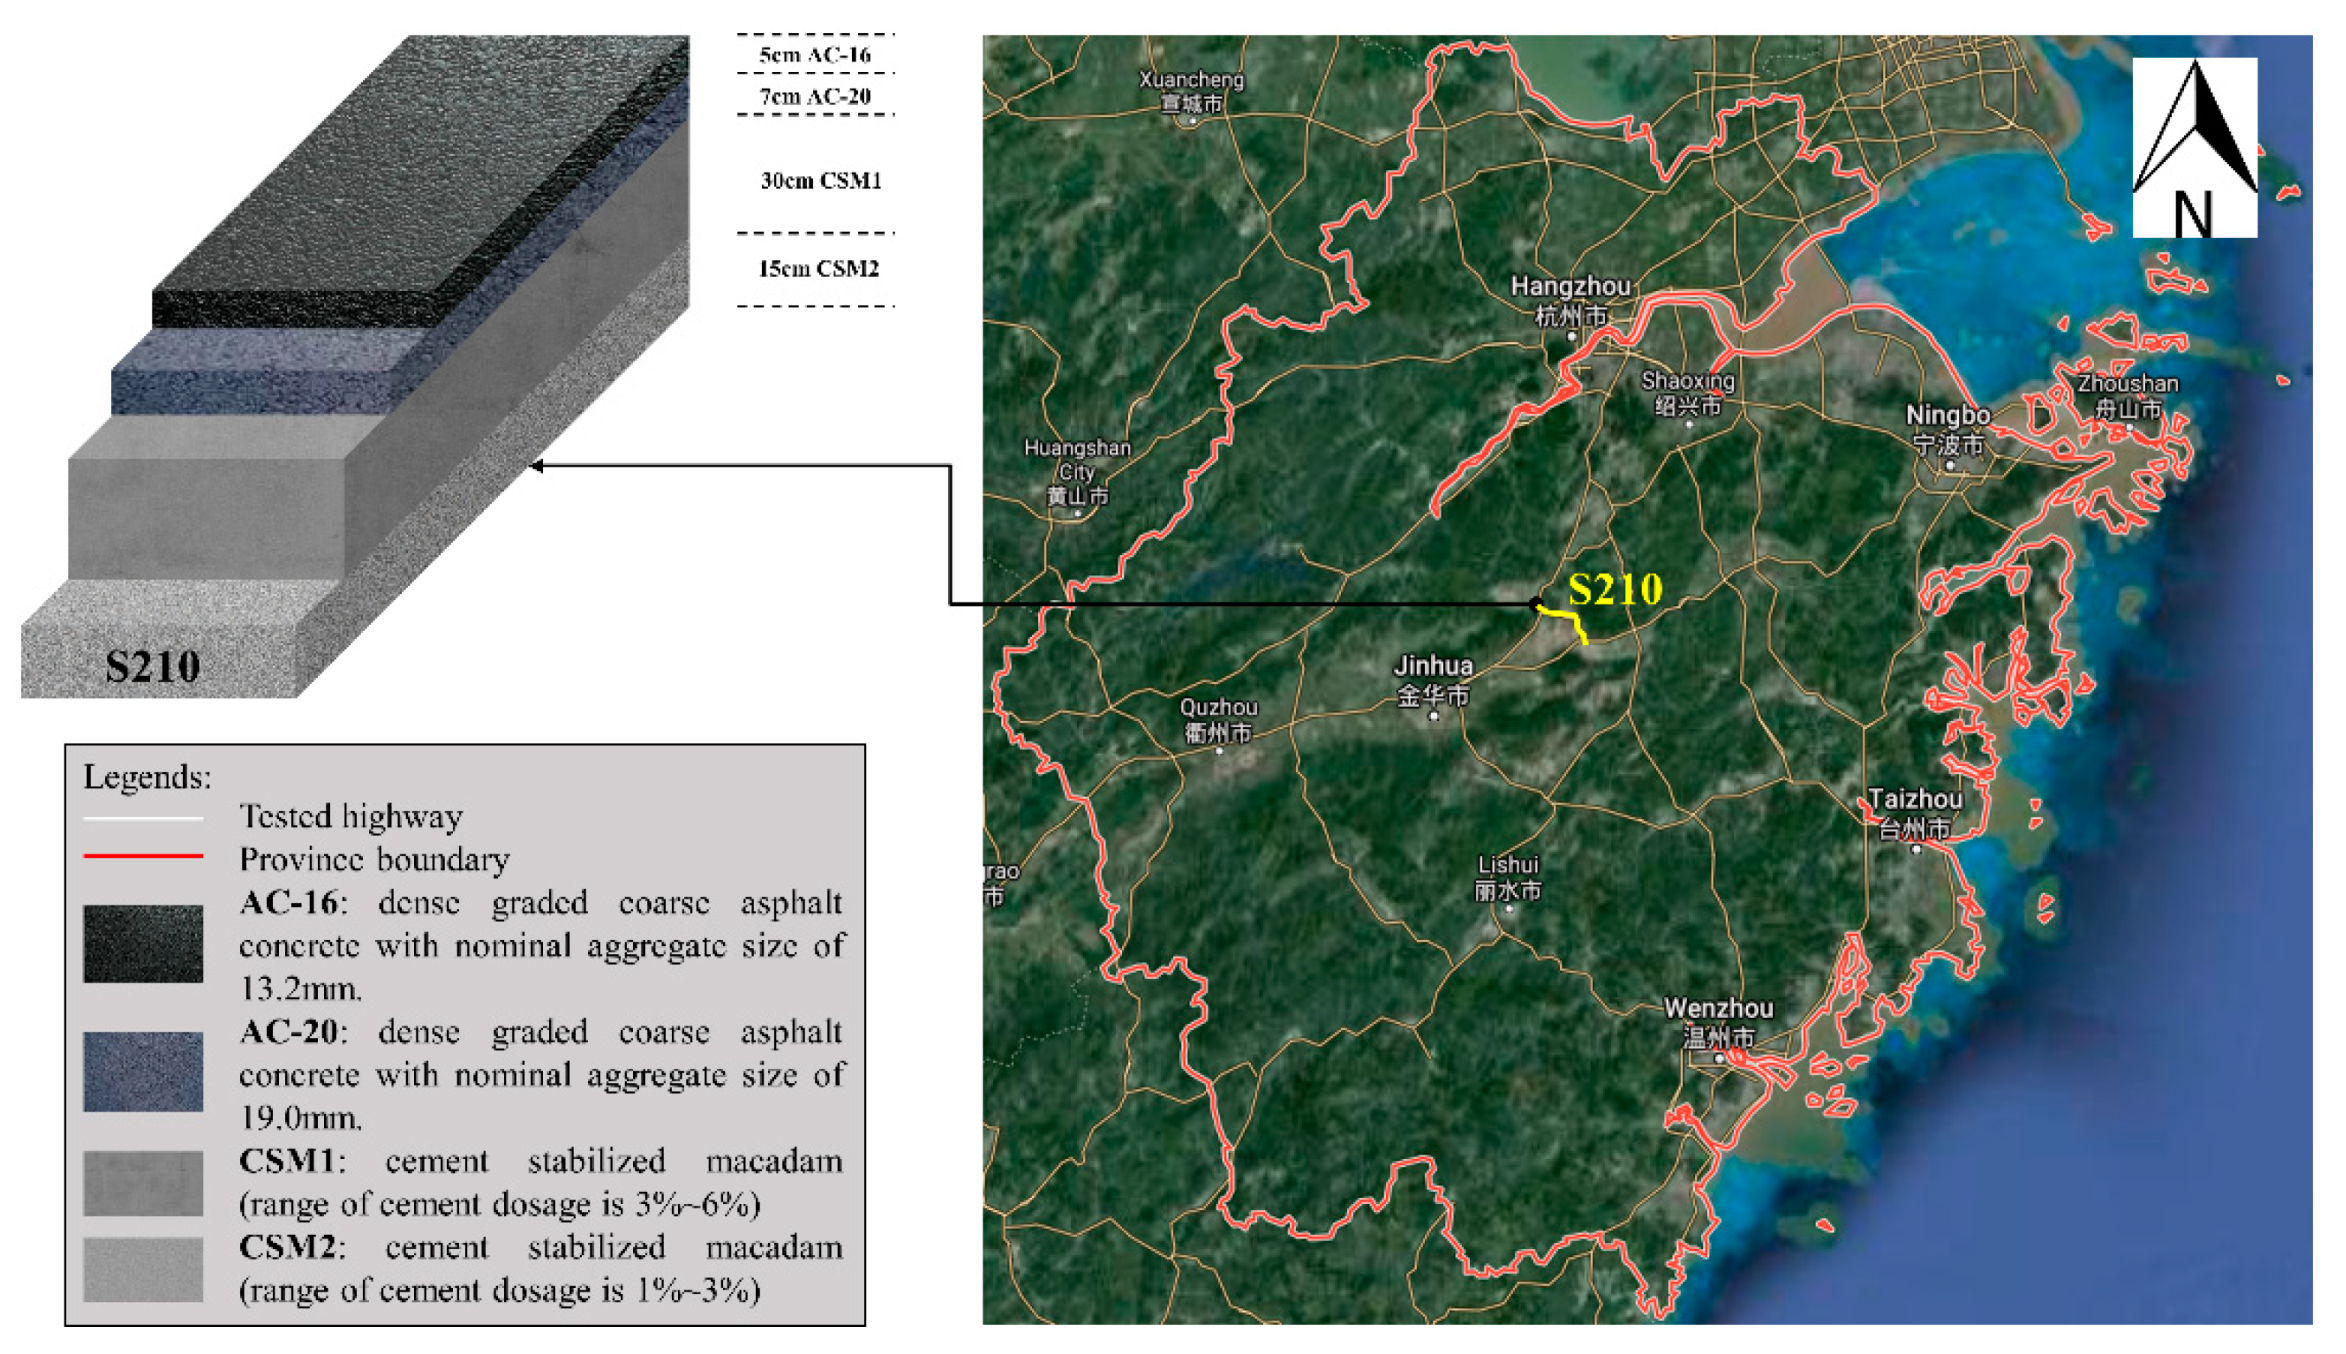
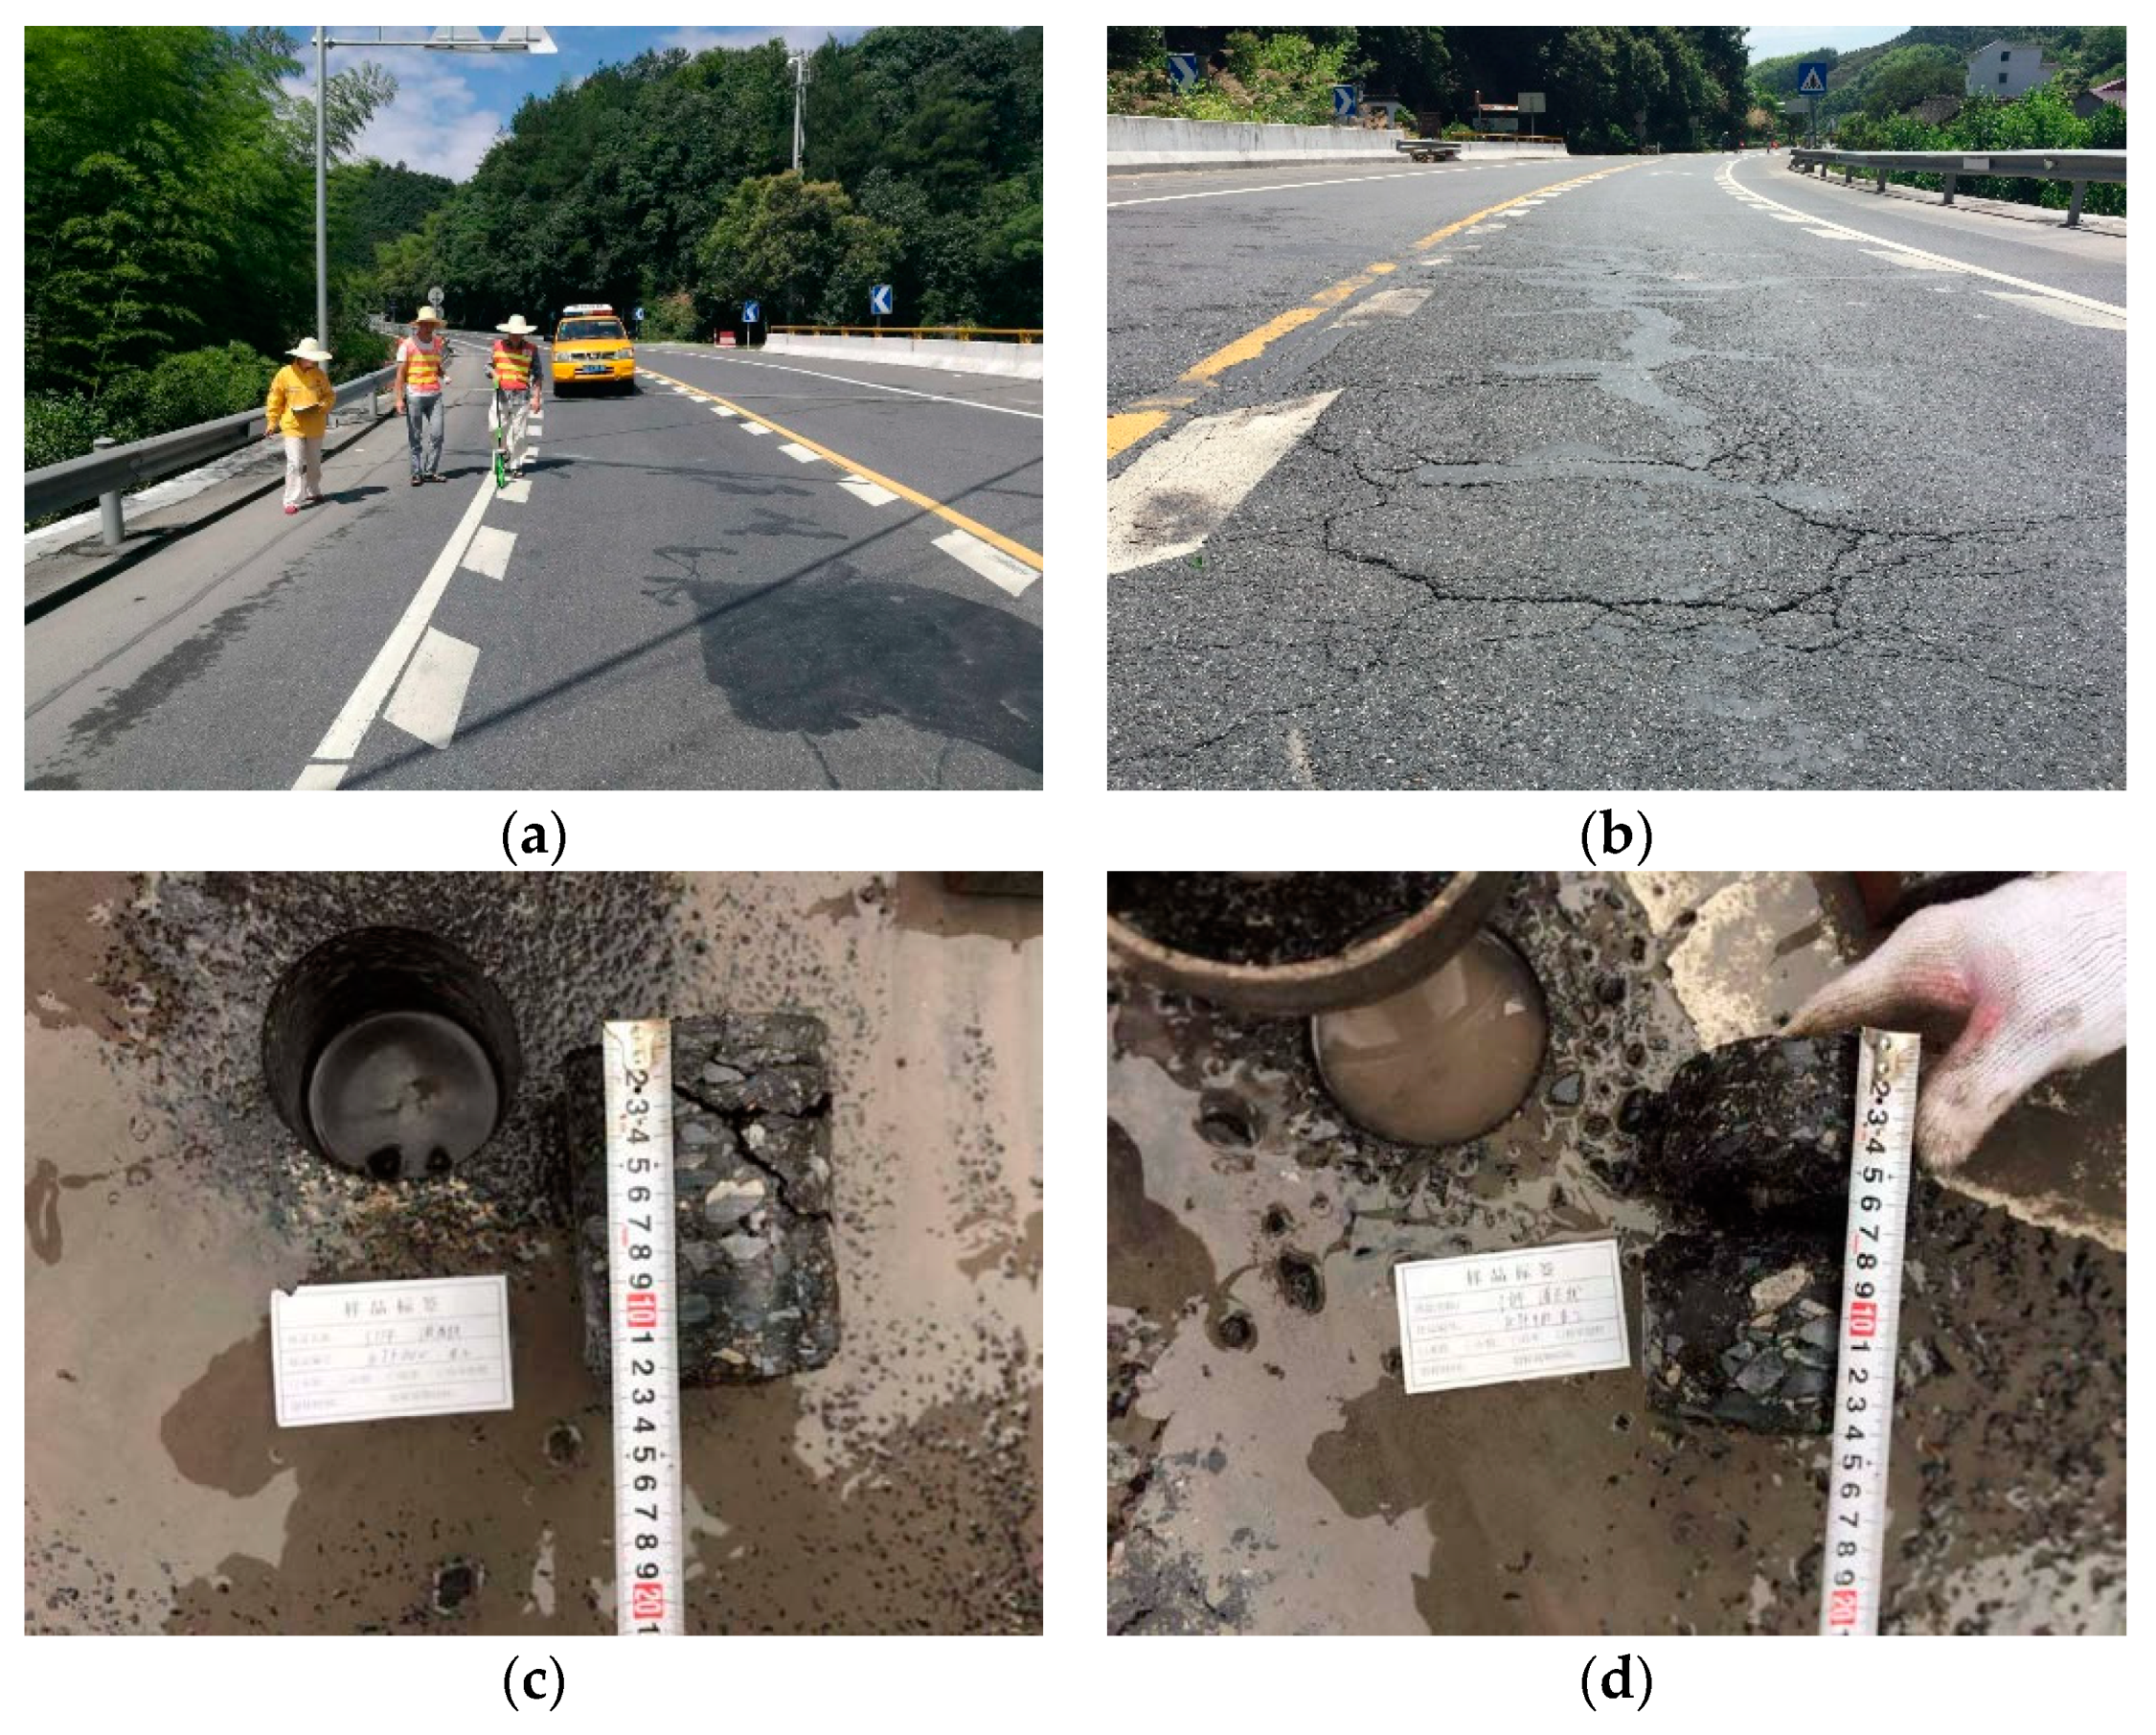
2.1. Tested Road Sections

Figure 2 shows the tested provincial road sections, which are called the Tonglu-Yiwu (TY) line (S210) and are located in Zhejiang province, China. Traditional and GPR inspection were implemented on this asphalt pavement from K46+000 to K51+000 and had a total length of 5 km. The structure layers, materials, and position of the tested road are indicated below.

2.2. Testing Process and Results

As shown in Figure 3, visual surveying and measurement were adopted by testing personnel to determine the damage condition of the pavement, and an inspection van was used to survey the surface roughness and skidding resistance of the pavement. Moreover, a coring survey was taken to obtain an accurate thickness of the asphalt pavement according to the highway performance assessment standards (JTG 5210-2018) and the specifications for maintenance design of highway asphalt pavement (JTG 5421-2019), which was enacted by the Ministry of Transport of the People’s Republic of China.
After these detections and observations, the results of the pavement defects investigation are shown in Table 1.

3. Nondestructive Testing of Pavement Based on GPR

3D GPR is a new type of nondestructive testing equipment, and its testing work will not damage the pavement. 3D GPR emits penetrating high-frequency electromagnetic waves to the pavement structure through the fixed distance transmitting antenna and receives the directional reflection signals by the paired receiving antenna. Then, through data processing and analysis of the radar host, the 3D detection information of the pavement structure is reconstructed in the computer.

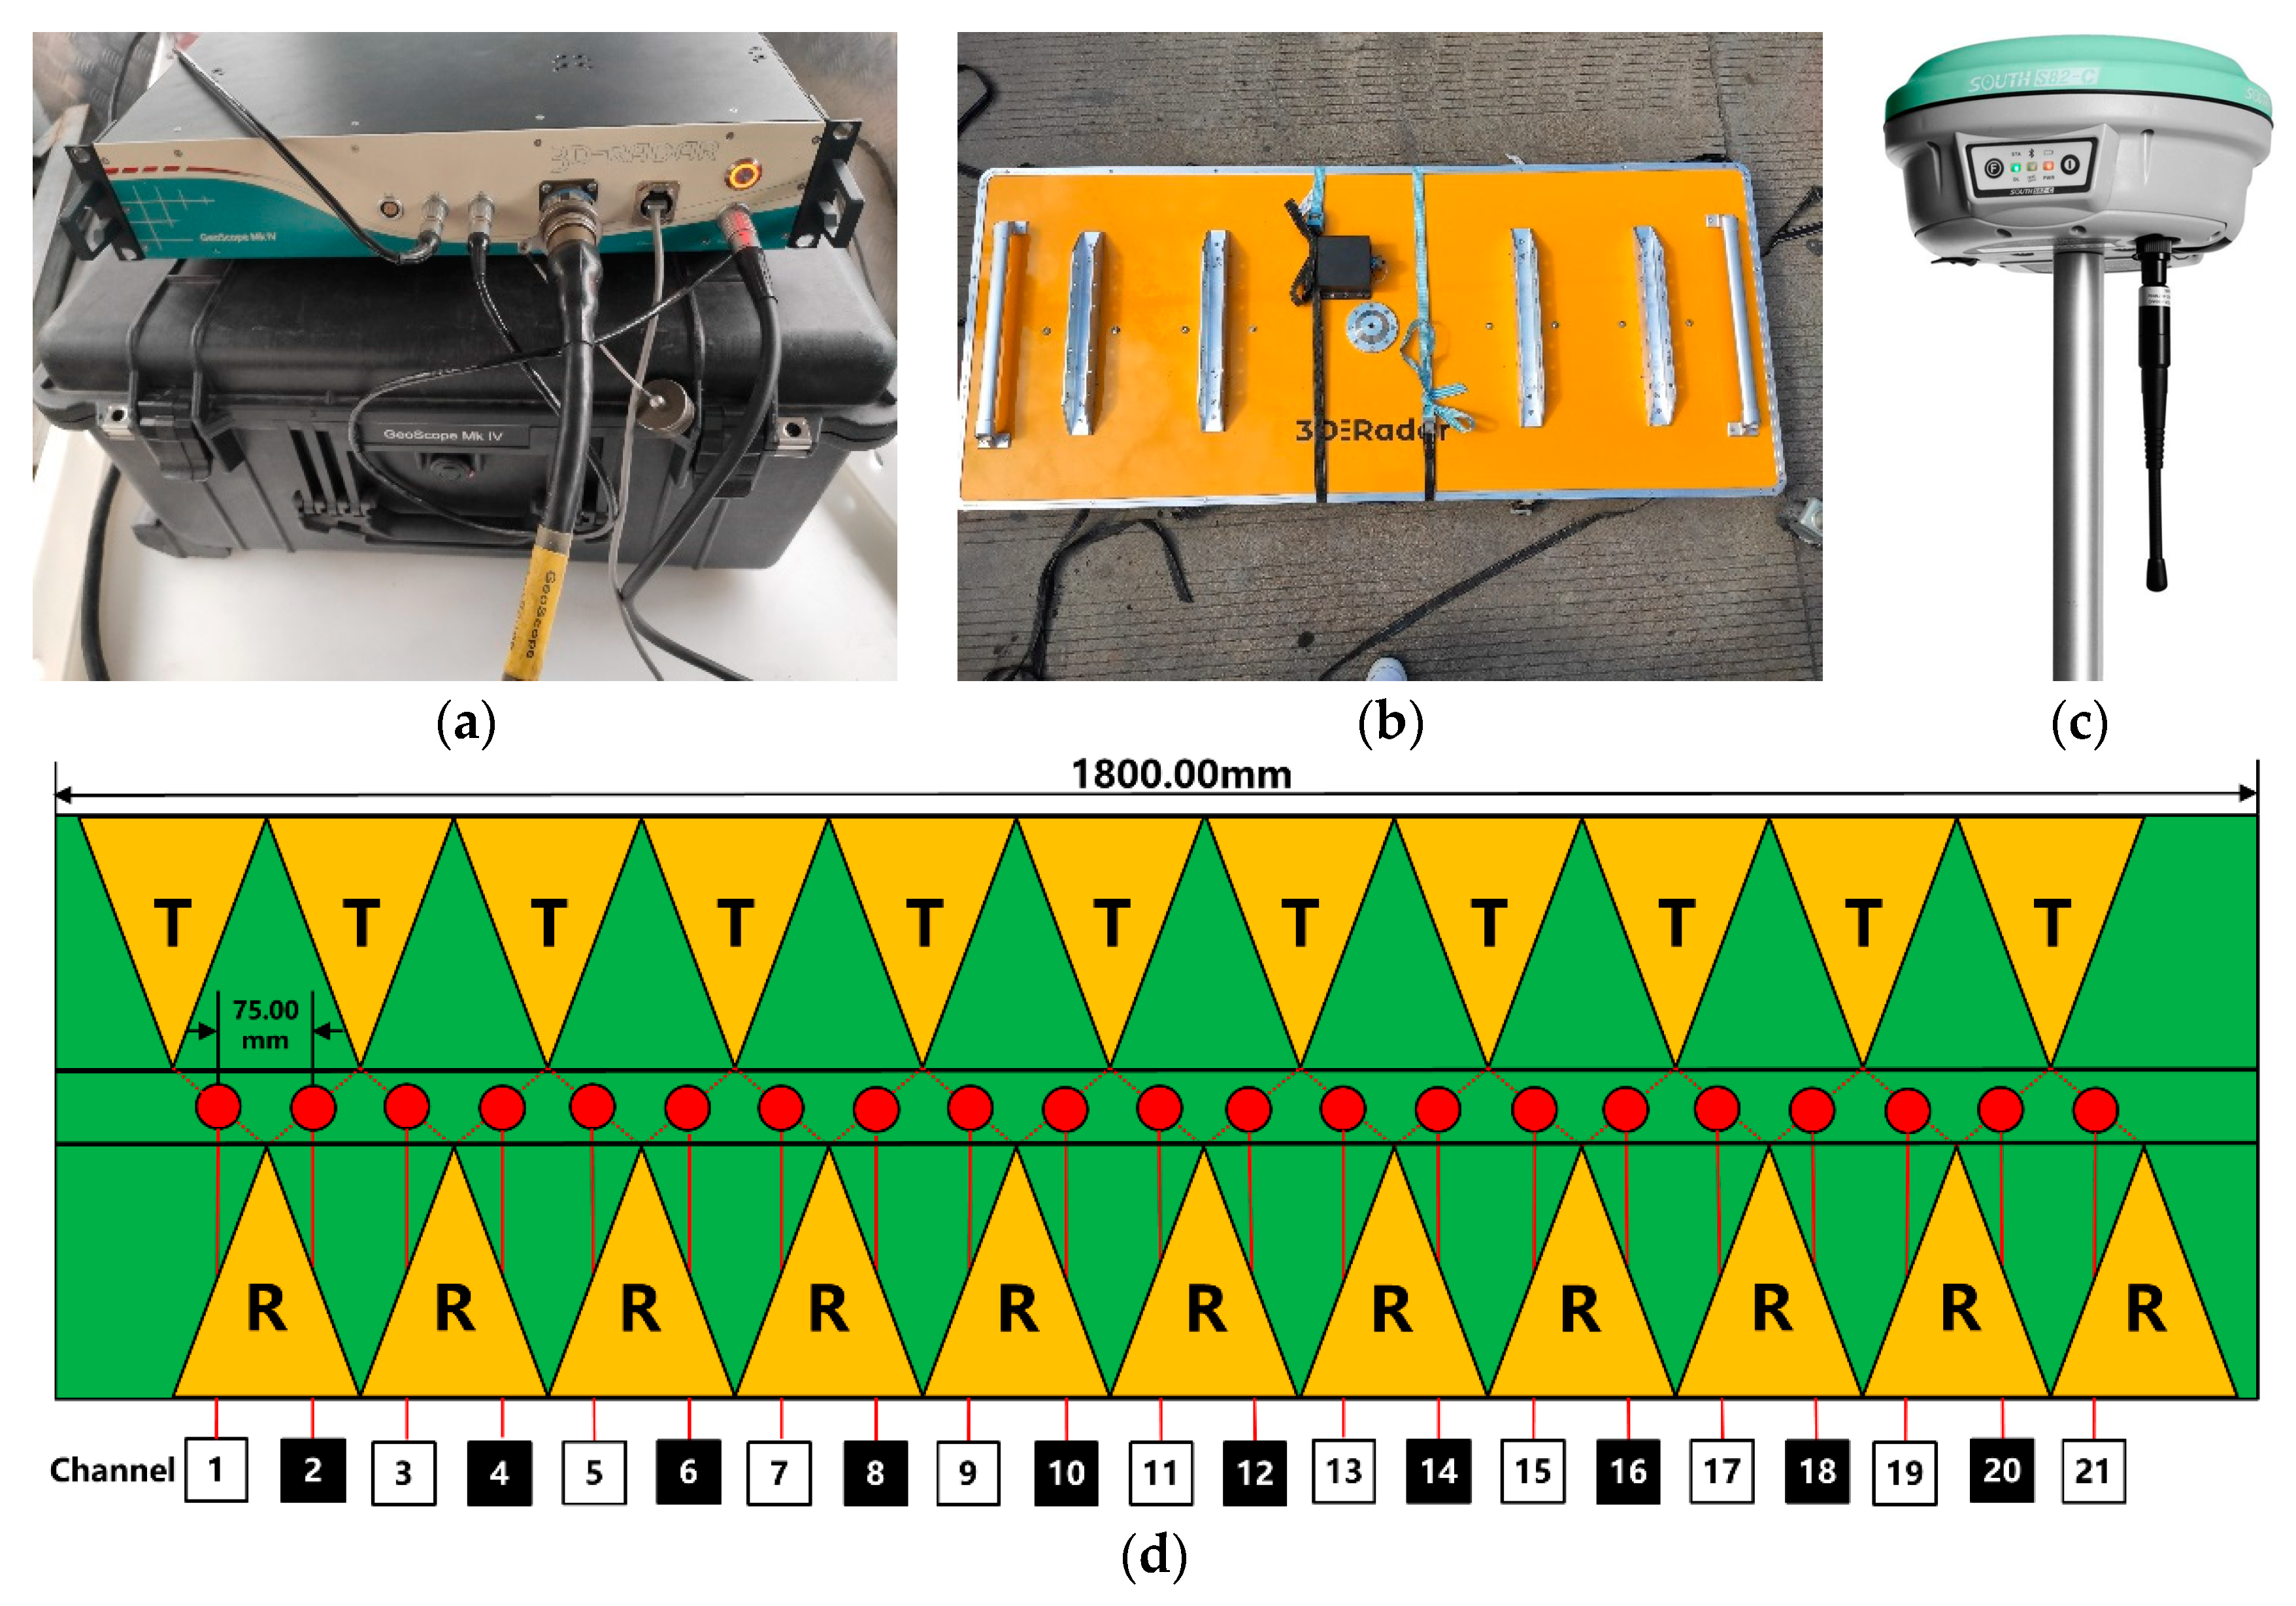
3.1. Testing Equipment
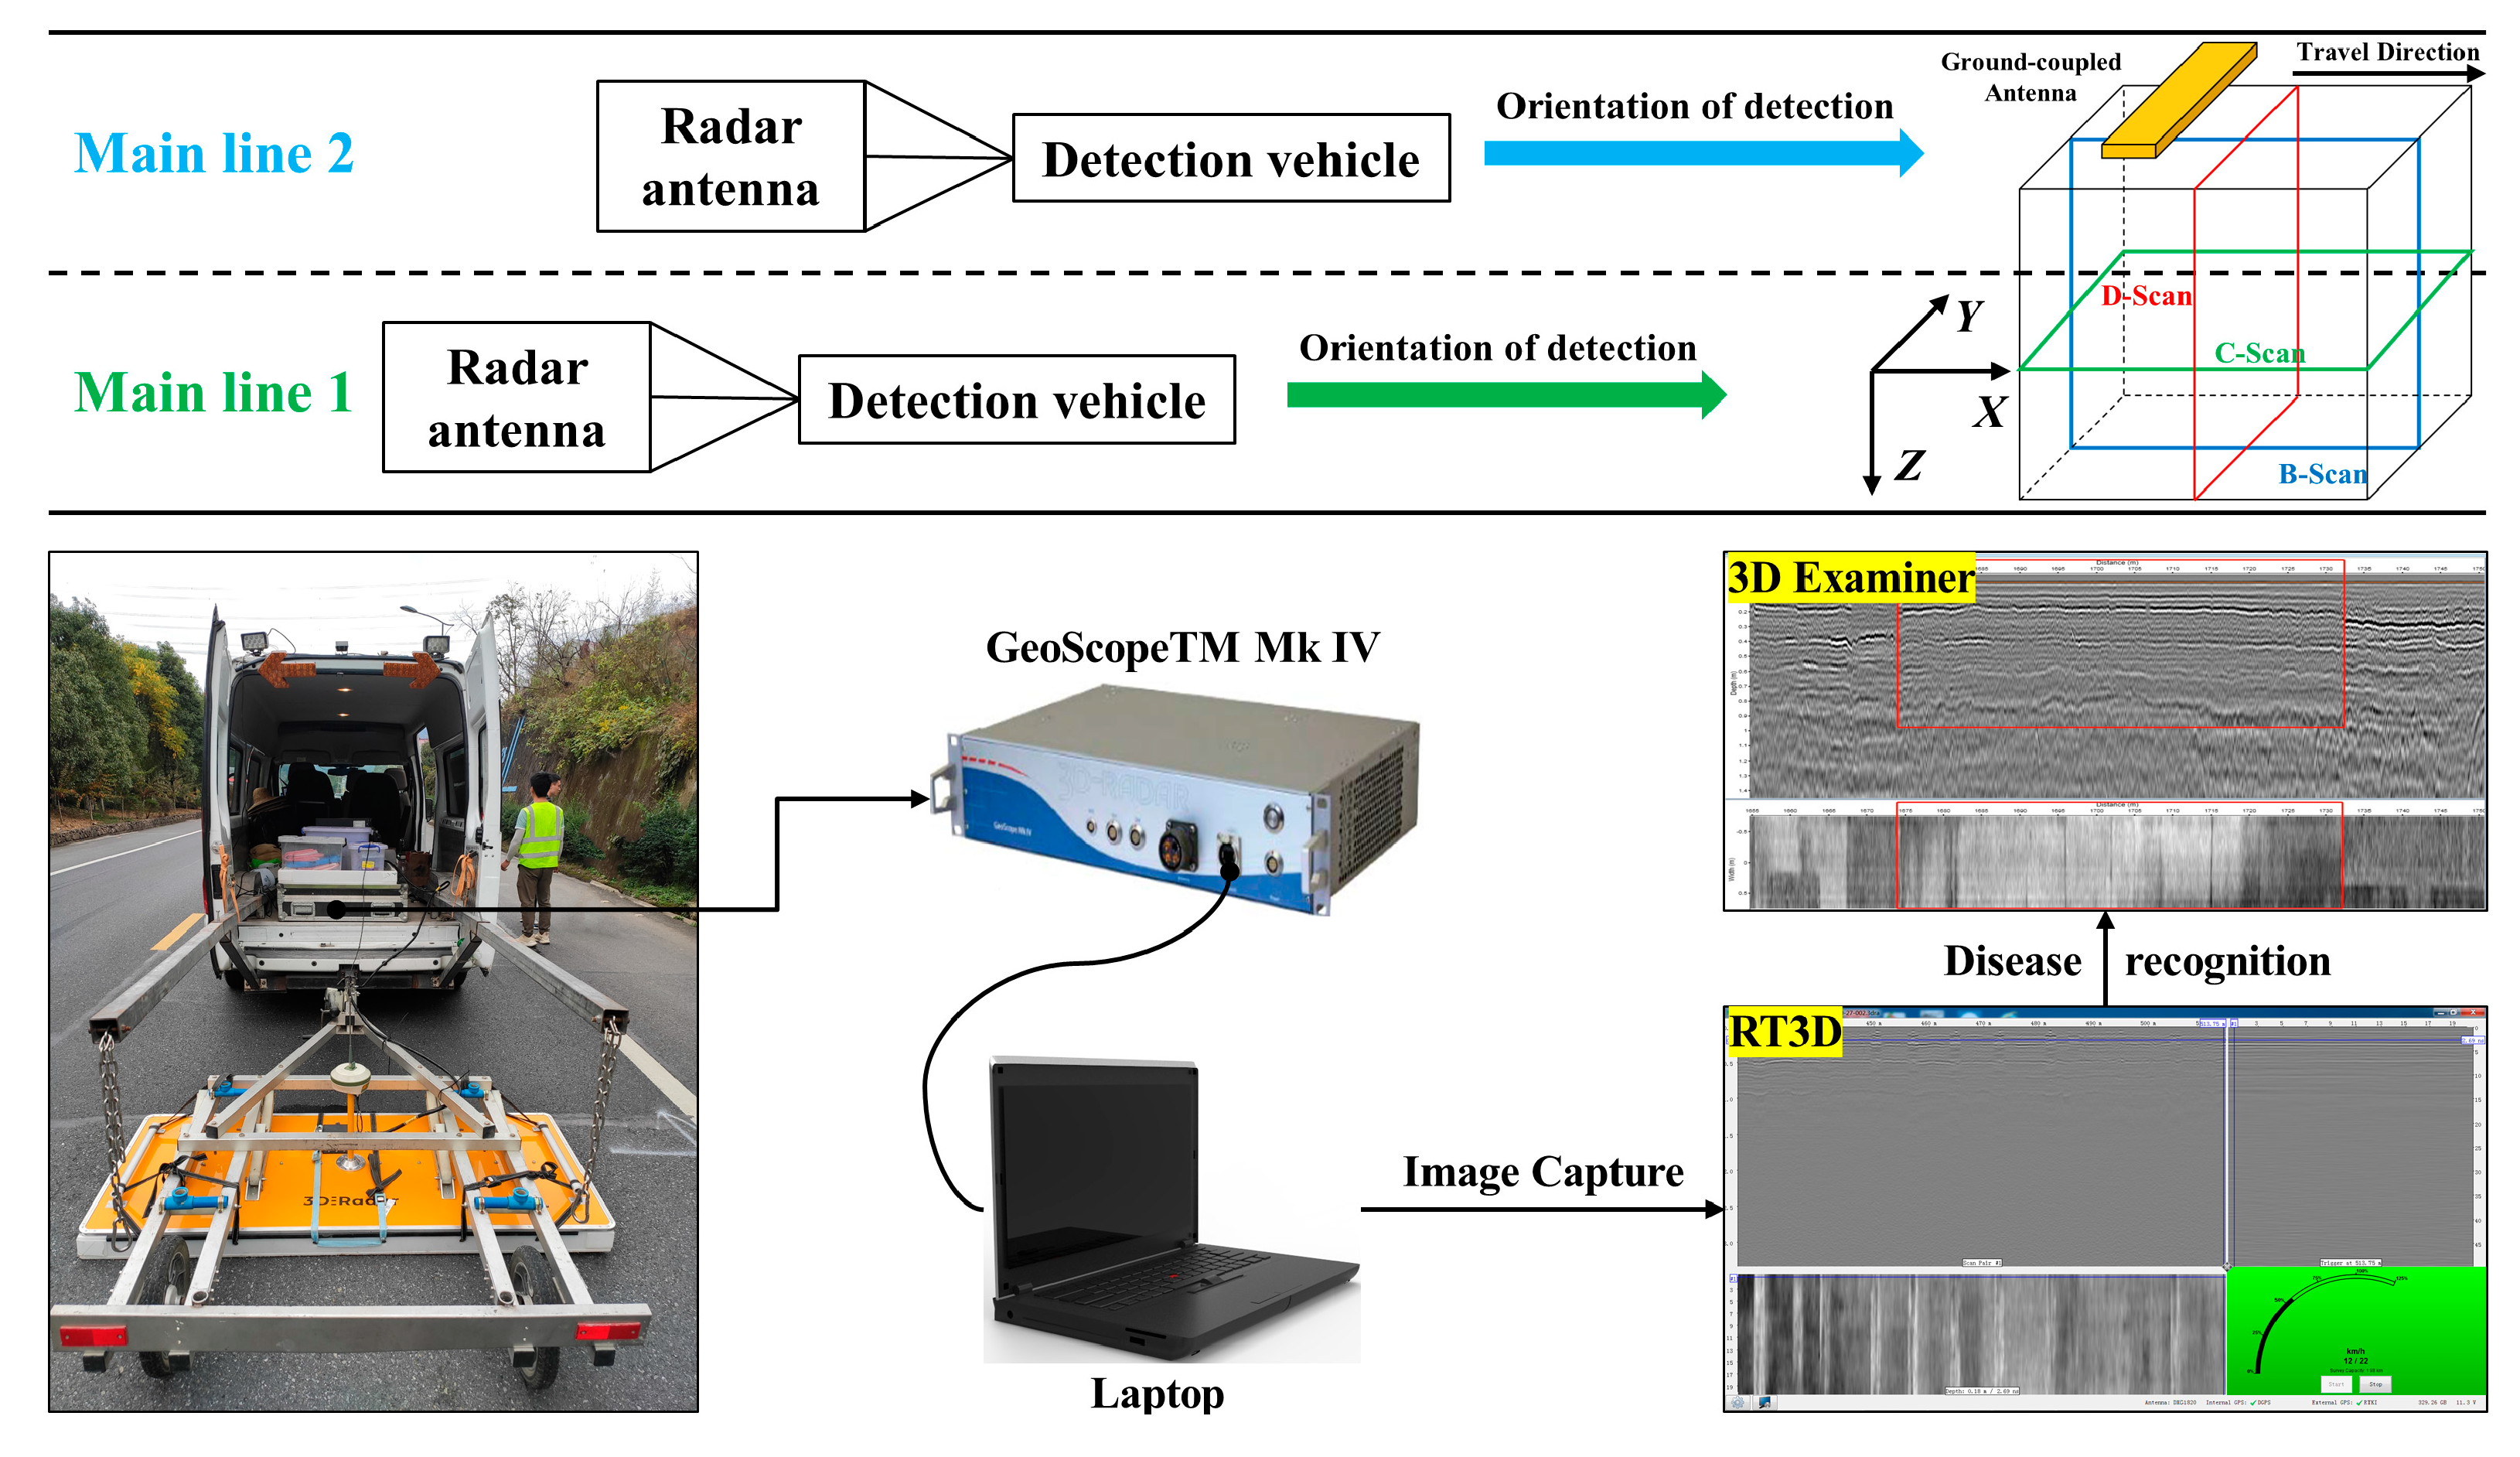
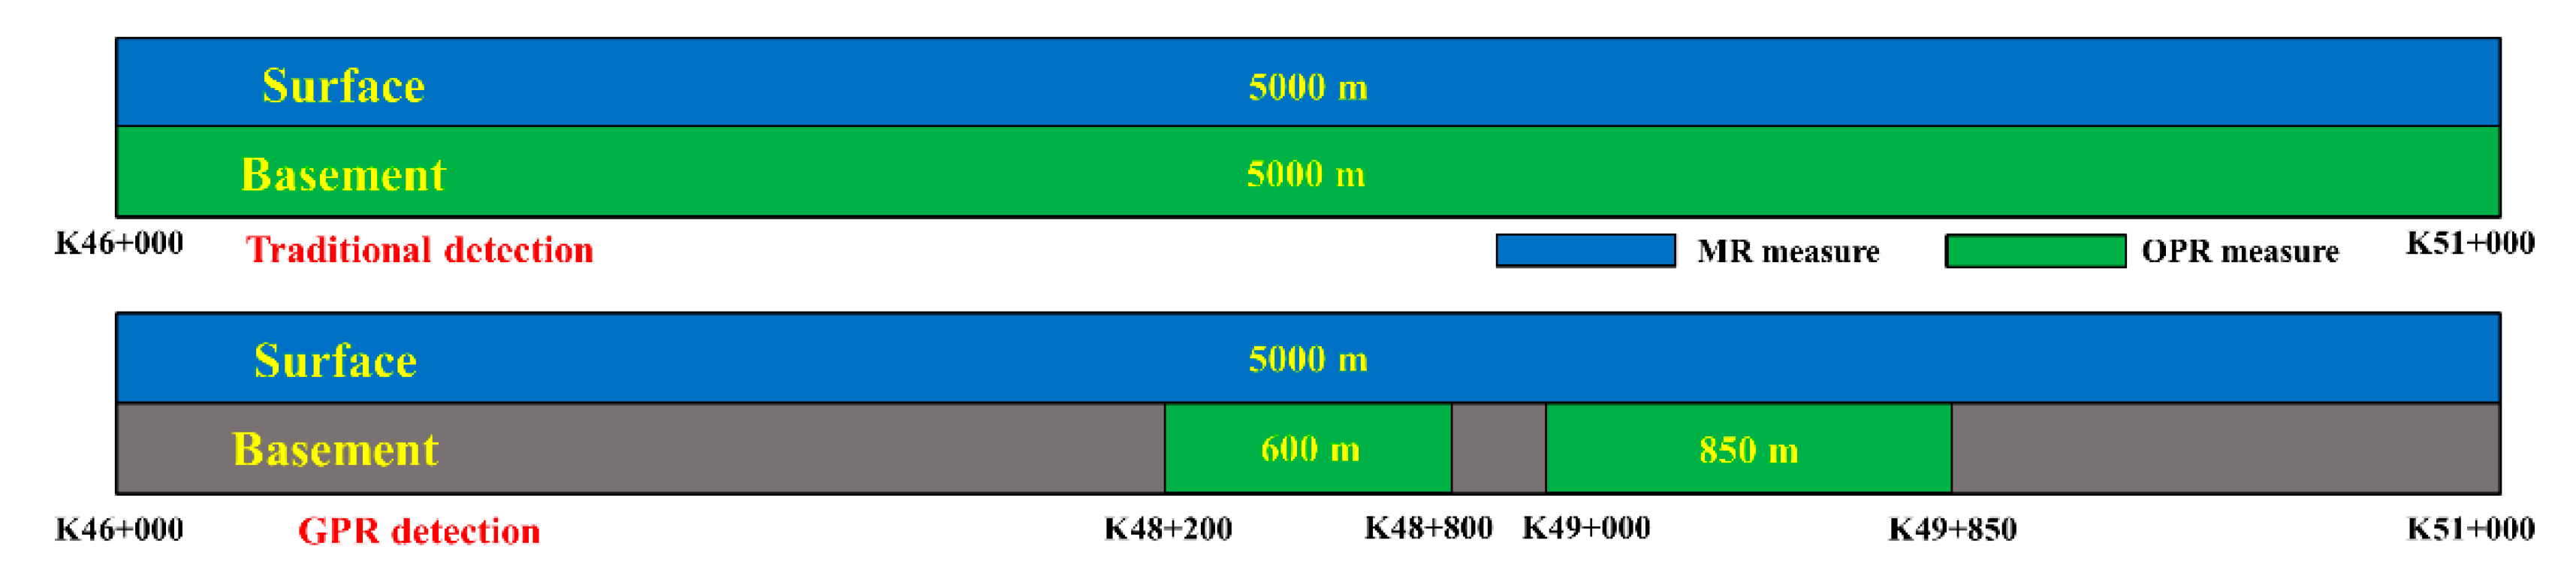
The 3D GPR system (3d-Radar Company, Trondheim, Norway) was used to inspect the internal damage of the road, which substantially reduced the misjudgment rate of interior conditions due to 2D imaging. The radar host of GeoScopeTM MKIV (Figure 4a), multi-channel DXGTM 1820 ground-coupled antenna arrays (Figure 4b), ExaminerTM 3 data analysis software, and GPS-RTK equipment (Figure 4c) was included in the 3D GPR system. GeoScopeTM MKIV enables high-density, high-speed data acquisition while combining deeper detection capabilities with high resolution. By optimizing the signal bandwidth and the best possible resolution, high-speed surveying and a large scan width can be realized without losing the image details for the study of different depth layers underground. The multi-channel DXGTM 1820 ground-coupled antenna arrays have the advantage of high resolution that can collect 3D GPR data from up to 41 survey lines in a single pass in a continuous frequency range of 200 MHz to 3 GHz. In addition, the road conditions are detected from the surface of the road to a depth of 3 m by this DXGTM antenna, which is well-suited for the detection requirements of highway subgrade and pavement.
Combined with the unique ability of the stepped-frequency radar host GeoScopeTM MKIV and VX series antennas to collect 3D radar data with a certain scan line density, the real 3D radar data processing is realized. As shown in Figure 4d, these antenna arrays combine different transmitting/receiving antenna pairs, allowing the user to collect multiple channels of data at once. By setting up, the user can collect data in a 7.5 cm × 7.5 cm grid (cover 1.5 m scanning) to obtain a true 3D image. The remaining technical parameters are shown in Table 2.

3.2. Testing Scheme

3D GPR was adopted in this research to realize a full scan covering the road cross-section of the TY line (S210). According to the stake number, horizon, area, volume and width of the characteristic signal of internal road defects, and the details of some typical defects were detected, including subsidence of internal road structure (position, the maximum height difference, and area), bad interlayer bonding (position and area), general transverse cracking (position and length), general longitudinal cracking (position and length), penetrating cracking (position and length), water-rich zones (position and area), void zones (position and volume), and relaxing zones (position and degree). The information of the tested road section is shown in Table 3.
As shown in Figure 5, the 3D GPR detection was conducted lane by lane and covered all the lanes. Some vehicles were arranged to follow the inspection van during the detection process by the proprietor, which assured the security of detection personnel and equipment. Under suitable conditions, the detection process should be closed to traffic based on the Safety Work Rules for Highway Maintenance, JTG H30-2015 (Ministry of Transport of the People’s Republic of China).

3.3. Data Processing

The construction of a deep, learning-based road internal defect identification model requires a 3D GPR image dataset to provide the training set, verification, and testing required for model construction. This process was conducted by taking the steps in Figure 6.

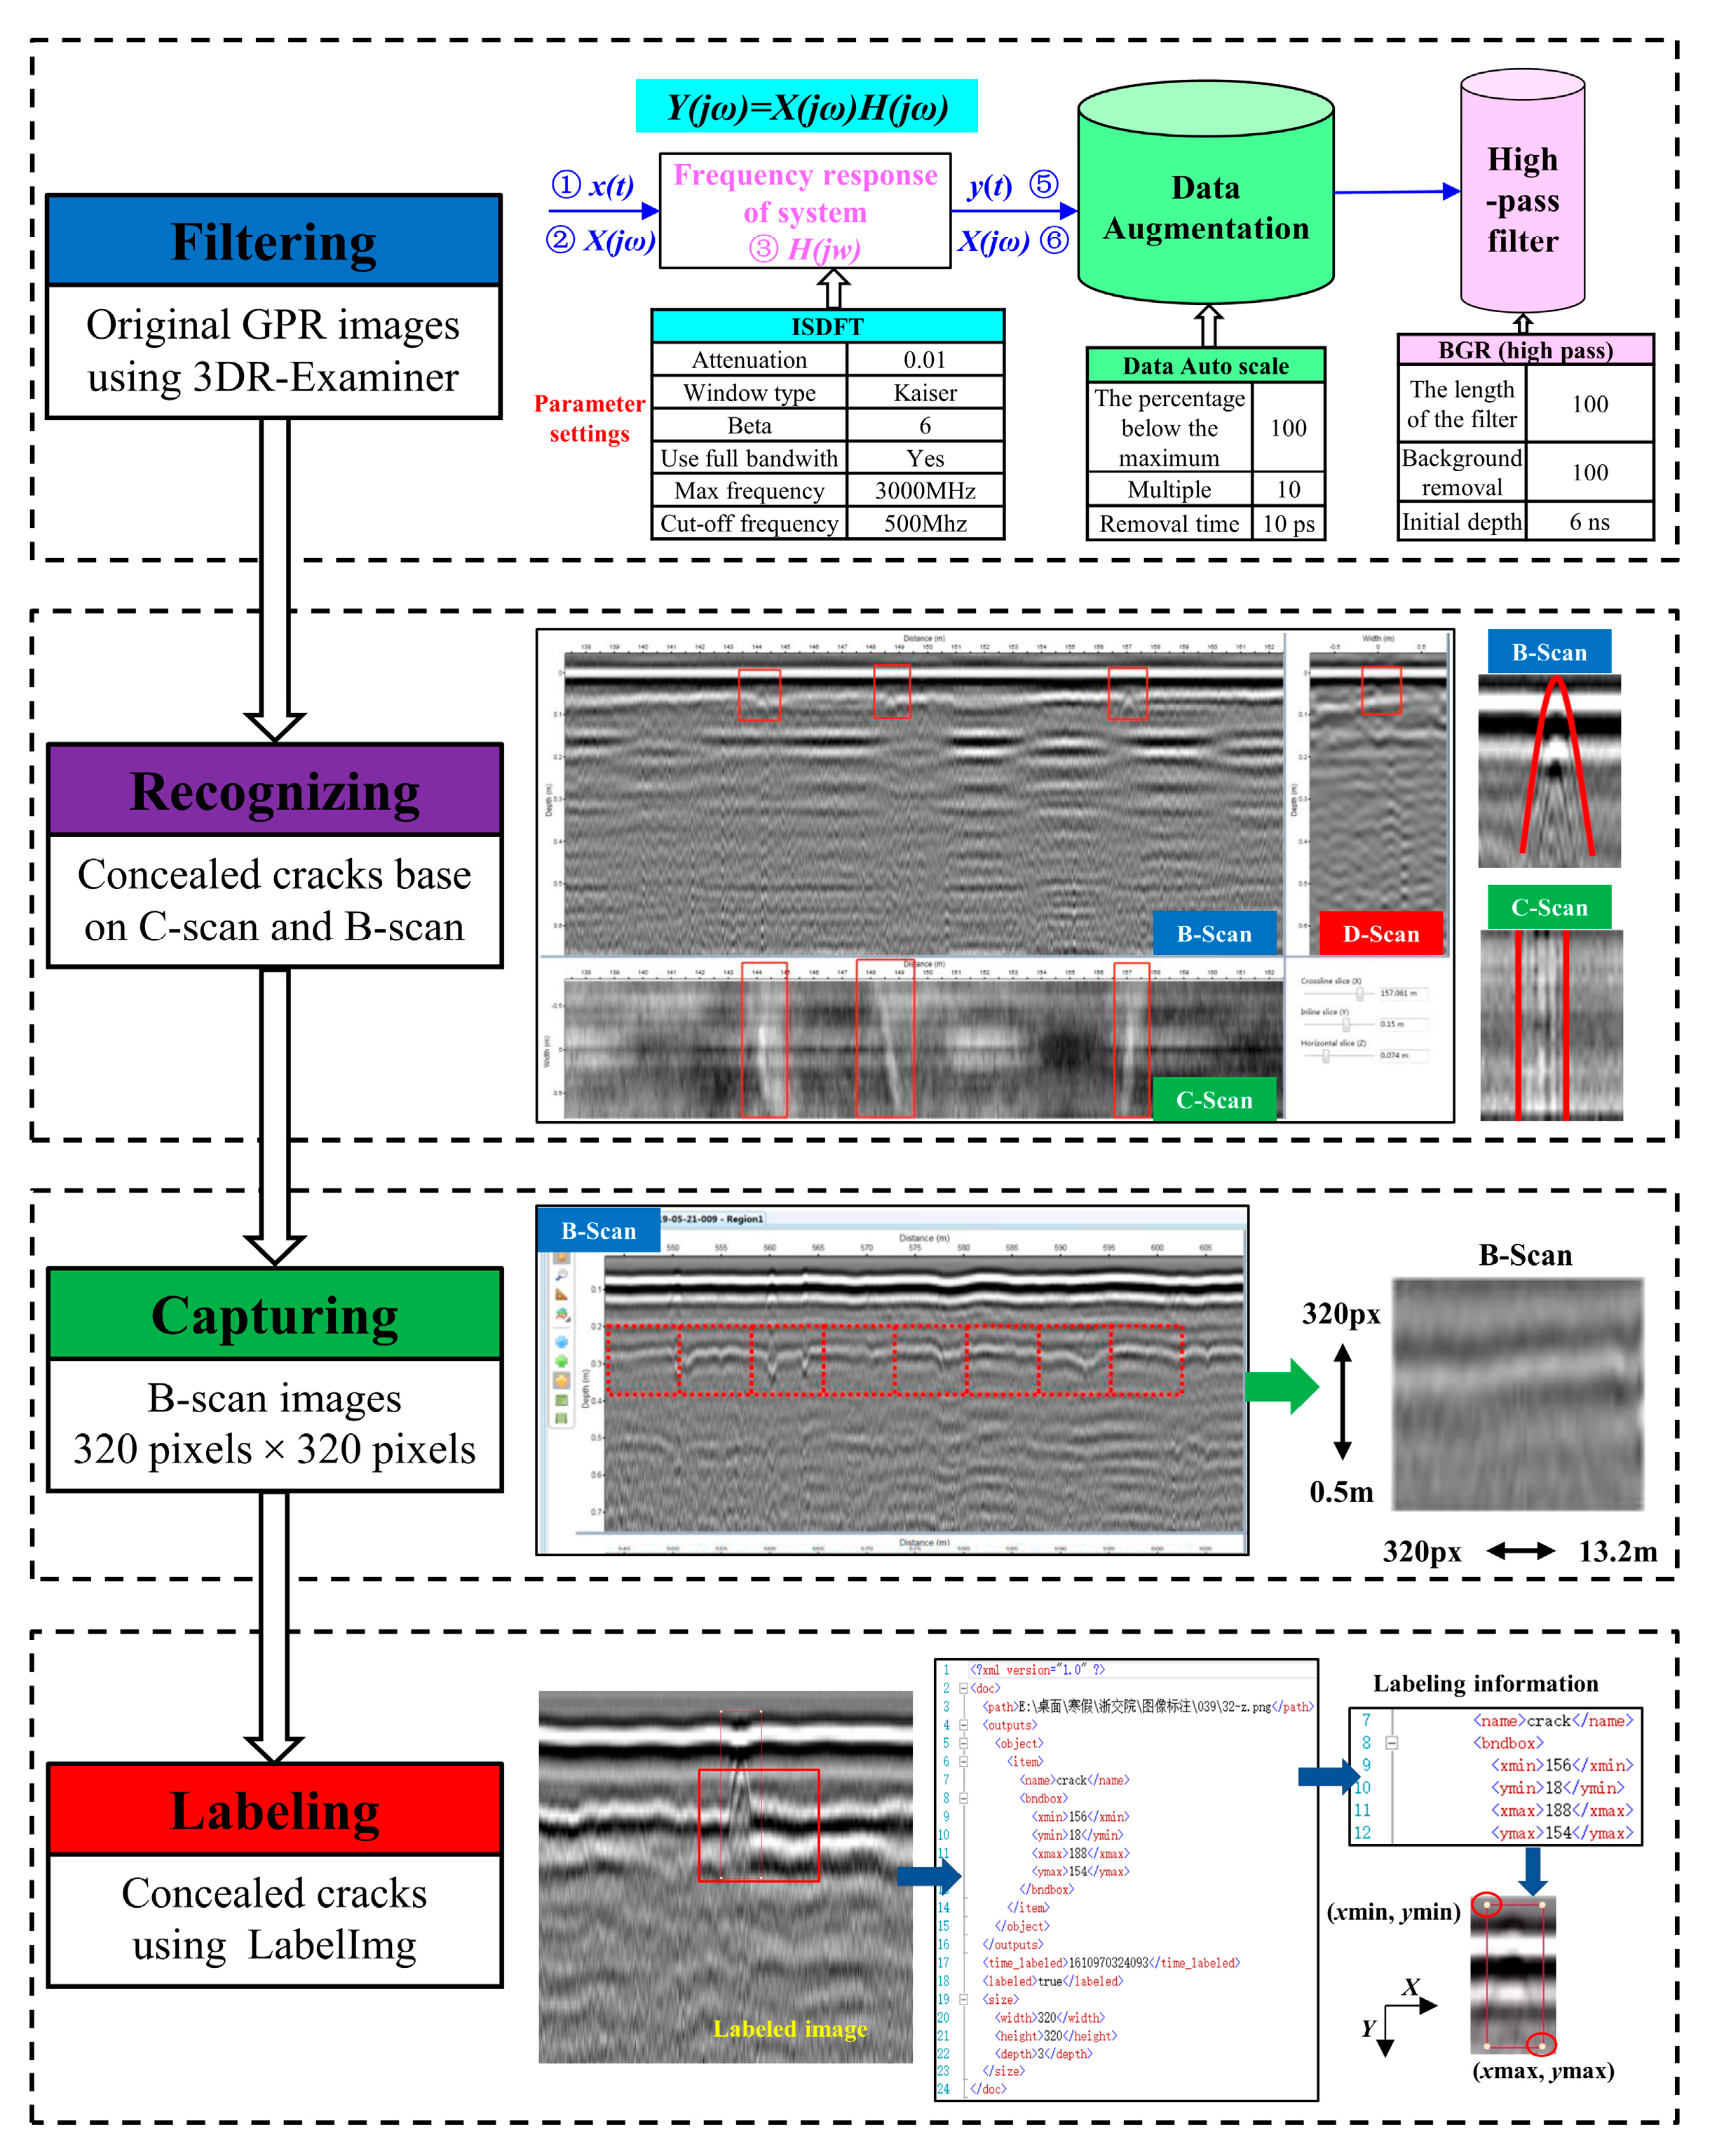
3.3.1. Filtering for GPR Data

After the GPR data acquisition, the augmentation and filtering of these images were to be performed. Based on the GPR system data processing software (ExaminerTM 3), the inverse discrete Fourier transform (ISDFT), data autoscale, and background removal (BGR) (high pass) were used for data processing. The specific settings of the filtering parameters are shown in Figure 6.

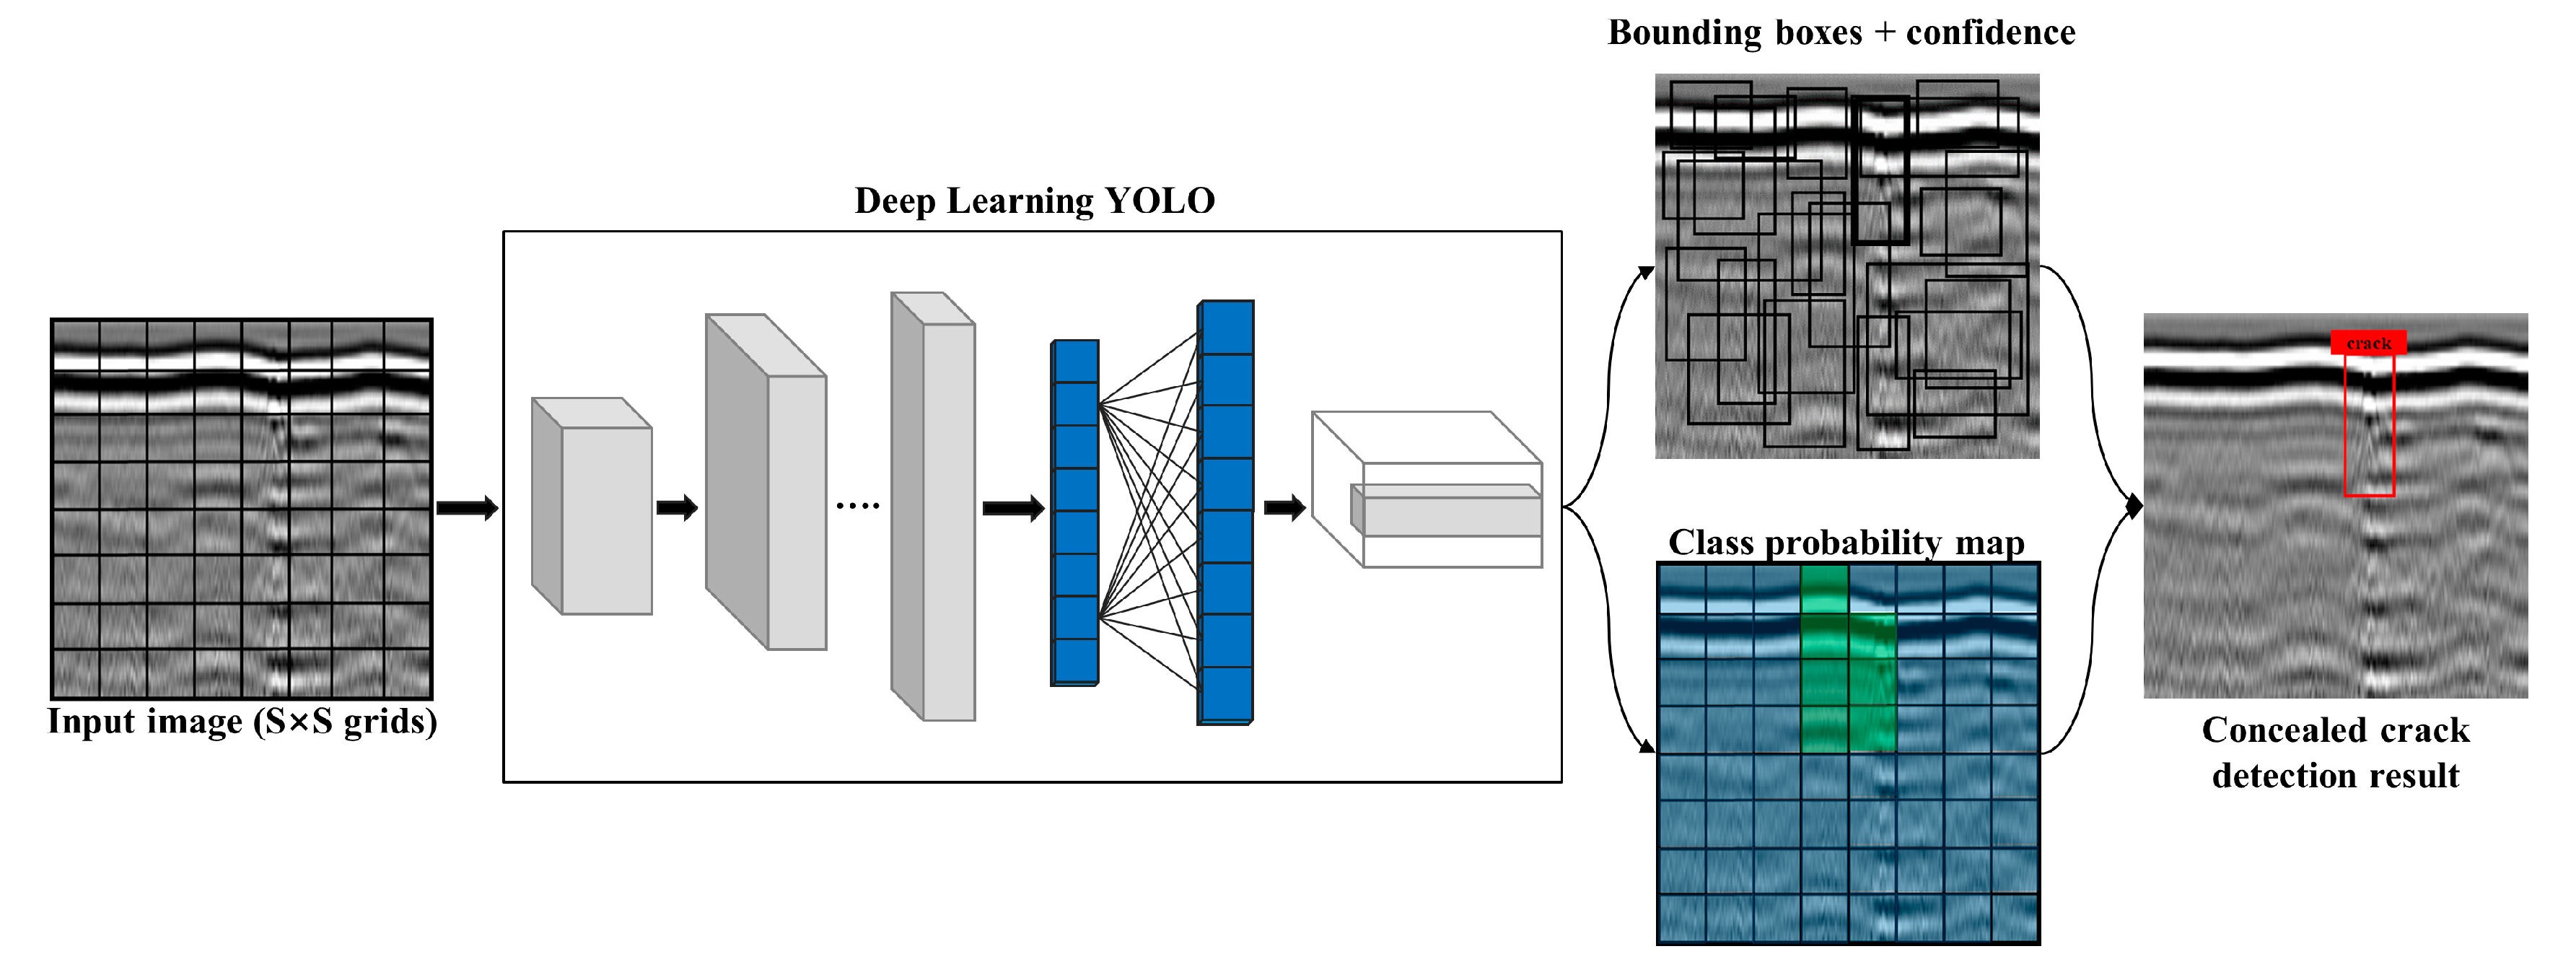
3.3.2. Recognizing for GPR Data

Cracking, void, and settlement are the three main defects to be classified and identified in this research. However, the settlement defect was not included in the identification model because the scale of settlement is much larger than the other two defects, and its characteristics are distinctive. Therefore, according to Technical Guideline for Ground Penetrating Radar Detection for Internal Conditions of Highway Asphalt Pavement promulgated by China Highway and Transportation Society, the basis for judgement of cracking and void was determined by summarizing the features of the B-scan and C-scan of these two defects in Table 4.

3.3.3. Capturing for GPR Data

The B-scan images were chosen as the input images because they could reflect the most basic features of internal defects and the exact location through GPR. In addition, the images have a high identifiability degree, which is easier to recognize. The resolution of the captured images was 320 × 320 pixels, and the real size for the B-scan was 0.5 m × 13.2 m.

3.3.4. Labeling for GPR Data

LabelImg labeling software [37] was used to mark hidden cracking in the captured images. Based on the identification method of 3.3.2 (the void defect was manually identified because the number of samples was too small), the hyperbolic reflection wave in B-scan and the long strip in C-scan were used to mark the hidden cracking with rectangular boxes.
Then, the corresponding annotation information for the box was stored in an XML-formatted file, as shown in the bottom of Figure 6. The marking information includes the coordinates of two points on the diagonal line of the rectangular box, which can reflect the location and size of the selected cracking.
Next, according to the number of captured images in our early research, 350 sample images were labeled, and the total number of concealed cracks was 1400. Afterwards, these samples were assigned to three groups randomly in a certain ratio as follows: the training model’s dataset (263 images and 1134 cracks), the verifying model’s validation set (44 images and 135 cracks), and the evaluating model’s test set (43 images and 131 cracks).

3.4. Testing Results

The workflow for the detection method of the YOLO models is shown in Figure 7. YOLOv3 is well known for having the most advanced one-stage detection networks. Although the updated version YOLOv5 uses new peculiarities to increase the detection efficiency, YOLOv5 and YOLOv3 still have a similar detection principle and network architecture. In brief, the latest technology has been used in YOLOv5 to update YOLOv3 in terms of Backbone and Neck. In parallel, skills are also added. Detailed information is shown in Table 5.
Figure 7 describes the detection workflow for the YOLO models of this research. The operations of our works were based on Python 3.7, PyTorch 1.4 in Windows 10. The model trainings were performed by a computer equipped with the following features: an AMD Ryzen 5 2600X CPU and 16 GB of memory.
This study compared 6 models with 2 different kinds of versions, namely, YOLOv3, YOLOv3-tiny, YOLOv5s, YOLOv5m, YOLOv5l, and YOLOv5x [38]. YOLO-tiny was considered light YOLO to substantially increase the detection speed but brought accuracy loss. Note that the s, m, l, and x appended to YOLOv5 represent the increasing depth of the model.
YOLOv3 predicts an objectness score for each bounding box based on logistic regression. As for the loss of the bounding box regression, intersection over union (IoU) [39] is the most popular metric for calculating loss. YOLOv5 uses the same backbone of YOLOv3 and utilizes GIoU to estimate the bounding box loss. Besides, it also uses auto-learning bounding box anchors to adjust and optimize the choice of anchors.
The network has a relatively large number of parameters and a small dataset, which could result in overfitting. Therefore, transfer learning was adopted to train the models to overcome this hidden danger [40]. The COCO dataset includes over 500,000 image data points belonging to 80 different categories. Consequently, the pretrained weights by the COCO dataset were used to initialize the model to be trained. The other hyperparameters of the model were set as shown below: the initial learning rate was 0.001; the size of the batch and mini-batch were 16 and 4, respectively; the momentum and weight decay were 0.9 and 0.0005, respectively; the epoch was 300; and the other parameters were set to their default values.
As is shown in Figure 8, the loss and mAP curves of the YOLO models were compared. The value of loss represents the difference between the predicted value and true value. The smaller the value of loss, the better training effect. Moreover, the high mAP also denotes a great performance of the training models.
According to Figure 8a,b, the final converged loss value of YOLOv3 was approximately 2, whereas that of YOLOv5 was lower than 0.2, which suggested that the YOLOv5 model performed substantially better than YOLOv3 because the lower loss indicates better training effects. Moreover, all mAP values of YOLOv5 were higher than those of YOLOv3. Taken together, we concluded that the performance of the YOLOv5 models was superior.
The specific training results of the YOLOv3 and YOLOv5 models are summarized in Table 6. All mAP values of the YOLOv5m, YOLOv5l, and YOLOv5x models were higher than 90% (the highest value was 94.45%), which is commendable for the small training set. Another finding may be summarized as the higher the number of weights is, the higher the model’s mAP value will be, suggesting that an appropriate increase in model depth favored the enhancement of the training performance. However, with increasing weights, the frames per second (FPS) were reduced, while the inference time was prolonged. It is not difficult to find that the FPS of the YOLOv3 and YOLOv5 models were poorly differentiated when the values of the weights were similar. What needs illustration is that the model with faster inference speed was preferentially selected based on the requirements of rapid detection. Ultimately, the YOLOv5m model with the most even performance was used to detect internal defects in roads according to the integrated consideration of mAP and FPS.
Depending on the training results obtained via YOLOv5m, the statistical information of the defects is listed in Table 7 and Table 8 (the raveling and settlement were manually recognized).
A schematic of the position and size of the defects is plotted in Figure 9 based on the recognition results (the detailed analysis is in the following Section 4.1).

4. Discussion of Maintenance Benefits

4.1. Disease Characteristics and Analysis

4.1.1. Traditional Detection

The primary defect types of the tested road section are the dominant cracking and settlement on the road surface. The maintenance measures were conducted at the surface and basement of the tested road because of the unclear information of the internal defects.

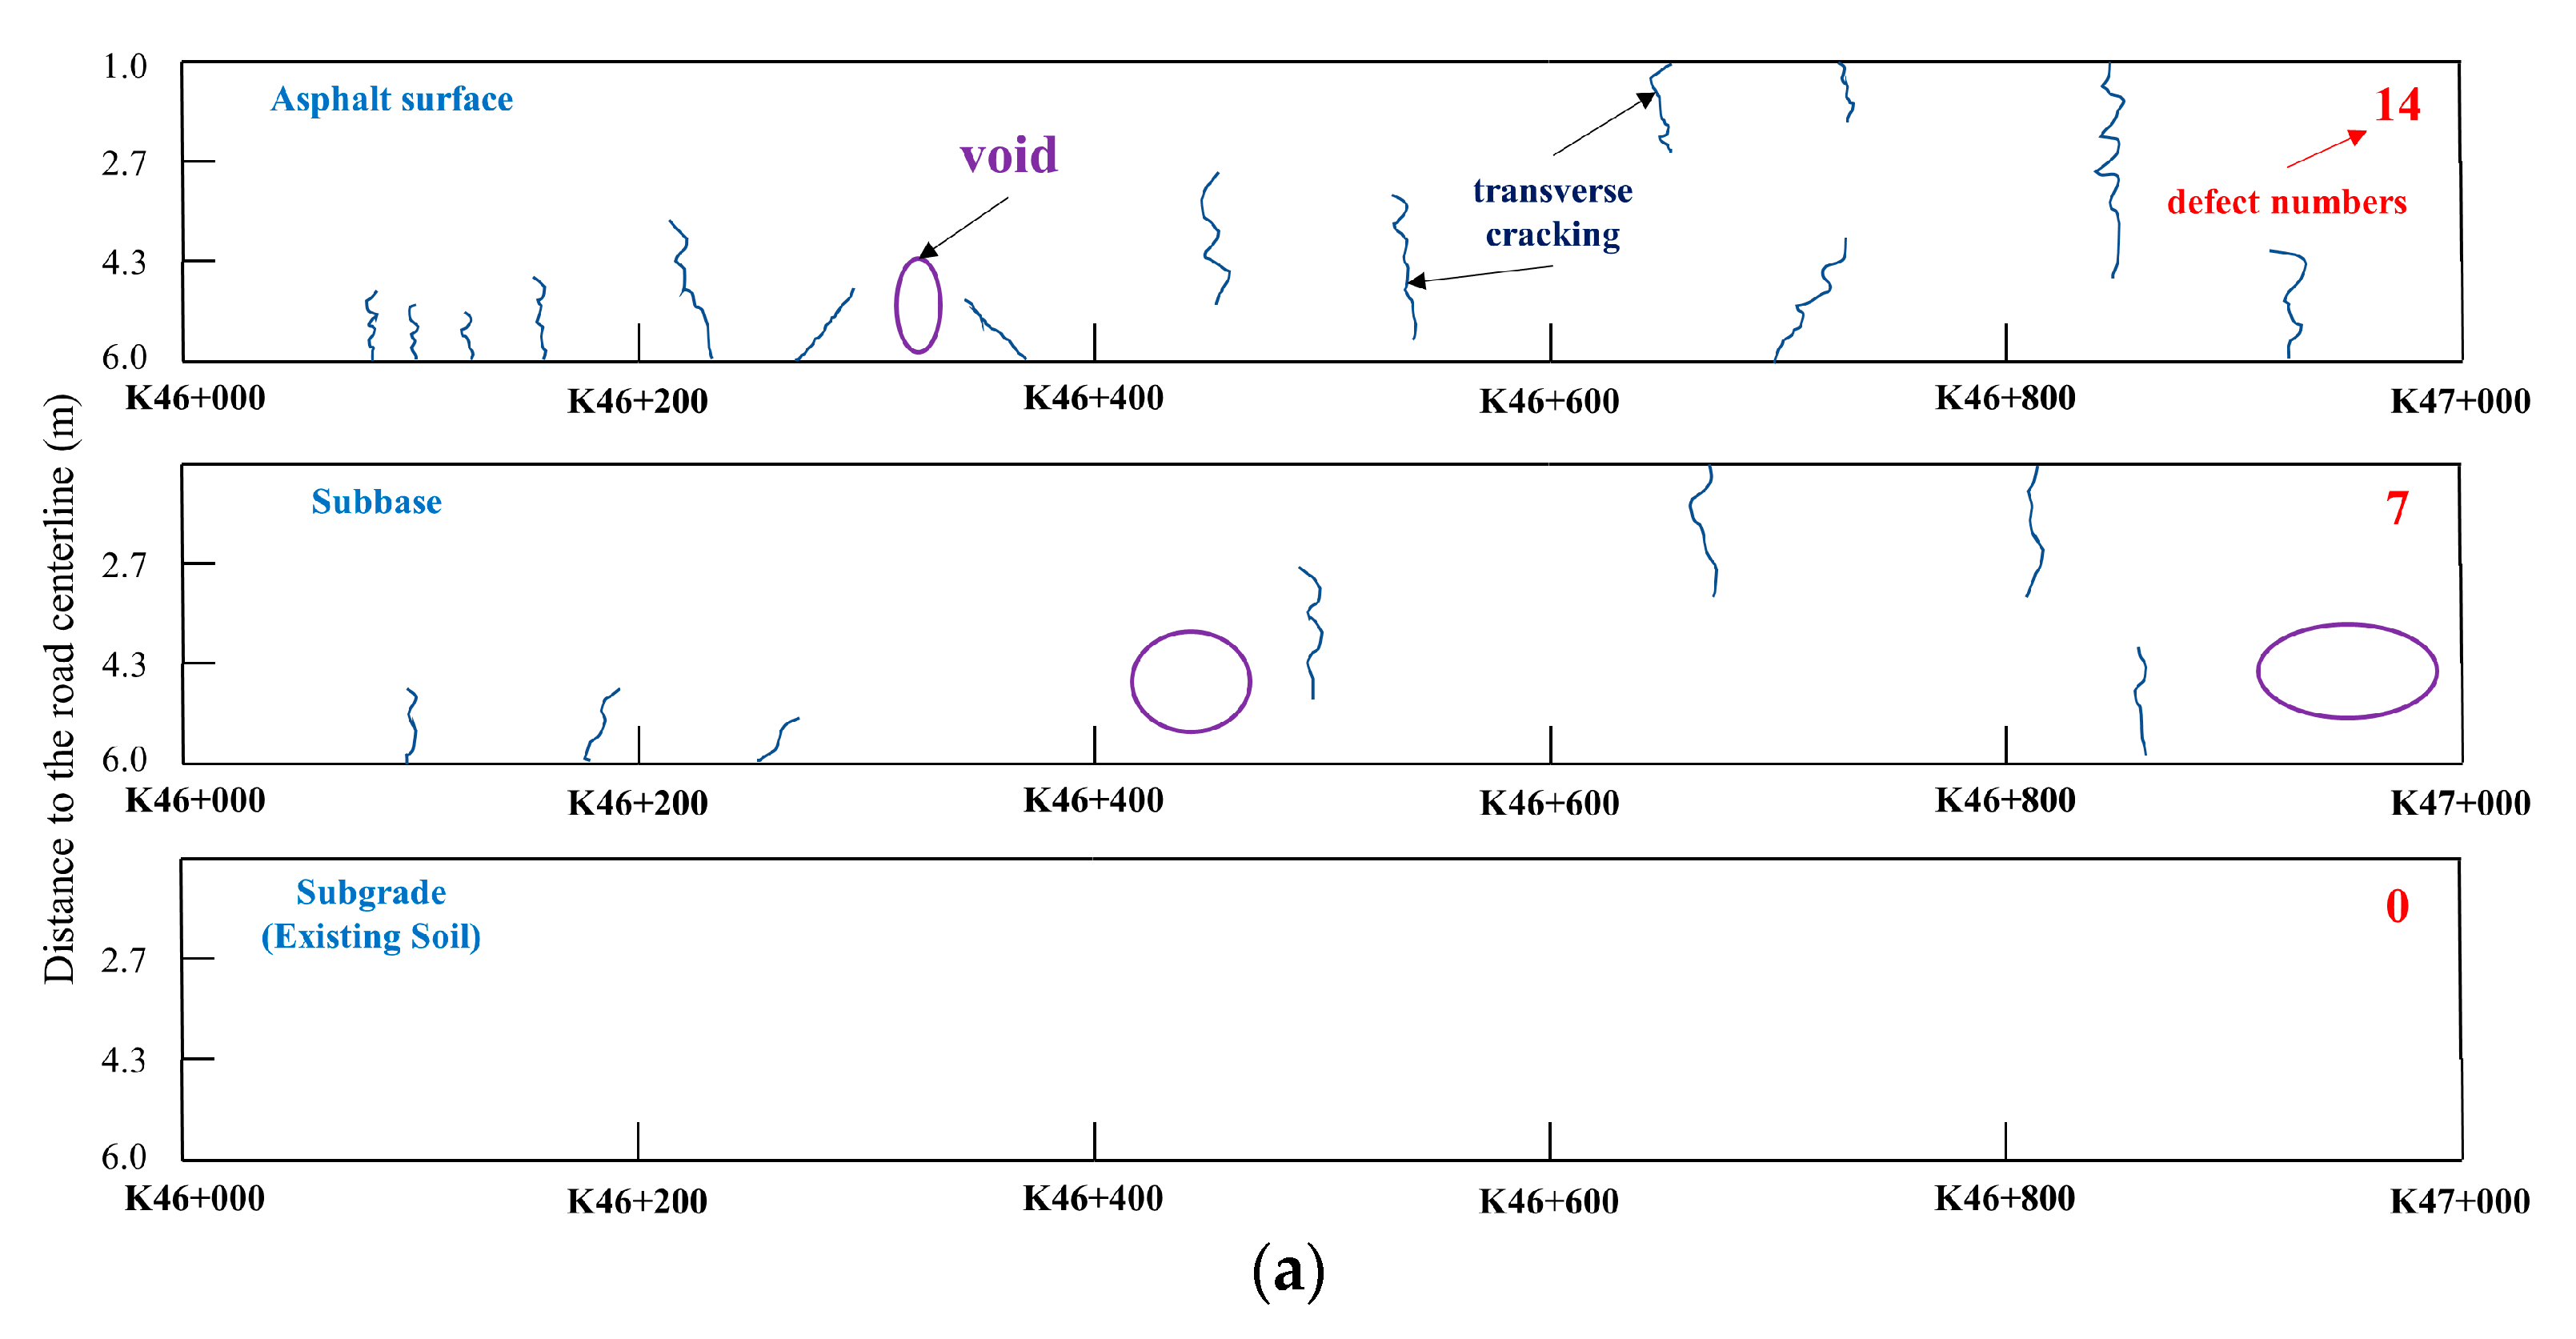
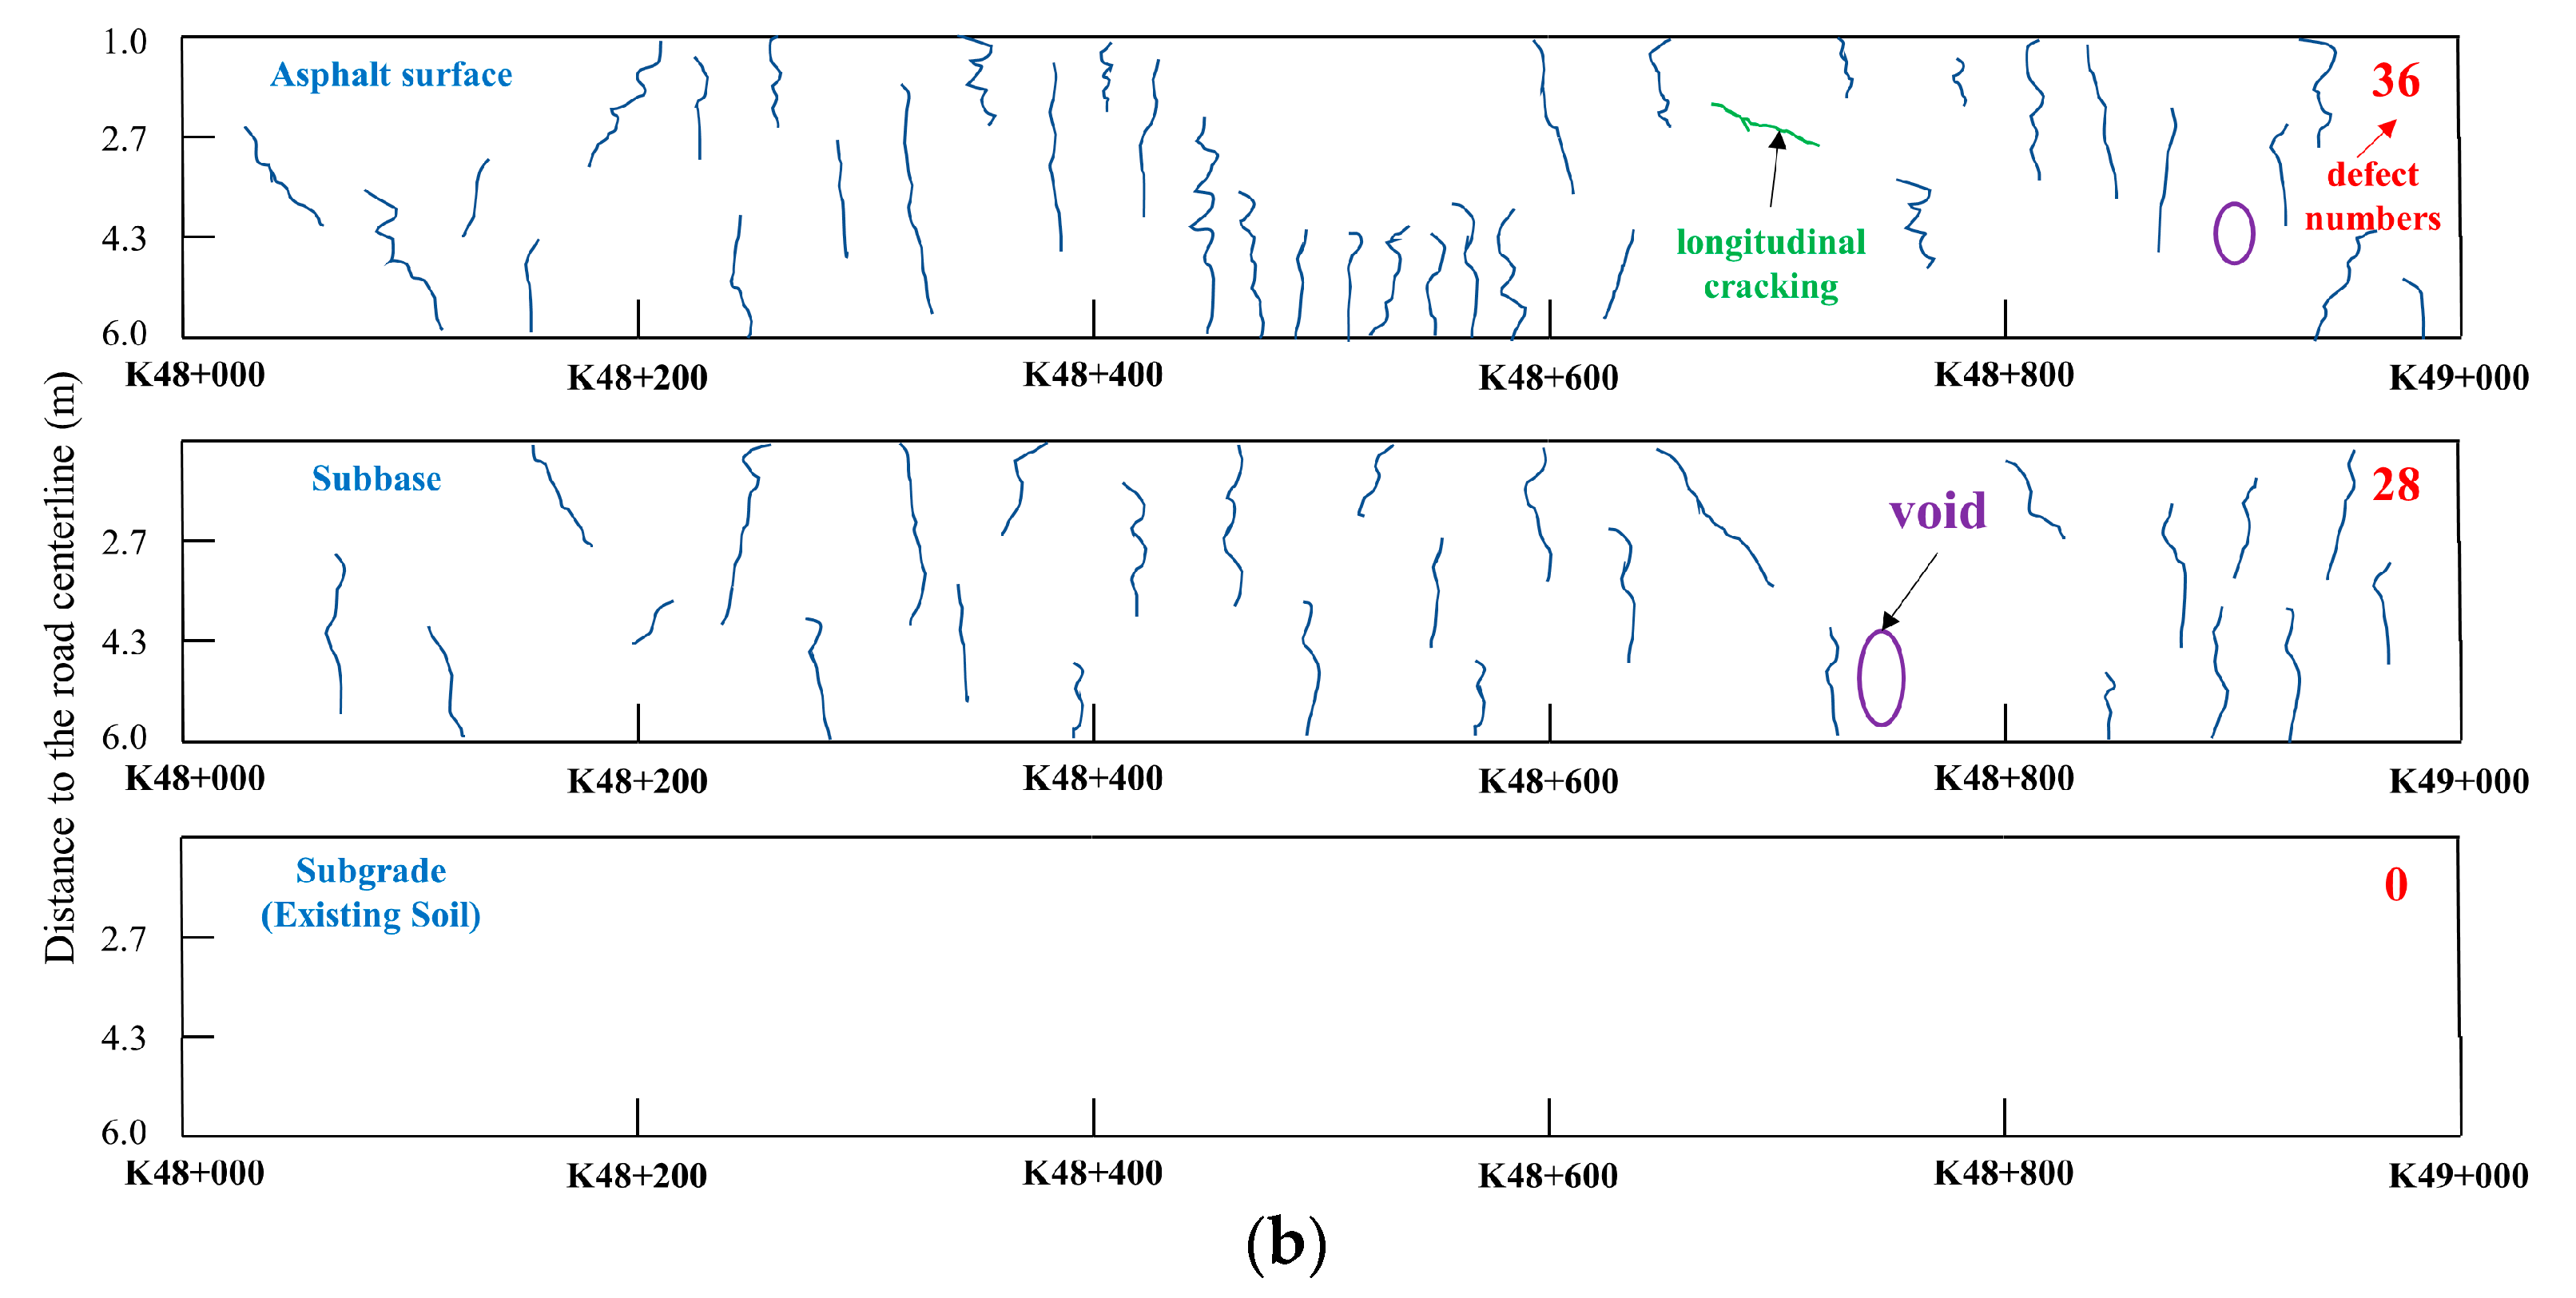
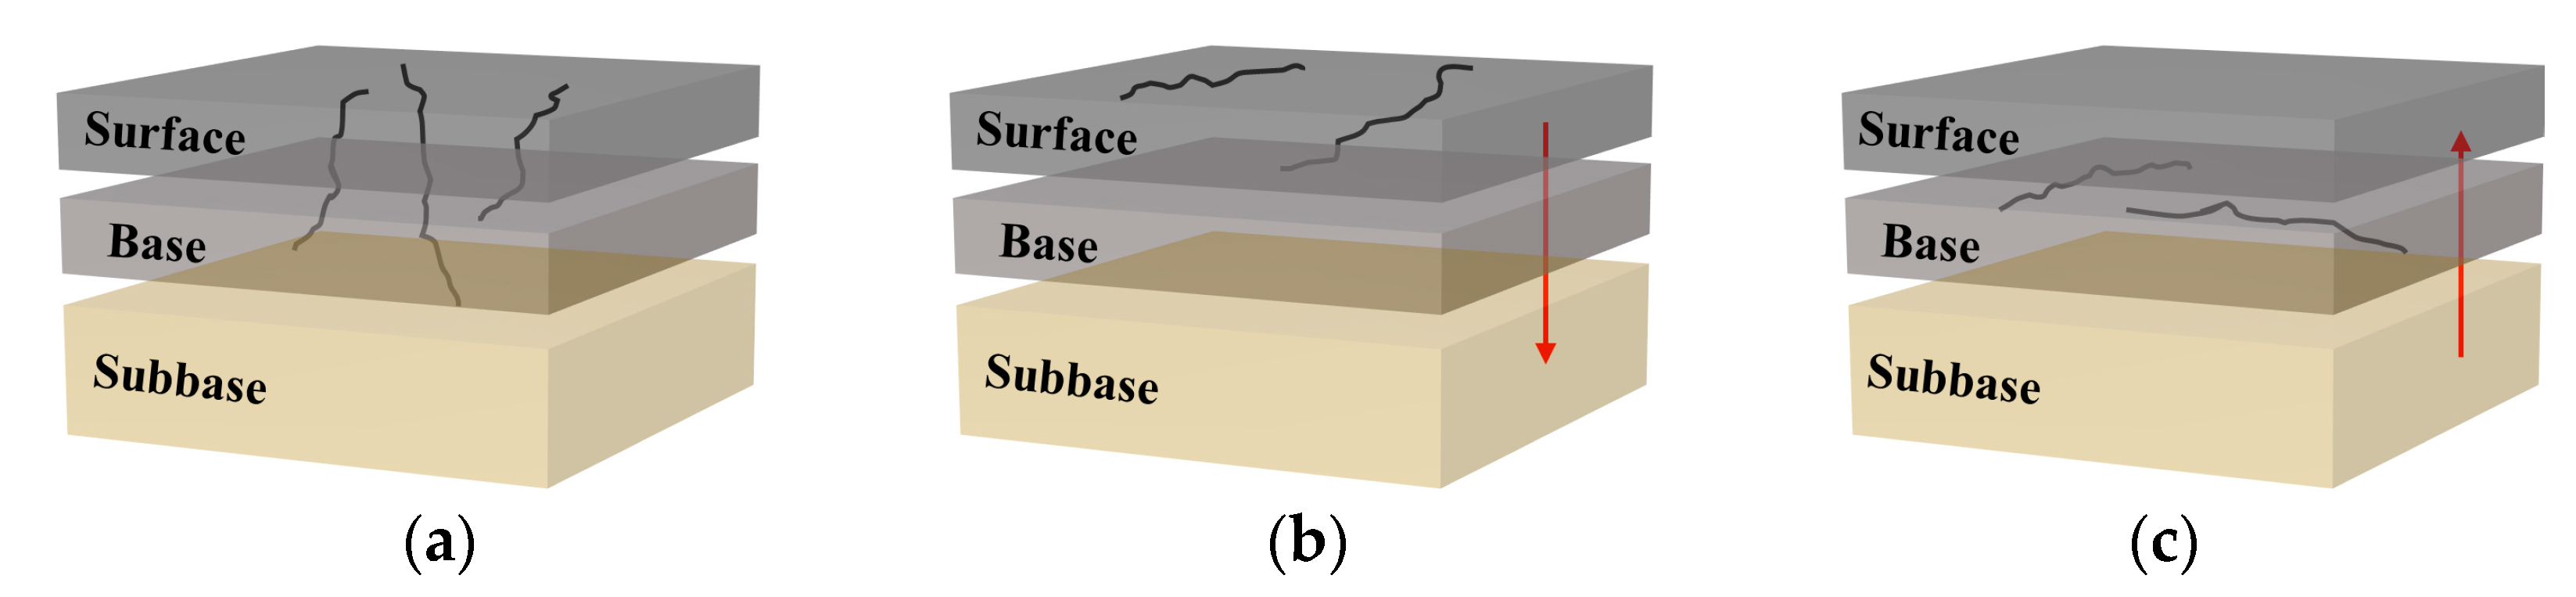
4.1.2. GPR Detection

The main defect types of the tested road section are cracking (more than 90%), void zones, and raveling. Therefore, the characteristics of the cracking were the focus of the analysis. First, the overall cracking density of the proposed maintenance roads was low. Specifically, the cracking density of the surface was 1.5 m/m2, the cracking density of the basement was 1.0 m/m2, and the number of void defects was 9 (the total area was 27 m2) in the left side of the tested road. Moreover, the cracking density of the surface was 0.8 m/m2, the cracking density of the basement was 0.6 m/m2, and the number of void defects was 13 (the total area was 52 m2) in the right side of the tested road.
As for the development horizon of the cracking, there were three types, as shown in Figure 10.
  • The up and down cracking (the pumping defect had emerged, Figure 10a).
  • The top-down developing cracking (the cracking had emerged on the surface but not at the basement, Figure 10b).
  • The bottom-up developing cracking (the cracking had emerged on the basement but not at the surface, Figure 10c).
From the perspective of the regional distribution of defects, distinct characteristics of partial defect concentration were in the tested roads. The defects of the basement were lesser than those of other structural layers in general road sections. On the other hand, the distribution of defects was more concentrated at the surface and basement in the road sections with severe defects.
Finally, the prediction of the development of defects was conducted based on the results above. Notably, the third type of developing cracking would gradually undergo a transition to the first type with the arrival of freeze-thawing during rainy and winter seasons, which would lead to the appearance of more pumping mud.

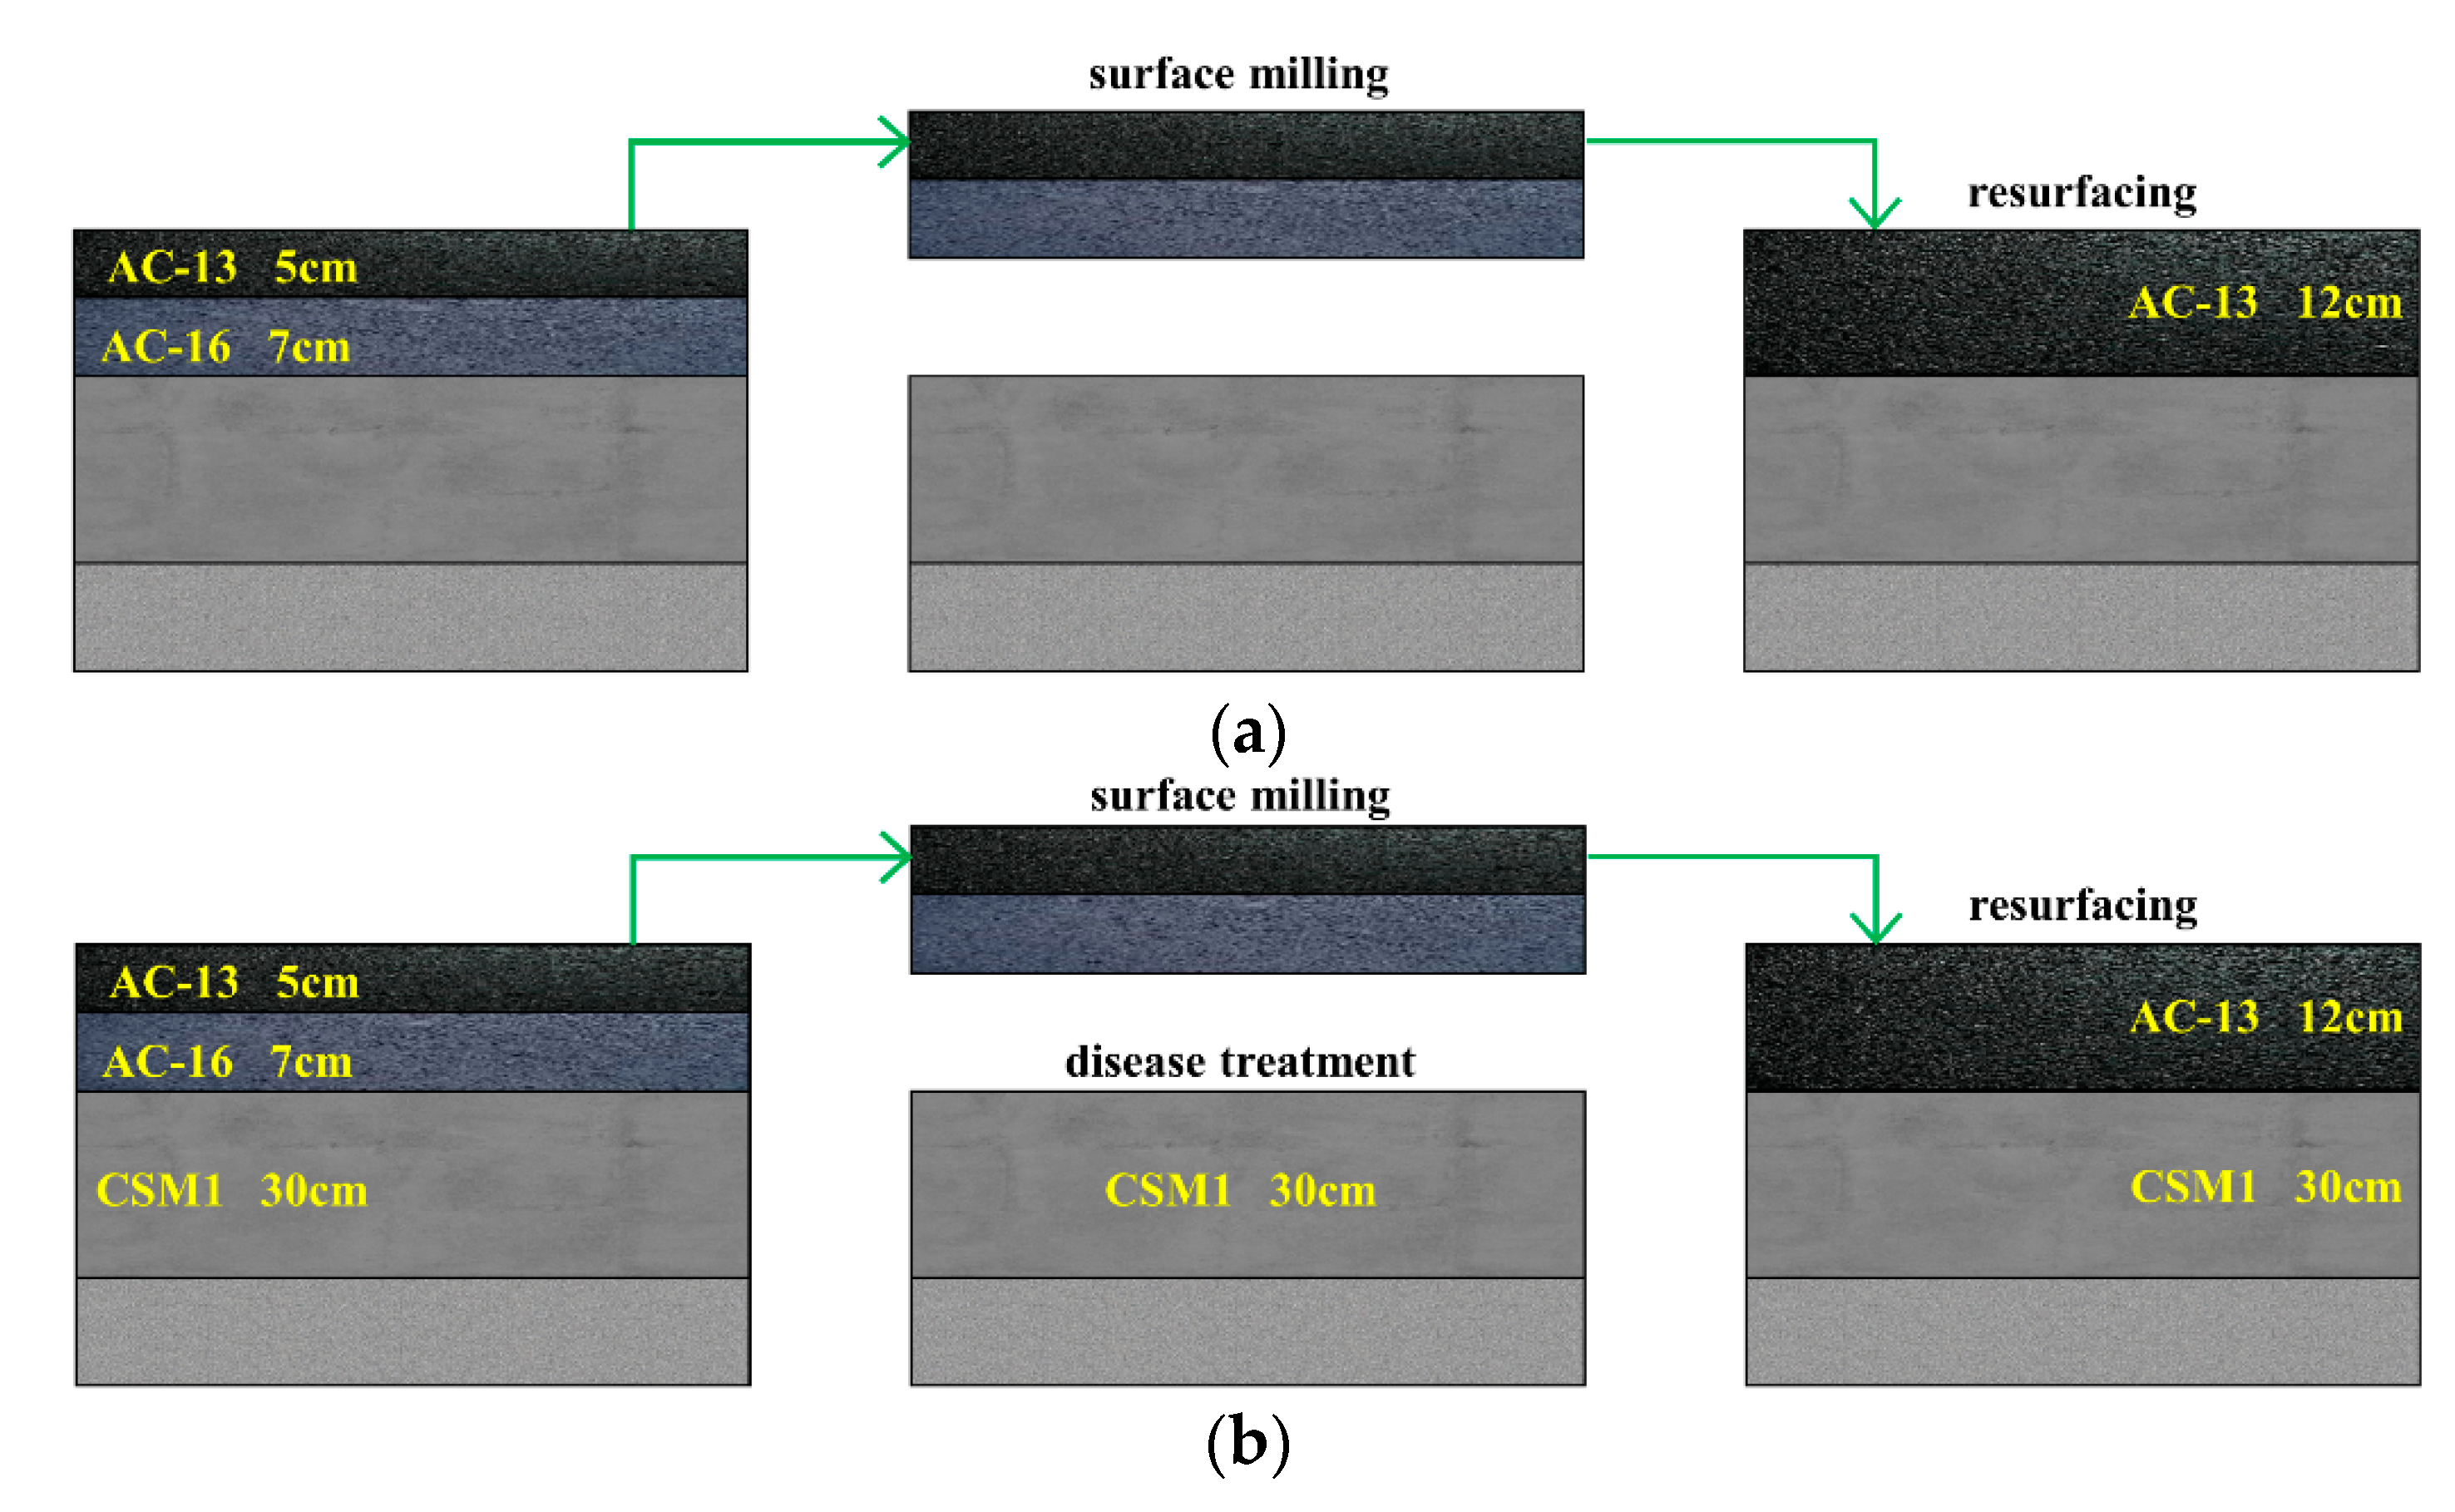
4.2. Maintenance Program

As shown in Figure 11, the following two maintenance programs were determined according to different defect severities.
First, for the general road sections with low defect severity, the milling measure for the original surface (5 cm AC-13 and 7 cm AC-16) should be performed. Then, the new surface (12 cm AC-13, a previous study demonstrated that the maintenance measure of AC-13 has the highest comprehensive benefit [41]) is spread on the basement (milling and resurfacing, MR). In terms of the road sections with severe defects, after the surface milling measure, the treatment of defects (overlay paving for reinforcement, OPR) is conducted on the basement before the resurfacing.
Finally, according to the analysis for defect characteristics and maintenance measures based on conventional detection and GPR detection, the maintenance programs were established for these two detection methods. As presented in Figure 12, the MR measure was conducted for surface maintenance based on both detection methods. However, this was not the same case for the basement. Specifically, the OPR measure was adopted for the full range of basement with conventional detection, while only 1450 m for the basement of serious diseases with GPR detection.

4.3. Benefits Analysis

The service life and pavement performance of maintenance measures have been used to evaluate the long-term benefits in many studies [42,43]. The present work drew on previous studies and used the economic and environmental benefits as evaluation criteria for comparison of traditional detection and GPR detection.
The fundamental assumptions for the calculation of benefits were as follows. The material haul-lengths of asphalt, gravel, and asphalt mixture are 100, 60, and 50 km, respectively. The density of hot-mix asphalt mixture is 2.45 t/m3. The thickness of treatment is typically 4 cm. The per unit of maintenance area is calculated as 375 m2 (100 m× 3.75 m, single lane).
In this study, the tested road was a two-way four-lane road of 5 km. According to Figure 12, the total area of the first and second maintenance measures was 75,000 m2 based on traditional detection. As for GPR detection, the area of the first maintenance measure was 53,250 m2 and that of the second was 21,750 m2.

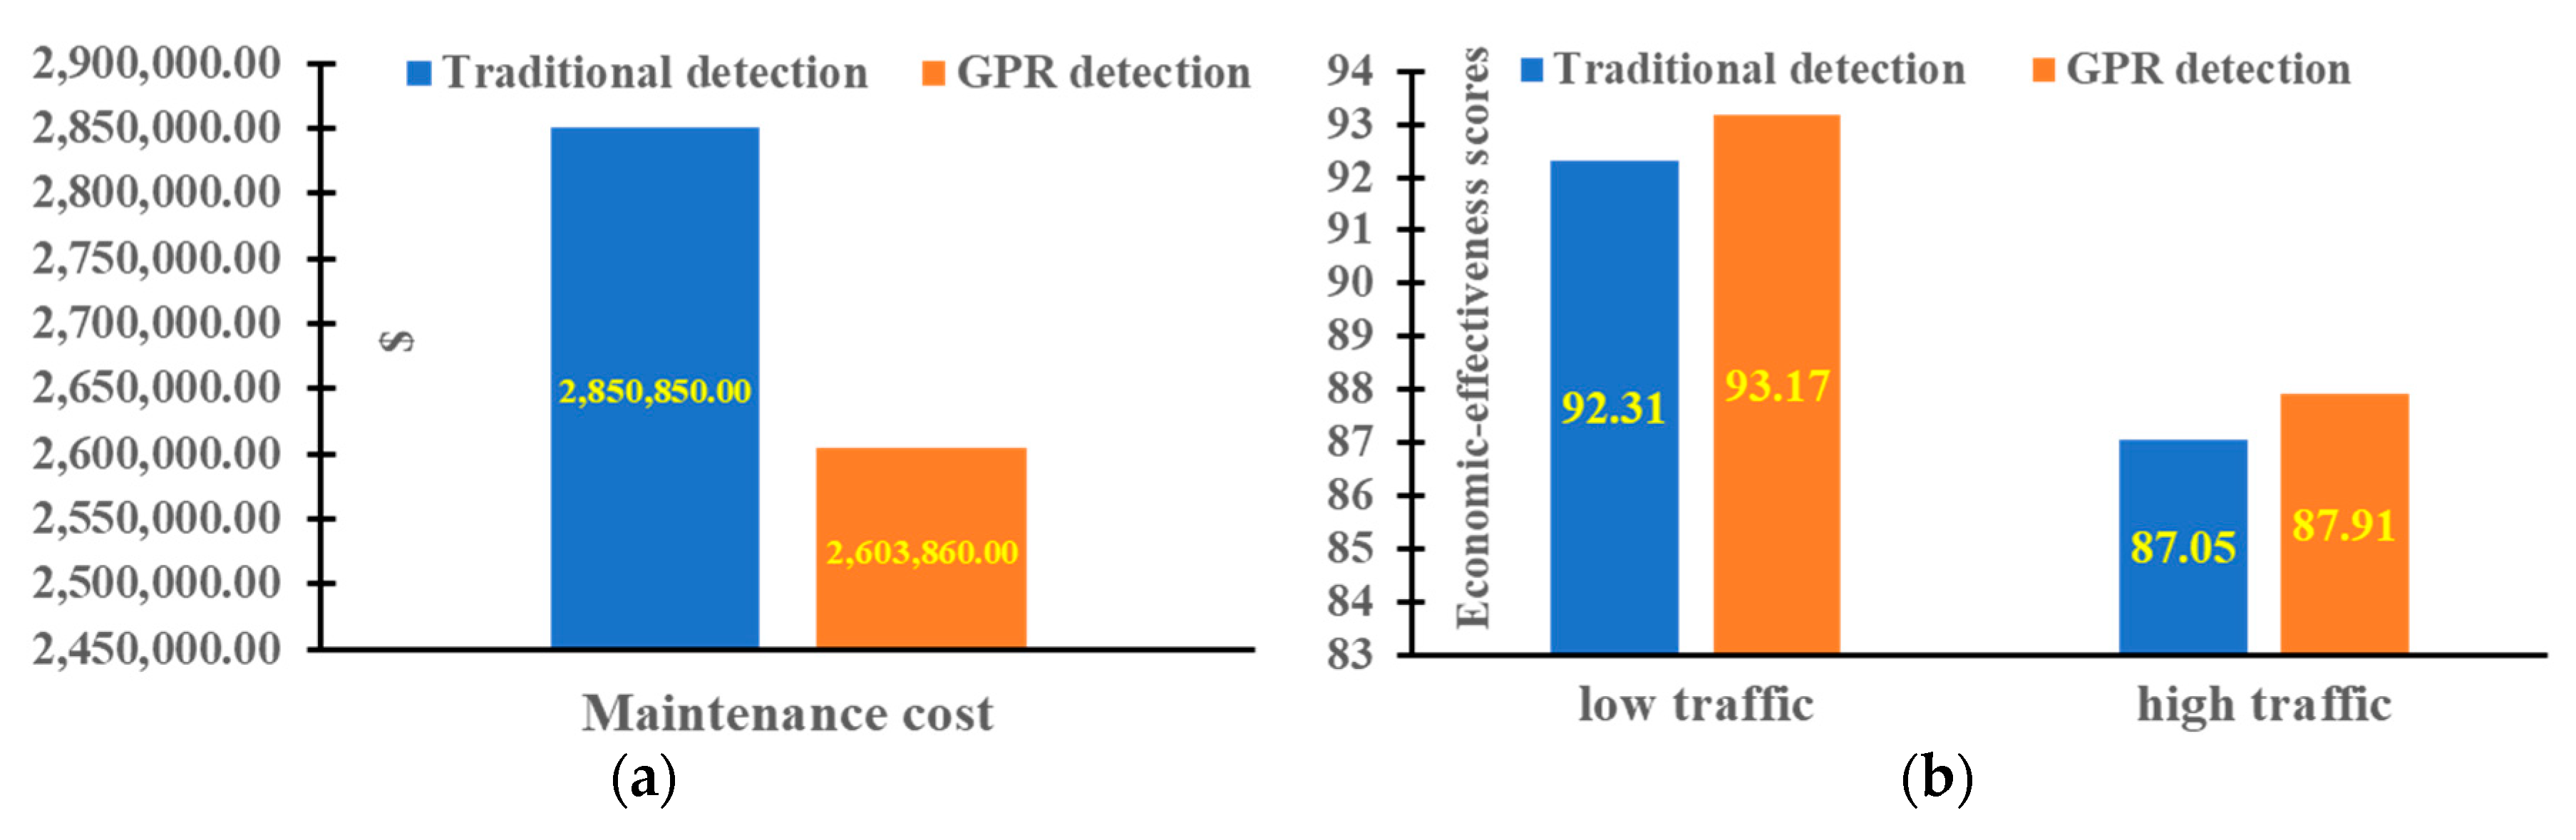
4.3.1. Economic Benefits

The average cost and economic effectiveness (the evaluation index for maintenance economic-benefits obtained by some pavement performance indexes) [44] of the MR and OPR measures are listed in Table 9. The actual thickness of treatment was 0.12 m in the road surface. Therefore, the final results in Figure 13 were obtained by multiplying by 3.
Figure 13 shows that the maintenance cost based on GPR detection was lower than that of traditional detection. More specifically, the reducing cost is $49,398/km. In addition, the economic scores were higher based on GPR detection than traditional detection in low-traffic and high-traffic road sections.

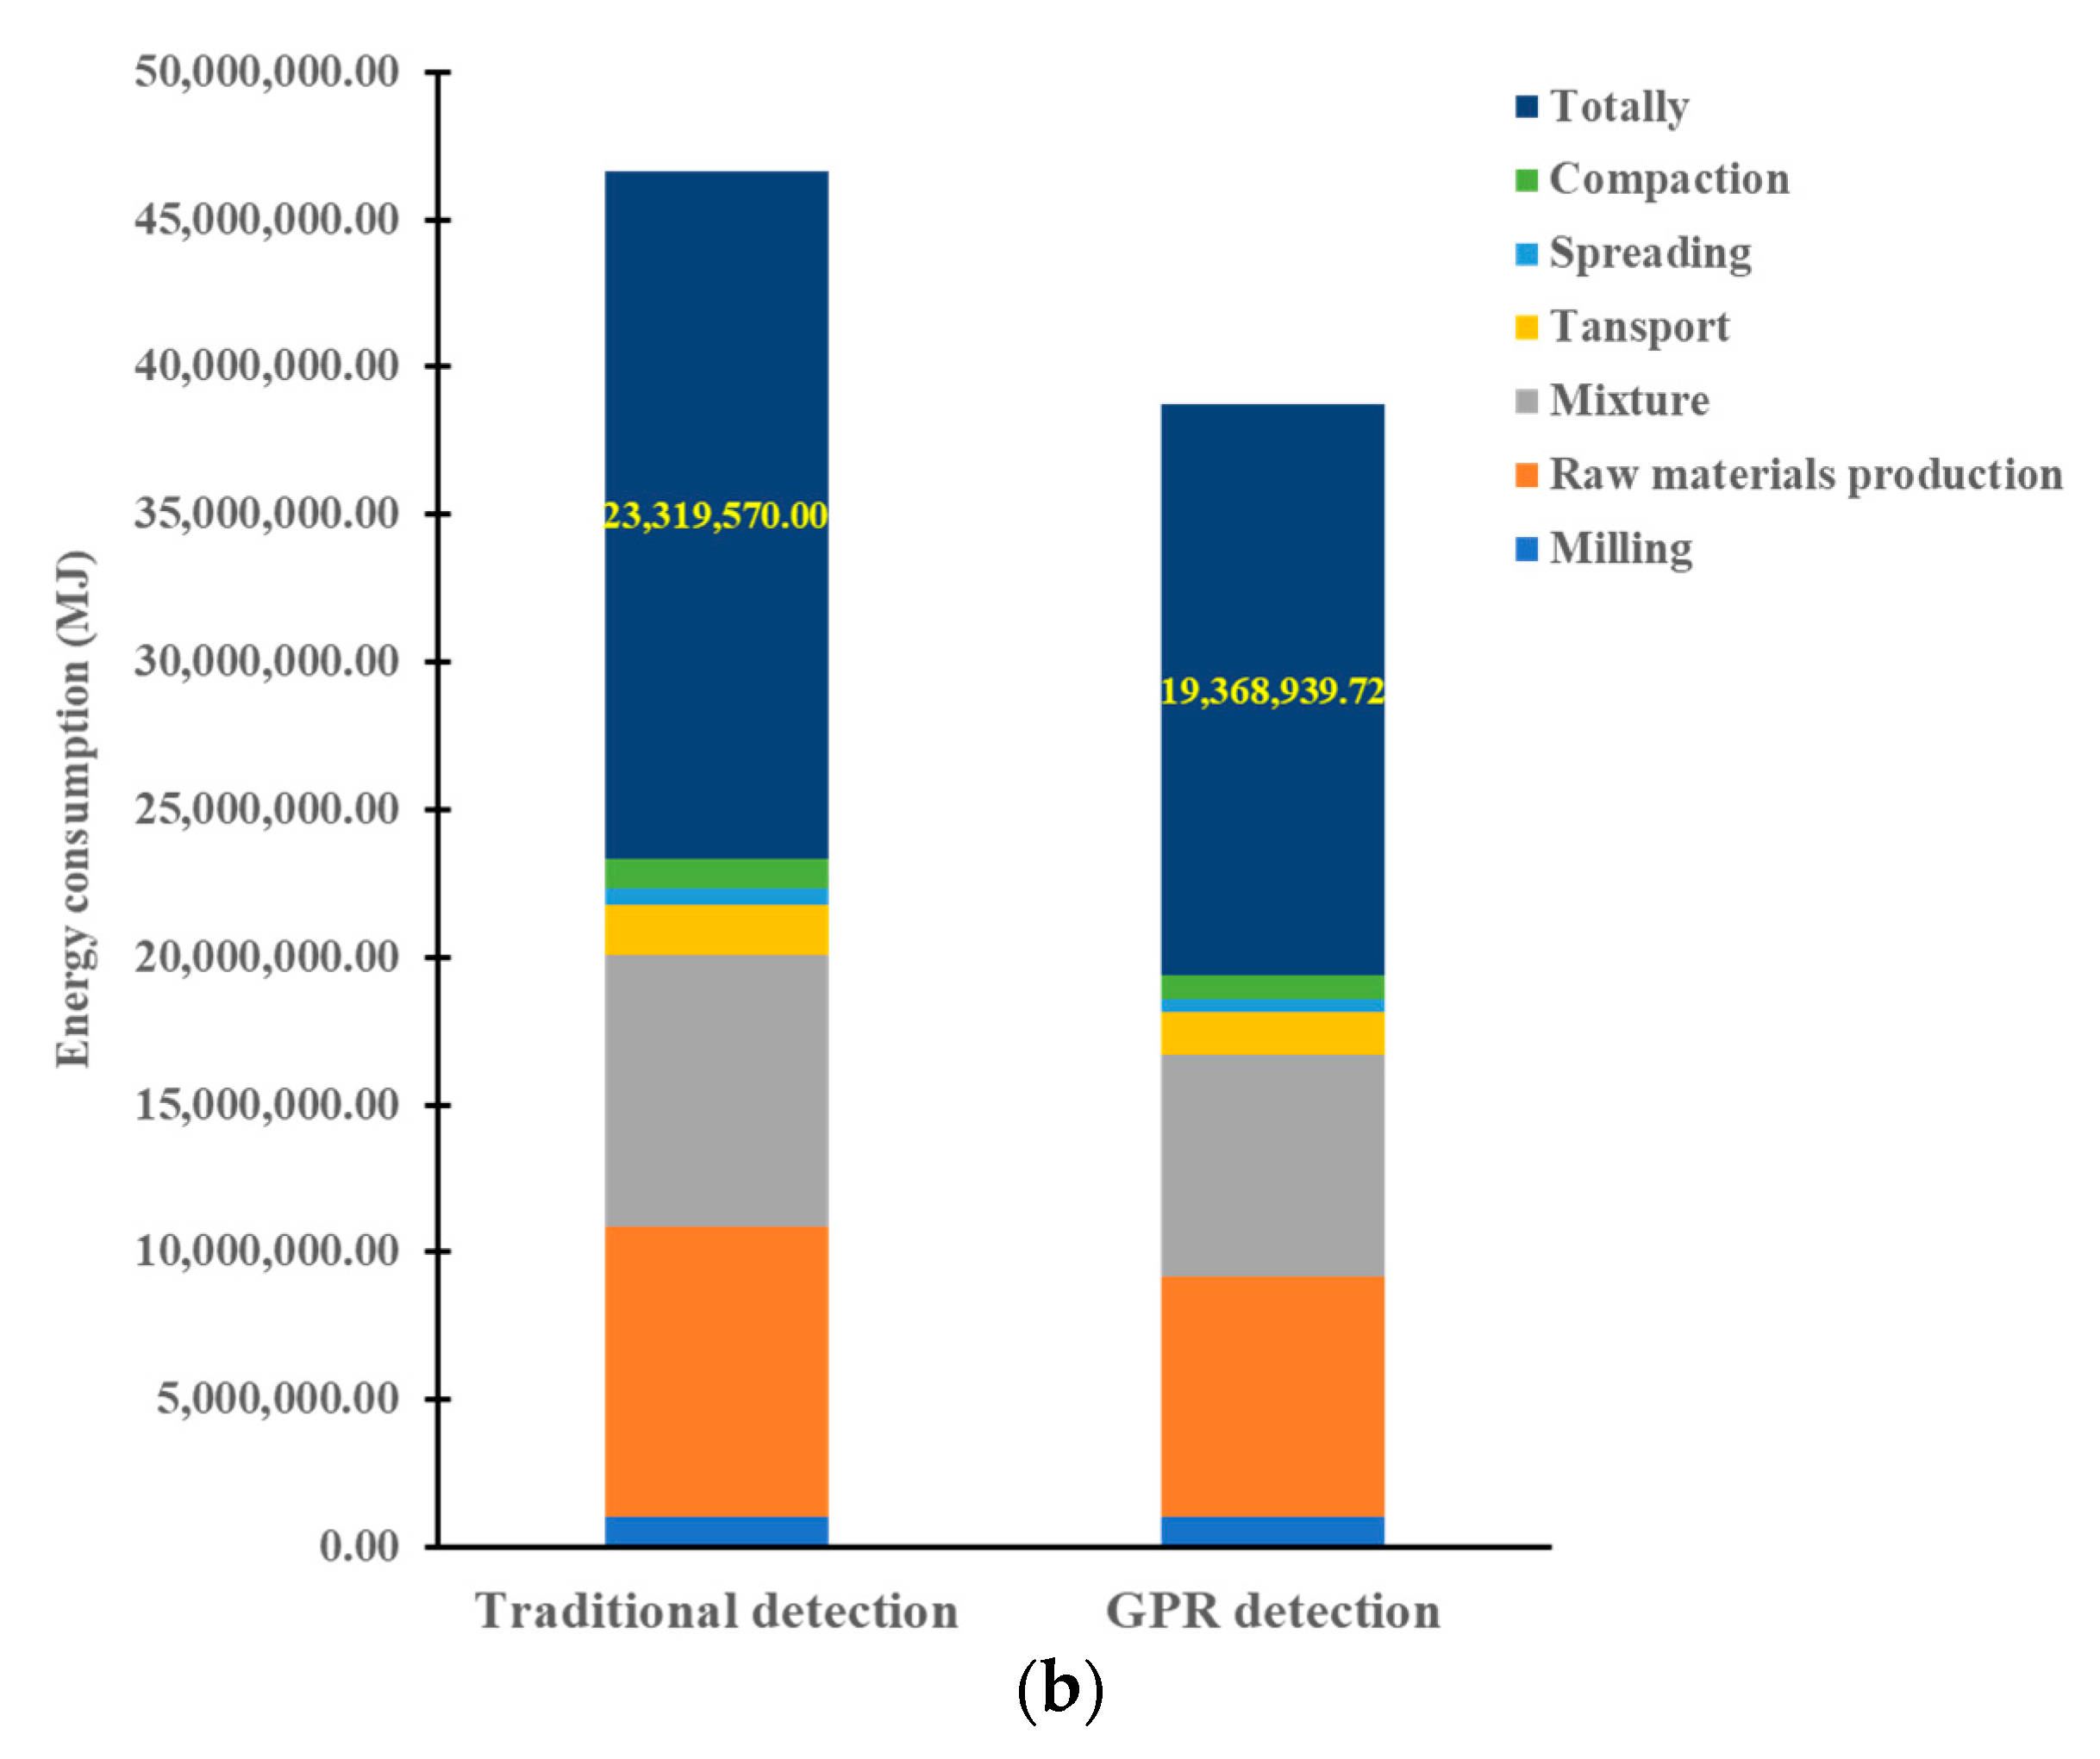
4.3.2. Environmental Benefits

Table 10 lists the energy consumption and carbon emissions of the MR and OPR measures, including the milling, raw materials production, mixture, transport, spreading, and compaction sessions.
The contrast for energy consumption and carbon emissions are shown below in Figure 14.
The contrast between the energy consumption and carbon emissions of the two detecting methods is shown in Figure 14. Obviously, the energy consumption and carbon emissions based on GPR detection were less than those based on traditional detection and were reduced by 792,106 MJ/km (16.94%) and 56,289 kg/km (16.91%), respectively.

5. Conclusions

This paper aims to improve the detection efficiency and increase the maintenance benefits by combining YOLO models and 3D GPR images of an asphalt road. The YOLOv5m model is selected to conduct the rapid identification of road defects according to the comparison results of six YOLO series models. Based on the analysis of economic and environmental benefits for tested-road maintenance, the advantage of GPR detection has emerged. Several conclusions can be summarized as follows:
  • The internal defects in asphalt pavement, including cracking, void zones, raveling, and settlement, were detected by 3D GPR. However, the conventional method detected only the surface conditions. Furthermore, 3D GPR detection is more nondestructive relative to the coring validation.
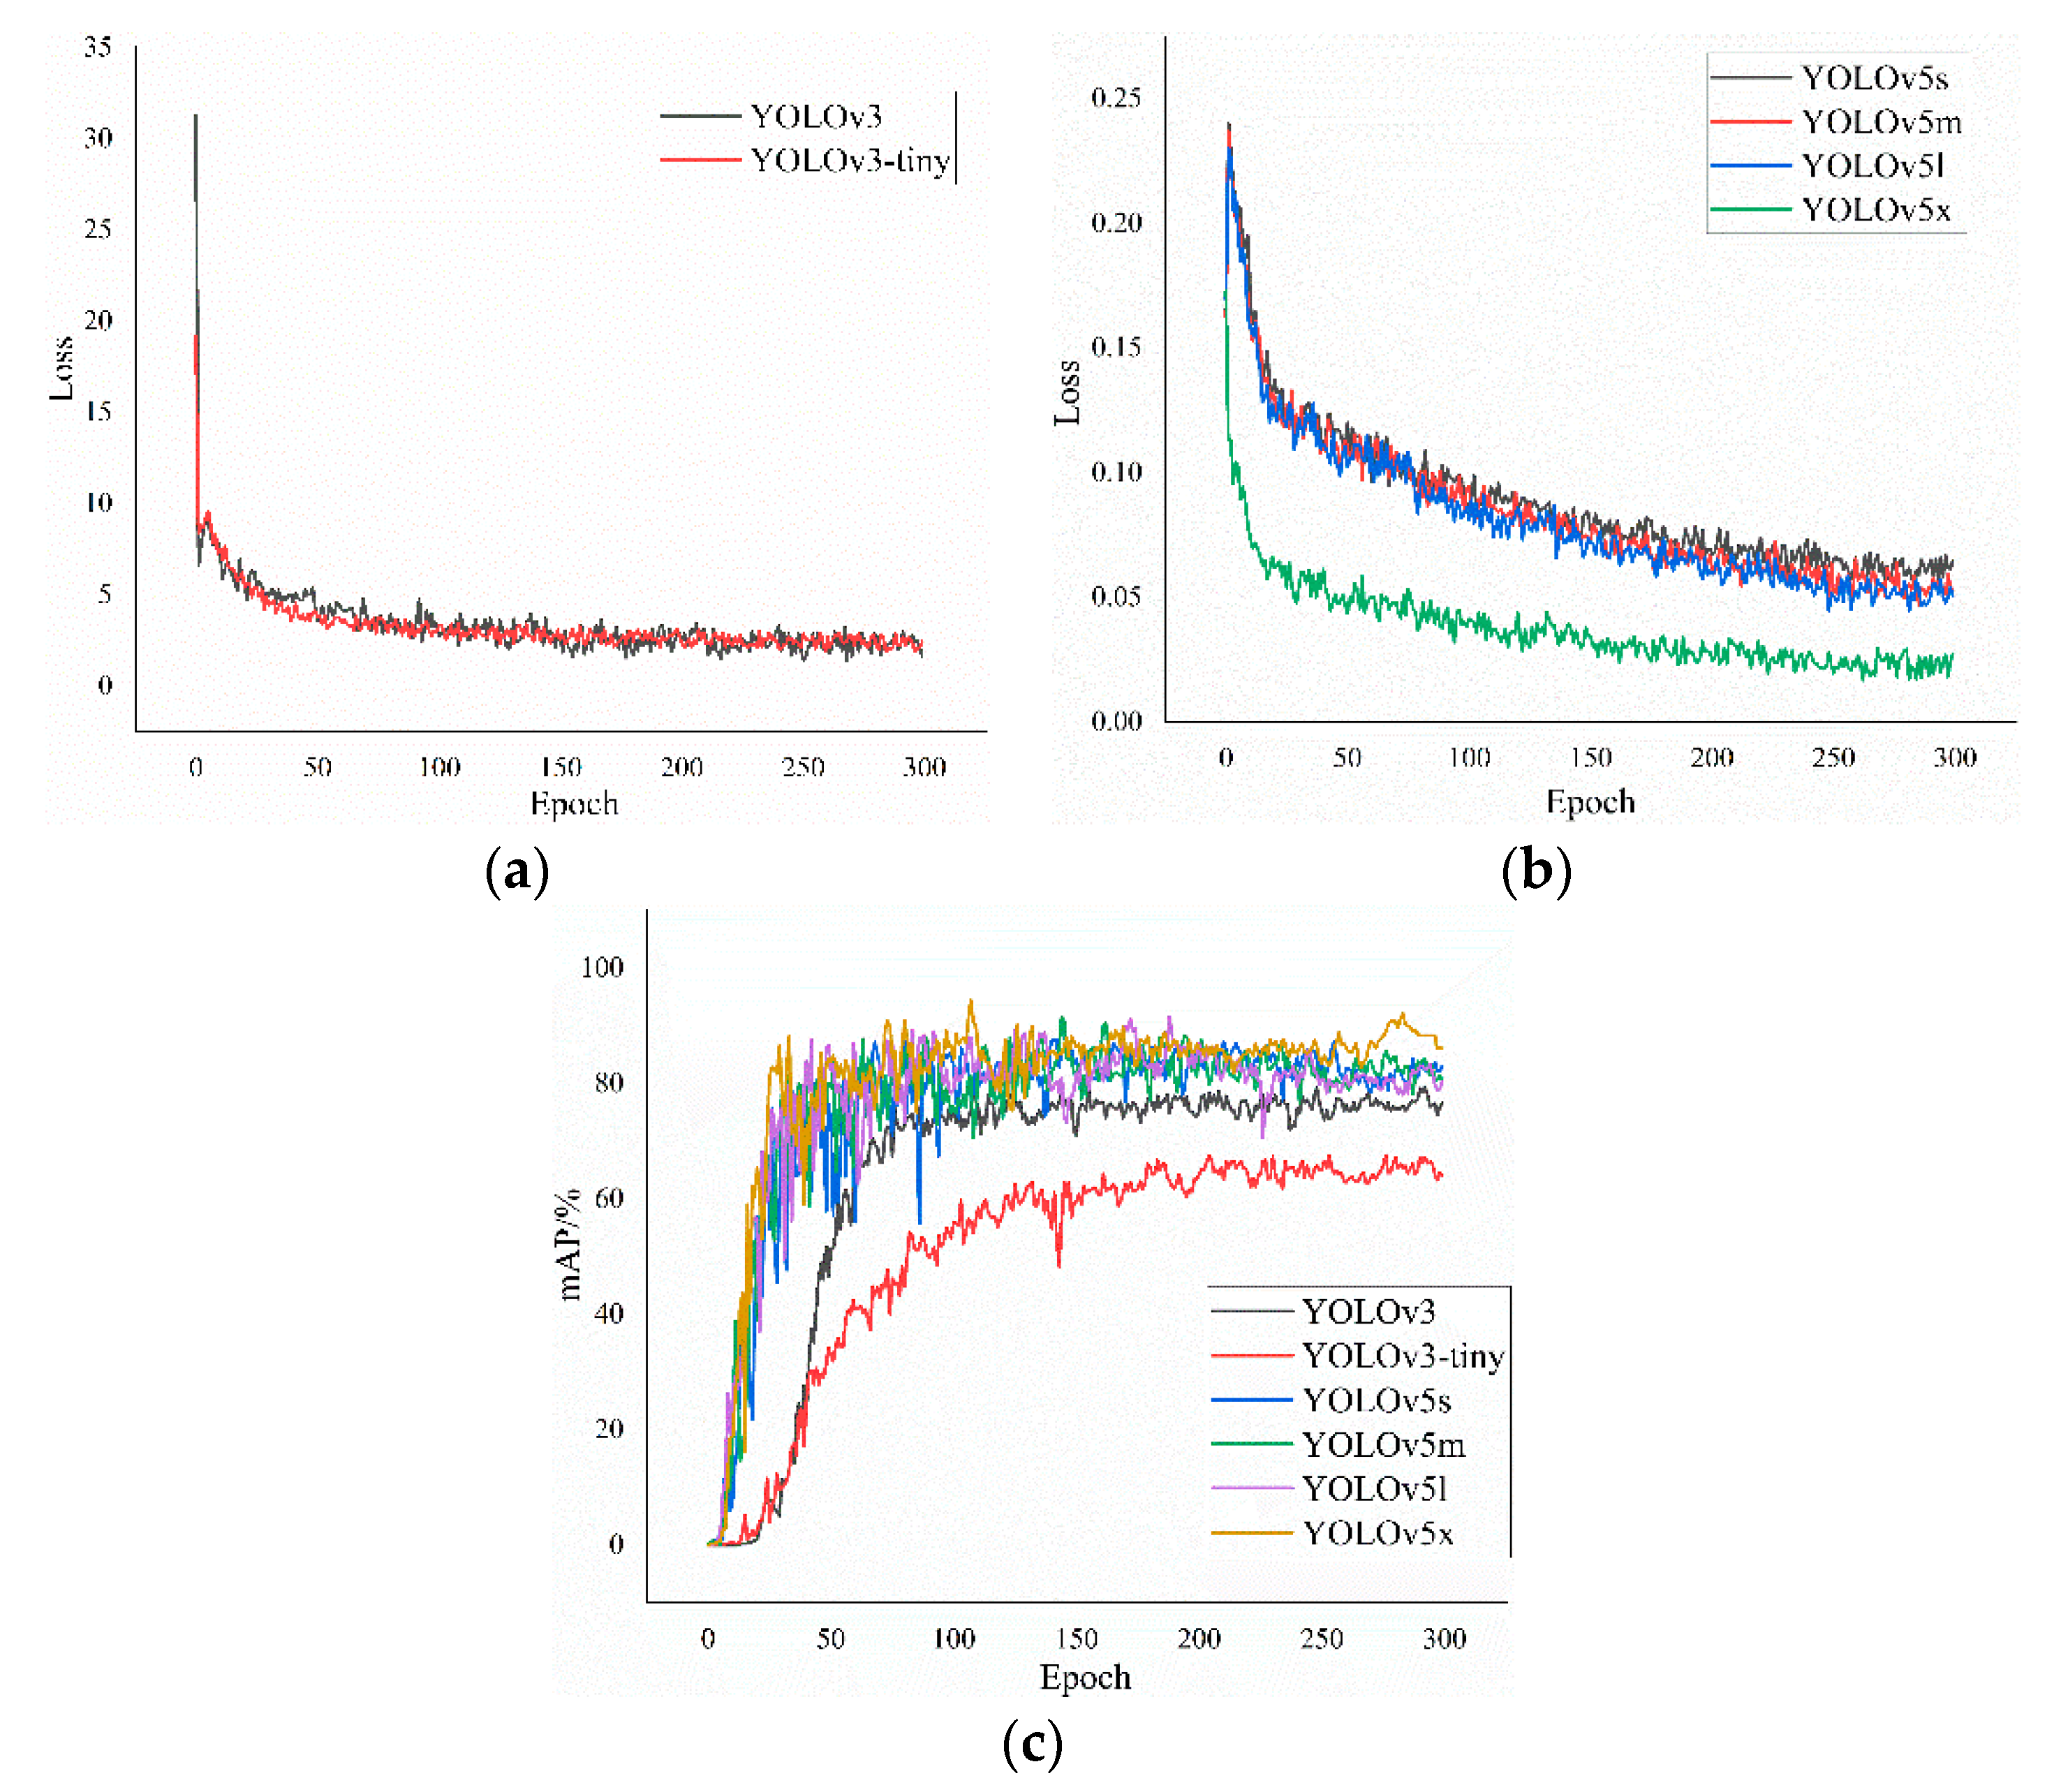
  • The final converged loss value of YOLOv3 was approximately 2, whereas that of YOLOv5 was lower than 0.2. Thus, the YOLOv5 models are suitable for the detection of internal defects in asphalt road, and these models provide a good training result even for a small dataset condition. The mAP values of the YOLOv5m, YOLOv5l, and YOLOv5x models were higher than 90% and the maximum was 94.45% in YOLOv5-x. It was also found with regularity that the larger a model’s weights are, the higher the model’s mAP will be, which suggests that an appropriate increase in model depth favors the enhancement of the training performance. Most importantly, the YOLOv5m models are the most balanced deep-learning models in terms of detection speed and actual performance of the six YOLO series models.
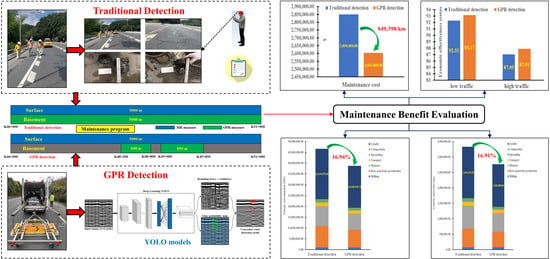
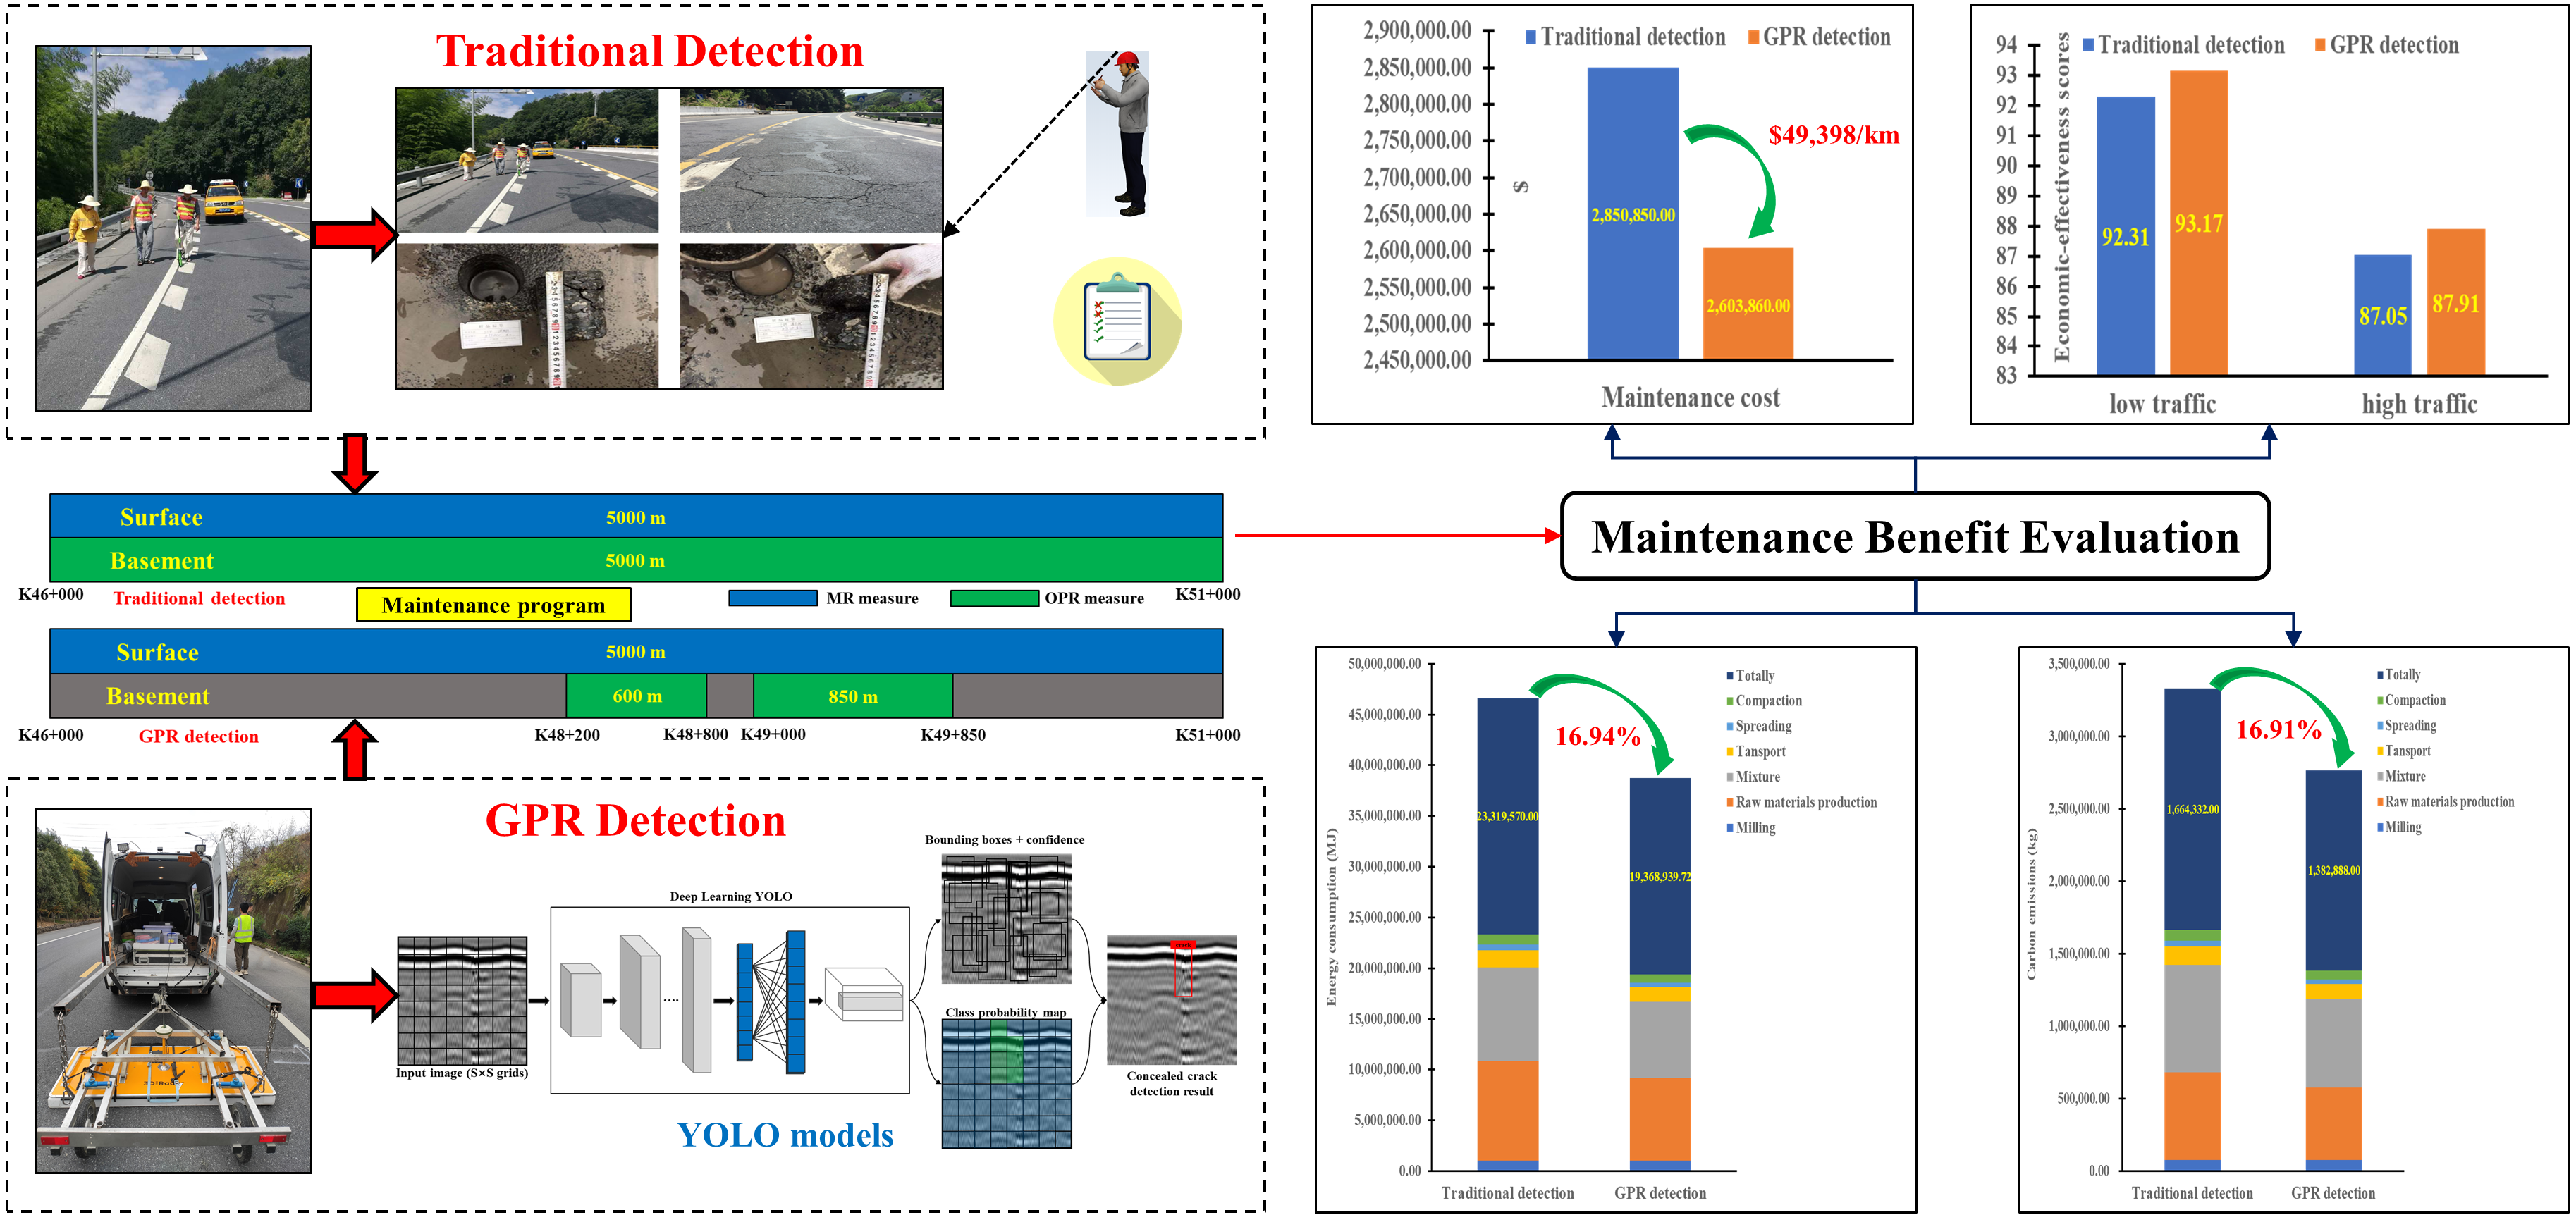
  • In the evaluation of the economic benefits of maintenance programs, the maintenance cost based on GPR detection was reduced by $49,398/km compared to that of traditional detection, and the economic scores based on GPR detection were higher than those of traditional detection in low-traffic and high-traffic road sections. As for environmental benefits, the energy consumption and carbon emissions of the maintenance program based on GPR detection was less than those of traditional detection by 792,106 MJ/km and 56,289 kg/km or 16.94 and 16.91 percentage points, respectively.
All these facts demonstrate that 3D GPR is effective in pavement detection and maintenance and should be recommended for the life-cycle maintenance of civil infrastructure. Future research may focus on further improving the intelligence level of GPR detection and developing the evaluation criteria of GPR detection.

Author Contributions

Conceptualization, Z.L., X.G. and S.L.; methodology, Z.L., X.G., S.L. and T.Z.; software, W.W. and S.L.; validation, Z.L., and X.G.; formal analysis, Z.L. and S.L.; investigation, Z.L., W.W., L.W. and S.L.; resources, W.W. and T.Z.; data curation, S.L. and L.W.; writing—original draft preparation, Z.L. and X.G.; writing—review and editing, Z.L. and S.L.; visualization, Z.L.; supervision, W.W.; project administration, X.G.; funding acquisition, W.W. and X.G. All authors have read and agreed to the published version of the manuscript.

Funding

This research was funded by [National Key R&D Program of China] grant number [2017YFF0205600], [Fundamental Research Funds for the Central Universities] grant number [3221008101], and [Science and Technology Project of Zhejiang Provincial Department of Transport] grant number [2020045] and [2020053].

Institutional Review Board Statement

Not applicable.

Informed Consent Statement

Not applicable.

Data Availability Statement

Restrictions apply to the availability of these data. Data was obtained from [Jinhua Highway and Transportation Management Center, China] and are available [from the authors] with the permission of [Jinhua Highway and Transportation Management Center, China].

Conflicts of Interest

The authors declare no conflict of interest.

References

  1. Zou, Q.; Cao, Y.; Mao, Q.; Wang, S. Crack Tree: Automatic crack detection from pavement images. Pattern Recogn. Lett. 2012, 33, 227–238. [Google Scholar] [CrossRef]
  2. Brown, S.F. Accelerated pavement testing in highway engineering. Transport 2004, 157, 173–180. [Google Scholar] [CrossRef]
  3. Lai, W.L.; Dérobert, X.; Annan, P. A review of ground penetrating radar application in civil engineering: A 30-year journey from locating and testing to imaging and diagnosis. NDT E Int. 2017, 96, 58–78. [Google Scholar]
  4. Zhao, S.; Al-Qadi, I.L. Development of regularization methods on simulated ground-penetrating radar signals to predict thin asphalt overlay thickness. Signal Process. 2017, 132, 261–271. [Google Scholar] [CrossRef]
  5. Zhao, S.; Al-Qadi, I.L. Super-Resolution of 3-D GPR Signals to Estimate Thin Asphalt Overlay Thickness Using the XCMP Method. IEEE Trans. Geosci. Remote Sens. 2019, 57, 893–901. [Google Scholar] [CrossRef]
  6. Zhang, J.; Yang, X.; Li, W.; Zhang, S.; Jia, Y. Automatic detection of moisture damages in asphalt pavements from GPR data with deep CNN and IRS method. Autom. Constr. 2020, 113, 103119. [Google Scholar] [CrossRef]
  7. Zhao, S.; Al-Qadi, I.L. Algorithm development for real-time thin asphalt concrete overlay compaction monitoring using ground-penetrating radar. NDT E Int. 2019, 104, 114–123. [Google Scholar] [CrossRef]
  8. Zhao, S.; Al-Qadi, I.L.; Wang, S. Prediction of thin asphalt concrete overlay thickness and density using nonlinear optimization of GPR data. NDT E Int. 2018, 100, 20–30. [Google Scholar] [CrossRef]
  9. Liu, Y.; Qiao, J.; Han, T.; Li, L.; Xu, T. A 3D Image Reconstruction Model for Long Tunnel Geological Estimation. J. Adv. Transp. 2020, 2020, 8846955. [Google Scholar] [CrossRef]
  10. Rasol, M.A.; Gracia, V.P.; Fernandes, F.M.; Pais, J.C.; Assuncao, S.S.; Santos, C.; Sossa, V. GPR laboratory tests and numerical models to characterize cracks in cement concrete specimens, exemplifying damage in rigid pavement. Measurement 2020, 158, 107662. [Google Scholar] [CrossRef]
  11. Rodes, P.J.; Reguero, A.M.; Perez-Gracia, V. GPR Spectra for Monitoring Asphalt Pavements. Remote Sens. 2020, 12, 1749. [Google Scholar] [CrossRef]
  12. Gao, J.; Yuan, D.; Tong, Z.; Yang, J.; Yu, D. Autonomous pavement distress detection using ground penetrating radar and region-based deep learning. Measurement 2020, 164, 108077. [Google Scholar] [CrossRef]
  13. Kang, M.S.; Kim, N.; Im, S.B.; Lee, J.J.; An, Y.K. 3D GPR Image-based UcNet for Enhancing Underground Cavity Detectability. Remote Sens. 2019, 11, 2545. [Google Scholar] [CrossRef] [Green Version]
  14. Gong, Z.; Zhang, H. Research on GPR image recognition based on deep learning. In MATEC Web of Conferences; EDP Sciences: Les Ulis, France, 2020; Volume 309, p. 03027. [Google Scholar]
  15. Tong, Z.; Gao, J.; Zhang, H. Innovative method for recognizing subgrade defects based on a convolutional neural network. Constr. Build. Mater. 2018, 169, 69–82. [Google Scholar] [CrossRef]
  16. Tong, Z.; Yuan, D.; Gao, J.; Wang, Z. Pavement defect detection with fully convolutional network and an uncertainty framework. Comput. Aided Civ. Infrastruct. Eng. 2020, 35, 832–849. [Google Scholar] [CrossRef]
  17. Tong, Z.; Yuan, D.; Gao, J.; Wei, Y.; Dou, H. Pavement-distress detection using ground-penetrating radar and network in networks. Constr. Build. Mater. 2019, 233, 117352. [Google Scholar] [CrossRef]
  18. Redmon, J.; Divvala, S.; Girshick, R.; Farhadi, A. You Only Look Once: Unified, Real-Time Object Detection. In Proceedings of the Computer Vision & Pattern Recognition, Las Vegas, NV, USA, 27–30 June 2016. [Google Scholar]
  19. Redmon, J.; Farhadi, A. YOLO9000: Better, Faster, Stronger. In Proceedings of the IEEE Conference on Computer Vision & Pattern Recognition, Honolulu, HI, USA, 21–26 July 2017. [Google Scholar]
  20. Redmon, J.; Farhadi, A. YOLOv3: An Incremental Improvement. arXiv 2018, arXiv:1804.02767. [Google Scholar]
  21. Lin, T.Y.; Gaoyal, P.; Girshick, R.; He, K.; Dollár, P. Focal Loss for Dense Object Detection. In Proceedings of the 2017 IEEE International Conference on Computer Vision (ICCV), Venice, Italy, 22–29 October 2017. [Google Scholar]
  22. Liu, W.; Anguelov, D.; Erhan, D.; Szegedy, C.; Reed, S.; Fu, C.Y.; Berg, A.C. SSD: Single Shot MultiBox Detector. In Computer Vision—ECCV 2016, ECCV 2016; Lecture Notes in Computer Science; Springer: Cham, Switzerland; Glasgow, UK, 2016. [Google Scholar]
  23. Shen, Z.; Zhuang, L.; Li, J.; Jiang, Y.; Xue, X. DSOD: Learning Deeply Supervised Object Detectors from Scratch. In Proceedings of the 2017 IEEE International Conference on Computer Vision (ICCV), Venice, Italy, 22–29 October 2017. [Google Scholar]
  24. Duan, K.; Bai, S.; Xie, L.; Qi, H.; Huang, Q.; Tian, Q. CenterNet: Keypoint Triplets for Object Detection. In Proceedings of the 2019 IEEE/CVF International Conference on Computer Vision (ICCV), Seoul, South Korea, 27 October–2 November 2019. [Google Scholar]
  25. Zhou, J.; Tian, Y.; Yuan, C.; Yin, K.; Wen, M. Improved UAV Opium Poppy Detection Using an Updated YOLOv3 Model. Sensors 2019, 19, 4851. [Google Scholar] [CrossRef] [Green Version]
  26. Pang, L.; Liu, H.; Chen, Y.; Miao, J. Real-time Concealed Object Detection from Passive Millimeter Wave Images Based on the YOLOv3 Algorithm. Sensors 2020, 20, 1678. [Google Scholar] [CrossRef] [PubMed] [Green Version]
  27. Liu, J.; Wang, X. Early recognition of tomato gray leaf spot disease based on MobileNetv2-YOLOv3 model. Plant Methods 2020, 16, 1–16. [Google Scholar] [CrossRef]
  28. Sunjay, S. GPR Applications in Energy Resources Exploration. In All India Seminar on “Sources of Planet Energy, Environmental and Disaster Science: Challenges & Strategies” (SPEEDS-2013) on Sep’ 07–08, 2013; The Institution of Engineers (India) State Centre, Lucknow&School of Management Sciences, Technical Campus: Lucknow, India, 2019. [Google Scholar]
  29. Ukhwah, E.N.; Yuniarno, E.M.; Suprapto, Y.K. Asphalt Pavement Pothole Detection using Deep learning method based on YOLO Neural Network. In Proceedings of the 2019 International Seminar on Intelligent Technology and Its Applications (ISITIA), Surabaya, Indonesia, 28–29 August 2019. [Google Scholar]
  30. Du, Y.C.; Pan, N.; Xu, Z.; Deng, F.; Shen, Y.; Kang, H. Pavement distress detection and classification based on YOLO network. Int. J. Pavement Eng. 2020, 1–14. [Google Scholar] [CrossRef]
  31. Bochkovskiy, A.; Wang, C.Y.; Liao, H.Y.M. YOLOv4: Optimal Speed and Accuracy of Object Detection. arXiv 2020, arXiv:2004.10934. [Google Scholar]
  32. Arya, D.; Maeda, H.; Ghosh, S.K.; Toshniwal, D.; Sekimoto, Y. Global Road Damage Detection: State-of-the-art Solutions. arXiv 2020, arXiv:2011,08740. Available online: https://github.com/USC-InfoLab/rddc2020 (accessed on 26 September 2020).
  33. Liu, Z.; Gu, X.; Dong, Q.; Tu, S.; Li, S. 3D Visualization of Airport Pavement Quality Based on BIM and WebGL Integration. Forthcoming. J. Transp. Eng. Part B Pavements 2021. [Google Scholar] [CrossRef]
  34. Yao, L.; Dong, Q.; Jiang, J.W.; Ni, F.J. Deep reinforcement learning for long-term pavement maintenance planning. Comput.-Aided Civ. Infrastruct. Eng. 2020, 35, 1230–1245. [Google Scholar] [CrossRef]
  35. China Highway and Transportation Society, Chts. Technical Guideline for Ground Penetrating Radar Detection for Internal Conditions of Highway Asphalt Pavement. China. 2020. Available online: http://www.chts.cn/upload/file/20201027/6373939111170418695360217.pdf (accessed on 20 October 2020).
  36. Li, S.; Gu, X.; Xu, X.; Xu, D.; Zhang, T.; Liu, Z.; Dong, Q. Detection of concealed cracks from ground penetrating radar images based on deep learning algorithm. Constr. Build. Mater. 2021, 273, 121949. [Google Scholar] [CrossRef]
  37. Tzutalin. LabelImg. Git Code. 2015. Available online: https://github.com/tzutalin/labelImg (accessed on 27 October 2017).
  38. YOLOv5. 2020. Available online: https://github.com/ultralytics/yolov5 (accessed on 30 May 2020).
  39. Rezatofighi, H.; Tsoi, N.; Gwak, J.Y.; Sadeghian, A.; Reid, I.; Savarese, S. Generalized Intersection Over Union: A Metric and a Loss for Bounding Box Regression. In Proceedings of the 2019 IEEE/CVF Conference on Computer Vision and Pattern Recognition, Long Beach, CA, USA, 15–20 June 2019; pp. 658–666. [Google Scholar]
  40. Yosinski, J.; Clune, J.; Bengio, Y.; Lipson, H. How transferable are features in deep neural networks? In Proceedings of the 27th International Conference on Neural Information Processing Systems, Montreal, QC, Canada, 8–13 December 2014. [Google Scholar]
  41. Yao, L.; Dong, Q.; Ni, F.; Jiang, J.; Lu, X.; Du, Y. Effectiveness and Cost-Effectiveness Evaluation of Pavement Treatments Using Life-Cycle Cost Analysis. J. Transp. Eng. Part B Pavements 2019, 145, 04019006. [Google Scholar] [CrossRef]
  42. Yu, B.; Meng, X.; Liu, Q. Multi-objective optimisation of hot in-place recycling of asphalt pavement considering environmental impact, cost and construction quality. Int. J. Pavement Eng. 2018, 21, 1576–1584. [Google Scholar] [CrossRef]
  43. Yu, B.; Wang, S.; Gu, X. Estimation and uncertainty analysis of energy consumption and CO2 emission of asphalt pavement maintenance. J. Clean. Prod. 2018, 189, 326–333. [Google Scholar] [CrossRef]
  44. Lei, M. Research on Comprehensive Evaluation System of Highway Maintenance Cost Benefit. Master’s Thesis, School of Transportation, Southeast University, Nanjing, China, 2019. (In Chinese). [Google Scholar]
  45. Xie, S. Research on Evaluation Method of Maintenance Benefit of Highway Asphalt Pavement. Master’s Thesis, School of Transportation, Southeast University, Nanjing, China, 2016. (In Chinese). [Google Scholar]
Figure 1. Technical roadmap of the detection, data analysis, maintenance measures, and benefits analysis based on traditional detection and ground-penetrating radar (GPR) detection in this research.
Remotesensing 13 01081 g001
Figure 2. View of the tested road network, construction scheme and materials. The map used is the free version of Google Earth 2020.
Remotesensing 13 01081 g002
Figure 3. (a) Pavement testing by inspection van, (b) pavement damage conditions, (c) the core sample of left-pavement, and (d) the core sample of right-pavement.
Remotesensing 13 01081 g003
Figure 4. (a) GeoScopeTM MKIV, (b) DXGTM 1820 ground-coupled antenna arrays, (c) GPS-RTK, and (d) transmit and receive arrays of Radar.
Remotesensing 13 01081 g004
Figure 5. The full field-testing workflow of GPR in Asphalt pavement (B-scan indicates the longitudinal vertical section, C-scan indicates the horizontal section, and D-scan indicates the lateral vertical section).
Remotesensing 13 01081 g005
Figure 6. The workflow of dataset construction for GPR images [36].
Remotesensing 13 01081 g006
Figure 7. The workflow for detection method of the you only look once (YOLO) models.
Remotesensing 13 01081 g007
Figure 8. (a) The loss curve of the YOLOv3 models, (b) the loss curve of the YOLOv5 models, (c) the mAP Curve of the YOLOv3 and YOLOv5 models.
Remotesensing 13 01081 g008
Figure 9. A schematic for detection results of partial tested road. (a) General defect severity and (b) high defect severity.
Remotesensing 13 01081 g009aRemotesensing 13 01081 g009b
Figure 10. (a) The up and down cracking, (b) the top-down developing cracking, and (c) the bottom-up developing cracking.
Remotesensing 13 01081 g010
Figure 11. (a) The first maintenance measure and (b) the second maintenance measure.
Remotesensing 13 01081 g011
Figure 12. The selection of maintenance schemes based on traditional detection and GPR detection.
Remotesensing 13 01081 g012
Figure 13. The contrast for maintenance cost (a) and economic effectiveness (b) of the two detecting methods.
Remotesensing 13 01081 g013
Figure 14. The contrast for energy consumption (a) and carbon emissions (b) of the two detecting methods.
Remotesensing 13 01081 g014aRemotesensing 13 01081 g014b
Table 1. The detection results of pavement defects investigation.
Disease CrackingSettlement
Structural Layer N lL lD lN rL rD rN lA lN rA r
Asphalt surface126337.61.484174.10.714.527.3
Base
Subbase
l Left side, r right side (N-number, L-length (m), D-density (N/m), A-area (m2)).
Table 2. The technical specifications of GeoScopeTM MKIV and DXGTM 1820.
GeoScopeTM MKIV
Data Acquisition
DXGTM 1820
Ground-Coupled Antenna Array
IndicatorsParametersIndicatorsParameters
AntennasCompatible with all 3D-RADAR DX and DXG antenna array modelsWidth1.8 m
Number of channels0~21Frequency range200–3000 MHz
Scan patternLiner scan, multi-offset, and common mid-pointNumber of channels21
Frequency bandwidth2.9 GHz (100–300 MHz)Channels spacing (Crpss-line)75 mm
Resolution (time)≥0.34 nsEffective scan width1.5 m
Time range≤250 nsDirect wave suppression>50 dB
Scan rate13,000 A-scans per secondPolarization (in-line direction)Linear
Table 3. Tested road section.
LocationStake Number of Starting PointStake Number of Ending PointBreadth of RoadLength/mNumber of Lines Testing ContentNumber of Repeated ScansTesting Mileage/m
S210K46 + 000K51 + 000Full width50002disease110,000
Table 4. The classification criteria of defects.
Typical Images of Abnormal GPR SignalsJudgement Excavation for Verifying
B-ScanDescriptionC-ScanDescription
Remotesensing 13 01081 i001Both sides of the waveform in-phase axial near horizontal distribution accompanied interruption or dislocation Remotesensing 13 01081 i002Similar to the shape pf cracking (long strip)Cracking Remotesensing 13 01081 i003
Remotesensing 13 01081 i004Reflected waves of in-phase axial clearly protrude toward the top Remotesensing 13 01081 i005Irregular bright-spotsVoid Remotesensing 13 01081 i006
Table 5. Architecture and improvement of you only look once version 3 (YOLOv3) and YOLOv5.
ModelBackboneNeckHeadMain Improvement
YOLOv3DarknetFeature Pyramid NetworkYOLOv3
YOLOv5sCross-stage Partial DarknetPath Aggregation NetworkMosaic (Data Augmentation)
GIoU (estimating the bounding box loss)
Auto-learning bounding box anchors (adjusting and optimize the choice of anchors)
Table 6. Training results of these six models of YOLO series.
ModelPRF1mAP/% FPSInference Time/msWeights/MB
YOLOv30.730.860.7980.110.521920.65235
YOLOv3-tiny0.660.650.6967.594.52221.4833.1
YOLOv5s0.790.870.8587.533.45289.8126.4
YOLOv5m0.760.940.8291.611.36735.5483.2
YOLOv5l0.770.950.8691.590.661526.37190
YOLOv5x0.750.950.8594.450.372735.15364
(P = precision, R = recall rate, F1score = 2P*R/(P+R), mAP = mean average precision, FPS = frames per second).
Table 7. The defects detection results of the left side of road.
DiseaseCrackingVoidRavelingSettlement
Structural Layer N 1L 2D 3NA 4NANA
Asphalt surface132354.91.541314.5
Base103238.51.051613.828.2
Subbase
1 N-number, 2 L-length (m), 3 D-density (N/m), 4 A-area (m2).
Table 8. The defects detection results of the right side of road.
DiseaseCrackingVoidRavelingSettlement
Structural Layer N 1L 2D 3NA 4NANA
Asphalt surface921890.827.3
Base86151.60.6135214.2
Subbase
1 N-number, 2 L-length (m), 3 D-density (N/m), 4 A-area (m2).
Table 9. The average cost and economic effectiveness of the two maintenance measures.
Maintenance MeasuresThickness of Treatment (m)Average Cost ($/m2)Economic Effectiveness 1Economic Effectiveness 2
MR0.0411.1293.8888.62
OPR0.014.6490.7385.47
1 Low traffic, 2 high traffic.
Table 10. The energy consumption (left) and carbon emissions (right) of the two maintenance measures [45].
Maintenance Measures Maintenance Measures
Maintenance Sessions MROPRMaintenance Sessions MROPR
Milling1770.83 Milling131.22
Raw materials production12,298.5312,298.53Raw materials production756.05756.05
Mixture11,469.1511,469.15Mixture925.58925.58
Transport2146.602146.60Transport159.06159.06
Spreading 681.09681.09Spreading 50.4750.47
Compaction 1225.961225.96Compaction 90.8490.84
Totally29,592.1727,821.34Totally2113.231982.01
Thickness of treatment (m)0.040.04Thickness of treatment (m)0.040.04
Energy consumption (MJ/m2)78.9174.19CO2 emissions (kg/m2)5.645.29
——————Carbon emissions (kg/m2)1.541.44
(The construction process of some sessions in the MR and OPR measures are the same)
Publisher’s Note: MDPI stays neutral with regard to jurisdictional claims in published maps and institutional affiliations.

