1. Introduction
It is evident that the determination of the current condition of reinforced concrete structures and the verification of their safety is of utmost importance. This is why non-destructive testing (NDT) and combinations of different diagnostic methods are favored for evaluations of structure conditions.
The basic method is a visual inspection and evaluation of the occurrence of changes and defects visible on the surface. Preference is given to methods working in 3D, enabling automatic evaluation, such as photogrammetry, interferometry, laser scanning, etc. [
1,
2,
3].
Diagnostic test methods can be divided into destructive, partially destructive, and non-destructive methods. Ground penetrating radar (GPR) has an irreplaceable place among other diagnostic methods (sonic, ultrasonic, microwaves, radiography, infrared thermography) that are used for testing reinforced concrete materials and structures [
4].
GPR is commonly used as a diagnostic method for a variety of applications [
5]. There are more or less sophisticated applications that focus on determining the rebar position and concrete cover thickness [
6,
7,
8], some are trying to determine rebar diameter [
8,
9], or identify rebar corrosion in concrete structures [
10]. Combinations of GPRs with other methods are also used to refine the measurement results, e.g., with electromagnetic induction [
8], electrical resistivity [
11], ultrasonic techniques [
12] or to compare the possibilities of individual methods with each other [
13].
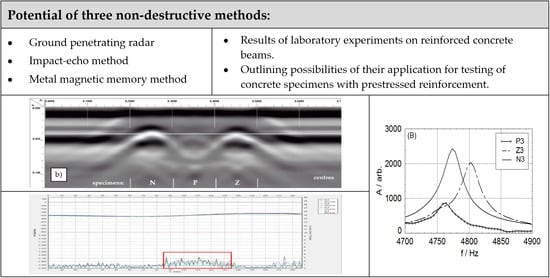
The presented work aims to investigate the potential of three non-destructive methods to detect different reinforcement conditions in reinforced concrete beams. It is a single-channel ground penetrating radar, with a common commercial way of evaluating the recording of this measurement, compared to one commonly used method, i.e., impact-echo, which allows measurements outside the area (not directly above it) and the metal magnetic memory method, which is not yet commonly used for the purpose of evaluating built-in reinforcement in concrete.
The measurements described below were performed as the first step in a project aimed at evaluating the condition of prestressed concrete beams.
In the case of GPR, it can be stated in this context that it allows the measurement of the position of the reinforcement and the thickness of the concrete cover of the reinforcement. It is a fast measurement that can be preliminarily evaluated directly from the recorded radargram in situ and indicate the position of the reinforcement directly on the surface of measured specimens/structures. In the case of dense reinforcement in rows one above the other, it has limitations, and if the reinforcement were placed in a steel duct (e.g., prestressing reinforcement), it is not possible to assess the condition of this reinforcement. This method does not record the state of reinforcement in terms of stress/load to which the specimen/structure has been subjected.
In the case of the impact-echo method, the method is suitable for the detection, localization, and evaluation of discontinuities inside concrete [
14,
15,
16], including evaluation of nonlinear effects [
17,
18,
19]. Its advantage is that it allows measuring even in cases where it is not possible to evaluate the condition of the reinforcement directly in the monitored area (directly above it). It is possible to measure at different distances between the exciter and the sensor. This method is less user-friendly than GPR and, like GPR, cannot detect the state of reinforcement in terms of stress/load to which the specimen/structure has been subjected.
The metal magnetic memory method can record the stress/load condition of steel elements, even when they are no longer exposed to this stress [
20,
21,
22,
23]. The condition of the concrete cover does not affect the results of this measurement. At present, the method is used mainly for evaluating the condition of iron and steel structures, or underground pipelines and there is not enough experience with its application on reinforced concrete structures.
These three methods were applied in a laboratory environment where the different reinforcement conditions were simulated by the use of reduced diameter of reinforcing bars in concrete beams. The comparison of the measured parameters obtained for different specimens was performed.
2. Description of Specimens
For this experiment, three variations of concrete beams with dimensions of 100 mm × 100 mm × 400 mm were made. They were reinforced with one steel reinforcing bar with a 10 mm diameter and a length of 400 mm, passing through the center of the specimen, see
Figure 1.
The following reinforcement variations were used: an undamaged reinforcing bar with the same diameter along the whole beam length (denoted N), reinforcing bar impaired to a diameter of 5 mm in the length of 50 mm (denoted Z), and reinforcing bar interrupted in the length of 50 mm (denoted P). These variations cover the basic three possibilities with the biggest difference between each other.
3. Ground Penetrating Radar
Ground-penetrating radar (GPR) is equipment that uses high-frequency electromagnetic waves. In combination with the corresponding software, it provides the location and an evaluation of the electrical and magnetic features of the studied environment in which these waves radiate.
A transmitting antenna (Tx) sends a wave into the structure that is examined. Because of discontinuities in the structure, a part of the energy is reflected back while a part continues through the structure. The reflected signal is recorded by the receiving antenna (Rx) and analyzed in a central unit (
Figure 2a). A discontinuity could be a boundary or interface between two materials/layers with different dielectric properties, their debonding or delamination, or the presence of inbuilt objects, such as reinforcement. The amplitudes of the detected echoes (
Figure 2b) and the corresponding arrival times can then be used to locate the discontinuity. Low-frequency antennas allow performing measurements at greater depths, but with lower resolutions. On the other hand, high-frequency antennas provide higher resolutions, but in a smaller depth. Concrete structures are commonly inspected with the use of antennas with a central frequency above 1 GHz.
3.1. Data Acquisition
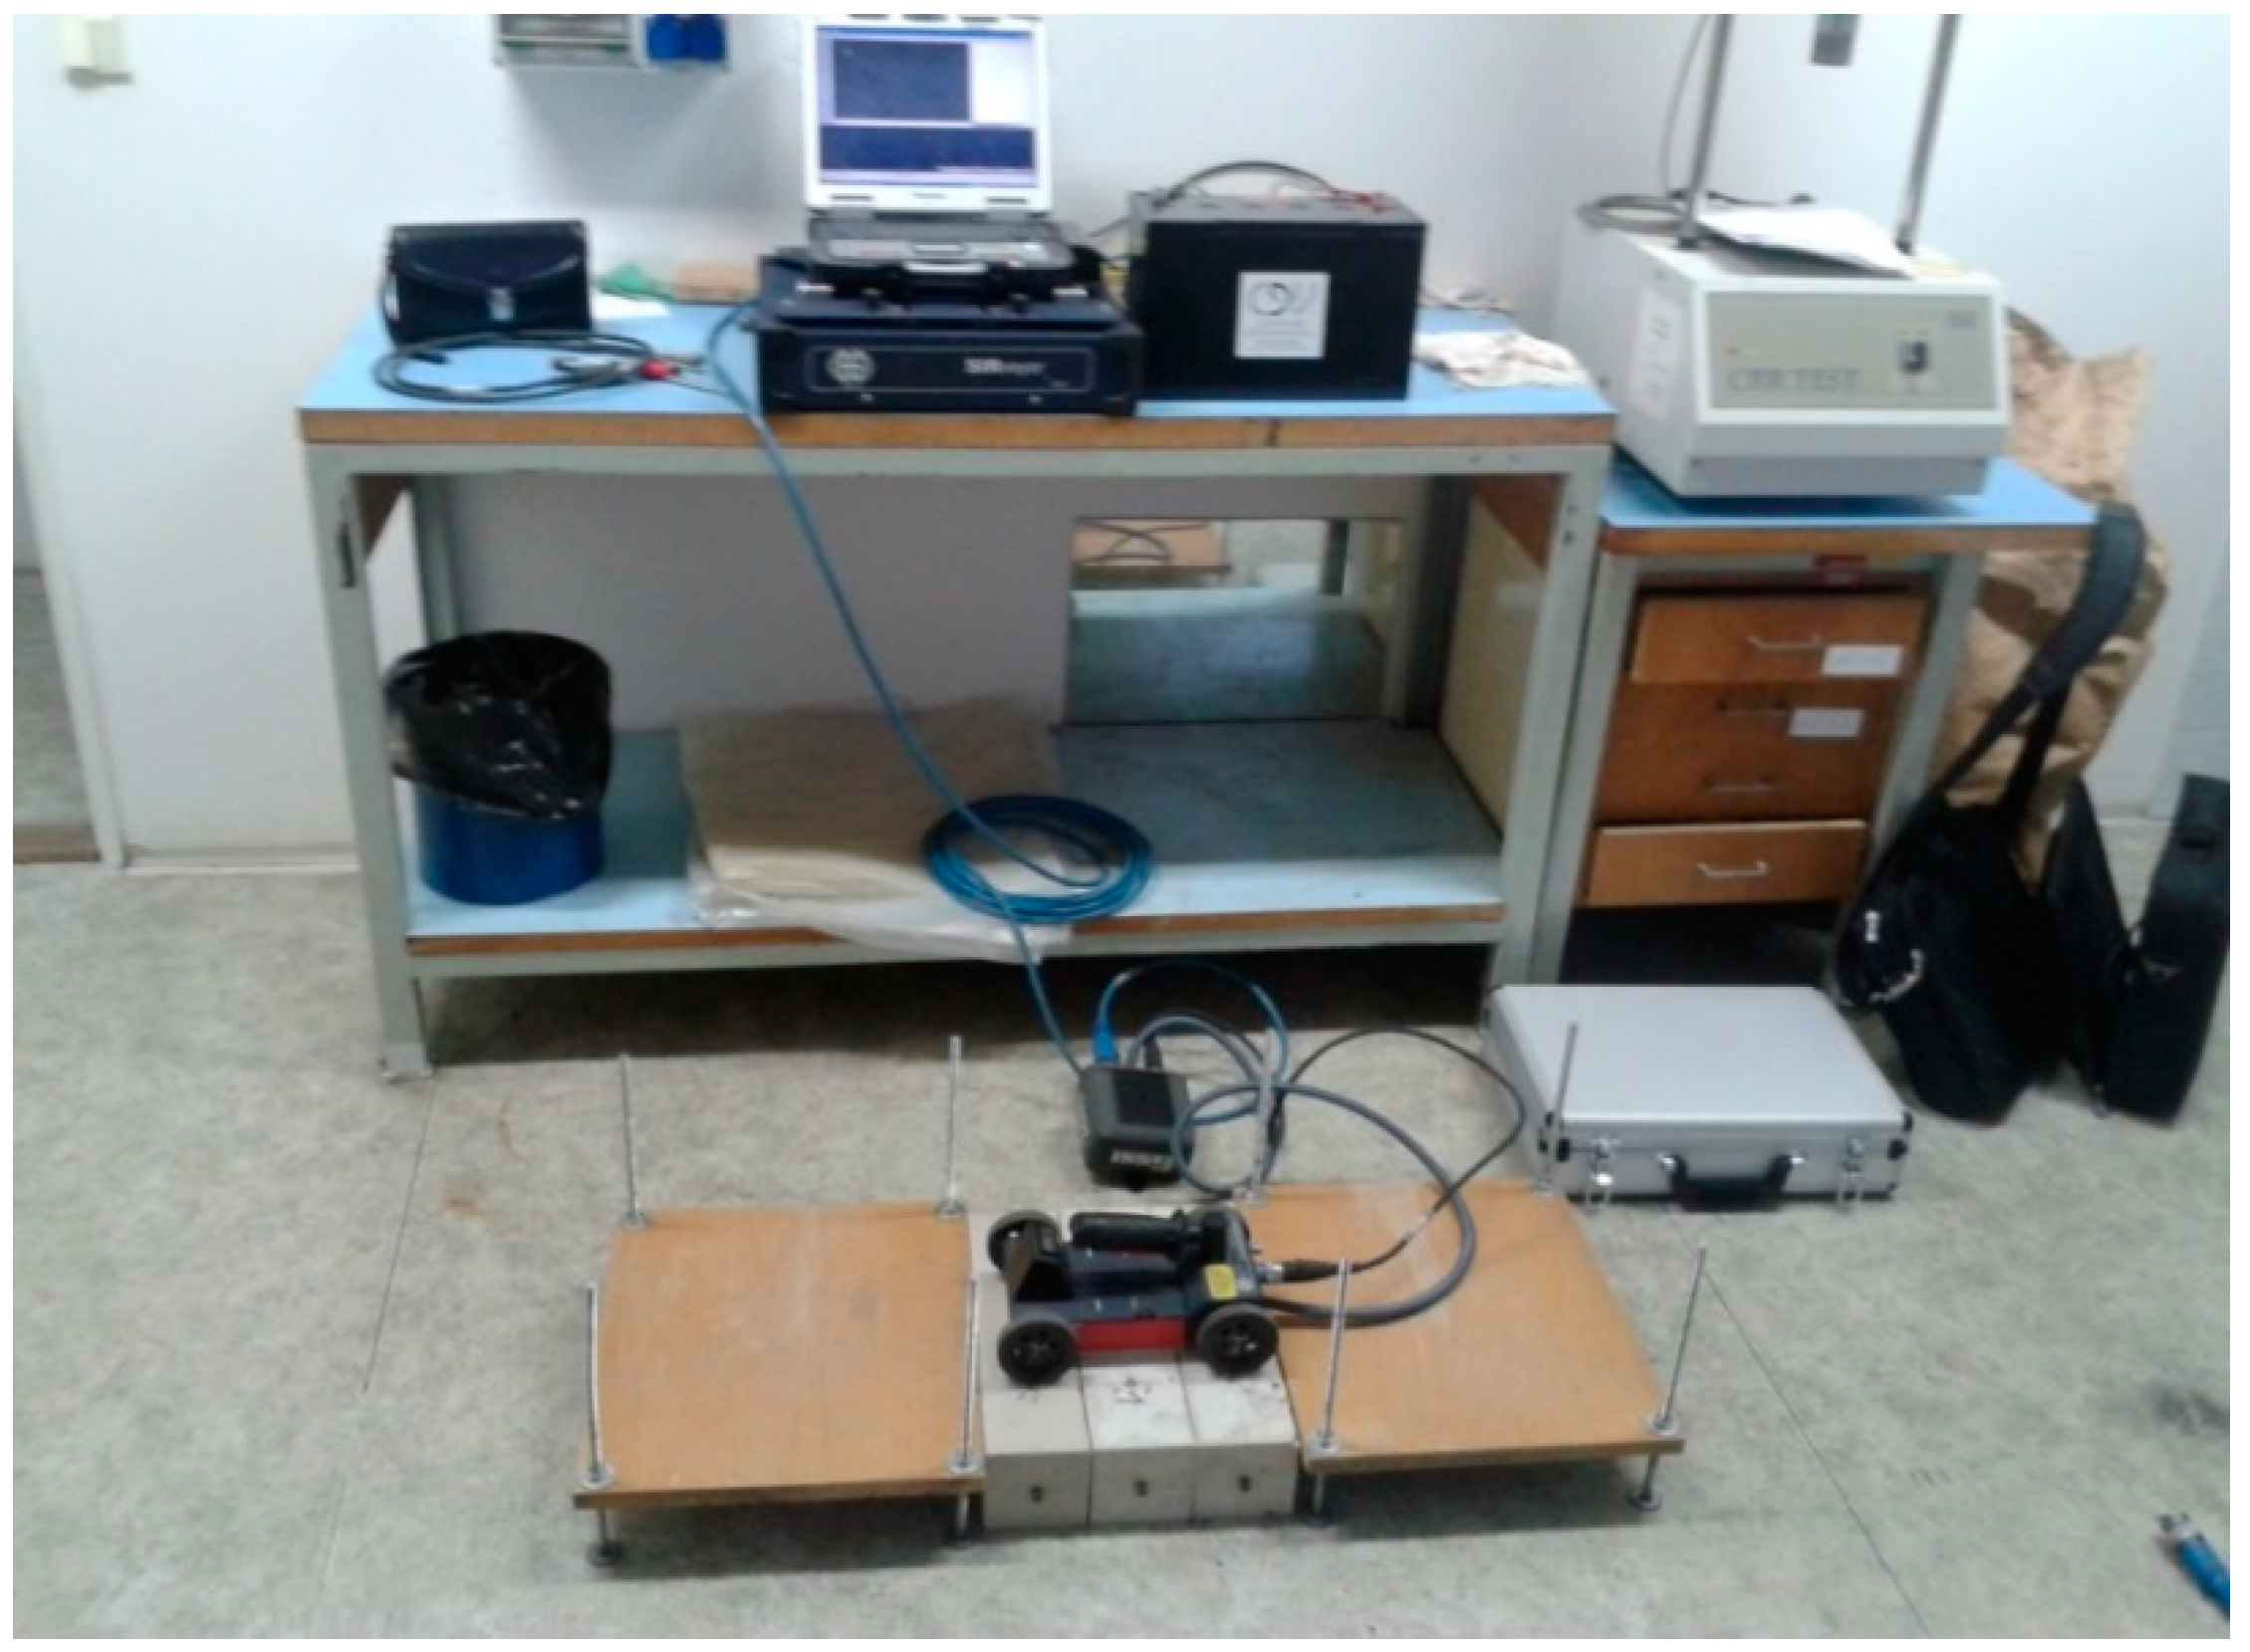
For this experiment the measurement system SIR-20 of the American company Geophysical Survey Systems, Inc. was used (
Figure 3). An antenna 2600 MHz was attached to a trolley in order to measure in a single line and allow recording of the traveled distance.
Measurement device adjustment was as follows:
Vertical high pass filtering HP F = 400 MHz;
Vertical low pass filtering LP F = 5070 MHz;
Range Gain: in order to highlight reinforcement bar surroundings;
Position measurement by trolley: 2000 scans/m, 153 scans/s;
Resolution: 512 samples/scan.
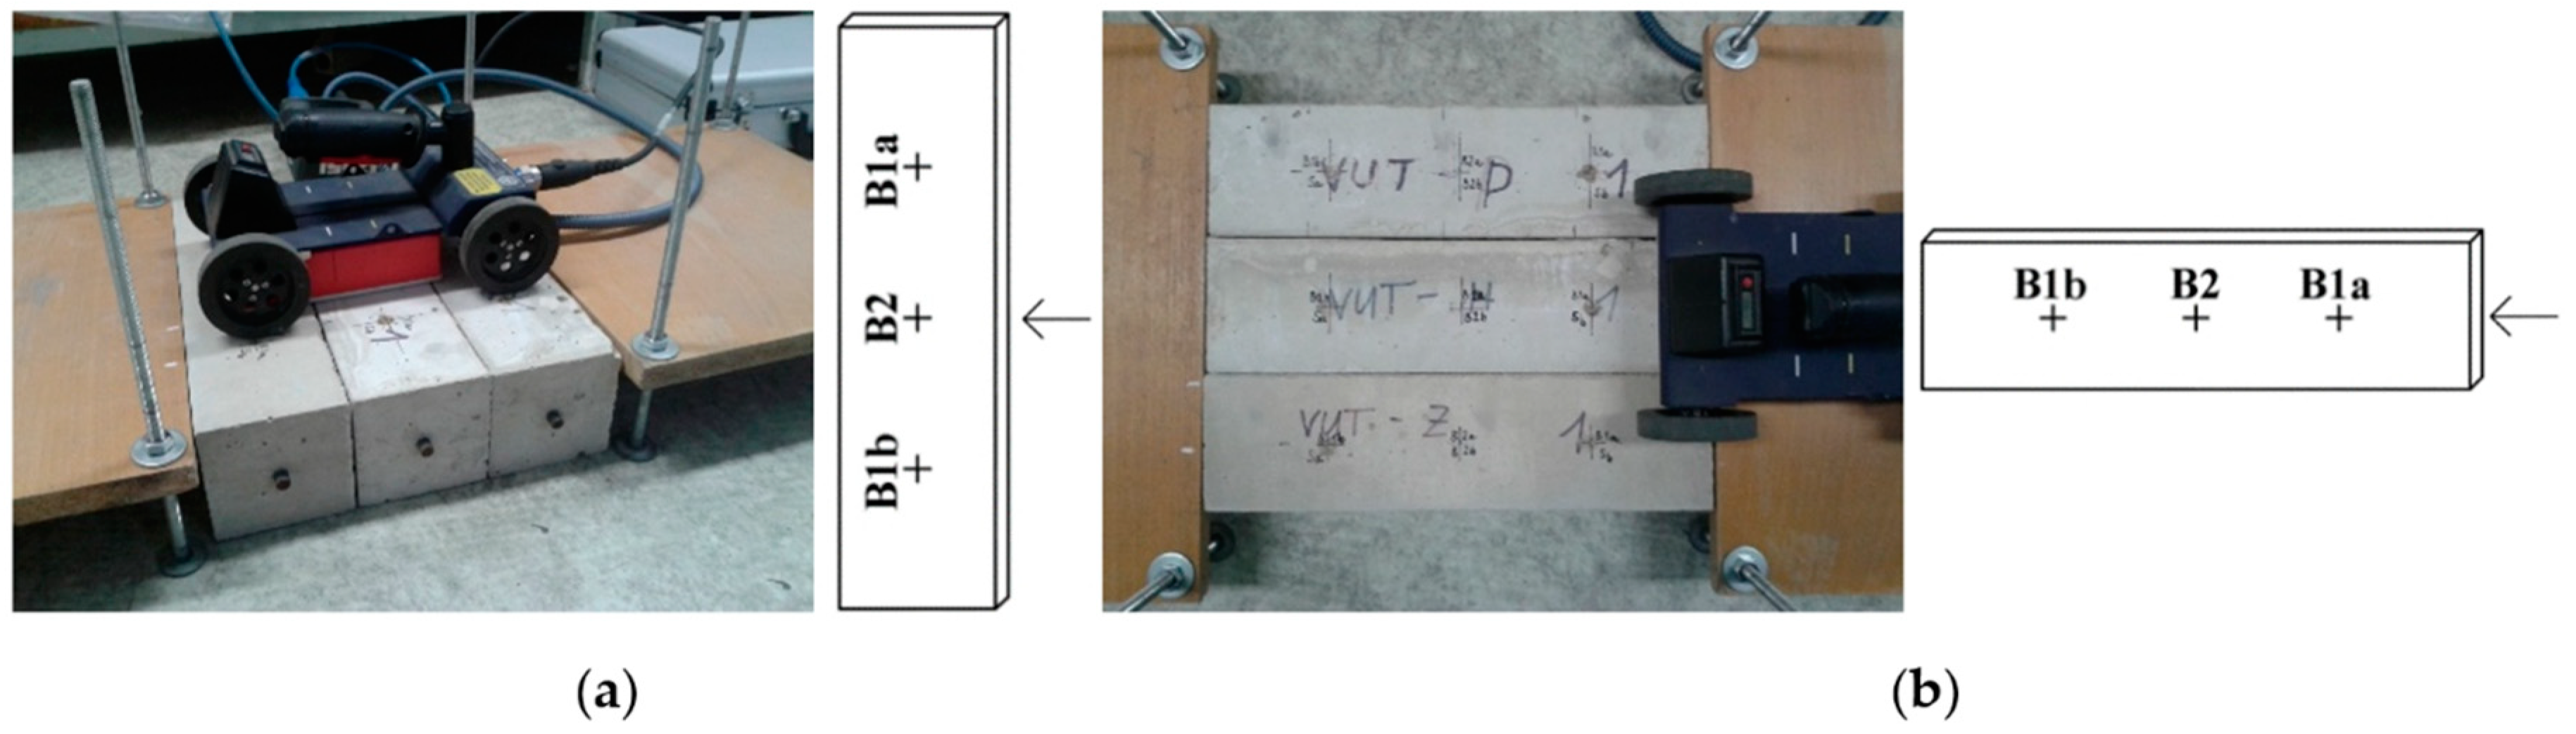
Timber ramps were used for the trolley movement. The measurement was repeated three times in laboratory conditions at a temperature of 20 °C. Measurement orientations were as follows, see
Figure 4:
Transversal direction:
- (a)
crossing above the right part of specimens (N-B1a; P-B1a; Z-B1a);
- (b)
crossing above the center of specimens (N-B2; P-B2; Z-B2);
- (c)
crossing above the left part of specimens (N-B1b; P-B1b; Z-B1b).
Longitudinal direction:
- (a)
crossing above specimen N (line N-B1a; N-B2; N-B1b);
- (b)
crossing above specimen Z (line Z-B1a; Z-B2; Z-B1b);
- (c)
crossing above specimen P (line P-B1a; P-B2; P-B1b).
3.2. Results and Discussion
Records from GPR measurements performed on specimens with reinforcing bar type (N, P, Z) in transversal direction are shown in
Figure 5.
Three identical hyperboles were evident in GPR records across the right parts and the left parts of the specimens (
Figure 5a,c) representing the reinforcing bar upper surface in all specimens (N, P, Z). The peaks of hyperboles with the highest amplitude were cut through by a reference horizontal (white) line. It confirmed that the reinforcing bar surfaces were at the same depth.
Figure 5b) illustrates the results of measurements across the center of the specimens. In this case, we could see that the plus amplitude value of the central hyperbole, corresponding to the interrupted reinforcing bar denoted as P, was much lower and its peak was located under the reference horizontal line. This corresponded to the fact that during the crossing, the end of the interrupted reinforcement 2.5 cm from the measurement axis was captured in the record. The hyperbole in
Figure 5b on the right corresponded to specimen Z with an impaired reinforcing bar and it was visible that the hyperbole peak was located under the horizontal reference line.
The measured data were evaluated using software RADAN 7.4 in the Interactive Interpretation module which allowed the determination of the depth of the reinforcing bars from the concrete specimen’s surface on the basis of the known velocity of electromagnetic signal propagation. The propagation velocity (v = 0.113 m/ns) was determined by the use of the known depth of the reinforcing bar at the beam’s ends. The measurements were repeated above the measurement positions three times. Calculated mean values of direct wave attenuation (expressing the ratio of the signal amplitude corresponding to the surface of the reinforcement and the surface of the concrete) [
11] (p. 365) and reinforcing bar location depth are summarized in
Table 1.
The bold numbers from
Table 1 show different measurement results. In the case of the impaired reinforcing bar—specimen Z—there was a moderate increase of direct wave attenuation and partial increase of reinforcing bar depth. In the case of the interrupted reinforcing bar 2.5 cm from the measurement axis—specimen P—there was a striking increase of direct wave attenuation and increase of reinforcing bar depth.
The evaluation of records from GPR measurements performed on specimens in the longitudinal direction is shown in
Figure 6. The analyzed boundaries represent the reinforcing bar’s upper surface in measured beams. These boundaries were visible at a depth of about 0.04 m at a distance of approximately 0.2 to 0.6 m in a longitudinal direction. The shape and length of reinforcing bar surface boundaries are evaluated and sketched in the lower right corners of
Figure 6. A change in reinforcing bar surface depth was not observed in the case of specimen N with the undamaged reinforcing bar (
Figure 6a). A smaller change was visible in the case of specimen Z with an impaired reinforcing bar (
Figure 6b) and a marked change was apparent in the case of specimen P with an interrupted reinforcing bar (
Figure 6c).
Mean values of length change
d and depth change
h in view of boundaries representing the reinforcing bar upper surface are summarized in
Table 2.
From
Table 2 it is evident that in the case of specimen N, with an undamaged reinforcing bar, changes were not observed. In the case of specimen Z with an impaired reinforcing bar in its center, the necking (3 mm) of the reinforcing bar upper surface in the length of 55 mm was apparent. The biggest changes corresponded to specimen P with a reinforcing bar interrupted in its center. In this case, we could see the amplitude of the lower value and the necking (5 mm) of the reinforcing bar upper surface in a length of 47 mm in its center due to the missing part of the bar.
4. Impact-Echo Method
The second applied method was impact-echo. It is based on the propagation of stress waves, which are generated by a mechanical impulse; the scheme is shown in
Figure 7. A short-duration mechanical impact, produced by tapping a hammer against the surface of concrete, produces low-frequency stress waves (from 1 to 60 kHz) that propagate into the structure and are reflected by flaws and/or external surfaces [
14,
19]. Reflected waves are recorded on the surface by a sensor in the form of a voltage signal. The resulting voltage versus time plot (time-domain realization) is digitized and fed into the memory of a computer, which subsequently performs the frequency analysis. A time realization and the corresponding frequency spectrum were the results of this test.
Any implementation of such tests requires a reference standard and its frequency spectrum to be set down. An undamaged reinforcing bar of the same diameter along the whole length of the beam N was the reference standard in our case. If the test specimen material properties differ from those of the reference standard (i.e., impaired reinforcing bar represented by the specimen Z and interrupted reinforcing bar represented by the specimen P), the resonance frequency will be shifted against that of the reference standard.
4.1. Data Acquisition
A mechanical impulse, provided by a special hammer, was applied at the exciter points E. A piezoelectric sensor S, operating in a frequency range from 100 Hz to 50 kHz, was used to pick up the specimen response, see
Figure 8. The THPS3_25 HandyScope3 measuring unit and a special signal-analysis software package were used for sampling and further processing of captured signals.
Seven mechanical impulse-to-sensor configurations were measured, see
Figure 8a. The results were verified by repeated measurement (three times). Various impulse intensity and response frequency spectra were also analyzed from the viewpoint of nonlinear effects [
18,
19].
The results obtained from three configurations (
Figure 8b) are presented below.
4.2. Results and Discussion
Measurement results are presented in the form of response frequency spectra.
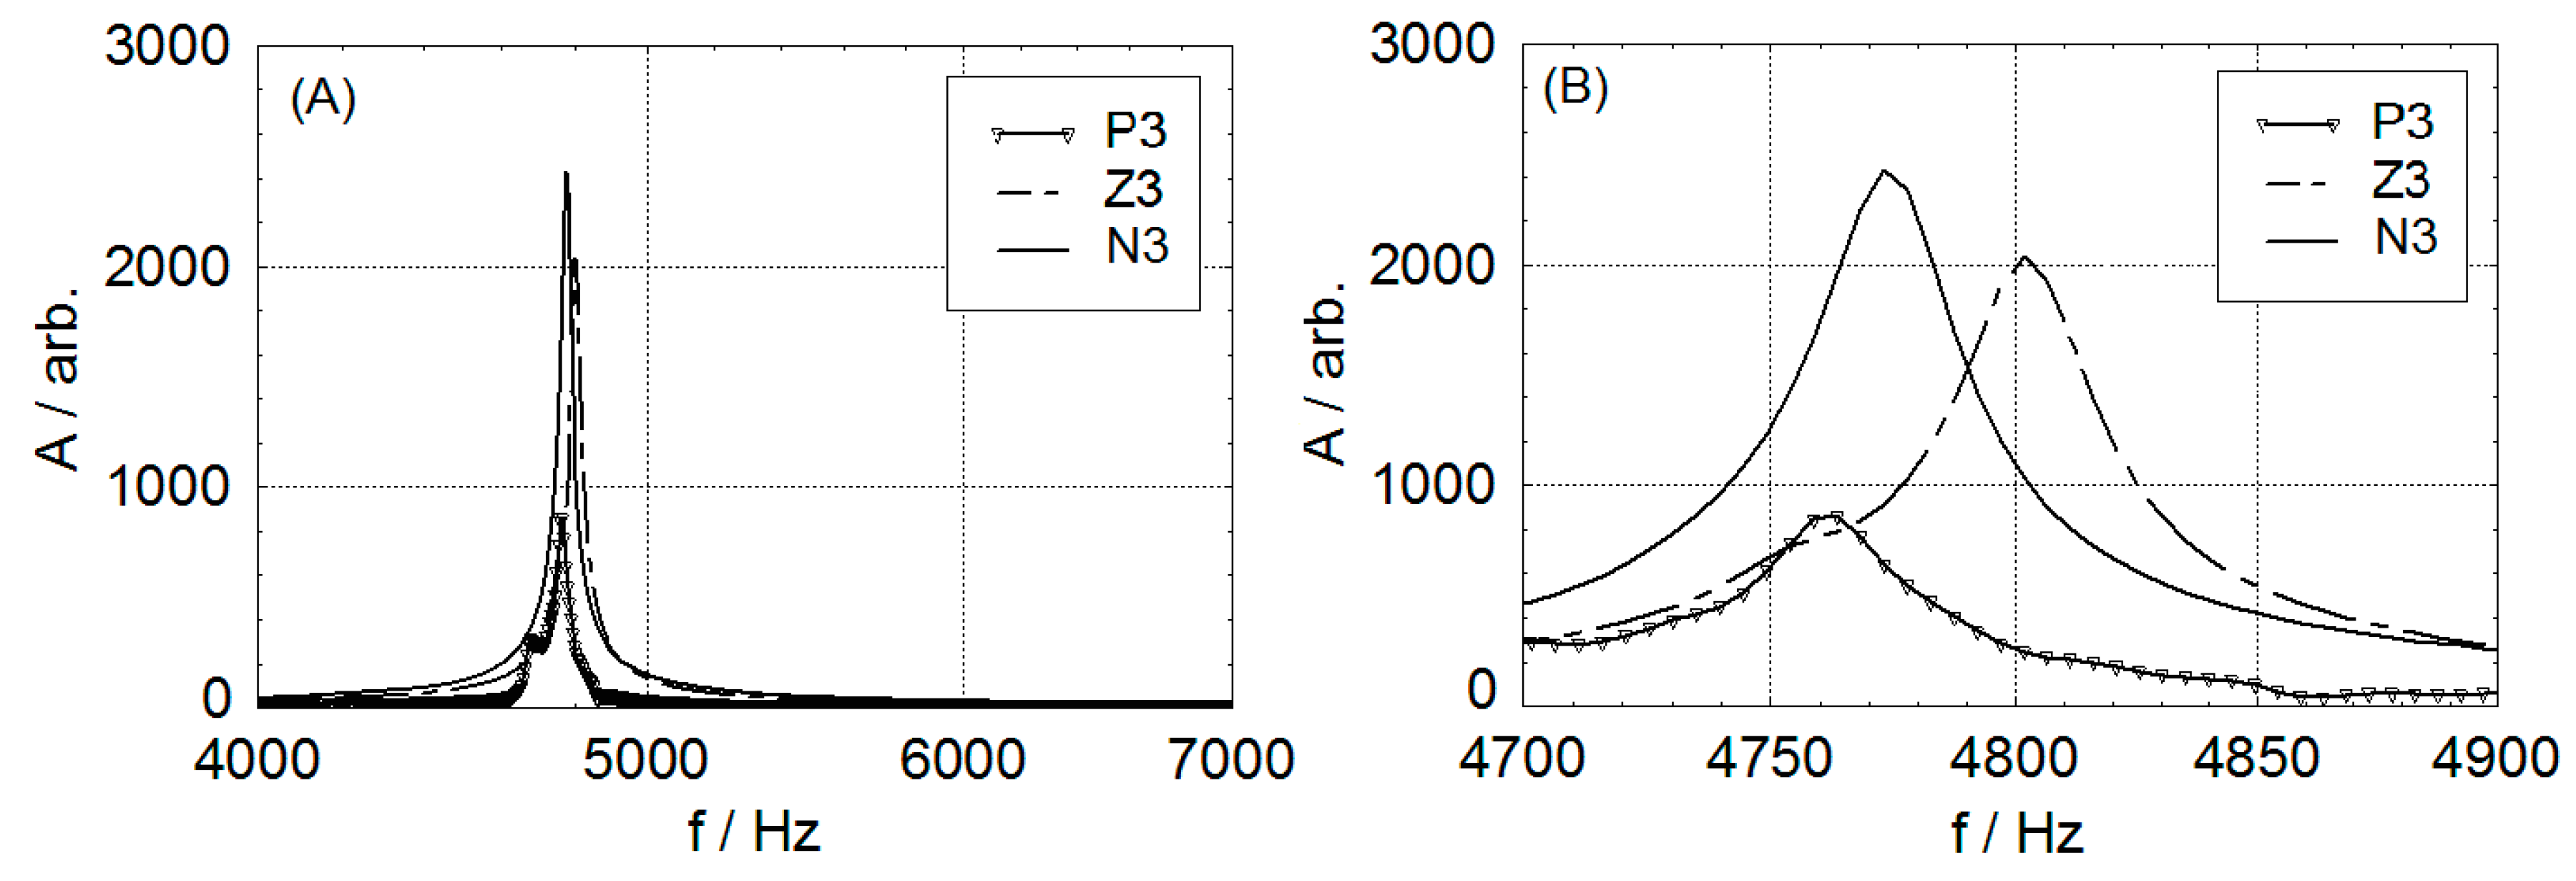
Figure 9 shows a frequency spectrum obtained from all specimen types (N, Z, P) corresponding to the 3rd configuration of E1b impulse-to-Sb sensor location, see
Figure 8b. The predominant frequencies occurred in the frequency range of 4700 to 4850 Hz, as shown in
Figure 9.
Figure 9A shows the whole frequency range and
Figure 9B shows details of the predominant frequency range.
The predominant frequency of the value of 4773 Hz (graph B) corresponded to specimen N, with an undamaged reinforcing bar. The response frequency spectrum Z corresponded to a specimen with a bar locally impaired in its central part. The peak frequency of 4802 Hz signified a shift of 29 Hz to the right in comparison with the N specimen. The response frequency spectrum P corresponded to a specimen with a reinforcing bar interrupted in its central part. The predominant frequency shifted to a lower value, namely 4762 Hz, which corresponded to a shift of 11 Hz in comparison with the N specimen.
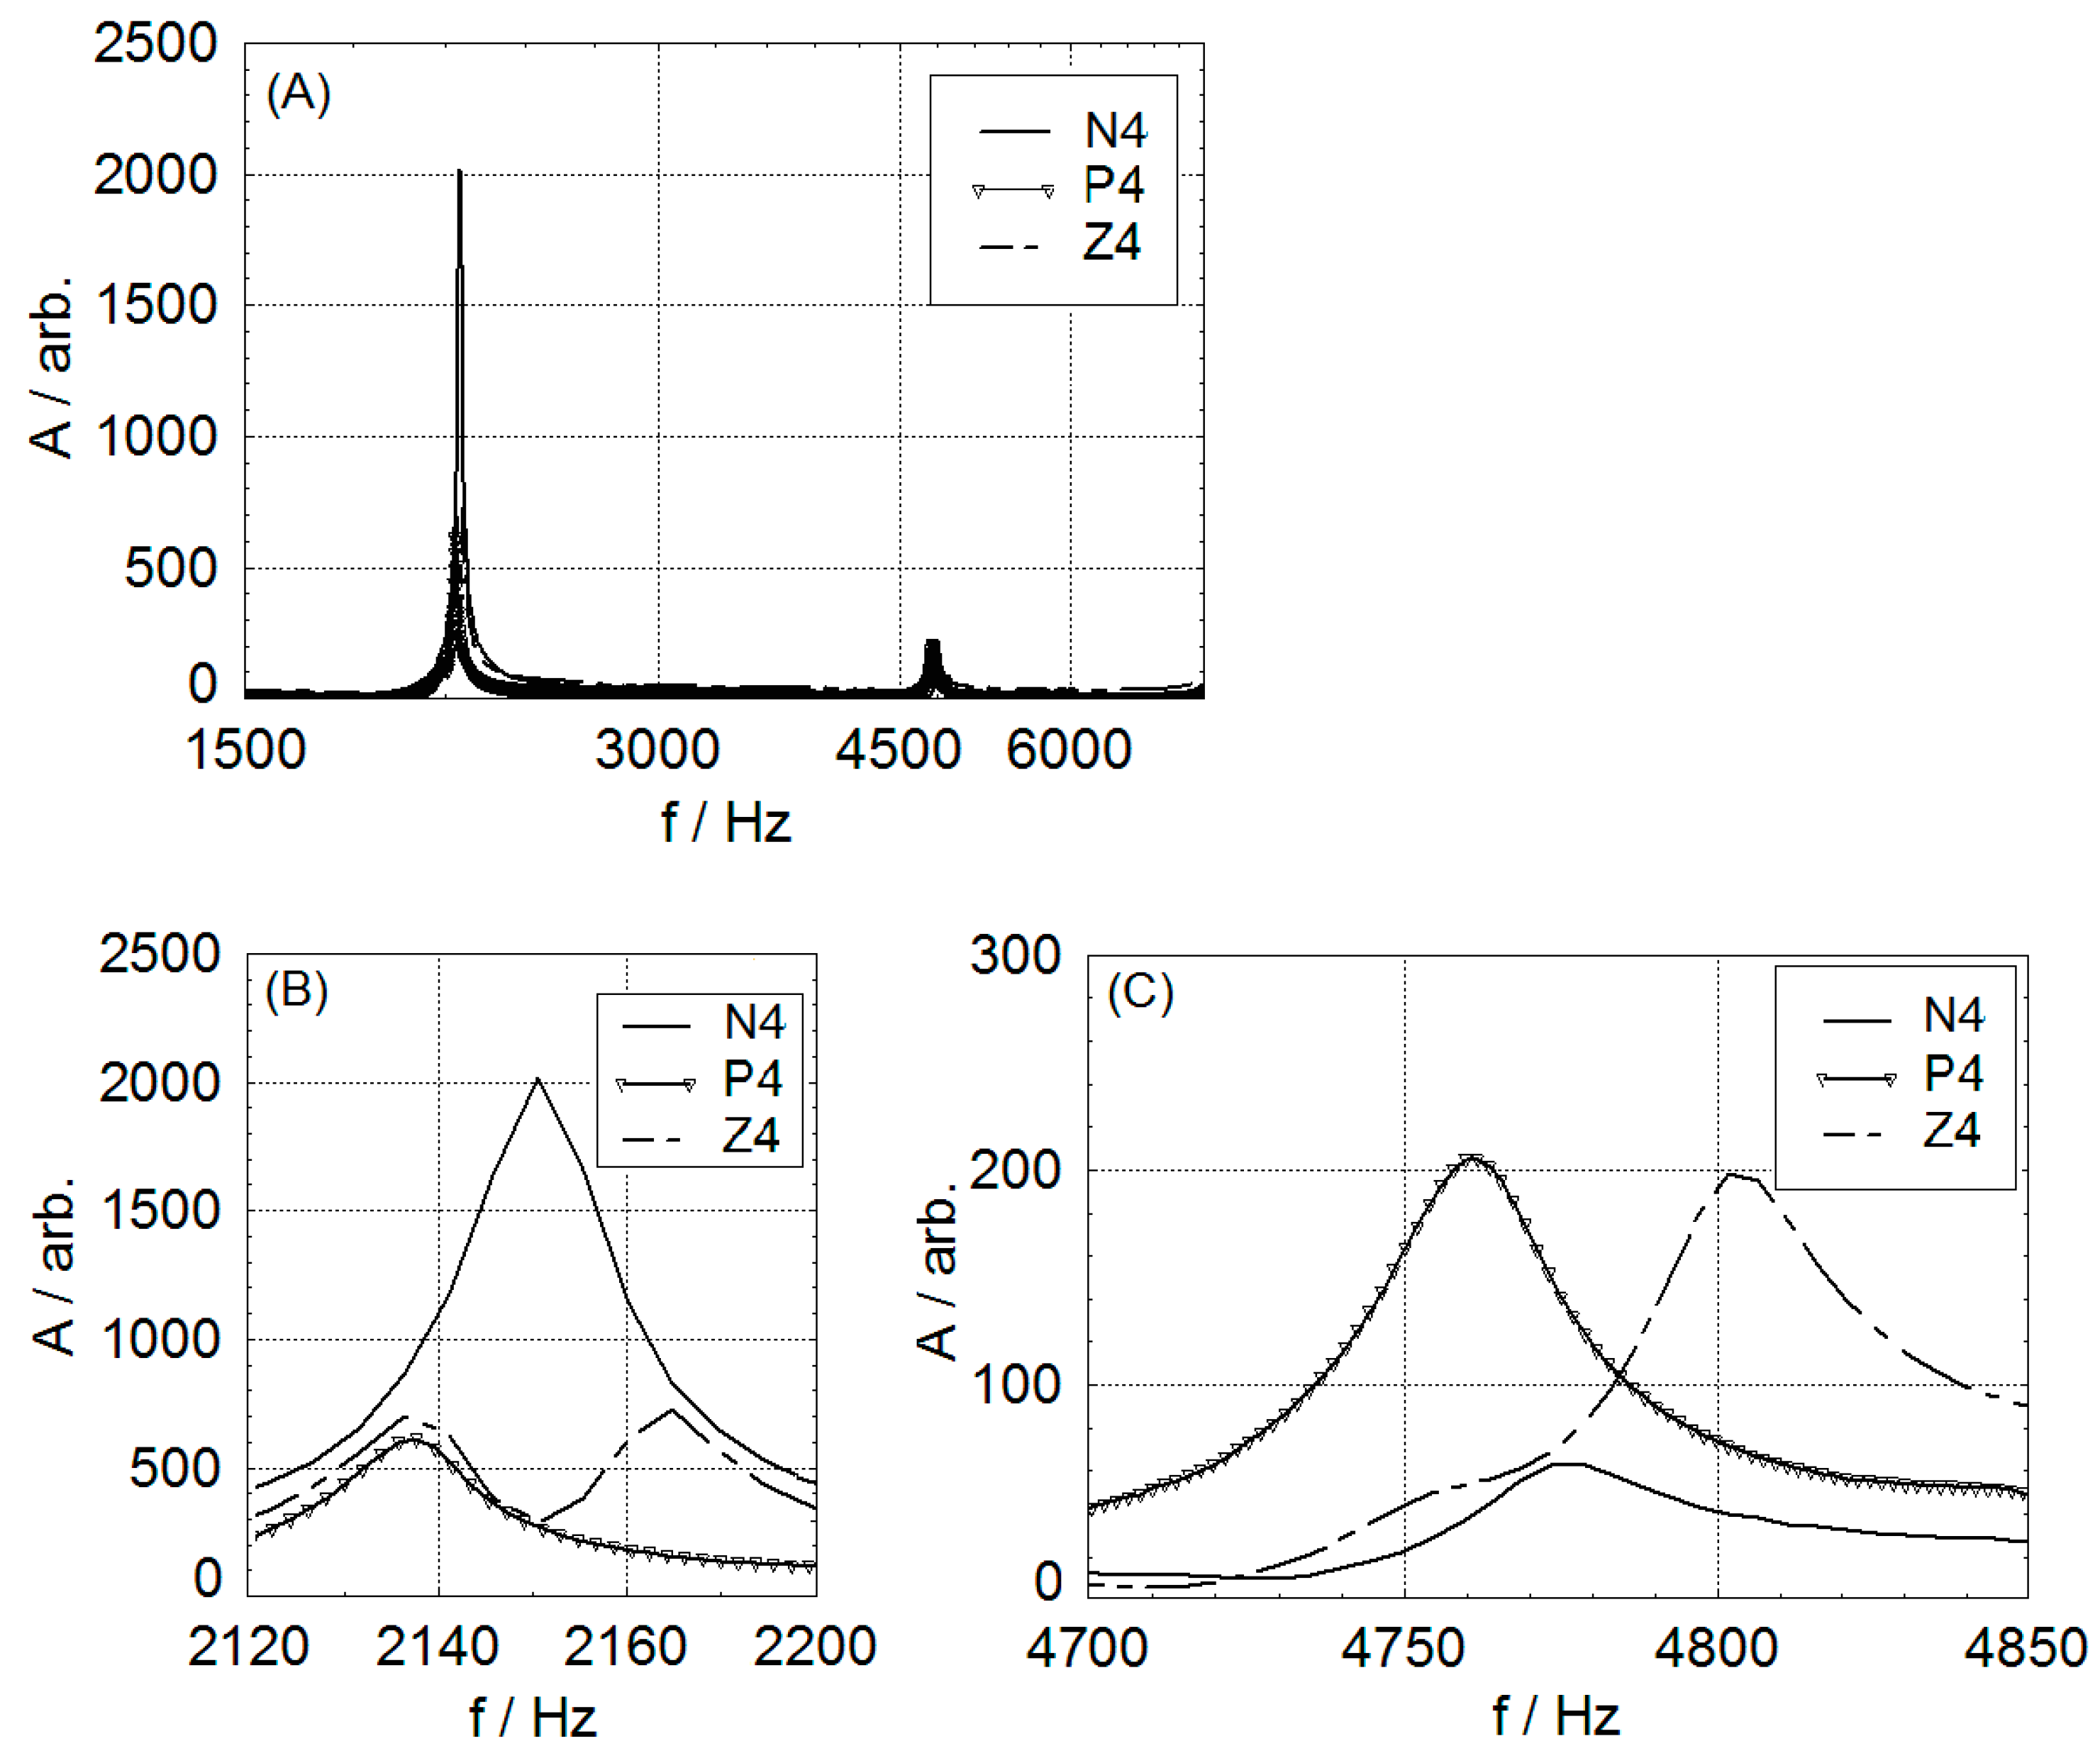
Figure 10A analogically compares measurement results from the 4th configuration of E2b impulse-to-Sb sensor location.
Figure 10B illustrates a detail of the frequency range from 2120 Hz to 2200 Hz. In this case, the dominant frequency value of 2151 Hz pertains to the N specimen with an undamaged reinforcing bar. The difference is evident in the case of specimen Z with a reinforcing bar locally impaired in its central part; two peaks were evident in this response frequency spectrum. The first peak of 2136 Hz occurred to the left of the predominant frequency of specimen N. The second peak occurred to the right of the predominant frequency of specimen N and its value equaled 2165 Hz. The frequency spectrum P corresponded to the specimen with a reinforcing bar interrupted in its central part. In this case, the predominant frequency shifted to value 2137 Hz on the left similar to specimen P (
Figure 9B).
Figure 10C illustrates a detail of the frequency range from 4700 Hz to 4 50 Hz, which corresponded to the predominant frequency range in the case of the 3rd configuration (
Figure 9). The peak frequency of 4776 Hz pertained to the N specimen, with an undamaged reinforcing bar. The response frequency spectrum Z corresponded to a specimen with a reinforcing bar locally impaired in its central part. Its frequency peak occurred at the value of 4802 Hz, which meant a shift of 26 Hz to the right, as in the case of the Z specimen (
Figure 9B), in comparison with the N specimen. The frequency spectrum P corresponded to a specimen with a reinforcing bar interrupted in its central part. In this case, the predominant frequency shifted to the value of 4760 Hz to the left also similar to specimen P (
Figure 9B).
Figure 11 shows the response frequency spectrum for the 6th configuration of the E6 impulse-to-S6 sensor location.
Figure 11A shows the whole frequency range and
Figure 11B shows details of the predominant frequency range. The predominant frequencies proved similar values as shown in
Figure 10B.
The dominant frequency value of 2129 Hz pertained to specimen N, with an undamaged reinforcing bar. Frequency spectrum Z6 corresponded to a specimen with a reinforcing bar locally impaired in its central part. It was seen that the predominant frequency with two peaks was similar to the 4th orientation (
Figure 10B); however, both peaks occurred to the right of the predominant frequency of specimen N. The first peak value equaled 2138 Hz and the second peak value equaled 2164 Hz. The frequency spectrum P corresponded to the specimen with a reinforcing bar interrupted in its central part. The predominant frequency shifted to the value of 2102 Hz to the left of the predominant frequency of specimen N, similar to
Figure 9 and
Figure 10B.
To verify measurement results, reproducibility measurements were repeated three times. Mean values of dominant frequencies are summarized in
Table 3.
A mechanical impulse of various intensities was used and response frequency spectra were also analyzed from the viewpoint of nonlinear effects. Higher impulse intensity normally produces a shift of dominant frequency in the case of a presence of cracks and other defects in the specimen structure. All specimens proved good reproducibility of measurement results and the presence of nonlinear effects, as the indicators of concrete structure damage, were not observed.
5. Metal Magnetic Memory Method
The metal magnetic memory (MMM) method is an NDT method based on sensing the magnetic field strength
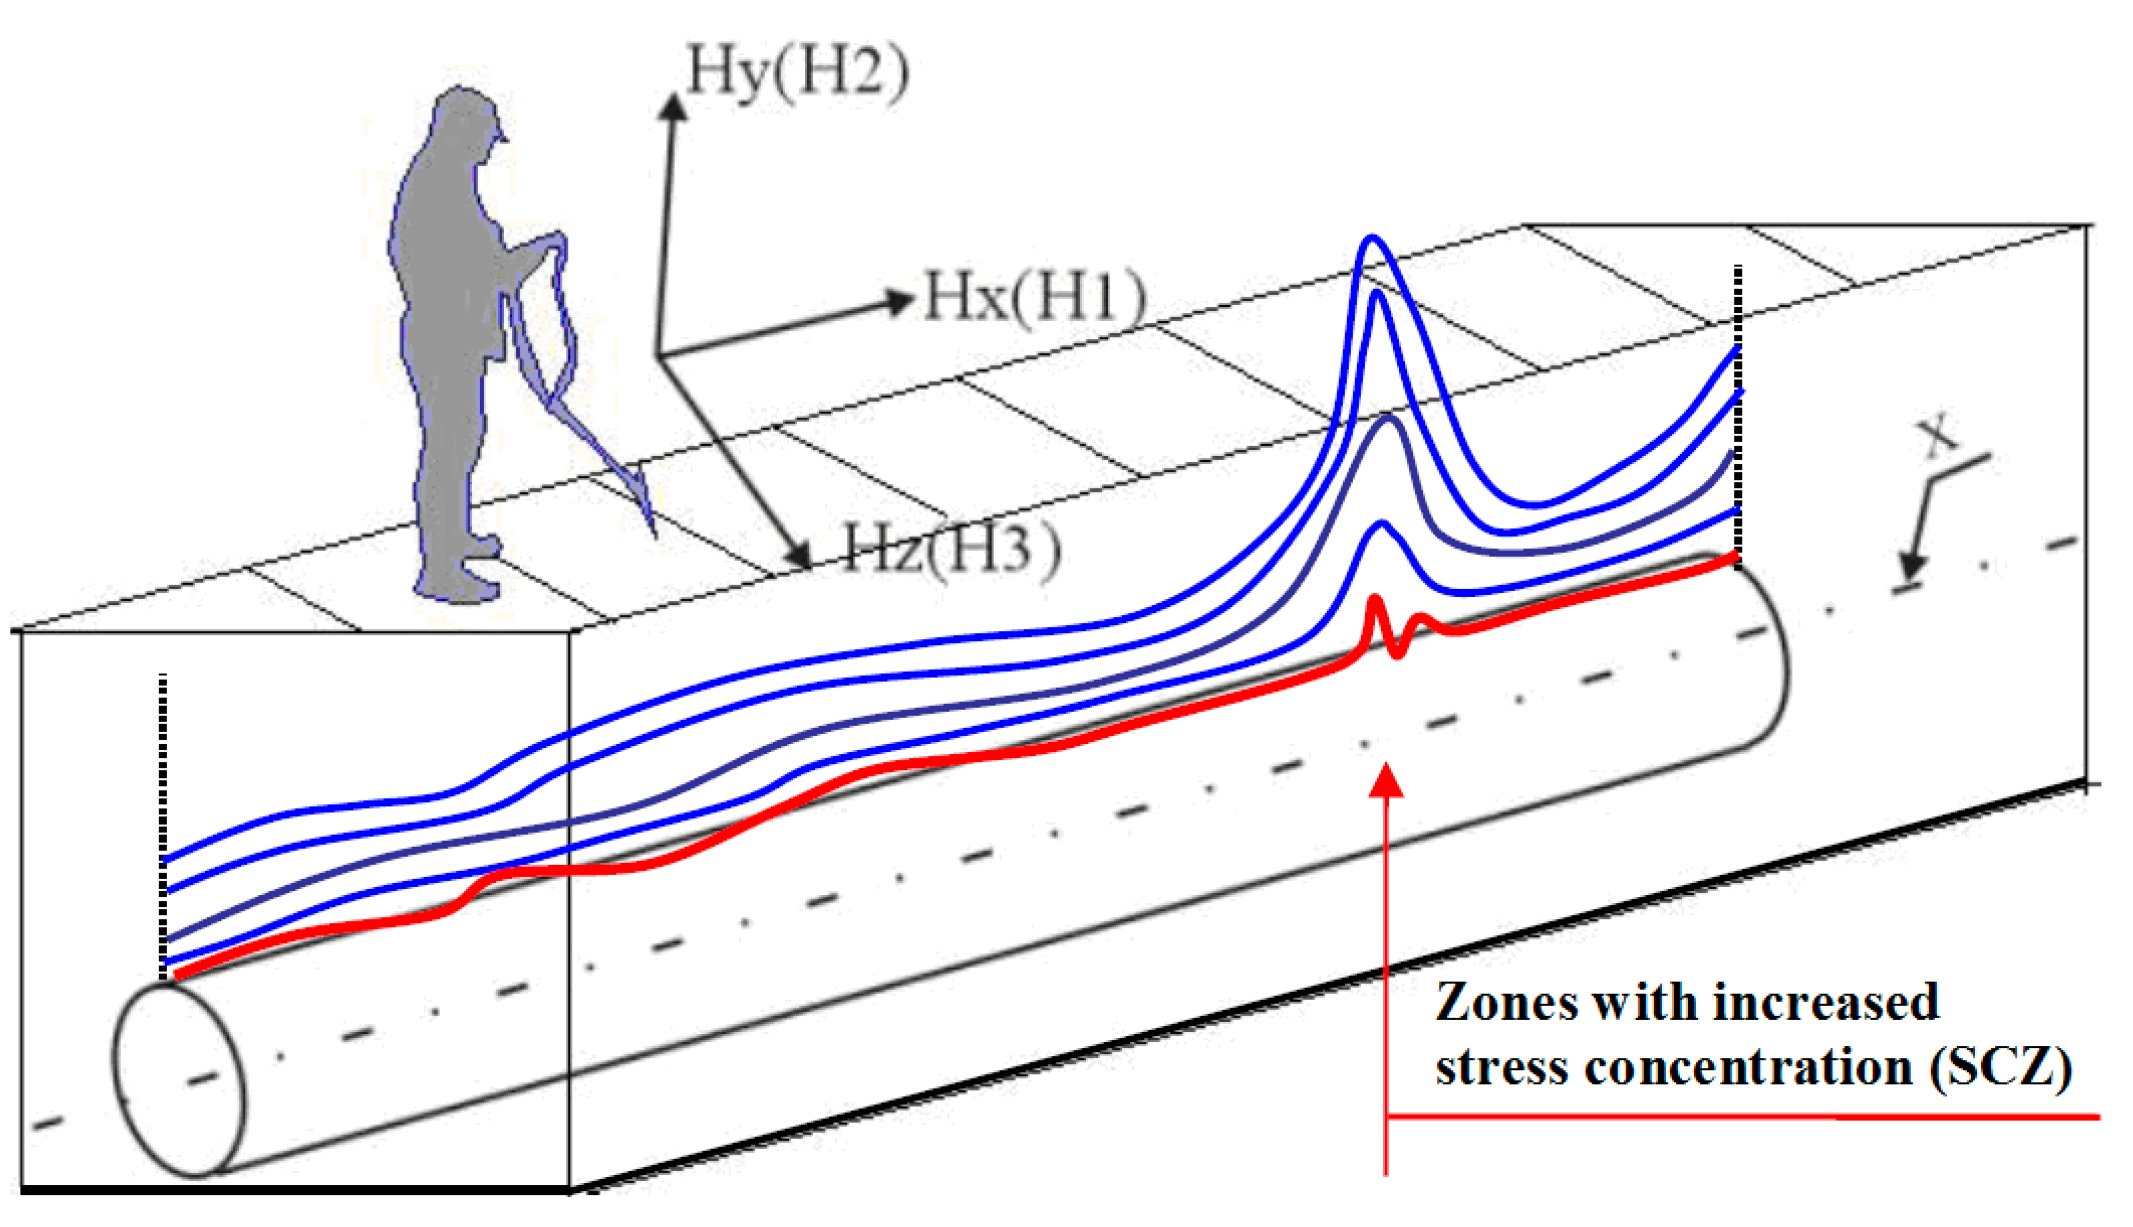
Hp in the form of residual magnetization on the surface of the material. It uses one or more probes, each sensing the magnetic field in three perpendicular planes, see
Figure 12. The residual magnetization of a material is affected by the production process, machining, cutting, welding, bending, heat treatment, cooling, operational stress, corrosion of the material, etc. A very important factor influencing the magnetic memory of a material is the degradation process caused by the operational stress and conditions to which the structure is exposed.
The MMM method can detect these effects from a magnetogram, i.e., the dependence of the magnetic field strength on the distance of the probe from the beginning of the measurement.
A special cart, on which the probes are placed, is moved above the surface of the measured area (e.g., in a pipe or beam axis) and the wheel of the device measures the driven distance. The signal from each individual channel, together with the distance, is recorded in digital form in the device’s memory and displayed graphically either directly as Hp or in the form of gradient dHp/dx.
The recorded data are presented in the form of a graph (so-called magnetogram). Based on the evaluation, we can then determine zones with increased stress concentration (SCZ), where there is an increased probability of changes or defects in the material structure. The stress concentration is proportional to the measured magnitude of the magnetic field strength gradient around a given position.
A significant advantage of this NDT method is the measurement speed and its high sensitivity.
5.1. Data Acquisition
The measurement technique used is shown in
Figure 13 and includes the following parts:
Tester of stress concentration with evaluation unit TSC-3M-12;
Scanning device type 11-6W with a probe comprising 2 triaxial sensors;
Cart with the device measuring the driven distance.
The measuring range for magnetic field strength Hp was from −2000 A/m to +2000 A/m. The used measurement step was every 1 mm.
5.2. Results and Discussion
The concrete beams were arranged in a line on the ground. Firstly, the indicative contactless measurement was applied at the distance of 50 mm from the surface of the beams, the contact measurement followed. The measurement was performed on specimen surfaces in the central part of the specimens along the length of 200 mm. The measurement was repeated four times to verify the reproducibility of the measurement results. A magnetogram in
Figure 14 illustrates the results of the continuous contact scanning of specimen N with an undamaged reinforcing bar.
The magnetogram graphically showed the field strength Hy and the field gradient dHy/dx as a function of distance x. The uniform distribution of the field strength Hy in the magnetogram confirmed that the sample structure was uniform along its length.
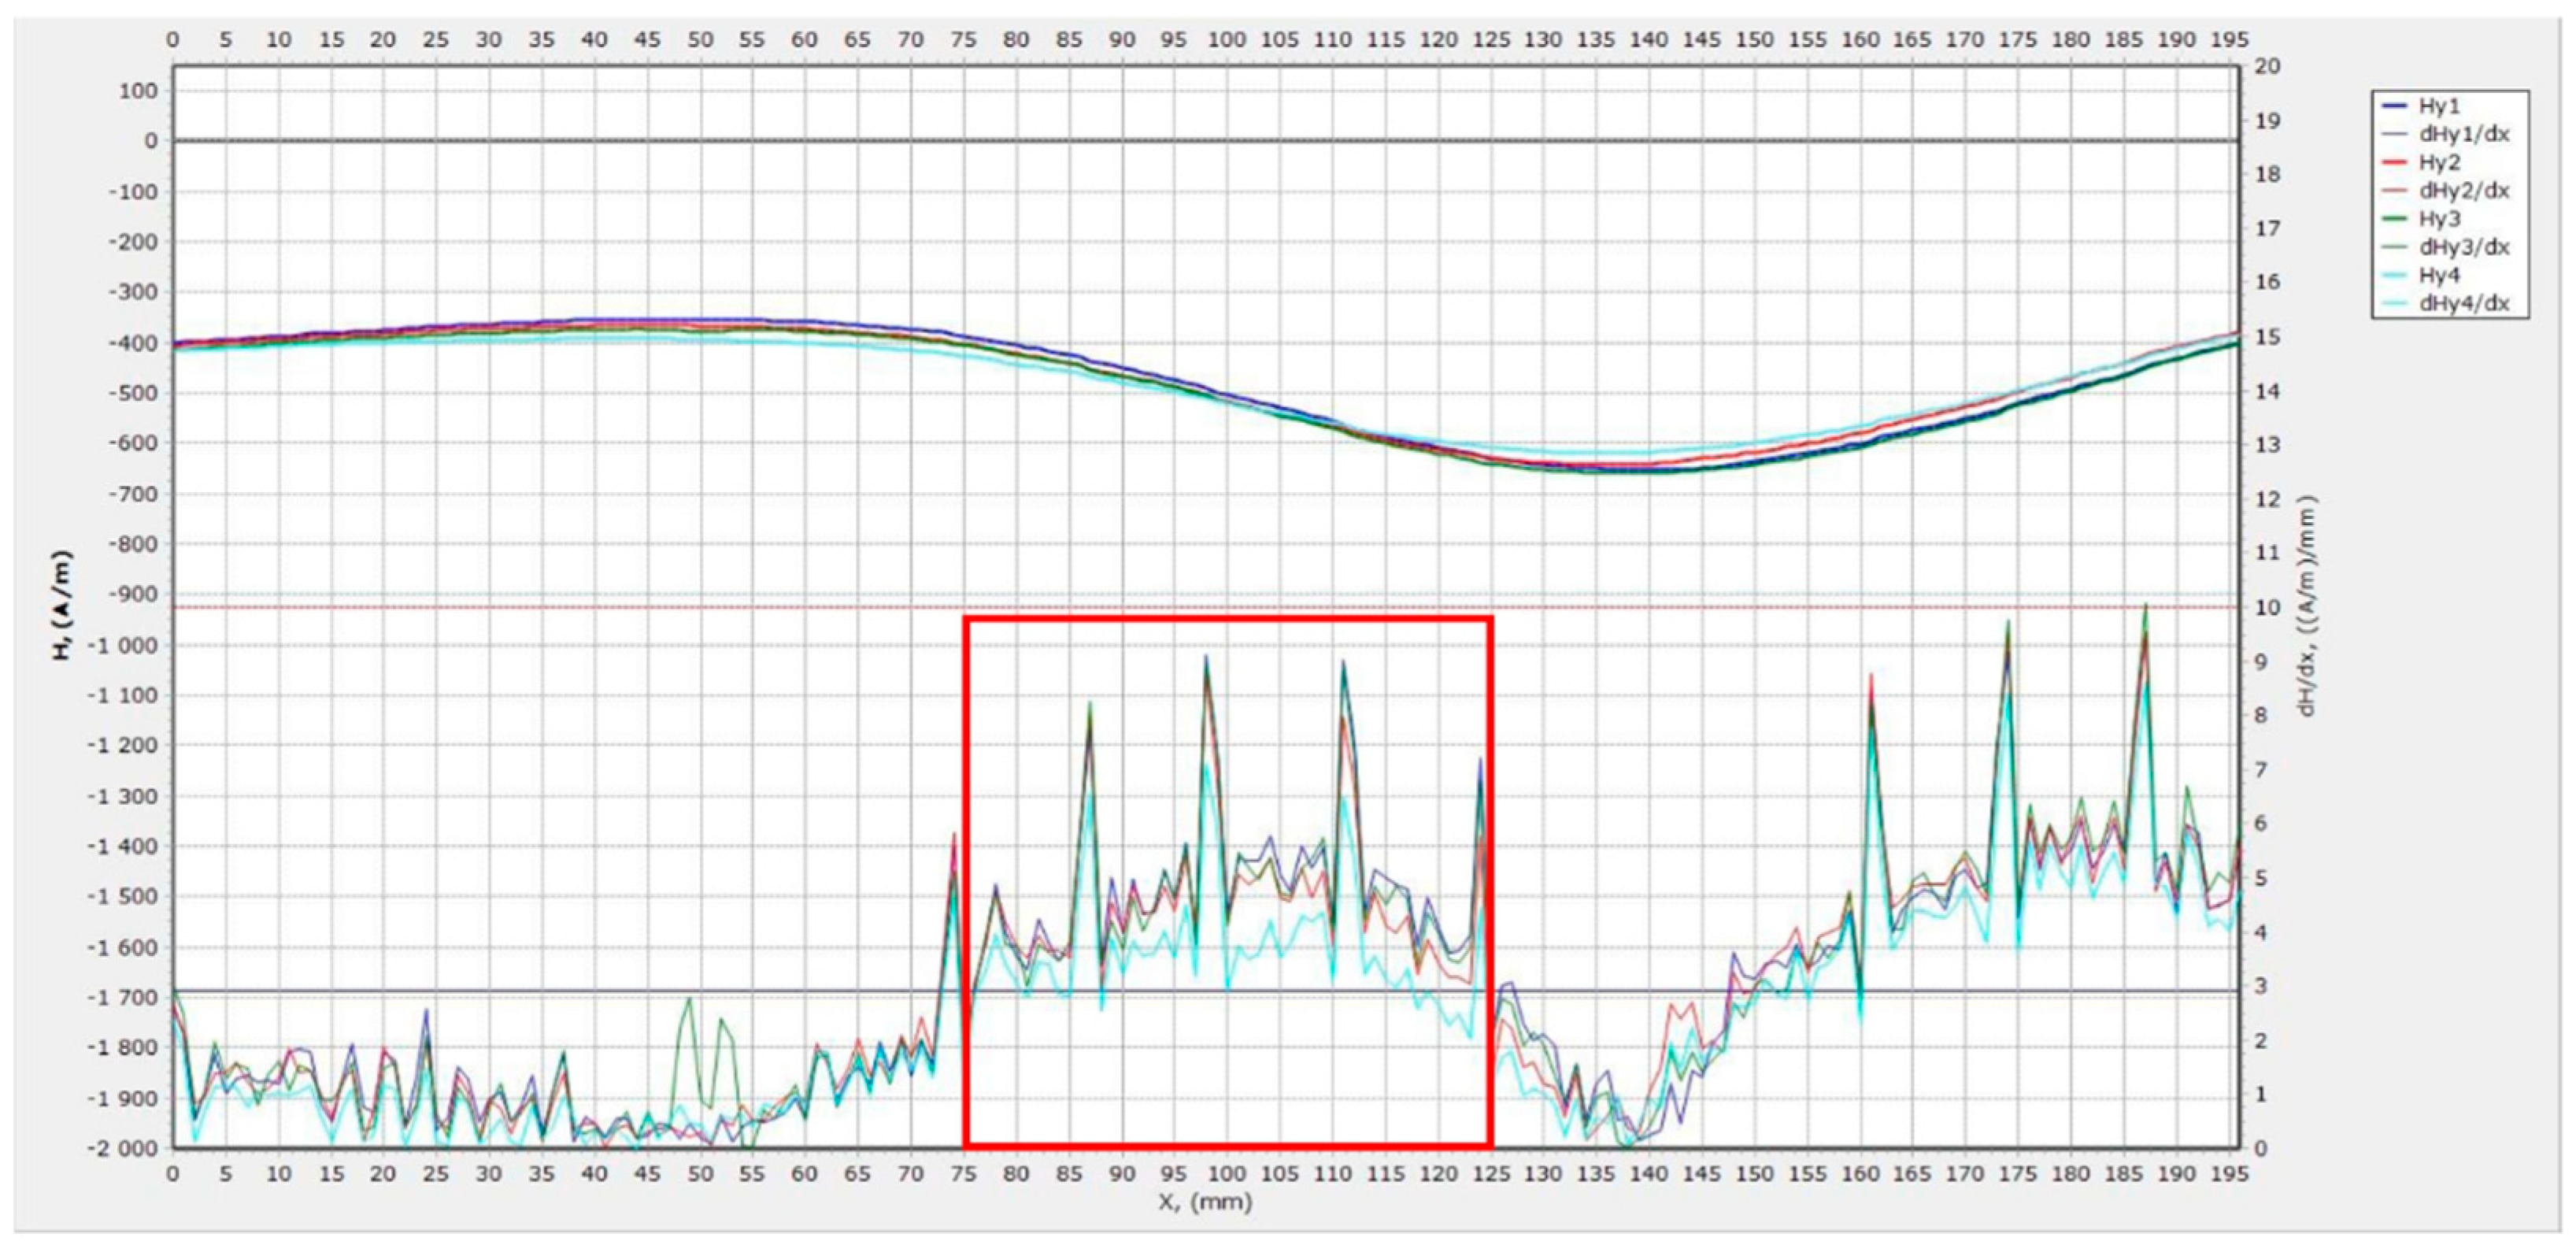
Figure 15 presents results of the continuous contact scanning of specimen Z with a locally impaired reinforcing bar.
The different distribution of field strength Hy compared to the magnetogram of specimen N was visible. The distribution was not uniform, in this case. The zone of the increased field strength gradient (area marked in a red rectangle) corresponded to the locally impaired part of the reinforcing bar.
Figure 16 presents a magnetogram from the measurement of specimen P with an interrupted reinforcing bar.
The magnetogram showed in shape analogous distribution of the field strength similar to the magnetogram in
Figure 15 (corresponding to specimen Z) with a larger range of values. The zone of increased field strength gradient (area marked in a red rectangle) corresponded to the missing part of the reinforcing bar. The adjoining zone with an increased gradient must have been caused by another reason, possibly the mechanical preparation of bars which needs to be further studied.
6. Conclusions
The presented paper describes the application of three non-destructive methods for the evaluation of different reinforcing bar conditions in concrete beams. These specimens were prepared in laboratory conditions and the only difference between them is in the central part of the reinforcing bars (diameter of 10 mm, diameter of 5 mm, and a missing piece of bar). The applied methods were: the ground-penetrating radar, the impact-echo method, and the metal magnetic memory method.
The ground-penetrating radar was applied in transversal and in longitudinal directions. The measurement results in both directions proved the correlation of evaluated parameters (changes of the observed depth of the reinforcing bar from the concrete surface and direct wave attenuation) with a reinforcing bar variant. It was confirmed that a 2.6 GHz antenna is able to measure the position of the reinforcement placed at a depth of about 50 mm with millimeter accuracy.
The results of the impact-echo method proved that this method is sensitive to the reinforcement conditions. The shifts of the dominant frequencies obtained with fast Fourier transform from the response signal correspond with the reinforcing bar changes in the concrete beams. It was shown that the impaired or interrupted reinforcing bars have an influence on the dominant frequency. However, these differences are difficult to interpret and without a comparison to a reference value measured in the same positions, an evaluation would not be possible.
The measured parameters of the metal magnetic method proved correlation with concrete beams with different reinforcing bars. The measurement with a contact probe shows that the uniform specimen structure along the whole length produced a uniform distribution of magnetic field strength Hy. In the case of impaired and interrupted reinforcing bars, the change appeared in Hy and became much clearer on its gradient. It turned out that it will be necessary to distinguish in the records other influences to which this method is sensitive. The measurement is similar to GPR in terms of time and comfort of measurement.
The results of these measurements showed how they can help in assessing conditions of steel reinforcement in concrete structures and have proved to constitute a starting point for specifying their use in the next step involving testing of concrete specimens with prestressed reinforcement, either directly embedded in the concrete or placed in a protecting duct.
GPR will be used to determine the position of structural reinforcement (stirrups, etc.) and ducts for conducting prestressed reinforcement in the form of strands.
The impact-echo method allows measurements directly on the prestressing reinforcement or using holes in the concrete and waveguides connected directly to the reinforcement (at different distances from each other). The use of waveguides to transmit the excitation pulse directly to the reinforcement and to sense the response on the reinforcement will allow a substantial increase in the distance between the exciter and the sensor and refine the measurement results. A combination of the impact-echo method with nonlinear ultrasonic spectroscopy will be used.
The MMM method will be tested to evaluate the state of prestressing reinforcement in the longitudinal direction when measured on the surface of concrete specimens. For the purposes of proper evaluation, it will be necessary to test variously damaged and modified samples of reinforcement and their location in various types of protective ducts, especially made of steel.


