
Determining Long-Term Land Cover Dynamics in the South Baltic Coastal Zone from Historical Aerial Photographs


Abstract
1. Introduction
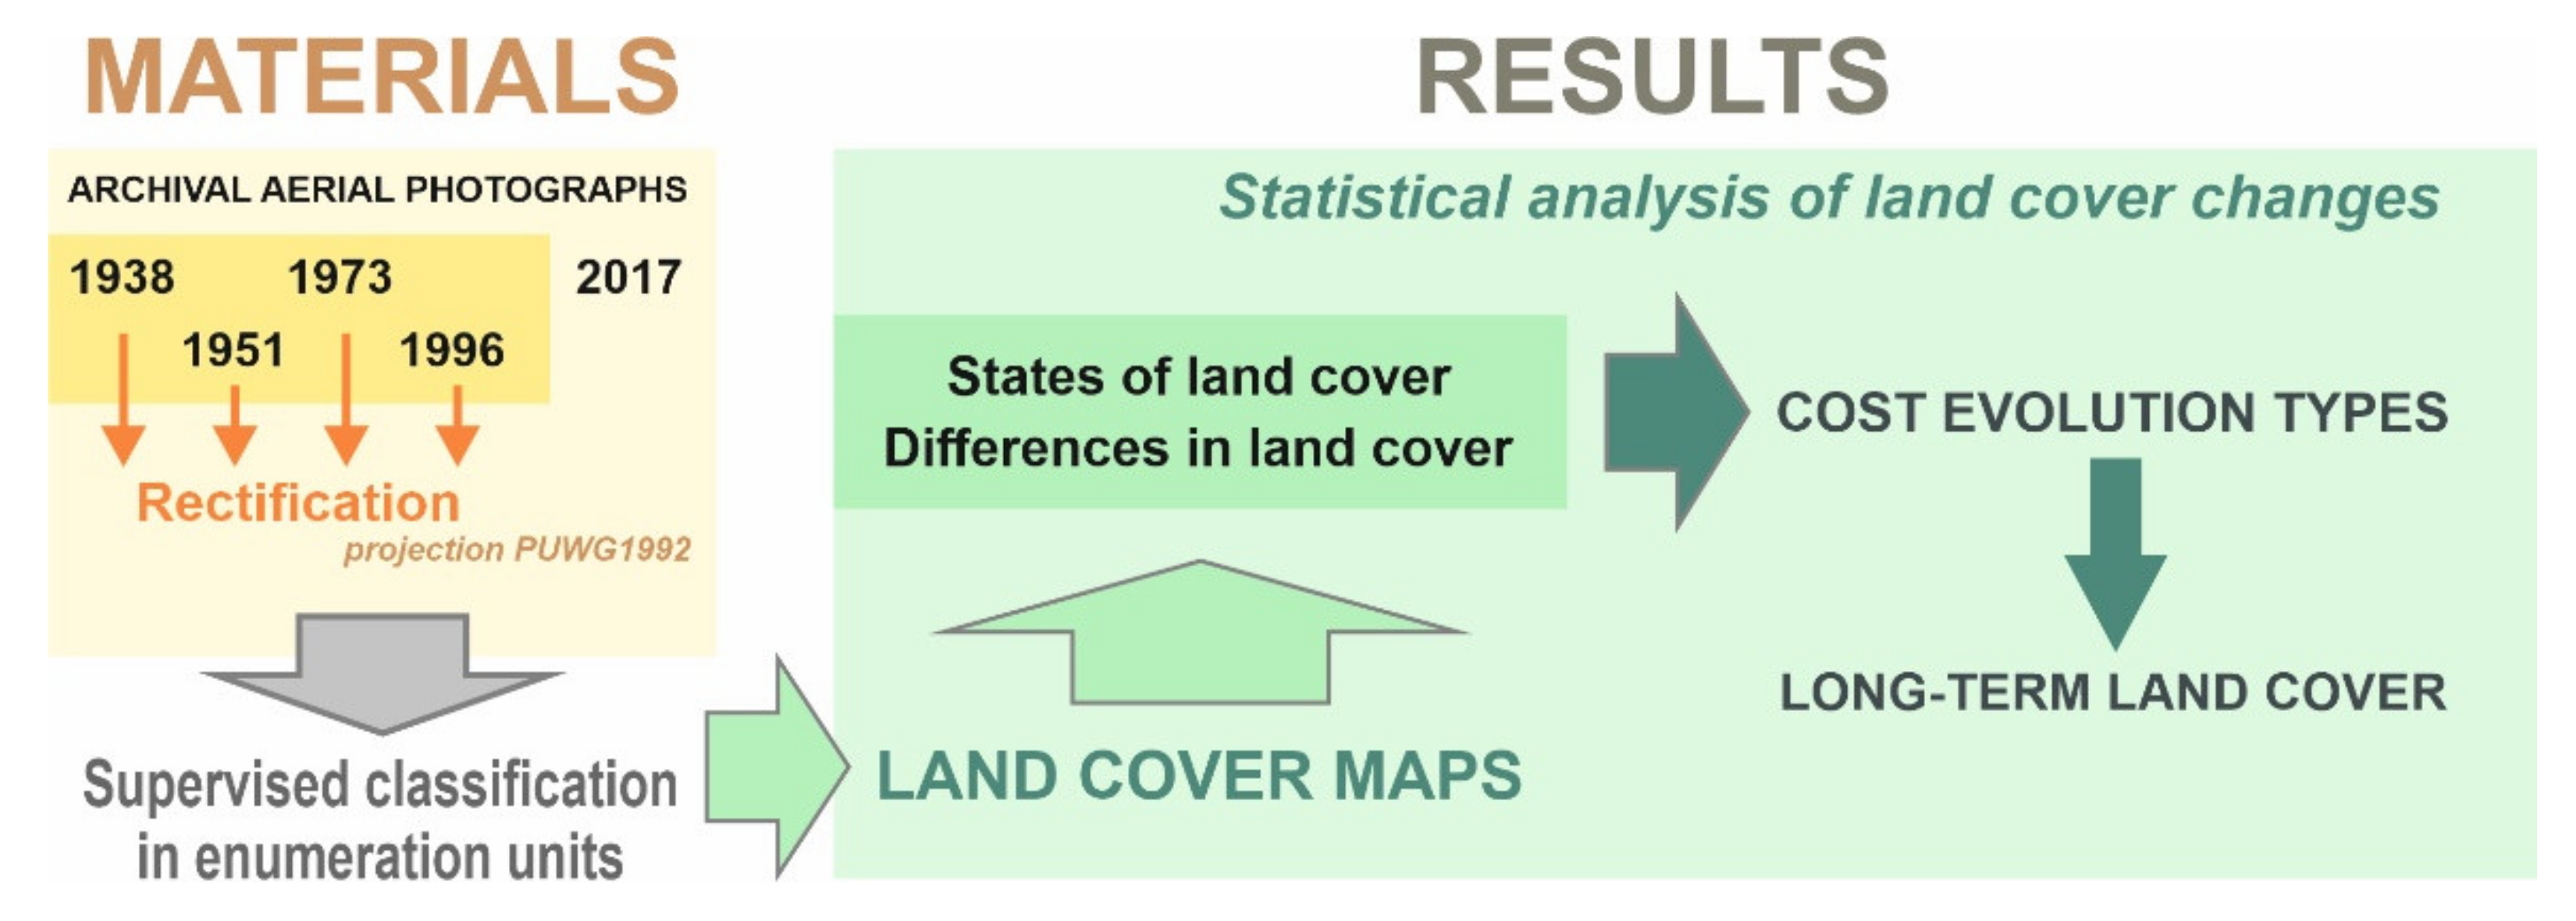
2. Materials
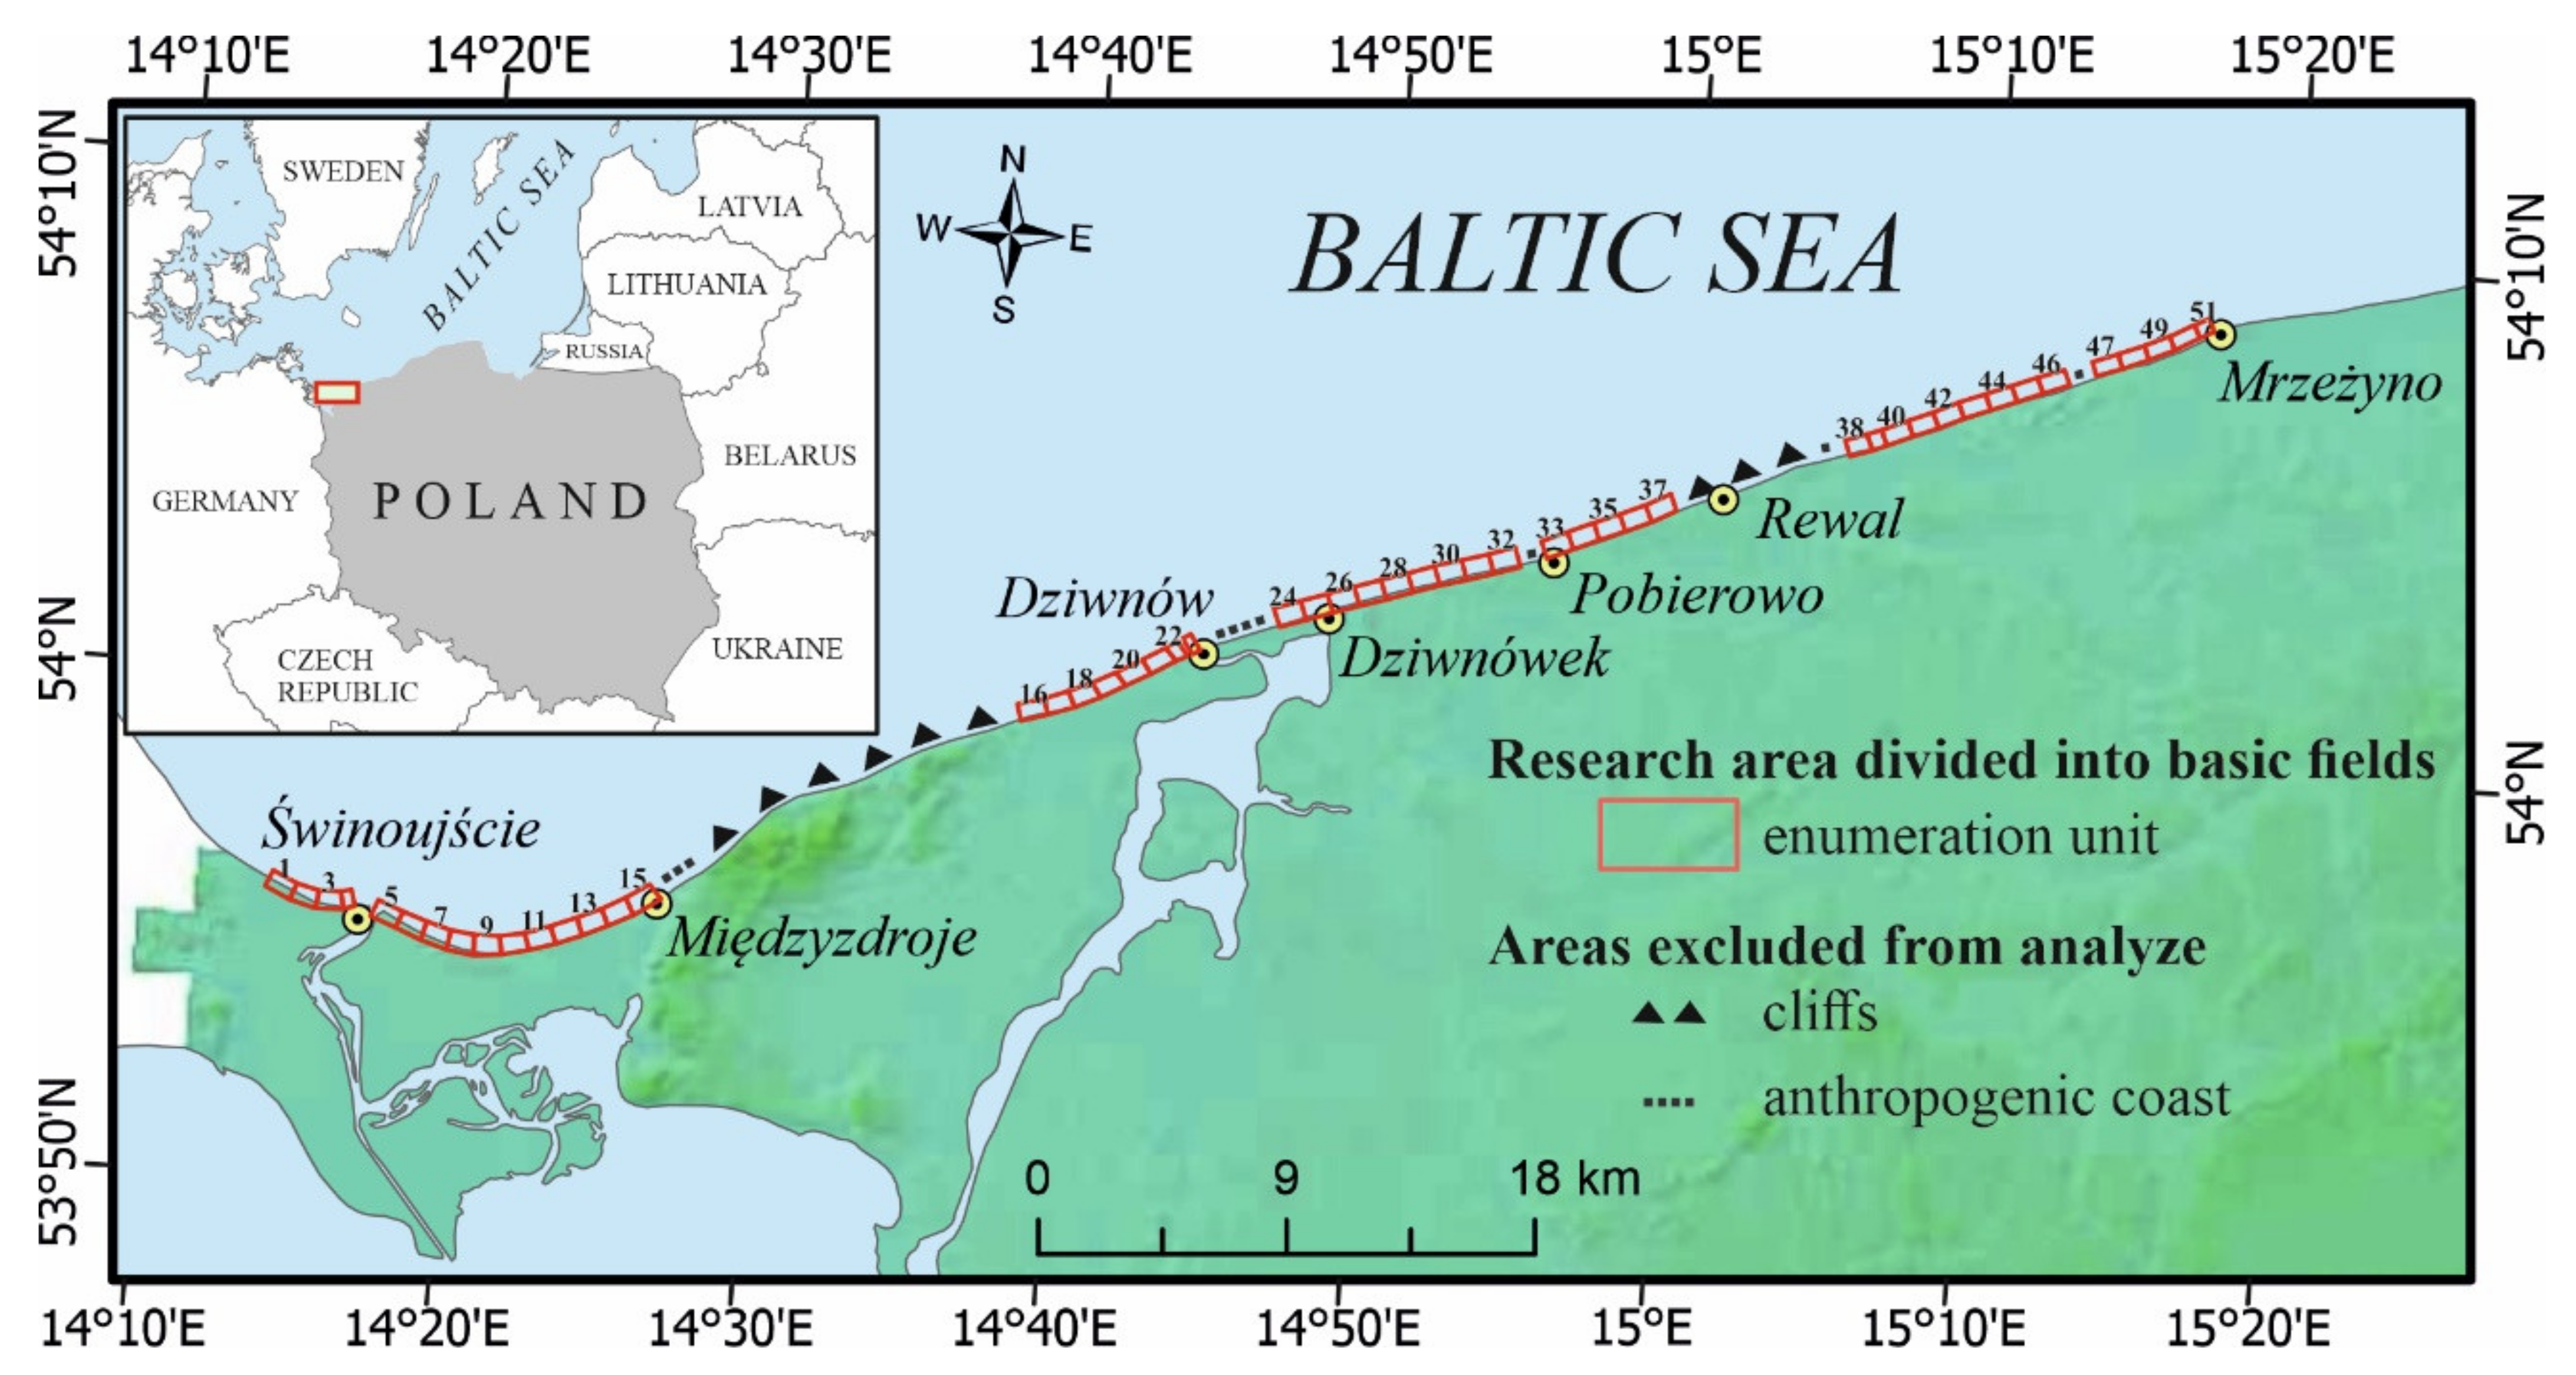
2.1. Study Site
2.2. Data
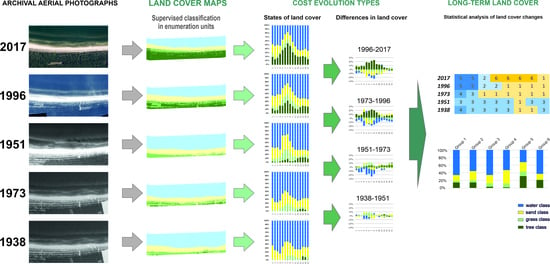
3. Methodology
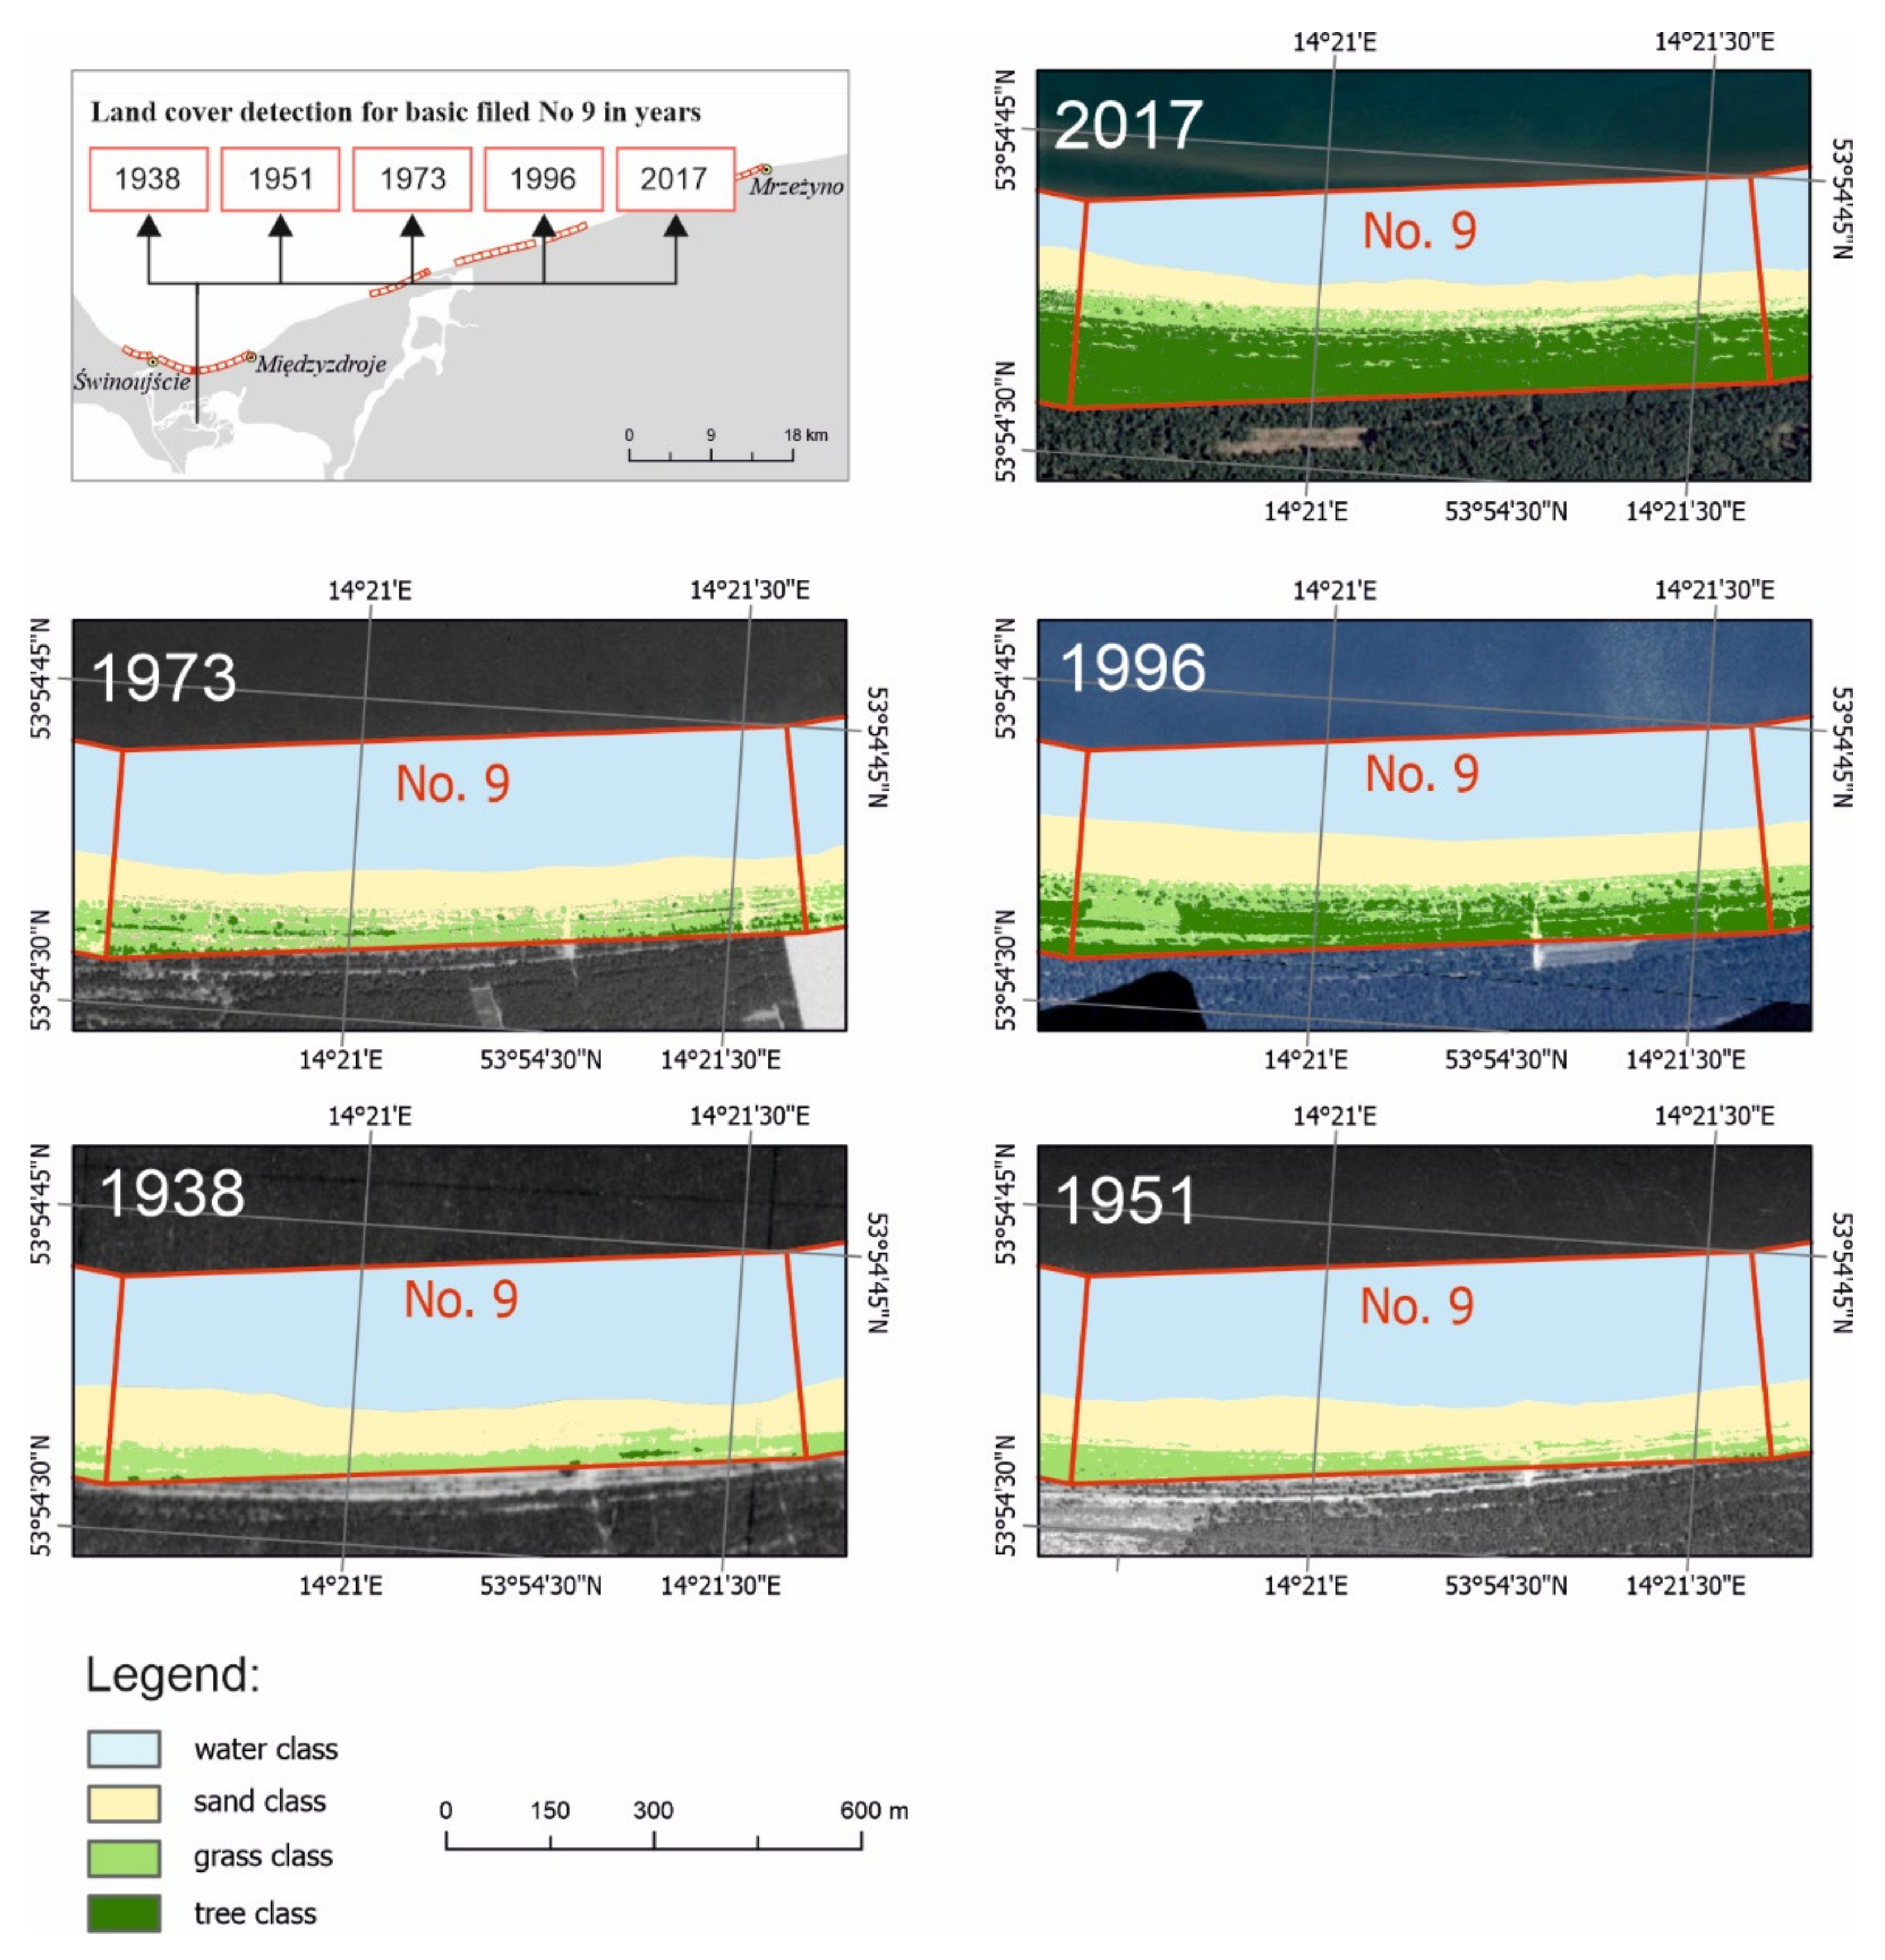
3.1. Image Processing
3.2. Land Cover Detection
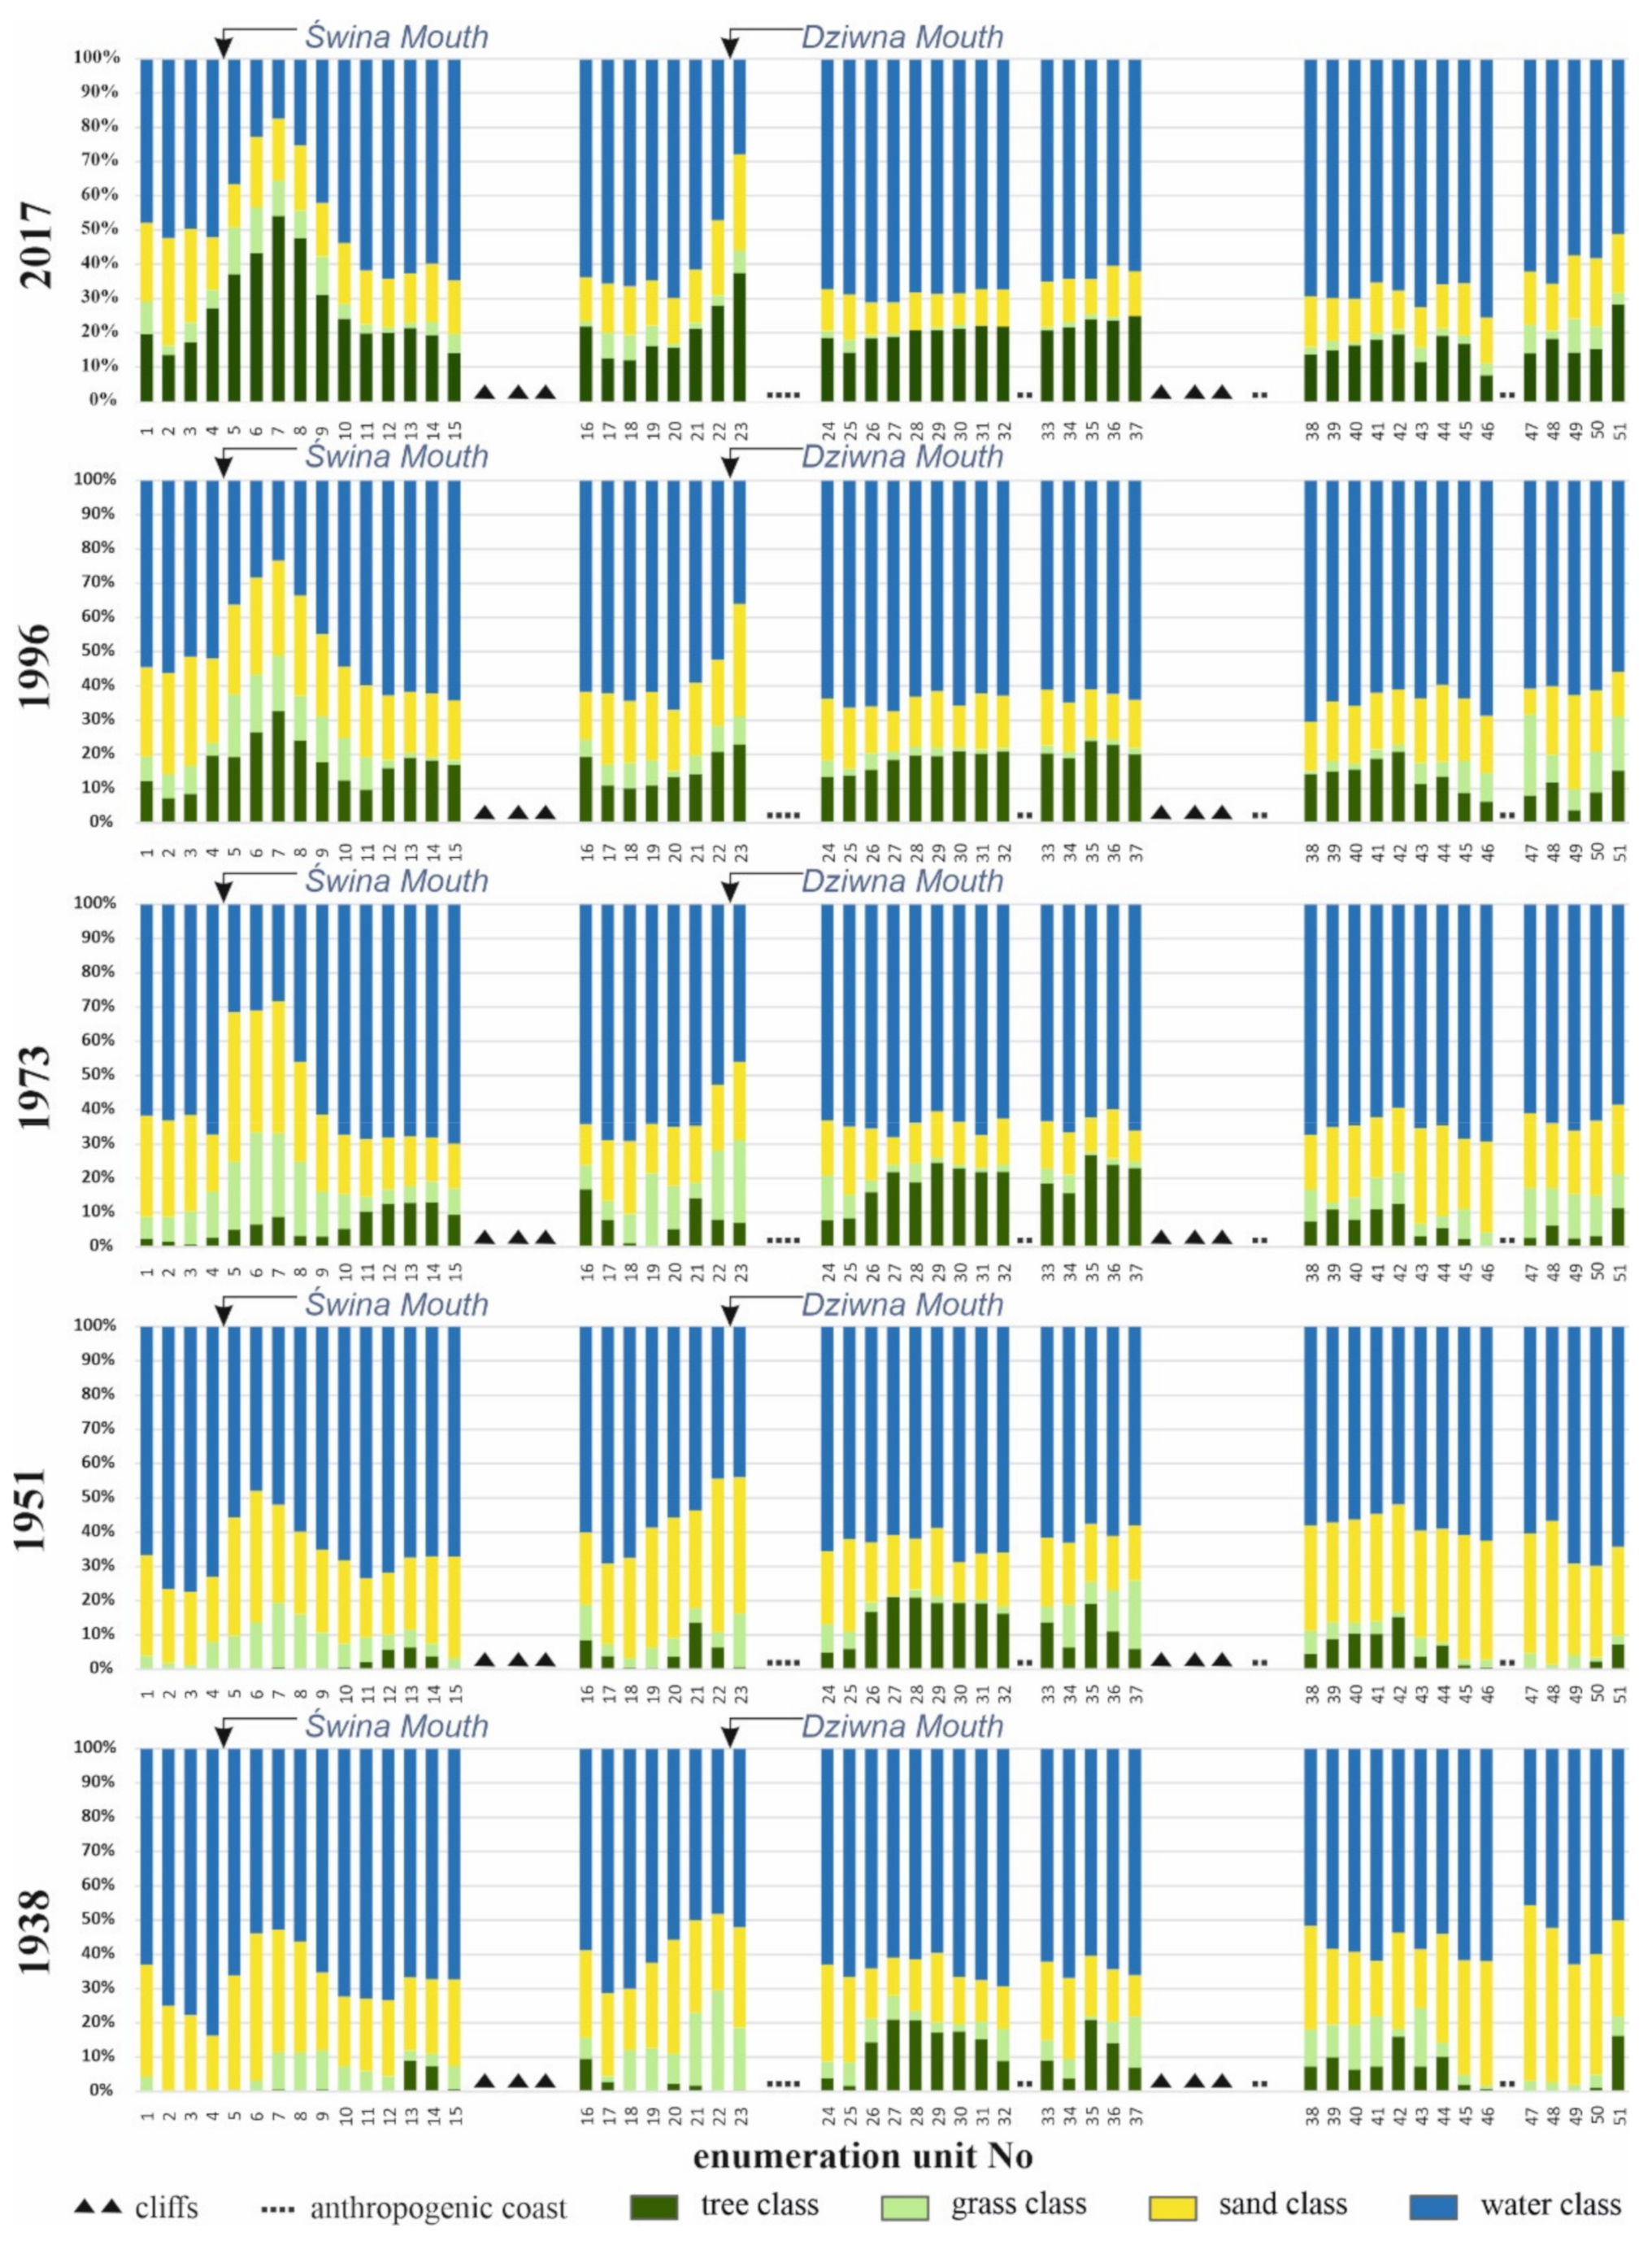
- tree class
- grass class
- sand class
- water class
3.3. Statistical Analysis
4. Results
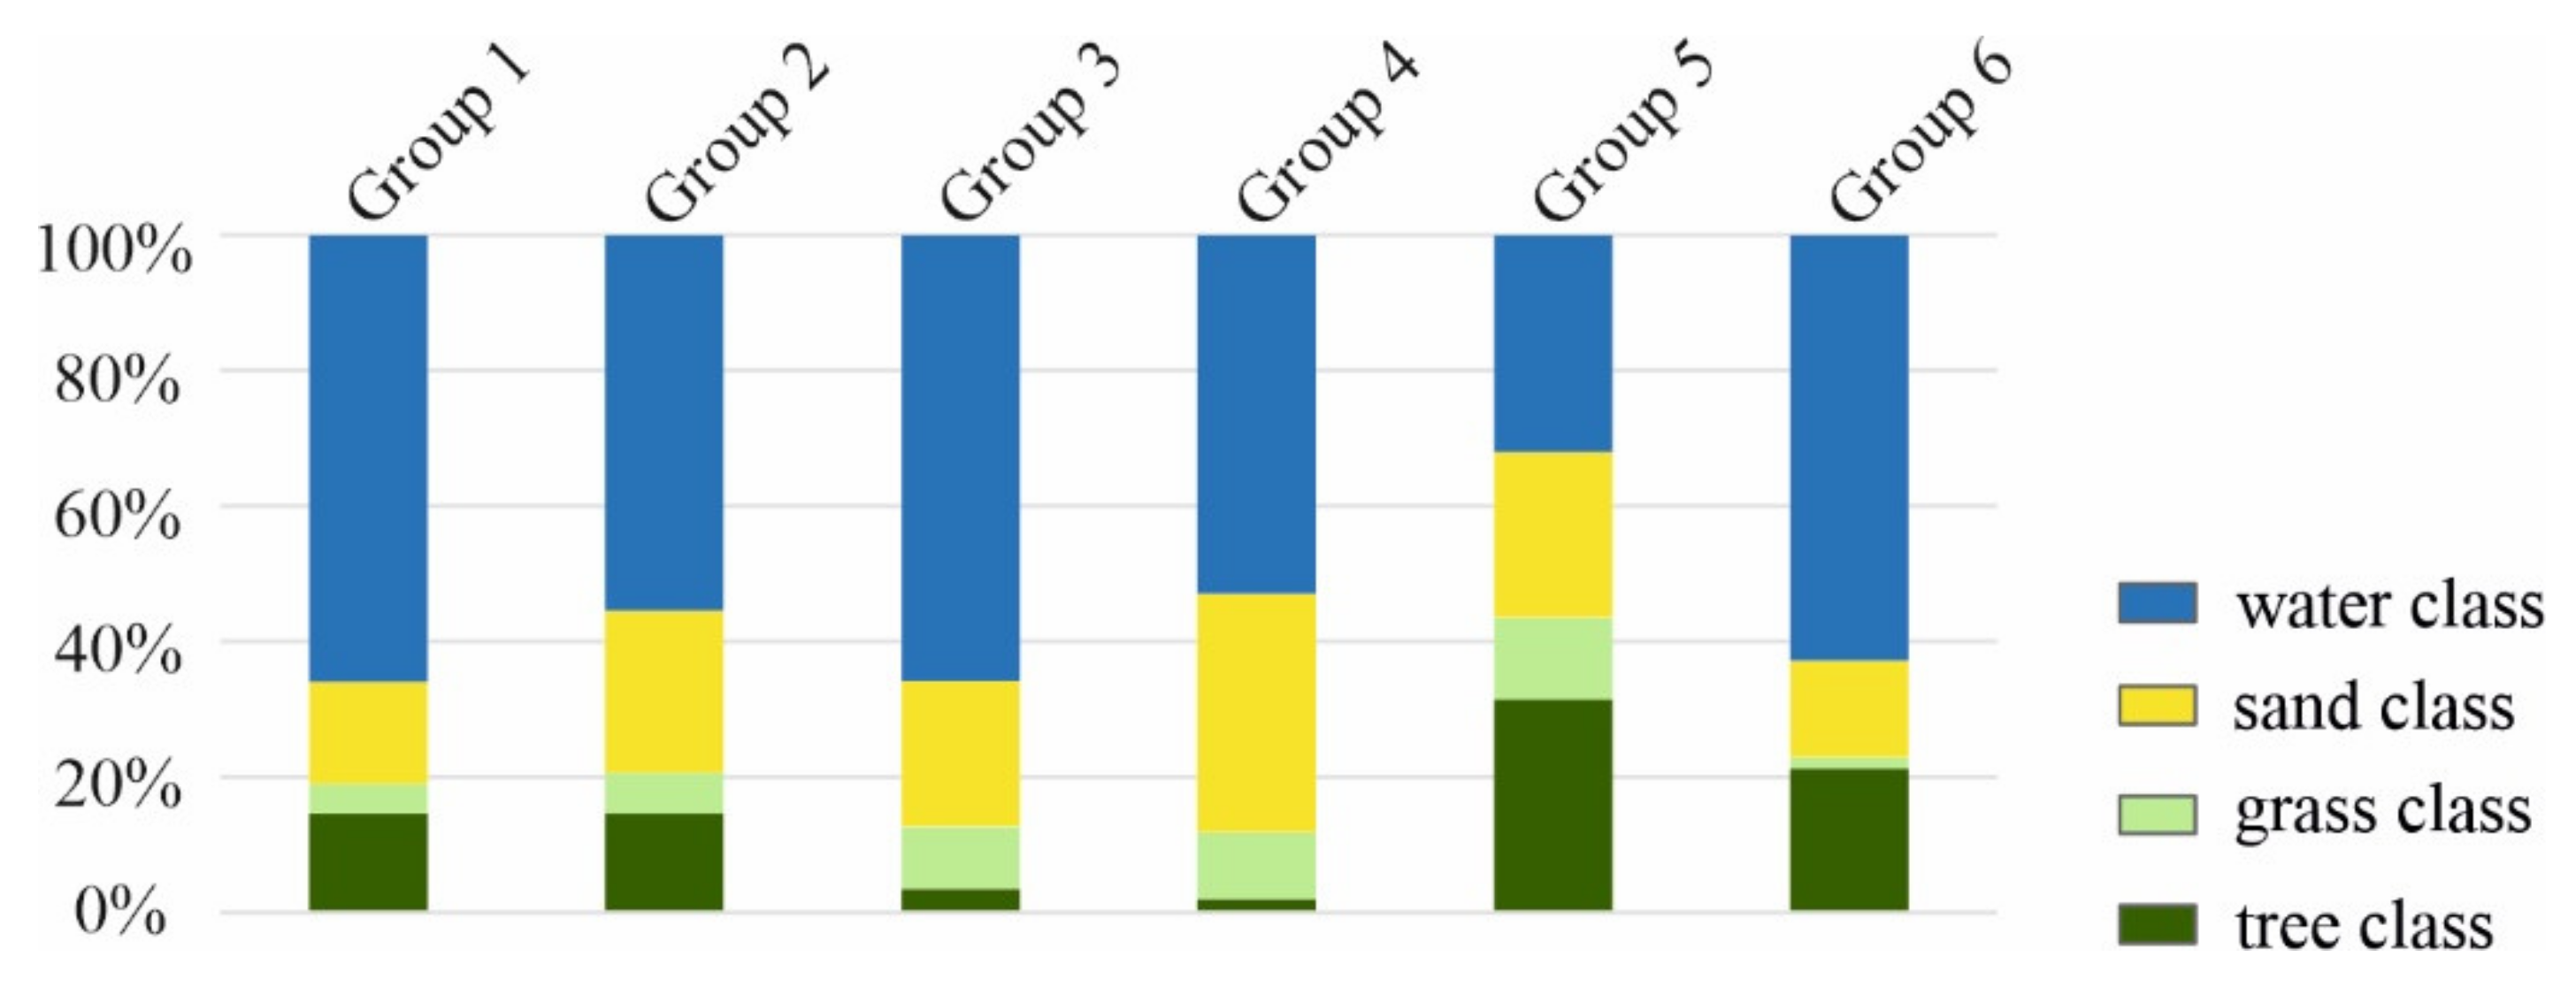
4.1. Descriptive Analysis of Land Cover
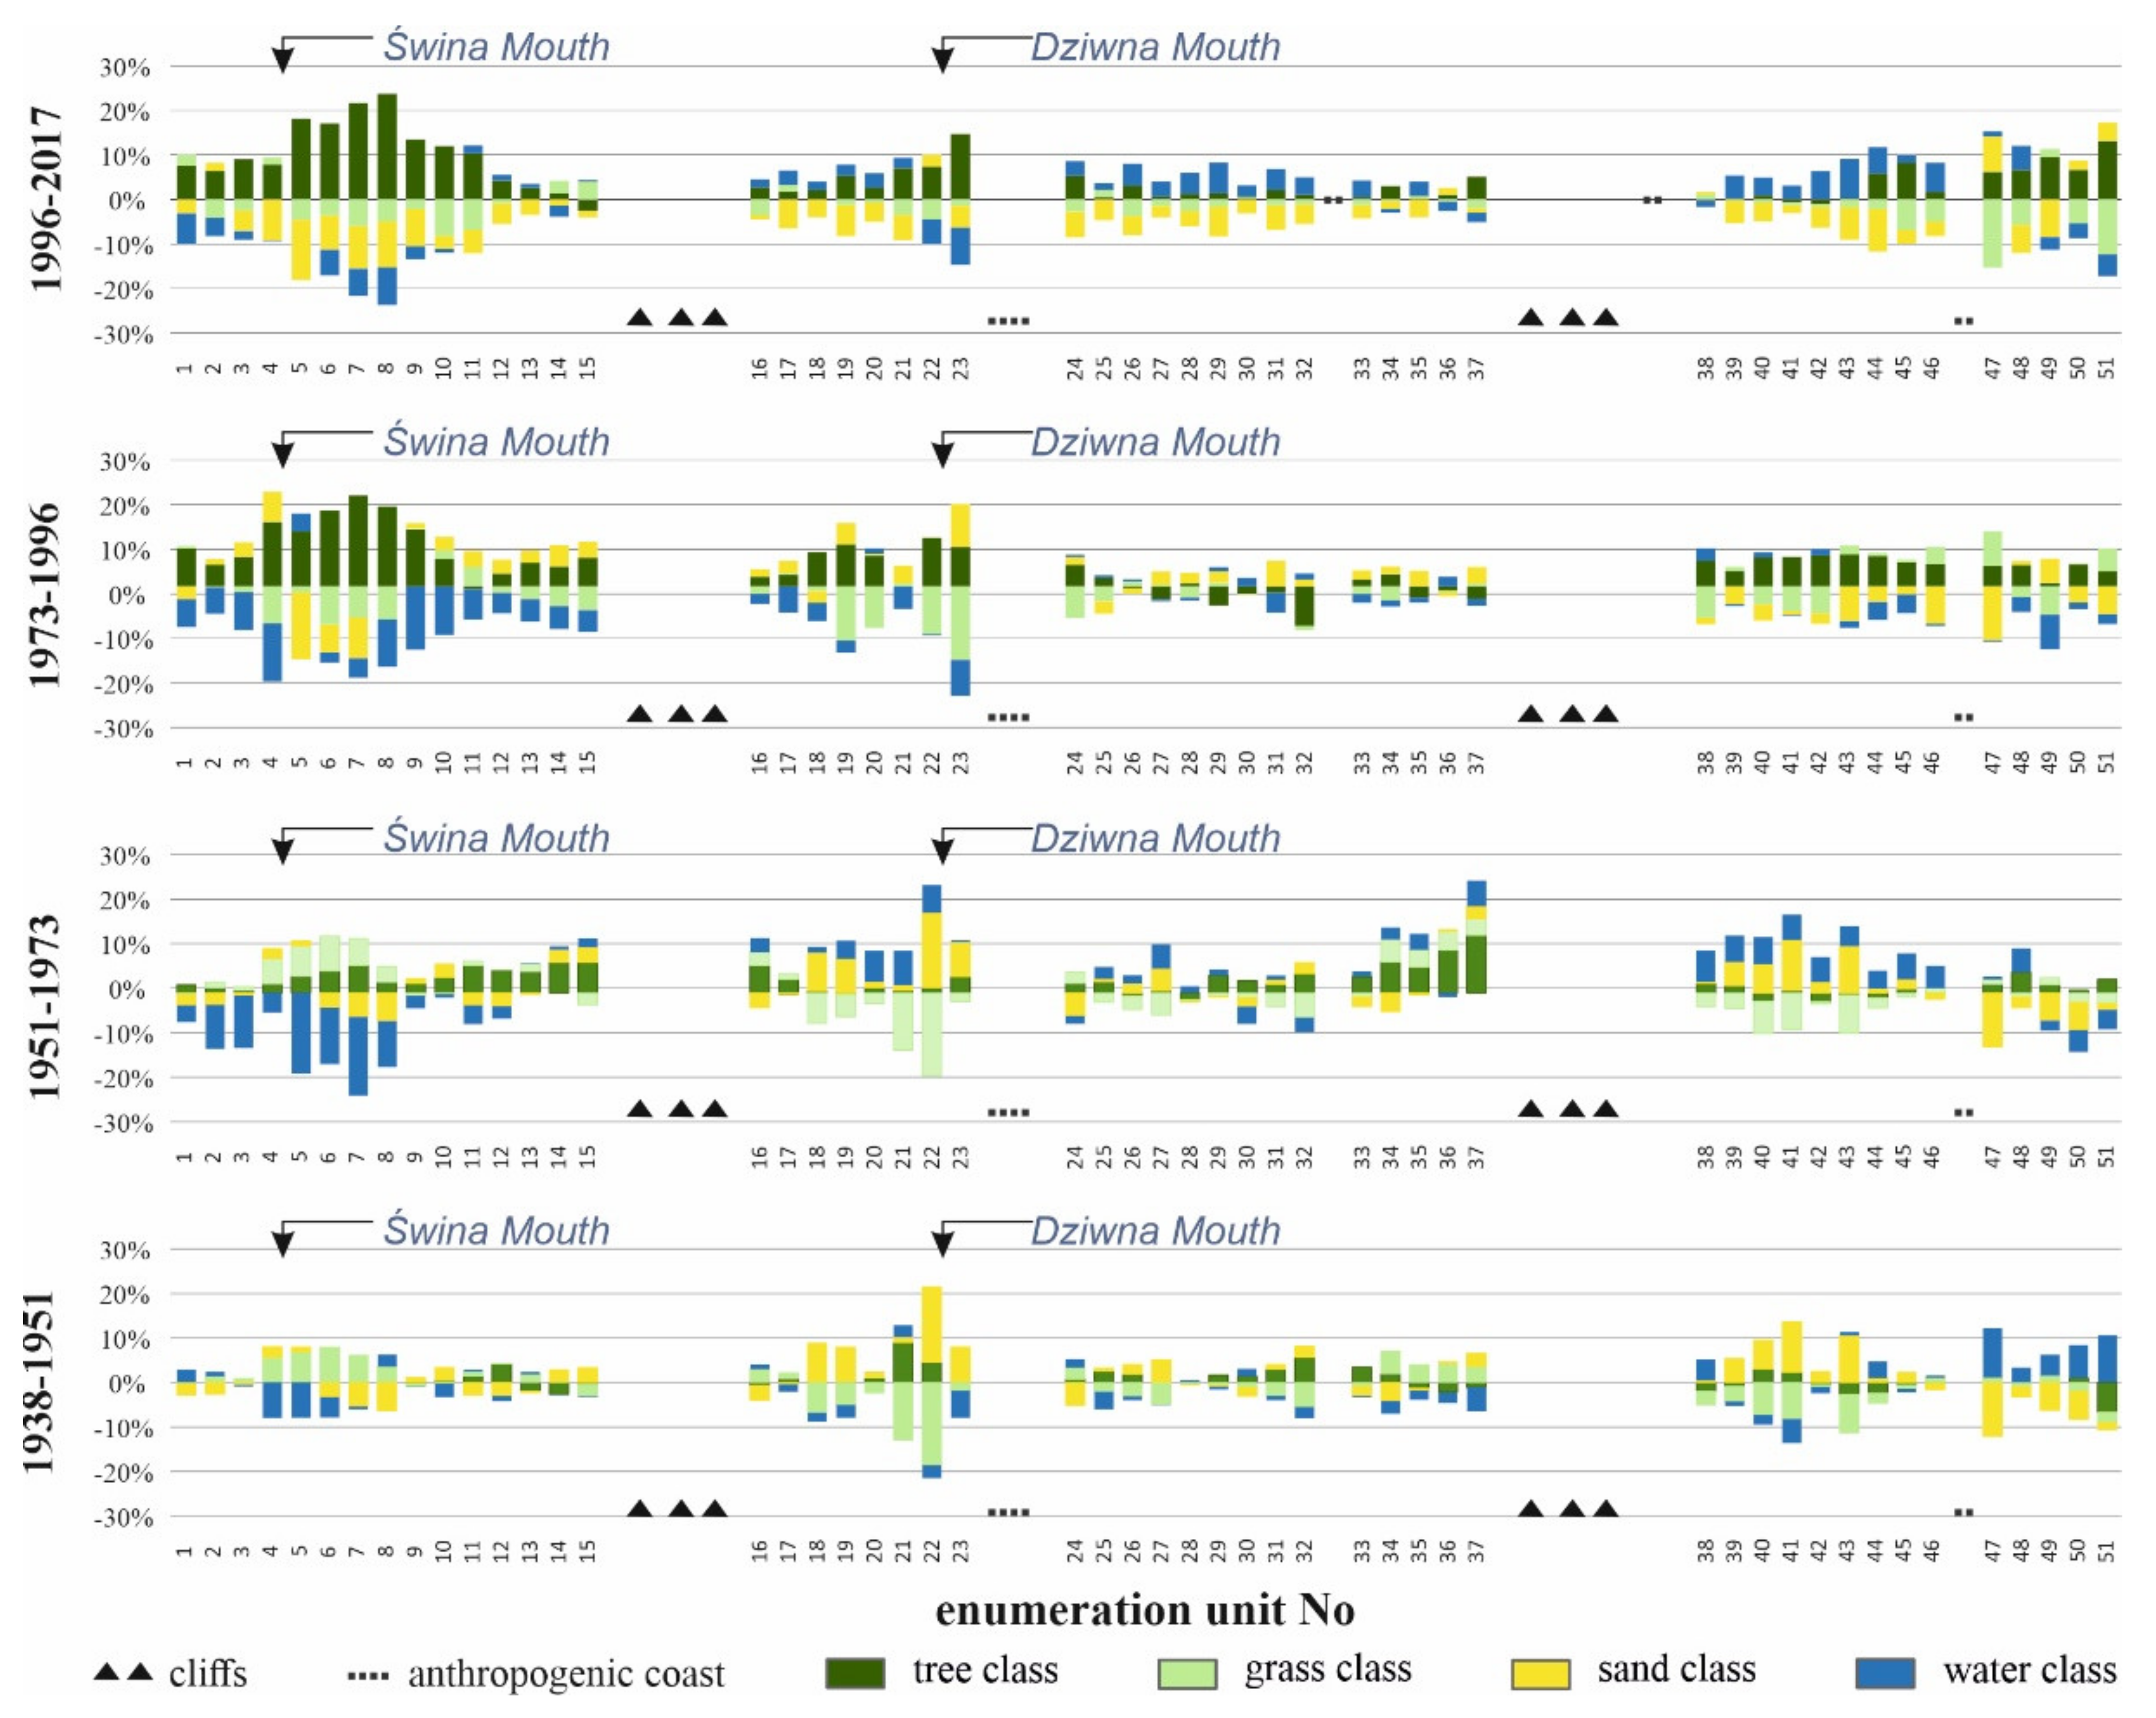
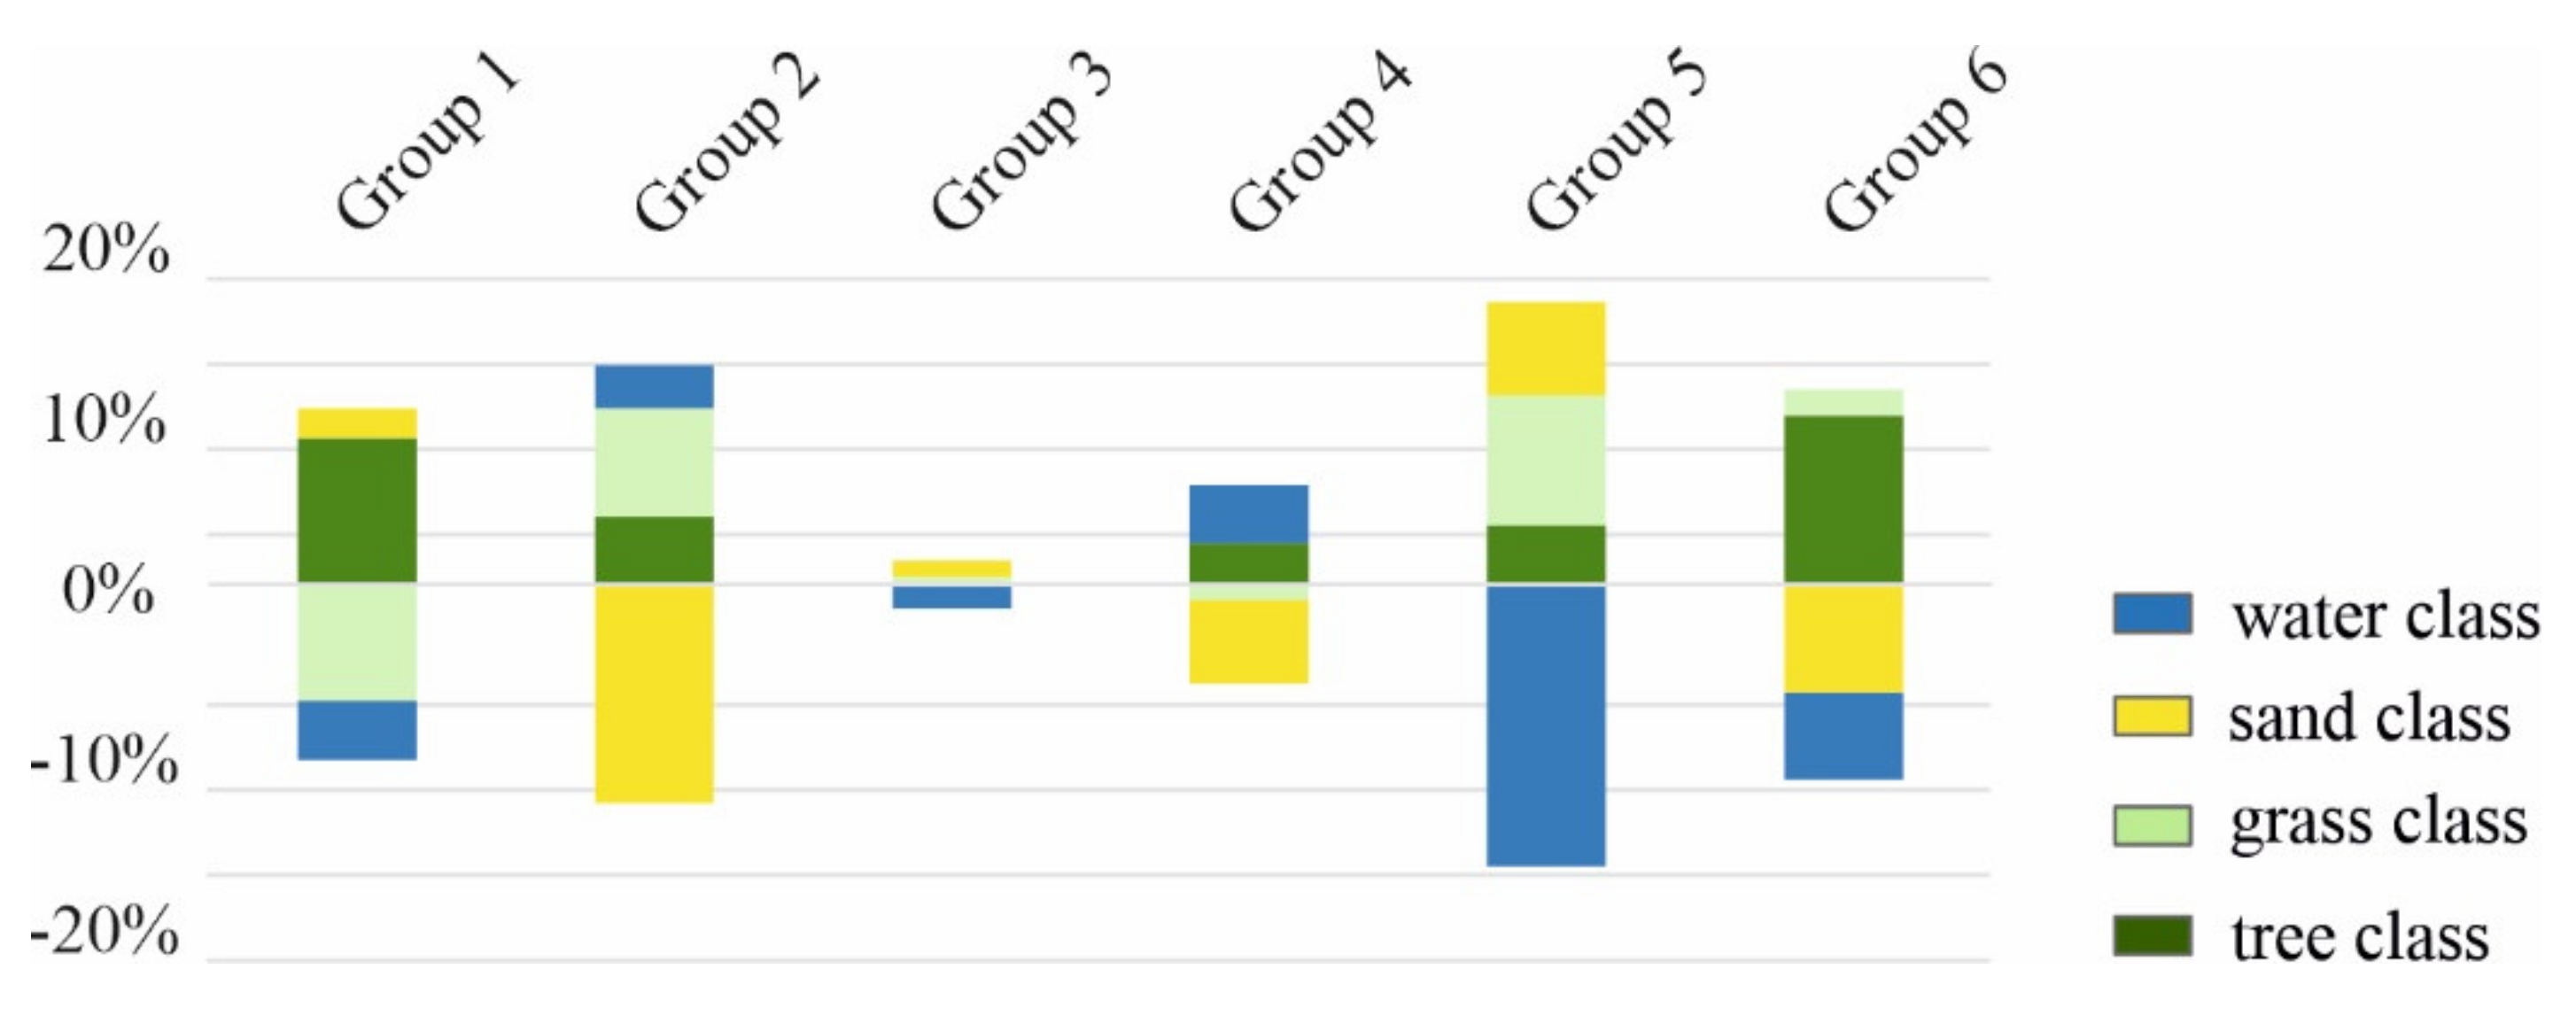
4.2. Differences in Land Cover
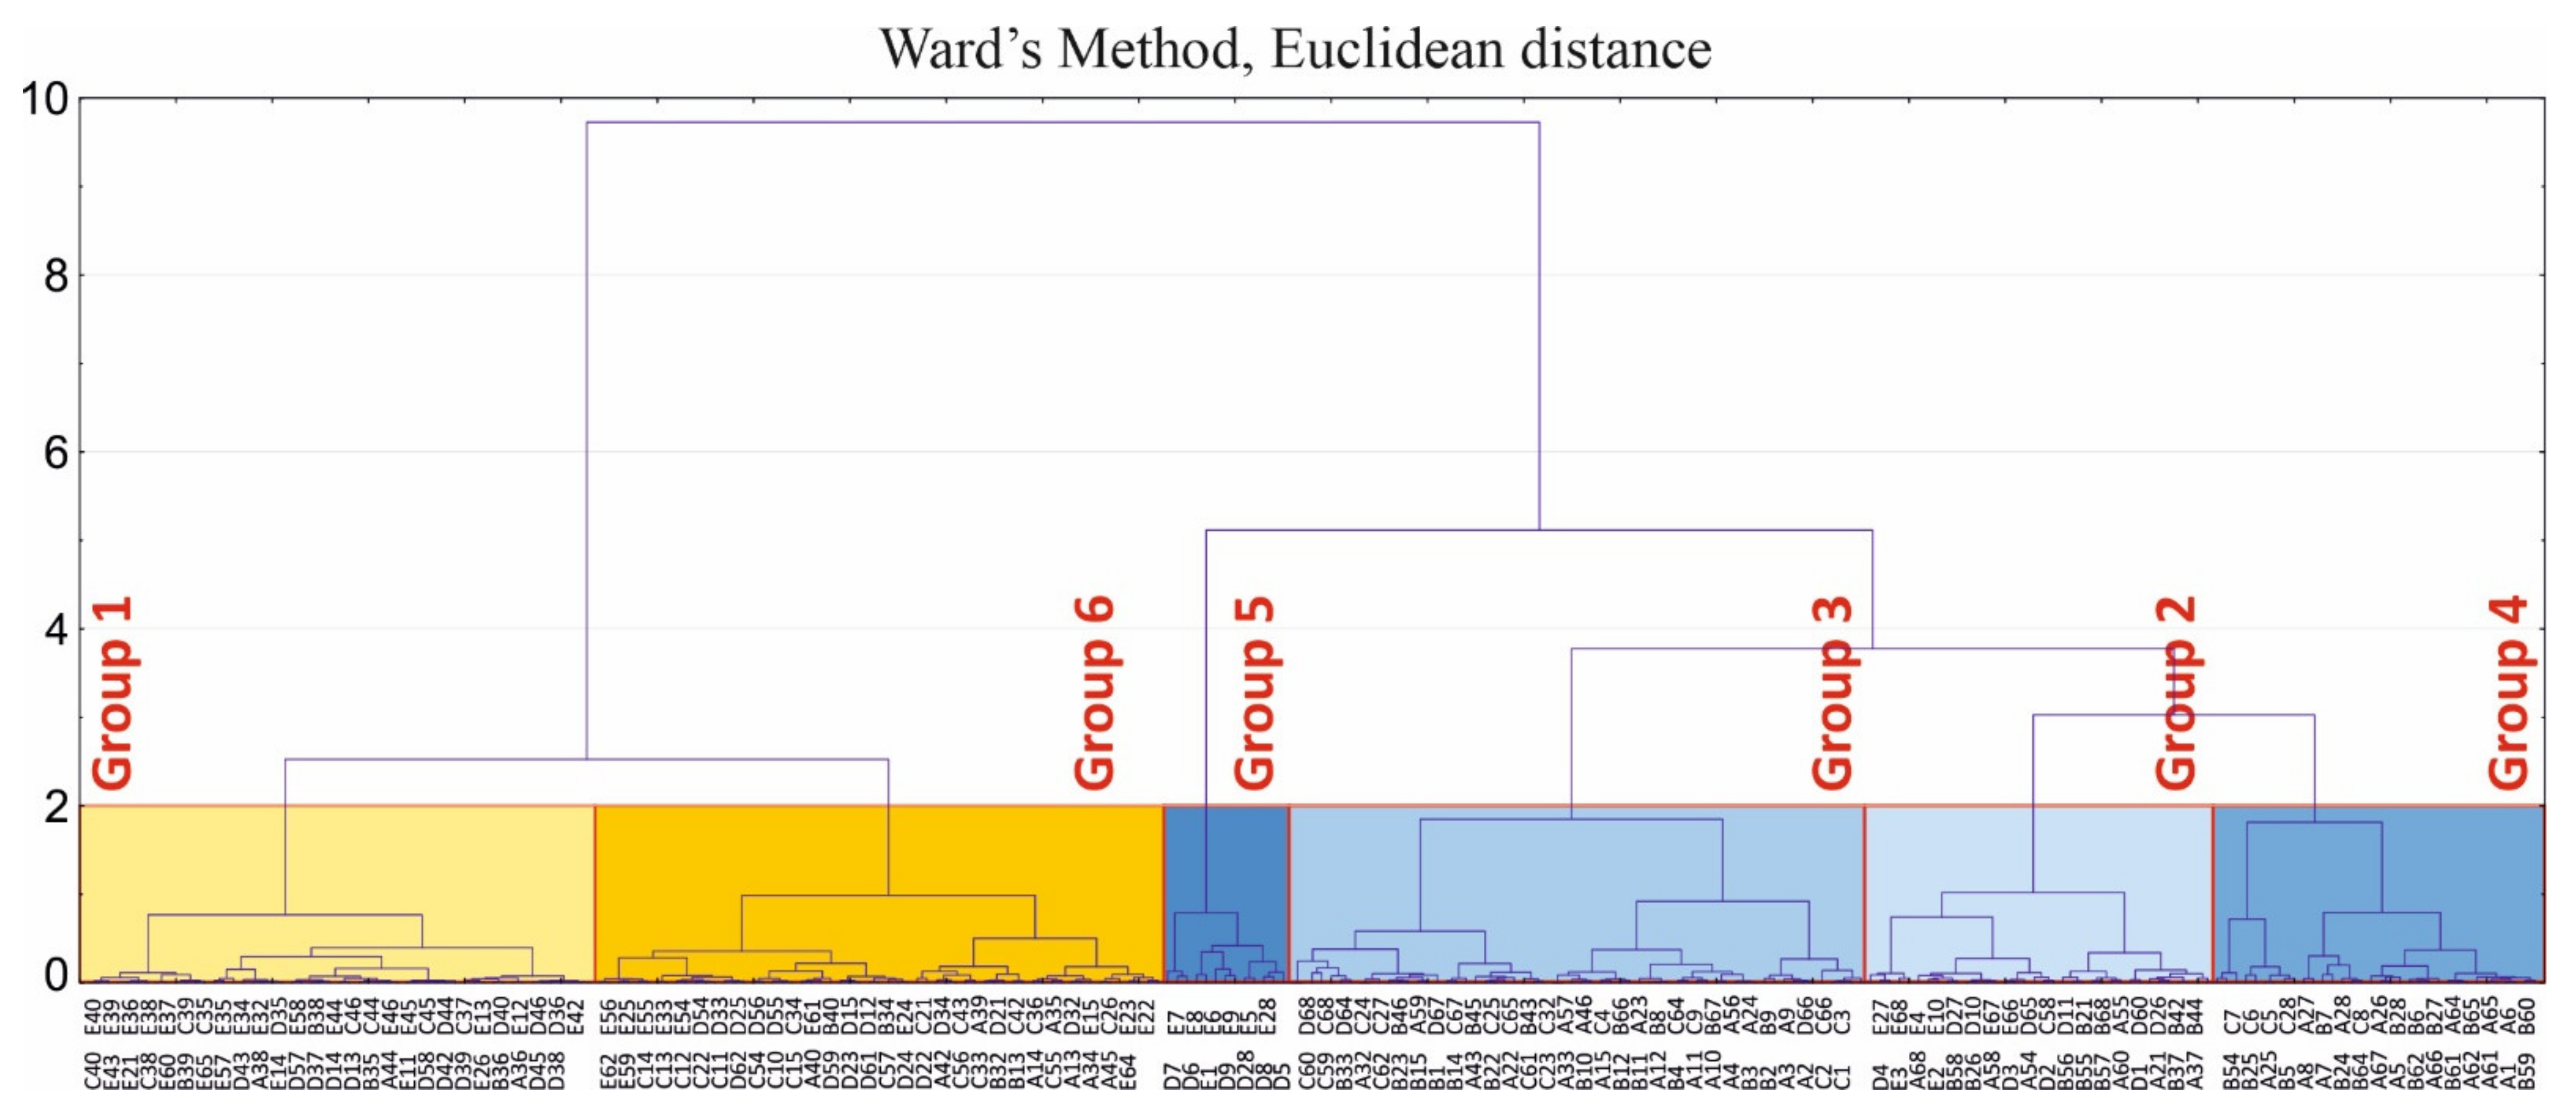
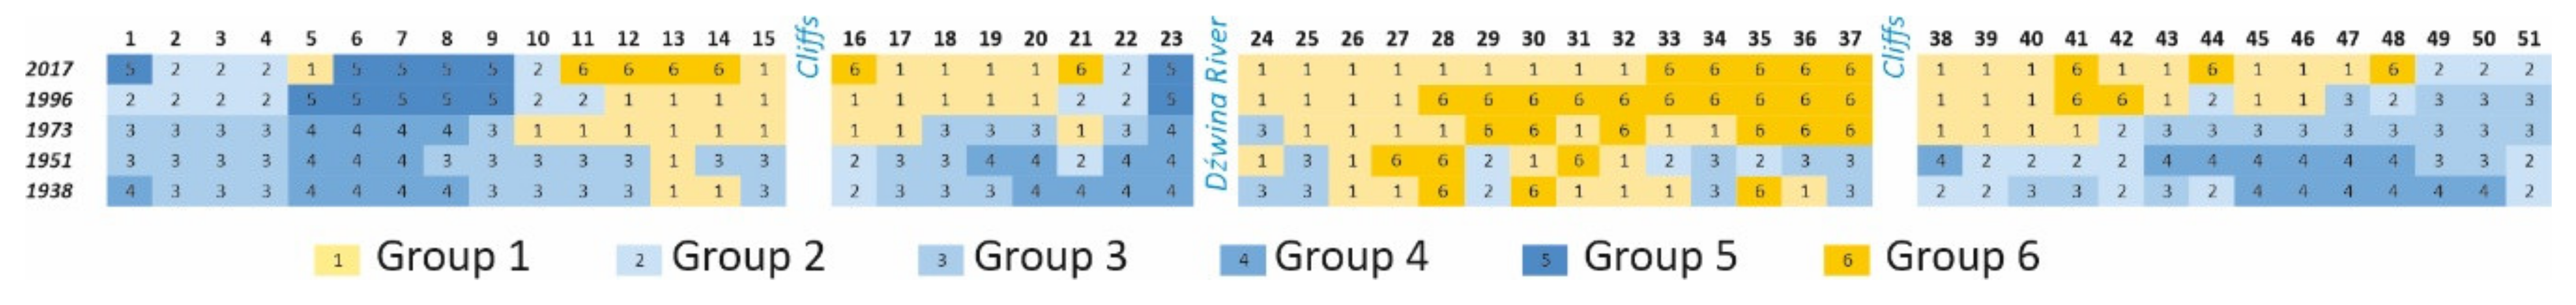
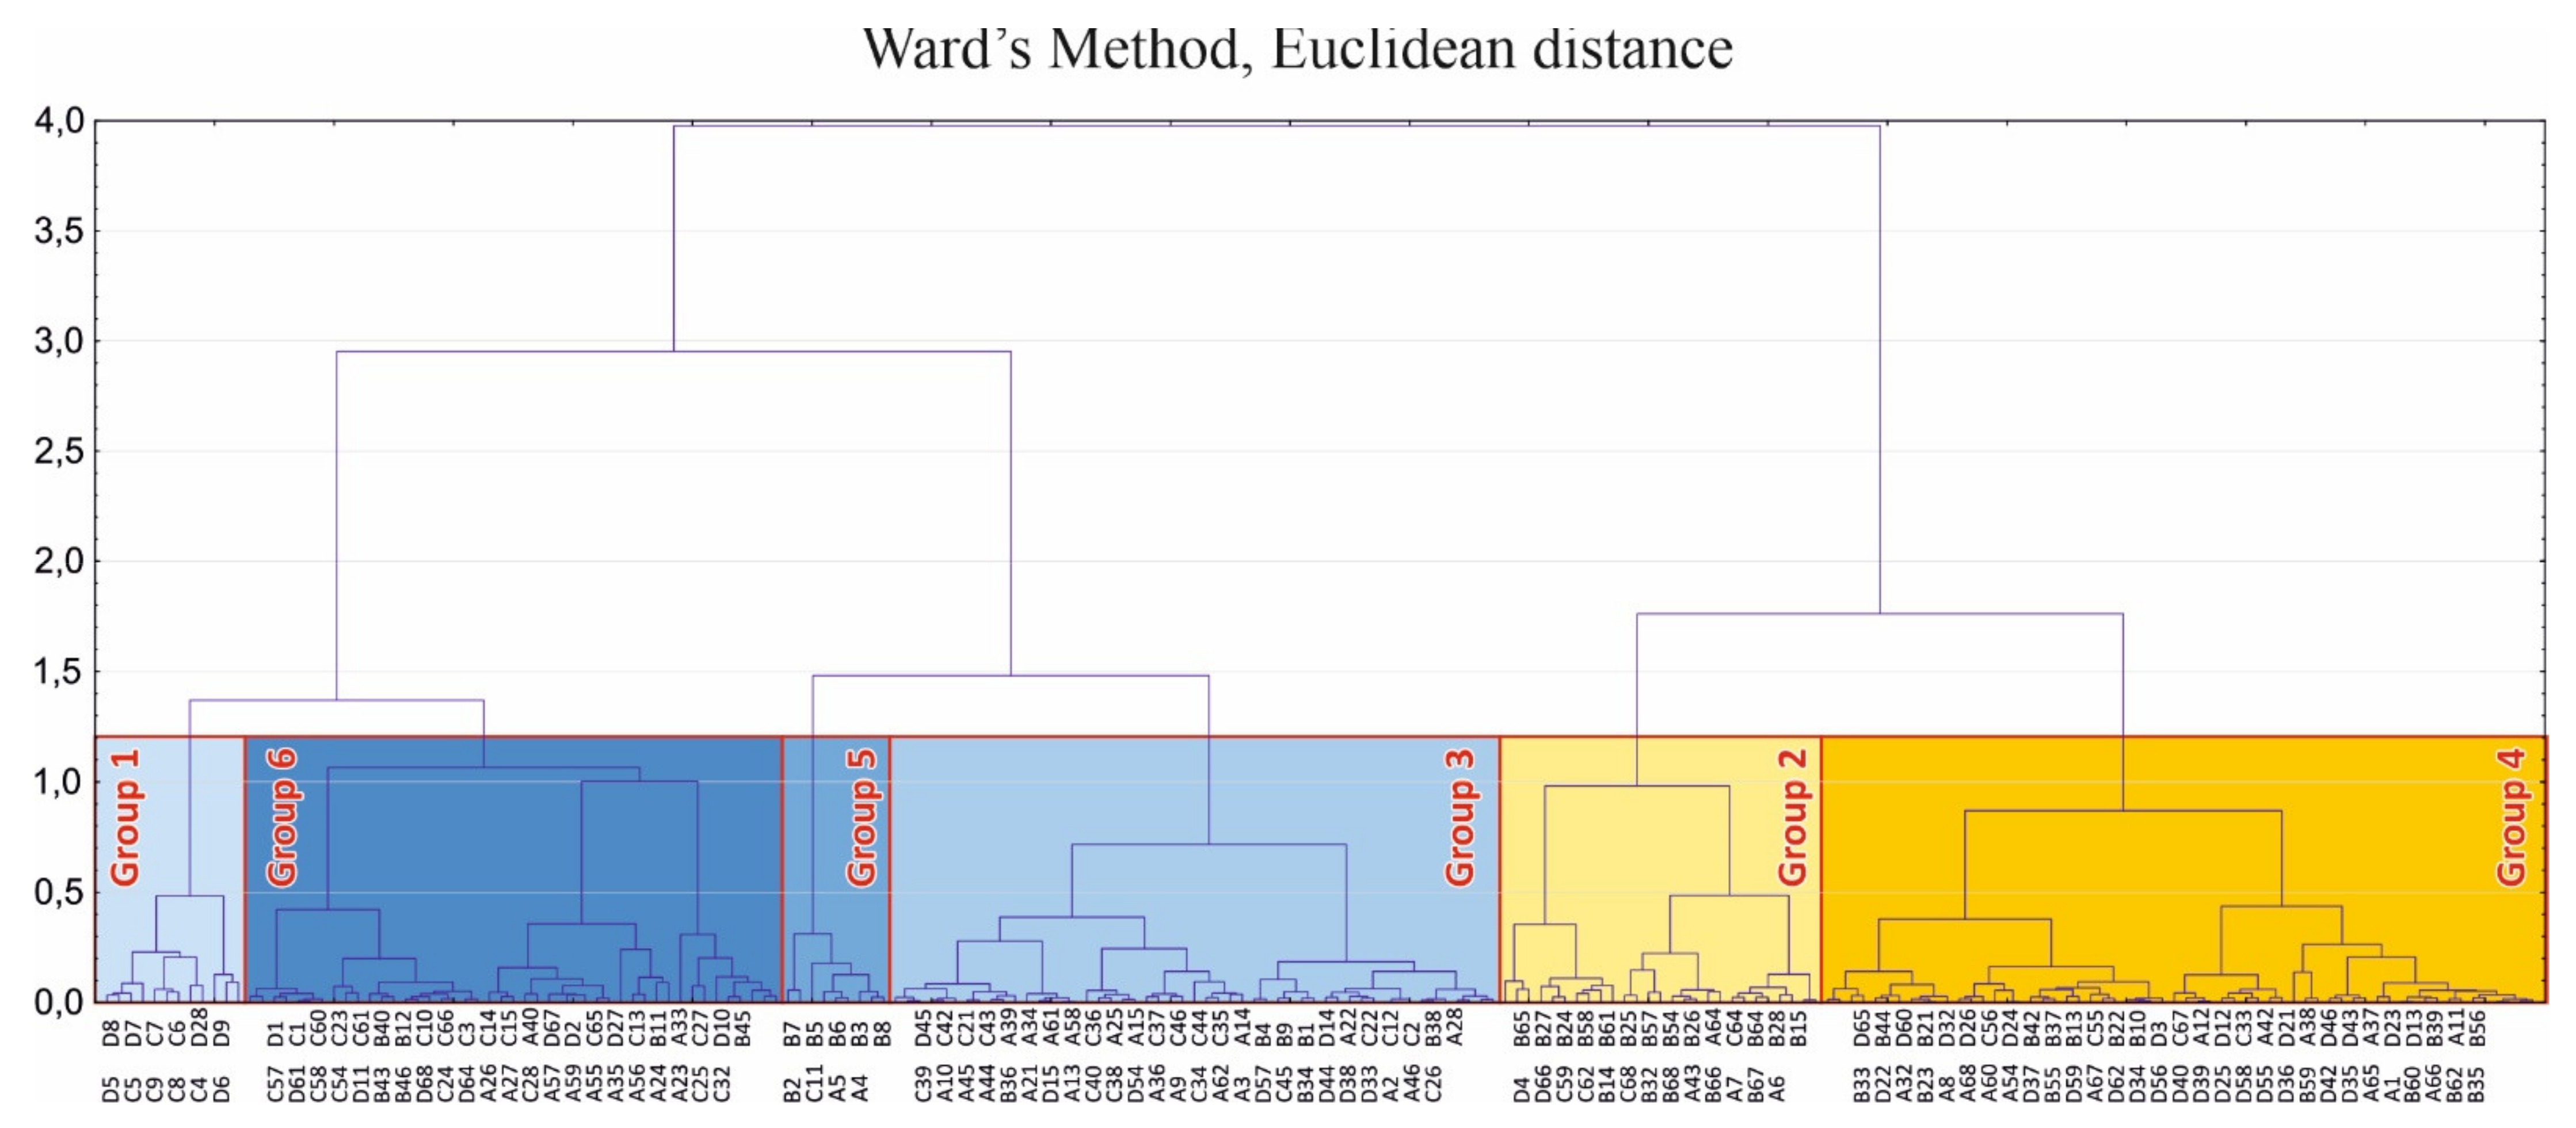
4.3. Statistical Analysis of Land Cover Changes
5. Discussion
6. Conclusions
Supplementary Materials
Author Contributions
Funding
Data Availability Statement
Conflicts of Interest
References
- Deng, J.; Harff, J.; Zhang, W.; Schneider, R.; Dudzińska-Nowak, J.; Giza, A.; Terefenko, P.; Furmańczyk, K. The Dynamic Equilibrium Shore Model for the Reconstruction and Future Projection of Coastal Morphodynamics. In Coastline Changes of the Baltic Sea from South to East; Springer International Publishing: Berlin/Heidelberg, Germany, 2017; pp. 87–106. [Google Scholar]
- Vousdoukas, M.I.; Voukouvalas, E.; Annunziato, A.; Giardino, A.; Feyen, L. Projections of extreme storm surge levels along Europe. Clim. Dyn. 2016, 47, 3171–3190. [Google Scholar] [CrossRef]
- Terefenko, P.; Giza, A.; Paprotny, D.; Kubicki, A.; Winowski, M. Cliff retreat induced by series of storms at Międzyzdroje (Poland). J. Coast. Res. 2018, 85, 181–185. [Google Scholar] [CrossRef]
- Tõnisson, H.; Suursaar, U.; Rivis, R.; Kont, A.; Orviku, K. Observations and analysis of coastal in the West Estonian Archipelago caused by storm Ulli (?Emil) in January 2012. J. Coastal Res. 2013, SI65, 832–837. [Google Scholar] [CrossRef]
- Paprotny, D.; Terefenko, P. New estimates of potential impacts of sea level rise and coastal floods in Poland. Nat. Hazards 2017, 85, 1249–1277. [Google Scholar] [CrossRef]
- Bugajny, N.; Furmańczyk, K. Comparison of Short-Term Changes Caused by Storms along Natural and Protected Sections of the Dziwnow Spit, Southern Baltic Coast. J. Coastal Res. 2017, 33, 775–785. [Google Scholar] [CrossRef]
- Furmańczyk, K.; Andrzejewski, P.; Benedyczak, R.; Bugajny, N.; Cieszyński, Ł.; Dudzińska-Nowak, J.; Giza, A.; Paprotny, D.; Terefenko, P.; Zawiślak, T. Recording of selected effects and hazards caused by current and expected storm events in the Baltic Sea coastal zone. J. Coastal Res. 2014, 70, 338–342. [Google Scholar] [CrossRef]
- Bugajny, N.; Furmańczyk, K. Short-term Volumetric Changes of Berm and Beachface during Storm Calming. J. Coastal Res. 2020, SI95, 398–402. [Google Scholar] [CrossRef]
- Terefenko, P.; Giza, A.; Paprotny, D.; Walczakiewicz, S. Characteristic of Winter Storm Xavier and Its Impacts on Coastal Morphology: Results of a Case Study on the Polish Coast. J. Coastal Res. 2020, SI95, 684–688. [Google Scholar] [CrossRef]
- Paprotny, D.; Terefenko, P.; Giza, A.; Czapliński, P.; Vousdoukas, M.I. Future losses of ecosystem services due to coastal erosion in Europe. Sci. Total Environ. 2021, 760, 144310. [Google Scholar] [CrossRef] [PubMed]
- Hägerstrand, T. Samhälle och natur. NordREFO 1993, 1, 14–59. [Google Scholar]
- Montereale-Gavazzi, G.; Roche, M.; Lurton, X.; Degrendele, K.; Terseleer, N.; Van Lancker, V. Seafloor change detection using multibeam echosounder backscatter: Case study on the Belgian part of the North Sea. Mar. Geophys. Res. 2018, 39, 229–247. [Google Scholar] [CrossRef]
- Gaida, T.C.; van Dijk, T.A.G.P.; Snellen, M.; Vermaas, T.; Mesdag, C.; Simons, D.G. Monitoring underwater nourishments using multibeam bathymetric and backscatter time series. Coast. Eng. 2020, 158, 103666. [Google Scholar] [CrossRef]
- Janowski, L.; Madricardo, F.; Fogarin, S.; Kruss, A.; Molinaroli, E.; Kubowicz-Grajewska, A.; Tegowski, J. Spatial and Temporal Changes of Tidal Inlet Using Object-Based Image Analysis of Multibeam Echosounder Measurements: A Case from the Lagoon of Venice, Italy. Remote Sens. 2020, 12, 2117. [Google Scholar] [CrossRef]
- Morgan, J.L.; Gergel, S.E. Quantifying historic landscape heterogeneity from aerial photographs using object-based analysis. Landsc. Ecol. 2010, 25, 985–998. [Google Scholar] [CrossRef]
- Morgan, J.L.; Gergel, S.E.; Coops, N.C. Aerial Photography: A Rapidly Evolving Tool for Ecological Management. Bioscience 2010, 60, 47–59. [Google Scholar] [CrossRef]
- Tomscha, S.A.; Sutherland, I.J.; Renard, D.; Gergel, S.E.; Rhemtulla, J.M.; Bennett, E.M.; Daniels, L.D.; Eddy, I.M.S.; Clark, E.E. A guide to historical data sets for reconstructing ecosystem service change over time. Bioscience 2016, 66, 747–762. [Google Scholar] [CrossRef]
- Cohen, W.B.; Kushla, J.D.; Ripple, W.J.; Garman, S.L. An introduction to digital methods in remote sensing of forested ecosystems: Focus on the Pacific Northwest. Environ. Manag. 1996, 20, 421–435. [Google Scholar] [CrossRef] [PubMed]
- Fensham, R.J.; Fairfax, R.J. Aerial photography for assessing vegetation change: A review of applications and the relevance of findings for Australian vegetation history. Aust. J. Bot. 2002, 50, 415–429. [Google Scholar] [CrossRef]
- Laliberte, A.S.; Rango, A.; Havstad, K.M.; Paris, J.F.; Beck, R.F.; McNeely, R.; Gonzalez, A.L. Object-oriented image analysis for mapping shrub encroachment from 1937 to 2003 in southern New Mexico. Remote Sens. Environ. 2004, 93, 198–210. [Google Scholar] [CrossRef]
- Gibbens, R.P.; McNeely, R.P.; Havstad, K.M.; Beck, R.F.; Nolen, B. Vegetation changes in the Jornada Basin from 1858 to 1998. J. Arid Environ. 2005, 61, 651–668. [Google Scholar] [CrossRef]
- Crowell, M.; Leatherman, S.P.; Buckley, M.K. Historical Shoreline Change: Error Analysis and Mapping Accuracy. J. Coast. Res. 1991, 7, 839–852. [Google Scholar]
- Wziątek, D.Z.; Terefenko, P.; Kurylczyk, A. Multi-Temporal Cliff Erosion Analysis Using Airborne Laser Scanning Surveys. Remote Sens. 2019, 11, 2666. [Google Scholar] [CrossRef]
- Terefenko, P.; Paprotny, D.; Giza, A.; Morales-Nápoles, O.; Kubick, A.; Walczakiewicz, S. Monitoring Cliff Erosion with LiDAR Surveys and Bayesian Network-based Data Analysis. Remote Sens. 2019, 11, 843. [Google Scholar] [CrossRef]
- Deng, J.J.; Harff, J.; Giza, A.; Hartleib, J.; Dudzinska-Nowak, J.; Bobertz, B.; Furmanczyk, K.; Zolitz, R. Reconstruction of Coastline Changes by the Comparisons of Historical Maps at the Pomeranian Bay, Southern Baltic Sea. In Coastline Changes of the Baltic Sea from South to East: Past and Future Projection; Harff, J., Furmanczyk, K., Von Storch, H., Eds.; Coastal Research Library; Springer: Berlin/Heidelberg, Germany, 2017; Volume 19, pp. 271–287. [Google Scholar]
- Lucas, C. Flora der Insel Wollin. Verh. des Bot. Ver. Berl. Brandenbg. 1860, 2, 25–68. [Google Scholar]
- Short, A.D.; Hesp, P.A. Wave, beach and dune interactions in southeastern Australia. Mar. Geol. 1982, 48, 259–284. [Google Scholar] [CrossRef]
- Carter, R. Coastal Environments. An Introduction to the Physical, Ecological, and Cultural Systems of Coastlines; Academic Press: Cambridge, MA, USA, 2013. [Google Scholar]
- Musielak, S.; Furmańczyk, K.; Osadczuk, K.; Prajs, J. Fotointerpretacyjny Atlas Dynamiki Strefy Brzegu Morskiego. Lata 1958–1989. Odcinek Świnoujście–Pogorzelica. Skala 1:5 000. 21 Sekcji; Urząd Morski w Szczecinie: Szczecin, Poland, 1991. [Google Scholar]
- Dudzińska-Nowak, J. Coastline Long-Term Changes of the Selected Area of the Pomeranian Bay. In Coastal Dynamic, Geomorphology and Protection; Tubielewicz, A., Ed.; EUROCOAST-LITTORAL: Gdańsk, Poland, 2006; pp. 163–170. [Google Scholar]
- Grunewald, R. Assessment of Damages from Recreational Activities on Coastal Dunes of the Southern Baltic Sea. J. Coast. Res. 2006, 5, 1145–1157. [Google Scholar] [CrossRef]
- Łabuz, T.A.; Grunewald, R. Studies on Vegetation Cover of the Youngest Dunes of the Świna Gate Barrier (Western Polish Coast). J. Coast. Res. 2007, 1, 160–172. [Google Scholar] [CrossRef]
- Bielecka, E.; Jenerowicz, A.; Pokonieczny, K.; Borkowska, S. Land Cover Changes and Flows in the Polish Baltic Coastal Zone: A Qualitative and Quantitative Approach. Remote Sens. 2020, 12, 2088. [Google Scholar] [CrossRef]
- Wolski, T.; Wiśniewski, B.; Giza, A.; Kowalewska-Kalkowska, H.; Boman, H.; Grabbi-Kaiv, S.; Hammarklint, T.; Holfort, J.; Lydeikaitė, Ž. Extreme sea levels at selected stations on the Baltic Sea coast. Oceanologia 2014, 56, 259–290. [Google Scholar] [CrossRef]
- Różyński, G. Wave Climate in the Gulf of Gdańsk vs. Open Baltic Sea near Lubiatowo, Poland. Arch. Hydroeng. Environ. Mech. 2010, 57, 167–176. [Google Scholar]
- Novak, K. Rectification of Digital Imagery. Photogramm. Eng. Remote Sens. 1992, 58, 339–344. [Google Scholar]
- Hood, J.; Ladner, L.; Champion, R. Image Processing Techniques for Digital Orthophotoquad Production. Photogramm. Eng. Remote Sens. 1989, 55, 1323–1329. [Google Scholar]
- Toutin, T. Geometric processing of remote sensing images: Models, algorithms and methods. Int. J. Remote Sens. 2004, 25, 1893–1924. [Google Scholar] [CrossRef]
- Stone, K.H. A Guide to the Interpretation and Analysis of Aerial Photos. Ann. Assoc. Am. Geogr. 1964, 54, 318–328. [Google Scholar] [CrossRef]
- Lillesand, T.; Kiefer, R.W. Remote Sensing and Image Interpretation, 4th ed.; John Wiley & Sons: New York, NY, USA, 2000. [Google Scholar]
- Hudak, A.T.; Wessman, C.A. Textural Analysis of Historical Aerial Photography to Characterize Woody Plant Encroachment in South African Savanna. Remote Sens. Environ. 1998, 66, 317–330. [Google Scholar] [CrossRef]
- Bähr, H.P.; Vögtle, T. Digitale Bildverarbeitung. Anwendungen in Photogrammetrie, Fernerkundung und GIS; Wichmann Verlag: Heidelberg, Germany, 2005. [Google Scholar]
- Congalton, R. A Review of Assessing The Accuracy of Classifications of Remotely Sensed Data. Remote Sens. Environ. 1991, 37, 35–46. [Google Scholar] [CrossRef]
- Stanisz, A. Przystępny Kurs Statystyki z Zastosowaniem STATISTICA PL na Przykładach Medycyny; StatSoft: Kraków, Poland, 2007. [Google Scholar]
- Ward, J.K. Hierarchical groupings to optimize an objective function. J. Am. Stat. Assoc. 1963, 58, 236–244. [Google Scholar] [CrossRef]
- Luszniewicz, A.; Słaby, T. Statystyka z Pakietem Komputerowym STATISTICA PL. Teoria i Zastosowania; Wydawnictwo C.H. Beck: Warsaw, Poland, 2003. [Google Scholar]
- Harvey, K.; Hill, G.J.E. Vegetation mapping of a tropical freshwater swamp in the Northern Territory, Australia: A comparison of aerial photography, Landsat TM and SPOT satellite imagery. Int. J. Remote Sens. 2001, 22, 2911–2925. [Google Scholar] [CrossRef]
- Lambin, E.F.; Geist, H.J.; Lepers, E. Dynamics of Land-Use and Land-Cover Change in Tropical Regions. Annu. Rev. Environ. Resour. 2003, 28, 205–241. [Google Scholar] [CrossRef]
- Antso, K.; Palginõmm, V.; Szava-Kovats, R.; Kont, A. Dynamics of Coastal Land Use over the Last Century in Estonia. J. Coast. Res. 2011, SI64, 1769–1773. [Google Scholar]
- Chun, J.; Kim, C.-K.; Kang, W.; Park, H.; Kim, G.; Lee, W.-K. Sustainable Management of Carbon Sequestration Service in Areas with High Development Pressure: Considering Land Use Changes and Carbon Costs. Sustainability 2019, 11, 5116. [Google Scholar] [CrossRef]
- Ibaceta, R.; Splinter, K.D.; Harley, M.D.; Turner, I.L. Enhanced coastal shoreline modelling using an Ensemble Kalman Filter to include non-stationarity in future wave climates. Geophys. Res. Lett. 2020, 47, e2020GL090724. [Google Scholar] [CrossRef]
- Vousdoukas, M.I.; Ranasinghe, R.; Mentaschi, L.; Plomaritis, T.A.; Athanasiou, P.; Luijendijk, A.; Feyen, L. Sandy coastlines under threat of erosion. Nat. Clim. Chang. 2020, 10, 260–263. [Google Scholar] [CrossRef]
- McCarroll, R.J.; Masselink, G.; Valiente, N.G.; Scott, T.; Wiggins, M.; Kirby, J.A.; Davidson, M. A novel rules-based shoreface translation model for predicting future coastal change: ShoreTrans. Earth arXiv 2020. [Google Scholar] [CrossRef]
- van der Meulen, F.; Witter, J.V.; Arens, S.M. The use of a GIS in assessing the impacts of sea level rise on nature conservation along the Dutch coast: 1990–2090. Landsc. Ecol. 1991, 1, 105–113. [Google Scholar] [CrossRef]
- Keijsers, J.G.S.; De Groot, A.V.; Riksen, M.J.P.M. Modeling the biogeomorphic evolution of coastal dunes in response to climate change. J. Geophys. Res. Earth Surf. 2016, 121, 1161–1181. [Google Scholar] [CrossRef]
- Hesp, P. Foredunes and blowouts: Initiation, geomorphology and dynamics. Geomorphology 2002, 48, 245–268. [Google Scholar] [CrossRef]
- Psuty, N.P. The Coastal Foredune: A Morphological Basis for Regional Coastal Dune Development. In Coastal Dunes; Martínez, M.L., Psuty, N.P., Eds.; Ecological Studies; Springer: Berlin/Heidelberg, Germany, 2008; p. 171. [Google Scholar]
- Martínez, M.L.; Psuty, N.P. Coastal Dunes. Ecology and Conservation; Springer: New York, NY, USA, 2004. [Google Scholar]
- Hesp, P. A review of biological and geomorphological processes involved in the initiation and development of incipient foredunes. Proc. R. Soc. Edinb. Sect. B Biol. Sci. 1989, 96, 181–202. [Google Scholar] [CrossRef]
- Musielak, S. Shoreline dynamics between Niechorze and Świnoujście. J. Coast. Res. 1995, 22, 288–291. [Google Scholar]
- Łabuz, T.A. Polish coastal dunes: Affecting factors and morphology. Landf. Anal. 2013, 22, 33–59. [Google Scholar] [CrossRef]
- Giza, A.; Furmańczyk, K. Model Rozwoju Profilu Brzegu Wydmowego. In Geologia i Geomorfologia Pobrzeża i Południowego Bałtyku; Florek, W., Ed.; Wydawnictwo Naukowe Pomorskiej Akademii Pedagogicznej w Słupsku: Słupsk, Poland, 2005; pp. 123–136. [Google Scholar]


| Year | Count | Scan Resolution | Scale | Spatial Resolution |
|---|---|---|---|---|
| 2017 | 42 | Digital version | 1:5 000 | 0.25 m |
| 1996 | 26 | 1200 dpi | 1:26 000 | 0.5 m |
| 1973 | 18 | 1200 dpi | 1:28 000 | 0.75 m |
| 1951 | 20 | 1200 dpi | 1:22 000 | 0.45 m |
| 1938 | 11 | 600 dpi | 1:25 000 | 1 m |
| Group 1 | Group 2 | Group 3 | Group 4 | Group 5 | Group 6 | |||||||||||||
|---|---|---|---|---|---|---|---|---|---|---|---|---|---|---|---|---|---|---|
| Mean | Max | Min | Mean | Max | Min | Mean | Max | Min | Mean | Max | Min | Mean | Max | Min | Mean | Max | Min | |
| Water class | 66% | 75% | 36% | 55% | 62% | 47% | 66% | 84% | 53% | 53% | 66% | 28% | 32% | 48% | 17% | 63% | 67% | 60% |
| Sand class | 15% | 23% | 8% | 24% | 32% | 15% | 21% | 30% | 8% | 35% | 51% | 22% | 24% | 33% | 16% | 14% | 18% | 9% |
| Grass class | 4% | 14% | 0% | 6% | 12% | 2% | 9% | 24% | 0% | 10% | 29% | 1% | 12% | 18% | 7% | 2% | 4% | 0% |
| Tree class | 15% | 37% | 5% | 15% | 28% | 7% | 4% | 15% | 0% | 2% | 9% | 0% | 31% | 54% | 18% | 21% | 27% | 17% |
| Group 1 | Group 2 | Group 3 | Group 4 | Group 5 | Group 6 | |||||||||||||
|---|---|---|---|---|---|---|---|---|---|---|---|---|---|---|---|---|---|---|
| Mean | Max | Min | Mean | Max | Min | Mean | Max | Min | Mean | Max | Min | Mean | Max | Min | Mean | Max | Min | |
| Water class | −3% | 8% | −17% | 3% | 15% | −7% | −1% | 3% | −8% | 3% | 14% | −2% | −17% | −8% | −24% | −5% | 4% | −11% |
| Sand class | 2% | 22% | −18% | −13% | −5% | −26% | 1% | 10% | −5% | −5% | 1% | −10% | 5% | 10% | −3% | −6% | 3% | −13% |
| Grass class | −7% | 2% | −25% | 6% | 16% | 0% | 0% | 6% | −4% | −1% | 6% | −6% | 8% | 13% | 5% | 2% | 10% | −6% |
| Tree class | 9% | 24% | −4% | 4% | 12% | −3% | 0% | 6% | −5% | 2% | 9% | −9% | 3% | 8% | −1% | 10% | 24% | 0% |
Publisher’s Note: MDPI stays neutral with regard to jurisdictional claims in published maps and institutional affiliations. |
© 2021 by the authors. Licensee MDPI, Basel, Switzerland. This article is an open access article distributed under the terms and conditions of the Creative Commons Attribution (CC BY) license (http://creativecommons.org/licenses/by/4.0/).
Share and Cite
Giza, A.; Terefenko, P.; Komorowski, T.; Czapliński, P. Determining Long-Term Land Cover Dynamics in the South Baltic Coastal Zone from Historical Aerial Photographs. Remote Sens. 2021, 13, 1068. https://doi.org/10.3390/rs13061068
Giza A, Terefenko P, Komorowski T, Czapliński P. Determining Long-Term Land Cover Dynamics in the South Baltic Coastal Zone from Historical Aerial Photographs. Remote Sensing. 2021; 13(6):1068. https://doi.org/10.3390/rs13061068
Chicago/Turabian StyleGiza, Andrzej, Paweł Terefenko, Tomasz Komorowski, and Paweł Czapliński. 2021. "Determining Long-Term Land Cover Dynamics in the South Baltic Coastal Zone from Historical Aerial Photographs" Remote Sensing 13, no. 6: 1068. https://doi.org/10.3390/rs13061068
APA StyleGiza, A., Terefenko, P., Komorowski, T., & Czapliński, P. (2021). Determining Long-Term Land Cover Dynamics in the South Baltic Coastal Zone from Historical Aerial Photographs. Remote Sensing, 13(6), 1068. https://doi.org/10.3390/rs13061068