Abstract
In the absence of systematic structural monitoring to support adequate maintenance standards, many existing infrastructures may reach unacceptable quality levels during their life cycle, resulting in significant damage and even potential failure. The metropolitan area of the Gulf of Salerno (Italy), served by a complex multimodal transport network connecting the port area to the roads and railways surrounding the urban area, represents an important industrial and commercial hub at the local and international scale. This particular scenario, developed in a complex morphological and geological context, has led to the interference and overlapping of the transport network (highway, railway, main and secondary roads) that run through the piedmont area north of the port. Given the relevance of the area, our research aims to highlight the capabilities of the persistent scatterer interferometry (PSI) technique, belonging to the group of differential interferometric synthetic aperture radar (SAR), to extract space–temporal series of displacements on ground points or artifacts with millimeter accuracy useful to understand ongoing deformation processes. By using archived data from the European Space Agency missions, i.e., ERS1/2 (European remote-sensing satellite) and ENVISAT (environmental satellite), and the most recent data from COSMO-SkyMed constellations, it was possible to collect a 28-year dataset that was used to spatially analyze displacement patterns at a site-specific scale to check the stability of viaducts and embankments, and on a larger scale to understand the activity of the surrounding slopes. Despite the different resolution and subsequently the ground density, the analysis of the different datasets showed a spatiotemporal consistency in the displacement patterns that concerned two subareas showing significant annual velocity trends, one northeast of the city and the second in the port area. The analysis presented in this paper highlights how a complex geologic area, combining slope movements and various fault systems, could be a major concern for the stability of the overlying infrastructure and also the role that a PSI analysis can play in remotely monitoring their behavior over long periods of time.
1. Introduction
Monitoring of ground deformations caused by natural processes (tectonics, subsidence or slope movements) or by anthropogenic transformation of the natural environment (groundwater exploitation, gas, oil and drilling) is a key factor to mitigate risks on civil structures and the surrounding environment [1,2].
In particular, the monitoring of linear infrastructure networks is crucial for the safety of population in terms of socioeconomic resources and for the sustainability of production processes.
Currently, a number of methods for in situ and remote data collection are available with the aim of monitoring, on large scale, both the evolution of natural and anthropogenic ground deformation processes and the degradation of construction materials of structural components of civil engineering structures [3,4,5,6].
As for the ground deformation, slow movements are often due to long-term ground consolidation and shear failure resulting in subsidence, but can also be ascribed to the movements of the slopes where the structure was founded. To date, many studies have focused on the severe damage caused by ground subsidence in urban or rural areas in order to reduce the negative impact of ground subsidence on the environment and infrastructures [7,8,9,10]. Similarly, the landslide research community has addressed the monitoring of ground displacement using a variety of ground and remote sensing techniques [11,12,13,14,15].
To assess the effects of ground deformation on large structures such as dams and linear infrastructure, conventional ground monitoring techniques (inclinometers, piezometers and topographic surveys) are usually employed; these traditional techniques provide survey data on a narrow set of control points that are not usually enough to describe the overall pattern of deformation [16]. Surveying techniques based on automated total stations and spirit leveling are able to detect up to subcentimeter displacements, but require targets installed on buildings [17,18].
In general, these conventional techniques allow for accurate and reliable measurements, but require long survey times and high costs for installation and maintenance (both of the targets and the fixed instrumentation to be installed) [19]. To ensure a systematic and comprehensive control of structural stability over large areas, terrestrial remote sensing techniques (e.g., laser scanning) [20,21,22] and satellite remote sensing techniques [23,24] can be effectively used.
Among the satellite techniques, especially the synthetic aperture radar (SAR) has improved in the last decades [25,26]. Originally, it was designed for geophysical applications, mainly for studying crustal dynamics and monitoring surface displacements [27,28,29]. In recent years, the use of a long series of continuous differential radar interferometry data has emerged as a very useful method for monitoring slow-moving landslides that can lead to damage of structures. The SAR technique can be used to analyze the static behavior of civil structures in both disrupted (during construction or restoration work) and undisrupted conditions and can aid in damage assessment analysis and scenario-based risk assessment. It has many advantages: it does not interfere with the structure or its surroundings, it is operational regardless of weather conditions and time of day, enables extending analyses back in time starting from the first ERS satellite missions in 1992 if archive data are used [30,31].
In particular, the differential interferometric synthetic aperture radar (DInSAR) technique is extensively used for the analysis and modeling of soil settlement/consolidation processes, as it provides a much denser sample of spatial data on the ground than can be obtained with standard direct monitoring methods [31]. The frequency of data depends on the acquisition schedule of the satellites ranging from 35 days for ERS/ENVISAT (European remote-sensing satellite/environmental satellite) missions to a few days for new generation satellites such as COSMO-SkyMed [30]. DInSAR time series provide ground displacements having subcentimeter accuracy [30,32,33,34]. Over the years, DInSAR deformation time series have been exploited in a wider variety of geophysical contexts, such as seismic, volcanic, and mass movement scenarios, with a dual purpose: to map ground displacements and monitor them over time [35,36,37,38,39,40].
A number of reports on the correlation between some advanced monitoring techniques and the DInSAR technique can be found in the literature. D’Aranno et al. [41] compare the displacements of a road surface measured using static and mobile laser scanners with those resulting from DInSAR techniques; the correlations are very high, the failures measured using SAR data are almost in line with those derived from the laser scanner technique. Głąbicki [42] compares the surface deformations of an active volcano measured using GNSS data with those obtained from differential interferometry; the comparison shows that both methods produce similar results, which leads to say that Sentinel-1 images processed with the DInSAR method can be successfully used to determine ground surface deformations over large areas.
The most widely used processing technique are based on high-resolution SAR interferometry algorithms referred to as persistent scatterers (PSs) and small baseline subset (SBAS) approaches [33].
The PS approach is based on the idea that a small subset of radar targets, the PSs, is almost free of temporal and geometric decorrelation effects and therefore, by maintaining all phase information over time and as the acquisition geometry changes, has optimal characteristics for interferometric measurements. PS processing is based on a statistical study of radar images and marks a transition from the analysis with pairs of images, typical of classical differential interferometry DInSAR, to a multi-image analysis. For each single PS, the average deformation velocity trend can be estimated with accuracy between 0.1 and 2 mm/year. To analyze infrastructure behavior or detect potential damage, an interpolation can be applied so that the information turns from point and discrete to diffuse and continuous. Due to the development of high-resolution SAR sensors, a large amount of PSs can be identified in an infrastructure to properly monitor different types of deformation movements [4]. In addition, a shorter revisit time provides a large set of SAR data that makes it possible to analyze seasonal expansion due to changes in water level and/or temperature [43].
The SBAS technique is based on the principle of SAR aperture synthesis and it uses a large number of single look complex (SLC) radar images with a baseline smaller than defined threshold for building a combination of differential interferograms. This process allows obtaining displacement time series and velocity maps from multiple unwrapped interferograms.
In addition, tomographic SAR imaging (TomoSAR) is the most widely used method to carry out detailed analysis in urban environment as it allows to separate overlapping PSs. TomoSAR is derived from three-dimensional SAR tomography (3D-SAR) [44,45], in which multibaseline images commonly acquired in one-pass mode are used to synthesize apertures along the elevation direction. An important improvement is tomography-based persistent scatterers interferometry (Tomo-PSInSAR) [46,47], a combination of tomography and InSAR time series. Since Tomo-PSInSAR has the advantage of measuring double persistent scatterers located in the same pixel, it can therefore increase the number of persistent scatterers in urban areas consisting of very tall buildings. The first applications in the field of infrastructure are reported in Ying and Qinfen [48] where the authors describe the region-based method that they developed for recognizing roads and bridges in fully polarized SAR images.
Italy is one of the European countries most affected by landslides, so researchers and technical officers are always looking for sustainable solutions for routine monitoring of civil infrastructures. In most cases, the problems of Italian infrastructures are not determined by structural factors, but by hydrogeological processes. In particular, the Campania Region in Southern Italy is young in geologic terms and as the geological structure of the Italian peninsula derives mainly from the Alpine orogeny with a few minor processes still in activity. Therefore, it is subjected to intense morphogenetic processes that substantially shape its landscape. Some studies carried out using the PSInSAR technique on the Campania county seat (Naples) have shown that uncorrelated anthropogenic and natural subsidence causes can coexist, thus highlighting the complexity of the territory [49,50]. The frequent phenomena of hydrogeological instability are due to the extremely heterogeneous ground nature. The DInSAR technique has proven effective because it allows one to detect and monitor diachronic landslides, close to a main infrastructure network, that can be periodically reactivated following heavy rainfall [51]. Inclinometers were used to monitor slope movements and the results were compared with satellite data; the studies show a good correlation between the results provided by the two techniques used.
All this goes to suggest that monitoring cannot be carried out on a single infrastructure, but it is also relevant to monitor much larger areas surrounding the infrastructure. The SAR technique has been proven to have the ability to monitor and analyze very large areas. Qin et al. [52] analyzed long-term subsidence mapping over the entire Shanghai transportation network—elevated roads, highways and subways—showing that SAR data can provide useful information for management and maintenance.
Our work presents an application of the persistent scatterer interferometry (PSI) technique over an area of great socioeconomic relevance, north of the city of Salerno (southern Italy), where many transport infrastructures coexist, with the aim of evaluating and analyzing the displacements that were observed in the last two decades by using traditional on-site measurements. The analyzed dataset consists, for the time period 1993–2008, by SAR data from the ERS-1, ERS-2 and ENVISAT missions made available to the authors by the Ministry of Environment and Territory Protection (MATTM) and, for the period ranging from 2013 to February 2020, by COSMO-SkyMed data.
Following an overall analysis of the results obtained over the whole study area, our analysis focused on the four viaducts built between the 1950s and 1960s along the Salerno—Cava de’ Tirreni section (A3 Highway). As will be described in Section 2, the peculiarities of the geological environment and the structural setting make this area of special relevance for the evaluation of the effectiveness of the PSI technique used both to quantitatively estimate ongoing displacement rates and to spatially delimit the most critical areas.
The results are shown and analyzed in comparison with available geological data useful to assess the presence and extent of settlements. The results described in our paper could be effectively used to implement large-scale damage assessment analysis and to address future scenarios by extrapolating deformation trends.
2. The Case Study: Salerno Area
The study area is located near “Monti Lattari” (Lattari Mountains) in the Campania Region, in Southern Italy (Figure 1a). The whole area is made-up of a few subareas that are exposed to the risk of landslides and floods, also characterized by the coexistence of many transport infrastructures concentrated in a high value urban environment. In detail, the belt of territory between Salerno and Cava de’ Tirreni (Figure 1b) represents a “Strategic Infrastructure Corridor” (SIC) at the regional, national and international level that goes through areas prone to hydrogeomorphological hazard.

Figure 1.
Focus area. (a) Map of Italy showing the location of focus area; (b) section of A3 highway analyzed; (c) excerpt of map showing the location of the four viaducts being analyzed, north of the Salerno port and (d–g) perspective views of the four viaducts in order: Madonna del Monte, Olivieri, Caiafa and Madonna degli Angeli.
This is proved by the disastrous events that have occurred in a territorial and temporal context less vulnerable and strategic than the present one [53].
2.1. Road Network
The study focuses on the “Salerno—Vietri sul Mare” section of the A3 highway, part of the European road E45, which connects Naples to Salerno, along which four long viaducts are located (Figure 1b). The section is made up of two separate carriageways, each consisting in two lanes. Additionally, the two carriageways are altimetrically shifted, the northern one being at the highest level. Traveling along the north carriageway, the viaducts are named from east to west as follows: Madonna del Monte, Olivieri, Caiafa and Madonna degli Angeli (Figure 1c).
The viaducts were built between the 1950s and 1960s. Except for the Madonna del Monte viaduct (Figure 1d), which does not have a central arch structure, the main structures are Maillart-arch-type bridges (Figure 1e–g), made of reinforced concrete with a continuous frame deck and two access viaducts. The spans are about 8 m long with local variation in length due to the curvilinear path of the viaduct. They are supported by a series of interconnected ribs and pillars and reinforced by thin cast-in-place concrete slabs. Foundations are of the shallow type, in detail of the isolated spread footings type.
Two of the four viaducts, Madonna del Monte and Olivieri (Figure 1d,e) were built on a geologically unstable ground, being characterized by deep gravitational slope deformation (DGSD).
2.2. Geological Settings
The main geological characteristics of the area north of Salerno were determined by the stress regime acting from the Lower Pleistocene (2 Myr) to the Middle Pleistocene (1 Myr). This strain system developed as a block-faulting mechanism defined by two prevailing orthogonal systems: NW-SE (Apennine system) and NE-SW (Anti-Apennine system). This deformation is also associated with quaternary plains and deep sedimentary basins (thousands of meters deep) filled with continental, marine and volcanic materials. The lithology of Salerno is dominated by the “Carbonate Complex”, which comprises all of the calcareous and dolomite lithostratigraphic series of the Campanian platform. Quaternary sedimentary deposits along with the underlaying bedrock are represented by the following units in the study area (Figure 2). The carbonate lithology is intersected by near-orthogonal fault systems (Apennines and Antiapennines) that give rise to the present morpho-structure and, at the same time, control the existing hydrological network and landslide processes. In addition, also related to previous tectonic events, triangular and trapezoidal facets are well identified at the base of the slopes.
The geo-environmental hazard of Salerno is mainly represented by flood events and landslides. The stability of the geographical features of the study area is controlled by a multiplicity of predisposing factors, among which the cracking system has an important effect here. This rock mass jointing along with steep slopes are the main predisposing factors for the various mass movement mechanisms typical of carbonate rocks, such as toppling, translational and rotational slides, collapse, debris discharge through gullies and alluvial fans. Furthermore, the northern area of Salerno Port rests on terrain affected by deep-seated gravitational slope deformation (DSGSD) favored by the high deformability of the lithostratigraphic interval of limestone-marl-mudstone within the dolomitic sequence [54]. The DSGSD, extending north of the A3 highway and the port, is delimited by a circular, vertical escarpment of about 750 m, which appears as a clear slope-break. Despite the relevant characteristics of the DSGSD, in [53] the authors state that there are no signs of movement taking place but, if there were, they would have had clear effects on the many artifacts in the area.
Very helpful for the analysis is the hazard and risk zoning that is available in the study area, based on the existing national database “Inventario dei Fenomeni Franosi in Italia” (IFFI) [54]. Based on this document, three of the viaducts analyzed were found to be built in high hazard (P3) and high risk (R3) zone; the eastern half of the Olivieri viaduct rests on a medium hazard (P2) and medium risk (R2) zone (Figure 3).
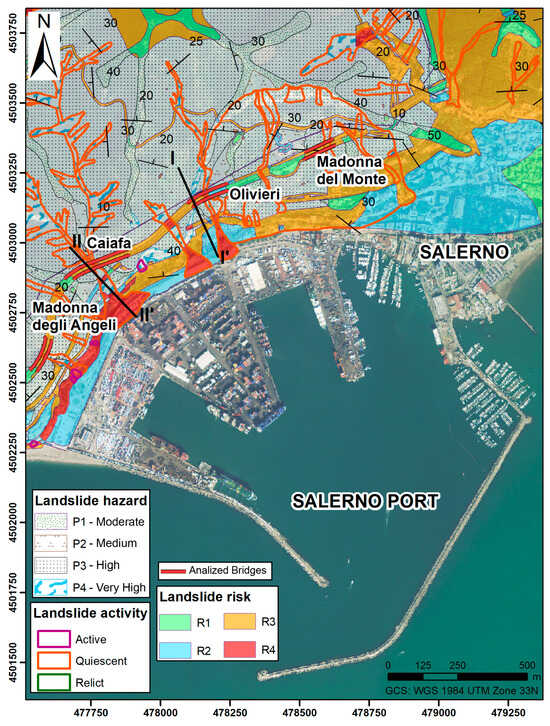
Figure 3.
Landslide hazard, risk and activity map. This map has been drawn based on the maps available on the website [55].

Figure 2.
Geological settings: 1. Anthropogenic debris and landfills; 2. gravels and sands with pelitic intercalations; 3. dense to partially cemented clastic and heterometric deposits, sometimes as stratiform bodies, composed of coarse angular and subangular grains; 4. dolomites and limestones, massive or in medium thin layers; 5. marl limestone in thin laminated layers, alternating with tabulated marls and stratified mudstones; 6. well stratified–massive dolomites, in many layers laminated and 7. dolomite in thin and medium layers, alternating with laminated dolomites. This map has been drawn based on the maps available on the website [55].

The activity of most of the landslides that affect this area, such as debris slides and other alluvial discharges that are even obstructed by some of the retaining walls and infrastructure previously built in concert with the highway, is located in a low hazard zone, characterized by a low potential for destructiveness related to the small size and constrained paths. Nevertheless, in light of the landslide inventory and zoning, as they interfere with existing infrastructure and the urban area, it is worth considering potential events that could cause various damages. Ground monitoring activities are therefore very useful to assess the timing of different geological and anthropogenic elements in this geographic area.
The geologic cross sections (Figure 4) for the Olivieri and Caiafa viaducts show the different degrees of geostructural complexity. The cross section I–I’ (Figure 4a) shows a profile that intersects the southwestern end of the Olivieri viaduct. The viaduct rests on the lithologic unit 4, whose bedrock consists of an alternation of limestones with softer marl limestones that are involved in the mobilized mass of the DSGSD and are limited to the south and southwest by mechanical contacts. The bedrock is susceptible to extensive deformation phenomena.

Figure 4.
Geological cross sections: (a) profile intersecting the Olivieri viaduct; (b) profile intersecting the Caiafa viaduct. 1. anthropogenic debris and landfills; 3. dense to partially cemented clastic and heterometric deposits, sometimes as stratiform bodies, composed of coarse angular and subangular grains; 4. dolomites and limestones, massive or in medium thin layers; 6. well stratified–massive dolomites, in many layers laminated and 7. dolomite in thin and medium layers, alternating with laminated dolomites.
The cross-section II–II’ intersects the Caiafa Viaduct (Figure 4b), which rests on the lithologic unit 6, composed of massive to layered dolomites and limestone. Here there were neither significant discontinuities nor landslides affecting the viaduct.
3. Materials and Methods
For the purpose of evaluating the deformation processes of the ground and infrastructure in relation to geological settings, the following data were considered in this study:
- The geospatial database containing, but not limited to, both the linear infrastructures (railways, main and secondary roads, etc.) and the public and private buildings. The geocoded viaducts being examined (Madonna del Monte, Olivieri, Caiafa and Madonna degli Angeli) were extruded from the regional Topographic Data Base (TDB) published in 2011, at scale 1:5000.
- A digital terrain model (DTM), at 1 m spatial resolution, derived from the 2011 LiDAR data provided by the Ministry of Environment, Land and Sea. The LiDAR data belong to the database of the Italian National Geoportal, produced within the framework of the Not-Ordinary Plan of Remote Sensing. The characteristics of the LiDAR data, as stated by the authority responsible for their distribution, are as follows: point density greater than 1.5 points per square meter, planimetric accuracy (2σ) of 30 cm and altimetric accuracy (1σ) of 15 cm. The LiDAR data (point cloud) processing has been based on: (i) spatial referencing of all source data in a given map coordinate systems, UTM/ETRF00, with orthometric heights; (ii) DTM interpolation of the point cloud based on a TIN (triangulated irregular network) according to the Delaunay triangulation method; (iii) improvement of the TIN by adding breaklines extracted from the TDB and transformation in a raster with a spatial resolution of 1 m and (iv) DTM filtering and generation of contour lines. The whole process was developed in Python using the ArcGIS library (ArcPy).
- The lithological, geostructural and landslide hazard and risk maps provided in digital format (shapefile) by the Southern Apennines River Basin District Authority.
- SAR images: The list of the images is shown in Table 1, with the main technical characteristics. The interferometric data have been obtained on the basis of SAR images of the ERS1, ERS2 and ENVISAT missions from the ESA archives, both in ascending and descending orbit; in particular, the areas of interest are covered by data from the period 1993–2000 (ERS 1/2) and 2002–2008 (ENVISAT). COSMO-SkyMed images have also been processed to cover the time interval from 2013 to the end of February 2020. In our analysis only the ascending orbits have been analyzed, since the descending ones were affected by the shadowing effect due to the slope orientation.
 Table 1. Main characteristics of used synthetic aperture radar (SAR) images.
3.1. PSI Data Analysis
Interferometric SAR data series were analyzed using the SARscape ver. 5.2 software package (http://www.sarmap.ch/wp/index.php/software/sarscape/, accessed on 1 March 2020), an ENVI plug-in written in C++, by using the interferometric stacking module for the generation of displacement maps and digital elevation models (DEMs).
The PS technique allows natural (such as exposed rocks) or artificial (such as buildings and metal structures) targets to be identified on the ground, by using multitemporal satellite radar observations and their displacement over time along the line of sight (LOS) with respect to a “reference point” considered stable within the “frame”, corresponding to the satellite observation range. The PS approach should only be used in urban areas or at least where the scatterers remain stable in terms of the radiometric and interferometric phase.
Displacements are measured only in the direction of the axis connecting the target with the sensor (LOS); this axis has a different orientation in space for ascending and descending orbits. In our analysis only the ascending orbits were analyzed, since the descending ones were affected by the shadowing effect due to the slope orientation. It should be noted that according to the geometry of the orbiting satellites, only deformations along the LOS direction (E–W and vertical components) could be estimated, so there will be a lack of information about the displacement in the N–S direction. Due to the satellite elevation value and the angle of view, PS measurements mainly consider the vertical component of the displacements and their variation rate.
The displacement accuracy rate may be up to few mm/year while the maximum detectable value is dependent on the wavelength value. The application of the technique can be considered reliable when at least twenty evenly spaced time series are available.
Before starting the images processing, software self-selected a suited reference image called “master” (for the test presented in this paper the master image is the one dated 24 February 2020), all the other images are called “slaves”. Following, a time–baseline plot was extracted (Figure 5) where all connection between master and slaves are represented. All the slaves below a baseline threshold were discarded (by default, the spatial baseline was set to 500% of critical baseline). The COSMO-SkyMed analyzed images cover a time interval ranging from 4 February 2013 and 24 February 2020.

Figure 5.
COSMO-SkyMed images. Time–baseline plot, which provides the normal baseline (y axis) and the input acquisition dates (x axis). Each acquisition is represented by a diamond associated to an ID number. Valid acquisitions are shown in green color and Master acquisition in yellow color.
The image processing phases, which precede their analysis, start with the image coregistration, a phase in which all the images are coregistered onto a single image chosen as a reference (master image). This phase is followed by the generation of a series of multiple interferograms flattened using a given DEM. A limited number of coherent pixels are automatically identified and selected to serve as a reference for the unwrapping phase. If the area is larger than a given surface threshold, the whole image will be divided in different subareas (considering an overlap of 30%) and each one will be processed separately with an own reference point (for this study, each subarea was set to 25 km2). At this stage all displacement measurements for each extracted PS were spatially referred. All candidates for “Radar Signal Reflectors” (persistent scatterers candidates) that fall be-low a selected coherence threshold (i.e., the stability over time of the backscatter electromagnetic signal) are then selected (for this study, coherence threshold was set to 0.5). An inversion step was used to extract the residual height and displacement velocity (referred to the reference point) for each selected PS. Usually the velocity was derived assuming a linear trend model and after removing the atmospheric phase components. For this study, only PSs candidates with displacement velocity range between ±25 mm/year were considered. Finally, the PS products were geocoded using the input DEM and the results were provided as a shapefile.
3.2. GIS Analysis
After the processing is complete, all information associated with each PS is viewable into a GIS environment, as a shape and/or as a raster, depending on the flag selected in the parameter setting in SARscape software.
To obtain an assessment of the spatial variability of the displacement and to obtain a more reliable estimate of the extent of settlements based on the interpolated data, a geostatistical analysis was performed. This provides continuous information that allows, through a chromatic scale, to show the overall trend in a certain area. By interpolating the cumulative displacements from the PS data, it is possible to determine cumulative displacements along sections to show settlements or irregular shapes.
The displacement velocity of each analyzed structural part has been computed using a semiautomatic software developed within the IMODI project (Proposal N. 720,121—EU-H2020-SME Instrument). The software uses the shape files of the viaduct polygons extracted from the topographic data base (TDB), divided into the main structural parts (center span and approach spans), to make an automated filtering of the PS contained within each polygon; the filtering is based on PS density and variance of the average velocity.
The PSI technique provides spatially scattered measurements of small displacements with a spatial density that depends on the resolution of each sensor being considered. However, to evaluate the relationship between displacements affecting different structures and the deformation due to geologic setting, it is advisable to extend the analysis outward the infrastructures so that the PSI results can be visually and statistically compared with ground features.
To perform the spatial analysis based on the PSI measurements, two procedures were run in our work:
- First, the PSI measurements were interpolated using the algorithm ordinary Kriging (OK) [56]. OK estimates the value to be assigned to a point of a region for which a variogram is known, using data in the neighborhood of the estimation location. This interpolation method differs from other deterministic methods as it computes the weights applied to each value in the neighborhood based on the correlation or not-correlation between them, which is expressed by the variogram function. This type of interpolation has been applied to all of the ERS, ENVISAT and COSMO-SkyMed constellation PSI results.
- Second, a spatial cluster analysis has been applied to the highest resolution results obtained from the processing of the COSMO-SkyMed data. This is performed through the application of the cluster and outlier analysis (Anselin Local Moran’s I) method [57,58], used to detect spatial clusters of points with high or low values and spatial outliers within these clusters (Figure 6). This method uses Moran’s I statistic of spatial association (Equation (1)), a z-score, and a p-value to encode each feature in the dataset. When a feature has neighboring features with similar high or low attribute values, positive values are assigned. Conversely, negative values indicate dissimilar surrounding values around an outlier.
 Figure 6. Cluster classification scheme.
The computed p-value for the z-score (Equation (2)) must be small (less than 0.05) so as to be statistically significant and allow a point to be assigned to a cluster (positive I) or conversely classified as an outlier (negative I). The value of is computed for each point as:
where:
4. Results
4.1. Classifications and Trends of The PSI Measurements
Once the image datasets have been processed, three vector-format files (shapefiles), containing the geographic locations of the points corresponding to the PSs, are generated in output. For each point, the monthly measurements, the mean and deviation for the yearly velocities are recorded in a database.
As can be seen in Figure 7, where the position of the PSs is shown on an excerpt of map, the point density varied significantly for the different constellations used. The average density, over the test area, of the three analyzed datasets was 88 Points/Km2 for ERS, 139 Points/Km2 for Envisat and 2700 Points/Km2 for COSMO-SkyMed.

Figure 7.
Classified velocity for the displacements from the persistent scatterer interferometry (PSI) analyses computed using the three SAR datasets: (a) ERS; (b) ENVISAT and (c) COSMO-SkyMed. White class represents stable areas.
The average spacing was 29.5 m, 18 m and 2.5 m for the ERS, ENVISAT and COSMO-SkyMed constellations, respectively. Similarly, the quality of the processed datasets and thus their reliability in determining stable areas increased from ERS to COSMO-SkyMed, as the standard deviations associated with the different datasets show: 1.9 mm/y for ERS, 1.54 mm/y for ENVISAT and 1.3 mm/y for COSMO-SkyMed.
In Figure 7, the white dots symbolize the class that corresponds to stable areas. PSs are more dense over the main transport infrastructures as in the harbor dock and breakwater and their distribution corresponds to the main orientation of the urbanized area, in a SW to NE direction. In accordance with the classification of PS velocities, it is evident that the highest velocity values are found on the dock and breakwater both ERS and ENVISAT. These areas appeared more stable in the last period covered by the COSMO-SkyMed data.
Additionally, note that in the DSGSD area there are a few scattered points characterized by greater displacements, corresponding to high negative values, both in the area north and southwest of the Olivieri viaduct, with velocities ranging from about −5 to −2 mm/year. This is most evident in the ENVISAT and COSMO-SkyMed datasets.
Due to the higher density of PSs on the infrastructures and therefore the higher reliability of the PSI measurements with respect to them, a more detailed analysis was carried out on the structural components (approach spans and center span) of the four viaducts of the A3 highway: Madonna del Monte, Olivieri, Caiafa and Madonna degli Angeli (Figure 8a).

Figure 8.
(a) Location of the analyzed viaducts and their man structural parts and (b) classification of the viaduct structural parts according to the velocities for the three SAR datasets.
For each polygon analyzed, which identifies the structural parts of the viaduct, a minimum of 3 points were considered for the ERS and Envisat data and a number between 15 and 40 for COSMO-SkyMed; the coherence of the variance values of the average velocity of each single point was also considered.
The average velocity for each structural component has been computed (Figure 8b). Due to the lower density of the ERS and ENVISAT datasets, it was not always possible to classify some parts (classified as “No_DATA” in the color scale), whereas the higher PS density of the COSMO-SkyMed dataset allowed the classification of all structural parts.
As shown in Figure 8b, as for the Madonna degli Angeli viaduct the velocity values are very low, mostly below the accuracy. Additionally, the Caiafa viaduct results stable over time.
The Olivieri viaduct shows a significant acceleration in the last period, reaching deformation rates up to −3.7 mm/year. As for the Madonna del Monte viaduct, moderate velocities (less than −1.5 mm/yr) were observed, decreasing in the last period. This deceleration is small in the approach spans while the central spans reach a steady state with an average velocity of 0 mm/year.
Functional to the analysis of the displacement trends, the processing output for each constellation also consist of the historical series for the PS points that fall on the spans of the viaducts (Figure 9). Linear trends for all observation intervals of the series being analyzed were computed by using a first degree polynomial function of the temporal variable “yr” as the interpolation model. The least squares method was used to estimate the coefficients. Figure 9 also reports the “rate” value that is the estimated slope coefficient of the equation. A polynomial model with constant coefficients well represents the global trend of the historical series referred to the whole temporal interval of observation. The sample mean of the displacements in the observation interval is almost zero, which means that the cyclical component has a zero mean value in the whole observation interval.
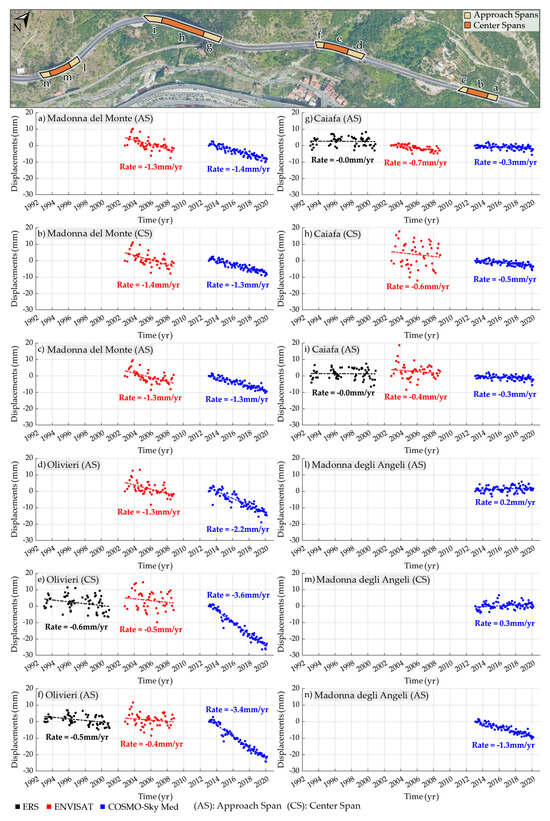
Figure 9.
Time series. The time series (a–n) follow the travel direction along the north carriageway of the analyzed section of road.
The graphs show that the Madonna del Monte viaduct (Figure 9a–c), characterized by a non-symmetric arch structure, presents a uniform deformation along all its spans with a constant velocity of −1.3 mm/year. As regards the Olivieri viaduct (Figure 9d–f), a significant acceleration is observed based on the analysis of the last dataset (2013–2020), increasing velocities from values of −1.3 to −2.2 mm/yr for the approach span that lies on the DSGSD (Figure 9d) and from almost −0.4 to about −3.5 mm/yr for the other approach span and the central one (Figure 9e,f). For the Caiafa viaduct (Figure 9g–i), the trends are also spatially uniform, though they show an increase in the second temporal period (ENVISAT 2003–2008) and a deceleration in the last period. Finally, with regard to the Madonna degli Angeli viaduct (Figure 9l–n), it may be stated that this structure was quite stable, although a small deformation with a rate of −1.3 mm/year was associated with the last approach span (Figure 9n).
4.2. PSI Spatial Analysis
The timeline of the analyzed SAR images is discontinuous, leaving gaps of several years between data from one constellation and the other (2 and 5 years). As a result of the PSI analysis, interpolated maps are also generated for each constellation, classified with a relative magnitude scale, thus allowing the spatial analysis of the measured displacements trend. In general, although with different magnitudes, the subsidence areas are located on the western harbor dock and on the breakwaters, but also in the area that coincides with the main body of the DSGSD in the northern part of the study area (Figure 10). This area includes the Madonna del Monte and Olivieri viaducts. The southwest area, where the Caiafa and Madonna degli Angeli viaducts are located, presents values closer to those corresponding to the stability class. This was not so evident in the first dataset (1993–2000) of the ERS constellation (Figure 10a), where the DSGSD mass body shows similar velocities to those of its SW part. Negative displacements of the DSGSD area were not been observed in the area just to the NE. During the period 2002–2008, for the processed images of the ENVISAT constellation (Figure 10b), the negative displacements of the northern zone were concentrated in the area of the DSGSD mass body. This area extended further to the SW during the third analyzed period 2013–2020 from the COSMO-SkyMed dataset (Figure 10c).
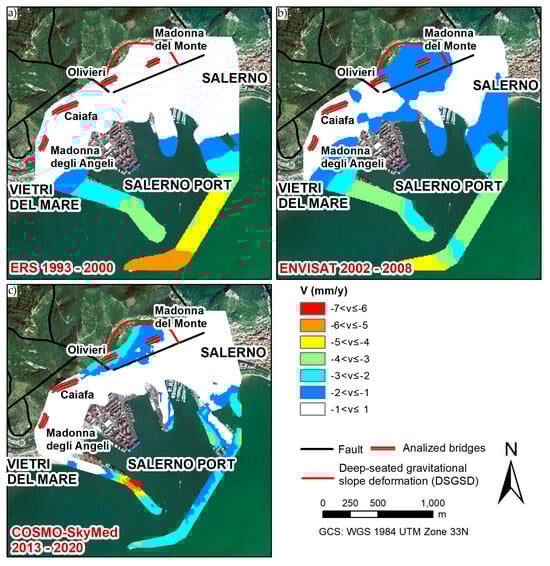
Figure 10.
Interpolation of velocities corresponding to the ground displacements obtained from ascending orbit data of (a) ERS, (b) ENVISAT and (c) COSMO-SkyMed.
The lowering observed along all the time periods analyzed (Figure 10) in correspondence of the port and the docks were probably due to consolidation processes still in progress but in phase of exhaustion (velocities decrease) or probably also correlated to the extension to the sea of the DSGSD phenomenon. All this needs further investigation.
The second phase of the spatial analysis consists of spatial clustering of the measurements using the Anselin Local Moran’s I method. The method has been applied to the most recent, high-resolution dataset from the Cosmo-SkyMed constellation.
Figure 11 shows the spatial clustering results overlayed on the velocity interpolation map. Clusters along the port breakwaters and all port docks are characterized by low value, meaning they are not very reliable. Consequently, the velocity values observed could be indicative of a localized phenomenon, which should be investigated, but are probably not indicative of the overall behavior of the structure.
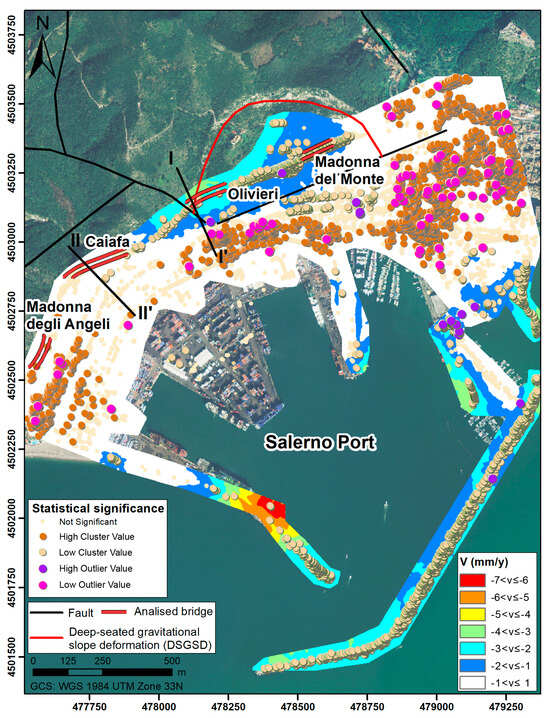
Figure 11.
Interpolation of the velocities corresponding to the ground displacements obtained from the high-resolution sensor of the COSMO-SkyMed constellation.
In addition, a low cluster appears to coincide with the DSGSD mass body, which extends to the southwest. This cluster of points, characterized by high values of negative sign velocities, involves the Olivieri viaduct and, with lower velocity values, the Madonna del Monte viaduct. In contrast, the Caiafa and Madonna degli Angeli viaducts are located in the more stable area to the north of the area of interest.
5. Discussion
In this work, the application of the PSI technique to the analysis of satellite datasets enabled the evaluation of the spatiotemporal distribution of displacements in a complex urban area, as it was to be expected given its well proven potential for monitoring terrain and complex infrastructure [26,43,59,60]. Regarding the test area, previous work has focused on regional-scale deformation to assess instability processes [61] or on the analysis of negative displacements concerning the coastal plain [62], and large-scale pattern deformation in relation to tectonic, volcanic, geomorphological and anthropogenic induced processes [50,63].
Our work is aimed to give a contribution with new input of information at local and site-specific scale, with the specific goal of deriving the spatiotemporal patterns of a complex infrastructure involving four viaducts in an area where a high level of risk is assumed in case of deformations exceeding threshold values. The results of the PSI analysis show spatiotemporal consistency in the different datasets used in this research. This is clearly observed in the negative displacements observed in the breakwaters and the western dock of the port during the whole monitoring period and in the negative displacements of the DSGSD area during the last observation periods corresponding to the ENVISAT (2002–2008) and the COSMO-SkyMed images (2013–2020). In the latter case, the distribution of the areas with higher velocity values, as computed by using the PSI method, coincides with the stratigraphic unit featuring high deformation of layered limestone–marl–mudstone within a dolomitic sequence.
Furthermore, in light of the results corresponding to the PSI analyses of the COSMO-SkyMed dataset, an expansion of negative displacements was detected in an area more intensely affected by several discontinuities. This area is traversed by the SW flank of the DSGSD, major faults of the Apennine and Antiapennine systems and a deep valley of the hydrologic network that runs beneath the Olivieri viaduct. If only a limited constellation or a subarea had been analyzed, it could be deduced that the highest negative values of displacements occurred only in the area pertaining to the Madonna del Monte viaduct in the period 2002–2008 or to the Olivieri viaduct in the period 2013 –2020.
However, evaluation of the various datasets shows how the deformation propagates and changes its acceleration from one part to another (e.g., from the NE to the SW part of the DSGSD). Similarly, the extension of the deformation beyond the ends of the Olivieri viaduct, which results from the COSMO-SkyMed constellation analysis, points to a negative displacement of the underlying soil rather than local displacements of the bridge structure.
These results highlight the importance of applying the PSI technique to both older (ERS and ENVISAT) and more recent images (COSMO-SkyMed) to assess the temporal evolution of infrastructure deformations. On one hand, the longer time window observed and the ability to remotely determine (millimeter displacements) compared to other monitoring techniques such as LiDAR, allows the analysis of earlier deformations. On the other hand, the use of multiple constellations that validate the spatiotemporal trends of the displacements, albeit with localized accelerations or decelerations that are expected from real phenomena, adds to this technique the control of congruence and reliability.
Our research confirms the robustness of the PSI technique in the field of ground and infrastructure deformation. However, limitations are still evident. The main and common constraint found in this research lies on the low density of the measurements, not only due to the low resolution of the heritage datasets, but also due to the attenuation that prevents the radar signal from reaching some areas to be examined.
In addition, temporal decorrelation and low coherence result in many measurements using the PSI technique being disregarded because they are lacking in quality. This effect is less intense in infrastructures that maintain a high consistency of signal parameters during the monitored time-window. To estimate displacement values where the PSI dataset has a low density of measurements, this is partially addressed by the interpolation process.
However, and keeping in mind the importance of studying the behavior of displacements also in the environment surrounding artificial objects, it is advisable to extrapolate or fill these gaps characterized by low coherence derived from the results of the method used.
The methods that could be applied to the study area are the following: small baseline subset (SBAS) [34], SqueeSAR [19] or Quas-PS (QPS) [64], which can improve the spatial correlation of the processed interferograms. Furthermore, once again underlining the relevance of this complex infrastructure, ground-based monitoring activities are encouraged to assess structural deformation trends and, even more, to mitigate and prevent any human or material damage.
6. Conclusions
PSI using both historical and recent satellite data is very valuable for analyzing displacement patterns at local scales and for specific infrastructure components, such as a bridge structure. The most recent high-resolution satellite data such as SAR imagery from COSMO-SkyMed are of great relevance for determining linear or nonlinear (time-varying) deformations with highest detail. Heritage data, available since 1992, are highly relevant for studying historical deformation.
Although man-made objects such as the analyzed infrastructure network provides the most appropriate conditions for improving the quality of PSI results, displacements below or above the threshold can be disregard using this technique. Thus, where smaller (less than a millimeter) or higher (several centimeters) displacements are expected, other complementary techniques such as LiDAR or in situ monitoring should be used. These latter techniques are also convenient where occlusion due to the reliefs does not allow scanning of the area of interest.
The results of our analysis revealed the displacement patterns of different infrastructures in the study area. The highest downward displacement values were observed in the northern part where the Olivieri viaduct is located and, to a lesser extent, on the Madonna del Monte viaduct. These structures are located in an area characterized by high landslide hazard and risk level (P3-P4 and R3-R4, respectively), affected by geological discontinuities such as faults and a DSGSD. The highest displacements were also observed in the southern part on the port docks, and probably are due to the presence of the consolidation phenomena still in progress or to the foot of the DSGSD present below sea level, which affects part of the port. The analyses carried out do not replace the direct survey but allow one to build an overall scenario of the slope instability phenomena and could be used as a reference for safety programs aimed at mitigating the potential risk.
The remaining viaducts and the entry of the port do not show a deformation process that can be related to the DSGSD one, or prompting mass movement risk in these infrastructures.
The results also highlight the importance of applying the PSI technique to both older and newer images; the longer time window allows for more accurate analysis of slow evolutionary processes, and the use of multiple constellations allows for validation of spatiotemporal trends in displacements.
Despite its limitations, currently, PSI is a cost-effective method to obtain a dataset of displacement measurements without physical contact with the object, that is, by acquiring the input data remotely. This is highly relevant in the field of research on natural and anthropogenic hazards, but should also be an important source of data for professionals, both from public and private entities, working on infrastructure. In addition, the vector-format datasets should be considered as a main source of data to monitor and control the behavior of the entire construction leading to decisions on the application of in-situ techniques to be used afterwards and monitoring of useful parameters to better understand the cause of the deformation pattern (e.g., groundwater, sea-level, underground excavation volume, change in live charges and others).
Author Contributions
Methodology, P.J.V.D., A.D.B., M.F., M.M and J.A.P.B.; formal analysis, P.J.V.D., A.D.B. and J.A.P.B.; investigation, P.J.V.D., A.D.B., M.F., M.M and J.A.P.B.; data curation, A.D.B., I.M. and J.A.P.B.; writing—original draft preparation, A.D.B., M.F., M.M. and J.A.P.B.; project administration, M.F.; funding acquisition, M.F. All authors have read and agreed to the published version of the manuscript.
Funding
The research is supported by the Italian Ministry of Education, University and Research under the National Project “Extended resilience analysis of transport networks (EXTRA TN): Towards a simultaneously space, aerial and ground sensed infrastructure for risks prevention”, PRIN 2017, Prot. 20179BP4SM.
Institutional Review Board Statement
Not applicable.
Informed Consent Statement
Not applicable.
Data Availability Statement
ERS and ENVISAT time series can be requested to Ministero dell’Ambiente e della Tutela del Territorio e del Mare (MATTM) URL: “http://www.pcn.minambiente.it/mattm/” accessed on 27 January 2021. COSMO-SkyMed raw data can be requested to ASI signing a user licence. Other information can be requested contacting the authors.
Conflicts of Interest
The authors declare no conflict of interest.
References
- Bru, G.; González, P.J.; Mateos, R.M.; Roldán, F.J.; Herrera, G.; Béjar-Pizarro, M.; Fernández, J. A-dinsar monitoring of landslide and subsidence activity: A case of urban damage in Arcos de la Frontera, Spain. Remote Sens. 2017, 9, 787. [Google Scholar] [CrossRef]
- Gigli, G.; Fanti, R.; Canuti, P.; Casagli, N. Integration of advanced monitoring and numerical modeling techniques for the complete risk scenario analysis of rockslides: The case of Mt. Beni (Florence, Italy). Eng. Geol. 2011, 120, 48–59. [Google Scholar] [CrossRef]
- D’Amico, F.; Gagliardi, V.; Bianchini Ciampoli, L.; Tosti, F. Integration of InSAR and GPR techniques for monitoring transition areas in railway bridges. NDT E Int. 2020, 115, 102291. [Google Scholar] [CrossRef]
- Bianchini Ciampoli, L.; Gagliardi, V.; Ferrante, C.; Calvi, A.; D’Amico, F.; Tosti, F. Displacement monitoring in airport runways by persistent scatterers SAR interferometry. Remote Sens. 2020, 12, 3564. [Google Scholar] [CrossRef]
- Bianchini Ciampoli, L.; Gagliardi, V.; Clementini, C.; Latini, D.; Del Frate, F.; Benedetto, A. Transport infrastructure monitoring by InSAR and GPR data fusion. Surv. Geophys. 2020, 41, 371–394. [Google Scholar] [CrossRef]
- Arangio, S.; Calò, F.; Di Mauro, M.; Bonano, M.; Marsella, M.; Manunta, M. An application of the SBAS-DInSAR technique for the assessment of structural damage in the city of Rome. Struct. Infrastruct. Eng. 2014, 10, 1469–1483. [Google Scholar] [CrossRef]
- Lazecky, M.; Hlavacova, I.; Bakon, M.; Sousa, J.J.; Perissin, D.; Patricio, G. Bridge displacements monitoring using space-borne X-band SAR interferometry. IEEE J. Sel. Top. Appl. Earth Obs. Remote Sens. 2017, 10, 205–210. [Google Scholar] [CrossRef]
- Goel, K.; Gonzalez, F.R.; Adam, N.; Duro, J.; Gaset, M. Thermal dilation monitoring of complex urban infrastructure using high resolution SAR data. In Proceedings of the 2014 IEEE Geoscience and Remote Sensing Symposium, Quebec, QC, Canada, 13–18 July 2014; pp. 954–957. [Google Scholar]
- Raucoules, D.; Colesanti, C.; Carnec, C. Use of SAR interferometry for detecting and assessing ground subsidence. Comptes Rendus Geosci. 2007, 339, 289–302. [Google Scholar] [CrossRef]
- Ding, X.L.; Liu, G.X.; Li, Z.W.; Li, Z.L.; Chen, Y.Q. Ground subsidence monitoring in hong kong with satellite SAR interferometry. Photogramm. Eng. Remote Sens. 2004, 70, 1151–1156. [Google Scholar] [CrossRef]
- Valarezo, D.; Mendieta, G.; Quiñones, M.; Zarate, B.; Quiñonez, V.; Soto, J. Landslide monitoring system through wireless sensor network using RTK technique: Case of study basin of Loja City. In Conference on Information Technologies and Communication of Ecuador; Springer: Cham, Switzerland, 2020; pp. 257–269. [Google Scholar]
- Rau, J.; Jhan, J.-P.; Andaru, R. Landslide deformation monitoring by three-camera imaging system. Int. Arch. Photogramm. Remote Sens. Spat. Inf. Sci. 2019, XLII-2/W13, 559–565. [Google Scholar] [CrossRef]
- Zhao, C.; Lu, Z. Remote sensing of landslides—A review. Remote Sens. 2018, 10, 279. [Google Scholar] [CrossRef]
- Palenzuela, J.A.; Marsella, M.; Nardinocchi, C.; Pérez, J.L.; Fernández, T.; Chacón, J.; Irigaray, C. Landslide detection and inventory by integrating LiDAR data in a GIS environment. Landslides 2015, 12, 1035–1050. [Google Scholar] [CrossRef]
- Delacourt, C.; Allemand, P.; Berthier, E.; Raucoules, D.; Casson, B.; Grandjean, P.; Pambrun, C.; Varel, E. Remote-sensing techniques for analysing landslide kinematics: A review. Bull. Soc. Geol. Fr. 2007, 178, 89–100. [Google Scholar] [CrossRef]
- Barla, G.; Antolini, F.; Barla, M.; Mensi, E.; Piovano, G. Monitoring of the beauregard landslide (Aosta Valley, Italy) using advanced and conventional techniques. Eng. Geol. 2010, 116, 218–235. [Google Scholar] [CrossRef]
- Lienhart, W. Geotechnical monitoring using total stations and laser scanners: Critical aspects and solutions. J. Civ. Struct. Health Monit. 2017, 7, 315–324. [Google Scholar] [CrossRef]
- Beshr, A.A.; Abo Elnaga, I.M. Investigating the accuracy of digital levels and reflectorless total stations for purposes of geodetic engineering. Alex. Eng. J. 2011, 50, 399–405. [Google Scholar] [CrossRef]
- Ferretti, A.; Fumagalli, A.; Novali, F.; Prati, C.; Rocca, F.; Rucci, A. A new algorithm for processing interferometric data-stacks: SqueeSAR. IEEE Trans. Geosci. Remote Sens. 2011, 49, 3460–3470. [Google Scholar] [CrossRef]
- Barba, S.; di Filippo, A.; Limongiello, M.; Messina, B. Integration of active sensors for geometric analysis of the Chapel of the Holy Shroud. Int. Arch. Photogramm. Remote Sens. Spat. Inf. Sci. 2019, XLII-2/W15, 149–156. [Google Scholar] [CrossRef]
- Barbarella, M.; Di Benedetto, A.; Fiani, M.; Guida, D.; Lugli, A. Use of DEMs derived from TLS and HRSI data for landslide feature recognition. ISPRS Int. J. Geo Inf. 2018, 7, 160. [Google Scholar] [CrossRef]
- Barbarella, M.; D’Amico, F.; De Blasiis, M.R.; Di Benedetto, A.; Fiani, M. Use of terrestrial laser scanner for rigid airport pavement management. Sensors 2018, 18, 44. [Google Scholar] [CrossRef] [PubMed]
- Marsella, M.; Scaioni, M. Sensors for deformation monitoring of large civil infrastructures. Sensors 2018, 18, 3941. [Google Scholar] [CrossRef]
- Tapete, D.; Casagli, N.; Luzi, G.; Fanti, R.; Gigli, G.; Leva, D. Integrating radar and laser-based remote sensing techniques for monitoring structural deformation of archaeological monuments. J. Archaeol. Sci. 2013, 40, 176–189. [Google Scholar] [CrossRef]
- Milillo, P.; Giardina, G.; DeJong, M.J.; Perissin, D.; Milillo, G. Multi-temporal InSAR structural damage assessment: The London crossrail case study. Remote Sens. 2018, 10, 287. [Google Scholar] [CrossRef]
- Gernhardt, S.; Adam, N.; Eineder, M.; Bamler, R. Potential of very high resolution SAR for persistent scatterer interferometry in urban areas. Ann. Gis 2010, 16, 103–111. [Google Scholar] [CrossRef]
- Bürgmann, R.; Rosen, P.A.; Fielding, E.J. Synthetic aperture radar interferometry to measure earth’s surface topography and its deformation. Annu. Rev. Earth Planet. Sci. 2000, 28, 169–209. [Google Scholar] [CrossRef]
- Massonnet, D.; Feigl, K.L. Radar interferometry and its application to changes in the earth’s surface. Rev. Geophys. 1998, 36, 441–500. [Google Scholar] [CrossRef]
- Alpers, W.R.; Ross, D.B.; Rufenach, C.L. On the detectability of ocean surface waves by real and synthetic aperture radar. J. Geophys. Res. Ocean. 1981, 86, 6481–6498. [Google Scholar] [CrossRef]
- Paek, S.W.; Balasubramanian, S.; Kim, S.; de Weck, O. Small-satellite synthetic aperture radar for continuous global biospheric monitoring: A review. Remote Sens. 2020, 12, 2546. [Google Scholar] [CrossRef]
- Crosetto, M.; Monserrat, O.; Cuevas-González, M.; Devanthéry, N.; Crippa, B. Persistent scatterer interferometry: A review. ISPRS J. Photogramm. Remote Sens. 2016, 115, 78–89. [Google Scholar] [CrossRef]
- Crosetto, M.; Monserrat, O.; Cuevas, M.; Crippa, B. Spaceborne differential SAR interferometry: Data analysis tools for deformation measurement. Remote Sens. 2011, 3, 305–318. [Google Scholar] [CrossRef]
- Prati, C.; Ferretti, A.; Perissin, D. Recent advances on surface ground deformation measurement by means of repeated space-borne sar observations. J. Geodyn. 2010, 49, 161–170. [Google Scholar] [CrossRef]
- Casu, F.; Manzo, M.; Lanari, R. A quantitative assessment of the SBAS algorithm performance for surface deformation retrieval from DInSAR data. Remote Sens. Environ. 2006, 102, 195–210. [Google Scholar] [CrossRef]
- Luo, S.; Fu, L.; Zhu, S.; He, Q.; Wan, W.; Yang, B. Processes of the displacement field change of the 2009 April 6 MW 6.3 L’Aquila earthquake using persistent scatterer and small baseline methods. Earthq. Sci. 2013, 26, 293–299. [Google Scholar] [CrossRef]
- Bovenga, F.; Nitti, D.O.; Fornaro, G.; Radicioni, F.; Stoppini, A.; Brigante, R. Using C/X-band SAR interferometry and GNSS measurements for the Assisi landslide analysis. Int. J. Remote Sens. 2013, 34, 4083–4104. [Google Scholar] [CrossRef]
- Sansosti, E.; Casu, F.; Manzo, M.; Lanari, R. Space-borne radar interferometry techniques for the generation of deformation time series: An advanced tool for earth’s surface displacement analysis. Geophys. Res. Lett. 2010, 37. [Google Scholar] [CrossRef]
- Tizzani, P.; Battaglia, M.; Zeni, G.; Atzori, S.; Berardino, P.; Lanari, R. Uplift and magma intrusion at Long Valley caldera from InSAR and gravity measurements. Geology 2009, 37, 63–66. [Google Scholar] [CrossRef]
- Trasatti, E.; Casu, F.; Giunchi, C.; Pepe, S.; Solaro, G.; Tagliaventi, S.; Berardino, P.; Manzo, M.; Pepe, A.; Ricciardi, G.P.; et al. The 2004–2006 uplift episode at Campi Flegrei Caldera (Italy): Constraints from SBAS-DInSAR ENVISAT data and Bayesian source inference. Geophys. Res. Lett. 2008, 35. [Google Scholar] [CrossRef]
- Hilley, G.E.; Bürgmann, R.; Ferretti, A.; Novali, F.; Rocca, F. Dynamics of slow-moving landslides from permanent scatterer analysis. Science 2004, 304, 1952–1955. [Google Scholar] [CrossRef]
- D’Aranno, P.; Di Benedetto, A.; Fiani, M.; Marsella, M. Remote sensing technologies for linear infrastructure monitoring. Int. Arch. Photogramm. Remote Sens. Spat. Inf. Sci. 2019, XLII-2/W11, 461–468. [Google Scholar]
- Głąbicki, D. Ground surface deformation monitoring of an active volcano using the DInSAR technique in comparison with GPS data: Case study of Okmok Volcano, Alaska. AIP Conf. Proc. 2020, 2209, 040004. [Google Scholar]
- Bakon, M.; Perissin, D.; Lazecky, M.; Papco, J. Infrastructure non-linear deformation monitoring via satellite radar interferometry. Procedia Technol. 2014, 16, 294–300. [Google Scholar] [CrossRef]
- Schmitt, M.; Shahzad, M.; Zhu, X.X. Reconstruction of individual trees from multi-aspect TomoSAR data. Remote Sens. Environ. 2015, 165, 175–185. [Google Scholar] [CrossRef]
- Fornaro, G.; Lombardini, F.; Serafino, F. Three-dimensional multipass SAR focusing: Experiments with long-term spaceborne data. IEEE Trans. Geosci. Remote Sens. 2005, 43, 702–714. [Google Scholar] [CrossRef]
- Chen, F.; Wu, Y.; Zhang, Y.; Parcharidis, I.; Ma, P.; Xiao, R.; Xu, J.; Zhou, W.; Tang, P.; Foumelis, M. Surface motion and structural instability monitoring of Ming Dynasty City Walls by two-step Tomo-PSInSAR approach in Nanjing City, China. Remote Sens. 2017, 9, 371. [Google Scholar] [CrossRef]
- Ma, P.; Lin, H. Robust detection of single and double persistent scatterers in urban built environments. IEEE Trans. Geosci. Remote Sens. 2016, 54, 2124–2139. [Google Scholar] [CrossRef]
- Ying, W.; Qinfen, Z. Recognition of roads and bridges in SAR images. In Proceedings of the International Radar Conference, Alexandria, VA, USA, 8–11 May 1995; pp. 399–404. [Google Scholar]
- Terranova, C.; Ventura, G.; Vilardo, G. Multiple causes of ground deformation in the Napoli Metropolitan area (Italy) from integrated persistent scatterers DInSAR, geological, hydrological, and urban infrastructure data. Earth Sci. Rev. 2015, 146, 105–119. [Google Scholar] [CrossRef]
- Vilardo, G.; Ventura, G.; Terranova, C.; Matano, F.; Nardò, S. Ground deformation due to tectonic, hydrothermal, gravity, hydrogeological, and anthropic processes in the Campania Region (Southern Italy) from permanent scatterers synthetic aperture radar interferometry. Remote Sens. Environ. 2009, 113, 197–212. [Google Scholar] [CrossRef]
- Budetta, P.; Nappi, M.; Santoro, S.; Scalese, G. Dinsar monitoring of the landslide activity affecting a stretch of motorway in the Campania Region of Southern Italy. Transp. Res. Procedia 2020, 45, 285–292. [Google Scholar] [CrossRef]
- Qin, X.; Zhang, L.; Ding, X.; Liao, M.; Yang, M. Mapping and characterizing thermal dilation of civil infrastructures with multi-temporal X-band synthetic aperture radar interferometry. Remote Sens. 2018, 10, 941. [Google Scholar] [CrossRef]
- Budetta, P.; de Riso, R. Studio delle condizioni di stabilità di alcuni versanti in Roccia Nell’appennino Campano. Mem. Soc. Geol. It. 1988, 41, 917–927. [Google Scholar]
- ISPRA. IFFI—Inventario dei Fenomeni Franosi in Italia. Available online: https://www.progettoiffi.isprambiente.it/ (accessed on 22 July 2020).
- Regione Campania, Difesa del Suolo; Servizio di Consultazione dei Piani Stralcio per l’assetto Idrogeologico. Available online: http://www.difesa.suolo.regione.campania.it/component/option,com_pai/Itemid,70 (accessed on 6 January 2020).
- Wackernagel, H. Ordinary kriging. In Multivariate Geostatistics; Wackernagel, H., Ed.; Springer: Berlin/Heidelberg, Germany, 1995; pp. 74–81. [Google Scholar]
- Getis, A.; Ord, J.K. Local Spatial Statistics: An Overview; Longley, P., Batty, M., Eds.; GeoInformation International: Cambridge, UK, 1996; pp. 261–277. [Google Scholar]
- Anselin, L. Local indicators of spatial association—LISA. Geogr. Anal. 1995, 27, 93–115. [Google Scholar] [CrossRef]
- Wasowski, J.; Bovenga, F.; Refice, A.; Nitti, D.O.; Nutricato, R. High resolution PSI for mapping ground deformations and infrastructure instability. In Engineering Geology for Society and Territory; Springer: Cham, Switzerland, 2014. [Google Scholar]
- Lan, H.; Li, L.; Liu, H.; Yang, Z. Complex urban infrastructure deformation monitoring using high resolution PSI. IEEE J. Sel. Top. Appl. Earth Obs. Remote Sens. 2012, 5, 643–651. [Google Scholar] [CrossRef]
- Guerriero, L.; Confuorto, P.; Calcaterra, D.; Guadagno, F.M.; Revellino, P.; Di Martire, D. Ps-driven inventory of town-damaging landslides in the Benevento, Avellino and Salerno Provinces, Southern Italy. J. Maps 2019, 15, 619–625. [Google Scholar] [CrossRef]
- Amato, V.; Aucelli, P.P.C.; Corrado, G.; Di Paola, G.; Matano, F.; Pappone, G.; Schiattarella, M. Comparing geological and persistent scatterer interferometry data of the Sele river coastal plain, Southern Italy: Implications for recent subsidence trends. Geomorphology 2020, 351, 106953. [Google Scholar] [CrossRef]
- Matano, F. Analysis and classification of natural and human-induced ground deformations at Regional scale (Campania, Italy) detected by satellite synthetic-aperture radar interferometry archive datasets. Remote Sens. 2019, 11, 2822. [Google Scholar] [CrossRef]
- Perissin, D.; Wang, T. Repeat-pass SAR interferometry with partially coherent targets. IEEE Trans. Geosci. Remote Sens. 2012, 50, 271–280. [Google Scholar] [CrossRef]


Publisher’s Note: MDPI stays neutral with regard to jurisdictional claims in published maps and institutional affiliations. |
© 2021 by the authors. Licensee MDPI, Basel, Switzerland. This article is an open access article distributed under the terms and conditions of the Creative Commons Attribution (CC BY) license (http://creativecommons.org/licenses/by/4.0/).