Abstract
This study assessed the aerosol climatology over Iran, based on the monthly data of aerosol optical depth (AOD) derived from the reanalysis-based Modern Era Retrospective Analysis for Research and Applications (MERRA-2) and the satellite-based Moderate Resolution Imaging Spectroradiometer (MODIS). In addition, sea level pressure, wind speed, temperature, relative humidity, precipitation, and soil moisture from the ERA5 reanalysis dataset were applied to investigate the climate-related effects on temporal AOD changes. Our analysis identified positive and negative AOD trends during 2000–2010 and 2010–2018, respectively, which are likely linked to aeolian dust changes. The dust-driven AOD trends were supported by changes in the Ångström exponent (AE) and fine mode fraction (FMF) of aerosols over Iran. During the early period (2000–2010), results of AOD-meteorology correlation analyses suggest reduced soil moisture, leading to increased dust emissions, whereas our results suggest that during the later period (2010–2018) an increase of soil moisture led to decreased AOD levels. Soil moisture appears to be a key factor in dust mobilization in the region, notably in southwestern Iran, being influenced by adjacent mineral dust sources. These phenomena were affected by large-scale sea level pressure transformations and the associated meteorology in the preceding winter seasons. Using a multiple linear regression model, AOD variability was linked to various meteorological factors in different regions. Our results suggest that climatic variations strongly affect the dust cycle, with a strong dependence on wintertime conditions in the region.
1. Introduction
Atmospheric aerosols are an important component in the Earth system [1] and significantly influence global and regional climate change, clouds and precipitation, air quality, and public health [2,3,4,5]. One often studied atmospheric property that can be observed by remote sensing techniques is the aerosol optical depth (AOD), which represents the light extinction by particulates [6]. Recently, remote sensing data from ground-based and satellite-borne instruments, in combination with reanalysis datasets have become widely used to assess the spatial and temporal distribution of AOD from local to global scales [7,8]. For example, some satellite, ground-based and reanalysis AOD data, such as the Moderate Resolution Imaging Spectroradiometer (MODIS), the Aerosol Robotic Network (AERONET), and the Modern Era Retrospective Analysis for Research and Applications (MERRA-2) have been applied in many recent studies [9,10,11,12,13].
Dust is a predominant primary aerosol particle type directly injected into the atmosphere. Vast amounts of dust are mobilized in the desert regions of the globe by strong winds, especially in the Sahara, Gobi, and Australian deserts. The distribution patterns of atmospheric hazes from reanalysis and satellite data show that the dust originating from these deserts stands out on a global scale. Due to the relatively large size of the dust particles, many of them sediment from the atmosphere close to their sources, but substantial amounts are transported over large distances [14]. The Middle East is the second widest mineral dust source, contributing approximately 10% of global dust emissions [15,16]. Iran is part of this region, located in the subtropical high-pressure belt with a dry or semi-dry climate [17,18]. This country has experienced dust events, in part originating from adjacent deserts in Saudi Arabia, Syria, and Iraq countries. In particular, a high frequency of dust emissions has been observed in the western areas of Iran [17,19,20,21,22].
Changing mineral dust aerosol concentrations may be associated with climate change. The variability of meteorological factors plays a major role in determining AOD trends over dust-dominated regions such as the Sahara and Middle East deserts [23,24,25,26]. Conversely, due to the lack of human activities in desert regions [23] suggested that meteorological parameters control the AOD variations in different dust areas. Previous studies have investigated whether the variability of AOD trends can be attributed to meteorological factors by using multiple linear regression methods [23,24,27,28].
In our previous study [13] we demonstrated an obvious change in AOD trends over Iran during the last decade. Klingmüller [24] investigated the reason behind the AOD increased over the Middle East. For example, over small regions in Iraq, Saudi Arabia and Iran during the years 2000–2011. However deep knowledge about the main reasons behind the changes in AOD trends during the years 2000–2018 over Iran are not clear and need to be investigated. The present study explores whether meteorological parameters are responsible for the AOD variations, and identifies parameters that are major factors in the observed trends. In Section 3.1, the spatial distributions of the trends of MERRA-2 and MODIS AODs were calculated over Iran for two increasing (2000–2010) and decreasing (2010–2018) AOD periods. To evaluate the key role of dust on AOD in Iran, the distribution of MERRA-2 dust and AE trends are shown. For the trend assessment, monthly anomalies of AOD, fine mode fraction (FMF500), and Ångström exponent (AE440–870) were used. The influence of the main meteorological parameters from the ERA5 dataset, such as sea level pressure, soil moisture, and surface wind speed on AOD changes are investigated individually in Section 3.2. Trends of these variables and the role of the preceding winter meteorology (DJFM) on AOD during the dusty period (MJJA) are also analyzed. In Section 3.3, a multiple linear Regression (MLR), based on meteorological data, is presented to reproduce the MERRA-2 AOD in dusty season trends.
2. Data and Methodology
2.1. Study Area
Dust events are among the most important atmospheric phenomena in arid and semiarid regions and widely affect the environment and climate [29,30]. Iran is located in Southwest Asia in a zonal dust belt that is frequented by dust storms because of its proximity to major deserts. For this work, to comprehensively evaluate the influence of dust emissions and meteorological parameters on AOD variability, Iran was subdivided into three large regions, i.e., in the north, west, and center (Figure 1). To bring together the data of the diverse climate conditions in Iran, the synoptic meteorology for winter (DJFM) and dusty (MJJA) seasons was characterized using MERRA-2 during 1980–2018 (Figure 1a,b). The results showed that the north of Iran typically experiences relatively low temperatures, high relative humidity and precipitation because of its geographic location between the Alborz Mountains and the Caspian Sea. Relatively higher temperatures and lower humidity were observed in the southwest, south, and center of the country. The dusty season in particular is that with the highest wind speeds, which governs dust activity and the transport from adjacent dust sources.
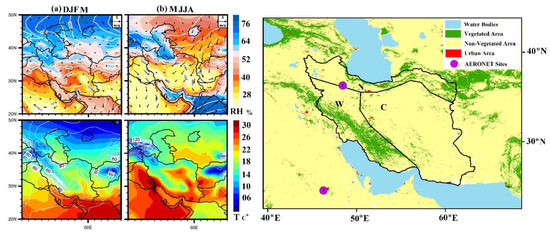
Figure 1.
The right diagram shows the three major regions: North (N), West (W) and Center (C), and two AERONET sites, IASBS (1) and Solar Village (2), in Iran and Saudi Arabia, respectively, used in this study. The left diagrams show the synoptic meteorological conditions from MERRA-2 (1980–2018) reanalysis data during (a) DJFM (winter) and (b) MJJA (dusty season). In the top panels wind arrows are shown, their length defining the wind speed (m∙s−1). The color contours indicate relative humidity (%) and the white lines the mean sea level pressure (Pa). In the bottom panels the color contours represent temperature (°C) and white lines the precipitation (mm∙month−1).
2.2. Aerosols Data
MERRA-2 is the updated reanalysis dataset provided by the Global Modeling and Assimilation Office (GMAO) of NASA, of which we used the latest atmospheric version [31] from the Goddard Earth Observing System (GEOS-5) [32,33]. The MERRA-2 assimilated AOD product allows the study of interactions with climate system, with data from the Advanced Very High Resolution Radiometer (AVHRR), MISR and MODIS satellite instruments, and also ground-based observations (AERONET) (https://disc.gsfc.nasa.gov (accessed on 8 March 2021)). In this study, the monthly AOD550, AE470-870 observation and Dust concentration from MERRA-2 were used for comprehensive evaluation of AOD variability over Iran. Global validation of MERRA-2 AOD against AERONET, noted a high agreement between MERRA-2 and AERONET over the Middle East where correlation coefficient (R) = 0.94 [23]. Our previous work [13] suggested that MODIS and MERRA-2 were in good agreement with AERONET AOD.
MODIS was launched on board the Terra (AM) and Aqua (PM) satellites from NASA’s Earth Observing System in 1999 and 2002, respectively that characterizes the spatial and temporal aerosol distributions. More information can be found in NASA reports (http://modis.gsfc.nasa.gov (accessed on 8 March 2021)). In this work, AOD product, combined Dark Target and Deep Blue retrievals, from monthly Terra/MOD-08 at 550 nm Collection 6.1 (https://modis-atmosphere.gsfc.nasa.gov/documentation/collection-61 (accessed on 8 March 2021)) Level 3, (1° × 1°) in spatial resolution during 2000–2018 were employed. The average root mean square error (RMSE) of MODIS AOD data has been estimated to be about 0.10 overland [2]. In addition, previous studies suggested a strong agreement between MODIS AOD and AERONET AOD [10,13].
The AERONET (Level 2.0 and Version 3.0) ground-based sites produce observations of aerosol microphysical and radiative attributes ([34]; https://aeronet.gsfc.nasa.gov (accessed on 8 March 2021)). In this work, the ground-based AOD550, AE 440–870, and FMF500 observations collected from Solar Village and IASBS AERONET were used to analyze the changing in AOD trends. The locations of AERONET networks are shown in Figure 1.
2.3. Meteorological Data
In the present study, the mean monthly meteorological factors from the ERA5 reanalysis dataset at 0.5 × 0.5 degree in spatial resolution were utilized, and included atmospheric sea level pressure (SLP), surface wind speed (WS), surface temperature (T2M), surface relative humidity (RH), total surface precipitation (TP), and soil moisture at the surface (SM). ERA5, the 5th generation reanalysis from the European Centre for Medium-Range Weather Forecasts (ECMWF) produce a large number of atmospheric, land, and oceanic climate hourly variables, with information regarding all variable uncertainties at reduced spatial and temporal resolutions. ERA5 data with a significantly higher resolution replaced ERA-Interim. This data has also been applied in recent research [35,36,37,38]. Morerever, recent studies have evaluated and cross-checked the meteorological parameters from ERA5 data using different observation data [38,39,40,41] and high agreement has been reported. Moreover, ERA5 data assimilated ground base data from the developed countries in the Middle East region (https://www.ecmwf.int/en/forecasts/datasets/reanalysis-datasets/era5 (accessed on 8 March 2021)).
2.4. Trend Analysis and MLR Model
To compare the results regarding AOD trends, the MERRA-2 and ERA5 data were linearly interpolated to the MODIS spatial resolution of (1° × 1°). Long-term AOD trend analysis from the monthly time series data of MERRA-2 and MODIS was performed. Firstly, the monthly AOD anomalies were calculated as the difference between the monthly mean AOD for each month and the long-term monthly AOD average to eliminate the large seasonal influence. Secondly, to derive the trends, the linear least-squares regression method was used [12,22,23,42,43] and a Student’s t-test was applied to evaluate the validity of the trend analysis at the 90% confidence level. To analyze the aerosol variations during the hot period of the year and its relationship with the meteorological parameters, two periods were chosen: (1) the dusty season (MJJA: May, June, July, and August) is the major time for dust transport from natural mineral dust sources because of strong atmospheric advection [13,19,23]; and (2) the winter season prior to the dusty period (DJFM: December, January, February, and March) was studied to evaluate the influence of winter climate on aerosols during the dusty season. Furthermore, the trend of meteorological parameters was calculated for these two periods using the same method as for the AOD trend to show the parameter variations during increasing and decreasing AOD periods.
Multiple linear regression (MLR) models of the mean MJJA MERRA-2 AOD were constructed for the three divided regions of Iran (north, west, and center (Figure 1)) using both MERRA-2 dust concentration (MJJA) and meteorological parameters (MJJA and DJFM) as predictors. To measure the correlation between aerosols and meteorological parameters, the Pearson’s R was computed. For each region, the MLR model takes the following equation:
In this study, y is the mean MJJA AOD, is the intercept values. (xi .. xi) is the total number of years during the calculation period (2000–2018, x = 19), is determined by the least-squares regression method and is known as the error term. To find the best model fit, the stepwise regression method was used with the 90% confidence level. This method has been widely used in previous studies [23,24,26,27,44].
3. Results and Discussion
3.1. Aerosol Trend Analysis
Figure 2 presents the spatial distribution of the linear trends of MERRA-2 and MODIS AODs over Iran that were calculated, including the 90% confidence level. Over the integral 19 years period between 2000 and 2018, no significant trend occurred over the country, with the exception of a small area over southwest Iran. However, significant opposite trends could be clearly detected in the early (2000–2010) and late (2010–2018) periods, respectively.
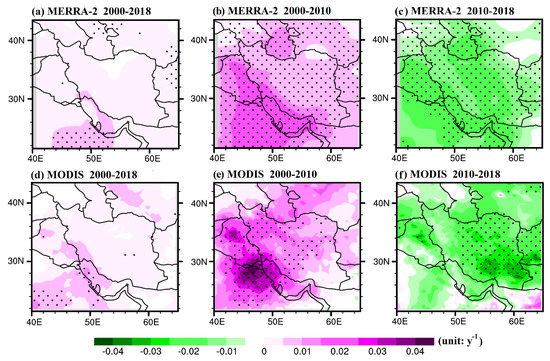
Figure 2.
Spatial distributions of the dusty season (MJJA) linear trends of MERRA-2 (a–c) and MODIS (d–f) AOD calculated from the anomalies during the periods 2000–2018, 2000–2010, and 2010–2018. Black dots show where the linear trend is significant at the 90% confidence level.
In the early period, significant positive trends were found in the MERRA-2 and MODIS AODs, with a small difference in small areas, mainly related to using different versions of AOD collections [10,13,23]. Strong positive trends were observed in the west and southwest of country, which is closely related to mineral dust sources from Arabian Peninsula deserts [45,46]. Furthermore, in early period, AOD trends derived by [24,25] confirmed the most significant and strong upward trends in the Middle East, particularly over the Arabian Peninsula, which are major source areas of natural mineral dust. In contrast, significant downward trends were detected in the later period by using both AOD datasets. This unexpected opposite trend [11,23] may be affected by the climatological parameters investigated in this study.
To evaluate the accuracy of the AOD results and the key role of dust, the distribution of MERRA-2 dust and AE trends are shown in Figure 3. The dust trend clearly corroborates its influence on AOD trends. During the early period, there was a significant positive dust trend in the southwest and west of the country. In contrast, the late period had a significant negative trend. The AE applies to the qualitative indication of aerosol size, with smaller aerosol particles for higher AE values, and vice versa [47,48]. The opposite trends compared with AOD trends (Figure 2) can be seen in the north and west of Iran in the early and late periods. A comprehensive explanation of AOD trends over Iran can be found in [13].
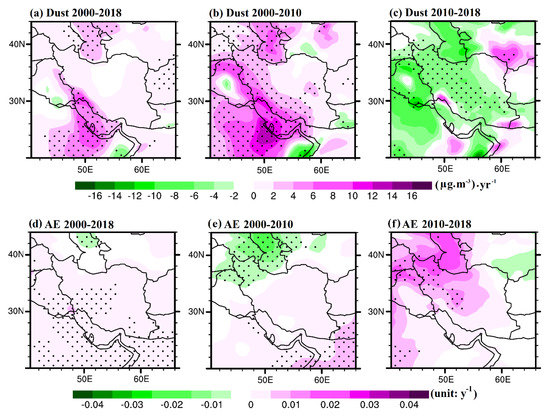
Figure 3.
As Figure 2 but for MERRA-2 dust (a–c) and AE (d–f).
To evaluate the time periods with increasing and decreasing AOD trends, the monthly anomalies of AOD, AE, and FMF from ground-based observation (AERONET) sites in the dusty season (May, June, July, and August) were calculated (Figure 4). The Solar Village data, with the longest record in the Middle East, exhibited a similar trend of AOD to the MERRA and MODIS AOD in the increasing and decreasing periods (Figure 2), confirming the downward trend that began in 2010. During the early period, the AE and FMF of the Solar Village station observed a decreased trend with rates of −0.007 and −0.004, respectively. In addition, significant negative AOD trend were obtained from the IABAS and Solar Village sites after 2010. The IABAS station showed also an increasing trends in AE with rates of 0.004. The increase in AOD is compatible with the decrease in AE and FMF, which is inversely linked to the size of the aerosols [24] reported the history of the AOD measured by the Solar Village station that showed significant positive AOD and negative AE and FMF trends during the years 2000–2011.
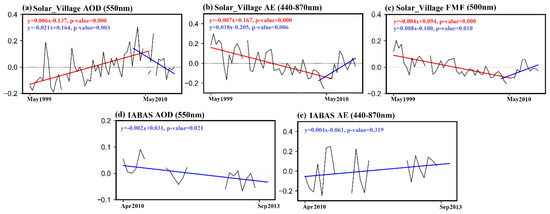
Figure 4.
Time series of AERONET AOD (a), AE (b), and FMF(c) at the station Solar Village. And AERONET AOD (d), AE (e) at the station IABAS, calculated for anomalies (MJJA).
The same results with AE are apparent from the trend in FMF from AERONET. Therefore, the upward trend of AOD corresponds to the downward trend of AE and FMF from 1999 to 2010 from the AERONET Solar Village site, and the reverse trends from 2010 to 2018 were observed in both the Solar Village and the IABAS stations. During the period 1999 to 2010 in the dusty season, the decreasing AE and FMF clearly show a trend towards relatively large aerosols that generally indicates the dominant role of dust in this period. Conversely, the increasing AE and FMF showed a trend from 2010 to 2018. The AE and FMF measurements clearly corroborate changes in aerosol abundance in the coarse size mode, which suggests that dust particles generally play a dominant role in the AOD variability. Significant spatial distributions of Pearson’s (R) between MERRA-2 AOD and MERRA-2 dust was detected over the region (Figure 5a). In addition, Pearson R between MODIS AOD and MERRA-2 dust was detected over the dusty areas in west of Iran (Figure 5b). The significant positive correlation of MERRA-2 AOD and MERRA-2 dust is consistent with the importance of dust on the AOD variability. To better understand the possible reasons for the alternating AOD increase and decrease during the dusty season, in the next section the major meteorological parameters sea level pressure (SLP), surface wind speed (WS), surface temperature (T2M), surface relative humidity (RH), total surface precipitation (TP), and soil moisture at the surface (SM) that control the dust cycle are investigated.
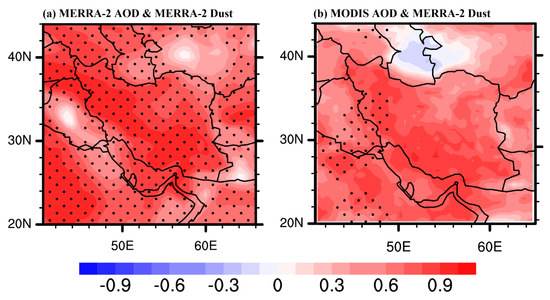
Figure 5.
Correlation of (a) MERRA-2 AOD and MERRA-2 dust and (b) MODIS AOD and MERRA-2 dust over Iran calculated from the anomalies (MJJA) during 2000–2018. Black dots show where the linear trend is significant at the 90% confidence level.
3.2. Correlation Analysis of Aerosols and Meteorological Data
To evaluate the role of meteorological conditions in the AOD changes, the linear trends of the six meteorological parameters (SLP, W, ST, TP, RH, and SM) from ERA5, (Figure 6, Figure 7 and Figure 8) and their correlations (Figure 9 and Figure 10) with MERRA-2 AOD during the dusty (MJJA) season were calculated for the winter (DJFM) and dusty (MJJA) seasons for the two increasing and decreasing AOD periods (2000–2010 and 2010–2018). Previous studies have suggested that the variations in AOD are mainly controlled by meteorological parameters and emission changes [23,24,49]. Due to the lack of a relationship between AOD and anthropogenic emissions in deserts, where human activities are limited, variations in AOD are expected to be controlled by meteorological parameters in these areas [23]. The main effective source of aerosols in this region is dust concentration, which has distinctly changed in the past decade (see Figure 3a).
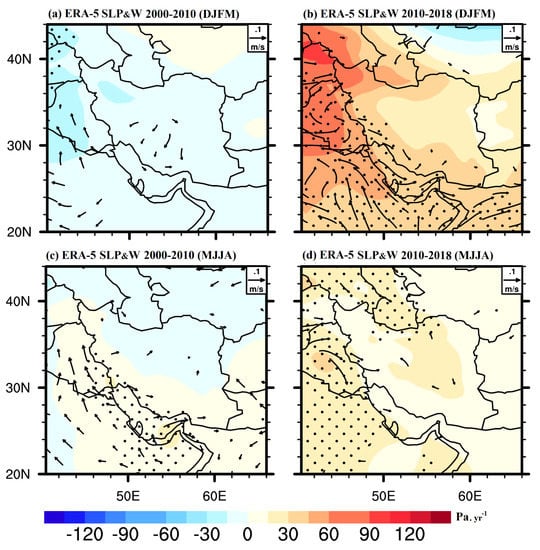
Figure 6.
Spatial distributions of the winter (DJFM: (a,b)) and dusty season (MJJA: (c,d)) linear trends of ERA5 sea level pressure and wind speed calculated from the monthly anomalies during 2000–2010, and 2010–2018 over Iran. Black dots show where the linear trend is significant at the 90% confidence level.
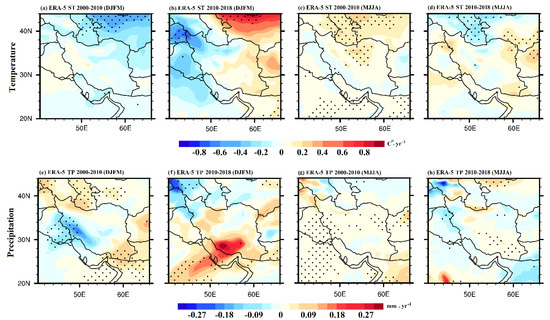
Figure 7.
Spatial distributions of the ERRA-5 ST (a–d) and TP (e–h) trends calculated from the monthly anomalies in the cold and hot periods (DJFM and MJJA) during 2000–2010 and 2010–2018. Black dots show where the linear trend is significant at the 90% confidence level.
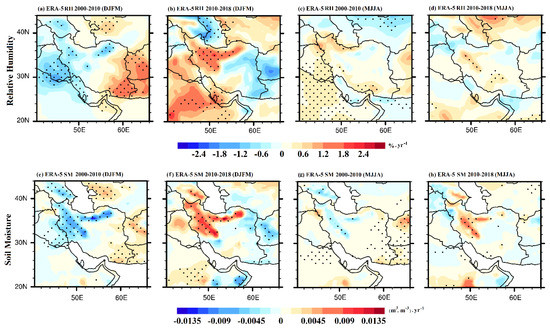
Figure 8.
Spatial distributions of the ERRA-5 RH (a–d) and SM (e–h) trends calculated from the monthly anomalies in the cold and hot periods (DJFM and MJJA) during 2000–2010 and 2010–2018. Black dots show where the linear trend is significant at the 90% confidence level.
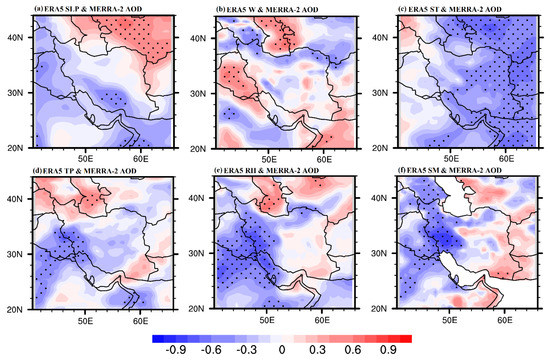
Figure 9.
Correlations of MERRA-2 AOD in the hot period (MJJA) and meteorological parameter: SLP (a), W (b), ST (c), TP (d), RH (e), and SM (f) from ERA5 in the cold period (DJFM) over Iran calculated from the monthly anomalies during 2000–2018. Black dots show where the linear trend is significant at the 90% confidence level.
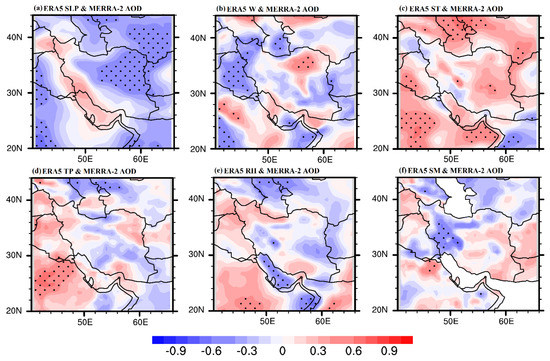
Figure 10.
Correlations of MERRA-2 AOD and meteorological parameter: SLP (a), W (b), ST (c), TP (d), RH (e), and SM (f) from ERRA-5 in the hot period (MJJA) over Iran calculated from the monthly anomalies during 2000–2018. Black dots show where the linear trend is significant at the 90% confidence level.
The most important parameter affecting the dust changes is soil moisture, in turn related to the atmospheric sea level pressure and other meteorological parameters. Furthermore, these meteorological parameters in the winter season co-control soil moisture during the dusty season. In terms of atmospheric circulations and meteorological phenomena, transitions from the cold season to the warm season are very prominent over the Middle East and the Persian Gulf region [50]. In both increasing and decreasing AOD time periods, significant anti-correlations of the AOD to the winter and dusty-time soil moisture were found in Western and Southwestern Iran, and the trend analysis of soil moisture showed significant negative trends in the same region and in the north of the country (Figure 8e–h, Figure 9f and Figure 10f). The AOD is negatively correlated with soil moisture, and therefore, this could translate into the observed upward AOD trend during 2000–2010 and negative AOD trend during 2010–2018. The same result obtained for soil moisture was also found for both the relative humidity and precipitation parameters (Figure 7e–h, Figure 8a–d and Figure 9d,e). Unlike the winter relative humidity and precipitation, the correlation of AOD with these two parameters in the dusty period is not significant (Figure 10d,e). This confirms the importance of winter meteorological parameters on the dusty season AOD by the co-control of soil moisture increase or decrease during the 2000–2010 and 2010–2018 periods, respectively. During the dust season, Figure 10c indicated a positive correlation of the AOD to the dusty season temperatures indicate an increase in evaporation, reducing soil moisture, and consequently, increasing dust emissions, and vice versa during the decreasing period. There are no significant trends in temperature. Over Iran, Iraq, and Saudi Arabia [24] concluded that surface wind speed, precipitation, and soil moisture are prime significant parameters for AOD level.
To better understand the underlying causes of the atmospheric dust changes, it is important to identify the associated circulation patterns. We performed an analysis of sea level pressure trends in a small and large domain (Figure 6 and Figure 11) during the early and late periods. During 2000–2010 (negative trend) and 2010–2018 (positive trend) years in winter and dusty seasons with the AOD trend (Figure 2) are basic to the negative correlation between them. However, regions with significant correlations are found in the south (DJFM) and some areas of the east and center (MJJA) of Iran, respectively (Figure 9a and Figure 10a). The changes in sea level pressure not only occurred over Iran, but also extend over the North Atlantic Ocean, North Africa, and West Europe (Figure 11). Several studies have demonstrated that the circulation patterns influence the variability of climate over Middle Eastern countries. One of the important patterns is the Azores High over the Atlantic Ocean, whereby variations can substantially influence meteorological conditions in the Middle East. Therefore, our results are consistent with [51,52], who suggested that strong pressure gradients between the subtropical and North Atlantic in winter, associated with the North Atlantic Oscillation (NAO), affect the dust transports from the Sahara and northwest China. A strong increase in the NAO index after 2010, with anomalously high SLP over the Mediterranean (Figure 11) coincided with the negative dust trend in this period.
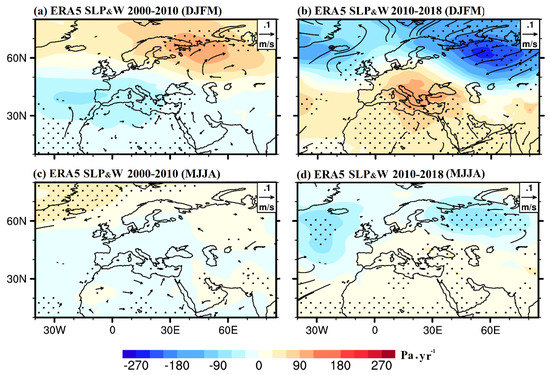
Figure 11.
Spatial distributions of the winter (DJFM: (a,b)) and dusty season (MJJA: (c,d)) linear trends of ERA5 sea level pressure and wind speed calculated from the monthly anomalies during 2000–2010, and 2010–2018 at an extended scale. Black dots show where the linear trend is significant at the 90% confidence level.
The resulting wind speed correlation maps are shown in Figure 9b and Figure 10b. The MJJA wind speed is significantly anticorrelated to the AOD over Iraq and the northern area of Iran (Figure 10b). On the other hand, the wind speed had a significant correlation over northeastern Iran. Therefore, we conclude that the wind speed does not notably contribute to increased or decreased dust activity in Iran. This is attributed to the fact that the effects of winds on the AOD change depend upon the direction of winds. The southerly and easterly winds generally collect the aerosols over the region, while the northerly wind is accompanied by a reduction of the dust aerosols. Klingmüller et al [24] obtained a similar result for the Middle East. Che et al [23] found a positive correlation between AOD and the wind speed in mineral dust sources. The results (Figure 6) showed a predominance of the surface wind at high speeds in these regions, but wind speed does not explain the variability in dust emissions. Therefore, the anomalies of wind direction were used, which appear to be more helpful in explaining dust transport, in particular between northerly and southerly winds. For example, the southwest of Iran experiences dust storms due to the transmission of mineral dust from sources to the west.
3.3. Multiple Linear Regression Analysis
In this section, we used the main meteorological factors in winter and MJJA seasons (atmospheric sea level pressure, surface wind speed, surface temperature, surface relative humidity, total surface precipitation, and soil moisture at the surface) that may control the dust cycle. The resulting mean MJJA AOD using dust and meteorology predictors with very acceptable agreement are shown in Figure 12a–c, with high R values (0.90, 0.92, and 0.89) and small errors (0.02, 0.02, and 0.03) for the north, west, and center of Iran, respectively. For the northern region, because of its geographic location between the Alborz Mountains and the Caspian Sea and with a wet climate [53], DJFM wind speed, relative humidity, soil moisture, MJJA sea level pressure, and soil moisture are dominant factors in predicting the MJJA AOD. In the winter season, high relative humidity is significantly related to the wind direction from the north and the Siberian high-pressure transporting Caspian Sea moisture, associated with elevated soil moisture [13]. In the dusty season, pressure patterns and soil moisture control the aerosol abundance. For the western region, being particularly dusty [13,19,21], the main predictors were temperature, precipitation, relative humidity, and soil moisture in the winter season, while in the hot season, wind speed and soil moisture were the dominant parameters that vary with AOD. Klingmüller et al [24] found that precipitation, as an important predictor of Iran’s AOD, indicates the main role of aerosol transport and precipitation scavenging. Furthermore, due to the proximity to the major source of natural mineral dust, the MJJA wind speed from these dry regions has a strong effect on AOD changes. Most humidity emanates from the west, and the northern and western regions of Iran are highly influenced by synoptic patterns, which lead to active changes in soil moisture [53]. The central region in Iran, unlike the other region where the two major mountain ranges (Alborz and Zagros) in North and Northwest Iran, prevent clouds and humidity from reaching the central region of Iran, which leads to less effect on soil moisture [53]. Therefore, only MJJA sea level pressure and temperature in both seasons are more relevant predictors than other factors in linear modeling for the center region. Previous study suggested that sea level pressure was the primary driving factor, accounting for 60.9% of the variation in AOD over the Middle East [23].
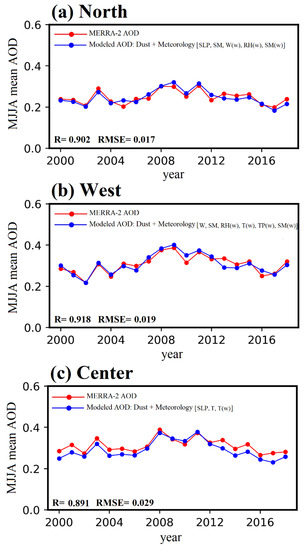
Figure 12.
Time series of mean MJJA MERRA-2 AOD (in red) and modeled mean MJJA AOD using MERRA-2 dust and ERA5 meteorological parameters (in blue) from 2000 to 2018 over the three divided regions of Iran (North: (a), West: (b), Center: (c)). The coefficient of determination (R) of the regression fit of the MLR model are given in the lower left of each panel.
4. Conclusions
This study is the first assessment of long-term AOD variability and the key role of dust emissions in Iran over two periods with opposite trends. We studied aerosol, dust, and meteorological parameters from MODIS, MERRA-2 AOD, and ERA5 meteorology datasets. The importance of dust on AOD changes has been determined by comparing trends. The observed AOD increased together with a decreasing AERONET fine mode fraction and Angstrom exponent, and vice versa; this result corroborated that the main contributors to the upward and downward AOD trends were related to aeolian dust. A generally consistent and significant upward trend was observed during 2000–2010, and then the trend turned from upward to significantly downward during 2010–2018. According to our findings, the amount of aerosol has decreased in the recent decade in response to significant anomalies in large-scale atmospheric pressure. The resulting correlation analysis of aerosols and meteorological parameters revealed that soil moisture was a likely determinant in the dust changes. It should be noted that the soil moisture in the dusty spring-summer season was also strongly related to the meteorology of the preceding winter season.
Overall, during the increasing AOD period, a decrease in sea level pressure was associated with southerly winds, reduced precipitation, and relatively high temperatures that enhance surface evaporation. When relative humidity was reduced dust was more easily mobilized. In contrast, during the period when the AOD was relatively low, anomalies in meteorological parameters that contribute to soil moisture decreased dust mobilization. The multivariable regression analysis revealed that AOD trends during the dusty period can be related to meteorological variations in both the winter and dusty seasons, probably influenced by the North Atlantic Oscillation. The AOD over the most important dusty region (Western Iran) appears to be relatively strongly affected by soil moisture, wind speed, and dust emissions in the spring-summer period, and temperature, relative humidity, precipitation, and soil moisture from the preceding winter season. We conclude that observed aerosol variability and trends are mainly related to meteorological conditions that shifted regime between the pre- and post-2010 period. Since the relevant parameters are sensitive to climate change, further studies are recommended on the variability dust in Iran in future.
Author Contributions
R.Y. performed the research work and wrote the manuscript with input from all the authors; F.W. designed the work and edited the manuscript text; Q.G. and J.L. participated in designing and data analyses; A.S. helped with data processing. All authors have read and agreed to the published version of the manuscript.
Funding
This study was supported by the National Key Research and Development Program of China (2019 YFC0507805, 2016YFA0602704), the Strategic Leading Science and Technology Program of the Chinese Academy of Sciences (XDA20020202), and the National Natural Science Foundation of China (41771050).
Data Availability Statement
MERRA-2 data were obtained from https://disc.gsfc.nasa.gov, MODIS from https://ladsweb.nascom.nasa.gov, AERONET data from https://aeronet.gsfc.nasa.gov and ERA5 data from https://ecmwf.int/.
Conflicts of Interest
The authors declare that they have no conflict of interest.
References
- Brock, C.A.; Cozic, J.; Bahreini, R.; Froyd, K.D.; Middlebrook, A.M.; McComiskey, A.; Brioude, J.; Cooper, O.R.; Stohl, A.; Aikin, K.C.; et al. Characteristics, sources, and transport of aerosols measured in spring 2008 during the aerosol, radiation, and cloud processes affecting Arctic Climate (ARCPAC) Project. Atmos. Chem. Phys. 2011, 11, 2423–2453. [Google Scholar] [CrossRef]
- Levy, H., II; Horowitz, L.W.; Schwarzkopf, M.D.; Ming, Y.; Golaz, J.C.; Naik, V.; Ramaswamy, V. The roles of aerosol direct and indirect effects in past and future climate change. J. Geophys. Res. Atmos. 2013, 118, 4521–4532. [Google Scholar] [CrossRef]
- Mukherjee, A.; Agrawal, M. World air particulate matter: Sources, distribution and health effects. Environ. Chem. Lett. 2017, 15, 283–309. [Google Scholar] [CrossRef]
- Shang, H.; Chen, L.; Tao, J.; Su, L.; Jia, S. Synergetic Use of MODIS Cloud Parameters for Distinguishing High Aerosol Loadings from clouds over the North China Plain. IEEE J. Sel. Top. Appl. Earth Obs. Remote Sens. 2014, 7, 4879–4886. [Google Scholar] [CrossRef]
- Giannadaki, D.; Pozzer, A.; Lelieveld, J. Modeled global effects of airborne desert dust on air quality and premature mortality. Atmos. Chem. Phys. 2014, 14, 957–968. [Google Scholar] [CrossRef]
- Kumar, K.R.; Sivakumar, V.; Reddy, R.R.; Gopal, K.R.; Adesina, A.J. Inferring wavelength dependence of AOD and Ångström exponent over a sub-tropical station in South Africa using AERONET data: Influence of meteorology, long-range transport and curvature effect. Sci. Total Environ. 2013, 461, 397–408. [Google Scholar] [CrossRef]
- Xia, X.; Eck, T.F.; Holben, B.N.; Phillippe, G.; Chen, H. Analysis of the weekly cycle of aerosol optical depth using AERONET and MODIS data. J. Geophys. Res. Atmos. 2008, 113. [Google Scholar] [CrossRef]
- Che, H.; Zhang, X.Y.; Xia, X.; Goloub, P.; Holben, B.; Zhao, H.; Wang, Y.; Zhang, X.C.; Wang, H.; Blarel, L.; et al. Ground-based aerosol climatology of China: Aerosol optical depths from the China Aerosol Remote Sensing Network (CARSNET) 2002–2013. Atmos. Chem. Phys. 2015, 15, 7619–7652. [Google Scholar] [CrossRef]
- Proestakis, E.; Amiridis, V.; Marinou, E.; Georgoulias, A.K.; Solomos, S.; Kazadzis, S.; Chimot, J.; Che, H.; Alexandri, G.; Binietoglou, I.; et al. Nine-year spatial and temporal evolution of desert dust aerosols over South and East Asia as revealed by CALIOP. Atmos. Chem. Phys. 2018, 18, 1337–1362. [Google Scholar] [CrossRef]
- Shaheen, A.; Wu, R.; Aldabash, M. Long-term AOD trend assessment over the Eastern Mediterranean region: A comparative study including a new merged aerosol product. Atmos. Environ. 2020, 238, 117736. [Google Scholar] [CrossRef]
- Sun, E.; Xu, X.; Che, H.; Tang, Z.; Gui, K.; An, L.; Lu, C.; Shi, G. Variation in MERRA-2 aerosol optical depth and absorption aerosol optical depth over China from 1980 to 2017. J. Atmos. Sol. Terr. Phys. 2019, 186, 8–19. [Google Scholar] [CrossRef]
- Wei, J.; Peng, Y.; Mahmood, R.; Sun, L.; Guo, J. Intercomparison in spatial distributions and temporal trends derived from multi-source satellite aerosol products. Atmos. Chem. Phys. 2019, 18, 1337–1362. [Google Scholar] [CrossRef]
- Yousefi, R.; Wang, F.; Ge, Q.; Shaheen, A. Long-term aerosol optical depth trend over Iran and identification of dominant aerosol types. Sci. Total Environ. 2020, 722, 137906. [Google Scholar] [CrossRef]
- Andreae, M.O. Climatic effects of changing atmospheric aerosol levels. In Future Climates of the World: A Modelling Perspective; Elsevier Science B.V.: Amsterdam, The Netherlands, 1995; pp. 347–398. [Google Scholar]
- Goudie, A.; Middleton, N. Desert Dust in the Global System; Springer: Heidelberg, Germany, 2006. [Google Scholar]
- Huneeus, N.; Schulz, M.; Balkanski, Y.; Griesfeller, J.; Prospero, J.; Kinne, S.; Bauer, S.; Boucher, O.; Chin, M.; Dentener, F.; et al. Global dust model intercomparison in AeroCom phase I. Atmos. Chem. Phys. 2011, 11, 7781–7816. [Google Scholar] [CrossRef]
- Masoodian, S.A. An Analysis of Tempo-Spatial Variation or Precipitation in Iran. Ph.D. Thesis, University of Isfahan, Isfahan, Iran, 1998. [Google Scholar]
- Hasanean, H.M. Middle East Meteorology. Available online: https://www.eolss.net/sample-chapters/C01/E6-158-19.pdf (accessed on 30 January 2021).
- Alizadeh-Choobari, O.; Ghafarian, P.; Owlad, E. Temporal variations in the frequency and concentration of dust events over Iran based on surface observations. Int. J. Climatol. 2016, 36, 2050–2062. [Google Scholar] [CrossRef]
- Namdari, S.; Valizade, K.K.; Rasuly, A.A.; Sari Sarraf, B. Spatio-temporal analysis of MODIS AOD over western part of Iran. Arab. J. Geosci. 2016, 9, 191. [Google Scholar] [CrossRef]
- Rezaei, M.; Farajzadeh, M.; Mielonen, T.; Ghavidel, Y. Analysis of spatio-temporal dust aerosol frequency over Iran based on satellite data. Atmos. Pollut. Res. 2019, 10, 508–519. [Google Scholar] [CrossRef]
- Yousefi, R.; Wang, F.; Ge, Q.; Shaheen, A.; Luterbacher, J. Long-term AOD trend analysis and classification of major aerosol types over Iran from 1980 to 2018. In Proceedings of the EGU General Assembly Conference Abstracts, Vienna, Austria, 3–8 May 2020; p. 1831. [Google Scholar]
- Che, H.; Gui, K.; Xia, X.; Wang, Y.; Holben, B.N.; Goloub, P.; Cuevas-Agulló, E.; Wang, H.; Zheng, Y.; Zhao, H.; et al. Large contribution of meteorological factors to inter-decadal changes in regional aerosol optical depth. Atmos. Chem. Phys. 2019, 19, 10497–10523. [Google Scholar] [CrossRef]
- Klingmüller, K.; Pozzer, A.; Metzger, S.; Stenchikov, G.L.; Lelieveld, J. Aerosol optical depth trend over the Middle East. Atmos. Chem. Phys. 2016, 16, 5063–5073. [Google Scholar] [CrossRef]
- Pozzer, A.; de Meij, A.; Yoon, J.; Tost, H.; Georgoulias, A.K.; Astitha, M. AOD trends during 2001–2010 from observations and model simulations. Atmos. Chem. Phys. 2015, 15, 5521–5535. [Google Scholar] [CrossRef]
- Yu, Y.; Notaro, M.; Liu, Z.; Wang, F.; Alkolibi, F.; Fadda, E.; Bakhrjy, F. Climatic controls on the interannual to decadal variability in Saudi Arabian dust activity: Toward the development of a seasonal dust prediction model. J. Geophys. Res. Atmos. 2015, 120, 1739–1758. [Google Scholar] [CrossRef]
- Balarabe, M.A.; Isah, M.N. Feed-forward and cascade back propagation artificial neural network models for predicting aerosol optical depth in Ilorin-Nigeria. FUDMA J. Sci. 2616–1370 2019, 3, 428–433. [Google Scholar]
- Shaheen, A.; Kidwai, A.A.; Ain, N.U.; Aldabash, M.; Zeeshan, A. Estimating air particulate matter 10 using Landsat multi-temporal data and analyzing its annual temporal pattern over gaza strip, Palestine. J. Asian Sci. Res. 2017, 7, 22. [Google Scholar] [CrossRef]
- Prospero, J.M.; Blades, E.; Naidu, R.; Mathison, G.; Thani, H.; Lavoie, M.C. Relationship between African dust carried in the Atlantic trade winds and surges in pediatric asthma attendances in the Caribbean. Int. J. Biometeorol. 2008, 52, 823. [Google Scholar] [CrossRef] [PubMed]
- Meng, Z.; Lu, B. Dust events as a risk factor for daily hospitalization for respiratory and cardiovascular diseases in Minqin, China. Atmos. Environ. 2007, 41, 7048–7058. [Google Scholar] [CrossRef]
- Gelaro, R.; McCarty, W.; Suárez, M.J.; Todling, R.; Molod, A.; Takacs, L.; Randles, C.A.; Darmenov, A.; Bosilovich, M.G.; Reichle, R. The modern-era retrospective analysis for research and applications, version 2 (MERRA-2). J. Clim. 2017, 30, 5419–5454. [Google Scholar] [CrossRef]
- Molod, A.; Takacs, L.; Suarez, M.; Bacmeister, J.; Song, I.S.; Eichmann, A. The GEOS-5 atmospheric general circulation model: Mean climate and development from MERRA to Fortuna. In Technical Report Series on Global Modeling and Data Assimilation; Suarez, M.J., Ed.; NASA: Maryland, MD, USA, 2012. [Google Scholar]
- Molod, A.; Takacs, L.; Suarez, M.; Bacmeister, J. Development of the GEOS-5 atmospheric general circulation model: Evolution from MERRA to MERRA2. Geosci. Model. Dev. 2015, 8, 1339–1356. [Google Scholar] [CrossRef]
- Holben, B.N.; Eck, T.F.; Slutsker, I.A.; Tanre, D.; Buis, J.P.; Setzer, A.; Vermote, E.; Reagan, J.A.; Kaufman, Y.J.; Nakajima, T. AERONET—A federated instrument network and data archive for aerosol characterization. Remote Sens. Environ. 1998, 66, 1–16. [Google Scholar] [CrossRef]
- Urraca, R.; Huld, T.; Gracia-Amillo, A.; Martinez-de-Pison, F.J.; Kaspar, F.; Sanz-Garcia, A. Evaluation of global horizontal irradiance estimates from ERA5 and COSMO-REA6 reanalyses using ground and satellite-based data. Sol. Energy 2018, 164, 339–354. [Google Scholar] [CrossRef]
- Olauson, J. ERA5: The new champion of wind power modelling? Renew. Energy 2018, 126, 322–331. [Google Scholar] [CrossRef]
- Hoffmann, L.; Günther, G.; Li, D.; Stein, O.; Wu, X.; Griessbach, S.; Heng, Y.; Konopka, P.; Müller, R.; Vogel, B.; et al. From ERA-Interim to ERA5: The considerable impact of ECMWF’s next-generation reanalysis on Lagrangian transport simulations. Atmos. Chem. Phys. 2019, 19, 3097–3124. [Google Scholar] [CrossRef]
- Tarek, M.; Brissette, F.P.; Arsenault, R. Evaluation of the ERA5 reanalysis as a potential reference dataset for hydrological modelling over North America. Hydrol. Earth Syst. Sci. 2020, 24, 2527–2544. [Google Scholar] [CrossRef]
- Baudouin, J.-P.; Herzog, M.; Petrie, C.A. Cross-validating precipitation datasets in the Indus River basin. Hydrol. Earth Syst. Sci. 2020, 24, 427–450. [Google Scholar] [CrossRef]
- Gleixner, S.; Demissie, T.; Diro, G.T. Did ERA5 Improve Temperature and Precipitation Reanalysis over East Africa? Atmosphere 2020, 11, 996. [Google Scholar] [CrossRef]
- Hersbach, H.; Bell, B.; Berrisford, P.; Hirahara, S.; Horányi, A.; Muñoz-Sabater, J.; Nicolas, J.; Peubey, C.; Radu, R.; Schepers, D.; et al. The ERA5 global reanalysis. Q. J. R. Meteorol. Soc. 2020, 146, 1999–2049. [Google Scholar] [CrossRef]
- Hammer, M.S.; Martin, R.V.; Li, C.; Torres, O.; Manning, M.; Boys, B.L. Insight into global trends in aerosol composition from 2005 to 2015 inferred from the OMI Ultraviolet Aerosol Index. Atmos. Chem. Phys. 2018, 18, 8097–8112. [Google Scholar] [CrossRef]
- Shaheen, A. A New MODIS C6.1 and MERRA-2 merged aerosol products: Validation over the eastern mediterranean region. In EGU General Assembly Conference Abstracts; EGU2020–639: Vienna, Austria, 2020. [Google Scholar]
- Zhai, S.; Jacob, D.J.; Wang, X.; Shen, L.; Li, K.; Zhang, Y.; Gui, K.; Zhao, T.; Liao, H. Fine particulate matter (PM 2.5) trends in China, 2013–2018: Separating contributions from anthropogenic emissions and meteorology. Atmos. Chem. Phys. 2019, 19, 11031–11041. [Google Scholar] [CrossRef]
- Léon, J.; Chazette, P.; Dulac, F.; Pelon, J.; Flamant, C.; Bonazzola, M.; Foret, G.; Alfaro, S.C.; Cachier, H.; Cautenet, S. Large-scale advection of continental aerosols during INDOEX. J. Geophys. Res. Atmos. 2001, 106, 28427–28439. [Google Scholar] [CrossRef]
- Reid, J.S.; Piketh, S.J.; Walker, A.L.; Burger, R.P.; Ross, K.E.; Westphal, D.L.; Bruintjes, R.T.; Holben, B.N.; Hsu, C.; Jensen, T.L. An overview of UAE2 flight operations: Observations of summertime atmospheric thermodynamic and aerosol profiles of the southern Arabian Gulf. J. Geophys. Res. Atmos. 2008, 113. [Google Scholar] [CrossRef]
- Remer, L.A.; Kleidman, R.G.; Levy, R.C.; Kaufman, Y.J.; Tanré, D.; Mattoo, S.; Martins, J.V.; Ichoku, C.; Koren, I.; Yu, H.; et al. Global aerosol climatology from the MODIS satellite sensors. J. Geophys. Res. Atmos. 2008, 113. [Google Scholar] [CrossRef]
- Rupakheti, D.; Kang, S.; Bilal, M.; Gong, J.; Xia, X.; Cong, Z. Aerosol optical depth climatology over Central Asian countries based on Aqua-MODIS Collection 6.1 data: Aerosol variations and sources. Atmos. Environ. 2019, 207, 205–214. [Google Scholar] [CrossRef]
- Lee, H.; Kalashnikova, O.V.; Suzuki, K.; Braverman, A.; Garay, M.J.; Kahn, R.A. Climatology of the aerosol optical depth by components from the Multi-angle Imaging SpectroRadiometer (MISR) and chemistry transport models. Atmos. Chem. Phys. 2016, 16, 6627. [Google Scholar] [CrossRef]
- Zoljoodi, M. The Study of Sea Level Pressure Patterns and Wind aloft Features over the Middle East and the Persian Gulf Area during Spring Transition. J. Persian Gulf 2015, 6, 11–20. [Google Scholar]
- Ginoux, P.; Prospero, J.M.; Torres, O.; Chin, M. Long-term simulation of global dust distribution with the GOCART model: Correlation with North Atlantic Oscillation. Environ. Model. Softw. 2004, 19, 113–128. [Google Scholar] [CrossRef]
- Zhao, Y.; Huang, A.; Zhu, X.; Zhou, Y.; Huang, Y. The impact of the winter North Atlantic Oscillation on the frequency of spring dust storms over Tarim Basin in northwest China in the past half-century. Environ. Res. Lett. 2013, 8, 24026. [Google Scholar] [CrossRef]
- Alizadeh-Choobari, O.; Najafi, M.S. Extreme weather events in Iran under a changing climate. Clim. Dyn. 2018, 50, 249–260. [Google Scholar] [CrossRef]


Publisher’s Note: MDPI stays neutral with regard to jurisdictional claims in published maps and institutional affiliations. |
© 2021 by the authors. Licensee MDPI, Basel, Switzerland. This article is an open access article distributed under the terms and conditions of the Creative Commons Attribution (CC BY) license (http://creativecommons.org/licenses/by/4.0/).