Abstract
Aerosol distribution with fine spatial resolution is crucial for atmospheric environmental management. This paper proposes an improved algorithm of aerosol retrieval from 250-m Medium Resolution Spectral Image (MERSI) data of Chinese FY-3 satellites. A mixing model of soil and vegetation was used to calculate the parameters of the algorithm from moderate-resolution imaging spectroradiometer (MODIS) reflectance products in 500-m resolution. The mixing model was used to determine surface reflectance in blue band, and the 250-m aerosol optical depth (AOD) was retrieved through removing surface contributions from MERSI data over Guangzhou. The algorithm was used to monitor two pollution episodes in Guangzhou in 2015, and the results displayed an AOD spatial distribution with 250-m resolution. Compared with the yearly average of MODIS aerosol products in 2015, the 250-m resolution AOD derived from the MERSI data exhibited great potential for identifying air pollution sources. Daily AODs derived from MERSI data were compared with ground results from CE318 measurements. The results revealed a correlation coefficient between the AODs from MERSI and those from the ground measurements of approximately 0.85, and approximately 68% results were within expected error range of ±(0.05 + 15%τ).
1. Introduction
Aerosols are a major component of the troposphere that contribute to climate change and play an essential role in atmospheric environment [1,2]. Satellite signals are important data sources for obtaining aerosol information. Remote sensing can quickly obtain the spatial distribution of aerosols, which can complement ground station monitoring. From retrieved aerosol information, particulate matter (PM10 and PM2.5) can be retrieved by the land-use regression (LUR) method [3].
Retrieving aerosols over land is difficult from satellite signals because of the reflectance of the ground surface. Several algorithms for aerosol retrieval were proposed based on assumptions regarding the land surface. For example, the dark dense vegetation (DDV) algorithm [4,5,6,7,8,9,10] uses the correlations of blue–red and red shortwave infrared (SWIR) surface reflectance. The multi-angle algorithm [11,12,13,14,15] assumes that the normalized reflectance at multi-angles is invariant in visible bands. The deep blue (DB) algorithm [16,17,18,19,20] assumes that surface reflectance in blue band is low and changes slowly with time. The multi-angle polarization algorithm [21,22,23,24,25,26] retrieves fine-particle aerosols by using polarization signals that are not sensitive to the surface. Multi-angle implementation of atmospheric correction (MAIAC) algorithm retrieves the aerosol based on a time series analysis and image-based processing, which was applied by the MODIS MCD19A2 product in 1 km resolution [27,28].
With the recent development of high-resolution sensors, aerosol optical depth (AOD) inversion has reached spatial resolutions of higher than 1000 m. In addition to obtaining the spatial distribution of aerosol particles and their temporal changes, high-resolution AODs can also identify the source of atmospheric pollution, providing supporting information for atmospheric environmental management. Wang et al. [29] retrieved AOD with 300-m resolution from Chinese HJ-1 charged-couple device (CCD) data using the DDV algorithm. Sun et al. [30] retrieved AOD with 500-m resolution from Landsat 8 Operational Land Imager (OLI) data by the DB algorithm. In Wuhan, China, Sun et al. [31] composited wide-field-of-view (WFV) data of Chinese GF-1 satellite on the clearest days of each season and retrieved AOD with 160-m resolution. Using the blue–red reflectance correlations for low-, medium-, and high-density vegetation, Bao et al. [32] retrieved AOD with 160-m resolution from GF-1 WFV data. Using the ratio between the red and blue bands extracted from MODIS and Multi-angle Imaging SpectroRadiometer (MISR) data, Vermote et al. [33] retrieved AOD with 30-m resolution from Landsat 8 OLI data.
However, for narrower swaths, OLI or WFV cannot cover one city daily, which means they cannot capture rapidly changing aerosol distributions. The swath width of the FY-3 MERSI is more than 2000 km, and in the four bands, the spatial resolution is 250 m. In general, AODs are generally retrieved from MERSI’s 1-km data, but the algorithm for high-resolution (250-m) aerosol retrieval should be improved.
In the paper, we employed the method of von Hoyningen-Huene et al. [34] to retrieve AOD. Compared to other methods for higher than 1000 m, the advancements were (1) only the signal in blue band was used to retrieve AOD so the error from different bands was reduced; (2) our method was not only suitable for vegetation and soil, but also for the mixed pixels.
Basing the research on the work of von Hoyningen-Huene et al. [34], we used surface reflectance data to analyze the correlation between the Normalized Difference Vegetation Index (NDVI) and surface reflectance in blue band and then developed a 250-m aerosol data inversion algorithm for FY-3 MERSI that achieved high-resolution AOD in an urban area of Guangzhou.
2. The Area and Data
2.1. Guangzhou Area
Guangzhou is in the southeast of China. Guangzhou city covers a 1249.11 km2 area, and more than 10 million people live in the city. Guangzhou is a key industrial base in China. Automobile manufacturing, electronic communication, and petrochemicals are the city’s main industries. After years of treatment, the air quality in Guangzhou has remarkably improved. However, aerosol particles from complex air pollution and regional pollution transport still greatly influence air quality.
2.2. The Data
The FY-3 satellites belong to China’s polar orbit meteorological satellite series. To date, four satellites (FY-3A, FY-3B, FY-3C, and FY-3D) have been launched in this series. The four FY-3 satellites are equipped with MERSI technology, which is widely used in meteorology, forestry, environmental science, and other fields. MERSI is designed mainly for the study of clouds, aerosols, and vegetation. It has a wide swath of 2000 km and boasts 20 channels. Five bands have a resolution of 250-m (Table 1), and the remaining bands have a resolution of 1-km [35,36]. The data we selected for inversion were the L1 250-m data from the FY-3 MERSI in hierarchical data format (HDF) version five. The data were radiance calibrated, and the apparent reflectance of each pixel was easily extracted. However, none of the auxiliary parameters (solar zenith angle, longitude, latitude, and so on) had a resolution of 250-m. We extracted these parameters from the 1-km data and interpolated them to 250-m resolution.

Table 1.
Characteristics of MERSI 250-m bands from FY-3 satellites.
Using the overpass time of FY-3B (14:30 local time), we selected the MODIS AOD product of the Aqua satellite (14:00 local time) for comparison with the results derived from our algorithm (https://ladsweb.nascom.nasa.gov/ (accessed on 10 January 2021)). The version of the MODIS AOD product was Collection 6. The MODIS AOD product was derived from the DDV algorithm [37] and MAIAC algorithm [28] (MCD19A2 products).
The ground-based aerosol measurements were observed by CE318. The observation site (red star in Figure 1) was the roof of one building at Sun Yat-sen University (113.29466° E, 23.1037° N). In China, although there are many aerosol ground observation sites, only few sites measure long-term stable data. In Guangzhou, we only obtained data from the Sun Yat-Sen University site. With the development of the city, the campus of Sun Yat-sen University has been surrounded by urban areas. Therefore, the site data also represent the aerosol of Guangzhou city. Because the site is located inside the campus, the surroundings are mainly vegetation. Many buildings are situated in the north and west of the campus, and the Pearl River lies approximately 200 m to the north (Figure 1). CE318 obtained the AOD in five bands (1020, 670, 440, 870, and 936 nm), which were then converted into 550 nm for comparison with the satellite’s results. The station had received AODs for several years, but because of complications, such as equipment maintenance, we were only able to obtain continuous observation data for 2015.
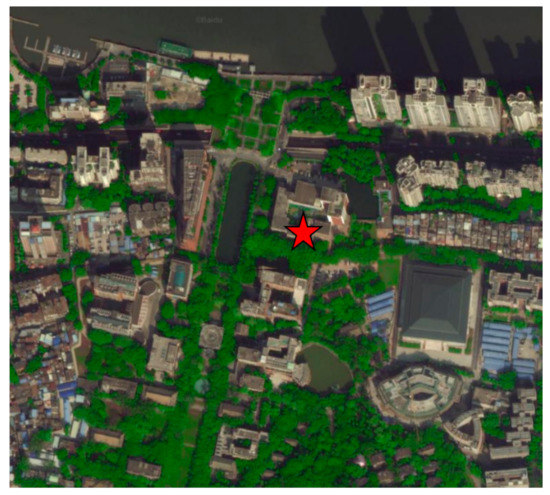
Figure 1.
The location of CE318 (from ditu.baidu.com) (accessed on 10 January 2021).
3. Inversion Principle and Methodology
3.1. Basic Theory
For the plane-parallel atmosphere, the top of atmosphere (TOA) reflectance, ,was defined as follows [38]:
where surface reflectance is represented by , and , and , and represent the atmospheric parameters (aerosols and molecules) from which the AOD can be extracted. Generally, atmospheric parameters are functions of the AOD and the aerosol model. Because we developed the aerosol model from CE318 data (see Section 3.2 for details), the AOD was retrieved from atmospheric parameters and . For quick inversion, the atmospheric parameters were precomputed using radiative transfer codes [39].
To retrieve aerosol data, the surface distribution in Equation (1) needed to be removed from the satellite signal. Several algorithms can remove surface distribution with satellite data in one or more bands by making assumptions regarding the land surface. In Equation (2), the DDV algorithm assumed that the reflectance of the red band was approximately twice that of the blue band for dense vegetation [4],
where represents the parameter, which changes in vegetation type, viewing geometry, and so on. This parameter is usually obtained through assessments of ground-based measurements or satellite data. Parameter is usually set to 2.
The DB algorithm [16] assumes that reflectance in blue channel is invariable for a short period. The surface reflectance can be replaced by that of the clearest recent day or that of the same day in a previous year.
Using a mixing model of soil and vegetation, the surface reflectance was adjusted to the NDVI [34]:
where is the estimation for the proportion of vegetation cover. When NDVI is greater than 0, is equal to NDVI, and when NDVI is less than 0, is set to 0. Von Hoyningen-Huene et al. [34] obtained and from aircraft measurements in Europe.
We improved the algorithm of von Hoyningen-Huene et al. [34] to retrieve information on aerosols from MERSI 250-m data over an urban area in Guangzhou. The algorithm can cover most of the urban surface, such as vegetation, bare soil, and the combination thereof, and surface reflectance is adjusted according to the NDVI of each pixel, allowing the effects of the surface to be removed precisely. For the lack of aircraft or ground observations of land surface over the Guangzhou area, we obtained the parameters in the algorithm through statistical analysis of the MODIS surface reflectance products (500 m) (see Section 3.3 for details).
Because the NDVI decreases when the AOD increases, atmospheric correction (AC) needed to be conducted first. The AODs used in AC were derived from the DB algorithm and were 1-km resolution. Figure 2 displays a flowchart of AOD retrieval. In our algorithm, when TOA reflectance in red band was greater than 0.2 or NDVI was less than 0, the pixel was removed as cloud [40].
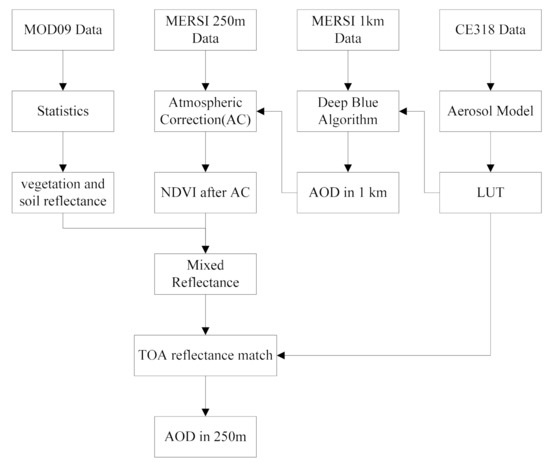
Figure 2.
Flowchart of aerosol optical depth (AOD) retrieval from MERSI 250-m data.
3.2. Aerosol Model in Guangzhou
The aerosol model was developed using CE318 data and MODIS TOA data. Following the method outlined by Wei et al. [41], we fitted the AOD of the mixture of the aerosol basic components to that of the CE318 data. CE318 data were from 2015, and the wavelengths were 440, 675, 870, and 1020 nm. Figure 3 shows the AOD from the CE318 data. However, because the CE318 does not measure sky radiance, we did not obtain any single-scattering albedos or asymmetry factors. To account for aerosol backscattering, we introduced MODIS TOA reflectance in the red and blue bands to develop the aerosol model.
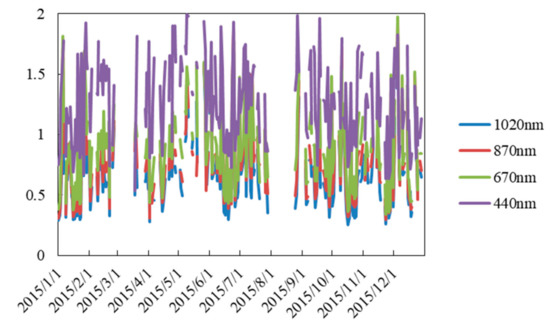
Figure 3.
AOD from CE318 in 2015.
We identified three components of aerosols from Guangzhou [42,43]: sea salt (SS), water soluble (WASO), and black carbon (BC). The extinctions of the components were derived from OPAC model [44].
In band j, the AOD and TOA reflectance are calculated as follows:
where is the extinction of component i and is the number of component i.
The N of the three components was obtained through minimization of the residual between the optical properties of aerosol and clouds (OPAC) simulation (simu) results and measurements (meas). The residual term is defined as follows:
The percent of component j was converted to 550 nm.
Figure 4 shows the monthly average proportions of the three aerosol components. Because there were more rainy than cloudy days, no valid data could be derived for June, August, or September, and the proportion of each component was not obtained. As indicated in Figure 4, the proportion of WASO compounds was the greatest (54–75%), followed by SS (34–52%) and BC (0–8%). Because the sources of aerosols in Guangzhou did not substantially change, the aerosol composition varied only slightly. The annual aerosol components were averaged, and the proportions of WASO compounds, SS, and BC were 67%, 29%, and 4%, respectively. We used the annual average proportions for the aerosol model in the remote sensing inversion.
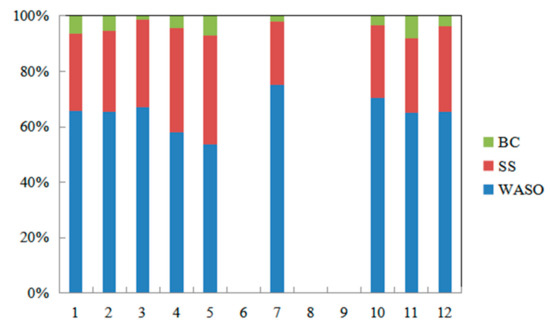
Figure 4.
Monthly average proportions of the three components in 2015.
3.3. Determination of Surface Reflectance
Because and in the work of von Hoyningen-Huene et al. [34] may not have been appropriate to retrieve the AOD in Guangzhou, we assessed and from satellite measurements of the MODIS over Guangzhou. Compared to Landsat 8 or Sentinel data in high resolution, MODIS surface reflectance (MOD09) products have two advancements (1) MOD09 products have mature quality control and easy to obtain; (2). Due to the width of MODIS swath, it can provide more surface reflectance data.
We analyzed the surface reflectance in Guangdong using the MODIS surface reflectance product from 2015. After AC (including absorption gas, molecules, and aerosols) of MODIS TOA reflectance, the MOD09 product was obtained through correction of the change in the surface reflection angle. Anticipating the needs of a surface reflectance analysis, we extracted the MOD09 product with 500-m resolution from the urban area in Guangzhou and selected MODIS bands 1, 2, 3, and 4 (red, near-infrared, blue, and green bands, respectively). We then re-projected the data into geographic projection and mosaicked the results to obtain the surface reflectance. To eliminate the influence of clouds, pixels were removed when the reflectance in the red band was greater than 0.2 or when the NDVI was less than 0.
Figure 5a presents the surface reflectance in Guangzhou. The figure shows that the northeast region of Guangzhou was an area with vegetation coverage, the south and north were urban areas, and the northwest corner was an area of vegetation concentration. A histogram of the surface reflectance in each band was obtained. As displayed in Figure 5b, the reflectance in near-infrared band was the highest overall, concentrated at above 0.2. The reflectance in blue band was the lowest overall, concentrated at below 0.13. The surface reflectance in the green and red bands was relatively similar, both generally below 0.15. Because of the vast vegetation coverage in Guangzhou, the reflectance in green band was higher than that in red band.
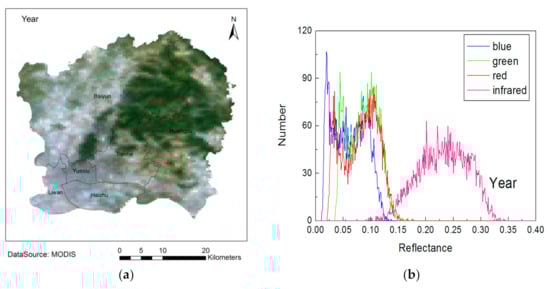
Figure 5.
Surface reflectance (a) and histogram (b) for Guangzhou.
Next, we calculated the minimum, maximum, average, and variance of the surface reflectance in the four bands, and after classifying the histogram by 25%, we extracted the surface reflectance in the first, second, and third 25% sections. Table 2 shows that the reflectance was the lowest overall in the blue band, similar between the green and red bands, and highest in the near-infrared band.
Table 2.
Surface reflectance in the four bands.
According to the surface reflectance in each band at the first, second, and third 25% sections, the TOA reflectance was simulated by second simulation of a 6S V 1.0 [39]. According to the satellite overpass time and the latitude of Guangzhou, the solar zenith angle was 14° and the observation zenith angle was 37°. As indicated in Figure 6, as the AOD increased, TOA reflectance in blue, green, and red bands also increased, whereas TOA reflectance in near-infrared band did not change significantly. The blue band had the largest interval of change, followed by the green and red bands, meaning that the satellite data in the blue band were the most suitable for aerosol inversion.
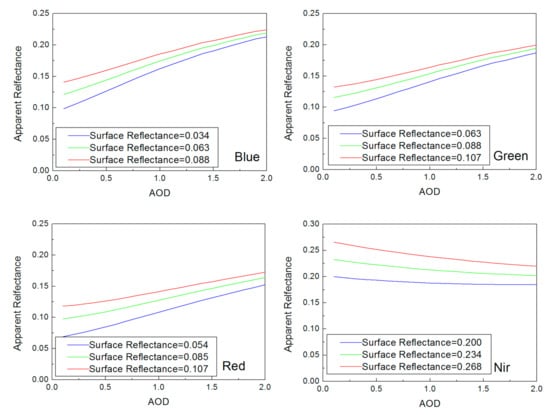
Figure 6.
Top of atmosphere (TOA) reflectance in the four bands with different AODs.
The correlation between the NDVI and surface reflectance in blue band was analyzed. Then the reflectance of pure bare soil and pure vegetation in Equation (3) was determined. As Figure 7 shows, a strong negative correlation was observed between the surface reflectance band and the NDVI, with a correlation coefficient of −0.931. The calculation indicated that the reflectance was 0.128 for pure bare land and −0.010 for pure vegetation. In actual observation, the NDVI of vegetation cannot reach 1; the reflectance of pure vegetation is a theoretical calculated value, and the negative value was used for the convenience of model calculation.
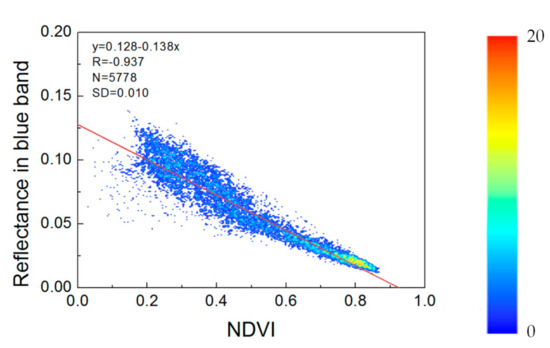
Figure 7.
Scatter plot of the Normalized Difference Vegetation Index (NDVI) versus reflectance in the blue band.
We also analyzed the correlation between the NDVI and the ratio (parameter a in Equation (2)), which is a fundamental parameter of the DDV algorithm. As displayed in Figure 8, a correlation was also observed between the NDVI and this ratio, with a correlation coefficient of 0.743. Compared with Figure 5, the ratio had a lower correlation with the NDVI and a greater degree of dispersion. Because the reflectance in blue band had a stronger correlation with the NDVI, we used the NDVI to calculate the surface reflectance in blue band and remove its contribution, and then received 250-m AOD from MERSI 250-m data.
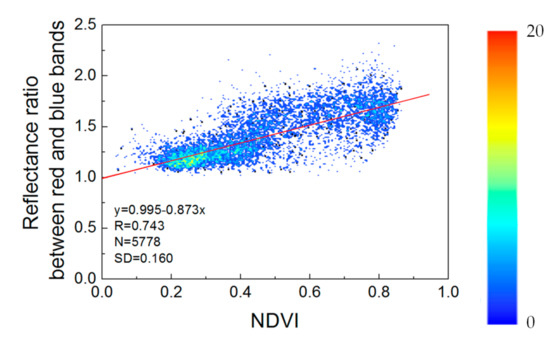
Figure 8.
Scatter plot of the NDVI versus the ratio a in Equation (2).
4. Results and Validation
The described algorithm was programmed in interactive data language. MERSI data were collected from the Guangzhou overpass and used in the algorithm to retrieve the 250-m AOD. The obtained AOD was then compared with the MODIS product and the CE318 observation data.
4.1. Retrieval Experiments
By our algorithm, we retrieved MERSI 250-m AOD images for every day in 2015, and then seasonal average AOD images were received. As shown in Figure 9, in the spring (March, April, and May) of 2015, the AOD was the greatest; in the summer (June, July, and August) of 2015, because of the clouds and rain, we only received AOD in partial areas; in the fall (September, October, and November) of 2015, the AOD was the lowest; in the winter (January, February, and December) of 2015, the AOD was the middle.
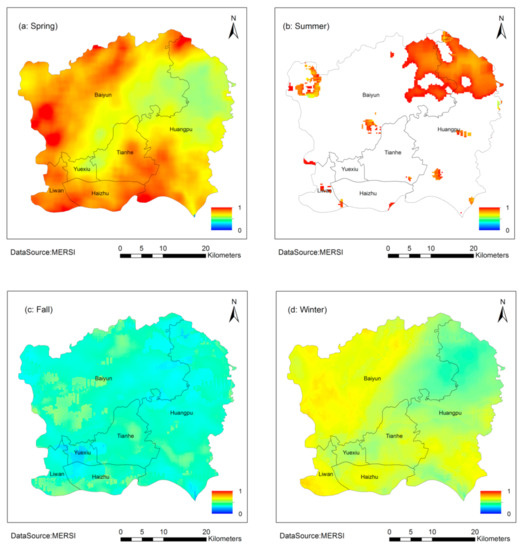
Figure 9.
AOD in four seasons of 2015.
Two pollution episodes were selected for evaluating the performance of the algorithm. Figure 10 displays the AOD images retrieved during the pollution episode of 14–17 January and the false-color images were composited with the data in MERSI’s channel 2, 3, and 4 to match the inversion. On 14 January, the overall AOD in Guangzhou was low, but there were high AOD value areas of approximately 0.5 in northwestern, southeastern, and southern regions. On 15 January, the air quality improved substantially, and the AOD decreased to below 0.3. On 16 January, because the clouds in the central and northern areas were incorrectly identified as high AOD areas, AOD over those areas was greater than 1; On 17 January, the air quality decreased considerably, and the overall AOD increased considerably, exceeding 0.5 in the west and south.
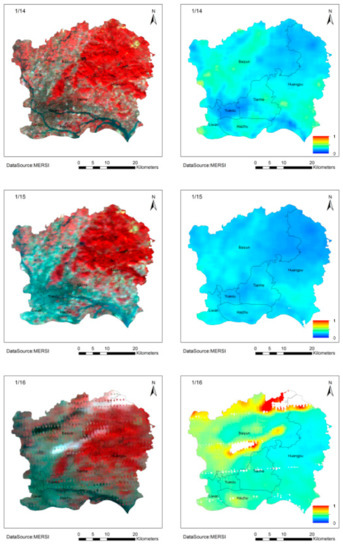
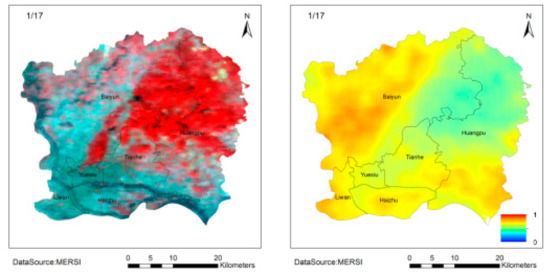
Figure 10.
False-color (left) and AOD (right) images on 14–17 January 2015.
Figure 11 displays AOD images retrieved during the 14–17 October pollution episode. On 14 October, Liwan, Haizhu, Yuexiu, and Tianhe in southwestern Guangzhou had high AODs of greater than 1. Blank areas on the images denote cloud cover or a high AOD. On 15 October, the AOD could not be retrieved because of cloud coverage. On 16 October, the AOD decreased substantially to below 0.4. On 17 October, the AOD increased to higher than 0.5 in some areas of Baiyun and in the south of Guangzhou.
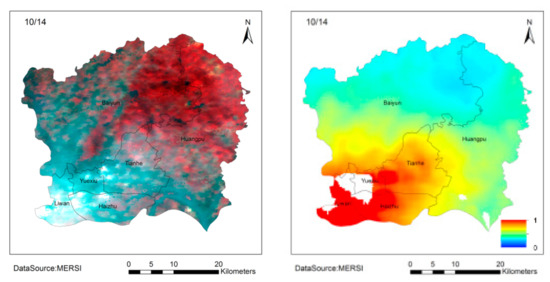
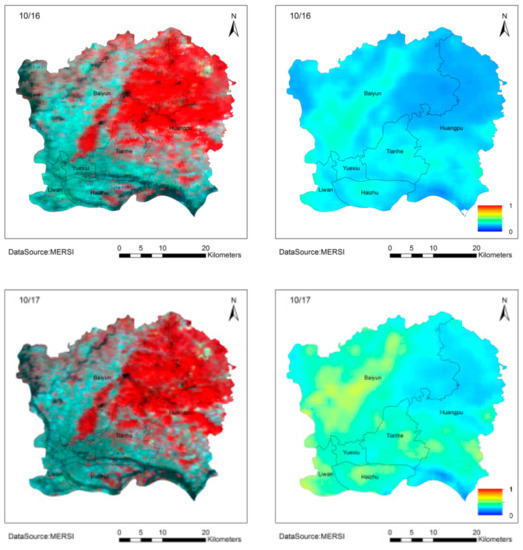
Figure 11.
False-color (left) and AOD (right) images on 14–17 October 2015.
4.2. Comparison with the MODIS Product
The algorithm retrieved a 250-m AOD from the MERSI data for every day in 2015, and then yearly average AOD from MERSI was received. The yearly average AOD from the MODIS aerosol product (MOD04 and MCD19A2) were then obtained. Figure 12 reveals a good agreement between the MERSI and MOD04 AODs, but in the northwest and south areas, MERSI and MOD04 AODs were greater than MCD19A2 AODs, and that may be from the improvement of MAIAC algorithm over brighter surface [28]. The AODs in Guangzhou were generally low. The northeastern area (forest) had low AODs, and the southern urban area and northwestern industrial area had high AODs. Because the resolution of the MERSI data was substantially higher than that of the MODIS data, several sources of air pollution could be identified, such as Baiyun Airport in the north.
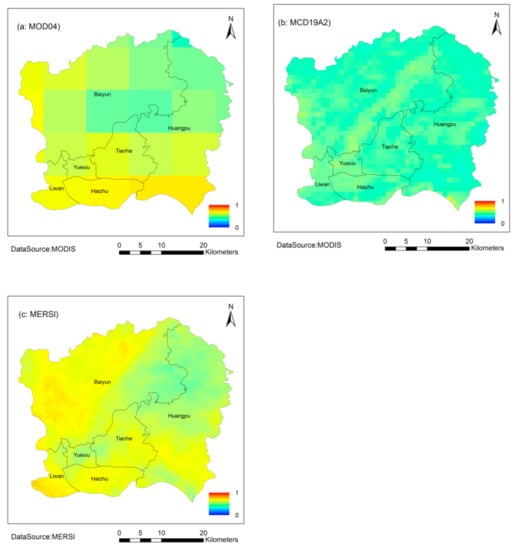
Figure 12.
Yearly average AOD over Guangzhou from MERSI (c) and MODIS (a): MOD04, (b): (MCD19A2) in 2015.
The spatial resolution of the MERSI AOD was resampled to 10-km for comparison with the MOD04 AOD. Figure 13 presents a scatter plot of the yearly average AODs of the MODIS and MERSI. Figure 13 shows that the Root Mean Square Error (RMSE) between MERSI and MODIS AOD was small (0.036 and 0.053). However, the range of the yearly average AODs was small (0.38–0.65), the scales (0.466 and 407) were far from 1, and the offsets were larger than 0.3. The correlation coefficient between the MOD04 and MERSI AODs was greater than 0.7, but was about 0.2 between the MCD19A2 and MERSI AODs, because in urban areas, MERSI AODs were greater than MCD19A2 AODs.
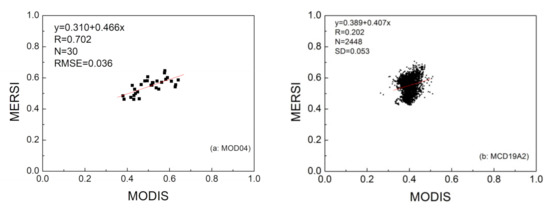
Figure 13.
Scatter plot of moderate-resolution imaging spectroradiometer (MODIS) (a): MOD04. (b): (MCD19A2) and Medium Resolution Spectral Image (MERSI) AODs.
4.3. Validation with CE318
The retrieved AOD was validated using the CE318 observation results. To eliminate the spatial and temporal inconsistency of aerosols, MERSI AODs within a range of 10 km around the site were spatially averaged, the ground observation results within an hour of the satellite overpass time were time-averaged, and results with a standard deviation above 40% of the average were excluded. To remove the influence of coarse particles, results with an Angstrom exponent of less than 1 were eliminated.
Figure 14 and Table 3 show a good relationship between the CE318 and MERSI AODs with a correlation coefficient greater than 0.85. The MERSI and CE318 AODs were similar with a proportional coefficient of 1.06. A total of 68% of the results were within the expected error (EE) range of ± (0.05 + 15%τ) [5], and the results outside the EE, accounting for 25%, were mainly attributed to underestimation. As shown in Figure 14, when CE318 AODs were lower than 0.7, MERSI AODs were obviously underestimated, but as CE318 AODs increased, the underestimation decreased. The reason may be that when AODs were low, the errors from surface reflectance were relatively obvious.
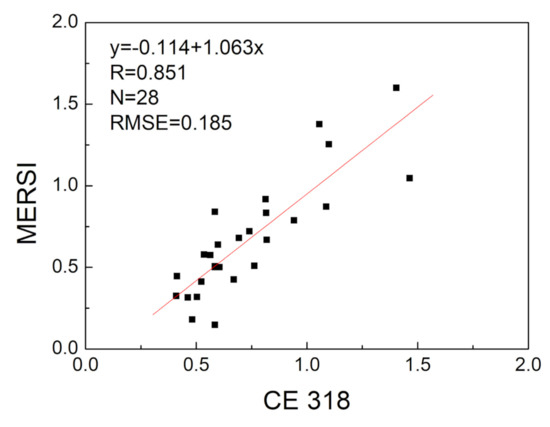
Figure 14.
Scatter plot of MERSI and CE318 AODs.
Table 3.
Validation of AODs with CE318 AODs
5. Conclusions
Although the results derived from our algorithm are in good agreement with ground measurements, three shortcomings should be addressed: (1) the parameters of and must be calculated over more areas and (2) the fixed aerosol model must be adjusted according to season and location (3) because the results are based on limited data sets, to fully understand the capabilities of our method, more experiments need to be completed in more time periods and more cities.
China continues to launch many new satellites equipped with CCD cameras with wide swaths, such as the WFV cameras onboard the GF-1 and GF-6 satellites and the 16-m cameras onboard the HJ-2A and HJ-2B satellites. Our algorithm can retrieve higher resolution AODs by using the blue band data of CCD cameras. In the future, China will launch more FY-3 satellites equipped with similar MERSI sensors, which will provide data that enables the algorithm to retrieve a larger number of AODs with 250-m resolution.
Author Contributions
Z.W. and H.C. performed the AOD algorithm research and prepared the paper. L.C. and R.D. provided advice and suggestions. Y.L. and Y.Z. processed the ground-based data. P.M. and S.Z. processed satellite remote sensing data. All authors have read and agreed to the published version of the manuscript.
Funding
This research was supported by the National Key Research and Development Program of China (2018YFE0106900), the National Natural Science Foundation of China (Grant No. 41971324), and the Major Projects of High Resolution Earth Observation Systems of National Science and Technology (Grant No. 05-Y30B01-9001-19/20, 05-Y30B02-9001-13/15).
Data Availability Statement
Restrictions apply to the availability of these data. Data was obtained from National Satellite Meteorological Center (NSMC) and are available from http://satellite.nsmc.org.cn/ (accessed on 10 January 2020) with the permission of NSMC.
Acknowledgments
The authors would like to thank NSMC for FY-3B MERSI data, NASA for the MODIS MOD09 product, Professor Vermote E. for 6S Vector1.1 code.
Conflicts of Interest
The authors declare no conflict of interest.
References
- Haywood, J.; Boucher, O. Estimates of the direct and indirect radiative forcing due to tropospheric aerosols: A review. Rev. Geophys. 2000, 38, 513–543. [Google Scholar] [CrossRef]
- Kaufman, Y.J.; Tanré, D.; Boucher, O. A satellite view of aerosols in the climate system. Nature 2002, 419, 215–223. [Google Scholar] [CrossRef]
- Alvarez-Mendoza, C.I.; Teodoro, A.C.; Torres, N.; Vivanco, V. Assessment of Remote Sensing Data to Model PM10 Estimation in Cities with a Low Number of Air Quality Stations: A Case of Study in Quito, Ecuador. Environments 2019, 6, 85. [Google Scholar] [CrossRef]
- Kaufman, Y.J.; Tanré, D.; Remer, L.A.; Vermote, E.F.; Chu, A.; Holben, B.N. Operational remote sensing of tropospheric aerosol over land from EOS moderate resolution imaging spectroradiometer. J. Geophys. Res. 1997, 102, 17051–17067. [Google Scholar] [CrossRef]
- Levy, R.C.; Remer, L.A.; Mattoo, S.; Vermote, E.F.; Kaufman, Y.J. Second-generation operational algorithm: Retrieval of aerosol properties over land from inversion of Moderate Resolution Imaging Spectroradiometer spectral reflectance. J. Geophys. Res. D Atmos. 2007, 112, D13211. [Google Scholar] [CrossRef]
- Li, Y.J.; Xue, Y.; de Leeuw, G.; Li, C.; Yang, L.K.; Hou, T.T.; Marir, F. Retrieval of aerosol optical depth and surface reflectance over land from NOAA AVHRR data. Remote Sens. Environ. 2013, 133, 1–20. [Google Scholar] [CrossRef]
- Mei, L.L.; Rozanov, V.; Vountas, M.; Burrows, J.P.; Levy, R.C.; Lotz, W. Retrieval of aerosol optical properties using MERIS observations: Algorithm and some first result. Remote Sens. Environ. 2017, 197, 125–140. [Google Scholar] [CrossRef]
- Xue, Y.; He, X.W.; de Leeuw, G.; Mei, L.L.; Che, Y.H.; Rippin, W.; Guang, J.; Hu, Y.C. Long-time series aerosol optical depth retrieval from AVHRR data over land in North China and Central Europe. Remote Sens. Environ. 2017, 198, 471–489. [Google Scholar] [CrossRef]
- Ge, B.Y.; Li, Z.Q.; Liu, L.; Yang, L.K.; Chen, X.F.; Hou, W.Z.; Zhang, Y.; Li, Q.H.; Li, L.; Qie, L.L. A Dark Target Method for Himawari-8/AHI Aerosol Retrieval: Application and Validation. IEEE Trans. Geosci. Remote Sens. 2019, 57, 381–394. [Google Scholar] [CrossRef]
- Wang, Z.T.; Ma, P.F.; Chen, H.; Zhang, Y.H.; Zhang, L.J.; Li, S.S.; Li, Q.; Chen, L.F. Aerosol retrieval in the autumn and winter from the red and 2.12 μm bands of MODIS. Trans. Geosci. Remote Sens. 2019, 57, 2372–2380. [Google Scholar] [CrossRef]
- Diner, D.J.; Martonchik, J.V.; Kahn, R.; Pinty, B.; Gobron, N.; Nelson, D.L.; Holben, B.N. Using Angular and Spectral Shape Similarity Constraints to Improve MISR Aerosol and Surface Retrievals over Land. Remote Sens. Environ. 2005, 94, 155–171. [Google Scholar] [CrossRef]
- Hagolle, O.; Dedieu, G.; Mougenot, B.; Debaecker, V.; Duchemin, B.; Meygret, A. Correction of aerosol effects on multi-temporal images acquired with constant viewing angles: A Application to Formosat-2 images. Remote Sens. Environ. 2008, 112, 1689–1701. [Google Scholar] [CrossRef]
- Wang, Y.Q.; Jiang, X.; Yu, B.; Jiang, M. A Hierarchical Bayesian Approach for Aerosol Retrieval Using MISR Data. J. Am. Stat. Assoc. 2013, 108, 483–493. [Google Scholar] [CrossRef]
- Shi, S.Y.; Cheng, T.H.; Gu, X.F.; Chen, H.; Guo, H.; Wang, Y.; Bao, F.W.; Xu, B.; Wang, W.N.; Zuo, X.; et al. Synergy of MODIS and AATSR for better retrieval of aerosol optical depth and land surface directional reflectance. Remote Sens. Environ. 2017, 195, 130–141. [Google Scholar] [CrossRef]
- Chen, X.F.; Li, Z.Q.; Zhao, S.H.; Yang, L.K.; Ma, Y.; Liu, L.; Li, D.H.; Qie, L.L.; Xing, J. Using the Gaofen-4 geostationary satellite to retrieve aerosols with high spatiotemporal resolution. J. Appl. Remote Sens. 2018, 12, 042606. [Google Scholar] [CrossRef]
- Hsu, N.C.; Lee, J.; Sayer, A.M.; Carletta, N.; Chen, S.H.; Tucker, C.J.; Holben, B.N.; Tsay, S.C. Retrieving near-global aerosol loading over land and ocean from AVHRR. J. Geophys. Res. Atmos. 2017, 122, 9968–9989. [Google Scholar] [CrossRef]
- Hsu, N.; Jeong, M.J.; Bettenhausen, C.; Sayer, A.M.; Hansell, R.; Seftor, C.S.; Huang, J.; Tsay, S.C. Enhanced deep blue aerosol retrieval algorithm: The second generation. J. Geophys. Res. Atmos. 2013, 118, 9296–9315. [Google Scholar] [CrossRef]
- Shams, S.B.; Mohammadzadeh, A. A Novel Aerosol Load Index Using MODIS Visible Bands: Applied to South-West Part of Iran. IEEE J. Sel. Top. Appl. Earth Obs. Remote Sens. 2015, 8, 1167–1175. [Google Scholar] [CrossRef]
- Sun, L.; Sun, C.; Liu, Q.; Zhong, B. Aerosol optical depth retrieval by HJ-1/CCD supported by MODIS surface reflectance data. Sci. China Earth Sci. 2010, 53, 74–80. [Google Scholar] [CrossRef]
- Mishra, M.K. Retrieval of Aerosol Optical Depth from INSAT-3D Imager over Asian Landmass and Adjoining Ocean: Retrieval Uncertainty and Validation. J. Geophys. Res. Atmos. 2018, 123, 5484–5508. [Google Scholar] [CrossRef]
- Dubovik, O.; Herman, M.; Holdak, A.; Lapyonok, T.; Tanré, D.; Deuzé, J.L.; Ducos, F.; Sinyuk, A.; Lopatin, A. Statistically optimized inversion algorithm for enhanced retrieval of aerosol properties from spectral multi-angle polarimetric satellite observations. Atmos. Meas. Tech. 2011, 4, 975–1018. [Google Scholar] [CrossRef]
- Cheng, T.; Gu, X.; Xie, D.; Li, Z.; Yu, T.; Chen, H. Aerosol optical depth and fine-mode fraction retrieval over East Asia using multi-angular total and polarized remote sensing. Atmos. Meas. Tech. 2012, 5, 501–551. [Google Scholar] [CrossRef]
- Wang, Z.T.; Chen, L.F.; Li, Q.; Li, S.S.; Jiang, Z.; Wang, Z.F. Retrieval of Aerosol Size Distribution from Multi-angle Polarized Measurements Assisted by Intensity Measurements over East China. Remote Sens. Environ. 2012, 124, 679–688. [Google Scholar] [CrossRef]
- Russell, P.B.; Kacenelenbogen, M.; Livingston, J.M.; Hasekamp, O.P.; Burton, S.P.; Schuster, G.L.; Johnson, M.S.; Knobelspiesse, K.D.; Redemann, J.; Ramachandran, S.; et al. A multiparameter aerosol classification method and its application to retrievals from spaceborne polarimetry. J. Geophys. Res. Atmos. 2014, 119, 9838–9863. [Google Scholar] [CrossRef]
- Fu, G.; Hasekamp, O. Retrieval of aerosol microphysical and optical properties over land using a multimode approach. Atmos. Meas. Tech. 2018, 11, 6627–6650. [Google Scholar] [CrossRef]
- Ge, B.; Mei, X.; Li, Z.; Hou, W.Z.; Xie, Y.S.; Zhang, Y.; Xu, H.; Li, K.T.; Wei, Y.Y. An improved algorithm for retrieving high resolution fine-mode aerosol based on polarized satellite data: Application and validation for POLDER-3. Remote Sens. Environ. 2020, 247, 111894. [Google Scholar] [CrossRef]
- Lyapustin, A.; Martonchik, J.; Wang, Y.; Laszlo, I.; Korkin, S. Multi-Angle Implementation of Atmospheric Correction (MAIAC): Part 1. Radiative Transfer Basis and Look-Up Tables. J. Geophys. Res. 2011, 116, D03210. [Google Scholar]
- Lyapustin, A.; Wang, Y.; Laszlo, I.; Kahn, R.; Korkin, S.; Remer, L.; Levy, R.; Reid, J.S. MultiAngle Implementation of Atmospheric Correction (MAIAC): Part 2. Aerosol Algorithm. J. Geophys. Res. 2011, 116, D03211. [Google Scholar] [CrossRef]
- Wang, Z.T.; Li, Q.; Tao, J.H.; Li, S.S.; Wang, Q.; Chen, L.F. Monitoring of aerosol optical depth over land surface using CCD camera on HJ-1 satellite. China Environ. Sci. 2009, 29, 902–907. [Google Scholar]
- Sun, L.; Wei, J.; Bilal, M.; Tian, X.P.; Jia, C.; Guo, Y.M.; Mi, X.T. Aerosol Optical Depth Retrieval over Bright Areas Using Landsat 8 OLI Images. Remote Sens. 2016, 8, 23. [Google Scholar] [CrossRef]
- Sun, K.; Chen, X.L.; Zhu, Z.M.; Zhang, T.H. High Resolution Aerosol Optical Depth Retrieval Using Gaofen-1 WFV Camera Data. Remote Sens. 2017, 9, 89. [Google Scholar] [CrossRef]
- Bao, F.W.; Gu, X.F.; Cheng, T.H.; Wang, Y.; Guo, H.; Chen, H.; Wei, X.; Xiang, K.S.; Li, Y.N. High-Spatial-Resolution Aerosol Optical Properties Retrieval Algorithm Using Chinese High-Resolution Earth Observation Satellite I. IEEE Trans. Geosci. Remote Sens. 2016, 54, 5544–5552. [Google Scholar] [CrossRef]
- Vermote, E.; Justice, C.; Claverie, M.; Franch, B. Preliminary analysis of the performance of the Landsat 8/OLI land surface reflectance product. Remote Sens. Environ. 2016, 185, 46–56. [Google Scholar] [CrossRef]
- von Hoyningen-Huene, W.; Freitag, M.; Burrows, J.B. Retrieval of aerosol optical thickness over land surfaces from top-of-atmosphere radiance. J. Geophys. Res. 2003, 108, 4260. [Google Scholar] [CrossRef]
- Yang, J.; Dong, C.H.; Lu, N.M.; Yang, Z.D.; Shi, J.M.; Zhang, P.; Liu, Y.J.; Cai, B. FY-3A: The New Generation Polar-Orbiting Meteorological Satellite China. Acta Meteorol. Sin. 2009, 67, 501–509. [Google Scholar]
- Yang, Z.D.; Lu, N.M.; Shi, J.M.; Zhang, P.; Dong, C.H.; Yang, J. Overview FY-3Payload Ground Application System. Meteorol. Sci. Technol. 2013, 4, 6–12. [Google Scholar]
- Levy, R.; Mattoo, S.; Munchak, L.; Remer, L.; Sayer, A.M.; Patadia, F.; Hsu, N.C. The Collection 6 MODIS aerosol products over land and ocean. Atmos. Meas. Tech. 2013, 6, 2989–3034. [Google Scholar] [CrossRef]
- Tanré, D.; Herman, M.; Deschamps, P.Y.; de Leffe, A. Atmospheric modeling for space measurements of ground reflectances, including bidirectional properties. Appl. Opt. 1979, 18, 3587–3594. [Google Scholar] [CrossRef]
- Kotchenova, S.Y.; Vermote, E.F.; Matarrese, R.; Klemm, F.J. Validation of a Vector Version of the 6S Radiative Transfer Code for Atmospheric Correction of Satellite Data. Part I: Path radiance. Appl. Opt. 2006, 45, 6762–6774. [Google Scholar] [CrossRef] [PubMed]
- Han, J.; Yang, L.K.; Xie, Y.J.; Liang, H.Y. Cloud detection on HJ-1B data based on multispectral analysis. Sci. Surv. Mapp. 2013, 38, 150–152. [Google Scholar]
- Wei, P.; Li, Z.Q.; Wang, Y.; Xie, Y.S.; Zhang, Y.; Xu, H. Remote sensing estimation of aerosol composition and radiative effects in haze days. J. Remote Sens. 2013, 17, 1021–1031. [Google Scholar]
- Tang, Y.M.; Deng, R.R.; Xu, M.D.; Wu, Y. Diurnal characteristics of autumn ASD-aerosols over Guangzhou. Acta Entiarum Nat. Univ. Sunyatseni 2019, 58, 58–67. [Google Scholar]
- Xu, M.D.; Deng, R.R.; Qin, Y.; Liang, Y.H.; Tang, Y.M. Analysis of Clear-Sky Aerosol Optical Properties and Source Characteristics in Guangzhou. Remote Sens. Technol. Appl. 2019, 34, 424–434. [Google Scholar]
- Hess, M.; Kocpke, P.; Schult, I. Optical Properties of Aerosols and Clouds: The Software Package OPAC. Bull. Am. Meteorol. Soc. 1998, 79, 831–844. [Google Scholar] [CrossRef]


Publisher’s Note: MDPI stays neutral with regard to jurisdictional claims in published maps and institutional affiliations. |
© 2021 by the authors. Licensee MDPI, Basel, Switzerland. This article is an open access article distributed under the terms and conditions of the Creative Commons Attribution (CC BY) license (http://creativecommons.org/licenses/by/4.0/).