1. Introduction
Geophysical exploration has played a vital role in mineral exploration, engineering geological survey, environment investigation, tectonic geology, and archaeological research. In China, with the vast lands and the rapid development of economy, ground-based geophysical exploration is getting more and more difficult to meet the requirements of energy and mineral explorations for its low efficiency and limited access caused by terrible terrain and traffic [
1,
2]. Airborne geophysical exploration has become an important tool to quickly investigate large-scale subsurface with lower time and economic costs in remote, uninhabitable areas [
3].
Airborne electromagnetics (AEM) is one of the most widely used airborne geophysical explorations, especially in groundwater and geotechnical studies [
4]. With instruments on an aircraft, it transmits electromagnetic waves and receives the electromagnetic signals from the earth by coils to detect the subsurface target body. There are two types of AEM methods: frequency-domain method (AFEM) and time-domain method (ATEM). The AFEM method provides high resolution at shallower depths, while the ATEM method is more suitable for large coverage areas and deeper exploration depths [
5]. Major AEM systems in the world basically come from a few companies [
2,
4]. These companies developed many AEM systems and successfully applied in in mineral exploration [
6,
7], groundwater study [
8,
9], engineering geology [
10], and environment investigations [
11] of shallow subsurface. The most commonly used AFEM systems include IMPULE from Geotech, and DIGHEM and RESOLVE from CGG. Major ATEM systems include TEMPEST from CGG, SkyTEM series from SkyTEM Surveys, and AeroTEM and VTEM series from Geotech. These systems were designed and developed with different features for focusing on different concerns.
The processing and interpretation of AEM data is more complex than ground EM data because of the large data volume, variation of flight height, and attitude changes of aircraft. As the 1D inversion and some processing technologies have matured, some commercial software were developed and applied in AEM surveys, such as Geosoft Oasis Montaj [
12], Aarhus Workbench [
13], and Maxwell from EMIT [
14] and so on. With the development of computer and technology, 3D and Quasi-3D inversion are gradually applied to AEM explorations [
15,
16,
17], and the machine learning has also shown a good effect on data processing [
18,
19,
20].
Since the airborne electromagnetic technology was imported into China, it has brought great promotion for China’s geophysical exploration [
2]. AEM’s early applications mainly focused on mineral exploration in Heilongjiang Province, Hubei Province, and Xinjiang Uygur Autonomous Region [
21,
22]. Now it gradually applied to environment, groundwater and engineering investigations [
23,
24,
25]. In recent decades, China constantly impel the research and development of AEM system. Some systems are under testing, and they are continuously improved before they are mature enough to be used in surveys.
In this paper, a successful case is presented to illustrate the effectiveness of AEM on mineral exploration in China. In 2016, China Aero Geophysical Survey & Remote Sensing Center for Natural Resources (AGRS) led a comprehensive geophysical survey at Baishiquan–Hongliujing area which locates at the border of Xinjiang Uygur Autonomous Region and Gansu Province, the Northwest China. With an integrated system, about 3149 line-km of both AEM and aeromagnetic data with 250 m line space were recorded simultaneously. The AEM data were acquired by the AeroTEM-IV system, which is a time-domain system imported from Canada. The aeromagnetic data were acquired by an optically pumped cesium vapor magnetometer (Scintrex CS3). The AeroTEM-IV system is used to reveal electrical conductivities within the upper several hundred meters of the subsurface, and the airborne magnetic system helps to distinguish magnetic rocks. Simple techniques were used in AEM data processing, such as filtering, correction, stacking, and one-dimensional inversions. Magnetic data are processed through reduction to pole, derivative calculation and the continuation. On these bases, a comprehensive interpretation of resistivity and magnetic anomalies is carried out to outline the possible ore deposits. A total of 39 new anomalies in AEM data were outlined, and then ground investigations were implemented to verify these anomalies, including trenching and sample collection.
Through the ground investigations, seven outlined anomalies are consistent with the known ore sites, and one new gold ore was determined. The prospective reserves of gold are expected to exceed 10 tons. Several mineralization clues were also found, and some prospecting target areas are outlined as the possible locations of copper–nickel deposits. The successful exploration shows airborne electromagnetic method is effective in finding metal mineral resources, and can provide support for solving the regional basic geological problems.
2. Survey Area
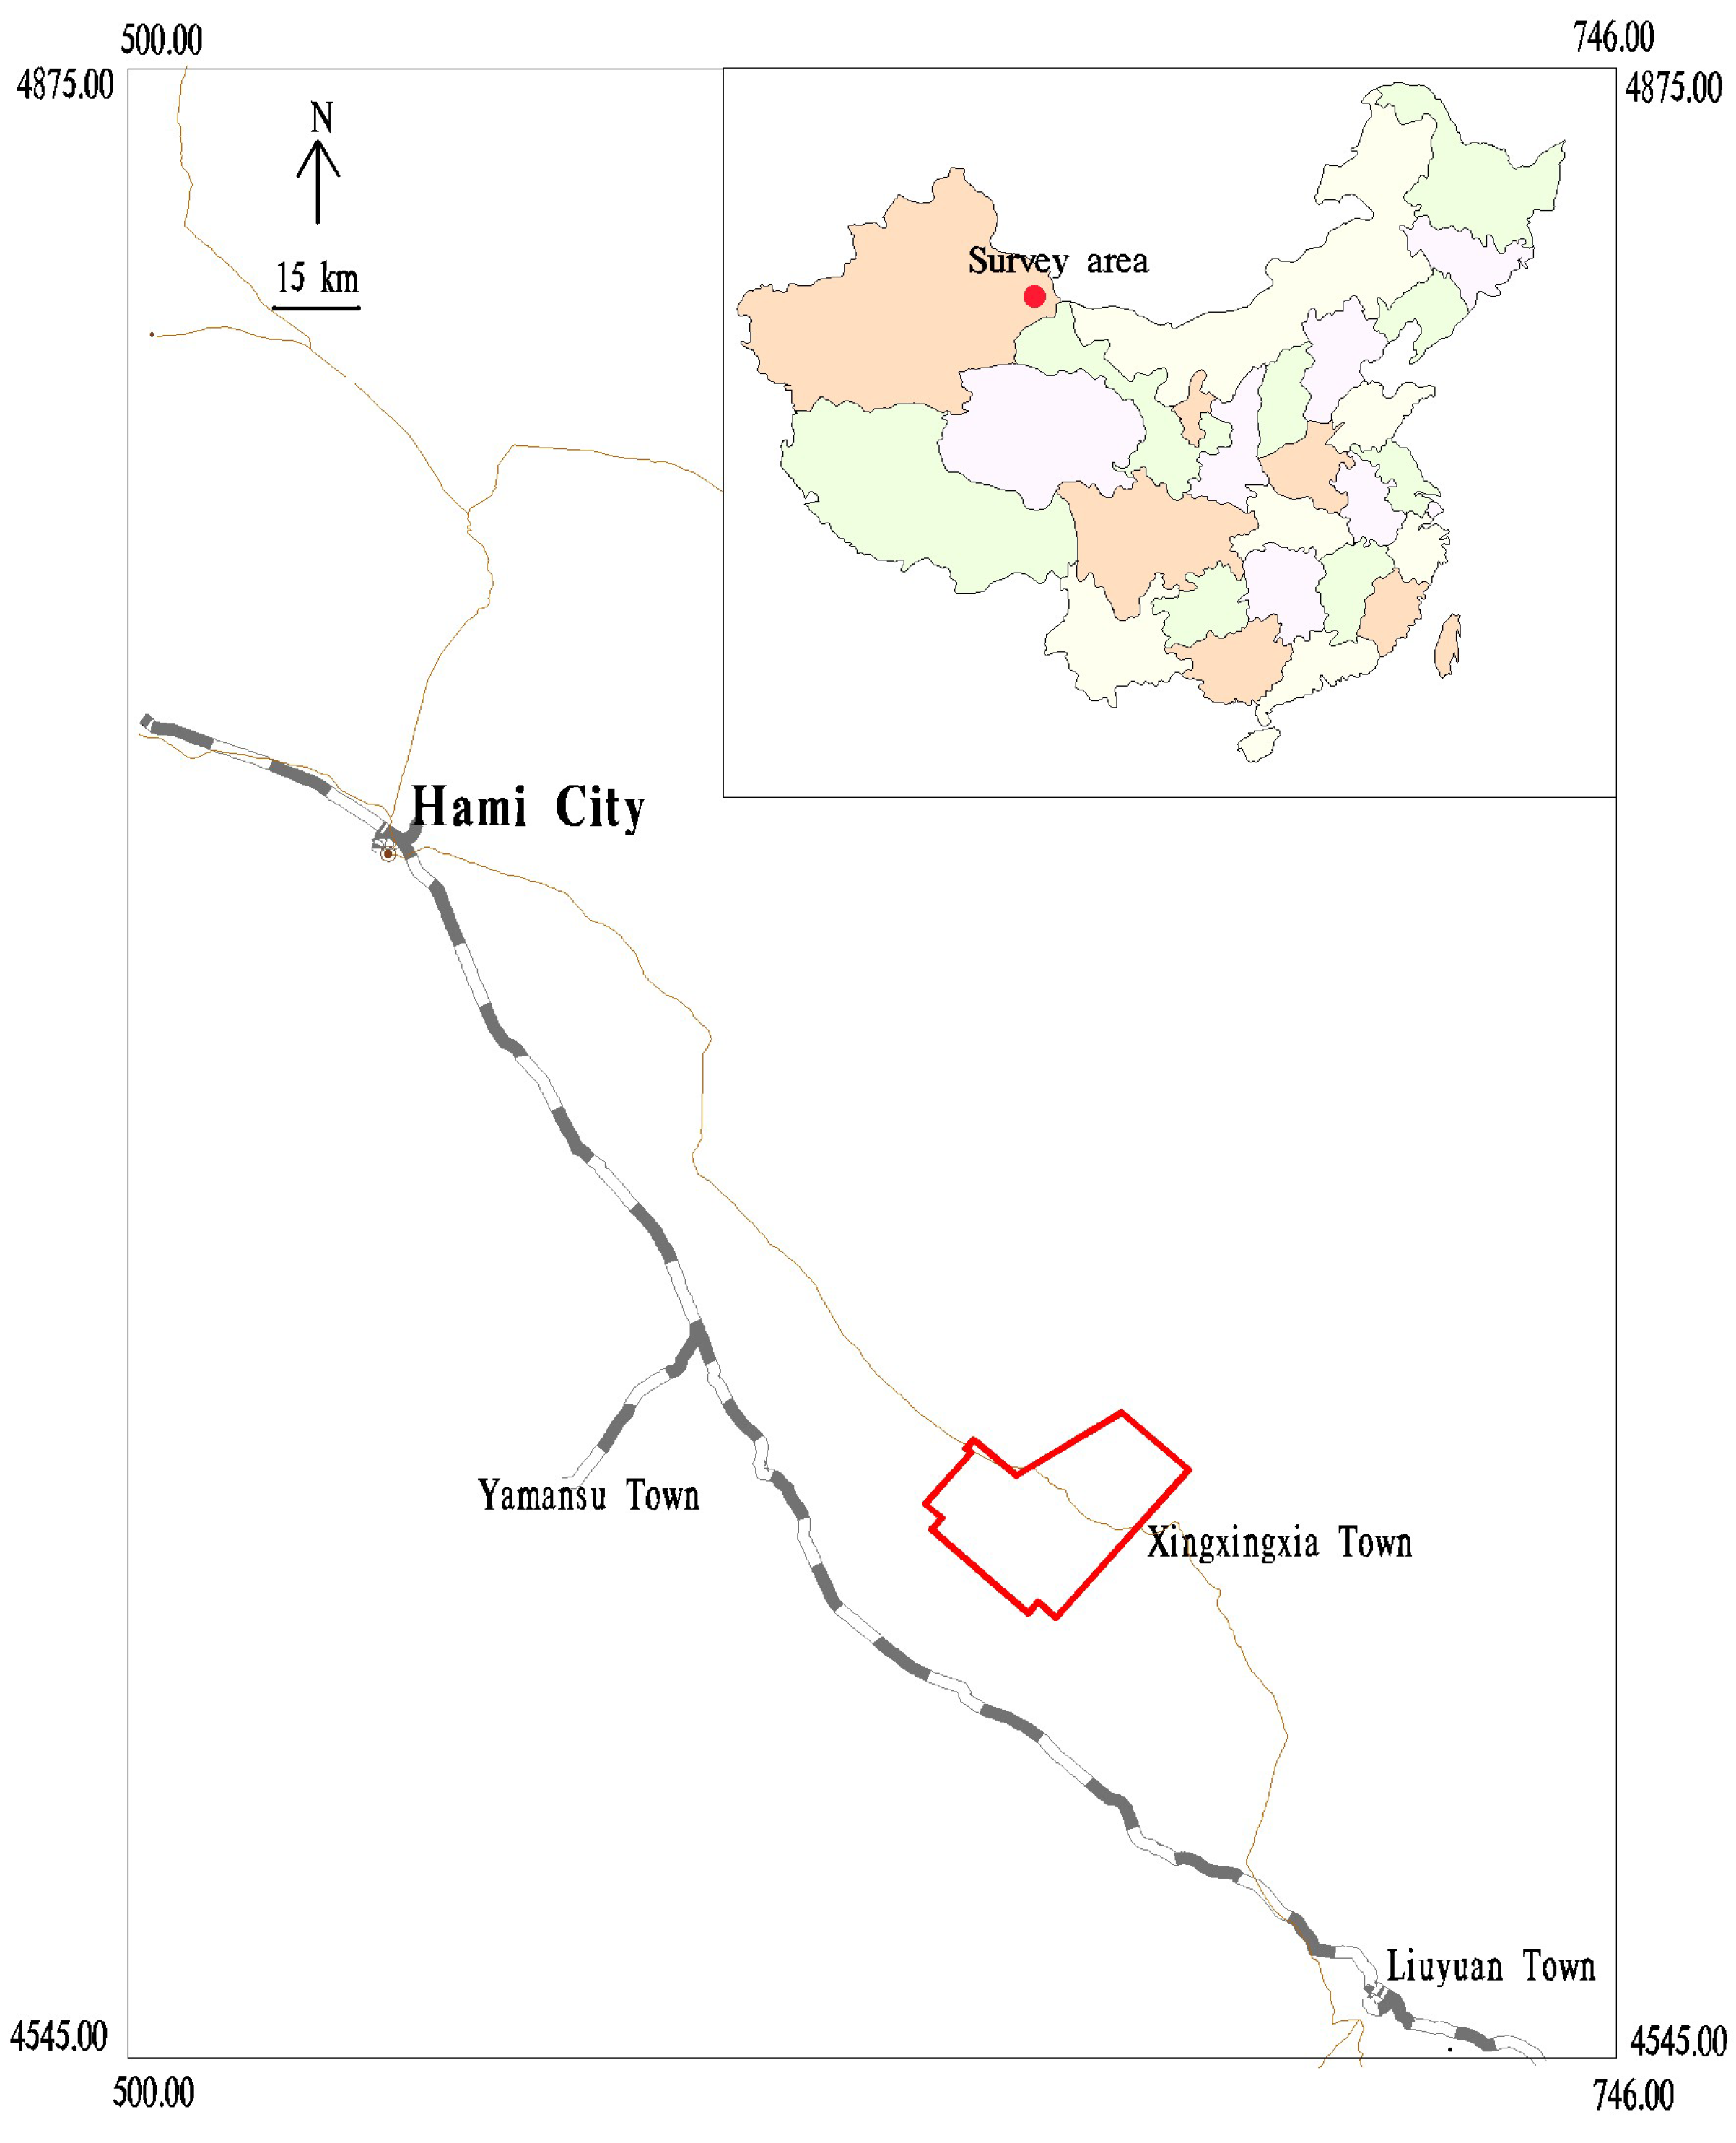
The Baishiquan–Hongliujing area is located in Hami City, Xinjiang Uygur Autonomous Region, which is circled by red box in
Figure 1. The survey area covers an area of about 700 km
2, and is underlain by Proterozoic metamorphic rocks [
26]. Baishiquan is a magmatic Cu-Ni deposit in the southern Central Asian Orogenic Belt (CAOB), located in the northern margin of the Central Tianshan Terrane and to the south of the Shaquanzi Fault [
27]. The CAOB is the largest Late Paleozoic juvenile orogenic belt in the world, and Late Paleozoic magmatism in Baishiquan resulted from paleo-Asian ocean closure, collision of multiple continents and post-collisional extension [
28]. As a result, intrusive rocks are developed well in this area, including gneissic granite, diorite, minor granite, and mafic–ultramafic rocks [
29].
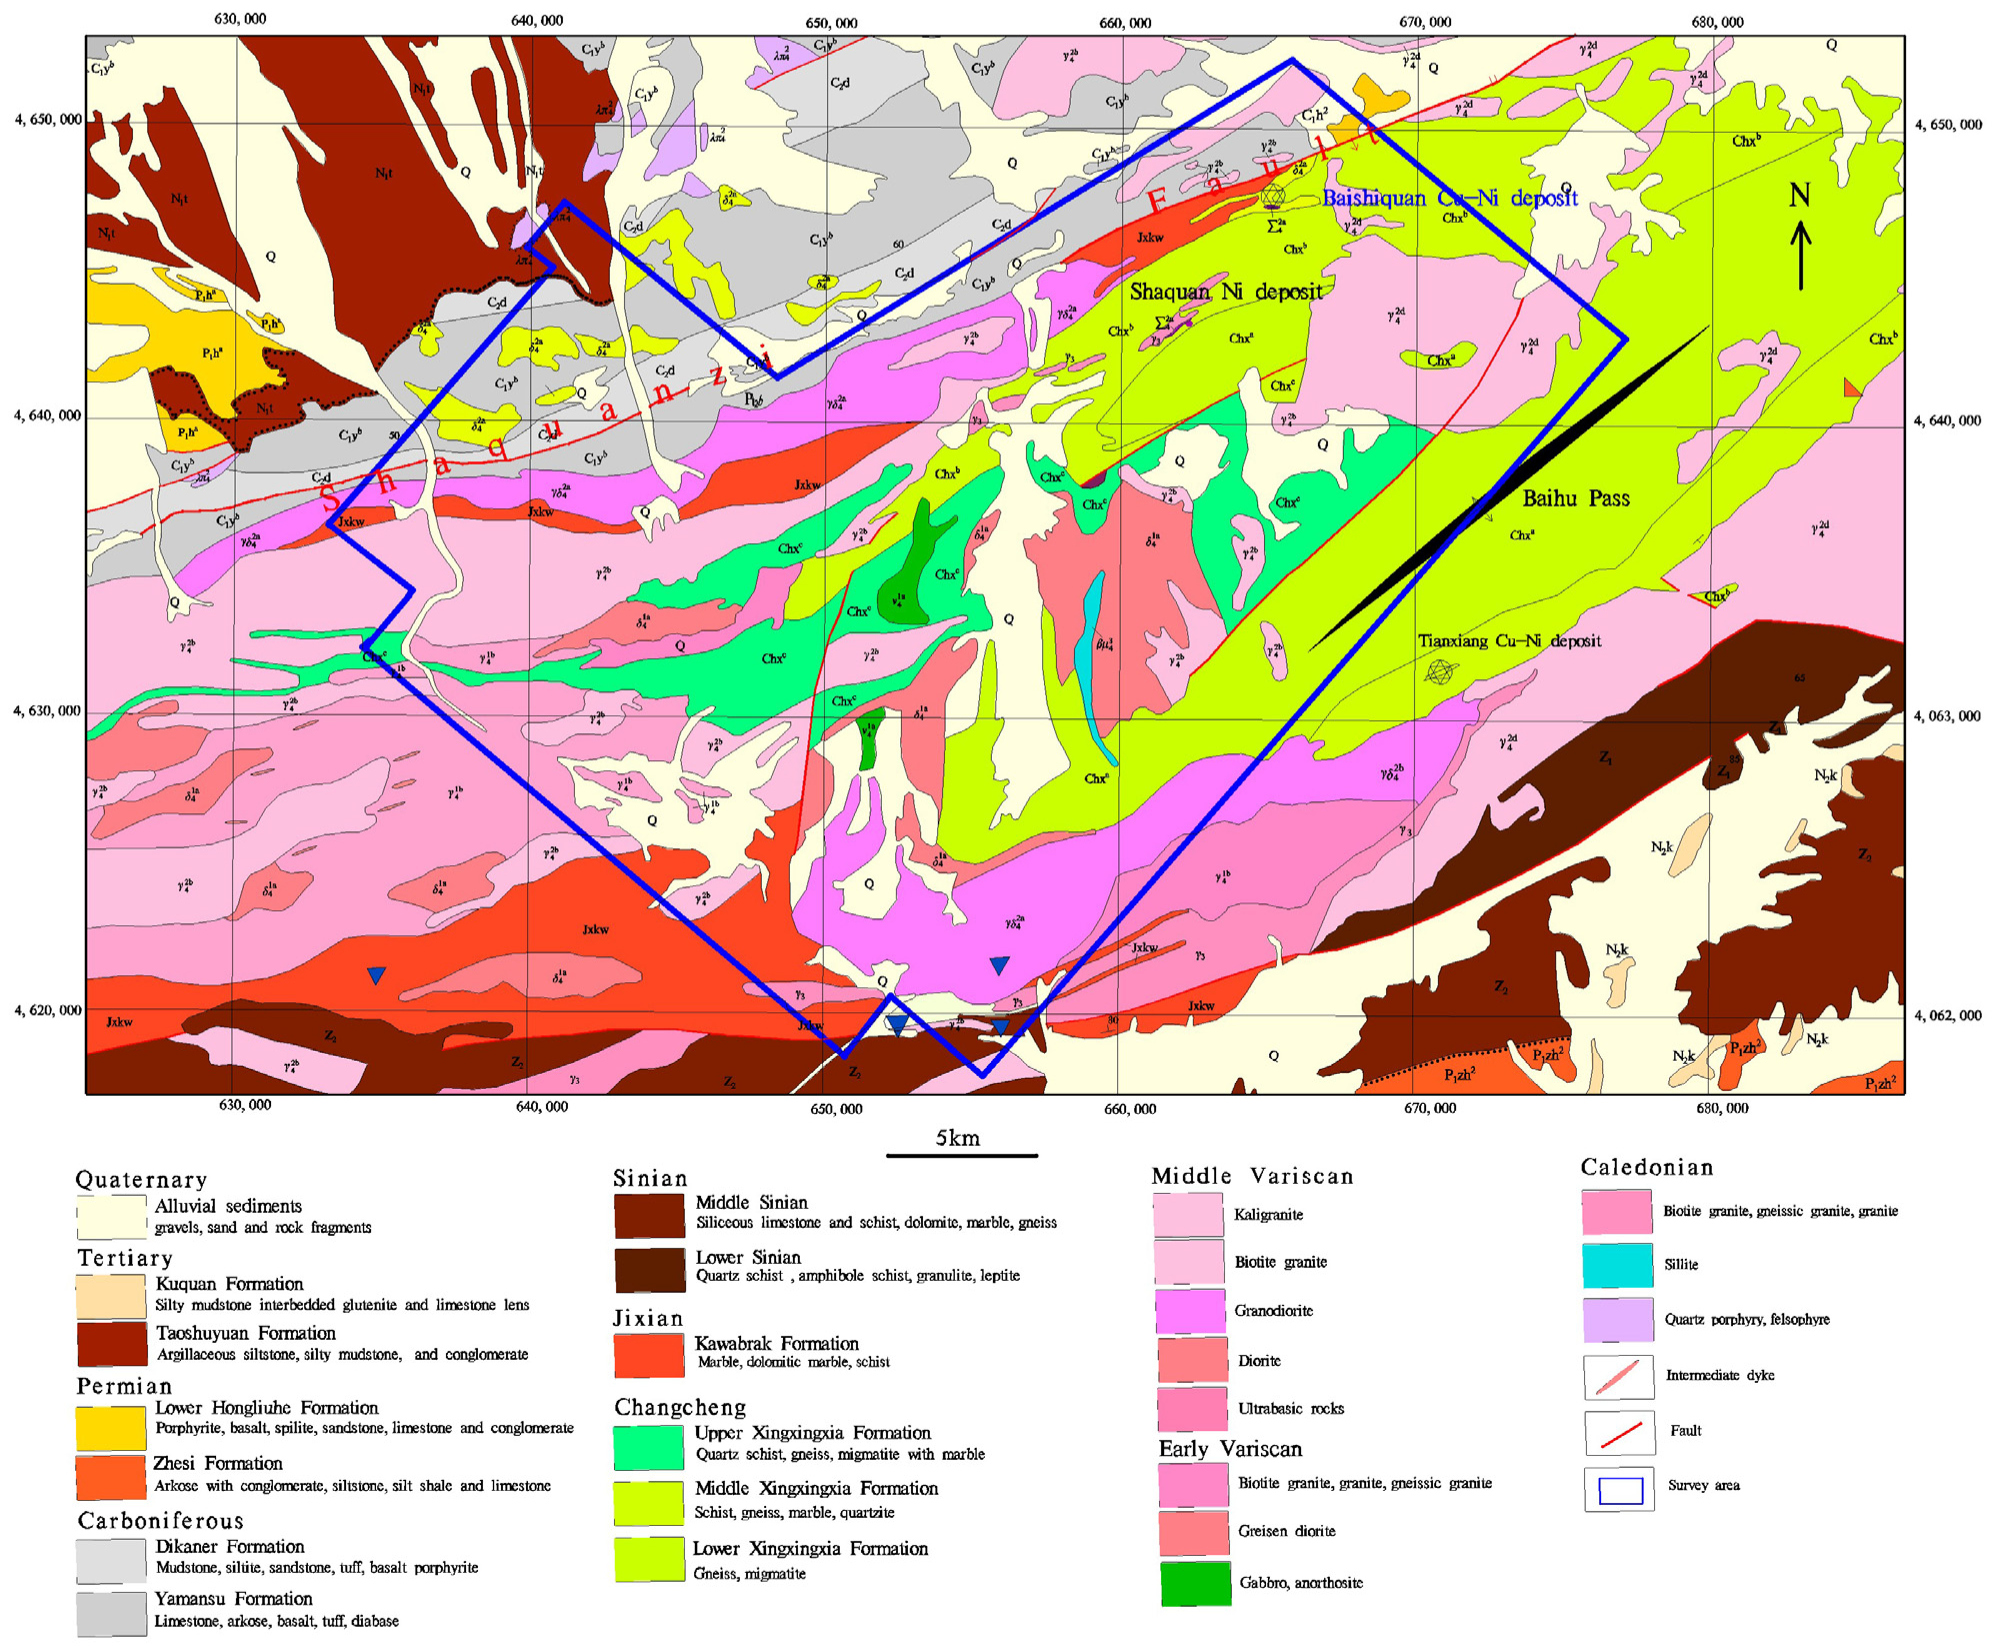
The main structure in the ore district is the Shaquanzi deep fracture and its subsidiary structures (
Figure 2) [
26]. The Baishiquan mafic–ultramafic intrusions intrude the Mesoproterozoic metamorphic sequences of the Xingxingxia Formation and Kawabulak Formation, and strike NEE along the regional Shaquanzi fault [
30]. Most orebodies occur as bands and dykes in olivine websterite and lherzolite [
31]. Ores are mainly disseminated and net-textured sulfide ores. The dominant sulfides are chalcopyrite, pentlandite, pyrrhotite, pyrite, and chalcocite [
32]. Mineralized olivine websterite has commonly undergone chlorite, and magnetite alteration. The outcrop of the largest ultramafic intrusion is approximately circular and about 0.018 km
2 [
33,
34]. The main lithofacies are olivine websterite and lherzolite, both of which host the Ni-Cu sulfide orebody [
35,
36].
Detailed geological surveys of the survey area and surrounding areas began in the 1960s. In geological surveys from 1965 to 1977, the stratigraphy, structure, magmatic rocks and mineral resources in the area are systematically divided and described. Since the 1980s, the eastern Tianshan area was regarded as the key area for ore prospecting, and a great deal of work has been done on the base of geology and metallogenic regularity of this area. Ground gravity and geochemical explorations were done to support the early mineral exploitation. After 2000, the induced polarization, magnetotelluric, and seismic methods were then implemented to detect nickel–copper bodies, and some deposits are found at that time [
26,
31].
As early as 1962, an aeromagnetic survey on a scale of 1:200,000 was carried out at the south of the survey area, which mainly aimed to detect chromite. Then in 1978, an aeromagnetic survey with a large scale was done at Shanshan-Hami area, east of the survey area. In this survey, some copper–nickel deposits related to ferromagnesian-ultramafic rocks were found [
37]. In 1997 and 2001, including aeromagnetic, AEM, and gamma-ray spectrometry, two integrated airborne geophysical surveys were implemented at Hami–Tudun and Weiya areas, the east of the survey area [
26]. These two implemented surveys provided rich experience for comprehensive interpretation of airborne geophysical prospecting.
3. Data Acquisition
In 2016, AGRS of China Geological Survey issued the subproject “comprehensive research of helicopter TEM in Baishiquan–Hongliujing area”. The subproject aimed to study the metallogenic geological background of Baishiquan–Hongliujing area, and provide high quality airborne geophysical data and interpretation results for the mineral resources investigation and evaluation. The subtask “Helicopter TEM Survey in Baishiquan–Hongliujing Area” provided the support for airborne data acquisition. With a scale of 1:25,000, this survey obtains the latest aeromagnetic and AEM data in the area.
The aircraft used was an AS-350 B3 helicopter. The integrated system contained an AeroTEM-IV system, a TRA-3000 radio altimeter from FreeFlight Systems (located at Irving, TX, USA), a CS3 Cesium Vapor magnetometer, a DDS1 receiving recording system from Aeroquest, and two GPS from Hemisphere (located at Scottsdale, AZ, USA), as shown in
Figure 3. The DDS1 receiving recording system, including control, monitoring and storage instruments, were mounted in the cabin of helicopter. The radar altimeter was mounted at the belly. Electromagnetic and magnetic data were simultaneously recorded by a magnetic bird and an AeroTEM-IV bird, which were about 53 m below the helicopter and leaned back with an angle when measuring. Electromagnetic and magnetic data used the same positioning and auxiliary information recording system.
The electromagnetic system is the AeroTEM-IV time-domain towed-bird system developed by Aeroquest, Vancouver, BC, Canada (now taken over by Geotech). This portable system facilitates transport for it can be dismantled and re-assembled. The towed-bird is a rigid platform linked to the helicopter by a tow cable about 60 m long, which transmits triangular wave and receives both the X and Z components, including 16 on-time channels and 17 off-time channels [
37]. Electromagnetic field is induced by transient pulses in transmitter coil, and the subsequent decay responses from subsurface measured, which contain abundant information of subsurface medium. We used the time duration between 3.19127 to 18.80237 ms after transmitter turns off. A split-coil design is used for the z-component coil. Auxiliary data streams are recorded and correlated with the EM data using UTC time synchronization. The use of a triangular rather than a square waveform energizes lower decay time-constants in the subsurface, which makes high-conductance bodies easier to detect. The high primary field at the receiver location is removed with a bucking coil. The whole system is about 630 kg. Four base operating frequencies are available, including 25, 75, and 125 Hz. More details about the system, please see
Table 1. In our survey, 25 Hz was selected. The nominal ground clearance of the AEM bird was about 40 m. We use the peak-to-peak value of last three channels to evaluate the noise level, the whole area noise level is less than 40 nT/s, and the noise level changes very little between flights.
The employed magnetometer sensor was a Scintrex CS3 cesium vapor magnetometer with integrated GPS, which were installed in a bird attached to the tow cable about 20 m below the helicopter. Data logging and UTC time synchronization was carried out within the magnetometer, with the GPS providing the timing signal. Digital recording resolution was 0.001 nT. Besides that, a base cesium vapor magnetometer CH-7 was placed on a ground tripod in an area of low magnetic gradient and free of cultural noise sources. The sensitivity of the magnetometer is 0.01 nT at a 0.5 s sampling rate. A continuously updated values of the base sensor was displayed for regularly monitored to ensure acceptable data quality and diurnal variation.
From geological information, the main structures of the survey area run slightly from northeast to southwest. To ensure the survey line is perpendicular to the tectonic strike, the survey line direction is from northwest to southeast (130°/310°) with a line spacing of 250 m, the control (tie) lines flown perpendicular at 4000 m line spacing. The nominal ground clearance of the bird was about 40 m.
The operator is responsible for ensuring the instrument is properly warmed up prior to departure and that the instruments are operated properly throughout the flight. Besides that, the operator maintains a detailed flight log during the survey noting any unusual geophysical or topographic features. In every flight, a high elevation ‘background’ check would be done after takeoff and before landing to ensure the gain of the system remained constant and within specifications. If one flight takes too long, the high elevation ‘background’ check should be repeated at hourly intervals.
Before the survey, a refined flight was carried out over the copper–nickel deposit of west Baishiquan to check the AEM system performance in key mining areas. The AEM responses correspond well to the known deposit.
4. Data Processing
The raw data of airborne surveys contain lots of redundant information and noises. Therefore, before interpretation of subsurface structures, data should be processed to extract usable information. In-field and out-field processing are generally required in data processing of AEM and aeromagnetic data, where in-field processing aims to ensure data quality and compliance.
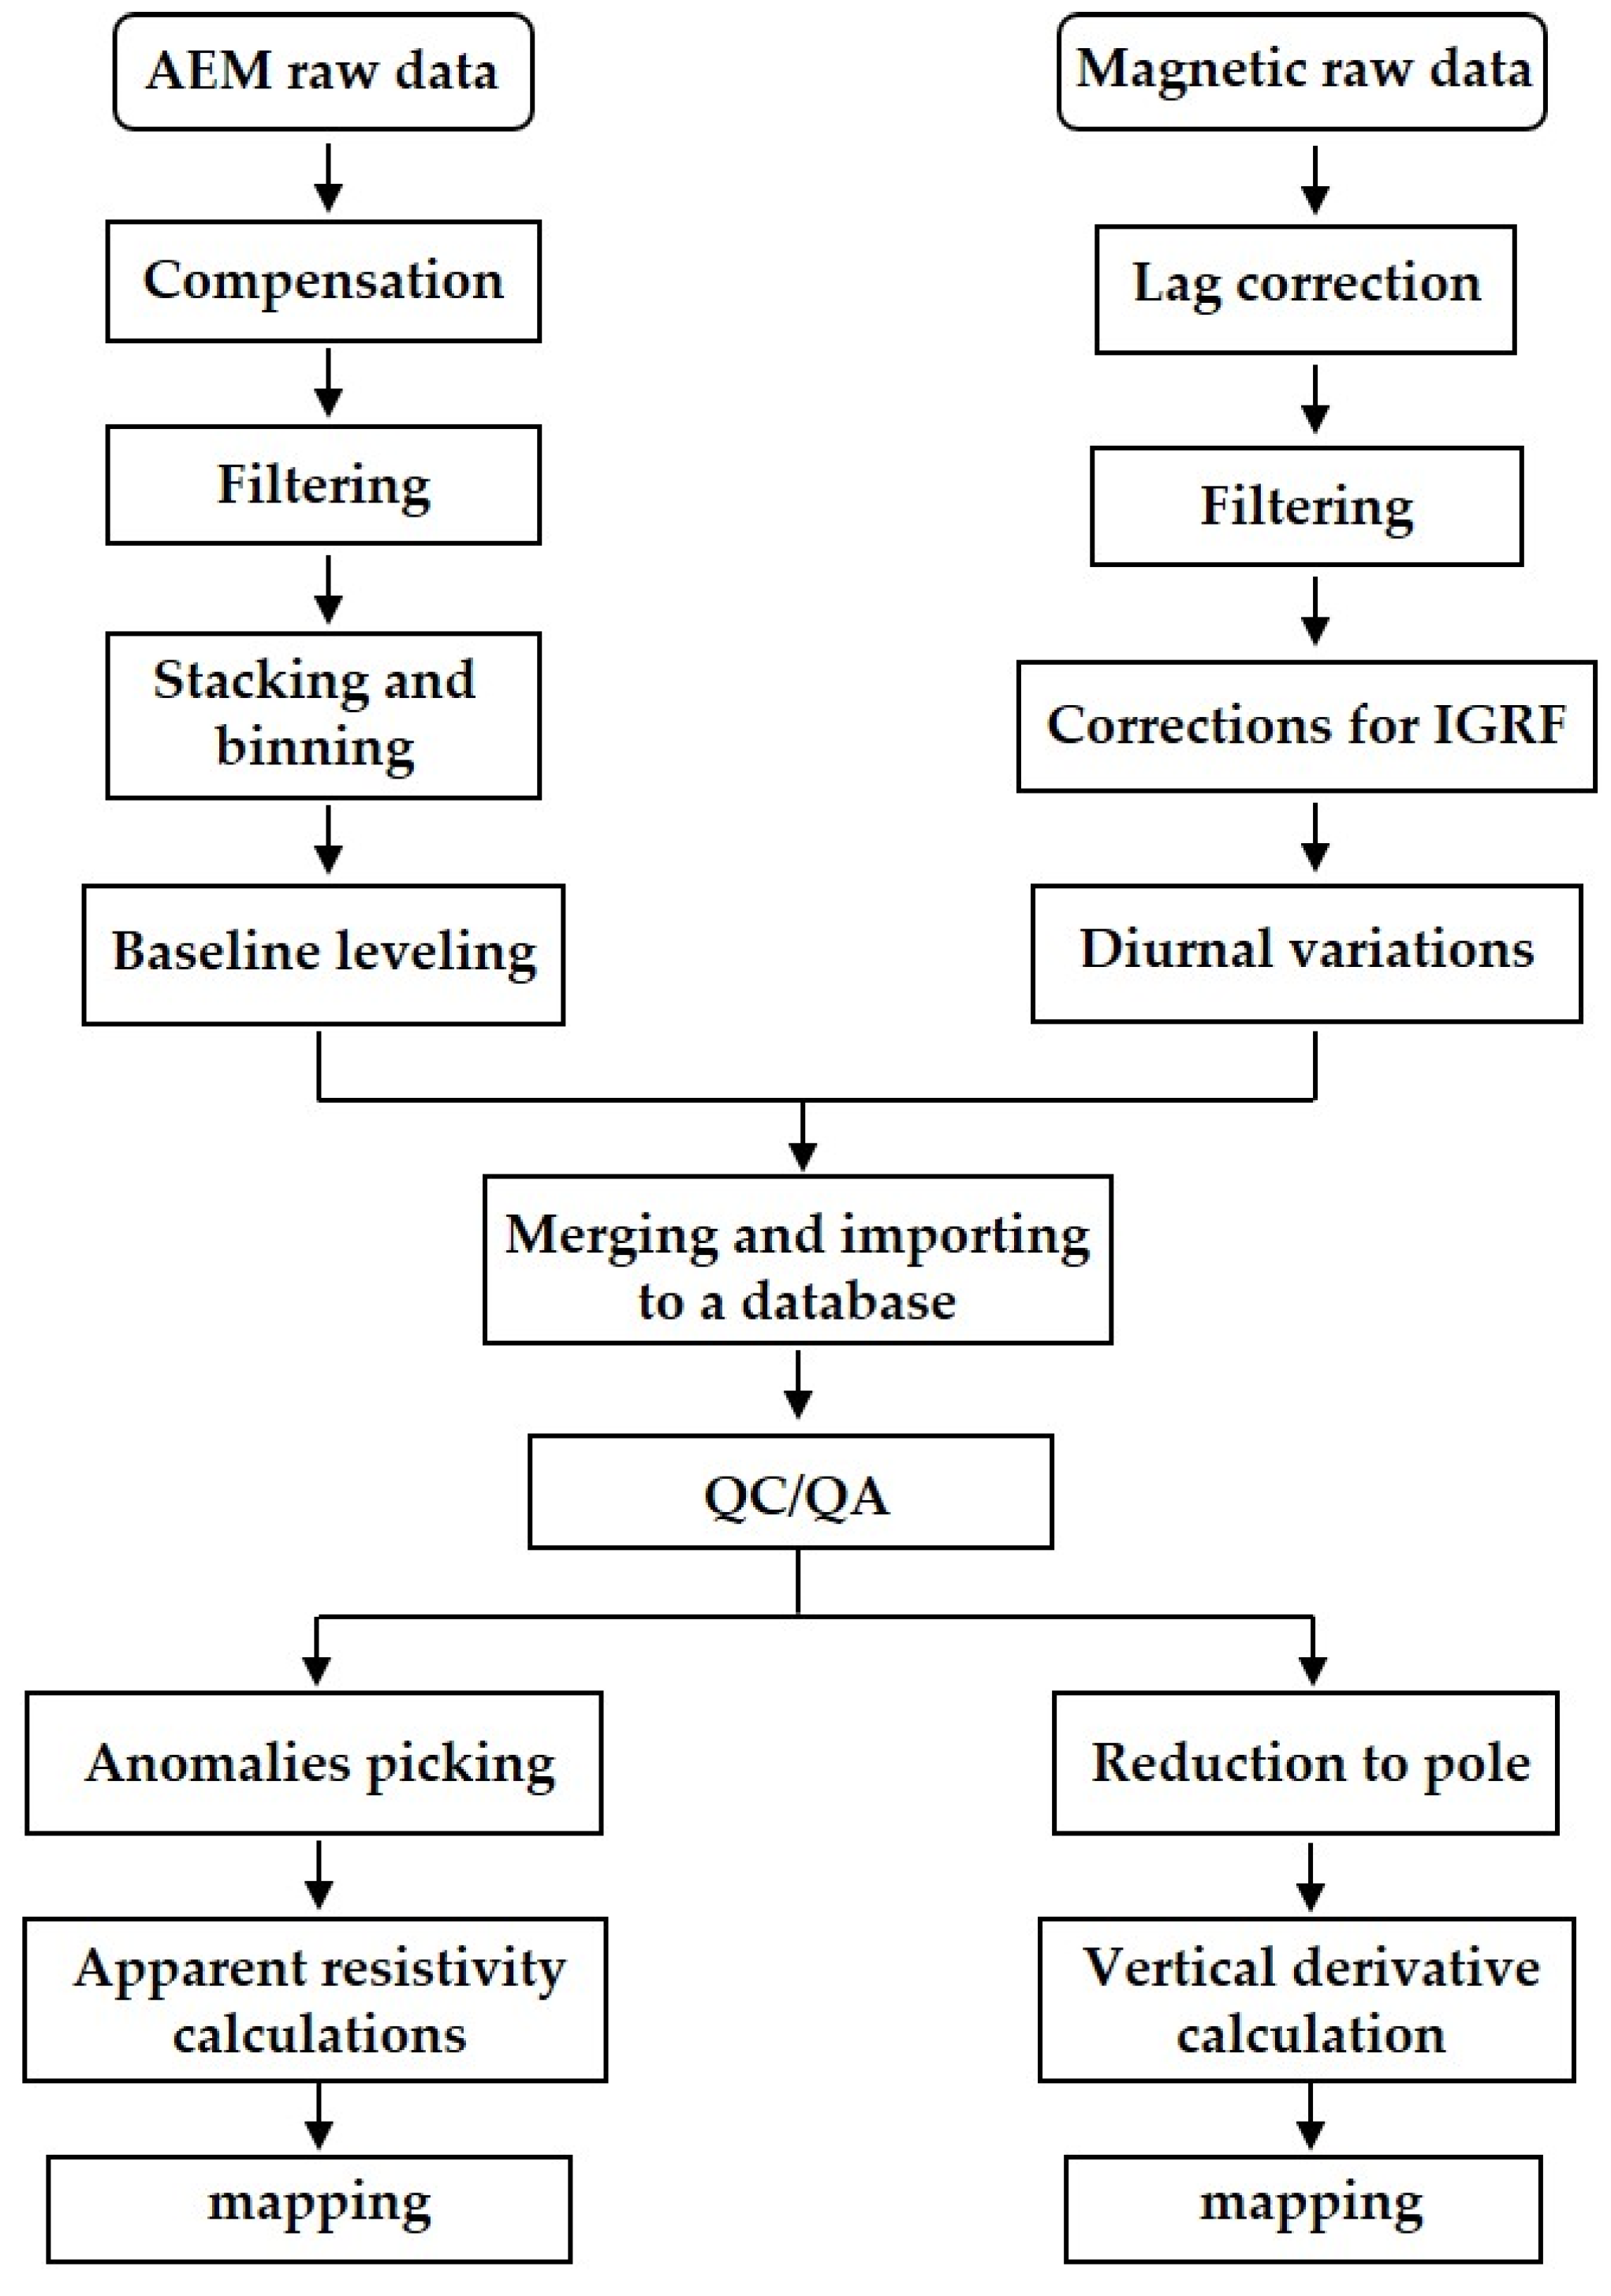
The signal acquired by the AeroTEM-IV system is the secondary field response signal of the underground medium. In-field processing of AEM data was carried out after each flight by using AEM processing software ‘ATP pro’ from Aeroquest in Vancouver, BC, Canada. It included compensation, stacking, filtering, baseline leveling, and merging. Baseline leveling is necessary, because temperature variations affect the system electronics. Level errors were detected and corrected by using the data from high elevation “background” check [
38]. In merging, all data would be merged to an ASCII format file, and then imported to a database for further QA/QC by Oasis Montaj from Geosoft Incorporated in Toronto, Canada and Geoprobe software from AGRS in Beijing, China. Geoprobe is a geophysical data processing software developed by AGRS, which was used for quality assessment, data statistics, and data processing.
Based on flight log, anthropogenic effects were detected and removed from the data in post-field data processing. The Conductivity Depth Imaging (CDI) was carried out on only part of lines by using software Maxwell, which converts the decay of electromagnetic field directly into apparent resistivity depending on depth. The final ATEM and magnetic database sampling rate is 10 Hz per second, we use 10 points stack before CDI. The method is fast because it does not require initialization model and iterative calculation. Although CDI is not as accurate as one-dimensional inversion, it is still widely used due to its advantages of computational speed and acceptable imaging accuracy.
Aeromagnetic data was mainly processed by software Geosoft Oasis Montaj. Aeromagnetic data measured by magnetometer is the total magnetic field including the superposition of the geomagnetic main field, local anomalies, and the diurnal variations. Geomagnetic main field and diurnal variations were removed using the International Geomagnetic Reference Field (IGRF) and base station data, respectively. The low-pass filtering was used to remove or minimize high frequency noise that cannot be sourced from the geology. Besides that, reduction to pole, vertical derivative calculation, and upward continuation were carried out on measured magnetic data. The reduction to pole was carried out to convert the oblique magnetization anomaly to the vertical magnetization anomaly, so that the location of abnormal field source can be determined more accurately. Upward continuation can separate the anomaly of the deeper geology from shallower geology. The vertical derivative is one of the filtering techniques used for the enhancement of the shallow source features in the data. In the survey area, the geomagnetic inclination is 62.274°, magnetic declination is 0.166°, and the geomagnetic main field is 57,550 nT. The magnetic data was upward continued to height of 500 m. Aeromagnetic data was imported into the database together with AEM data. The workflow of data processing is shown in
Figure 4.
5. Results
The pre-existing polymetallic deposits in the survey area and its surround areas generally have good electrical conductivity, and locate at the transition zone from high magnetic field to low magnetic field. Based on these characteristics, AEM and aeromagnetic surveys were carried out to search for more polymetallic deposits and provide geophysical data for basic geological research in the survey area.
5.1. Results of Magnetics and Electromagnetics
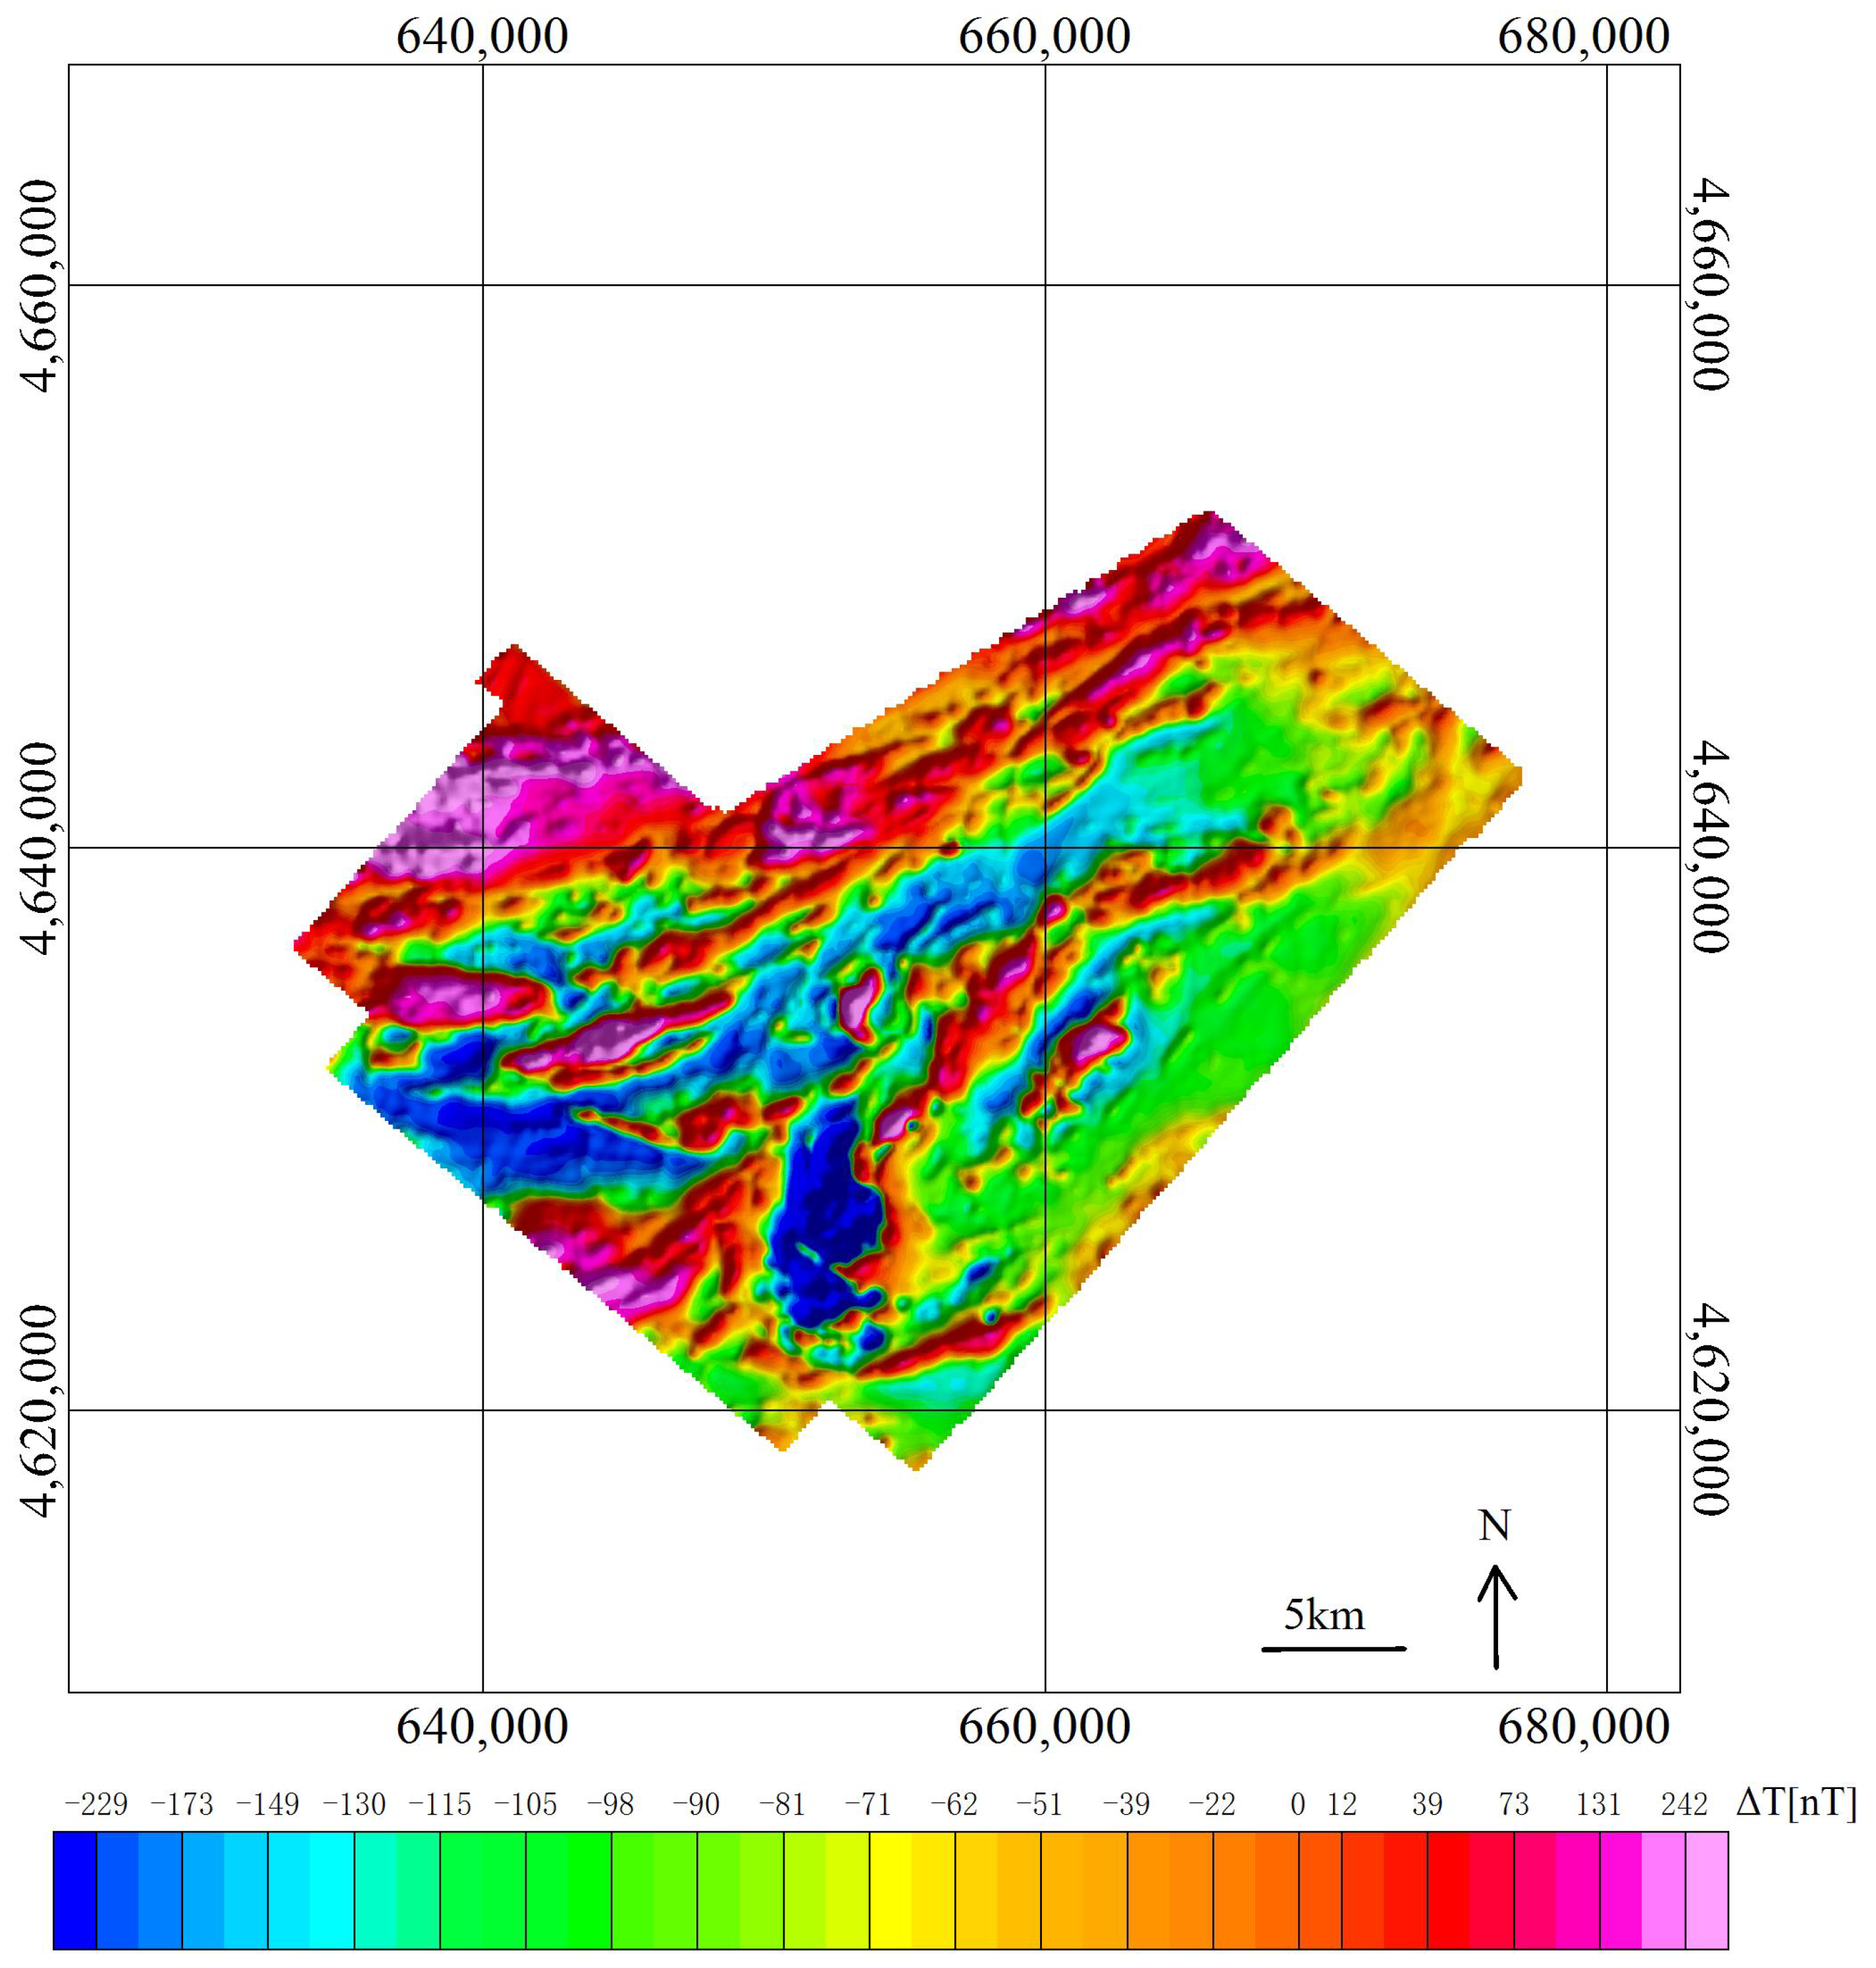
After data processing, anomalies of the magnetic field ∆T is presented in
Figure 5. It shows that magnetic field ∆T in the north is higher than it in the south. They are dominated by positive anomalies, and ∆T varies in a large range, which means both higher and lower magnetic field is distinct. The anomalies have good continuity, and the major axis direction of anomalies is NE-SW. The strike of anomalies are consistent with the main faults in survey area. Near the subsidiary fault of Shaquanzi, ∆T changes rapidly, and presents a striking contrast. These characteristics are considered to derive from that the Baishiquan mafic–ultramafic intrusions intruded the Mesoproterozoic metamorphic sequences of the Xingxingxia Formation and Kawabulak Formation, and strike NEE along the regional Shaquanzi fault.
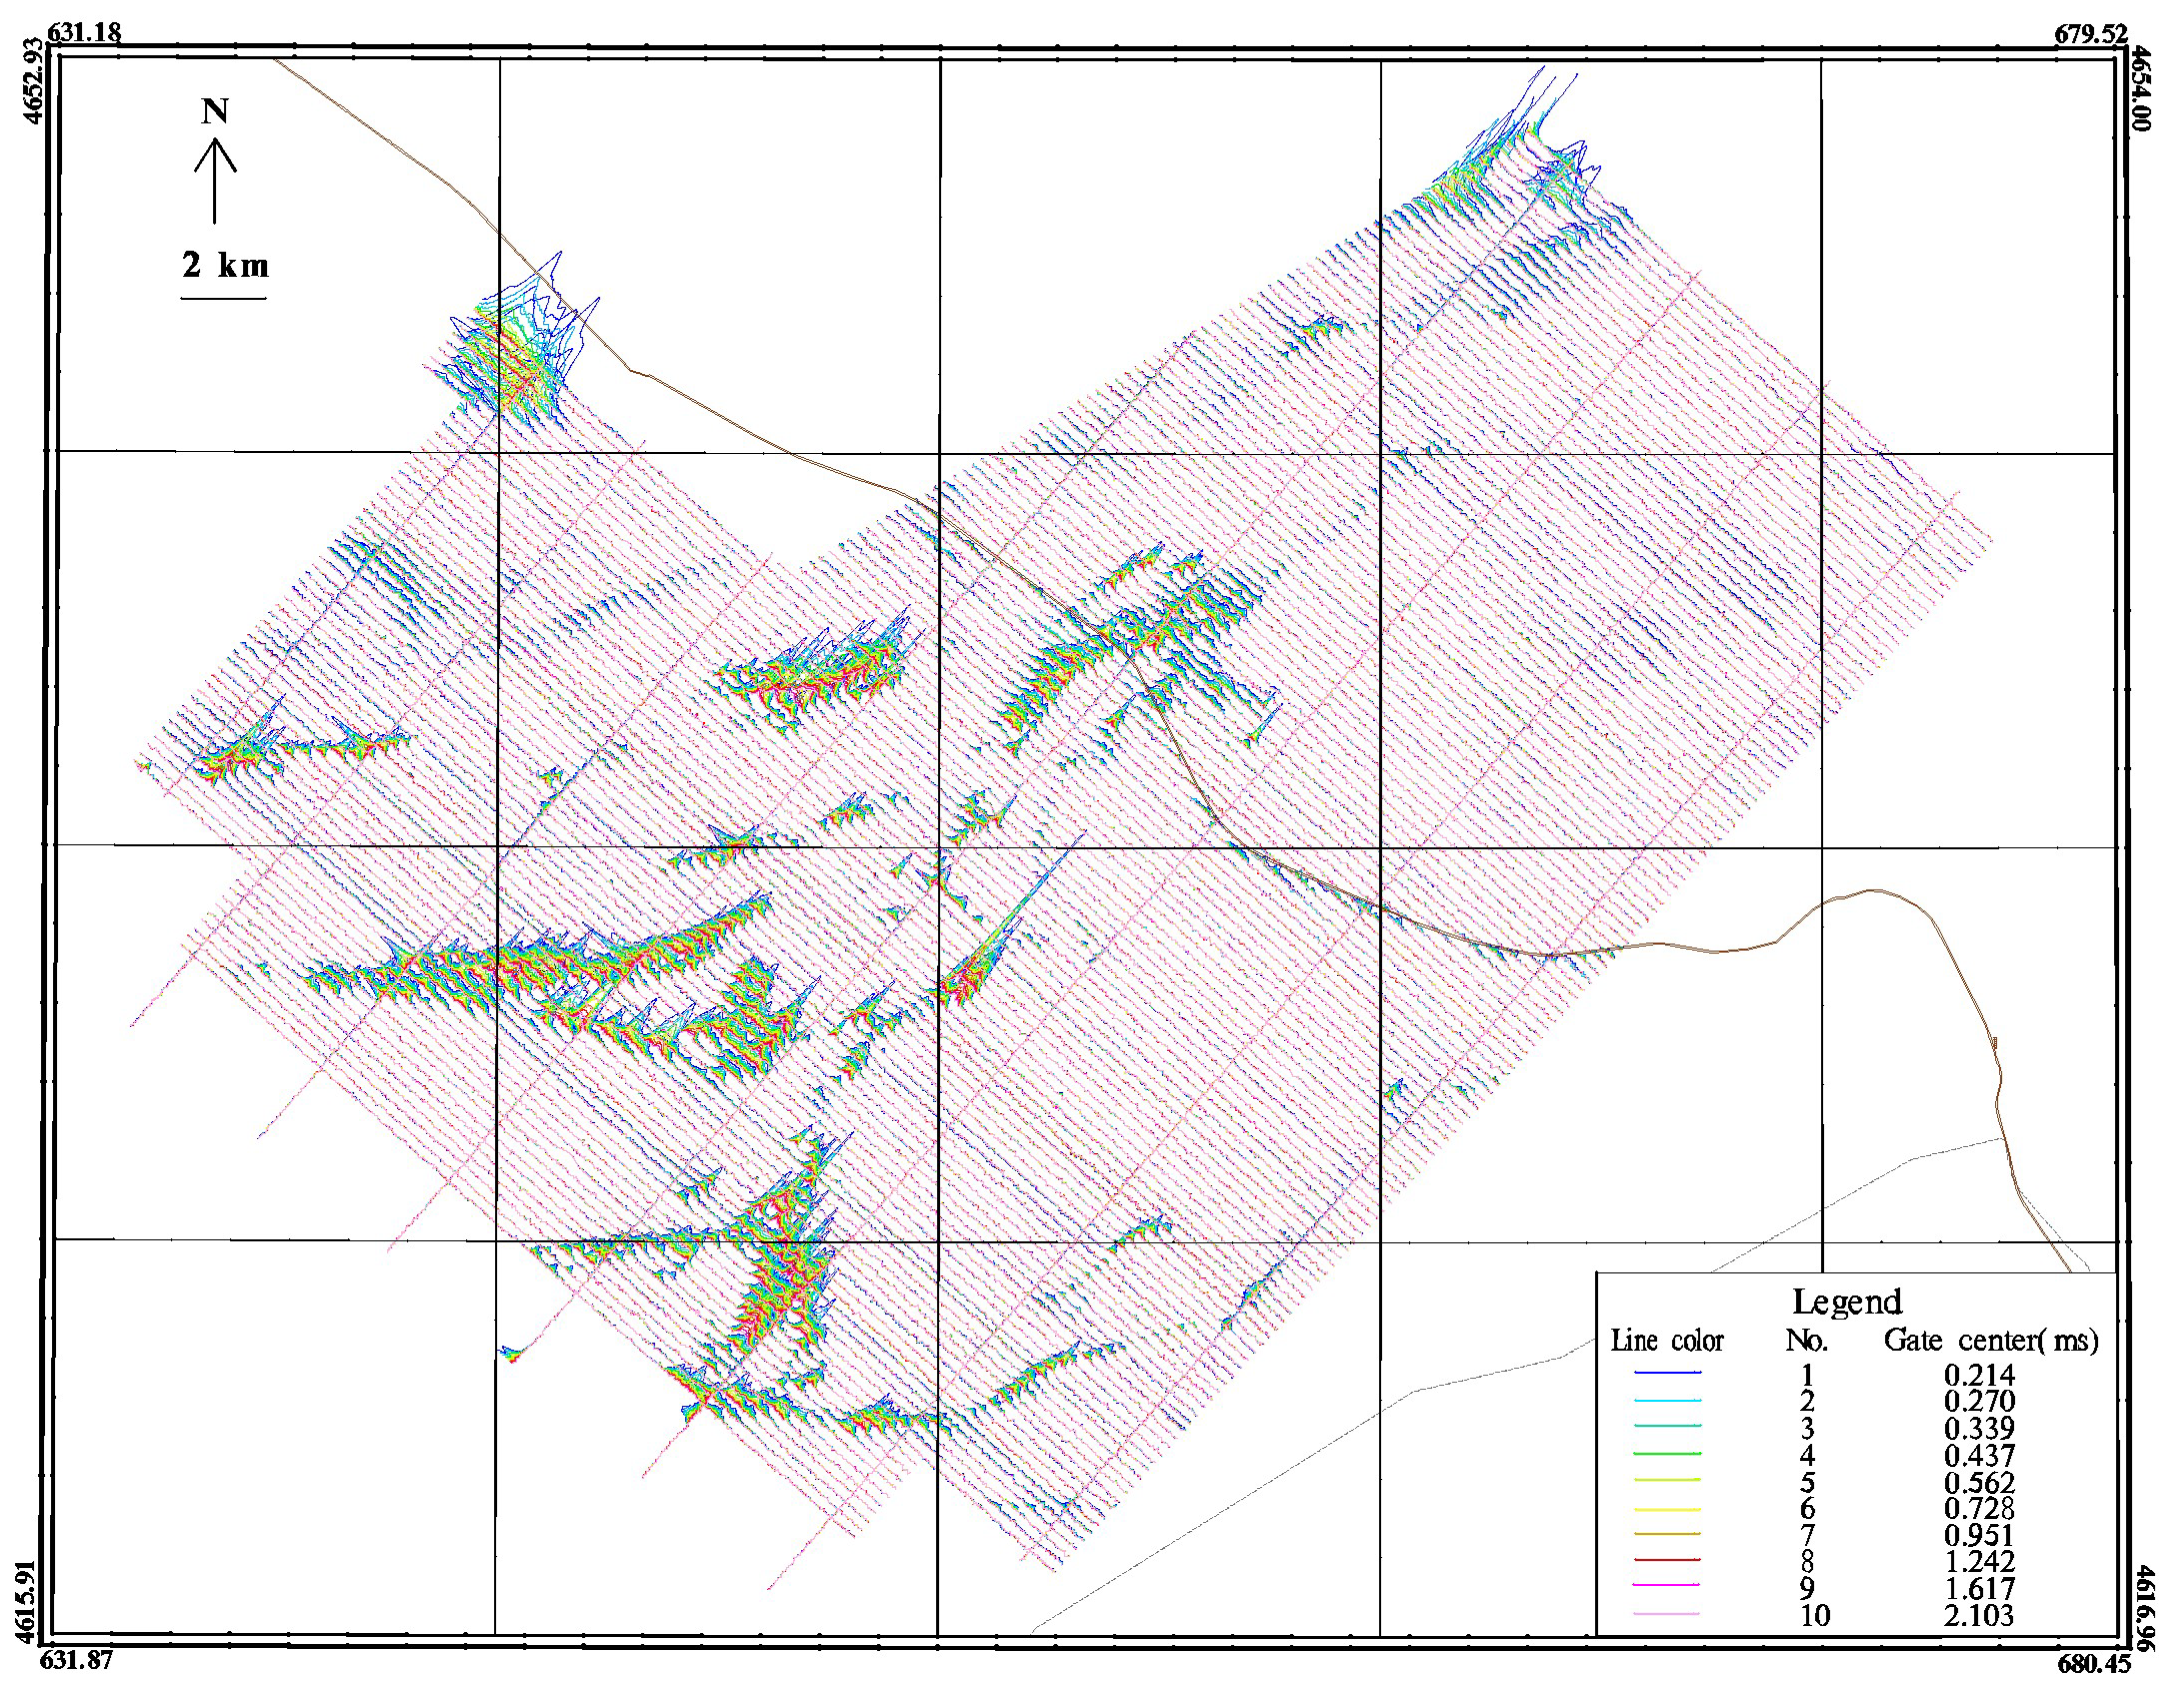
Figure 6 displays the decay profile of AEM data, where only 10 channels with different colors are shown to ensure the figure is clear and clean. Different lines correspond to dBz/dt responses at different recording time, of which the unit is nT/s. The decay profile is used to distinct the conductor and resistance by relative magnitudes. Generally, electromagnetic field decays rapidly in a good conductor, while it is the opposite in resistance. Compared with
Figure 5, one can see that most anomalies of AEM data locate at the transition zones where the gradient of magnetics is large. The major axis direction of regional aeromagnetic and AEM data anomalies is generally consistent. The influence of the highway performance a wirelike anomaly along the highway. There are obvious AEM anomalies in either smooth or steep magnetic area.
With the integrated system and mixed database, a joint interpretation may be expected to obtain more information from two datasets. However, the AEM data reflect the electrical properties of the shallow geological body, and the aeromagnetic data reflect the deep rock mass and structural characteristics, which generally exceed the scope of the AEM in depth. In our paper, aeromagnetic result was used to help identify the space distribution of geological structures, and validated with AEM anomalies caused by geological structures. Besides, potential ore bodies were inferred from both aeromagnetic and AEM results.
5.2. Data Analysis and Potential Mineral Prediction
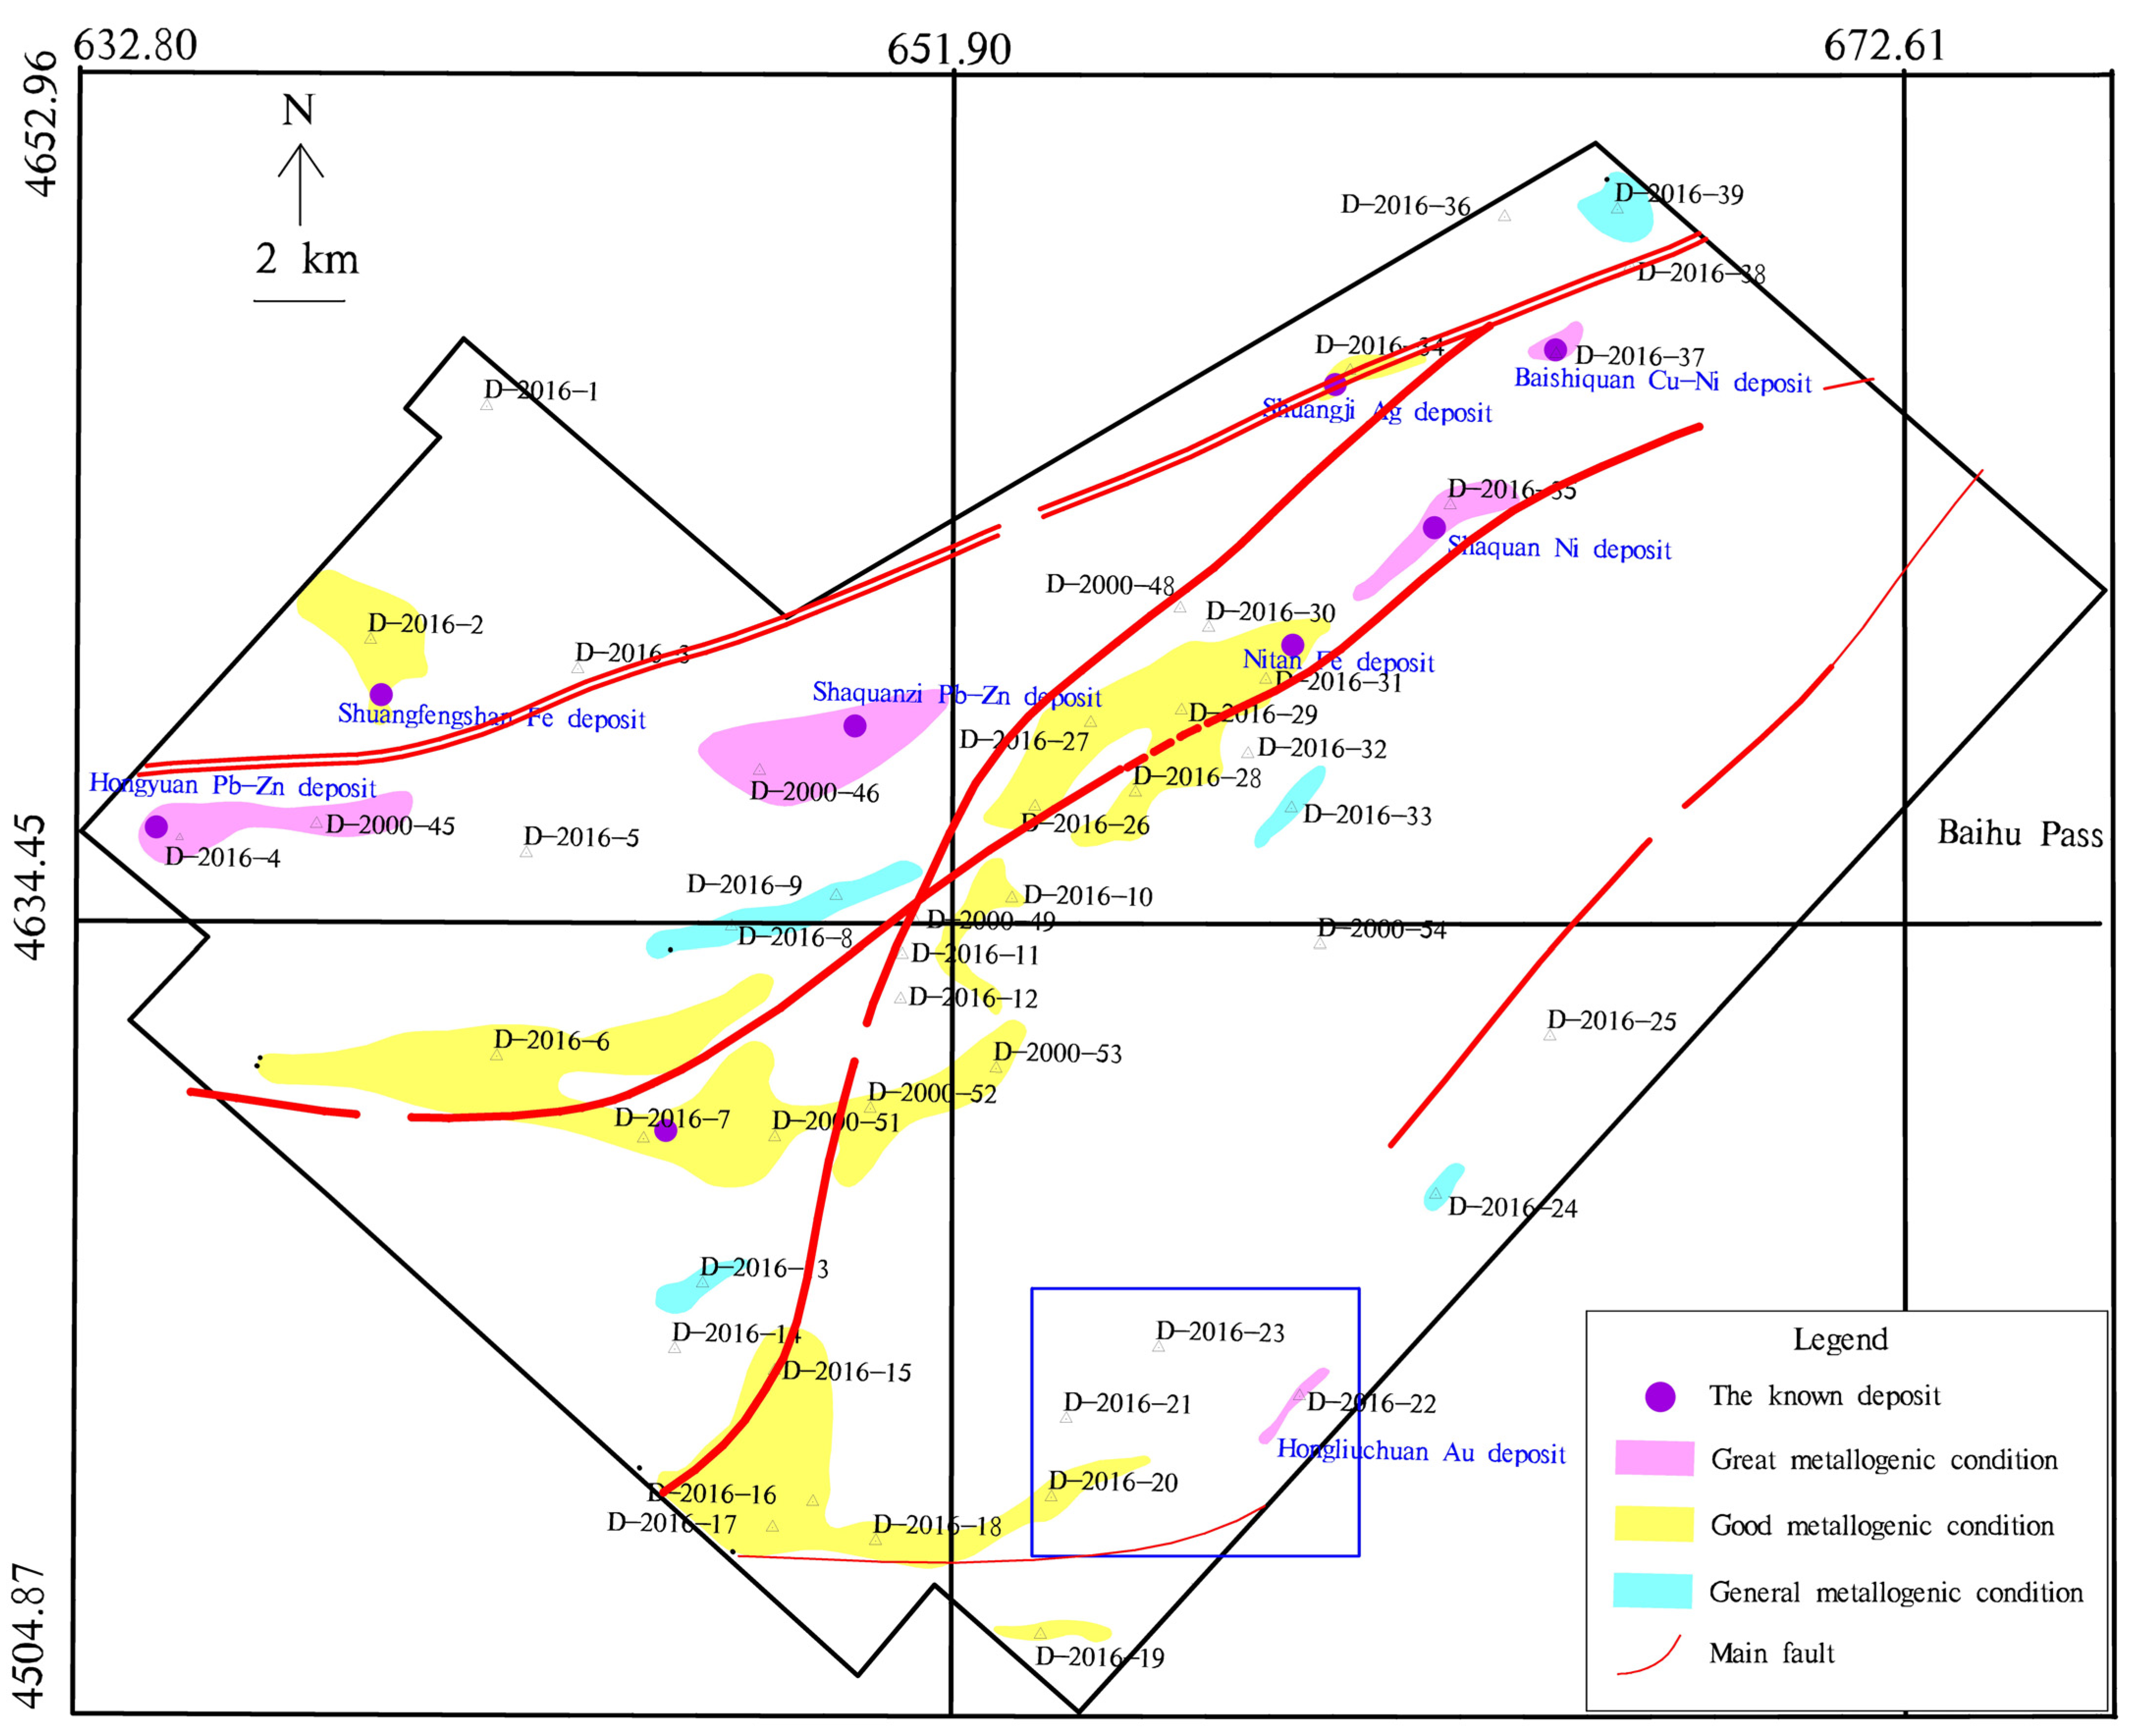
Based on
Figure 5 and
Figure 6, AEM anomalies caused by potential ore bodies were delineated and displayed in
Figure 7. These anomalies were determined according to the following creterions: (1) The amplitude of the anomaly is larger than 3 times the noise level; (2) The anomaly has an continuous effect on at least 3 survey lines; (3) Based on the flight log, exclude the anomaly caused by anthropogenic effects; (4) Based on the known deposits, anomalies caused by them should be delineated first; (5) They are preferred that anomalies perpendicular to the survey line, near the geological structures, or corresponding to the transition zones of magnetic anomalies.
The new delineated anomalies were numbered as “D-2016-??”, where “D” represents the amomalies determined by AEM data, “2016” denotes the year when data collected, and “??” stands for anomaly number. From
Figure 7, one can see that there are 48 delineated anomalies, among which 39 anomalies are newfound. It should be noted that 9 anomalies has been numbered in 2000 and their numbers are still used. In
Figure 7, the locations of seven known deposits are marked by purple circles, which have a good correspondence of seven anomalies numbered as D-2016-2, D-2016-4, D-2000-46, D-2016-31, D-2016-34, D-2016-35, and D-2016-37. After delineation, ground surveys were carried out subsequently to identify the source of anomalies. The results of exploratory trench and analysis of rock samples show that 12 anomalies provide mineralization clues, and 4 areas are considered as the potential deposits [
34,
38]. Besides that, with the support of Xinjiang Bureau of Geo-Exploration & Mineral Development, one gold deposit was found at D-2016-22 in 2017.
After first round of ground surveys, based on the potential ores, the anomalies were classified into five categories, including anomalies caused by orebody, potential orebody after ground surveys, potential orebody without ground survey, cannot determine, non-ore body. More details are shown in
Table 2.
5.3. New Gold Deposit
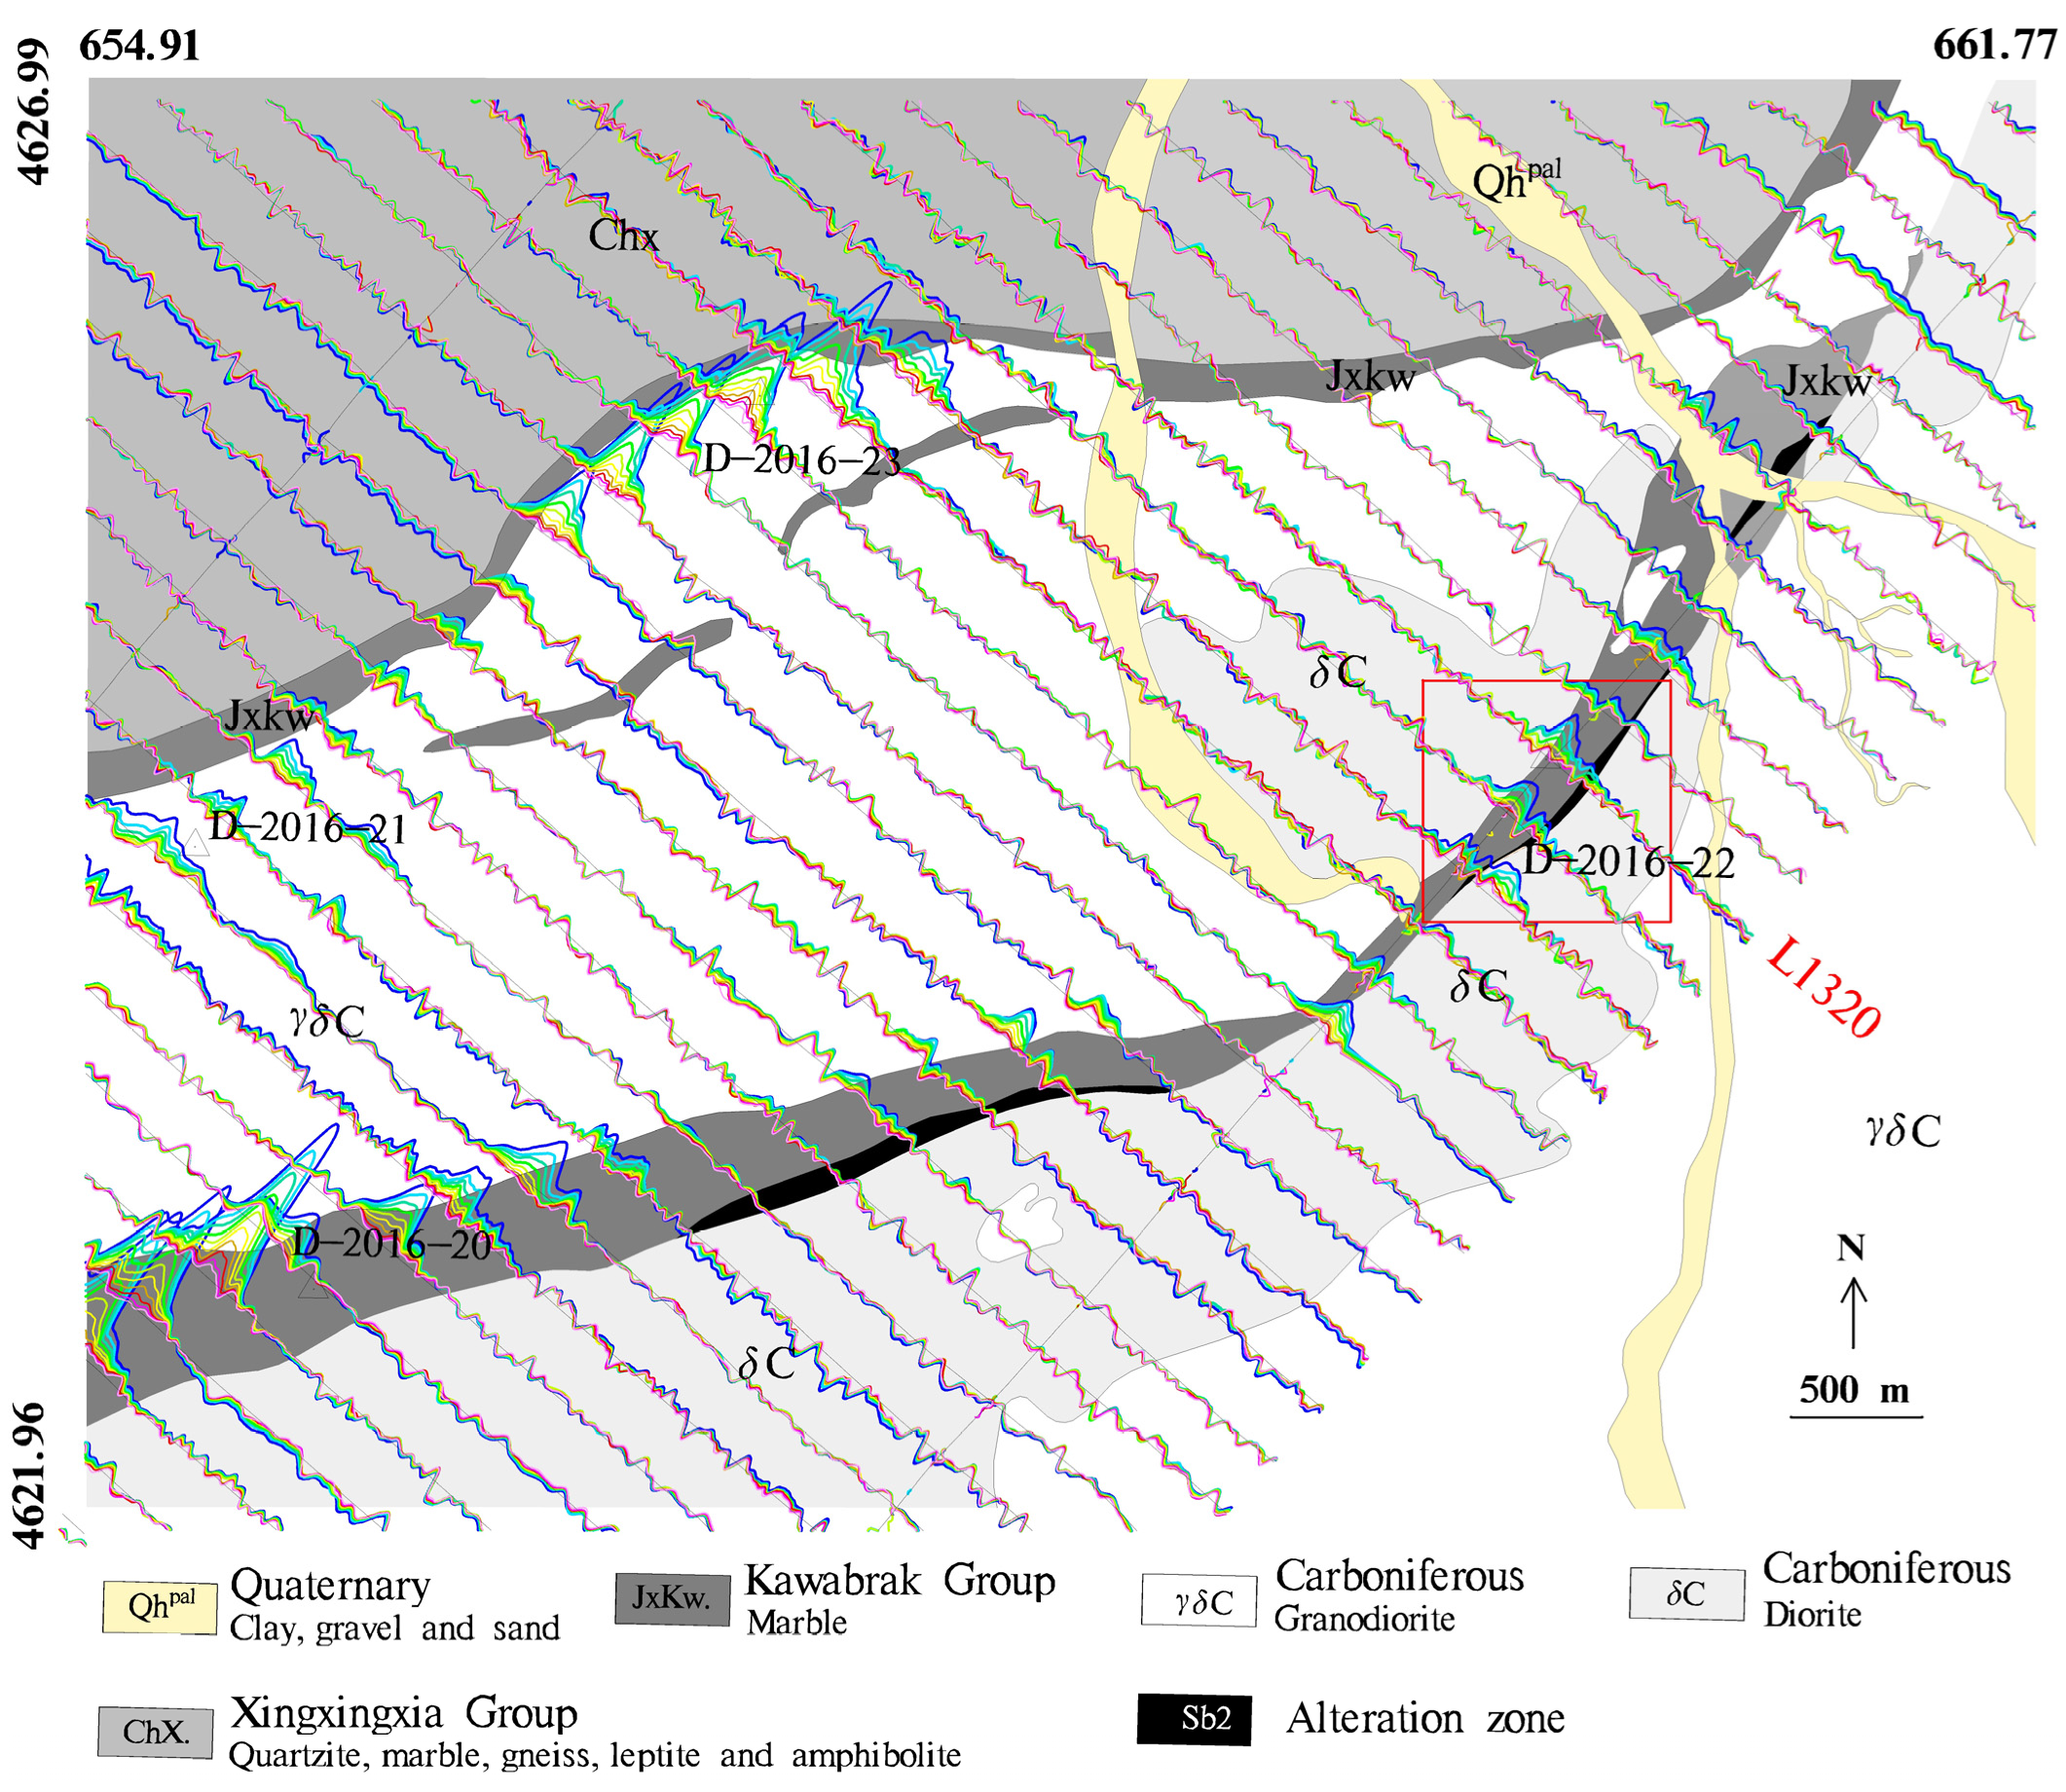
In the south of the survey area, the decay curves of AEM data was overlapped on the geological map with a scale of 1:10,000, and shown as
Figure 8. As one can see in
Figure 8 that, two banded anomalies in AEM data are distinct, and their locations correspond to the contact zone between marble in grey and granodiorite in white. Along the two bands, ground survey were carried out subsequently, which was led by the Geological Team Six of Xinjiang Geological and Mineral Bureau. By exploratory trench and analysis of rock samples, a new gold deposit was discovered at the anomaly D-2016-22, named Hongliuchuan gold deposit [
26].
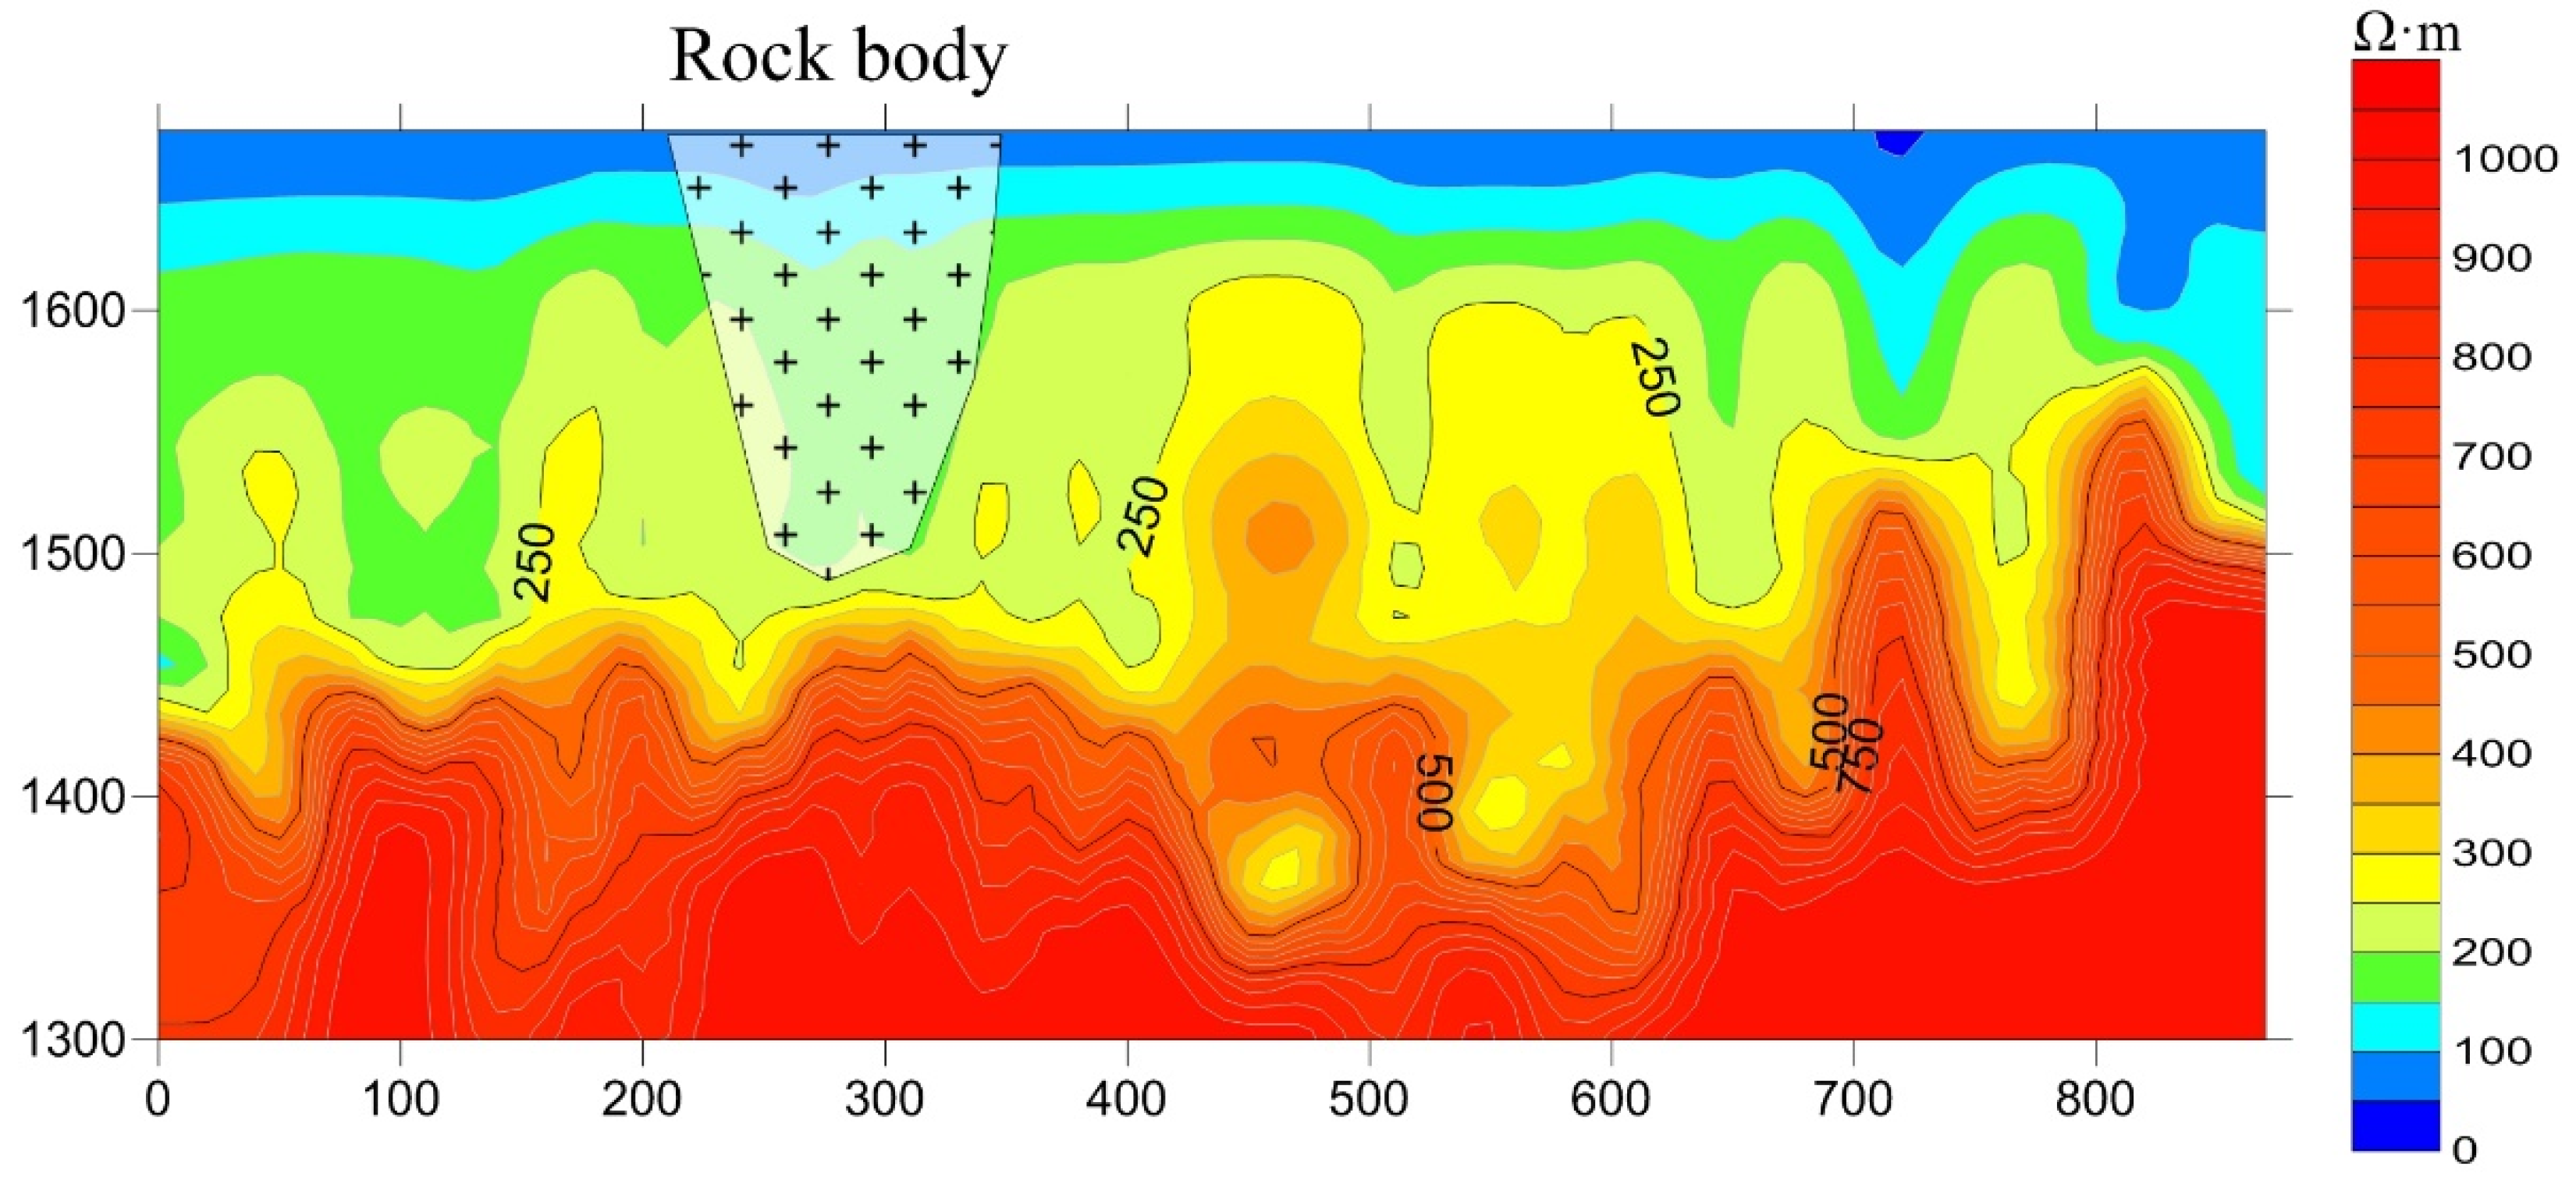
The anomaly D-2016-22 showed an effect on 8 survey lines with length of 900 m, which locates the interface between the basic-ultrabasic rock mass and Kawabulake formation of Jixian system. The center of D-2016-22, survey line L1320 was picked out to implement CDI, and apparent resistivity of L1320 is shown in
Figure 9. The inferred ore-bearing rock was outlined on the figure, which was determined by ground survey and experimental measurement. According to the comprehensive study, the anomaly was caused by the basic-ultrabasic ferromagnesian rock mass, and the two sides of the rock mass correspond to alteration zones [
37,
39].
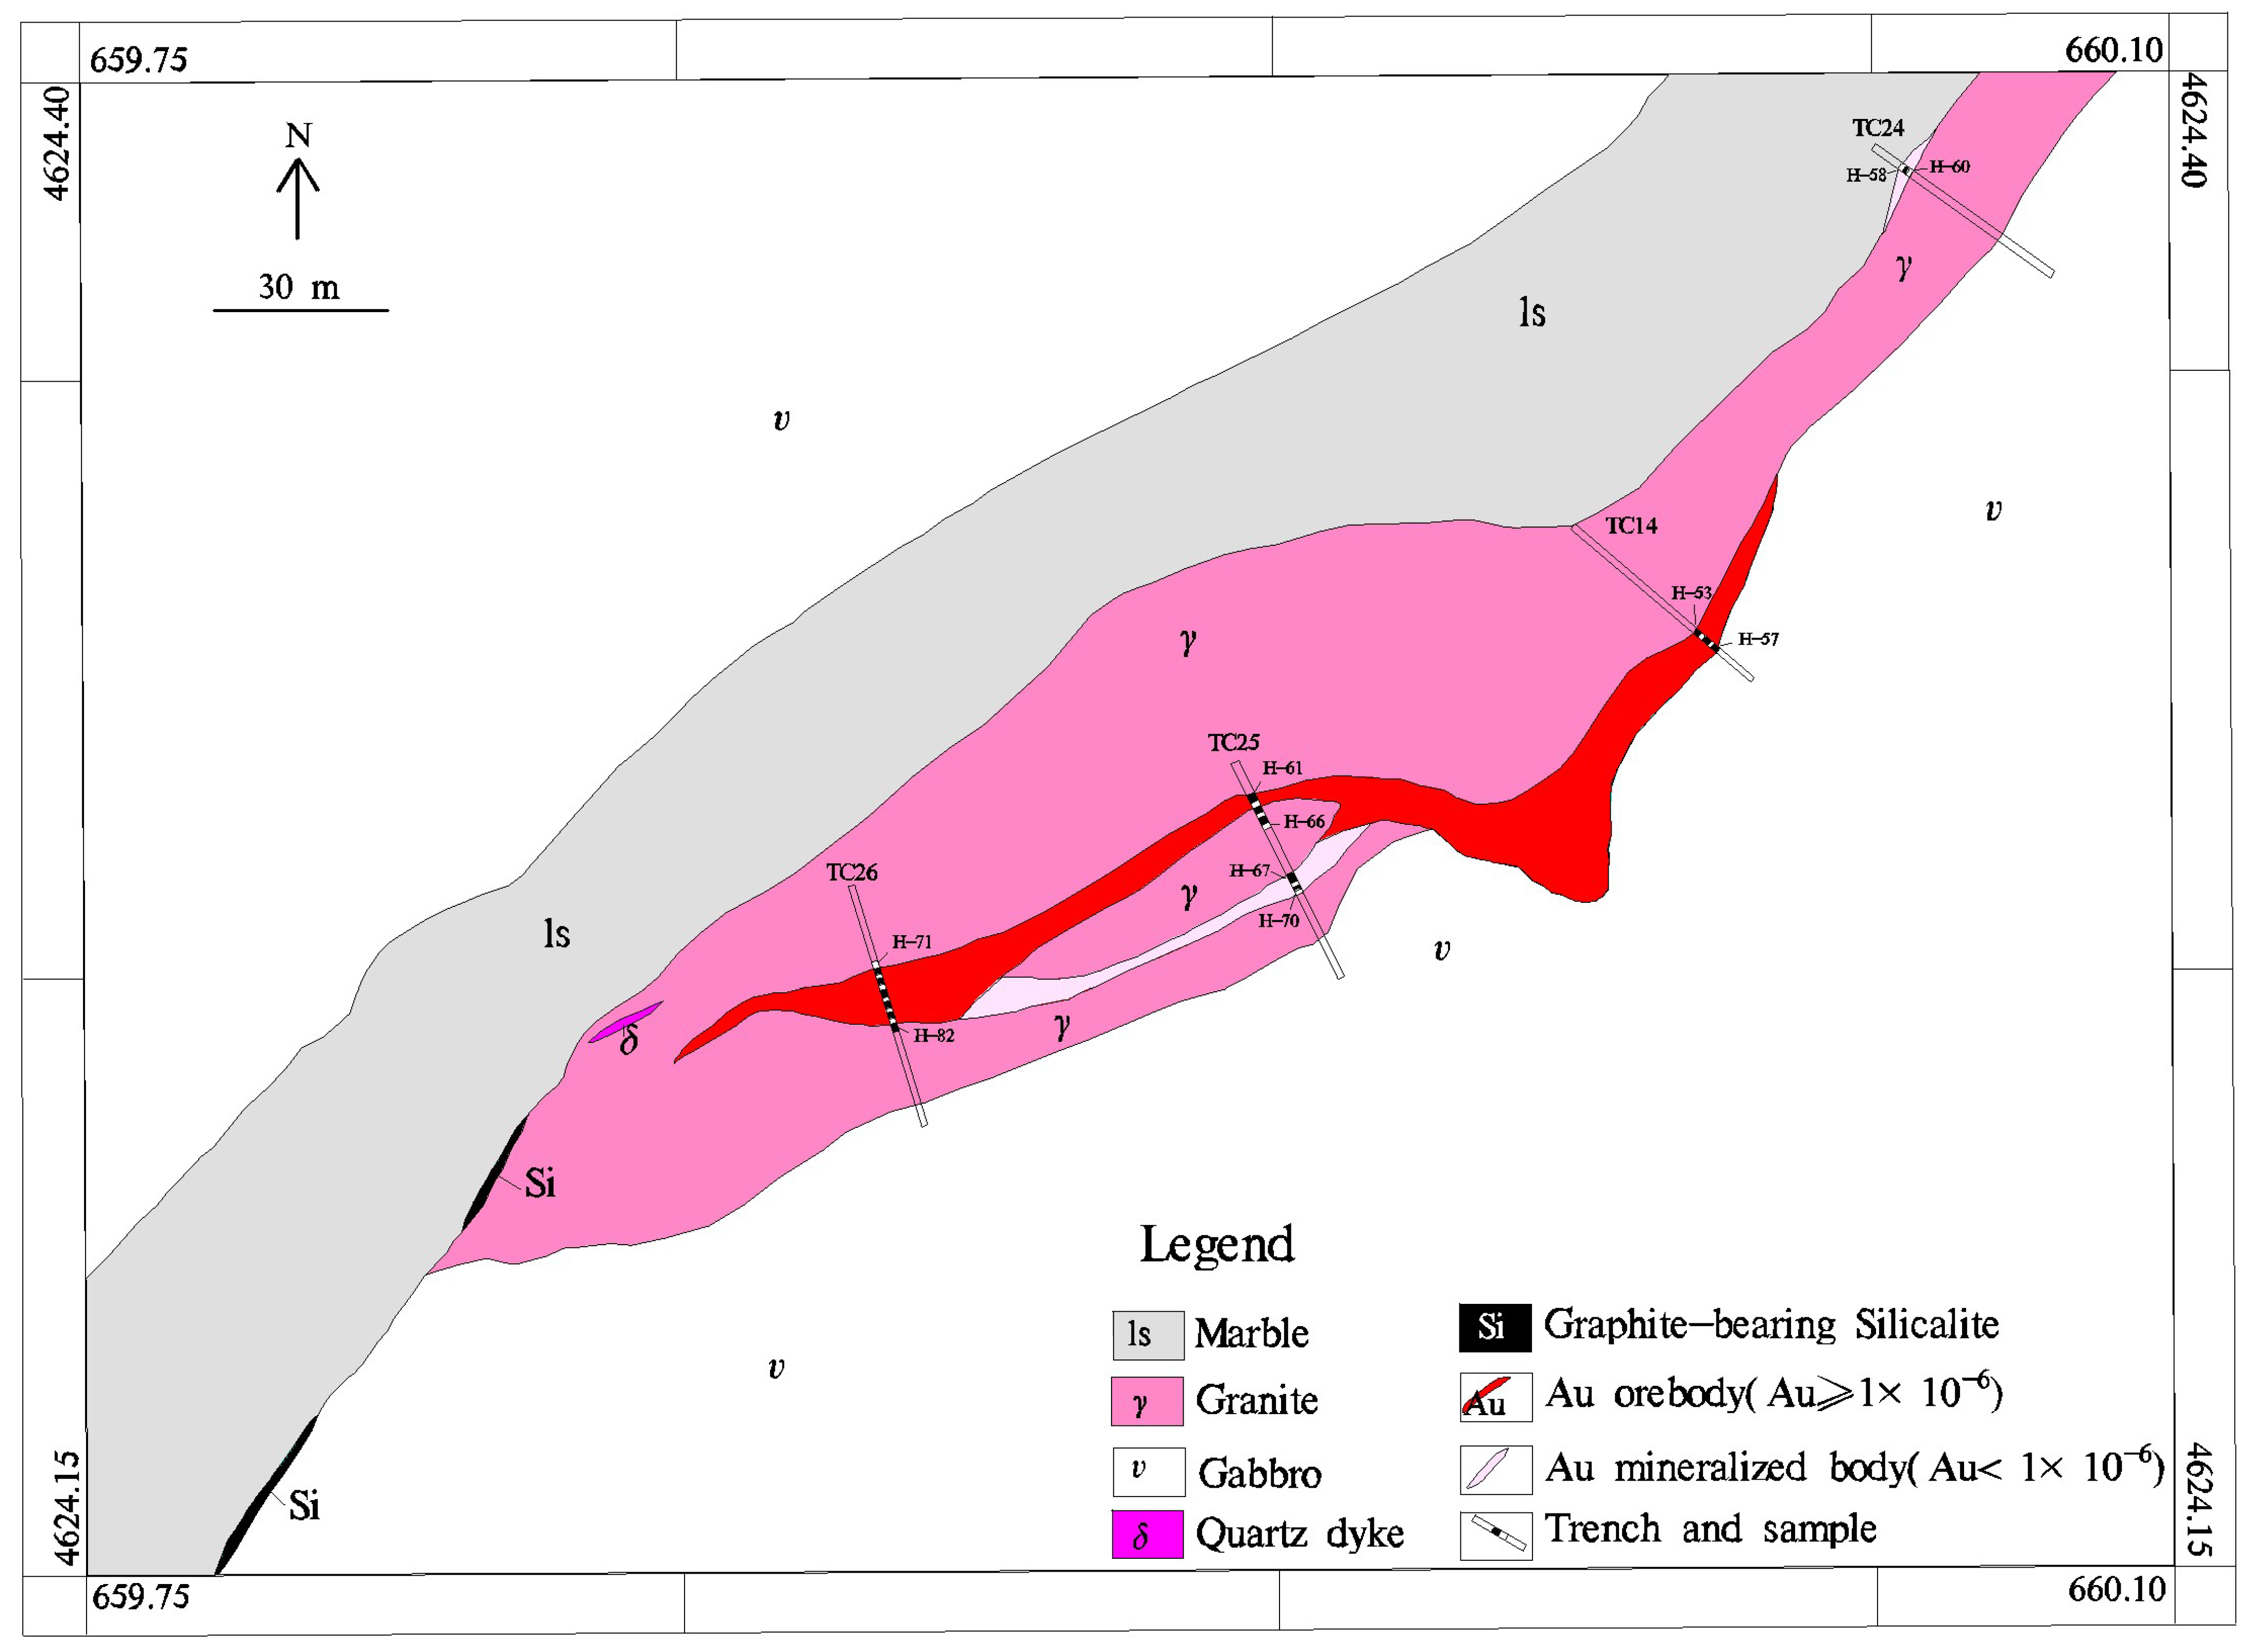
The outcrop of the gold deposit presents in irregular veined with the strike angle of 65°, length of about 220 m, and maximum width of about 20 m. The ore rocks are graphite-bearing secondary quartzite, and the tectonic breccia is developed in the ore body. The surrounding rocks of the orebody mainly include graphite marble, strongly altered granite, mylonitic granite, and gabbro. The main texture of the ore rocks is the microscale granular lepidoblastic texture. The main structures include tabular structure, cataclastic structure and brecciated structure. The ore rocks are mainly composed of fine quartz (82–90%), crystalline graphite (3–10%), fine flaky sericite-muscovite (3–8%), limonite (1%) and traces of pyrite [
26,
39]. The thickness of crystalline graphite in the ore rocks is mainly 0.03–0.12 mm, which can also be claimed as graphite ore. The gold orebody was developed in the tectonic fault zone of the graphite marble stratum. Gold grade is about 1.03–5.37 × 10
−6, with an average of 2.26 × 10
−6, and silver grade is about 4.64–14.17 × 10
−6.
According to the results of ground survey, the inferred geological model of Hongliuchuan gold deposit is shown as
Figure 10. The ore body is distributed in the contact zone between two large rock masses. The marble rock mass is rich in elemental carbon, and the carbonaceous layers were formed along the contact zones after enrichment. The carbonaceous layers formed an adsorption effect on the altered rock of granite, and the gold element was enriched in the carbonaceous layer and the gold ore body was formed. From the above mineralization mechanism, the carbonaceous layers and surrounded basic–ultrabasic rock mass play an ore controlling role in the formation of Hongliuchuan gold deposit.
The airborne anomaly in the area has a good reflection on the ferromagnesian rock mass. With the AEM anomalies indicating position, Hongliuchuan gold deposit was finally found. The successful case shows airborne geophysical explorations are effective in prospecting polymetallic mineral resources. From the mineralization mechanism of the new gold deposit, carbonaceous marble, strong alteration, and basic-ultrabasic rock mass should be regarded as a mark for potential gold, copper or nickel polymetallic deposits in eastern Tianshan region.
6. Conclusions
Through the airborne magnetic and AEM survey at Baishiquan–Hongliujing area, 39 new AEM anomalies are outlined as the clues of potential deposits, where 7 outlined anomalies are consistent with the known ore sites. By ground surveys of anomaly investigation, one new gold deposit was found. The prospective reserves of gold are expected to exceed 10 tons, and gold grade is about 1.03–5.37 × 10⁻⁶. Moreover, some prospecting target areas are outlined as the possible locations of copper–nickel deposits. At the new Hongliuchuan gold deposit, there are carbonaceous marble, strong alteration and basic-ultrabasic rock mass, which can be regarded as a mark for potential gold, copper or nickel polymetallic deposits in the area. The survey in Baishiquan–Hongliujing area enriched the understanding of geological structure and mineralized mechanism in the eastern Tianshan Mountain area.
In the survey, most of the AEM anomalies lie at the steep bands of magnetic field, which are also consistent with the geological structures. The magnetic data exposed the geological structures, and the AEM data provided information of electrical properties in the shallow area. The combination of the two delineated the clues of potential polymetallic deposits near faults and other geological structures. Airborne geophysical explorations provided an efficient and quick glance for searching potential ore bodies with no surface outcrop, as a consequence, the ground surveys were implemented more specifically and efficiently. The successful case shows airborne geophysical explorations are effective in prospecting polymetallic mineral resources.
Abnormalities with high possibility of mineral resources usually exist in low resistivity and magnetic gradient belts. The survey line should vertically surround the long axis of ore body, and the line space should small enough to describe the shape of ore body. Certain amount of airborne work should be done to cover the important area. We made up a menu during the project carrying out, which could provide a main guide for other area. The integrating interpreting method with AEM, magnetic, and ground base worked efficiently and effectively in the area.
However, in our interpretations, the AEM data were only used to locate anomalies on earth surface, while the space distribution estimation and total reserve estimation were mainly relied on the ground surveys. Actually, AEM data contain abundant information of subsurface from early and late decay channels. A further information mining should be done by 1D or 3D inversion. Besides, the combination of airborne AEM and magnetics were superficial. Airborne magnetic data were used to identify the main and subsidiary faults, and validated with AEM anomalies only. Joint inversion or interpretation would be considered as a valid way to gain more information with limited data.
