
Improved Boreal Forest Wildfire Fuel Type Mapping in Interior Alaska Using AVIRIS-NG Hyperspectral Data


Abstract
1. Introduction
2. Materials and Methods
2.1. Study Area
2.2. Data
2.3. Preprocessing
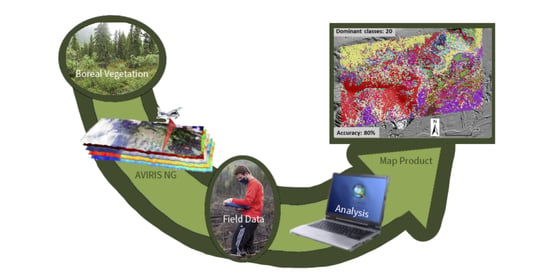
2.4. Fire Fuel Mapping
3. Results
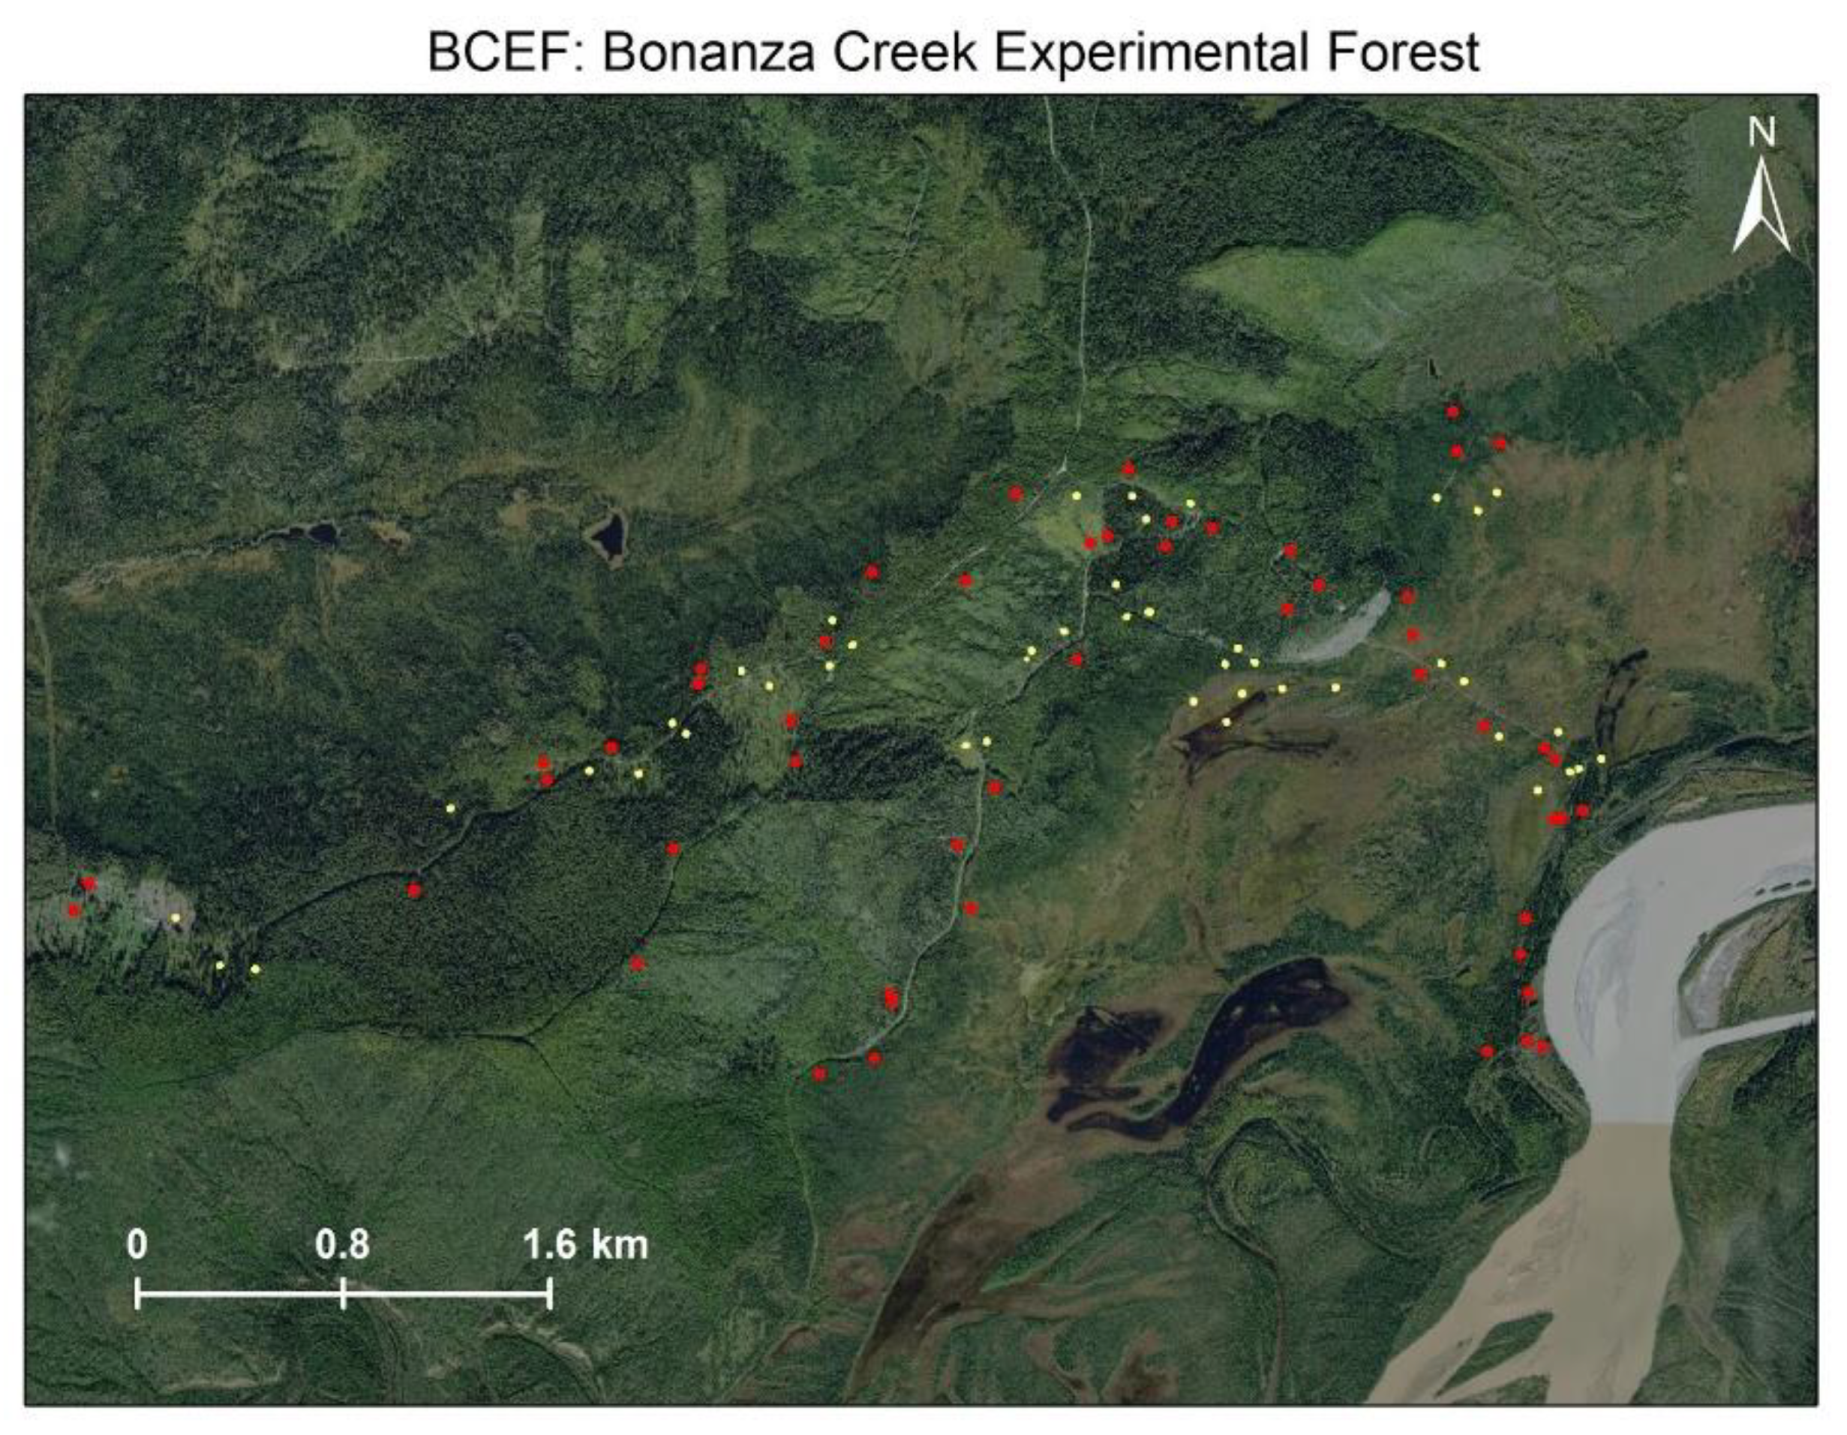
3.1. BCEF
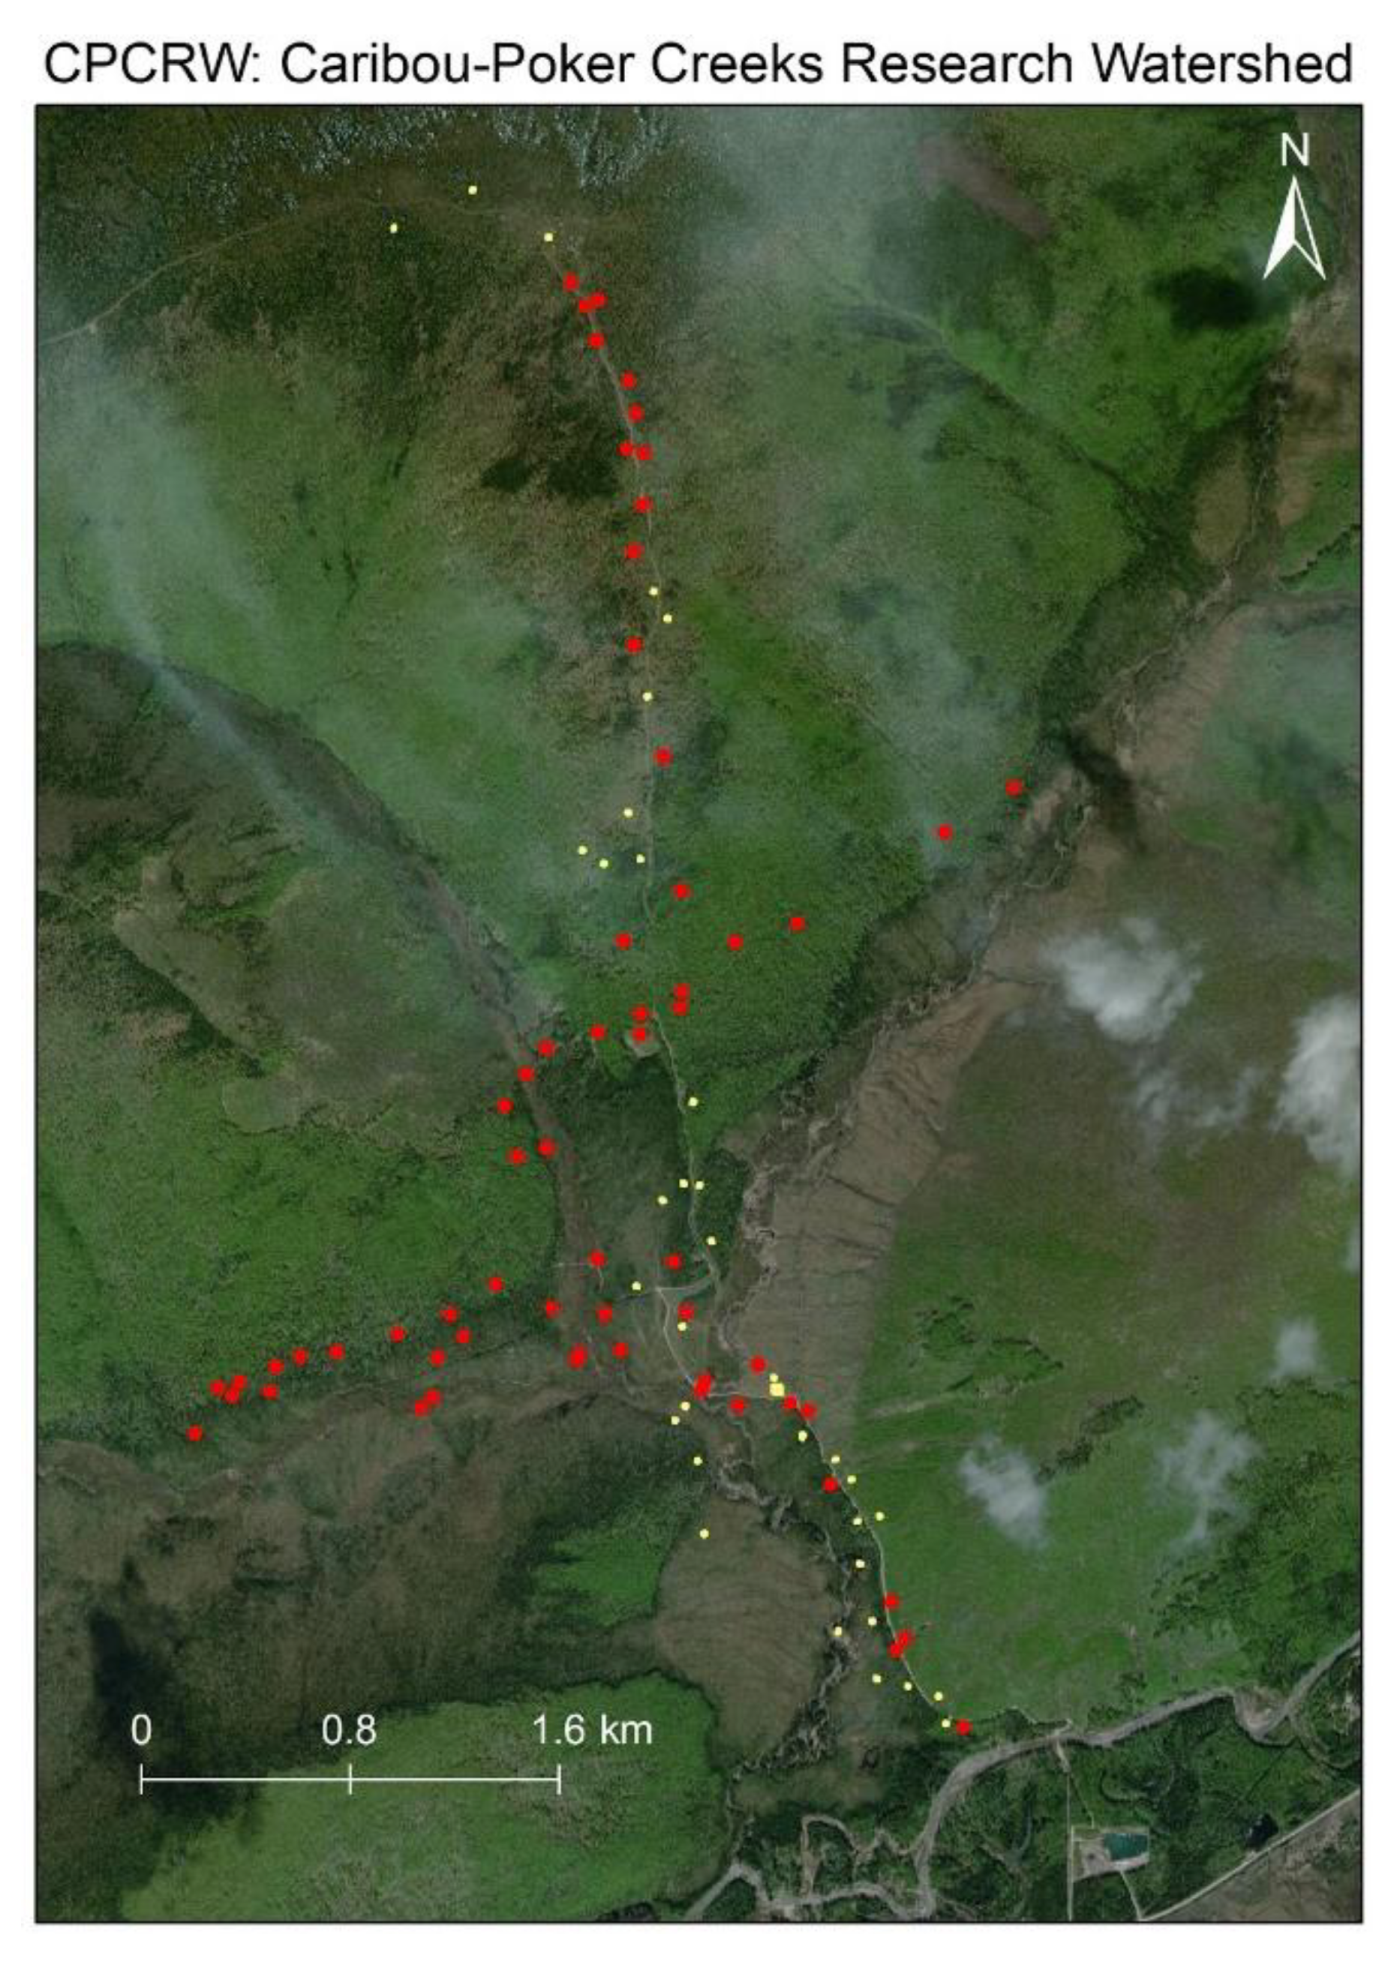
3.2. CPCRW
4. Discussion
5. Conclusions
Supplementary Materials
Author Contributions
Funding
Institutional Review Board Statement
Informed Consent Statement
Data Availability Statement
Acknowledgments
Conflicts of Interest
Abbreviations
| AVIRIS-NG | Airborne Visible/Infrared Imaging Spectrometer Next-Generation |
| BCEF | Bonanza Creek Experimental Forest |
| CPCRW | Caribou-Poker Creeks Research Watershed |
| DEM | Digital Elevation Model |
| EVT | Existing Vegetation Type |
| LF | LANDFIRE |
| NDVI | Normalized Difference Vegetation Index |
| PCA | Principal Component Analysis |
References
- Alaska Department of Fish and Game. Boreal Forest in Alaska—Extent, Alaska Department of Fish and Game. Available online: http://www.adfg.alaska.gov/index.cfm?adfg=boreal.extent (accessed on 28 December 2020).
- Rick, T.; Walsh, J. Alaska’s Changing Environment. International Arctic Research Center. Available online: Uaf-iarc.org/our-work/alaskas-changing-environment/ (accessed on 25 February 2021).
- Ziel, R. 2019: Alaska’s Fire Environment: Not an Average Place. International Association of Wildland Fire. Available online: http://www.iawfonline.org/article/alaskas-fire-environment-not-an-average-place/ (accessed on 26 December 2020).
- LANDFIRE Existing Vegetation Type. Available online: http://www.landfire.gov/evt.php (accessed on 28 December 2019).
- Alaska Department of Natural Resources Division of Forestry, Alaska 2019 Fire Numbers. Available online: http://forestry.alaska.gov/Assets/pdfs/firestats/2019%20Alaska%20Fire%20Statistics.pdf (accessed on 25 February 2021).
- Holland, M.M.; Bitz, C.M. Polar amplification of climate change in coupled models. Clim. Dyn. 2003, 21, 221–232. [Google Scholar] [CrossRef]
- Box, J.; Colgan, W.T.; Christensen, T.R.; Schmidt, N.M.; Lund, M.; Parmentier, F.-J.W.; Brown, R.; Bhatt, U.S.; Euskirchen, E.S.; Romanovsky, V.E.; et al. Key indicators of Arctic climate change: 1971–2017. Environ. Res. Lett. 2019, 14, 045010. [Google Scholar] [CrossRef]
- Kasischke, E.S.; Turetsky, M.R. Recent changes in the fire regime across the North American boreal region—Spatial and temporal patterns of burning across Canada and Alaska. Geophys. Res. Lett. 2006, 33. [Google Scholar] [CrossRef]
- Kelly, R.; Chipman, M.L.; Higuera, P.E.; Stefanova, I.; Brubaker, L.B.; Hu, F.S. Recent burning of boreal forests exceeds fire regime limits of the past 10,000 years. Proc. Natl. Acad. Sci. USA 2013, 110, 13055–13060. [Google Scholar] [CrossRef]
- York, A.; Bhatt, U.S.; Gargulinski, E.; Grabinski, Z.; Jain, P.; Soja, A.; Thoman, R.L.; Ziel, R. Wildland Fire in High Northern Latitudes Arctic Report Card 2020; Thoman, R.L., Richter-Menge, J., Eds.; NOAA: Washington, DC, USA, 2020. [Google Scholar] [CrossRef]
- Schuur, E.A.G.; McGuire, A.D.; Schadel, C.; Grosse, G.; Harden, J.W.; Hayes, D.J.; Hugelius, G.; Koven, C.D.; Kuhry, P.; Lawrence, D.M.; et al. Climate change and the permafrost carbon feedback. Nat. Cell Biol. 2015, 520, 171–179. [Google Scholar] [CrossRef] [PubMed]
- Bieniek, P.A.; Bhatt, U.S.; York, A.; Walsh, J.E.; Lader, R.; Strader, H.; Ziel, R.; Jandt, R.R.; Thoman, R.L. Lightning Variability in Dynamically Downscaled Simulations of Alaska’s Present and Future Summer Climate. J. Appl. Meteorol. Clim. 2020, 59, 1139–1152. [Google Scholar] [CrossRef]
- Veraverbeke, S.; Rogers, B.M.; Goulden, M.L.; Jandt, R.R.; Miller, C.E.; Wiggins, E.B.; Randerson, S.V.M.L.G.E.B.W.J.T. Lightning as a major driver of recent large fire years in North American boreal forests. Nat. Clim. Chang. 2017, 7, 529–534. [Google Scholar] [CrossRef]
- Ahmad, S.; Pandey, A.C.; Kumar, A.; Lele, N.V. Potential of hyperspectral AVIRIS-NG data for vegetation characterization, species spectral separability, and mapping. Appl. Geomatics 2021, 1–12. [Google Scholar] [CrossRef]
- Clark, M.L.; Roberts, D.A.; Clark, D.B. Hyperspectral discrimination of tropical rain forest tree species at leaf to crown scales. Remote. Sens. Environ. 2005, 96, 375–398. [Google Scholar] [CrossRef]
- Hati, J.P.; Goswami, S.; Samanta, S.; Pramanick, N.; Majumdar, S.D.; Chaube, N.R.; Misra, A.; Hazra, S. Estimation of vegetation stress in the mangrove forest using AVIRIS-NG airborne hyperspectral data. Model. Earth Syst. Environ. 2020, 1–13. [Google Scholar] [CrossRef]
- Roberts, D.; Gardner, M.; Church, R.; Ustin, S.; Scheer, G.; Green, R. Mapping Chaparral in the Santa Monica Mountains Using Multiple Endmember Spectral Mixture Models. Remote. Sens. Environ. 1998, 65, 267–279. [Google Scholar] [CrossRef]
- Salas, E.A.L.; Subburayalu, S.K.; Slater, B.; Zhao, K.; Bhattacharya, B.; Tripathy, R.; Das, A.; Nigam, R.; Dave, R.; Parekh, P. Mapping crop types in fragmented arable landscapes using AVIRIS-NG imagery and limited field data. Int. J. Image Data Fusion 2020, 11, 33–56. [Google Scholar] [CrossRef]
- Singh, P.; Srivastava, P.K.; Malhi, R.K.M.; Chaudhary, S.K.; Verrelst, J.; Bhattacharya, B.K.; Raghubanshi, A.S. Denoising AVIRIS-NG data for generation of new chlorophyll indices. IEEE Sens. J. 2020, 1. [Google Scholar] [CrossRef]
- Zhang, C. Combining Hyperspectral and Lidar Data for Vegetation Mapping in the Florida Everglades. Photogramm. Eng. Remote. Sens. 2014, 80, 733–743. [Google Scholar] [CrossRef]
- Miller, C.E.; Green, R.O.; Thompson, D.R.; Thorpe, A.K.; Eastwood, M.; Mccubbin, I.B.; Olson-duvall, W.; Bernas, M.; Sarture, C.M.; Nolte, S.; et al. Arctic-Boreal Vulnerability Experiment (ABoVE)ABoVE: Hyperspectral Imagery from AVIRIS-NG, Alaskan and Canadian Arctic, 2017–2018; ORNL DAAC: Oak Ridge, TN, USA, 2018. [Google Scholar] [CrossRef]
- Potter, C.S. Recovery of Vegetation Cover in Burned Ecosystems of Interior Alaska Derived from a Combination of ABoVE-AVIRIS and Landsat Imagery. In Proceedings of the AGU Fall Meeting 2019, San Francisco, CA, USA, 9–13 December 2019. [Google Scholar]
- DeVelice, R.L. Accuracy of the LANDFIRE Alaska Existing Vegetation Map over the Chugach National Forest; LANDFIRE Assessments; 2012; Volume 10. Available online: https://landfire.cr.usgs.gov/documents/LANDFIRE_ak_110evt_accuracy_summary_013012.pdf (accessed on 25 February 2021).
- Krasnow, K.; Schoennagel, T.; Veblen, T.T. Forest fuel mapping and evaluation of LANDFIRE fuel maps in Boulder County, Colorado, USA. For. Ecol. Manag. 2009, 257, 1603–1612. [Google Scholar] [CrossRef]
- Bonanza Creek LTER Overview. Available online: http://www.lter.uaf.edu/research/study-sites-overview (accessed on 4 December 2020).
- Roberts, D.; Smith, M.; Adams, J. Green vegetation, nonphotosynthetic vegetation, and soils in AVIRIS data. Remote. Sens. Environ. 1993, 44, 255–269. [Google Scholar] [CrossRef]
- Exelis Visual Information Solutions; ENVI vs 4.8. L3Harris Geospatial: Boulder, CO, USA, 2010.
- EnMAP-Box Developers. EnMAP-Box 3—A QGIS Plugin to Process and Visualize Hyperspectral Remote Sensing Data. 2019. Available online: https://enmap-box.readthedocs.io (accessed on 25 February 2021).
- ESRI. ArcGIS Desktop: Release 10; Environmental Systems Research Institute: Redlands, CA, USA, 2019. [Google Scholar]
- Agarwal, A.; El-Ghazawi, T.; El-Askary, H.; Le-Moigne, J. Efficient Hierarchical-PCA Dimension Reduction for Hyperspectral Imagery. In Proceedings of the 2007 IEEE International Symposium on Signal Processing and Information Technology, Giza, Egypt, 15–18 December 2007; pp. 353–356. [Google Scholar] [CrossRef]
- Alaska Fuel Model Guide Task Group. Fuel Model Guide to Alaska Vegetation. Unpubl. Report; Alaska Wildland Fire Coordinating Group, Fire Modeling and Analysis Committee: Fairbanks, AK, USA, 2018; p. 105. [Google Scholar]
- Viereck, L.; Dyrness, C.; Batten, A.; Wenzlick, K. The Alaska Vgetation Classification; USDA Forest Service: Washington, DC, USA, 1992; pp. 278–286. [Google Scholar]
- Chapman, D.S.; Bonn, A.; Kunin, W.E.; Cornell, S.J. Random Forest characterization of upland vegetation and management burning from aerial imagery. J. Biogeogr. 2009, 37, 37–46. [Google Scholar] [CrossRef]
- Cutler, D.R., Jr.; Beard, K.H.; Cutler, A.; Hess, K.T.; Gibson, J.; Lawler, J.J. Random Forests for Classification in ecology. Ecology 2007, 88, 2783–2792. [Google Scholar] [CrossRef]
- Belgiu, M.; Drăguţ, L. Random forest in remote sensing: A review of applications and future directions. ISPRS J. Photogramm. Remote. Sens. 2016, 114, 24–31. [Google Scholar] [CrossRef]
- Rodriguez-Galiano, V.; Ghimire, B.; Rogan, J.; Chica-Olmo, M.; Rigol-Sanchez, J. An assessment of the effectiveness of a random forest classifier for land-cover classification. ISPRS J. Photogramm. Remote. Sens. 2012, 67, 93–104. [Google Scholar] [CrossRef]
- Prasad, A.M.; Iverson, L.R.; Liaw, A. Newer Classification and Regression Tree Techniques: Bagging and Random Forests for Ecological Prediction. Ecosyst. 2006, 9, 181–199. [Google Scholar] [CrossRef]
- Bonanza Creek LTER Disturbance Regimes. Available online: https://www.lter.uaf.edu/boreal-forest/disturbance (accessed on 29 December 2020).
- Alaska Department of Fish and Game; Succession Changing Forest Habitats. Available online: https://www.adfg.alaska.gov/static-sf/statewide/aquatic_ed/AWC%20ACTIVITIES/FORESTS%20&%20WILDLIFE/BACKGROUND%20INFORMATION/Forests%20IV_Succession%20Facts.pdf (accessed on 21 January 2021).
- Andrews, P.; Finney, M.; Fischetti, M. Predicting Wildfires. Sci. Am. 2007, 297, 46–55. [Google Scholar] [CrossRef] [PubMed]
- Little, J.M.; Jandt, R.R.; Drury, S.A.; Molina, A.; Lane, B. Evaluating the effectiveness of fuel treatments in Alaska. Final re-port to the Joint Fire Science Program (JFSP project no. 14-5-01-27). 2018; p. 97. Available online: https://www.frames.gov/catalog/56829 (accessed on 21 February 2021).
- Moghaddas, J.J.; Craggs, L. A fuel treatment reduces fire severity and increases suppression efficiency in a mixed conifer forest. Int. J. Wildland Fire 2007, 16, 673–678. [Google Scholar] [CrossRef]


| Vegetation Type | Fuel Type | Cover (%) |
|---|---|---|
| Black Spruce Woodland with Tussocks | Black Spruce Woodland w/Tussocks | 3.71 |
| Black Spruce/Tammarack Forest | Black Spruce-Tamarack Forest | 3.08 |
| Bluejoint | Bluejoint | 0.12 |
| Post Harvest Bluejoint | Bluejoint | 0.71 |
| Bluejoint/Shrub & Bluejoint Herb | Bluejoint-Shrub/Herb | 2.95 |
| Closed Black Spruce | Closed Black Spruce Forest and Closed Mixed Black Spruce-White Spruce Forest | 10.33 |
| Closed Black/White Spruce Forest | Closed Black Spruce Forest and Closed Mixed Black Spruce-White Spruce Forest | 1.44 |
| Closed Tall Alder | Closed Tall Alder-Willow | 10.48 |
| Closed Tall Shrub Birch/Willow Shrub | Closed Tall Birch Shrub | 1.69 |
| Closed White Spruce | Closed White Spruce Forest | 3.28 |
| Open Black Spruce | Open Black Spruce & Open Mixed Black Spruce | 5.63 |
| Open Tall Alder | Open Tall Alder-Willow | 1.28 |
| Open Tall Shrub Birch Shrub | Open Tall Shrub Birch-Willow | 9.60 |
| Open White Spruce | Open White Spruce Forest | 0.89 |
| Closed Paper Birch | Paper Birch-Quaking Aspen Forest | 8.02 |
| Closed Quaking Aspen Forest | Paper Birch-Quaking Aspen Forest | 0.54 |
| Shrub/Bare | Shrub/Bare | 0.18 |
| Closed Quaking Aspen/White Spruce Forest | Spruce-Paper Birch-Aspen Forest | 1.92 |
| Closed Spruce/Paper Birch Forest | Spruce-Paper Birch-Aspen Forest | 0.26 |
| Closed Spruce/Paper Birch/Aspen Forest | Spruce-Paper Birch-Aspen Forest | 9.33 |
| Open Quaking Aspen/Spruce Forest | Spruce-Paper Birch-Aspen Forest | 0.93 |
| Open Spruce/Paper Birch Forest | Spruce-Paper Birch-Aspen Forest | 2.75 |
| Tussock Tundra | Tussock Tundra | 9.00 |
| Wet Sedge Meadows | Wet Sedge Meadows | 5.84 |
| Wetlands | Wetlands | 6.03 |
| LANDFIRE EVT (Landsat) | AVIRIS-NG 304-Band Image + DEM Veg. Class | |
|---|---|---|
| Pixel size | 30 m | ~5 m |
| Number of Dominant classes with % cover > 1 | 8 | 20 |
| Top 3 dominant classes (% cover): | 1. Birch-Aspen forest (33) 2. Black spruce forest (26) 3. Birch-Willow shrubland (15) | 1. Closed Birch forest (16) 2. Open White Spruce forest (9) 3. Closed tall shrub (9) |
| Source Data | Vegetation Classification Accuracy (%) | Fuel Type Classification Accuracy (%) | Cohan’s Kappa |
|---|---|---|---|
| LF EVT | 33 | - | - |
| Landsat + DEM | 65.2 | 74.2 | 0.55 |
| AVIRIS-NG PCA image + DEM | 64.1 | 71.9 | 0.56 |
| AVIRIS-NG 304 band image | 80 | 81.5 | 0.7 |
| Source Data | Vegetation Classification Accuracy (%) | Fuel Type Classification Accuracy (%) | Cohen’s Kappa |
|---|---|---|---|
| LF EVT | 20 | - | - |
| AVIRIS-NG PCA image + DEM | 69 | 74 | 0.4 |
| AVIRIS-NG 304 band image | 56 | 61 | 0.36 |
| Vegetation Type | Fuel Type | Cover (%) |
|---|---|---|
| Black Spruce Woodland with Tussocks | Black Spruce Woodland w/Tussocks | 2.34 |
| Black Spruce/Tamarack Forest | Black Spruce-Tamarack Forest | 1.22 |
| Closed Tall Alder | Closed Tall Alder-Willow | 12.67 |
| Closed White Spruce Forest | Closed White Spruce Forest | 3.36 |
| Dwarf Tree Black Spruce Scrub | Dwarf Tree Black Spruce Scrub | 1.66 |
| Open Black Spruce Forest | Open Black Spruce & Open Mixed Black Spruce | 18.96 |
| Open Low Shrub Birch/Willow | Open Low Shrub Birch— Ericaceous Shrub Bog and Open Low Shrub Birch—Willow | 14.80 |
| Open Paper Birch Forest | Open Paper Birch Forest | 3.91 |
| Open Quaking Aspen Forest | Open Quaking Aspen Forest | 9.25 |
| Open Tall Alder Shrub | Open Tall Alder-Willow | 3.60 |
| Open Tall Willow Shrub | Open Tall Alder-Willow | 1.25 |
| Closed Paper Birch Forest | Paper Birch-Quaking Aspen Forest | 1.94 |
| Closed Quaking Aspen Forest | Paper Birch-Quaking Aspen Forest | 4.82 |
| Closed Spruce/Paper Birch Forest | Spruce-Paper Birch-Aspen Forest | 3.79 |
| Open Quaking Aspen/Spruce Forest | Spruce-Paper Birch-Aspen Forest | 7.44 |
| Open Spruce/Paper Birch Forest | Spruce-Paper Birch-Aspen Forest | 3.17 |
| Tussock Tundra | Tussock Tundra | 0.94 |
| Wet Sedge Meadow | Wet Sedge Meadow | 4.89 |
Publisher’s Note: MDPI stays neutral with regard to jurisdictional claims in published maps and institutional affiliations. |
© 2021 by the authors. Licensee MDPI, Basel, Switzerland. This article is an open access article distributed under the terms and conditions of the Creative Commons Attribution (CC BY) license (http://creativecommons.org/licenses/by/4.0/).
Share and Cite
Smith, C.W.; Panda, S.K.; Bhatt, U.S.; Meyer, F.J. Improved Boreal Forest Wildfire Fuel Type Mapping in Interior Alaska Using AVIRIS-NG Hyperspectral Data. Remote Sens. 2021, 13, 897. https://doi.org/10.3390/rs13050897
Smith CW, Panda SK, Bhatt US, Meyer FJ. Improved Boreal Forest Wildfire Fuel Type Mapping in Interior Alaska Using AVIRIS-NG Hyperspectral Data. Remote Sensing. 2021; 13(5):897. https://doi.org/10.3390/rs13050897
Chicago/Turabian StyleSmith, Christopher William, Santosh K. Panda, Uma Suren Bhatt, and Franz J. Meyer. 2021. "Improved Boreal Forest Wildfire Fuel Type Mapping in Interior Alaska Using AVIRIS-NG Hyperspectral Data" Remote Sensing 13, no. 5: 897. https://doi.org/10.3390/rs13050897
APA StyleSmith, C. W., Panda, S. K., Bhatt, U. S., & Meyer, F. J. (2021). Improved Boreal Forest Wildfire Fuel Type Mapping in Interior Alaska Using AVIRIS-NG Hyperspectral Data. Remote Sensing, 13(5), 897. https://doi.org/10.3390/rs13050897