Article

Frequency Variability Feature for Life Signs Detection and Localization in Natural Disasters

1
School of Computer and Information, Hefei University of Technology, Hefei 230009, China
2
Anhui Key Laboratory of Industry Safety and Emergency Technology, Hefei 230009, China
3
School of Software, Hefei University of Technology, Hefei 230009, China
4
Intelligent Interconnected Systems Laboratory of Anhui Province, Hefei University of Technology, Hefei 230009, China
5
School of Electronic Information and Electrical Engineering, Hefei Normal University, Hefei 230009, China
*
Author to whom correspondence should be addressed.
Remote Sens. 2021, 13(4), 796; https://doi.org/10.3390/rs13040796
Submission received: 3 January 2021 / Revised: 14 February 2021 / Accepted: 18 February 2021 / Published: 21 February 2021
(This article belongs to the Section Remote Sensing Image Processing)

Abstract

:
The locations and breathing signal of people in disaster areas are significant information for search and rescue missions in prioritizing operations to save more lives. For detecting the living people who are lying on the ground and covered with dust, debris or ashes, a motion magnification-based method has recently been proposed. This current method estimates the locations and breathing signal of people from a drone video by assuming that only human breathing-related motions exist in the video. However, in natural disasters, background motions, such as swing trees and grass caused by wind, are mixed with human breathing, that distort this assumption, resulting in misleading or even no life signs locations. Therefore, the life signs in disaster areas are challenging to be detected due to the undesired background motions. Note that human breathing is a natural physiological phenomenon, and it is a periodic motion with a steady peak frequency; while background motion always involves complex space-time behaviors, their peak frequencies seem to be variable over time. Therefore, in this work we analyze and focus on the frequency properties of motions to model a frequency variability feature used for extracting only human breathing, while eliminating irrelevant background motions in the video, which would ease the challenge in detection and localization of life signs. The proposed method was validated with both drone and camera videos recorded in the wild. The average precision measures of our method for drone and camera videos were 0.94 and 0.92, which are higher than that of compared methods, demonstrating that our method is more robust and accurate to background motions. The implications and limitations regarding the frequency variability feature were discussed.

1. Introduction

Natural disasters, such as fire, earthquake and mudslides, threaten the nation’s safety and security, rendering post-disaster search and rescue (SAR) operations critical [1]. The locations and breathing signal of people in disaster areas are significant information for SAR missions in prioritizing operations to save more lives [2]. However, the environment in disaster areas is always unknown and possibly hostile due to potential poisonous gases, hazardous materials, radiation, extreme temperatures and dust, which increases the challenge for rescue workers in the ground search for trapped survivors.
To address these challenges, ground rescue robots have been used in SAR missions as an assistant technology to reduce both the health and personal risks for rescue workers, and provide an alternative to access disaster areas that may otherwise be inaccessible to workers [3]. The majority of robots require human operators to remotely guide them in searching for victims, however, this can be a very stressful task, which causes cognitive and physical fatigue to operators during time-critical situations. Semi-autonomous control schemes [4,5,6,7] for robotic exploration in SAR operations have been proposed to address the limitations of both teleoperation and constant human supervision, but require demanding technical supports, such as path planning, autonomous navigation, task allocation, decision-making and victim identification [8]. Furthermore, implementing ground rescue robots in hard-to-reach areas is a hard problem due to difficult terrains, such as mountains, rivers and lakes.
Additionally, the Doppler radar sensor is also a powerful tool used in SAR missions [9]. An important application of the Doppler radar sensor is to search and locate an alive person under the rubble of collapsed building or behind a wall by detecting vital signs, such as heartbeats and breathing [10,11,12]. The fundamental supporting this work is that a moving target relative to the radar sensor can induce a frequency shift of the echo as a result of the well-known Doppler effect; additional movements of smaller parts of the target will result in additional modulation of the main Doppler frequency shift, known as the micro-Doppler effect, i.e., the micro-Doppler signature, which reflects the periodic kinetic characteristics of a moving object and can be used for target or activity recognition and classification [13,14,15]. The radar sensor offers advantages in searching for and locating survivors due to its low cost and capability to work at relatively long distances, as well as strong robustness to illumination and weather conditions, but there may be weaknesses in the process to deploy radar networks immediately and appropriately in disaster zones, especially those which are unknown or hard to reach [16]. In this respect, drones may be used as a complementary tool to provide additional information for life detection and localization.
Unmanned aerial vehicles (UAVs), also known as drones, have been recognized as one of the revolutionary advances in the recent technological evolution, and are now experiencing new applications also in SAR missions [15,17,18]. This is mainly because: (1) drones can be put into action immediately without any loss of time, and obtain a rapid overview of the disaster situation by transferring surveillance and video data in real time; (2) they are especially suitable for use in the cases of difficult terrains or in hazardous or life-threatening situations; (3) they perform flexible operations to rapidly approach target regions where the potential victims are. Al-Kaff et al. [19] proposed a detection and tracking algorithm for rescuing victims in disaster environments based on color and depth data obtained from drone videos. This method is efficient for localizing humans who are lying on the ground in many poses, but fails to detect their life signs. In order to detect life signs, such as the breathing signal and heart rate, which help to identify whether the person is alive or not, Al-Naji et al. [20] proposed a remote physiological measurement system based on the skin color analysis of facial videos. They can detect human physiological parameters if the subject location is known prior, but limit the subject standing in front of the drone camera with a single pose. To release the requirement on a specific pose, in another study, Al-Naji et al. [21] proposed a new life signs detector system based on analyzing the periodic chest movements of survivors. This method can efficiently distinguish living and non-living subjects at different poses, but requires one to select a region of interest (ROI), i.e., the chest region. A body joint estimation approach [22] was applied in this method to select ROI, however, it performs well only when there are no occlusions on subjects. In contrast, a motion magnification-based method has recently been proposed by Perera et al. [
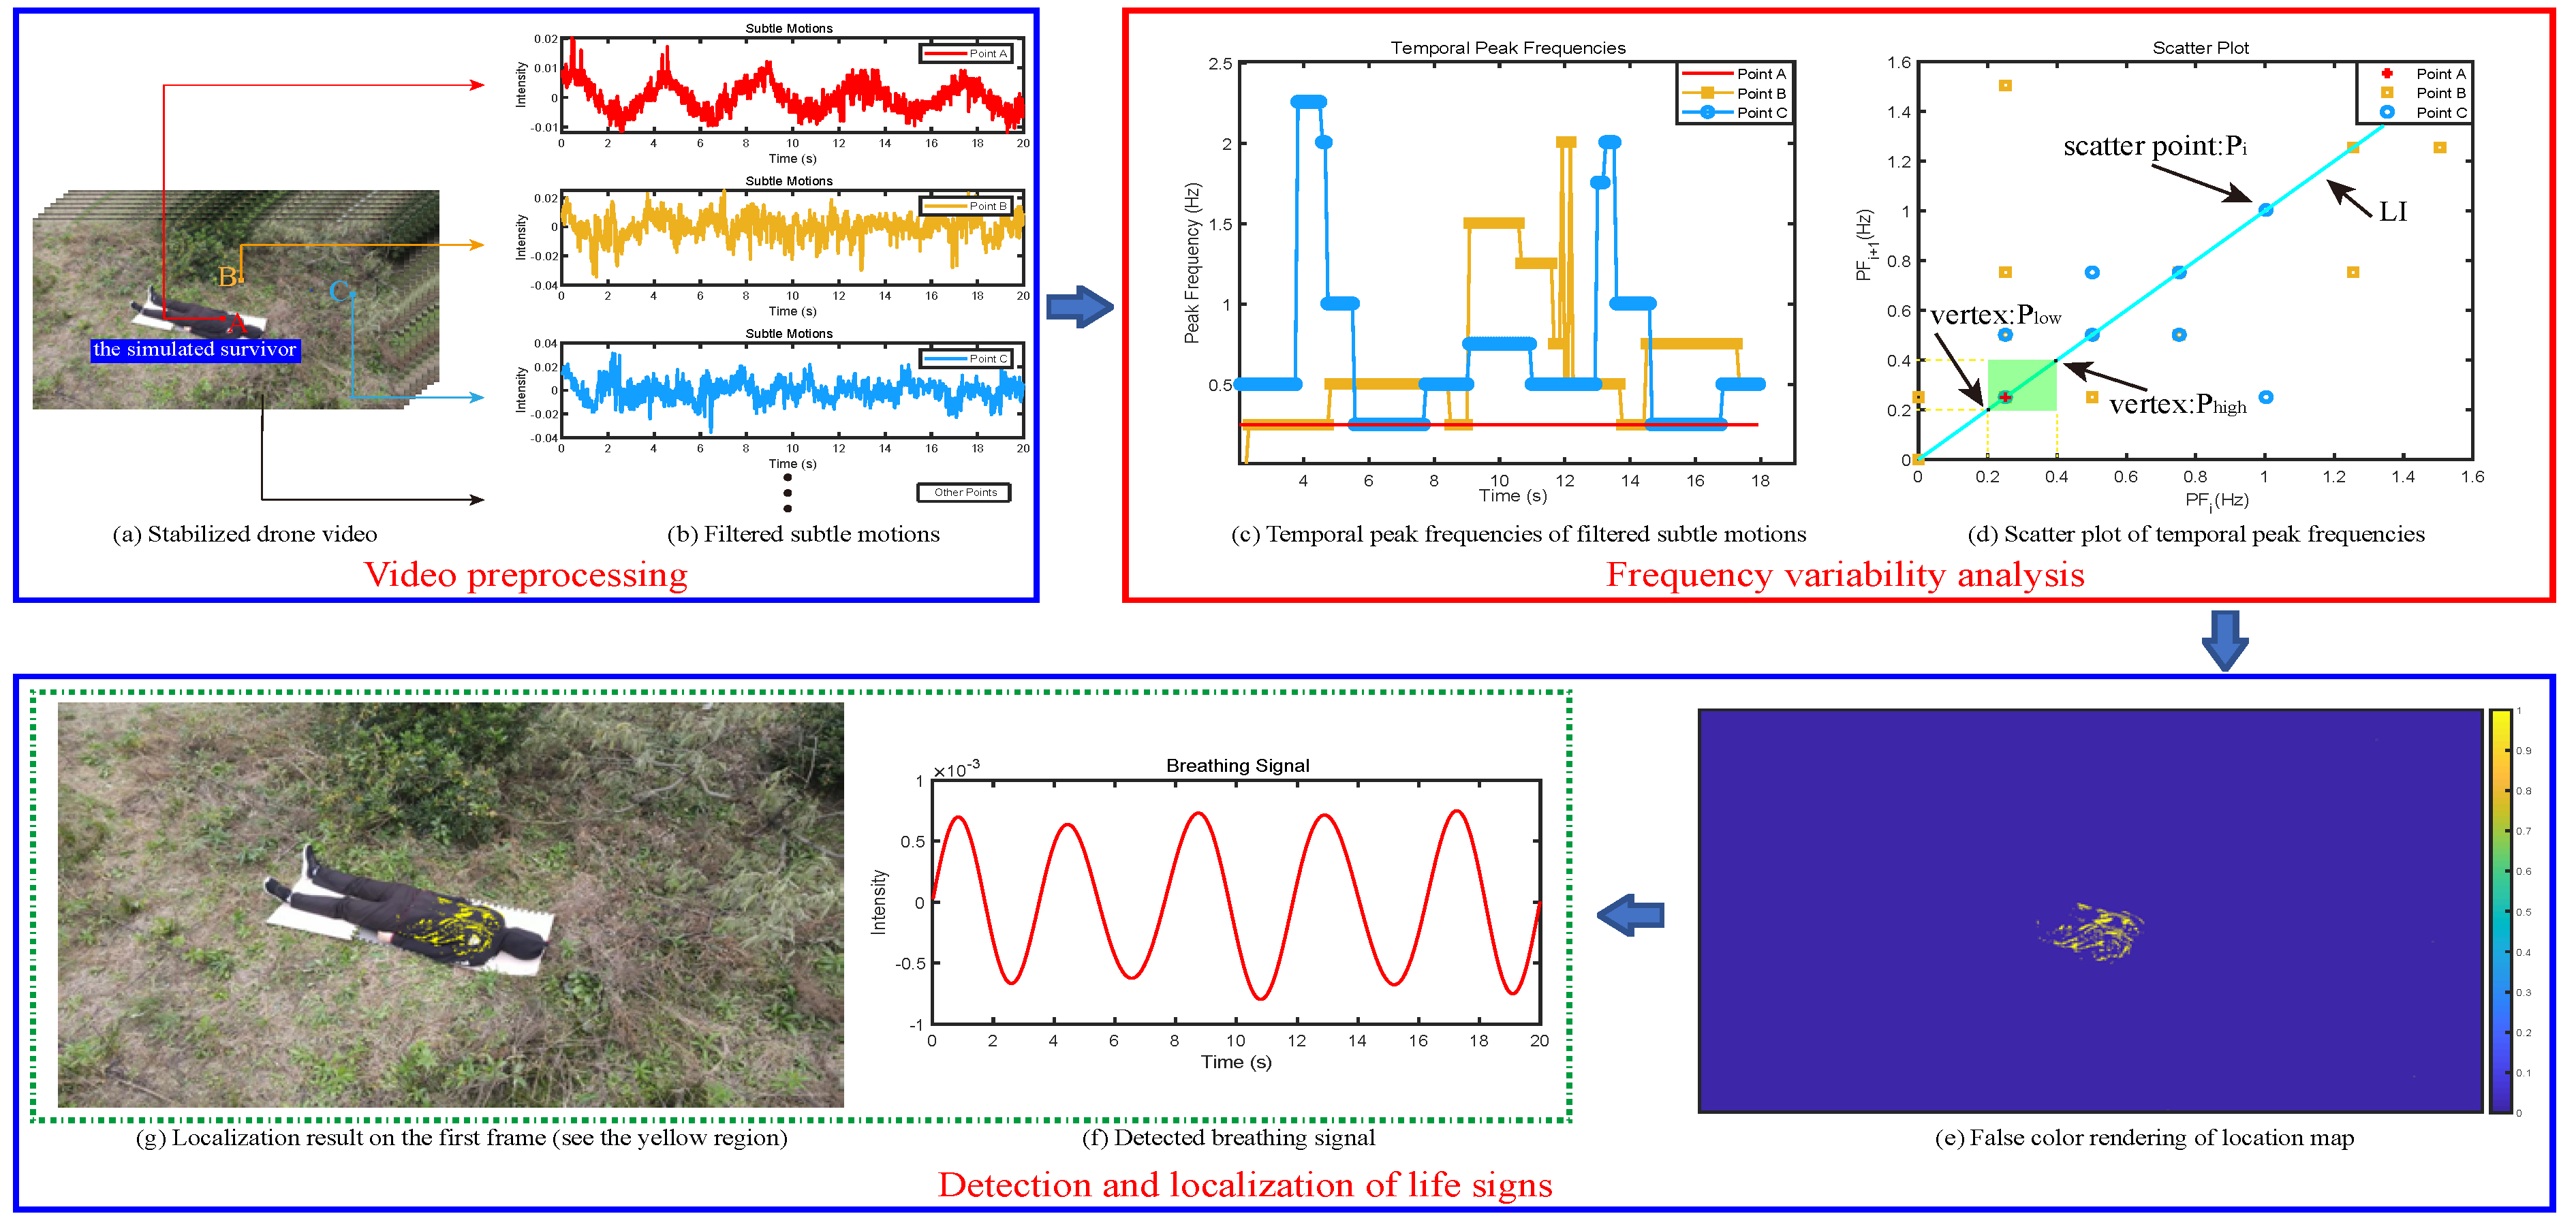
2] to estimate the locations and breathing signal of survivors in natural disasters. This method can successfully work well on clearly visible people and even those fully covered with dust, debris or ashes, but relies on a special assumption that only human breathing-related motions exist in the drone video. However, in some natural disasters, breathing movements of survivors are mixed with undesired motions in surroundings, such as swing trees and grass caused by wind. Therefore, the current method often produces ’contaminated’ breathing signal, and results in misleading or even no life signs locations.
To overcome this limitation, this paper presents a frequency variability feature-based method, which is robust to background motions. It is found that human breathing is a periodic motion with a steady peak frequency that falls within the range of human breathing rate (i.e., (0.2, 0.33) Hz), while for background motions, their peak frequencies seem to be variable over time due to that background motions always involve complex space-time behavior. The peak frequency here means the frequency with largest power in a local spectrum, which is the spectrum corresponding to a signal segement. Therefore, we consider that the temporal variability of peak frequencies of motion signals, which is called frequency variability (FV) feature, enables us to isolate breathing movements from background motions. In developing our method, we focused on analyzing the properties of peak frequencies, and modeled the FV feature using the geometric algebra of a 2D scatter plot. With the estimated FV values, we then designed a binary map that indicates the life signs locations, and with which the breathing signal of survivor was obtained. The proposed method was validated on both drone and camera videos, and experimental results show that our method is more robust and accurate to background motions when compared with the state-of-the-art method [2].
The contributions of this paper are below. (1) A frequency variability feature-based method is proposed for detecting and locating life signs in natural disasters. (2) The proposed frequency variability feature is successfully applied for discerning breathing movements from background motions. (3) The practical performances that our method provides were demonstrated, and its potential implications and limitations were discussed.

2. Background

2.1. Extraction of Subtle Motions from Videos

To the best of our knowledge, the research on subtle motions in a video is a main topic in motion magnification [23], which is used to visualize deformations or vibrations that would otherwise be invisible. This method followed a Lagrangian perspective to track and record subtle motions in the video. As such, it depended on accurate motion estimation, which is expensive and difficult to make artifact-free, especially at regions of occlusion boundaries and complicated motions [24]. In contrast, motion magnification methods [24,25,26] based on the Eulerian perspective do not require explicit motion estimation. Our work for obtaining subtle motions is inspired by the Eulerian video magnification (EVM) [24] method, where subtle motions are extracted from the temporal variations of intensity at fixed positions. The details are as follows.
In order to explain the relationship between intensity variation and motion signal, a simple case of a 1D signal undergoing translational motion was considered. This analysis generalizes directly to locally translational motion in 2D. Given an 1D image intensity I ( x ; t ) at position x and time t, the observed intensities with respect to a motion signal δ ( t ) are expressed by I ( x ; t ) = f ( x + δ ( t ) ) and I ( x ; 0 ) = f ( x ) . Based on the first-order Taylor series expansions common in optical flow analysis [27,28], the image at time t, f ( x + δ ( t ) ) can be written approximately as
I ( x ; t ) f ( x ) + δ ( t ) f ( x ) x .
Therefore, the subtle intensity changes B ( x ; t ) at every position x can be picked out by applying a broadband temporal bandpass filter to I ( x ; t ) , that gives
B ( x ; t ) = δ ( t ) f ( x ) x .
Considering that the motion signal δ ( t ) is within the passband of temporal filter, B ( x ; t ) is an approximate expression for the subtle motion. For more details, see [24,29].

2.2. SAR Operations Using Thermal and Infrared Radiation (IR) Cameras

Here, we discussed some important topics related to drone-based SAR operations by using thermal and infrared radiation (IR) cameras for human detection. Based on a particle filter combined with background subtraction, Portmann et al. [30] proposed a tracking algorithm for people tracking in thermal-infrared images. Kang et al. [31] proposed an approach for tracking continuously multiple objects across multiple sensors (i.e., electro-optical (EO) and infra-red (IR) sensors) using a joint probability model, which encodes the object’s appearance and motion. Rivera et al. [32] produced a modular equipment consisting of two cameras (i.e., thermal and color cameras) and a geolocation module mounted on a drone for possible human survivors in areas afflicted by disaster. Additionally, the data implied that optical detection effectively operates during daytime, having a higher accuracy at daytime deployment in comparison to nighttime. By integrating visible and thermal images recorded by the drone, Blondel et al. [33] proposed a new detection pipeline for viewpoint robust and fast human detection in SAR operations.
However, these studies may have limitations with low resolution, short-range detection and motion artefacts caused by camera movement [2], and life signs detection of humans was not considered in these studies. Furthermore, less thermal difference between the human body and background would make thermal images to be less contrasted between living people and warm backgrounds that may increase the challenge to detect humans. This paper focused on studies using only a RGB camera, but the practical importance of using a thermal camera in parallel to the RGB camera to enhance the implementation for real scenarios should be noted. Unless mentioned otherwise, the camera used in the drone-based methods described in the following text is an RGB camera.

2.3. Detection and Localization of Life Signs from Drone Videos

Drones have mobility and height advantages over humans and ground robots, and have proven to be a very useful tool for rescuing survivors in SAR missions [17]. However, in some natural disasters, the survivors may be lying on the ground and covered with dust, debris or ashes, making them difficult to be detected by video analysis that is tuned to human poses or shapes [19,20,21].
Recently, Perera et al. [2] proposed a motion magnification-based method to estimate the survivor locations and breathing signal from the drone video by detecting human breathing movements. A significant advantage of this method is that it can successfully detect clearly visible people and those who are fully occluded by dust, debris or ashes, without additional information that previous methods required [19,20,21]. First, the drone videos were stabilized using the key points of adjacent image frames to remove the camera or platform movements. Next, by using a sliding window, the stabilized video was decomposed into tiles, which were then further stabilized. Then, motion magnification [25,34,35] was applied to enhance the potential chest movements in each tile video, and from which a difference image sequence was obtained; potential breathing signal was estimated by applying image averaging and temporal filtering on each sequence. Finally, the estimated breathing rates that fallen inside the range of human breathing rate were remapped to the first image frame, creating a life signs map that indicates possible survivor locations.
This method performs well by assuming that only human breathing-related motions exist in the video. However, in some natural disasters, there may be undesired background motions in surroundings, such as swing trees and grass caused by wind. Current method did not discern between breathing and background motions, but averaged them to estimate the breathing signal. However, the breathing signal may be contaminated by background motions, and the estimated breathing rate may be wrong or not in the range of human breathing rate, resulting in misleading or no life signs locations. Another limitation of this approach is computational complexity, due to the expensive video stabilization and motion magnification for all tile videos.
Our method proposed in this paper is more robust to background motions by using an FV feature to isolate breathing movements from background motions. Additionally, the proposed method does not need to decompose the original video into tiles, nor magnify motions, thus runs faster than the current method. A comparison among these drone-based technologies for life signs detection and localization is summarized in Table 1, with specific focus on main characteristics, key techniques, main pros and cons, as well as on the distance between the drone and subject and the number of subjects of each approach.

3. Method

This study focuses on the detection and localization of life signs in disaster areas using a frequency variability (FV) feature. First, the drone video is preprocessed by video stabilization and temporal filtering. Second, we will describe the principal of the FV feature proposed in this method, and explain why FV is a useful feature to discern human breathing movements from background motions. Finally, we will show how to detect the survivor locations and breathing signal using the estimated FV values. The process is illustrated in Figure 1.

3.1. Video Preprocessing

Drone videos often suffer from camera motions caused by the platform movement and wind [2]. In recent years, video stabilization methods have been developed as a useful tool to remove camera motions [36,37]. They use the key points of adjacent image frames to stabilize drone videos. However, the larger the number of key points in the raw video, the more time it would cost in the stabilization operation. In order to reduce this cost, in this study the 1920 × 1080 raw video was downsampled to 960 × 540 with a scale factor β = 0.5 , by using the bicubic interpolation algorithm [38]. Similar to [2], the downsampled video was then stabilized using the MathWork’s publicly available video stabilization work [39].
After that, the subtle intensity changes B ( x ; t ) at each position x and time t used to describe the motion signals in drone videos are obtained by referring to EVM method [24], as described in Section 2.1. Note that the more frequency components of B ( x ; t ) are preserved, the more frequency information can be used to distinguish between human breathing movements and background motions. However, we found that frequencies lower than 0.1 Hz negatively affect our method’s performance for detecting more location points of life signs. This is because that there are low-frequency camera movements residual in the stabilized video [2] that always have high amplitudes and dominate the peak frequencies of B ( x ; t ) . Taking these elements into consideration, the components of B ( x ; t ) lower than the cut off frequency f c o = 0.1 Hz were removed by an ideal bandpass filter (i.e., temporal filtering). For convenient notation, the filtered subtle motions are still written as B ( x ; t ) when there is no ambiguity.

3.2. Frequency Variability Feature

In order to discern human breathing movements from background motions, we firstly explain their difference in the frequency property. Note that human breathing is a natural physiological phenomenon; it is a steady periodic motion and thus can be expressed by
B b r e ( x ; t ) = A b r e ( x ) s i n ( 2 π f b r e t + θ ( x ) ) ,
where A b r e , f b r e and θ correspond to the amplitude, breathing rate and initial phase, respectively, and they are constant over time. While background motions, such as swing trees and grass caused by wind, always involve complex space-time behavior, they are defined as
B b a c ( x ; t ) = A b a c ( x ; t ) s i n ( 2 π f b a c ( x ; t ) t + ϕ ( x ; t ) ) ,
where A b a c , f b a c and ϕ are functions of time for amplitude, frequency and phase. We focused on the frequency property, and found that the peak frequencies of B b r e ( x ; t ) are constant over time and fall within the range of human breathing rate; while for B b a c ( x ; t ) , their peak frequencies always vary with time t and may not be in this breathing rate range. Therefore, we consider that the temporal variability of peak frequencies of motions, i.e., frequency variability (FV) feature, enables us to isolate breathing movements from background motions. That is, the human breathing movements can be identified by assessing two frequency properties: the peak frequencies (1) keep constant over time, and (2) fall within the frequency band of human breathing. These two properties are key components of our proposed FV feature. The details are as follows.
For obtaining the temporal peak frequencies of motion signal B ( x ; t ) at 2D pixel coordinates x in the video, we first took its short-time Fourier transform (STFT) as
S T F T B ( x ; t , f ) = [ B ( x ; u ) g ¯ ( x ; u t ) ] e j 2 π f u d u ,
where g ( x ; t ) is a Hamming window that divides B ( x ; t ) into segments and performs windowing, and g ¯ denotes the complex conjugate of g ( x ; t ) . The number of segments is N = ( l e n s a m p l e + 5 ) / 5 , where l e n is the signal length of B ( x ; t ) , and s a m p l e is the window width denoted by f l o o r ( f s / f r e s ) , where f l o o r ( z ) rounds z to integer, f s denotes the video frame rate, and f r e s is the frequency resolution that denotes the minimum frequency interval in a spectrum. Unless mentioned otherwise, f r e s is set to 0.25 Hz in this paper. Then, we recorded the peak frequency P F i x of each local frequency spectrum of B ( x ; t ) and obtained the temporal peak frequencies P F 1 x , P F 2 x , . . . , P F i x , . . . , P F N x , 1 i N . Waves of temporal peak frequencies of three representative motion signals, which are located respectively at positions A, B and C (see the marked three points in Figure 1a), are illustrated in Figure 1c. From the wave plot, we can see that the red wave corresponding to the motion signal at point A (located around chest region) is a constant line, while the brown and blue waves at point B and C (located in the background) are variable over time. These waves in turn indicate that there indeed is a difference in the temporal variability of peak frequencies for human breathing and background motions.
In order to estimate the FV feature of B ( x ; t ) from temporal peak frequencies, the geometric algebra of a 2D scatter plot is applied in this study. The 2D scatter plot (see Figure 1d) was drawn with a set of scatter points, and the coordinates of each scatter point P i x are consisted by two adjacent peak frequencies P F i x and P F i + 1 x . Then, the FV feature was modeled by using the geometric distance of these scatter points. That is, the distance between two contiguous scatter points indicates the variation of two adjacent peak frequencies; moreover, since the 1D breathing frequency band ( F l o w , F h i g h ) can be equivalently expressed by a 2D grid cell in the scatter plot (see the green square in Figure 1d), the distance between the scatter point P i x and two vertices ( P l o w and P h i g h ) of the grid cell indicates whether or not a peak frequency is in the breathing frequency band. These lead to the formulation of the FV feature, defined as
F V ( x ) = i = 1 N 1 L 1 ( P i x , P i + 1 x ) + i = 1 N L 1 ( P i , P l o w ) + L 1 ( P i , P h i g h ) L 1 ( P l o w , P h i g h ) ,
where L 1 denotes the L1 norm distance between two scatter points, P l o w and P h i g h are two vertices of the grid cell lying on the line of identity (LI). The coordinates of P l o w and P h i g h are ( F l o w , F l o w ) and ( F h i g h , F h i g h ) , respectively.
In this formulation, the first term is fidelity term, enforcing the current peak frequency to be equal to the next adjacent one. The second term is a constraint term, which requires the peak frequency to be in the breathing frequency band ( F l o w , F h i g h ). These two terms create a solution which maintains the constant of the temporal peak frequencies and satisfies the frequency band of human breathing. It can be found from Equation (6) that for a breathing movement with constant peak frequencies, the FV value is 0; while for background motions with variable peak frequencies, the corresponding FV values are greater than 0. Thus, human breathing movements can be isolated from background motions by identifying whether the FV feature is 0 or not.

3.3. Detection and Localization of Life Signs

Based on the analysis of the FV feature, we designed a binary location map (LM) that indicates possible survivor locations. This location map is designed by identifying whether F V ( x ) is 0 or not, as
L M ( x ) = 1 F V ( x ) = 0 0 others .
This location map has high values (equivalent to 1) only when motion signal having constant peak frequencies and satisfying the breathing frequency band appears, meaning that it can detect only locations where human breathing movements appear, and ignores that where background motions exist. Through this process, our method presents clear locations of living people, without negative effects of background motions. The false color rending of LM and the localization result created by mapping LM on the first frame are shown in Figure 1e,g.
Based on the location map L M ( x ) , we obtained the survivor’s breathing signal as follows. First, we detected the positions x with a pixel value of 1 in L M ( x ) , and extracted corresponding subtle intensity changes B ( x ; t ) at x from the stabilized video. Then, by averaging and filtering these intensity changes as done in [2,40], the breathing signal can be expressed by
B S ( t ) = 1 M x B ( x ; t ) B P F ( t ) ,
where M is the number of positions x , ⊗ is a convolution operator, and B P F ( t ) is an ideal bandpass filter with band ( F l o w , F h i g h ), specified as (0.2, 0.33) Hz in this paper. Through this process, our method extracts a pure breathing signal, without contamination by background motions (see Figure 1f). The algorithm of this study is presented in Algorithm 1.
Algorithm 1: Frequency Variability Feature for Life Signs Detection & Localization in Natural Disasters.
  • Input:  drone video;
  • Output:  location map L M ( x ) ; breathing signal B S ( t )
  • Initialization:
  •     video downsampling scale factor β , 0.5;
  •     cut off frequency f c o , 0.1 Hz;
  •     frequency resolution f r e s , 0.25 Hz;
  •     frequency band of human breathing, (0.2, 0.33) Hz;
  • Video preprocessing:
  •     downsample and stabilize the drone video;
  •     extract and filter motion signals B ( x ; t ) at each position x ;
  • Detection and localization:
  •   for each B ( x ; t ) at position x do
  •     do STFT of B ( x ; t ) using Equation (5);
  •     record temporal peak frequencies;
  •     calculate frequency variability feature F V ( x ) using Equation (6);
  •     if F V ( x ) = 0 then
  •         set location map at x to 1, i.e., L M ( x ) = 1 ;
  •         record B ( x ; t ) ;
  •     else
  •         set location map at x to 0, i.e., L M ( x ) = 0 ;
  •     end if
  •   end for
  •   average and filter all the recorded B ( x ; t ) to obtain breathing signal B S ( t ) using Equation (8).

4. Experimental Results

4.1. Experimental Setup

To evaluate the effectiveness of our method, which detects and locates the life signs from drone videos under the presence of background motions, we performed experiments on 20 drone videos. These videos were recorded by a drone, DJI Mavic Air2, at different angles and places in the wild (simulated disaster scenarios) where background motions exist, such as swinging trees and grass caused by wind. During video capture, we set f s at 60 fps, the resolution 1920 × 1080 pixels, the duration 20 s, and the altitude of drone in hovering state 3–4 m. A total of seven human subjects (five males and two females) aged from 20 to 53 years and one full-body male mannequin (1.72 m tall, fully clothed) participated in these experiments. During the data capture, the human subjects were asked to lie down comfortably and breath naturally. All subjects gave their informed consent for inclusion before they participated in the study. The study was conducted in accordance with the Declaration of Helsinki, and approved by Hefei University of Technology (Project identification code: 18-163-21-TS-001-061-01, date of approval: 27 October 2018).
Referring to the simulated scenarios used in previous work [
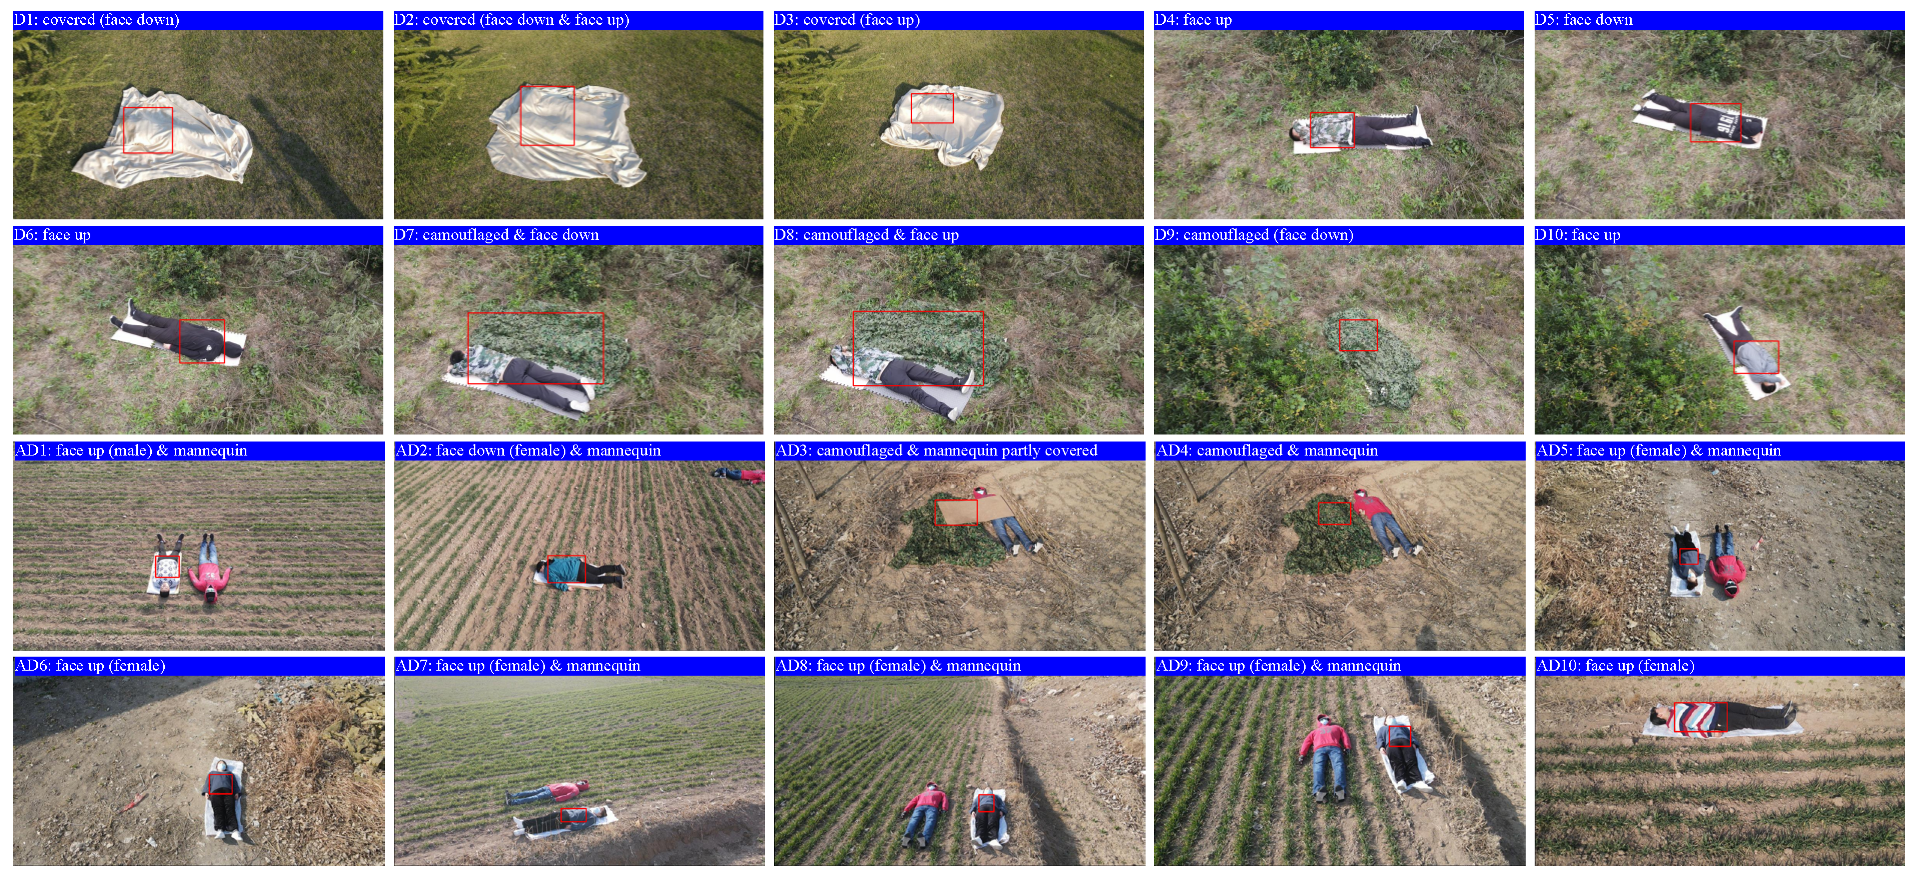
2], the drone videos with different simulated scenarios in our experiments included (1) three videos of subject(s) fully covered with a blanket, (2) six videos of a fully visible subject (face up and face down), (3) two videos of a camouflaged subject and clearly visible subject, (4) one video of a camouflaged subject, (5) six videos of a mannequin and clearly visible subject, (6) one video of a mannequin and camouflaged subject and (7) one video of a mannequin and camouflaged subject partly covered with wood plank. Similar to [2], we drew a red bounding box enclosing the chest area of human subjects in the first frame of videos as the ground truth. 
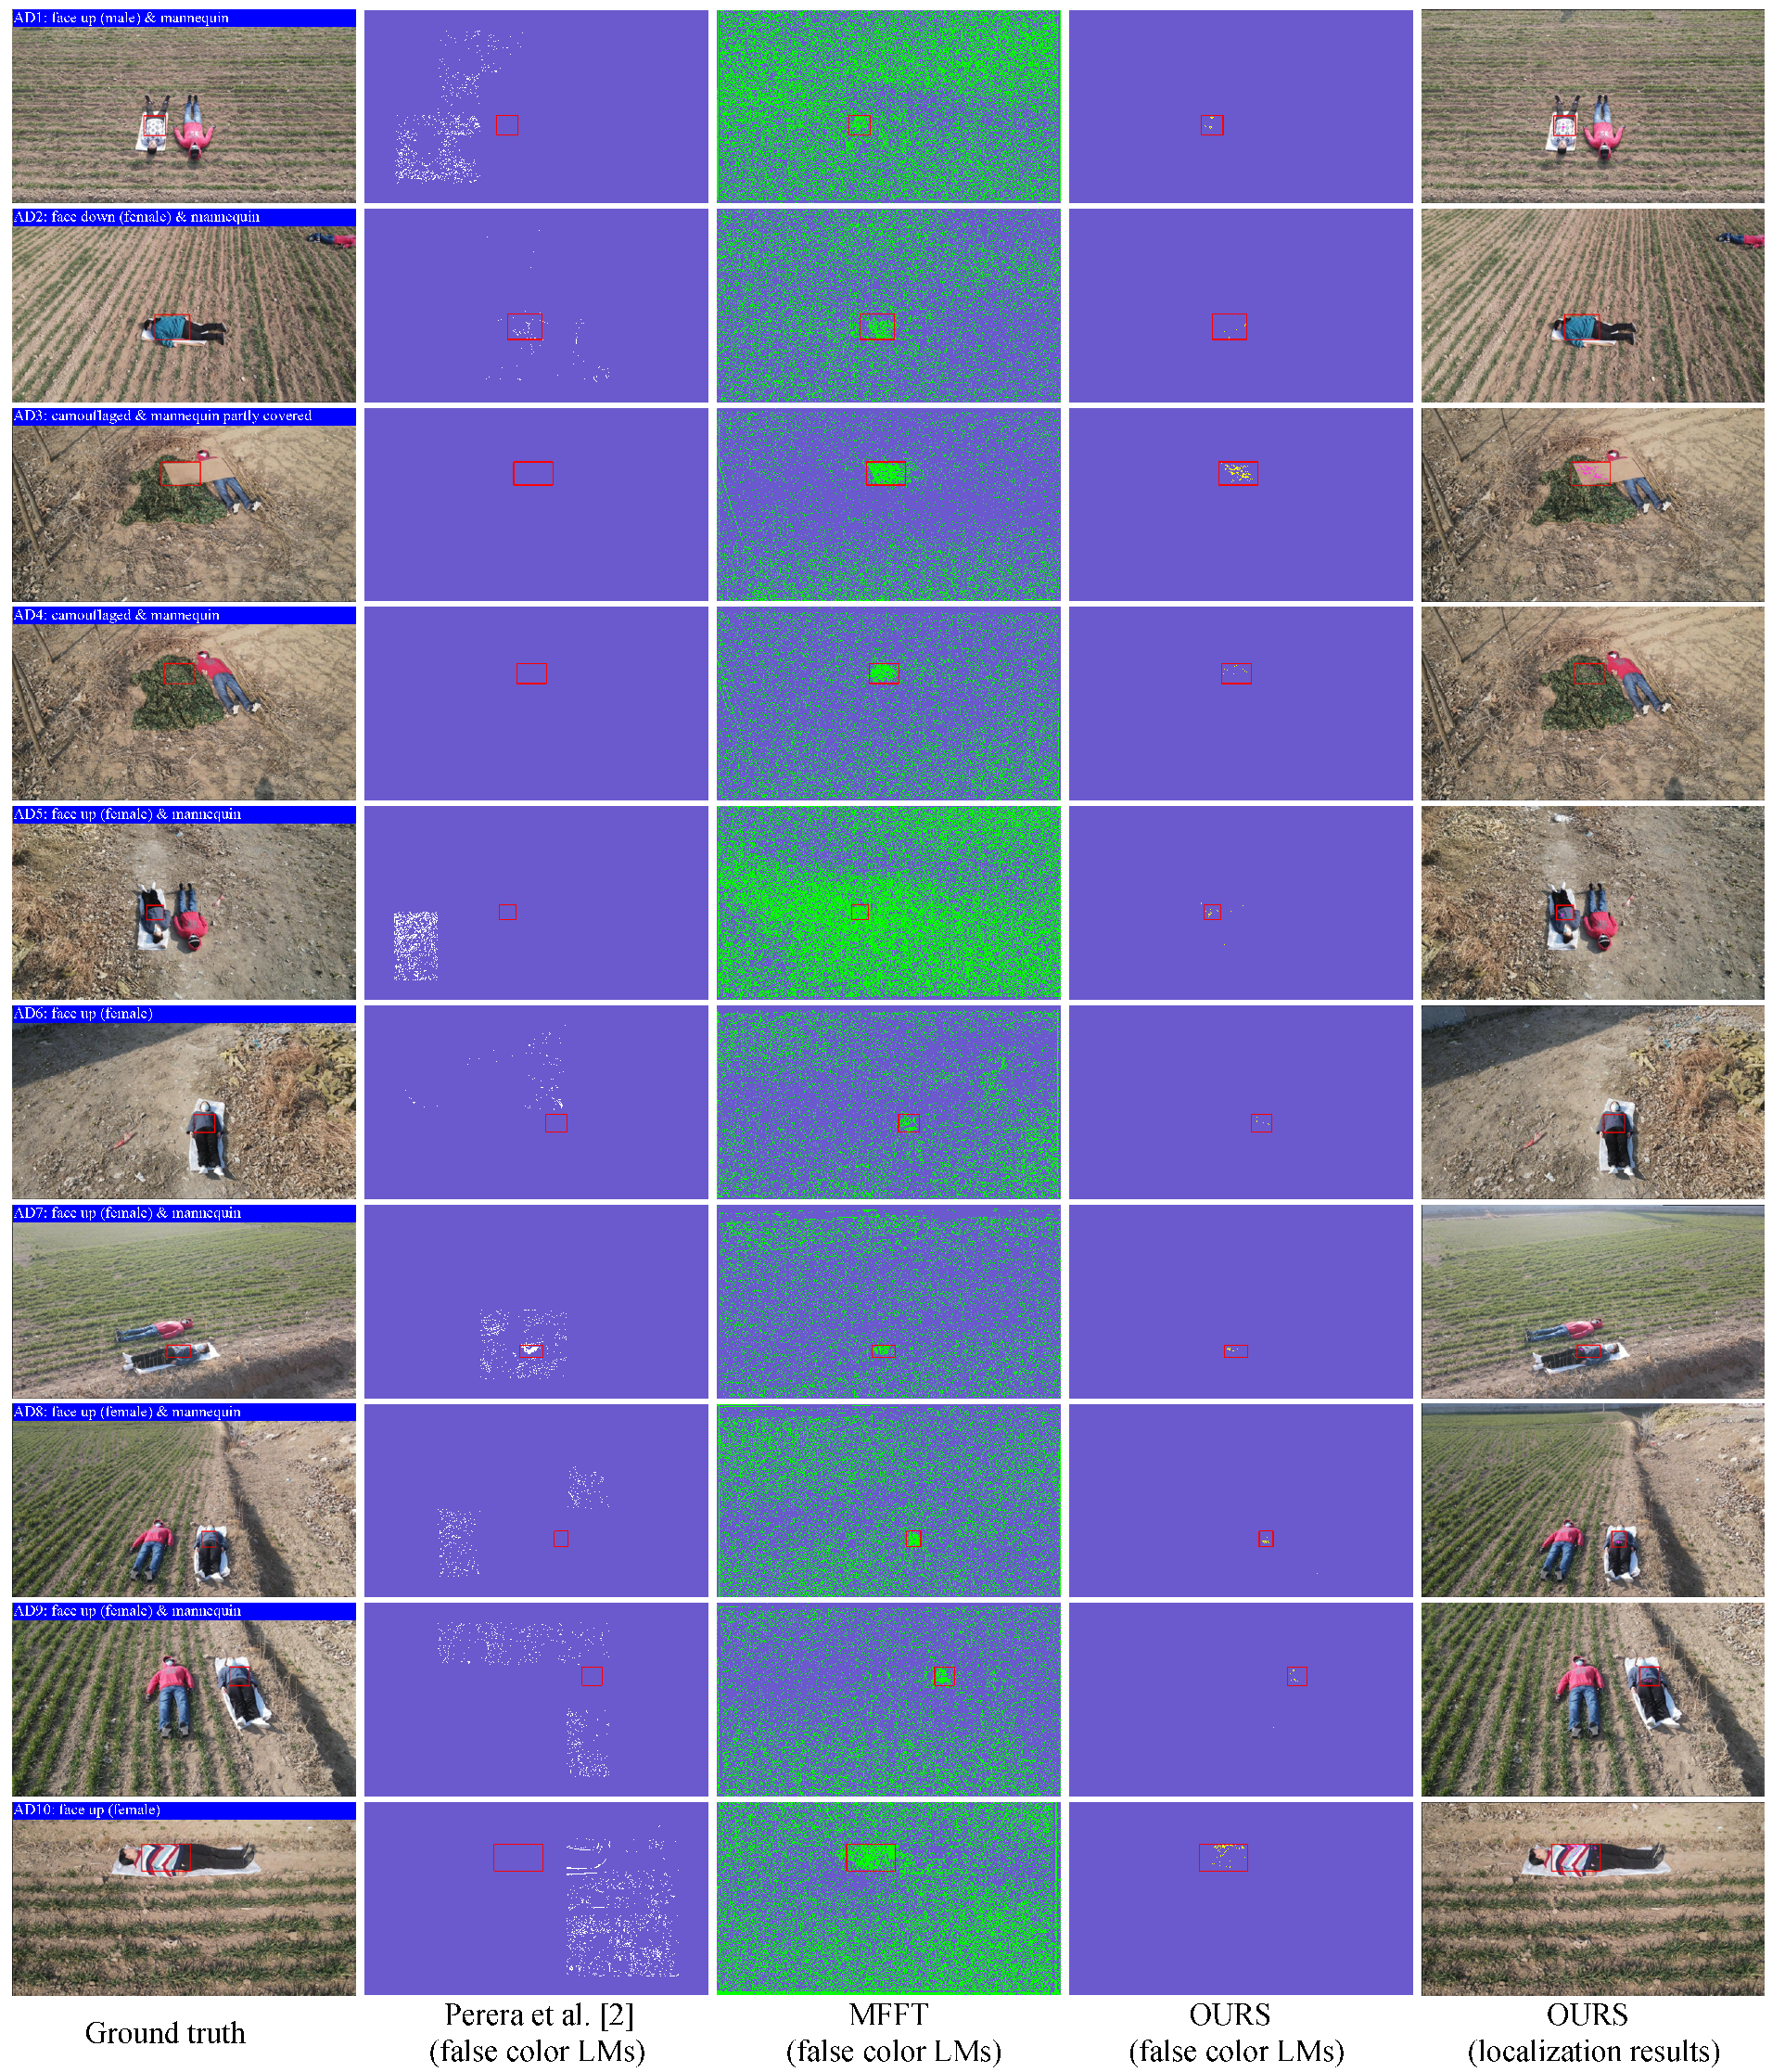
Figure 2 shows the first frames and ground truth regions for 20 drone videos. Note that we presented and discussed the experimental results of the first ten drone videos (i.e., D1 to D10) in the main text, and the experimental results of the last ten drone videos (i.e., AD1 to AD10) are shown in the appendix (see Table A1 and Figure A1). Either of the two group results is reliable to indicate the effectiveness of the proposed method. Unless mentioned otherwise, the ten drone videos examined in the main text are the first ten videos, i.e., D1 to D10. Additionally, to evaluate the performance of the proposed method on stable videos, we also did experiments on five camera videos, which were collected in the wild by using a stationary Canon camera (for details, see Section 4.4.2). All experiments were implemented in MATLAB, and ran on a computer server with an Intel Xeon Silver 4114 CPU at 2.20 GHz and 128 GB of RAM.

4.2. Evaluation Criteria

To evaluate the performance of our method on the detection of life signs from drone videos, we focus on five criteria. They are the detection precision D P , the location density L D , the number of false detected points F P , the computational time C T and the joint performance J P .
Detection precision is the ability of a classification model to identify only the relevant data points, that is, the fraction of detected items that are correct [2]. It is defined as
D P = T P T P + F P ,
where T P is the number of human locations that are correctly detected and F P is the number of items that are falsely detected as human locations. In our experiments, if the pixel positions of detected human breathing are in the ground truth box, they are regarded as correct localization items, otherwise not.
Location density is to measure the denseness of life signs locations detected correctly, and is expressed by
L D = T P G T ,
where G T is the total pixel number in the ground truth region.
Taking D P , L D , F P and C T into consideration, we defined a new evaluation criterion J P to evaluate the joint performance of a method on detection precision, location density, false detection and computational time. Formally, given K drone videos, we tested the k t h video with Q methods and recorded their D P , L D , F P and C T in four vectors respectively as D P V k = D P k 1 , . . . , D P k q , . . . , D P k Q , L D V k = L D k 1 , . . . , L D k q , . . . , L D k Q , F P V k = F P k 1 , . . . , F P k q , . . . , F P k Q and C T V k = C T k 1 , . . . , C T k q , . . . , C T k Q , where D P k q , L D k q , F P k q and C T k q are the detection precision, location density, the number of false detections and computational time of the k t h drone video tested by the q t h method, 1 k K , and 1 q Q . Then, we normalized all elements of each vector between 0 and 1, and obtained the normalized vectors as D P V k ˜ = D P k 1 ˜ , . . . , D P k q ˜ , . . . , D P k Q ˜ , L D V k ˜ = L D k 1 ˜ , . . . , L D k q ˜ , . . . , L D k Q ˜ , F P V k ˜ = F P k 1 ˜ , . . . , F P k q ˜ , . . . , F P k Q ˜ and C T V k ˜ = C T k 1 ˜ , . . . , C T k q ˜ , . . . , C T k Q ˜ . Finally, the joint performance J P q of the q t h method can be defined as
J P q = 1 K k = 1 K ( D P k q ˜ + L D k q ˜ F P k q ˜ C T k q ˜ ) .
The J P value is high (close to 2) when a method has good performance with high detection precision, high location density, small number of false detections and low computational time, and becomes low (close to −2) when the method has contrasting performance.

4.3. Parameter Analysis

In this subsection, in order to evaluate the effectiveness of the proposed method under various parameter settings, experiments on ten drone videos were conducted. The default parameter settings in the proposed method are: (1) do video stabilization as preprocessing, (2) set the scale factor β to 0.5, (3) set the cut-off frequency f c o to 0.1 Hz, and (4) set the frequency resolution f r e s to 0.25 Hz. When evaluating the performance of one parameter (e.g., video stabilization) on our method, we keep other parameters (e.g., β , f c o and f r e s ) unchanged. Experiments contain the following five aspects: (1) video stabilization, (2) image resolution, (3) temporal filtering, (4) frequency resolution and (5) fidelity term and constraint term.

4.3.1. Video Stabilization

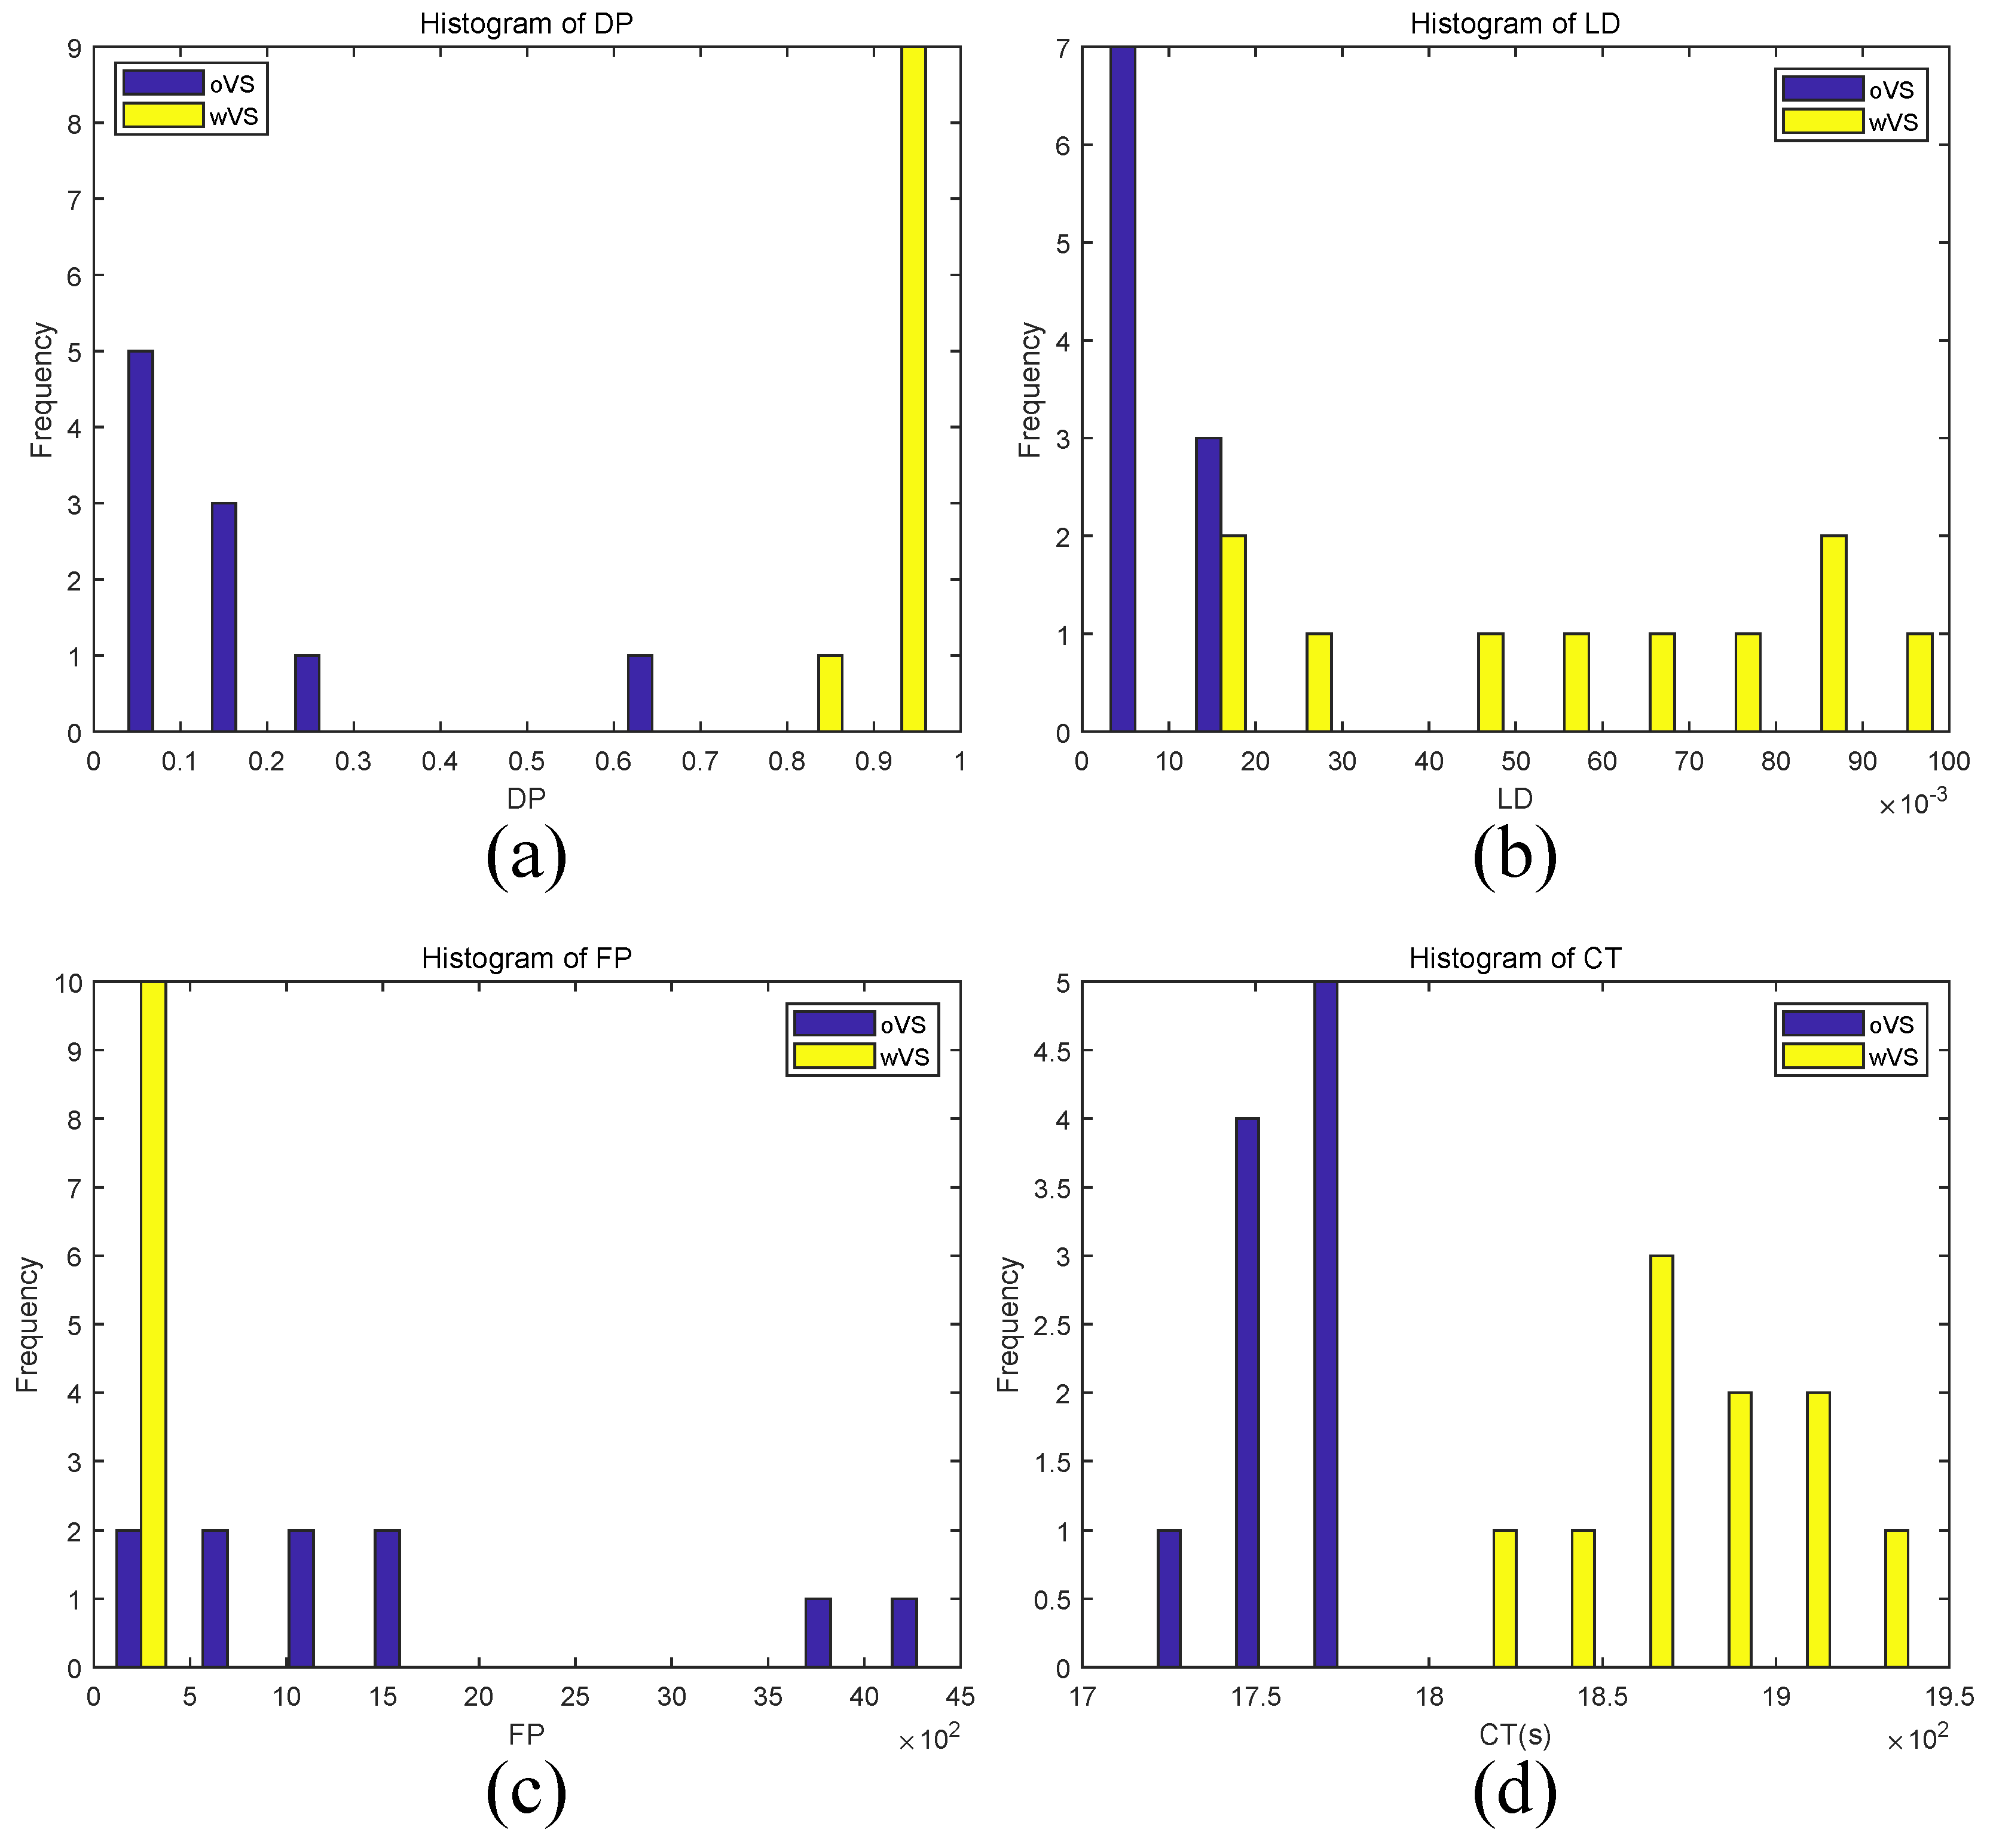
To validate the effectiveness of video stabilization, we tested the stabilized and unstabilized drone videos by our method. For convenient notation within the text, the methods with and without video stabilization are written as wVS and oVS, respectively, when there is no ambiguity. The histogram results of D P , L D , F P and C T for ten drone videos are shown in Figure 3. Each histogram axis is quantized into several bins. The horizontal axis represents the range of D P , L D , F P and C T , and the vertical axis corresponds to the number of videos in each bin.
The D P of wVS ranged from 0.87 to 0.98, while that of oVs ranged from 0.02 to 0.62 (see Figure 3a). The L D of wVS distributed in the interval larger than 14.36‰, while that of oVs distributed less than 19.94‰(see Figure 3b). Additionally, the F P of wVS mainly located at regions with false detection less than 194, while that of oVs distributed widely from 36 to 4495 (see Figure 3c). The C T of wVs were in the range (1827.84, 1942.95) s, and that of oVs were in (1716.96, 1784.67) s (see Figure 3d).
The C T histogram (Figure 3d) shows that the method wVs costs more time (the average C T is 1877.56 s) than oVS (the average C T is 1758.88 s). This is because wVs needs to take time to do the process of video stabilization, while oVS not. However, method wVs has a better performance on D P , L D and F P than oVS. For example, the average D P and L D values of wVS are 0.94 and 57.38‰, which are much higher than that of oVS, i.e., 0.17 and 8.69‰; furthermore, the average F P of wVS is 57, which is much lower than that of oVS, 1517. This is because the video stabilization in wVS can remove most of camera motions in the drone video that helps the resulting stabilized video to meet the first-order Taylor series expansion [24], therefore, the subtle motions can be extracted effectively at fixed positions by using Equation (2) that helps to detect the target human breathing; however, for oVS, the raw drone video without stabilization does not meet this expansion, resulting in distorted motions caused by camera motions that lead to false detection. The joint performance values of wVS and oVS are 1 and −1, respectively, indicating that video stabilization is a useful preprocessing to improve method’s performance.

4.3.2. Image Resolution

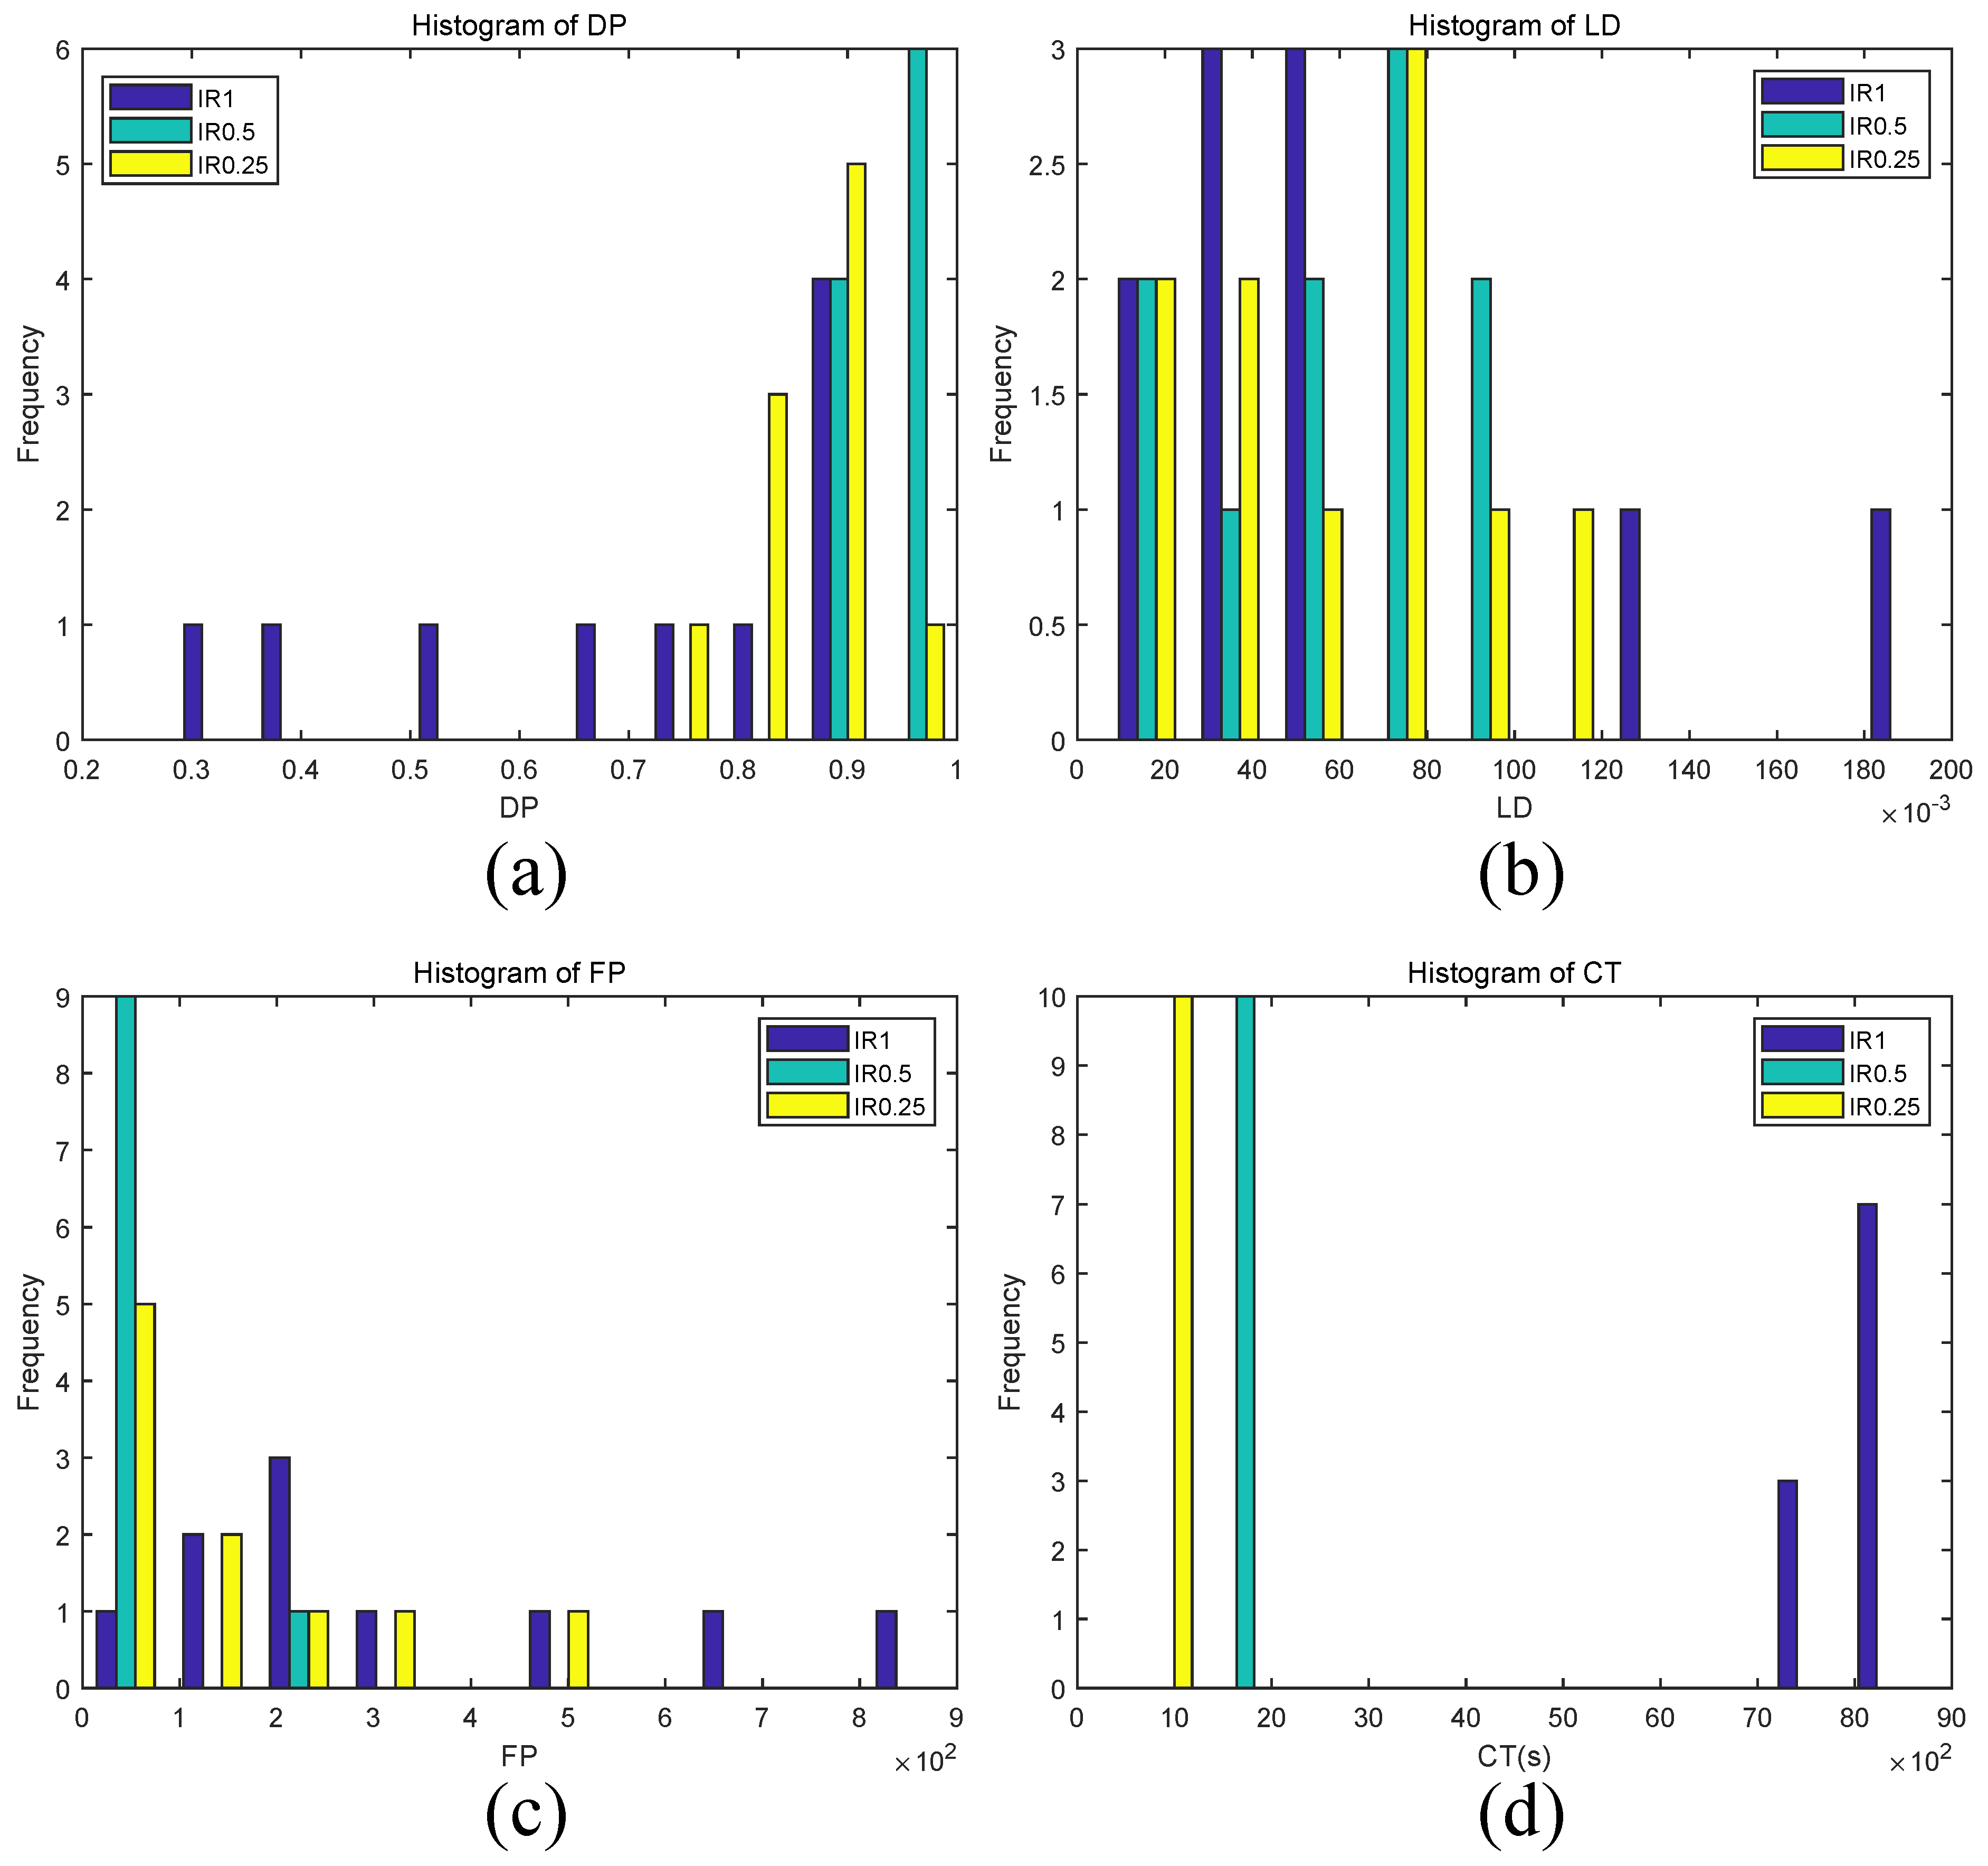
Next, we examined the impact of image resolution on reducing the time cost. We set the scale factor β to 1, 0.5 and 0.25, and write methods under these three factors as IR1, IR0.5 and IR0.25, respectively. Under the different scale factors, the histogram results of D P , L D , F P and C T of the proposed method for ten drone videos are shown in Figure 4.
The D P values of IR0.25, IR0.5 and IR1 ranged from 0.72 to 1.0, from 0.87 to 0.98 and from 0.28 to 0.91, respectively (see Figure 4a). For methods IR0.25 and IR0.5, they had a similar L D distribution in the range (6.35‰, 106.83‰); while IR1 had a wide range of L D , from 15.36‰to 197.58‰(see Figure 4b). In addition, the F P of IR0.5 was mainly located in the range (22, 194), while that of IR0.25 and IR1 ranged from 0 to 456 and 85 to 892, respectively (see Figure 4c). The C T values of IR0.25 and IR0.5 were in the range (495.31, 536.12) s and (1827.84, 1942.95) s, while that of IR1 was in (7492.91, 8727.41) s (see Figure 4d).
The C T histogram (Figure 4d) shows that the computational time is significantly reduced with the decrease of image resolution. For instance, the average C T values of IR1, IR0.5, and IR0.25 are 8272.06 s, 1877.56 s and 507.28 s respectively. This is because the number of key points in downsampled image is smaller than that in the raw image, and therefore improving the computation speed of video stabilization process. However, when downsampled the raw video further from β = 0.5 to a smaller scale factor β = 0.25 , the performance on D P , L D and F P became a little worse. For instance, the average D P and L D values decreased from 0.94 to 0.87 and from 57.39‰to 56.01‰, respectively, and the average F P increased from 57 to 142. There are likely two reasons for this outcome. On the one hand, videos at small image resolution may have smaller number of target signals than that of videos at larger ones, therefore resulting in low D P and L D . On the other hand, the target signals may be distorted when downsampling the raw video from fine resolutions to coarse ones, thus resulting in high F P . Additionally, results also show that IR1 has poor performance, not only on C T , but also on D P and F P . For example, IR1 has a lower average D P (i.e., 0.70) than that of IR0.5 and IR0.25 (i.e., 0.94 and 0.87), and has a higher average F P (i.e., 347) than that of IR0.5 and IR0.25 (i.e., 57 and 142). This may due to the fact that in the raw video, some background motions satisfying F V ( x ) = 0 are falsely detected as target breathing motions, therefore resulting in low D P and high F P . These background motions may be removed in the downsampling process, therefore IR0.5 and IR0.25 have better performance on D P and F P than IR1. Taking all criteria results into consideration, the joint performance criterion JP of method IR0.5 with β = 0.5 is the highest (i.e., 1.29), especially compared to that of IR1 and IR0.25 (i.e., −1.27 and 0.74). Therefore, the scale factor was set to 0.5 in all experiments for obtaining a better performance on detection precision, location density, false detection and time cost at the same time.

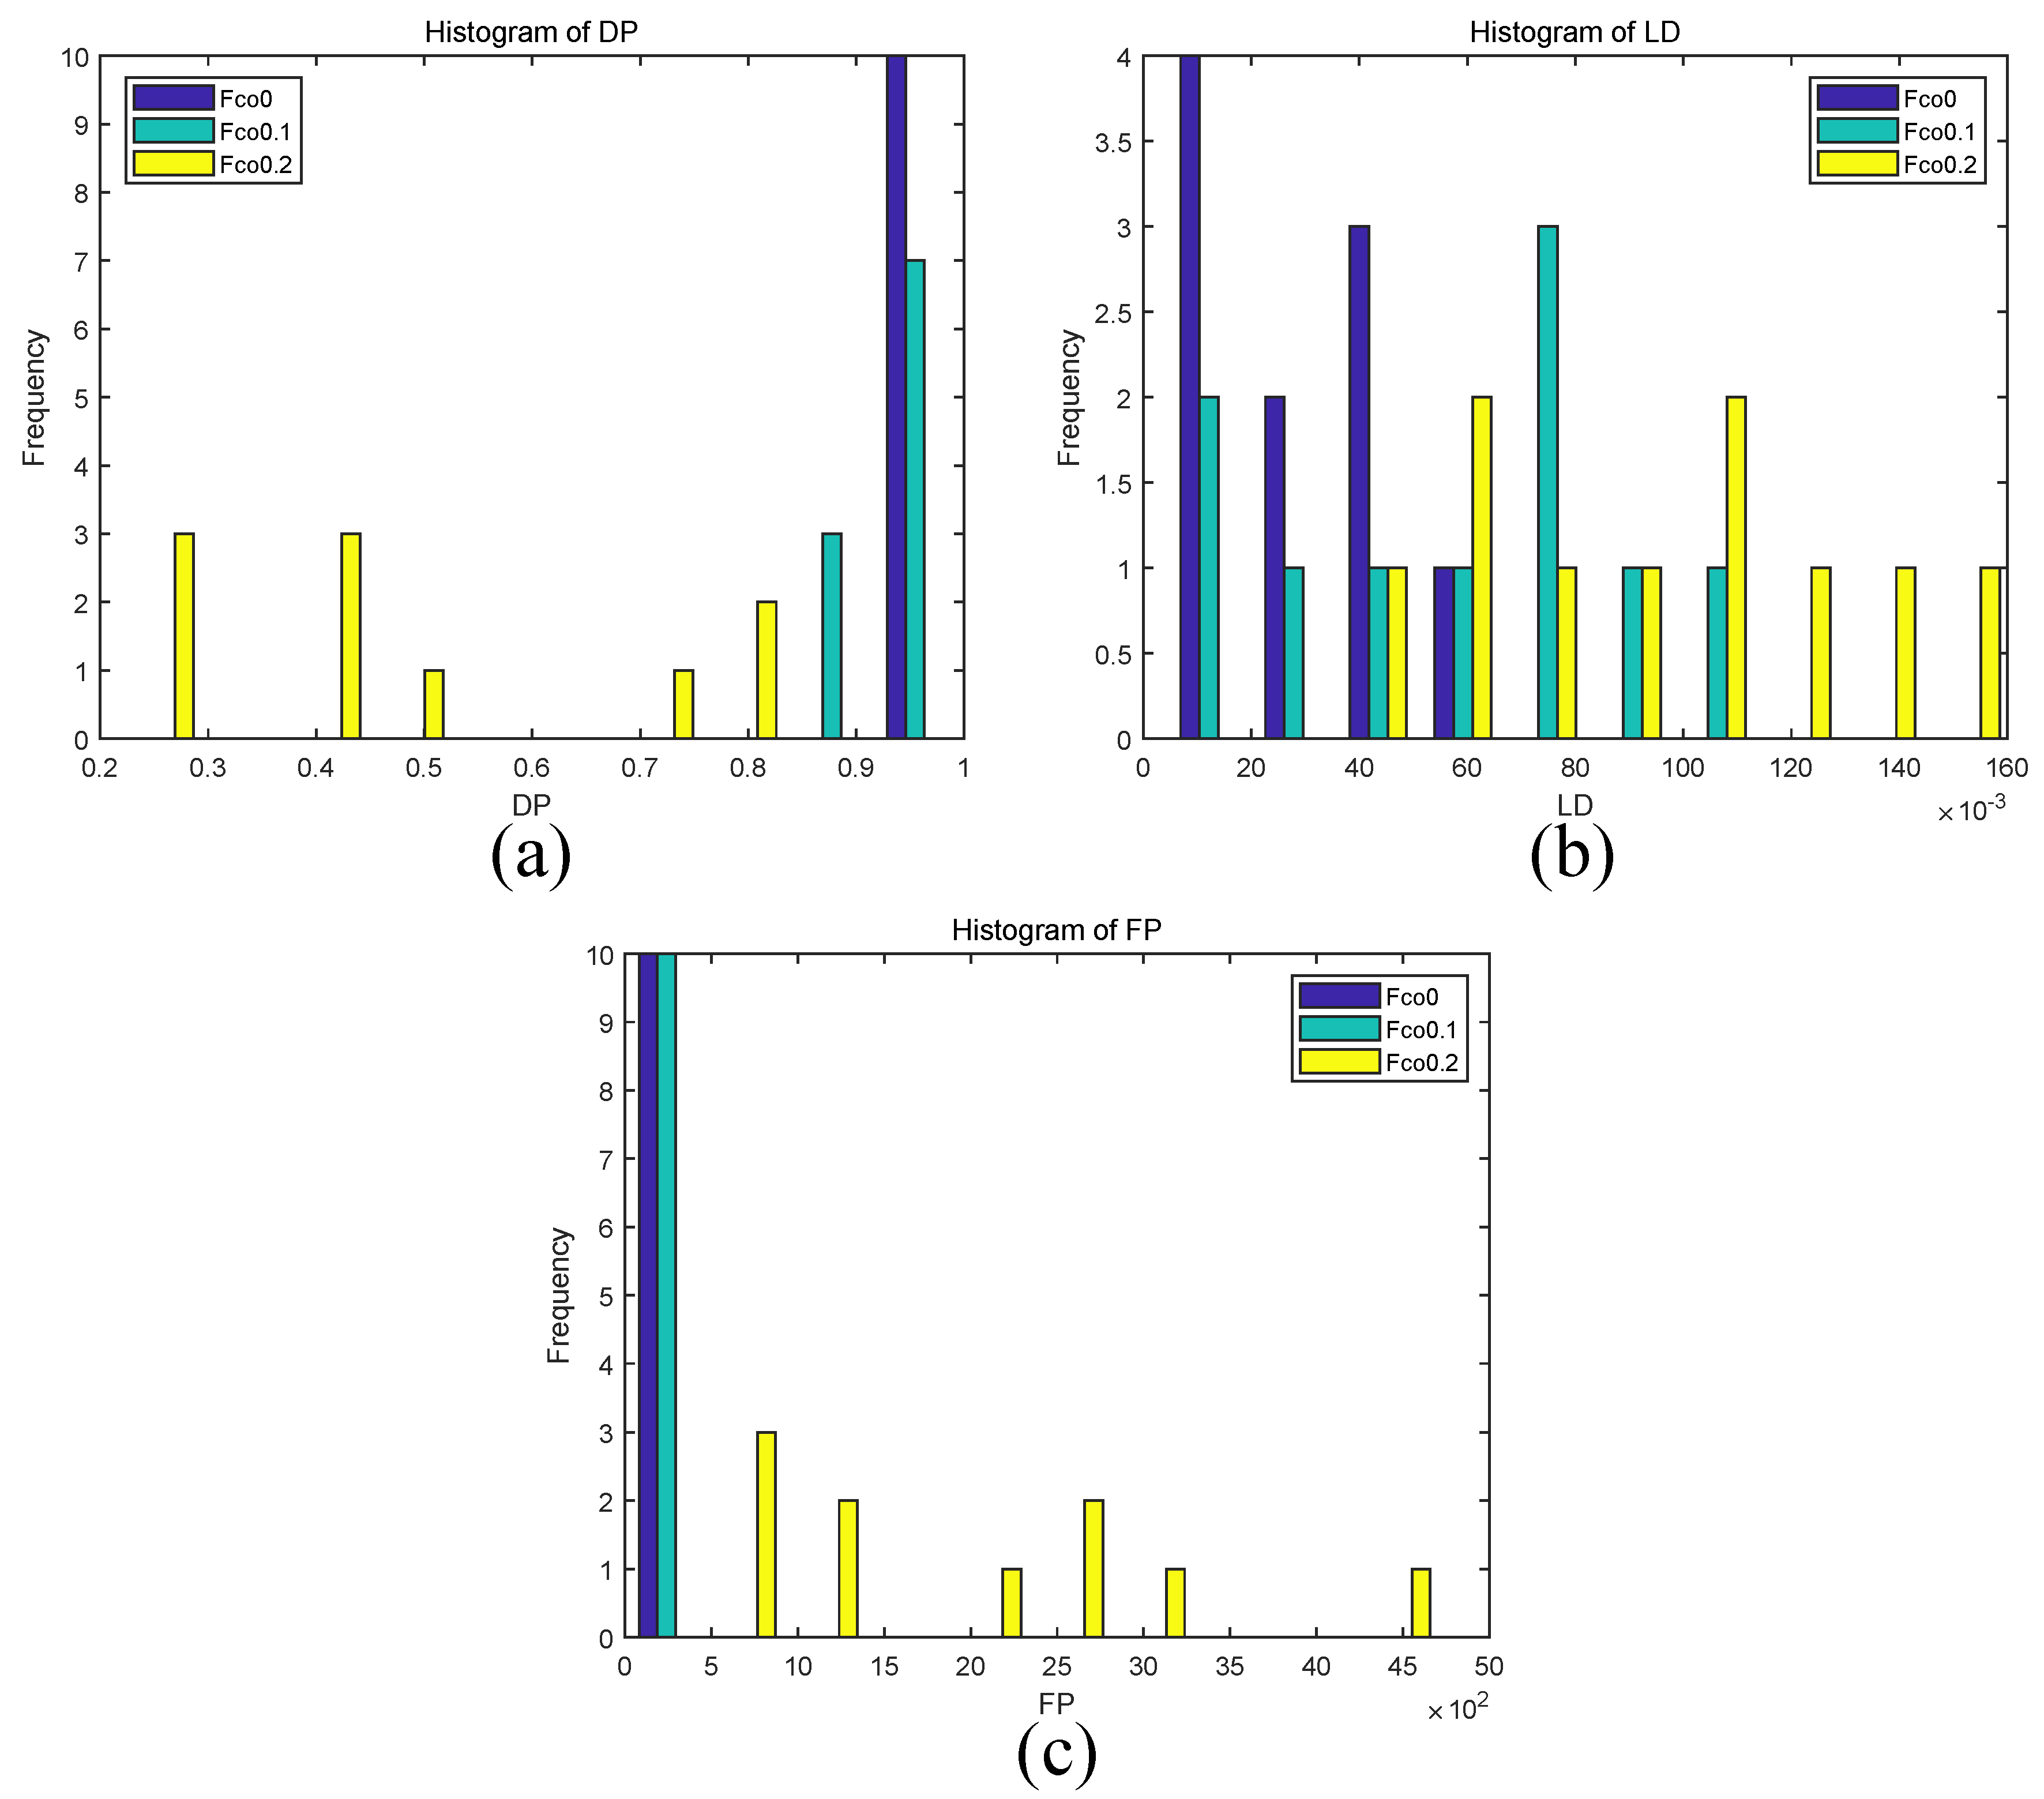
4.3.3. Temporal Filtering

In this part, we analyzed the performance of the proposed method with three different cut off frequencies f c o , i.e., 0, 0.1 and 0.2 Hz (which are not larger than the lower bound of breathing rate F l o w ). The corresponding methods are labeled as Fco0, Fco0.1 and Fco0.2 for convenient notation. Since the total computational time does not change much when adjusting the f c o value in temporal filtering, only detection precision D P , location density L D and false detection F P are evaluated, except for C T . Under different cut off frequencies, the histogram results of D P , L D and F P of the proposed method for ten drone videos are shown in Figure 5.
The D P values of Fco0, Fco0.1 and Fco0.2 ranged from 0.96 to 0.99, from 0.87 to 0.98 and from 0.22 to 0.84, respectively (see Figure 5a). The L D of Fco0 was mainly distributed in the low range (4.29‰, 54.50‰), that of Fco0.1 distributed in the low-middle range (14.36‰, 100.14‰), and that of Fco0.2 was in the middle-high range (49.36‰, 161.23‰) (see Figure 5b). In addition, the F P values of Fco0 and Fco0.1 mainly located in the interval (2, 194), while that of Fco0.2 was in (561, 4737) (see Figure 5c).
Although Fco0 has the highest D P values with an average 0.98, its average L D is the lowest (28.61‰). This may be due to the fact that there are residual low-frequency camera movements in the stabilized video that have high amplitude and dominate the peak frequency of B ( x , t ) ; therefore, only few target signals falling inside the range of human breathing are correctly detected. On the other hand, method Fco0.2 obtains the highest L D values but has the lowest D P and highest F P , due to many motions, including breathing signals and background motions, which do not satisfy F V ( x ) = 0 initially, could in turn become satisfied after removing frequency components lower than 0.2 Hz. By setting C T k q ˜ in Equation (11) to zero, the J P values corresponding to Fco0, Fco0.1 and Fco0.2 were 1.00, 1.36 and −0.009 respectively; it seems to obtain a good compromise between D P , L D and F P when setting f c o to 0.1 Hz.

4.3.4. Frequency Resolution

Then, the impact of various frequency resolutions f r e s on the performance of the proposed method was evaluated. The frequency resolution has four potential values: 0.1, 0.2, 0.25 and 0.3 Hz. Similar to the above notations, the corresponding methods are written as Fres0.1, Fres0.2, Fres0.25 and Fres0.3 if there is no ambiguity. Under four different frequency resolutions, 0.1, 0.2, 0.25, and 0.3 Hz, the JP and average results of D P , L D , F P and C T of the proposed method for ten drone videos are presented in Table 2.
As presented in Table 2, by increasing the value of f r e s , the average D P rises initially, peaks, and then falls, while the average L D , F P and C T always fall. Additionally, though Fres0.1 has the highest L D value 231.71‰, its average D P is the lowest (i.e., 0.27), and its average F P is the largest (i.e., 12,224). This is because of the fact that 0.1 Hz is a fine frequency resolution, so that some background motions with steady peak frequencies falling within the breathing frequency band (0.2, 0.33) Hz are falsely detected as life signals. One may improve the detection precision by increasing f r e s values. However, when increasing frequency resolution to be coarser (e.g., 0.3 Hz), which is close to or larger than the upper bound of breathing rate 0.33 Hz, the D P value falls again. For instance, we found that there are no life signs been detected when increasing f r e s higher than 0.5 Hz. This may be due to the fact that the real breathing rate cannot be detected correctly under coarser frequency resolutions. Taking D P , L D , F P and C T into consideration, our method has a better joint performance (i.e., J P = 1.16) when setting f r e s to 0.25 Hz. This suggests that a frequency resolution not larger than F l o w + 0.5 * ( F h i g h F l o w ) may be a candidate for users.

4.3.5. Fidelity Term and Constraint Term

Finally, we estimated the importance of the combination of fidelity term and constraint term in the model of the frequency variability feature (defined in Equation (6)). For comparison, we also evaluated the individual impact of fidelity term and constraint term on the performance of the proposed method. For convenient notation within the text, the methods when only fidelity term or constraint term works are written as MFt and MCt, respectively.
Note that a strict constraint, i.e., F V ( x ) = 0 , is used in our method for life detection and localization (for details, see Section 3.2 and Section 3.3, and Equation (7)); while, in this part, in order to assess and compare the robustness of MFt, MCt and our method for isolating breathing movements from background motions, we relaxed this strict constraint with a threshold τ allowing one to detect those motions whose FV value is not larger than τ . Here, we rewrite Equation (7) with a threshold τ as
L M ( x ) = 1 F V ( x ) τ 0 others .
The threshold τ is set to four different values manually in this experiment, i.e., 0, 0.1, 1 and 1.5. Here, τ = 0 means that Equation (12)) has the same ability with Equation (7)) to detect only motions that have constant peak frequencies and absolutely satisfy the breathing frequency band; while, for τ > 0 (e.g., 0.1, 1 or 1.5), it means that Equation (12)) also detects those background motions that have approximate peak frequencies and approximately satisfy the breathing frequency band. It means that when τ is 0, the probability of false detection is the lowest and the greater the τ is, the higher probability the false detection will be. The average results of D P , L D and F P for ten drone videos are reported in Table 3. Meanwhile, the C T values were not evaluated, since the total computational time does not change much under different FV thresholds.
Table 3 reports that these three methods have similar results when threshold τ is set to 0 or 0.1. This indicates that each of them performs well under a strict threshold constraint. When adjusting threshold from τ = 0.1 to higher value τ = 1.5 , the average D P of MFt significantly falls from 0.94 to 0.76, and average L D and F P values rise from 57.39‰to 103.51‰and from 57 to 539, respectively. This is due to that lots of motion signals (including both breathing and background motions) with slight changes in peak frequencies are detected as target motions. On the other hand, MCt shows a slight decrease in average D P and a small increase in average L D and F P values. This is because that MCt obtained some motions that have variable frequencies close to the breathing frequency band. In contrast, our method shows almost steady performance for all of the cases. For instance, the mean and standard deviation values of D P , L D and F P of our method under different thresholds are (0.94, 0), (58.03‰, 0.79‰) and (57.75, 0.96). This is because under the same threshold τ , our method using the combination of fidelity term and constraint term obtains less false detections than MFt and MCt. These results indicate that the combination of fidelity term and constraint term is important to remain the performance of frequency variability feature for isolating breathing movements from background motions. Additionally, note that when performing the proposed method in the practice, we do not use Equation (12) (which contains parameter τ ), but still Equation (7) (i.e., under the strict constraint F V ( x ) = 0 ) for obtaining the highest D P and lowest F P .
From the above parameter analysis, we can conclude as follows. (1) Video stabilization is a necessary preprocessing to remove the camera motions in drone videos, and helps to improve method’s performance. (2) A small resolution (e.g., 480 × 270 pixels) is recommended if users want to obtain method results in a short time (about 8.45 min); in addition, the resolution can be adjusted as users’ requirements change. (3) The temporal filtering enables us to remove the frequencies of residual low-frequency camera motions in a stabilized video; additionally, the cut off frequency f c o can be set with a low value (e.g., 0.1 Hz) but not lager than F l o w . (4) Frequency resolution f r e s seems to be an important factor; as finer f r e s value led to long computational time and large number of false detections, while coarser f r e s decreased the detection precision and location density, a frequency resolution not larger than F l o w + 0.5 * ( F h i g h F l o w ) may be a candidate for users. (5) For reliably isolating human breathing from background motions, both fidelity and constraint terms are recommended to be applied in the proposed model of the frequency variability feature.

4.4. Comparison Experiments

In this section, our method was compared with a motion magnification-based method recently proposed by Perera et al. [2]. Additionally, at the frequency variability feature we are after, one might ask: is it also valid when using only the main frequency of B ( x ; t ) rather than temporal peak frequencies to identify the life signs locations? Here, the main frequency means the frequency with largest power in the Fourier spectrum of B ( x ; t ) . To answer this question, we conducted another method, called MFFT. MFFT marks positions x as the life signs locations if the main frequency of B ( x ; t ) falls within the range of human breathing rate. Ten drone videos and five camera videos were tested in this section.

4.4.1. Drone Videos

Based on the parameters analyzed in Section 4.3, experiments on drone videos use the default parameter settings as follows: β = 0.5 , f c o = 0.1 Hz, f r e s = 0.25 Hz. Results of detection precision D P , location density L D , number of false detected points F P and computational time C T for ten drone videos are summarized in Table 4.
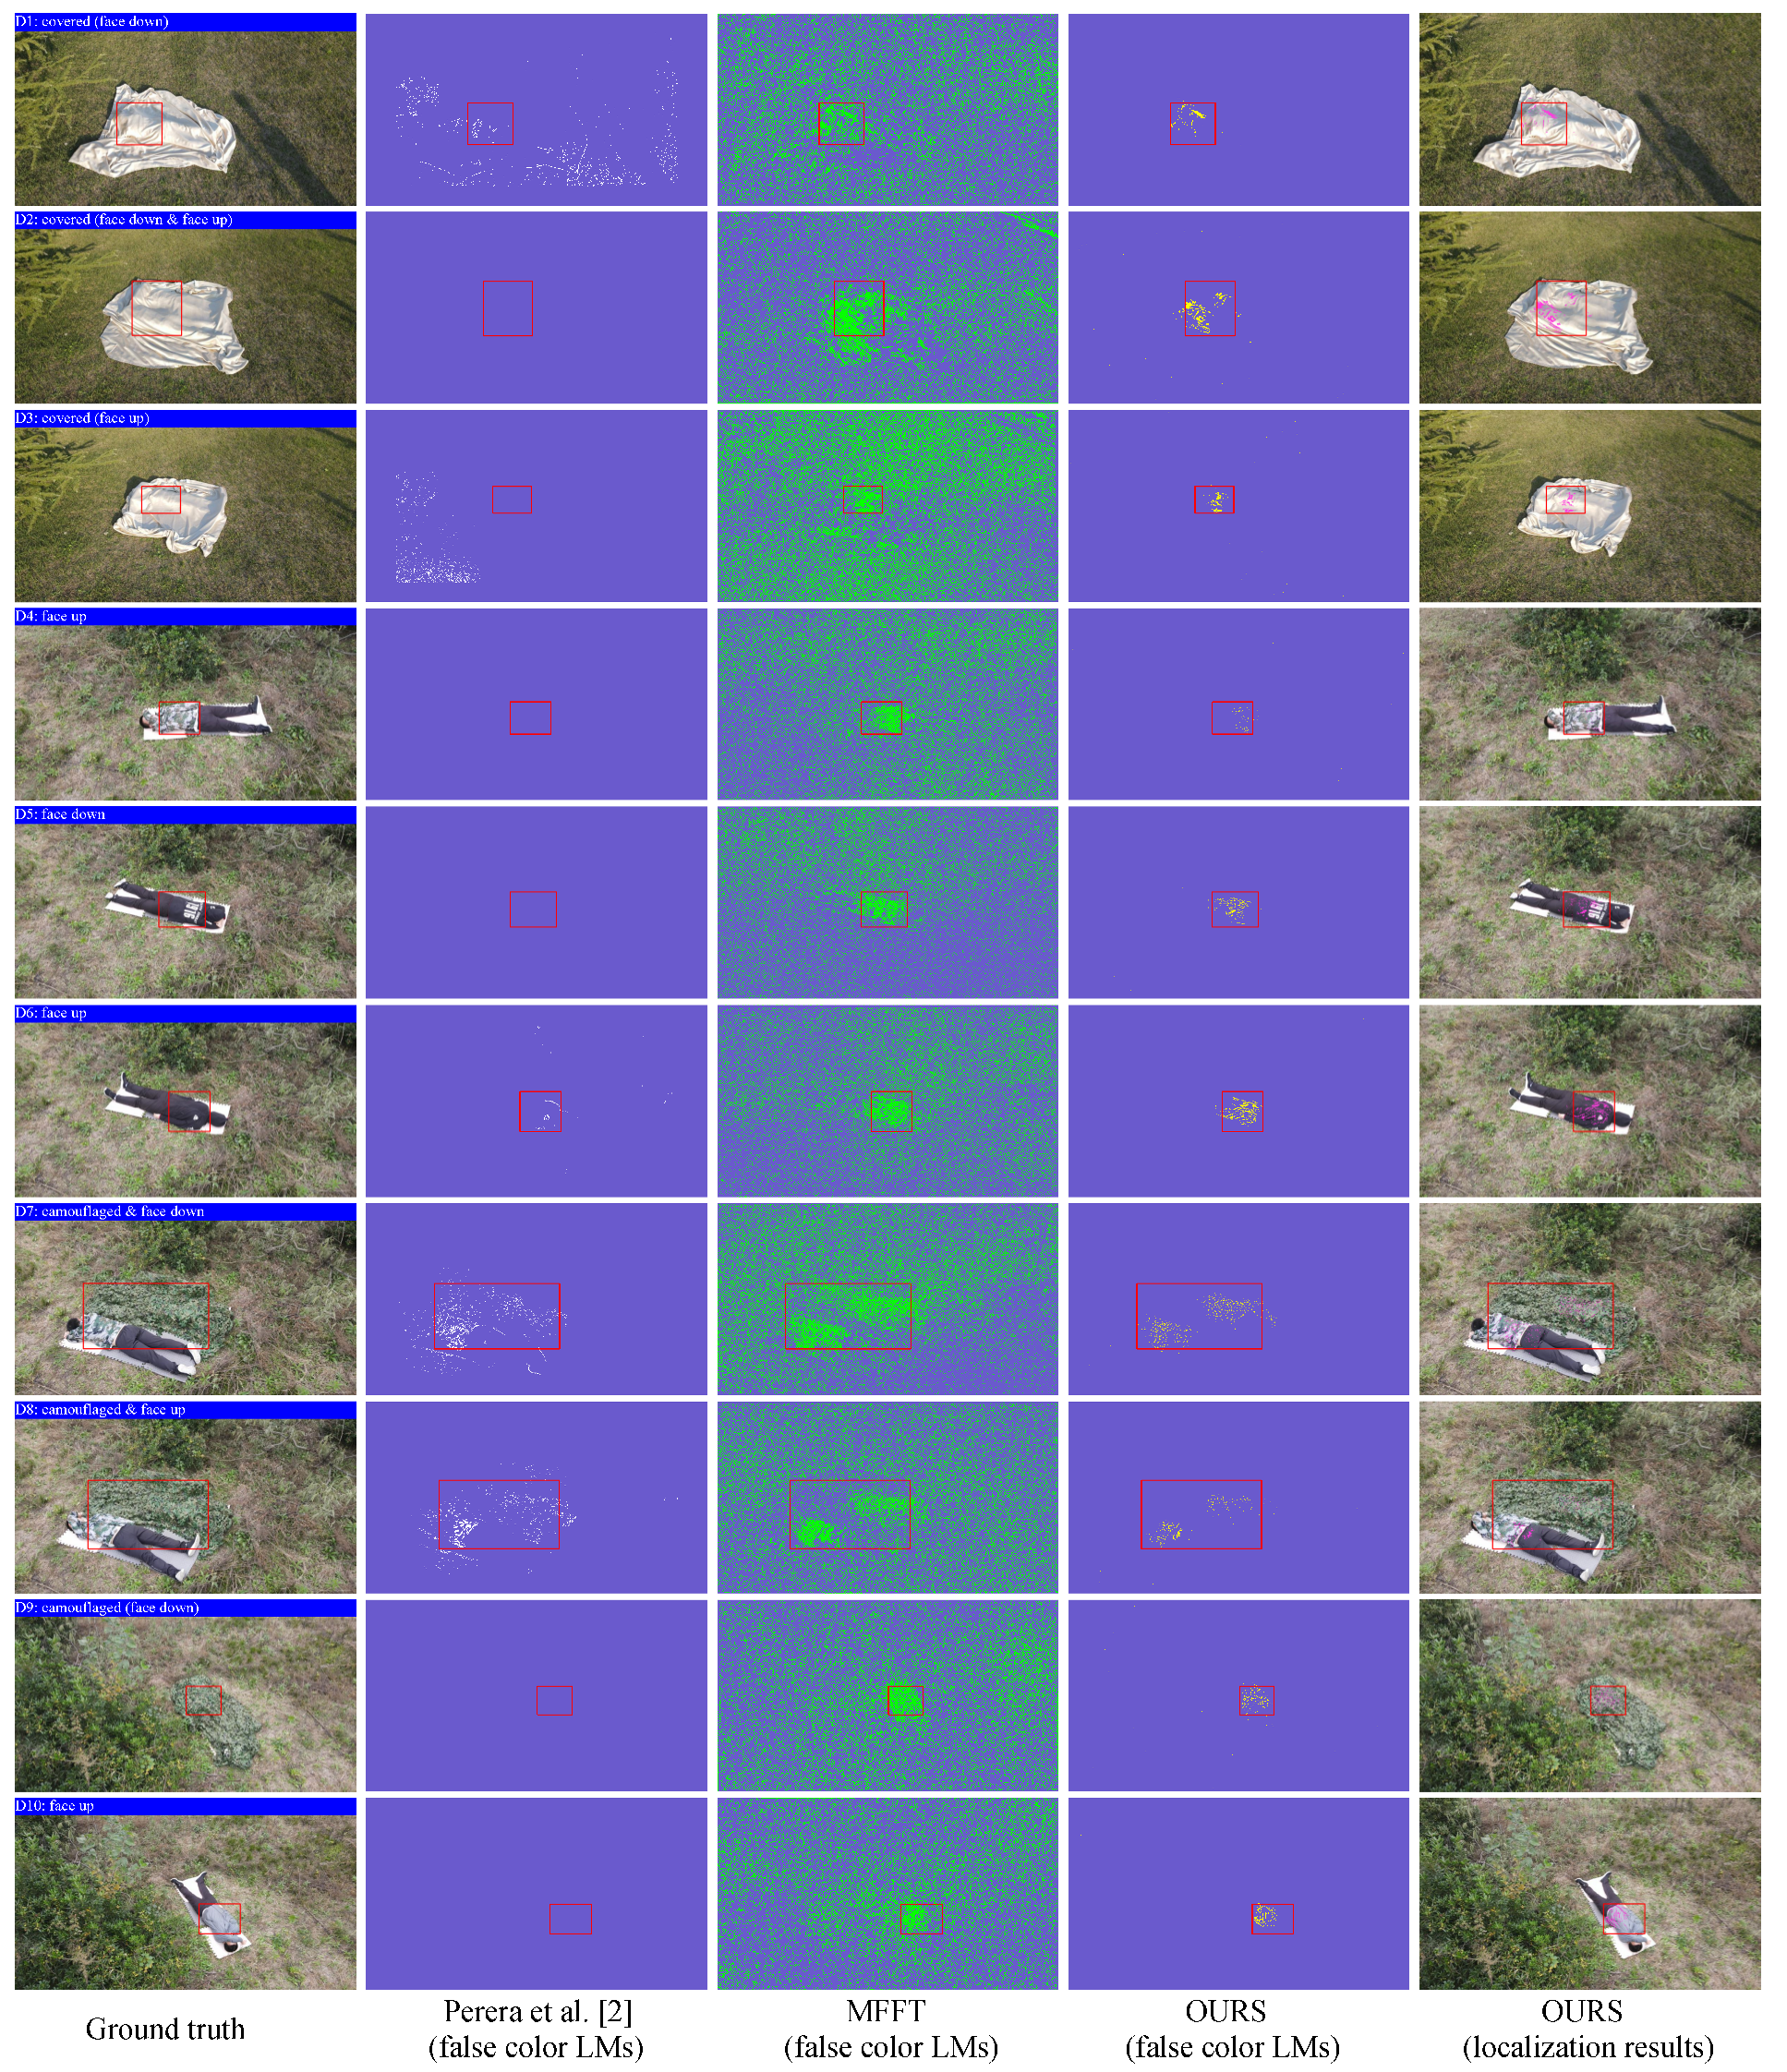
For the motion magnification-based method [2], the D P , L D and F P values ranged from 0 to 0.78, from 0 to 0.05‰, and from 0 to 4301, respectively. The potential reason that accounts for this performance seems to be an overly strong assumption to the drone video, in which only breathing related motions exist. However, in the wild, background motions, such as swing trees and grass caused by wind, severely distort this assumption, resulting in misleading or even no life signs locations. The false color location maps of the motion magnification-based method [2] for ten drone videos are shown in the second column of Figure 6. As shown in this figure, due to the negative effect of background motions, only four of ten location maps indicate the human positions.
For method MFFT, the D P ranged from 0.03 to 0.21, while the LD and FP ranged from 310.99‰to 716.07‰and from 90,832 to 184,969, respectively. These results show that MFFT has low detection precision and high false detection, although it has the highest location density (the average LD is 510.94‰). Since MFFT identifies life signs locations only by judging whether the main frequency of B ( x ; t ) falls within the breathing frequency band or not, it cannot remove those background motions whose main frequencies are also in the range of human breathing rate. Therefore, MFFT presented many false detected locations in the background, as shown in the third column of Figure 6.
As reported in Table 4, the average D P value of our method is 0.94, which is higher than that of Perera et al. [2] and MFFT (i.e., 0.23 and 0.08), and the average FP is 57, which is less than that of compared methods (i.e., 870 and 117,408). These results indicate that the proposed method obtained more accurate estimate of life signs locations and less false detections than compared methods. Such good performance on D P and F P mainly owes to the proposed FV feature, which is capable of discerning the human breathing movements from background motions. The reason why D P values did not reach 1 is that a small number (i.e., the FP value) of background motions satisfying F V ( x ) = 0 is falsely detected as breathing signals. However, these outlier points were always distributed sparsely, and therefore can be removed by using morphological operator of erosion. The false color location maps and localization results of our method for ten drone videos are presented in the last two columns of Figure 6. Compared with the results of Perera et al.’s work [2] and MFFT shown in the second and third columns of Figure 6, the proposed frequency variability feature-based method can detect and locate only the human breathing signals around the chest area, and ignores the background motions.
Additionally, the computational times displayed in Table 4 indicate that the proposed method produces results about six times faster than [2], whose average C T value is 11,210.96 s. This is because the proposed method did not need the expensive processes of video stabilization and motion magnification for tile videos as done in [2]. Meanwhile, our method has a processing speed lower than that of MFFT. This is due to the fact that the STFT in the analysis of frequency variability is more expensive than the Fourier transform in MFFT. However, the J P values of the motion magnification-based method [2], MFFT and ours are −0.79, 0.03 and 0.96, respectively, demonstrating that when detecting life signs from drone videos, our method has a better joint performance than compared methods.

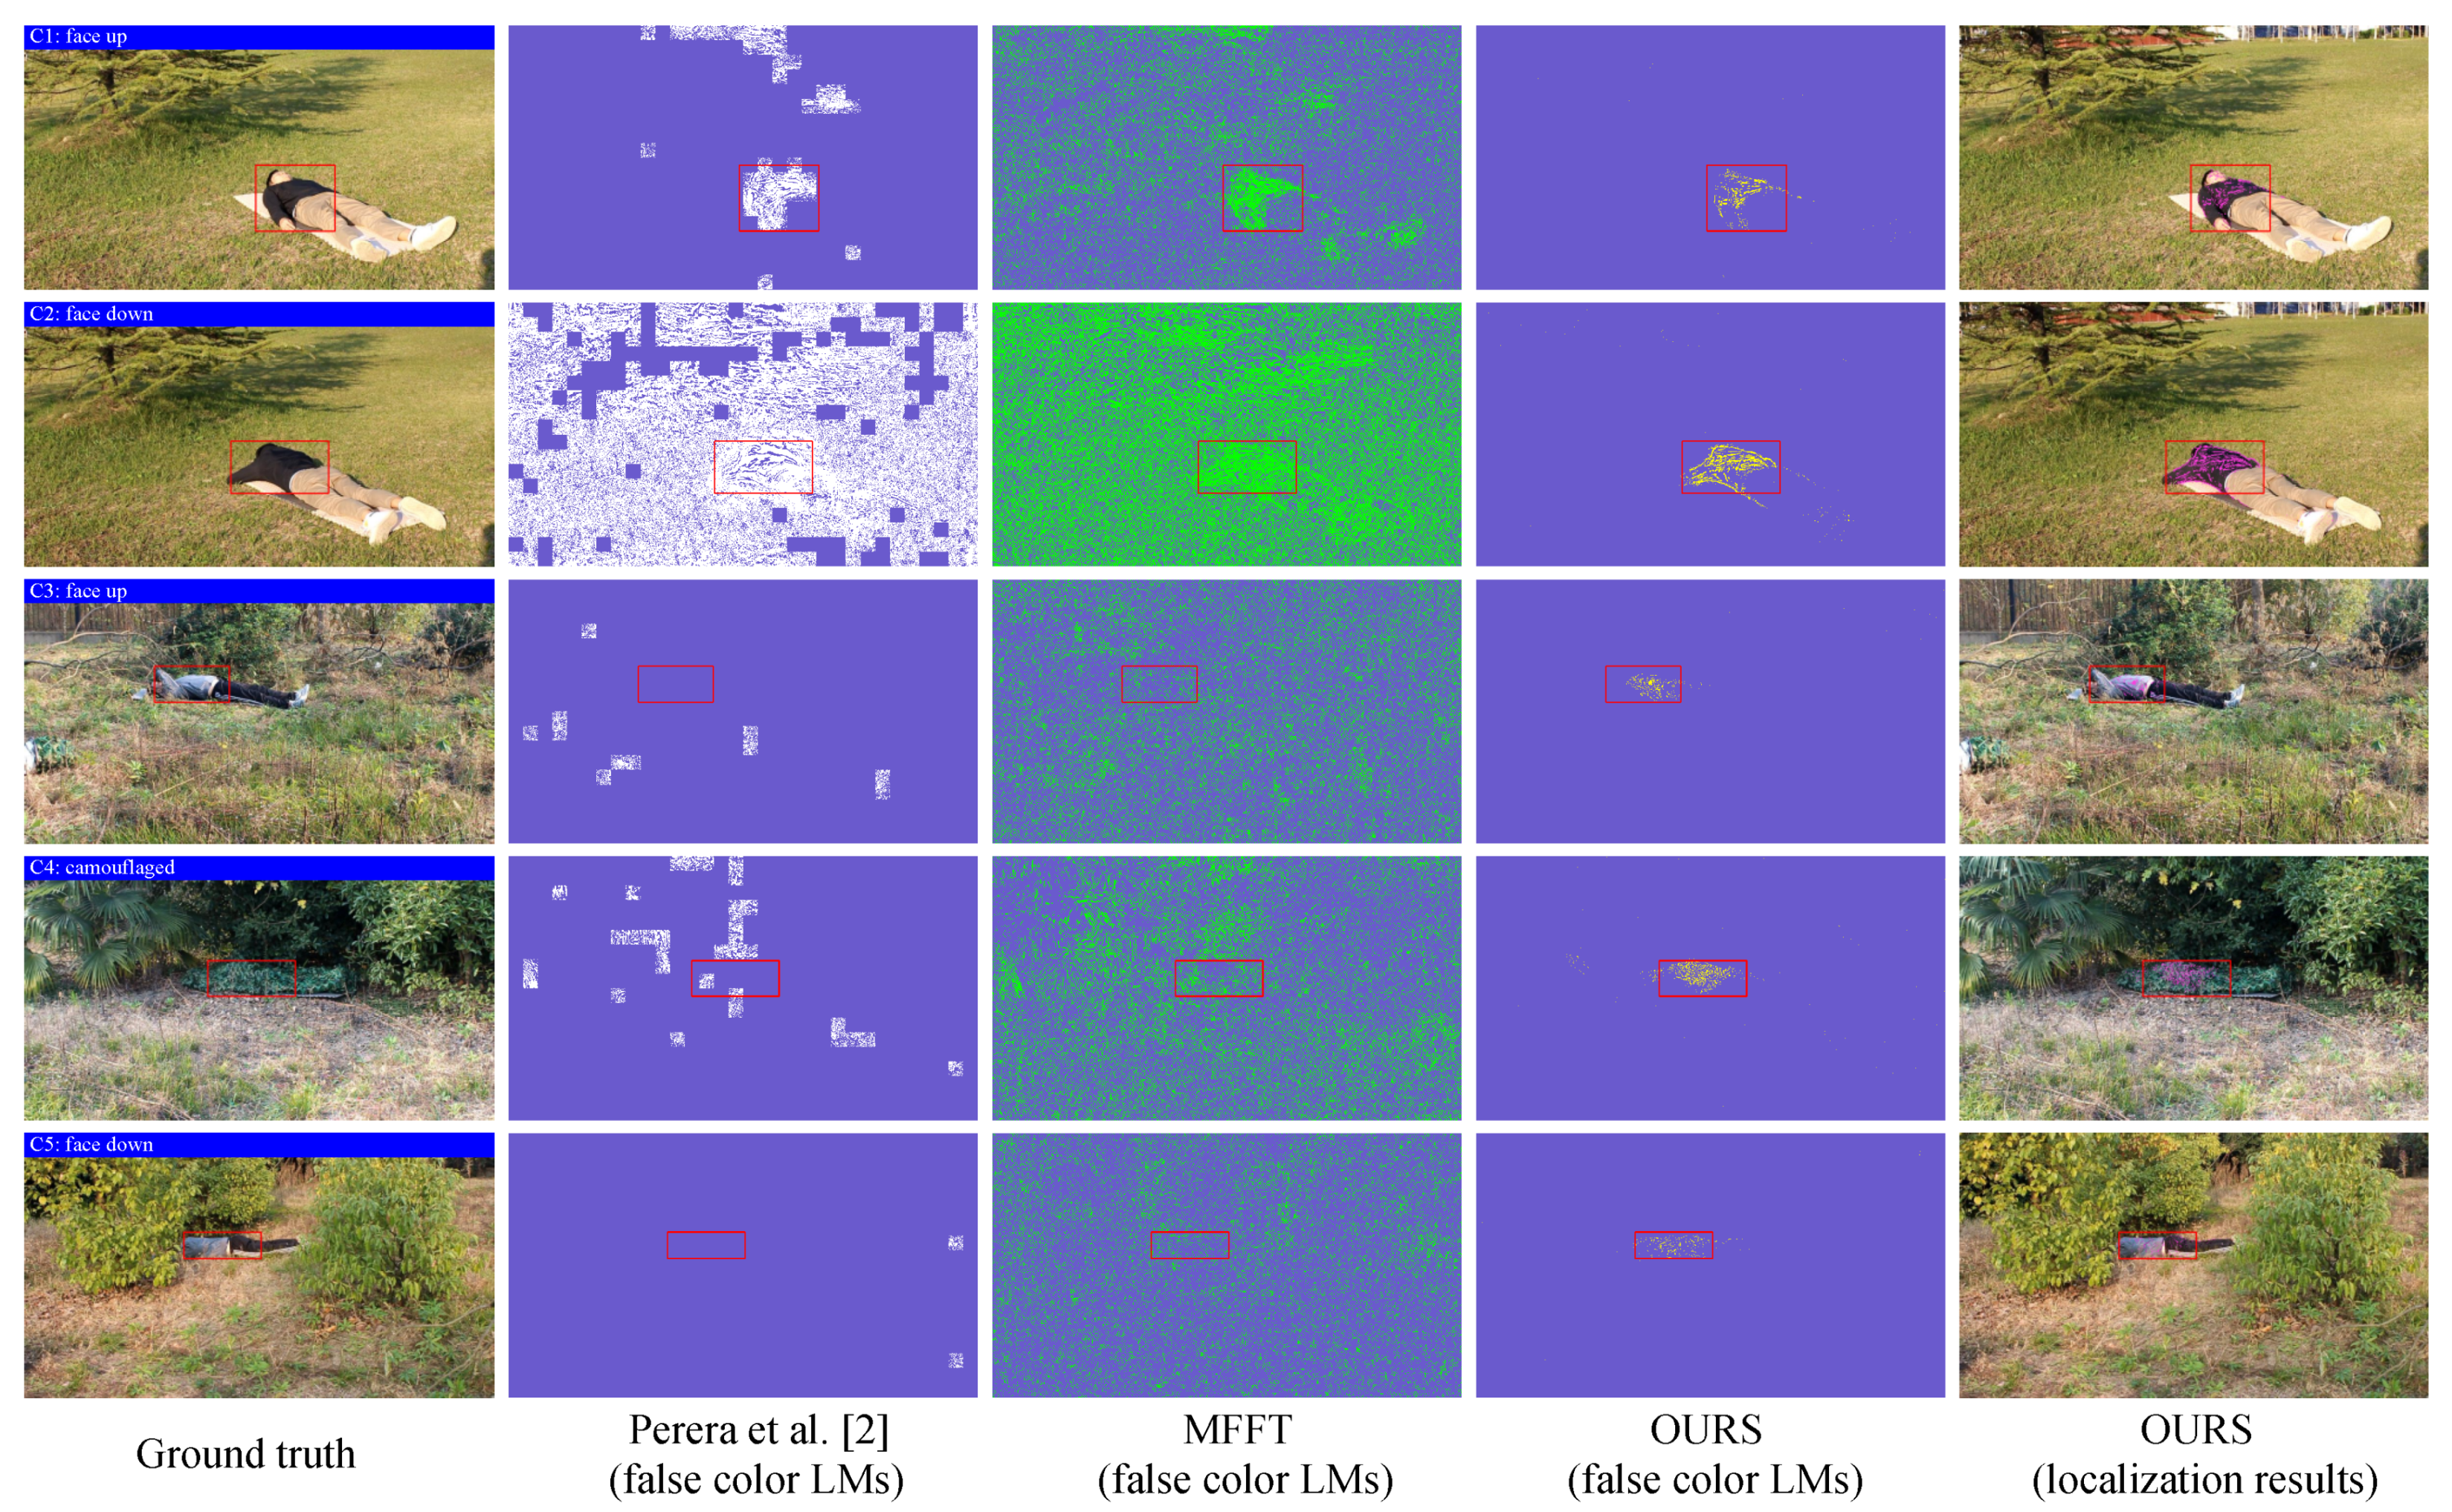
4.4.2. Camera Videos

To evaluate the performance of the proposed method on stable videos, we also did experiments on camera videos, which were collected in the wild by using a stationary Canon camera. During video capture, we set f s at 50 fps, the resolution 1280 × 720 pixels, the duration 20 s, and the distance between camera and subject to about 10 m. The parameter settings in this part are as follows: β = 0.75 (the new resolution is 960 × 540 pixels), f c o = 0.1 Hz, f r e s = 0.25 Hz. Our method was compared with method MFFT and the motion magnification-based method proposed by Perera et al. [2]. Scenarios and results of detection precision D P , location density L D , number of false detected points F P and computational time C T for five camera videos are presented in Table 5.
As reported in Table 5, the average DP, LD, FP and CT values of Perera et al.’s work [2], MFFT and ours are (0.11, 263.83‰, 67,413, 94.84 s), (0.04, 339.47‰, 123,428, 83.83 s) and (0.92, 85.6‰, 116, 1243.37 s), respectively. Our method got the lowest location density (average: 85.6‰) than compared methods. This may due to the fact that some factors, such as image noise introduced during the photographic process, affect the peak frequencies of breathing movements, leading to larger FV values than zero. These breathing movements do not satisfy F V ( x ) = 0 anymore, and therefore cannot be detected by Equation (7). In addition, the proposed method costs much time than compared methods. This is because that the STFT in the analysis of frequency variability feature for obtaining the time-frequency information is time consuming; in contrast, since there are less or no camera shaking in ground recorded videos, compared methods did not need the expensive operation of video stabilization, and therefore ran faster than ours. However, our method obtained the highest DP (average: 0.92) and lowest FP (average: 116), which indicate that the proposed method still keeps a high detection precision and a small number of false detections when evaluating on camera videos. The false color location maps and localization results of three methods for five camera videos are shown in Figure 7. Perera et al.’s work [2] did not work well due to the background motions (resulting in misleading life signs locations). MFFT can present the human locations but produces much false detections in background. In contrast, our proposed method shows clear locations of life signs without the negative effects of background motions.

5. Discussion

This study was proposed to detect and locate life signs of survivors who are lying on the ground in disaster areas and covered with dust, debris or ashes. As the current method [2] assumes only human breathing related motions existing in the video, it did not work well in challenging conditions when background motions, like swing trees and grass, exist. In contrast, our method is robust to background motions with the help of frequency variability (FV) feature, and can be used as an emergency tool for detecting survivors in SAR missions.
Besides being used in SAR missions for detecting life signs, the proposed FV feature may be applied in signal analysis for describing the frequency property of a signal. For instance, as shown in the results in Figure 6 and Figure 7, the FV is indeed an effective feature for isolating the periodic breathing motions from non-meaningful ones. There may be several potential applications by using the FV feature. For example, the FV feature may be used in the cardiac pulse measurement [41] for extracting pure heart pulse, without the effects of face motions, such as eye blink and mouth motion. This is because heart pulse is also a periodic signal accompanying blood circulation, while face motions are not. In contrast, users could also analyze non-periodic signals by focusing on the different range of FV values, since the peak frequency-to-peak frequency variations may be benefit to describing the potential properties of signals. For example, the FV feature may have potential implications in mechanical engineering for extracting the time-varying vibration mode shapes [42], and in micro-expression recognition for detecting the tiny, sudden and short-lived subtle emotions [43].
There are some factors that may affect the method’s performance. The proposed FV feature enables us to discern breathing motions from background motions, but it relies on the assumption that the extracted breathing motions are periodic signals and fall in the range of human breathing rate. However, some factors may contaminate these breathing motions and distort this assumption, resulting in misleading or sparse results. (1) Camera movements. The subtle motions are extracted based on the EVM [24] method, which requires that the video frames should be approximated by a first-order Taylor series expansion. However, videos with large camera motions do not hold this requirement. Video stabilization is a necessary preprocess step to remove most of these camera motions; in addition, we consider that a method for directly extracting periodic motions mixed with camera motions can be developed as a subject for future work. (2) Image noise. The collected videos may be mixed with image noise caused by low light levels, atmospheric turbulence, high sensor gain, short exposure time, and so on. Therefore, breathing signals would be contaminated by image noise, and cannot be detected correctly. Denoising methods, such as principal component analysis, wavelet analysis and fractional anisotropy [44], may be useful to overcome this problem. (3) Camera distance. The breathing movements around the chest are the key clue for detecting life signs in this study. However, as the camera distance increased (e.g., longer than 30 m), the size of the survivor in a image decreased. Therefore, it is difficult to detect ideal breathing signals from a small chest region. To overcome this problem, users can flexibly operate the drone to approach the target zones where the potential victims are at a close distance (e.g., 5 m). Another limitation of this approach is computational complexity. It takes about 30 min to process a drone video with resolution 1920 × 1080 pixels, although it is about six times faster than the motion magnification-based method [2]; it seems too slow for a real time implementation. This is because the STFT in the analysis of the frequency variability feature for obtaining the time-frequency information is time consuming. A simple and principled approach should be developed as a substitute for using STFT in future work. In addition, weather conditions, such as heavy wind, rain, dense fog and snow, could affect our approach on both data collection and video processing. On the one hand, the drone may not work well in adverse weather conditions; this could alter how the drone perceives its environment and reacts to it. On the other hand, the motion artifacts and poor image quality introduced during the photographic process would bring challenge to video processing. In this respect, the integration of other type of sensors (e.g., radars, thermal and IR cameras) could also be investigated to provide an additional information for life detection and localization complementary to drone-based methods.

6. Conclusions

A frequency variability feature-based method is proposed in this paper for detecting and locating life signs in disaster areas where background motions exist. Motion magnification-based method [2] has recently been proposed for detecting both clearly visible survivors and those who are fully occluded by dust, debris or ashes, without the additional information that previous methods required [19,20,21]. However, this method can only work well in controlled environment without background motions, such as swing trees and grass caused by wind.
To overcome this limitation, on the basis of our observation that human breathing is a stable periodic motion with constant peak frequency, while that of background motions are not, we analyzed the temporal variability of peak frequency of subtle motions to model a frequency variability (FV) feature. It is found that the FV feature can be used to describe a signal’s frequency properties, and enables us to isolate human breathing from background motions. Using the estimated FV values, we designed a binary map that indicates the human locations, and with which the breathing signal of survivor was obtained. The proposed method was validated on both drone and camera videos, and the average precision measures of our method for drone and camera videos were 0.94 and 0.92, which are higher than that of Perera et al. [2] (i.e., 0.28 and 0.11) and MFFT (i.e., 0.08 and 0.04), demonstrating that the proposed method obtained more accurate results than those obtained with compared methods. Besides being used in SAR missions for detecting life signs, our method has potential implications in signal analysis and practical applications, such as cardiac pulse measurement, mechanical engineering and micro-expression recognition. Possible future directions of this study are target motion extraction from drone videos without video stabilization and algorithm optimization to reduce computational complexity.

Author Contributions

Conceptualization, L.Z. and X.Y.; Data curation, L.Z. and J.S.; Investigation, L.Z.; Methodology, L.Z. and X.Y.; Resources, X.Y.; Software, L.Z.; Supervision, X.Y.; Writing—original draft, L.Z.; Writing—review and editing, J.S. All authors have read and agreed to the published version of the manuscript.

Funding

This research was funded by the Commission of Science and Technology for the Central Military Commission, People’s Republic of China (grant number 18-163-21-TS-001-061-01).

Institutional Review Board Statement

The study was conducted according to the guidelines of the Declaration of Helsinki, and approved by the Institutional Review Board of Hefei University of Technology (Project identification code: 18-163-21-TS-001-061-01, date of approval: 27 October 2018).

Informed Consent Statement

Informed consent was obtained from all subjects involved in the study.

Data Availability Statement

The data presented in this study are available on request from the corresponding author. The data are not publicly available due to privacy.

Acknowledgments

We thank the volunteers who participated in the data collection. We acknowledge Ali Al-Naji et al. for their works related to drone video processing and application. We also thank MIT Computer Science and Artificial Intelligence Lab for making their motion magnification codes publicly available.

Conflicts of Interest

The authors declare no conflict of interest.

Appendix A. Experimental Results of Ten Drone Videos (AD1 to AD10)

Results of detection precision DP, location density LD, number of false detected points FP and computational time CT for another ten drone videos (AD1 to AD10) are summarized in Table A1. As reported in Table A1, the average D P value of our method is 0.97, which is higher than that of Perera et al. [2] and MFFT (i.e., 0.06 and 0.02); the average FP is 4, which is less than that of compared methods (i.e., 2932 and 134,137), and the average LD is 37.97‰, which is less than that of compared methods (i.e., 33.84‰and 571.98‰). These results indicate that the proposed method obtained more accurate estimate of life signs locations and less false detections than compared methods, but had more sparse target locations. Additionally, the average CT value of our method is 1845.16 s, indicating that the computation speed is faster than [2], but slower than MFFT. However, the J P value of the proposed method is 0.91, which is higher than that of compared method (i.e., −0.89 and 0.02), demonstrating that when detecting life signs from drone videos, our method has a better joint performance than compared methods.
The false color location maps of Perera et al.’s work [2], MFFT and ours, and our localization results for ten drone videos (AD1 to AD10) are presented in Figure A1, which shows that the proposed frequency variability feature-based method can detect and locate only the human breathing signals around the chest area, and ignores the background motions.
Figure A1. False color location maps (LMs) of Perera et al.’ work [2], MFFT and ours, and our localization results for ten drone videos (AD1 to AD10).
Remotesensing 13 00796 g0a1
Table A1. Results of detection precision D P , location density L D ( ‰), number of false detected points F P and computational time C T ( s ) of Perera et al.’s work [2], MFFT and ours for ten drone videos (AD1 to AD10).
VideoScenarioPerera et al. [2]MFFTOURS
DPLDFPCTDPLDFPCTDPLDFPCT
AD1face up & mannequin00584510,723.570.01580.03219,525335.82126.5301833.49
AD2face down & mannequin0.4153.3152610,513.140.03448.4511,6748330.5714.8601607.92
AD3camouflaged & mannequin00010,796.600.06671.769,264320.231109.3901741.65
AD4camouflaged & mannequin00010,793.800.03581.3387,600320.88113.9801727.47
AD5face up & mannequin00584411,325.080.01854.26258,123360.320.7653.19311900.91
AD6face up0064211,216.900.01347.4692,758368.080.9616.9521919.24
AD7face up & mannequin0.2285.0724719945.680.01430.3283,093292.90128.9601805.14
AD8face up & mannequin00212810,555.200.01680.07126,553331.500.9854.2021942.85
AD9face up & mannequin00354011,571.830.01468.5398,002391.370.9827.6222040.37
AD10face up00832111,422.560.03657.65189,701365.550.9844.0271932.57

References

  1. Sun, J.; Zhu, X.; Zhang, C.; Fang, Y. RescueMe: Location-Based Secure and Dependable VANETs for Disaster Rescue. IEEE J. Sel. Areas Commun. 2011, 29, 659–669. [Google Scholar] [CrossRef]
  2. Perera, A.G.; Khanam, F.T.Z.; Al-Naji, A.; Chahl, J. Detection and Localisation of Life Signs from the Air Using Image Registration and Spatio-Temporal Filtering. Remote Sens. 2020, 12, 577. [Google Scholar] [CrossRef] [Green Version]
  3. Casper, J.; Murphy, R.R. Human-robot interactions during the robot-assisted urban search and rescue response at the World Trade Center. IEEE Trans. Cybern. 2003, 33, 367–385. [Google Scholar] [CrossRef] [PubMed] [Green Version]
  4. Doroodgar, B.; Liu, Y.; Nejat, G. A Learning-Based Semi-Autonomous Controller for Robotic Exploration of Unknown Disaster Scenes While Searching for Victims. IEEE Trans. Cybern. 2014, 44, 2719–2732. [Google Scholar] [CrossRef]
  5. Liu, Y.; Nejat, G.; Vilela, J. Learning to cooperate together: A semi-autonomous control architecture for multi-robot teams in urban search and rescue. In Proceedings of the IEEE International Symposium on Safety, Linköping, Sweden, 21–26 October 2014. [Google Scholar]
  6. Liu, Y.; Ficocelli, M.; Nejat, G. A supervisory control method for multi-robot task allocation in urban search and rescue. In Proceedings of the IEEE International Symposium on Safety, West Lafayette, IN, USA, 18–20 October 2015. [Google Scholar]
  7. Liu, Y.; Nejat, G. Multirobot Cooperative Learning for Semiautonomous Control in Urban Search and Rescue Applications. J. Field Robot. 2015, 33, 512–536. [Google Scholar] [CrossRef]
  8. Tsalatsanis, A.; Yalcin, A.; Valavanis, K.P. Dynamic task allocation in cooperative robot teams. Robotica 2012, 30, 721–730. [Google Scholar] [CrossRef]
  9. Van, N.T.P.; Tang, L.; Demir, V.; Hasan, S.F.; Mukhopadhyay, S. Review-Microwave Radar Sensing Systems for Search and Rescue Purposes. Sensors 2019, 19, 2879. [Google Scholar]
  10. Chen, K.M.; Huang, Y. Microwave life-detection systems for searching human subjects under earthquake rubble or behind barrier. Biomed. Eng. IEEE Trans. 2000, 47, 105–114. [Google Scholar] [CrossRef] [PubMed]
  11. Liu, L.; Liu, S. Remote Detection of Human Vital Sign with Stepped-Frequency Continuous Wave Radar. IEEE J. Sel. Top. Appl. Earth Obs. Remote Sens. 2014, 7, 775–782. [Google Scholar] [CrossRef]
  12. Jalalibidgoli, F.; Moghadami, S.; Ardalan, S. A Compact Portable Microwave Life-Detection Device for Finding Survivors. IEEE Embed. Syst. Lett. 2016, 8, 10–13. [Google Scholar] [CrossRef]
  13. Chen, V.C.; Lipps, R.D. Time frequency signatures of micro-Doppler phenomenon for feature extraction. Proc. Spie Int. Soc. Opt. 2000, 4056. [Google Scholar] [CrossRef]
  14. Luo, F.; Poslad, S.; Bodanese, E. Human Activity Detection and Coarse Localization Outdoors Using Micro-Doppler Signatures. IEEE Sensors J. 2019, 19, 8079–8094. [Google Scholar] [CrossRef]
  15. Coluccia, A.; Parisi, G.; Fascista, A. Detection and Classification of Multirotor Drones in Radar Sensor Networks: A Review. Sensors 2020, 20, 4172. [Google Scholar] [CrossRef] [PubMed]
  16. Gong, X.; Zhang, J.; Cochran, D.; Xing, K. Optimal Placement for Barrier Coverage in Bistatic Radar Sensor Networks. IEEE/ACM Trans. Netw. 2014, 24, 259–271. [Google Scholar] [CrossRef]
  17. Beloev, I.H. A review on current and emerging application possibilities for unmanned aerial vehicles. Acta Technol. Agric. 2016, 19, 70–76. [Google Scholar] [CrossRef] [Green Version]
  18. Camara, D. Cavalry to the Rescue: Drones Fleet to Help Rescuers Operations over Disasters Scenarios. In Proceedings of the International Conference on Antenna Measurements & Applications, Antibes Juan-les-Pins, France, 16–19 November 2014. [Google Scholar]
  19. Al-Kaff, A.; Gómez-Silva, M.; Moreno, F.; Arturo, D.L.E.; Armingol, J. An Appearance-Based Tracking Algorithm for Aerial Search and Rescue Purposes. Sensors 2019, 19, 652. [Google Scholar] [CrossRef] [PubMed] [Green Version]
  20. Al-Naji, A.; Perera, A.G.; Chahl, J. Remote monitoring of cardiorespiratory signals from a hovering unmanned aerial vehicle. Biomed. Eng. Online 2017, 16, 101. [Google Scholar] [CrossRef] [Green Version]
  21. Al-Naji, A.; Perera, A.G.; Mohammed, S.L.; Chahl, J. Life signs detector using a drone in disaster zones. Remote Sens. 2019, 11, 2441. [Google Scholar] [CrossRef] [Green Version]
  22. Cao, Z.; Simon, T.; Wei, S.E.; Sheikh, Y. Realtime multi-person 2d pose estimation using part affinity fields. In Proceedings of the IEEE Conference on Computer Vision and Pattern Recognition, Honolulu, HI, USA, 21–26 July 2017; pp. 7291–7299. [Google Scholar]
  23. Liu, C.; Torralba, A.; Freeman, W.T.; Durand, F.; Adelson, E.H. Motion Magnification. ACM Trans. Graph. 2005, 24, 519–526. [Google Scholar] [CrossRef]
  24. Wu, H.Y.; Rubinstein, M.; Shih, E.; Guttag, J.V.; Durand, F.; Freeman, W.T. Eulerian Video Magnification for Revealing Subtle Changes in the World. ACM Trans. Graph. 2012, 31, 1–8. [Google Scholar] [CrossRef]
  25. Wadhwa, N.; Rubinstein, M.; Durand, F.; Freeman, W.T. Phase-Based Video Motion Processing. ACM Trans. Graph. 2013, 32, 1–10. [Google Scholar] [CrossRef] [Green Version]
  26. Wadhwa, N.; Rubinstein, M.; Durand, F.; Freeman, W.T. Riesz pyramids for fast phase-based video magnification. In Proceedings of the 2014 IEEE International Conference on Computational Photography (ICCP), Santa Clara, CA, USA, 2–4 May 2014; pp. 1–10. [Google Scholar]
  27. Horn, B.K.P.; Schunck, B.G. Determining Optical Flow. Artif. Intell. 1981, 17, 185–203. [Google Scholar] [CrossRef] [Green Version]
  28. Lucas, B.; Kanade, T. An Iterative Image Registration Technique with an Application to Stereo Vision. In Proceedings of the 7th International Joint Conference on Artificial Intelligence, Vancouver, BC, Canada, 24–28 August 1981; pp. 674–679. [Google Scholar]
  29. Video Magnification. Available online: http://people.csail.mit.edu/mrub/vidmag/ (accessed on 24 December 2020).
  30. Portmann, J.; Lynen, S.; Chli, M.; Siegwart, R. People detection and tracking from aerial thermal views. In Proceedings of the 2014 IEEE International Conference on Robotics and Automation (ICRA), Hong Kong, China, 31 May–7 June 2014. [Google Scholar]
  31. Kang, J.; Gajera, K.; Cohen, I.; Medioni, G. Detection and Tracking of Moving Objects from Overlapping EO and IR Sensors. In Proceedings of the Computer Vision and Pattern Recognition Workshop, Washington, DC, USA, 27 June–2 July 2004. [Google Scholar]
  32. Rivera, A.J.A.; Villalobos, A.D.C.; Monje, J.C.N.; Marias, J.A.G.; Oppus, C.M. Post-disaster rescue facility: Human detection and geolocation using aerial drones. In Proceedings of the 2016 IEEE Region 10 Conference (TENCON), Singapore, 22–25 November 2017. [Google Scholar]
  33. Blondel, P.; Potelle, A.; Pégard, C.; Lozano, R. Fast and viewpoint robust human detection for SAR operations. In Proceedings of the 2014 IEEE International Symposium on Safety, Security, and Rescue Robotics (2014), Security, Hokkaido, Japan, 27–30 October 2014; pp. 1–6. [Google Scholar]
  34. Simoncelli, E.P.; Freeman, W.T.; Adelson, E.H.; Heeger, D.J. Shiftable multiscale transforms. IEEE Trans. Inform. Theory 1992, 38, 587–607. [Google Scholar] [CrossRef] [Green Version]
  35. Portilla, J.; Simoncelli, E.P. A Parametric Texture Model Based on Joint Statistics of Complex Wavelet Coefficients. Int. J. Comput. Vis. 2000, 40, 49–70. [Google Scholar] [CrossRef]
  36. Walha, A.; Wali, A.; Alimi, A. Video stabilization with moving object detecting and tracking for aerial video surveillance. Multimed. Tools Appl. 2015, 74, 6745–6767. [Google Scholar] [CrossRef]
  37. Wang, Y.; Hou, Z.; Leman, K.; Chang, R. Real-Time Video Stabilization for Unmanned Aerial Vehicles. In Proceedings of the MVA2011 IAPR Conference on Machine Vision Applications, Nara, Japan, 13–15 June 2011; pp. 336–339. [Google Scholar]
  38. Keys, R. Cubic convolution interpolation for digital image processing. IEEE Trans. Acoust. Speech, Signal Process. 1981, 29, 1153–1160. [Google Scholar] [CrossRef] [Green Version]
  39. Video Stabilization Using Point Feature Matching. Available online: https://www.mathworks.com/help/vision/ug/video-stabilization-using-point-feature-matching.html (accessed on 24 December 2020).
  40. Chen, J.G.; Davis, A.; Wadhwa, N.; Durand, F.; Freeman, W.T.; Buyukozturk, O. Video Camera-Based Vibration Measurement for Civil Infrastructure Applications. J. Infrastruct. Syst. 2017, 23, B4016013. [Google Scholar] [CrossRef]
  41. Moya-Albor, E.; Brieva, J.; Ponce, H.; Martinez-Villasenor, L. A non-contact heart rate estimation method using video magnification and neural networks. IEEE Instrum. Meas. Mag. 2020, 23, 56–62. [Google Scholar] [CrossRef]
  42. Liu, Z.; He, Q.; Chen, S.; Peng, Z.; Zhang, W. Time-varying motion filtering for vision-based non-stationary vibration measurement. IEEE Trans. Instrum. Meas. 2019, 69, 3907–3916. [Google Scholar] [CrossRef]
  43. Le Ngo, A.C.; See, J.; Raphael Phan, C.W. Sparsity in Dynamics of Spontaneous Subtle Emotion: Analysis & Application. IEEE Trans. Affect. Comput. 2016, 8, 396–411. [Google Scholar]
  44. Takeda, S.; Akagi, Y.; Okami, K.; Isogai, M.; Kimata, H. Video magnification in the wild using fractional anisotropy in temporal distribution. In Proceedings of the IEEE Conference on Computer Vision and Pattern Recognition, Long Beach, CA, USA, 15–20 June 2019; pp. 1614–1622. [Google Scholar]
Figure 1. Overview of the frequency variability feature-based method for detection and localization of life signs in natural disasters.
Remotesensing 13 00796 g001
Figure 2. The first frames and ground truth regions indicated with red boxes for 20 drone videos. The name and the simulated scenario of each drone video are shown on the top of every frame image.
Remotesensing 13 00796 g002
Figure 3. Histogram results of D P , L D , F P and C T of the proposed method with and without video stabilization: (a) D P histogram, (b) L D histogram, (c) F P histogram and (d) C T histogram.
Remotesensing 13 00796 g003
Figure 4. Histogram results of D P , L D , F P and C T of the proposed method with three different scale factors, 0.25, 0.5 and 1: (a) D P histogram, (b) L D histogram, (c) F P histogram and (d) C T histogram.
Remotesensing 13 00796 g004
Figure 5. Histogram results of D P , L D and F P of the proposed method with three different cut off frequencies 0, 0.1 and 0.2 Hz: (a) D P histogram, (b) L D histogram and (c) F P histogram.
Remotesensing 13 00796 g005
Figure 6. False color location maps (LMs) of Perera et al.’ work [2], MFFT and ours, and our localization results for ten drone videos.
Remotesensing 13 00796 g006
Figure 7. False color location maps (LMs) of Perera et al.’ work [2], MFFT and ours, and our localization results for five camera videos.
Remotesensing 13 00796 g007
Table 1. Comparison among different drone-based approaches for life signs detection and localization.
PaperMain Characteristics of the ApproachKey TechniquesPros and ConsDistance between Drone and SubjectNumber of Subjects
[19]Color and depth data obtained from drone videos are used to detect and track victims in disaster environments.human detection, multi-object tracking and semi-autonomous reactive controlThis method: (1) is efficient for localizing humans who are lying on the ground in many poses, (2) but fails to detect their life signs.1.5 mmultiple subjects
[20]A remote physiological measurement system is designed based on the skin color analysis of facial videos to detect the vital signs (heart rate and respiratory rate).complete ensemble empirical mode decomposition with adaptive noise, canonical correlation analysis and video magnificationThis method: (1) can identify whether the person is alive or not, based on the detected vital signs (heart rate and respiratory rate), (2) but limits the subject standing in front of the drone camera with a single pose.3 m15 subjects
[21]A new life signs detector system is proposed by analyzing the periodic chest movements of survivors.color space conversion and body joint estimationThis method: (1) can efficiently distinguish living and non-living subjects at different poses, (2) but performs well only when there are no occlusions on subjects.4–8 meight subjects and one mannequin
[2]A novel method is proposed to estimate the locations of people from drone video using motion magnification technique and signal processing by detecting breathing movements.video stabilization and motion magnificationThis method: (1) can successfully work well on clearly visible people and even those fully covered with dust, debris or ashes, (2) but is sensitive to background motions, such as swing trees and grass caused by wind.4–8 msix subjects and one mannequin
OursThe proposed method analyzes and focuses on the frequency properties of motions to model a frequency variability feature used for extracting only human breathing while eliminating irrelevant background motions in the video, which helps to detect and localize life signs in disaster areas.video stabilization and frequency variability analysis (proposed in our method)The proposed method: (1) is useful to isolate human breathing from background motions, (2) and is more robust to background motions than existing method [2] for life signs detection and localization.3-4 mseven subjects and one mannequin
Table 2. The JP and average results of D P , L D ( ‰), F P and C T ( s ) of the proposed method with four different frequency resolutions 0.1, 0.2, 0.25 and 0.3 Hz.
Evaluation CriteriaFres0.1Fres0.2Fres0.25Fres0.3
average DP0.270.570.940.87
average LD231.7167.1457.389.01
average FP12,224790575
average CT2569.221872.121877.561869.04
JP−0.980.631.160.89
Table 3. Average results of D P , L D ( ‰) and F P of three methods under four different τ values 0, 0.1, 1 and 1.5.
MethodsAverage DPAverage LDAverage FP
τ = 0 τ = 0.1 τ = 1 τ = 1.5 τ = 0 τ = 0.1 τ = 1 τ = 1.5 τ = 0 τ = 0.1 τ = 1 τ = 1.5
MFt0.940.940.900.7657.3957.3970.70103.515757134539
MCt0.940.940.940.9357.3857.3859.9861.5157576265
OURS0.940.940.940.9457.3857.3858.3858.9757575859
Table 4. Results of detection precision D P , location density L D ( ‰), number of false detected points F P and computational time C T ( s ) of Perera et al.’s work [2], MFFT and ours for ten drone videos.
VideoScenarioPerera et al. [2]MFFTOURS
DPLDFPCTDPLDFPCTDPLDFPCT
D1covered (face down)0.070.02430110,566.850.05424.66113,216276.950.9646.91271887.46
D2covered (face down & face up)0.000.00010,211.550.10525.70101,447276.430.9080.451941827.84
D3covered (face up)0.000.00253210,360.250.03587.64184,969264.580.9268.32481840.20
D4face up0.000.00012,160.410.04516.68124,982267.620.8717.16261853.33
D5face down0.000.00011,050.180.07491.4890,832274.850.9555.98371904.07
D6face up0.700.029911,258.710.07566.12105,457270.020.98100.14221871.13
D7camouflaged & face down0.780.0588011,449.520.21452.83113,357290.820.9526.09861942.95
D8camouflaged & face up0.750.0488512,070.780.16310.99109,060296.810.9714.36311914.24
D9camouflaged (face down)0.000.00011,506.770.05716.07118,449278.910.9084.44731881.37
D10face up0.000.00011,474.510.04517.24112,306264.080.9779.95221853.03
Table 5. Results of detection precision D P , location density L D ( ‰), number of false detected points F P and computational time C T ( s ) of Perera et al.’s work [2], MFFT and ours for five camera videos.
VideoScenarioPerera et al. [2]MFFTOURS
DPLDFPCTDPLDFPCTDPLDFPCT
C1face up0.44422.5011,90495.120.09413.4090,93582.750.9563.05681238.19
C2face down0.06837.34306,48793.420.06723.22259,21682.390.93147.762311242.19
C3face up0.000.00469795.020.02156.6994,50184.370.9456.35431256.79
C4camouflaged0.0659.3113,22196.870.03259.05106,09583.530.88107.061861239.40
C5face down0.000.0075893.760.02144.9866,39186.120.9053.80501240.28
Publisher’s Note: MDPI stays neutral with regard to jurisdictional claims in published maps and institutional affiliations.

