Article

Contourlet-CNN for SAR Image Despeckling

School of Computer Science and Technology, Xidian University, Xi’an 710071, China
*
Author to whom correspondence should be addressed.
Remote Sens. 2021, 13(4), 764; https://doi.org/10.3390/rs13040764
Submission received: 22 January 2021 / Revised: 9 February 2021 / Accepted: 18 February 2021 / Published: 19 February 2021
(This article belongs to the Section Remote Sensing Image Processing)

Abstract

:
A multiscale and multidirectional network named the Contourlet convolutional neural network (CCNN) is proposed for synthetic aperture radar (SAR) image despeckling. SAR image resolution is not higher than that of optical images. If the network depth is increased blindly, the SAR image detail information flow will become quite weak, resulting in severe vanishing/exploding gradients. In this paper, a multiscale and multidirectional convolutional neural network is constructed, in which a single-stream structure of convolutional layers is replaced with a multiple-stream structure to extract image features with multidirectional and multiscale properties, thus significantly improving the despeckling performance. With the help of the Contourlet, the CCNN is designed with multiple independent subnetworks to respectively capture abstract features of an image in a certain frequency and direction band. The CCNN can increase the number of convolutional layers by increasing the number of subnetworks, which makes the CCNN not only have enough convolutional layers to capture the SAR image features, but also overcome the problem of vanishing/exploding gradients caused by deepening the networks. Extensive quantitative and qualitative evaluations of synthetic and real SAR images show the superiority of our proposed method over the state-of-the-art speckle reduction method.

Graphical Abstract

1. Introduction

Synthetic aperture radar (SAR) images are images of the Earth’s surface obtained by the observation tool (SAR systems) under any weather condition. However, SAR images are inevitably obscured by speckle noise due to their coherent imaging mechanism, which makes it extremely difficult for computer vision systems to automatically interpret SAR data. Removing speckle is an essential step before applying SAR images to various tasks [1].
Conventional methods remove speckle, either in the spatial domain, such as Lee [2], Kuan [3] and Frost [4], which operate on the pixels by sliding a window over the entire image, or in the frequency domain, where some transforms that can sparsely represent images, such as wavelets [5] and contourlets [6], are employed to reduce speckle by thresholding the small coefficients of the frequency domain. The frequency domain methods improve the performance of speckle reduction in the following two aspects: representing SAR image features more sparsely and more accurately distinguishing the transformation coefficients of the image content from the speckle. The former analyzes geometrical structures in SAR images from the multiscale and multidirection of the transform and represents many detailed features with fewer high-magnitude transform coefficients [7,8]. The goal of the latter is to optimize the threshold determination strategy to identify the coefficients representing the image content from all the transform coefficients as accurately as possible [9].
In the past decade, non-local self-similarity (NSS)-based methods [10,11,12,13] for speckle reduction have received wide attention due to their ability to eliminate speckle while sacrificing fewer image details. Deledalle et al. [10] proposed the first nonlocal patch-based despeckling method, where each despeckled pixel is a weighted average of pixels centered at some blocks that are similar to the block centered at the current pixel. Two perfect variants of this kind of method are NL-SAR [12] and SAR-BM3D [13], which can obtain a desired result for the SAR images with regular and repetitive textures. However, it is difficult for this kind of method to create an optimal balance between preserving SAR image features and removing artifacts because the NSS models are sensitive to the spatial features of SAR images.
Inspired by the success of deep convolutional neural networks (CNNs) in the field of optical image denoising, Chierchia et al. [14] first proposed a residual CNN for subtracting speckle noise from SAR images. Considering that speckle noise is assumed to be multiplicative, the method first transforms multiplicative speckle into an additive form and then regards the additive speckle as the residual of the network. The ID-CNN [15] can directly train SAR images without requiring a homomorphic transformation. In this method, the SAR image subtracts the learned speckle through skip connections, thus yielding a clean SAR image. SAR-DRN [16] employs dilated convolutions and a combination structure of skip connections with a residual learning. Similar to [15], SAR-DRN is also trained in an end-to-end way. Yue et al. [17] exploited a deep neural network architecture to extract image features and reconstruct the probability density function (PDF) of the radar cross section (RCS) that is obscured by speckle noise. Lattari et al. [18] proposed a deep encoder-decoder CNN based on the architecture of the U-Net to capture speckle statistical features. Cozzolino et al. [19] proposed a nonlocal despeckling method for SAR images, in which the weight of the target pixel is estimated using a convolutional neural network.
From the above deep-learning-based despeckling methods, it can be seen that these methods all employ CNNs with a single-stream structure for training, either outputting a clean image in an end-to-end fashion or learning the underlying noise model. However, it is very difficult for models that adopt a single-stream structure to capture the multidirectional features of images, which will result in the loss of many detailed edge and textural features in the process of removing speckle noise.
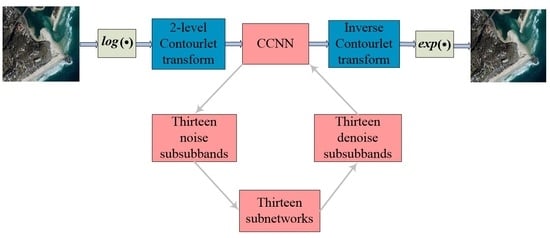
In this paper, we propose a multiscale and multidirectional CNN (CCNN) model to capture image features and to achieve better performance in suppressing speckle noise. The CCNN consists of multiple independent subnetworks (shown in Figure 1), each of which adopts a network structure and a loss function according to the characteristic of the subband. Each subnetwork captures feature details and removes speckle noise from a specific direction and a specific scale. When the loss function of each subnetwork reaches the optimal value, the despeckled SAR image is obtained in a coarse-to-fine manner through the in-verse Contourlet transform.
Benefiting from the multiscale and multidirectional decomposition of the Contourlet transform, the CCNN can capture the detailed features in multiscales and multidirections, thus preserving image resolution while suppressing speckle noise. Compared with state-of-the-art despeckling methods, the CCNN can preserve relatively more detailed features while suppressing speckle noise.
In summary, the main contributions of the proposed method are fourfold: (1) the CCNN uses the Contourlet transform to divide a problem of SAR image despeckling into multiple subproblems and then suppresses speckle noises of the Contourlet sub-bands using multiple independent subnetworks, which means that our proposed CCNN can provide sufficient convolutional layers for capturing the image features, but overcome the problem of vanishing/exploding gradients; (2) each subnetwork has its structure and loss function, which ensures that each sub-band is the most similar to the corresponding sub-bands of the clean SAR image; (3) the features in each sub-band are concentrated in the horizontal or vertical or diagonal direction, etc., which reduces the requirement of a convolutional neural network, that is, each sub-band does not require too many convolution layers or a complex network to capture SAR image features and suppress speckle noise; (4) the subnetwork used to train each sub-band is independent and can run in parallel, thus shortening the training time.
This paper is organized as follows: Section 2 briefly introduces the related work on CNN-based despeckling and the Contourlet analysis. The architecture of the proposed CCNN and the adopted loss functions are described in detail in Section 3. We describe and discuss experimental results for synthetic and real-world SAR data in Section 4. Finally, Section 5 concludes and outlines future work.

2. Related Work

Many schemes for improving the visual quality of SAR image despeckling have been developed. Here, we focus on the schemes that are relative to the proposed CCNN.
With the success of AlexNet [20] in the ImageNet Large Scale Visual Recognition Challenge (ILSVRC-2012), CNNs have attracted great attention in the field of SAR image despeckling. In the last two years, a surge in SAR image despeckling methods based on CNNs has been presented, which adopted the architecture of U-Net [21], ResNet [22], or DenseNet [23]. These CNN architectures are designed with many convolutional layers to make them deep enough to capture abundant enough features for images. To alleviate the problem of vanishing/exploding gradients caused by deepening the networks, the common characteristic of these networks is that not only neighboring layers, but also any other two layers, are linked by using skip connections. U-Net uses skip connections to concatenate feature mapping from the first convolutional layer to the last, second to second to last, etc. In ResNet, the input of convolutional blocks (containing multiple convolutional layers) is added to their output via skip connections. In DenseNet, all preceding convolutional layers were connected to their subsequent layers, which can overcome the shortcomings of ResNet, such as some layers being selectively discarded, or information being blocked. The basic idea of such a design is that only the deep network with a greater number of convolution layers can capture as many features as possible, helping to upgrade the visual quality of SAR image despeckling.
However, SAR image resolution is inferior to that of optical images. If capturing the detailed features of SAR images by only increasing the network depth, network training will become quite difficult and fail to capture some feature details. Multiscale and multidirection are natural attributes of an image. Analyzing the characteristics of multiscale and multidirectional images can reveal more essences of SAR images [24]. The Contourlet transform plays an important role in the multiscale and multidirectional analysis of images and can produce large magnitude coefficients for image details in a certain scale and direction, which can effectively analyze and sparsely represent the edges and textures of SAR images. This helps us to improve the despeckling performance of the CNN-based method.
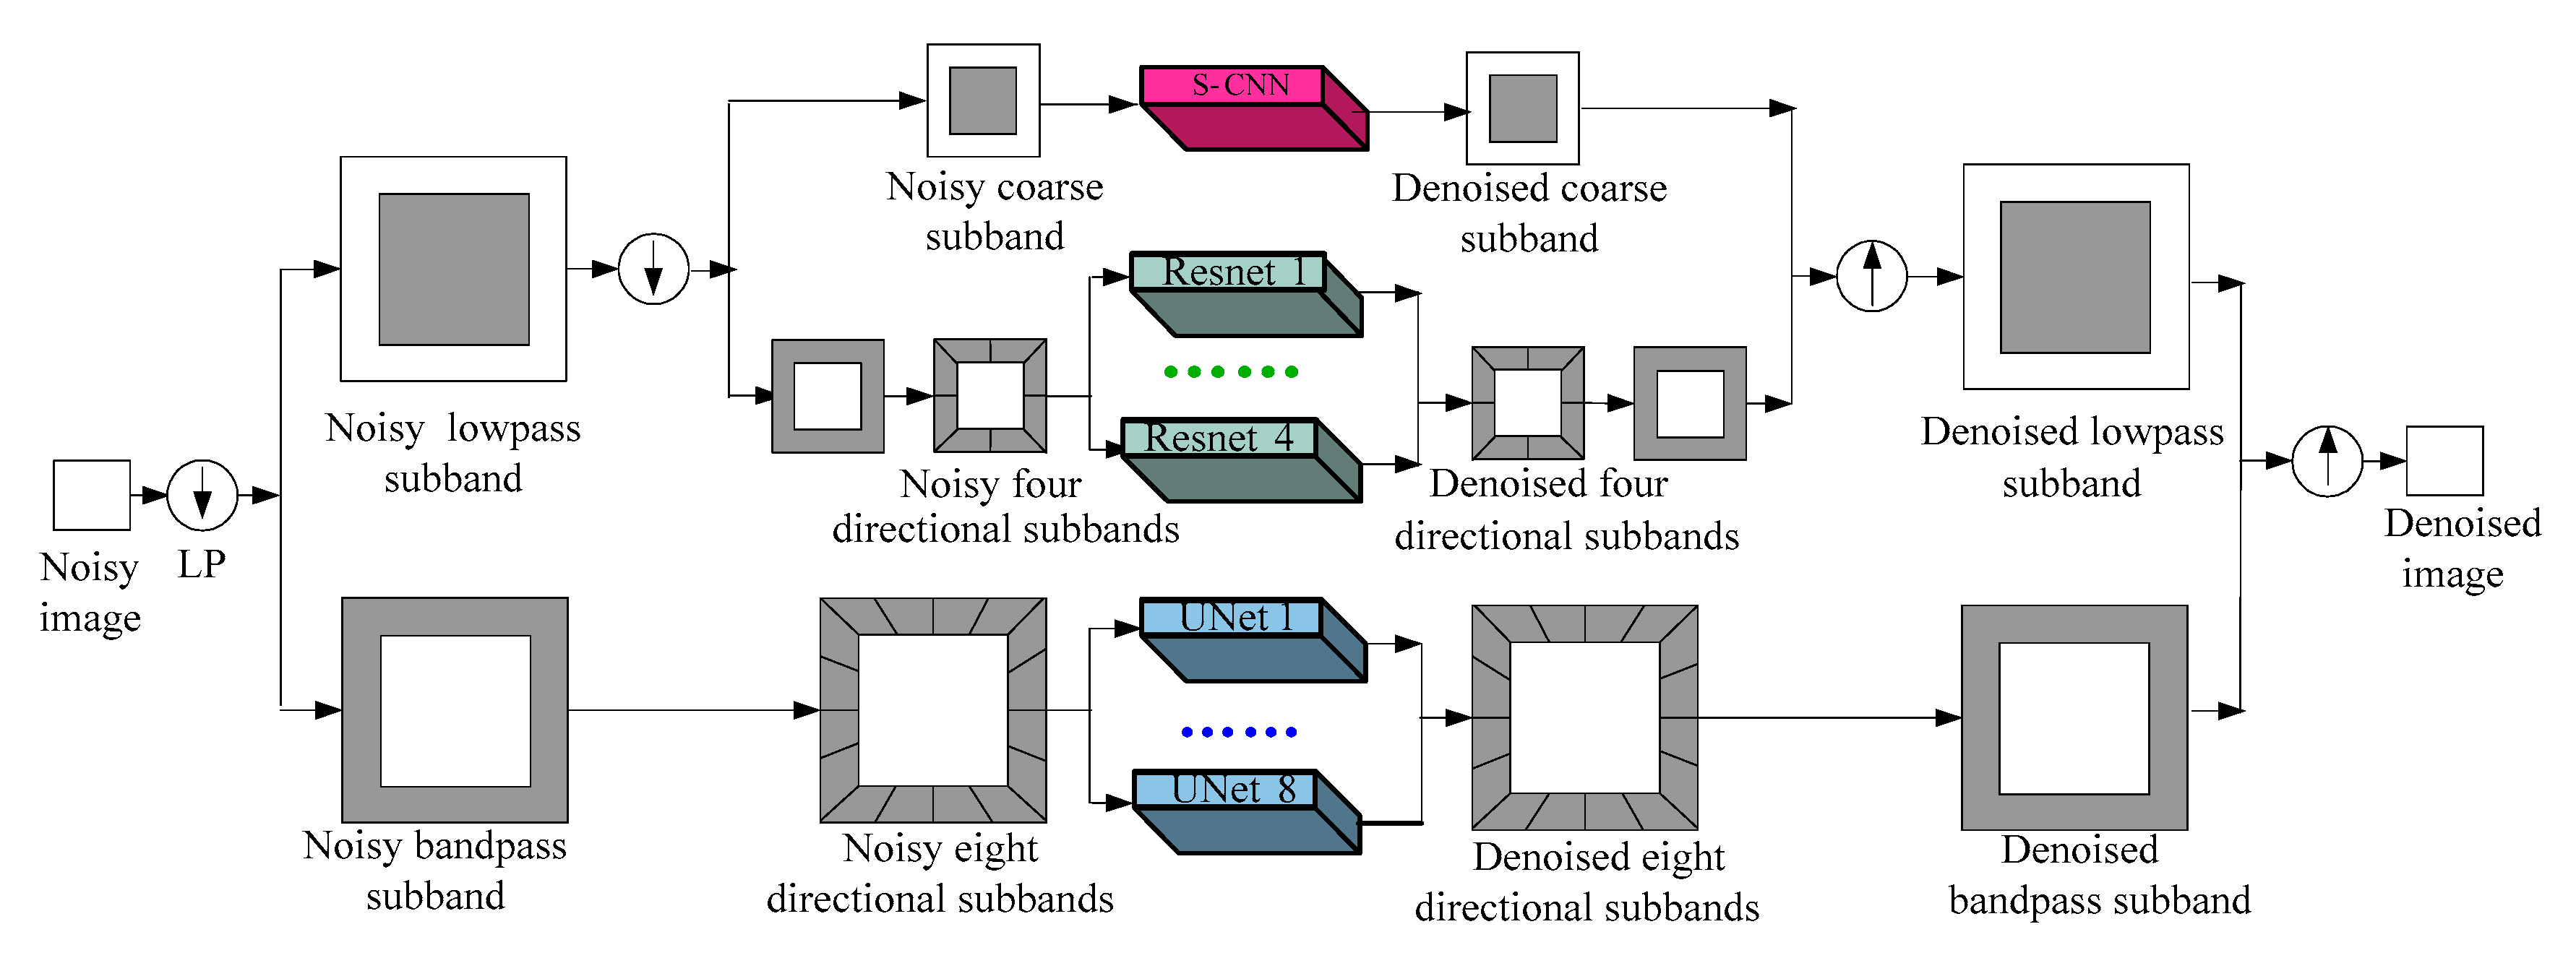
The Contourlet transform [6] is an efficient multiresolution image representation, which has properties such as multiresolution, multiscale, multidirectionality, and anisotropy. The original image can be decomposed into lossless multiscale sub-bands in different directions and different frequency bands through Contourlet transform. In Contourlet transform, the Laplacian pyramid (LP) [6] is first used to decompose an image into a bandpass sub-band and a lowpass sub-band. The bandpass sub-bands from the LP are then fed into a directional filter bank (DFB) [6] to decompose into bandpass sub-bands with specific directional features. The process can be iterated on the lowpass sub-band, generating multiple sub-bands with different scales and different directions. These sub-bands use a few high-magnitude coefficients to represent image features along specific directions, while noise is generally represented by smaller coefficients [25]. Through Contourlet decomposition, we can divide the problem of requiring a deep and complicated CNN to handle SAR image despeckling into multiple small problems, each of which, using a simple CNN, trains the features of a Contourlet sub-band with a specific scale and direction. The features in the Contourlet sub-bands are concentrated in a specific direction, and their feature coefficients are large; the subnetwork that has a relatively simple structure and fewer convolutional layers will be sufficient to fully learn the feature details of each sub-band and effectively suppress speckle noise.

3. Proposed Method

In this section, we first introduce the architecture of the CCNN and describe its subnetworks. Second, we analyze the loss function of each subnetwork. Finally, the CCNN training procedure is described.

3.1. Network Structure

The CCNN is composed of multiple independent subnetworks, each of which captures feature details from a specific direction and a specific scale and removes SAR image speckle noise. Each subnetwork has a structure and objective function for learning the corresponding frequency sub-band independently. When the objective function of the subnetwork reaches the optimal value, it means that the sub-band of the contaminated SAR image has been trained to be very close to that of the clean image and, at this time, the parameters of the subnetwork have been adjusted to the optimal value. Now, the inverse Contourlet transform can be applied to all the well-trained sub-bands, resulting in a clean SAR image. As shown in Figure 1, the CCNN does not seek to improve the performance of capturing image features and eliminating speckles by deepening the network. The CCNN attempts to decompose images into several sub-bands or multiple subproblems using the Contourlet transform and then suppress speckle noise using multiple multidirectional and multiscale subnetworks. Thus, not only is the performance-suppressing speckle noise of the network guaranteed, but as many SAR image feature details as possible are preserved, thus balancing the despeckling performance against the lost feature details.
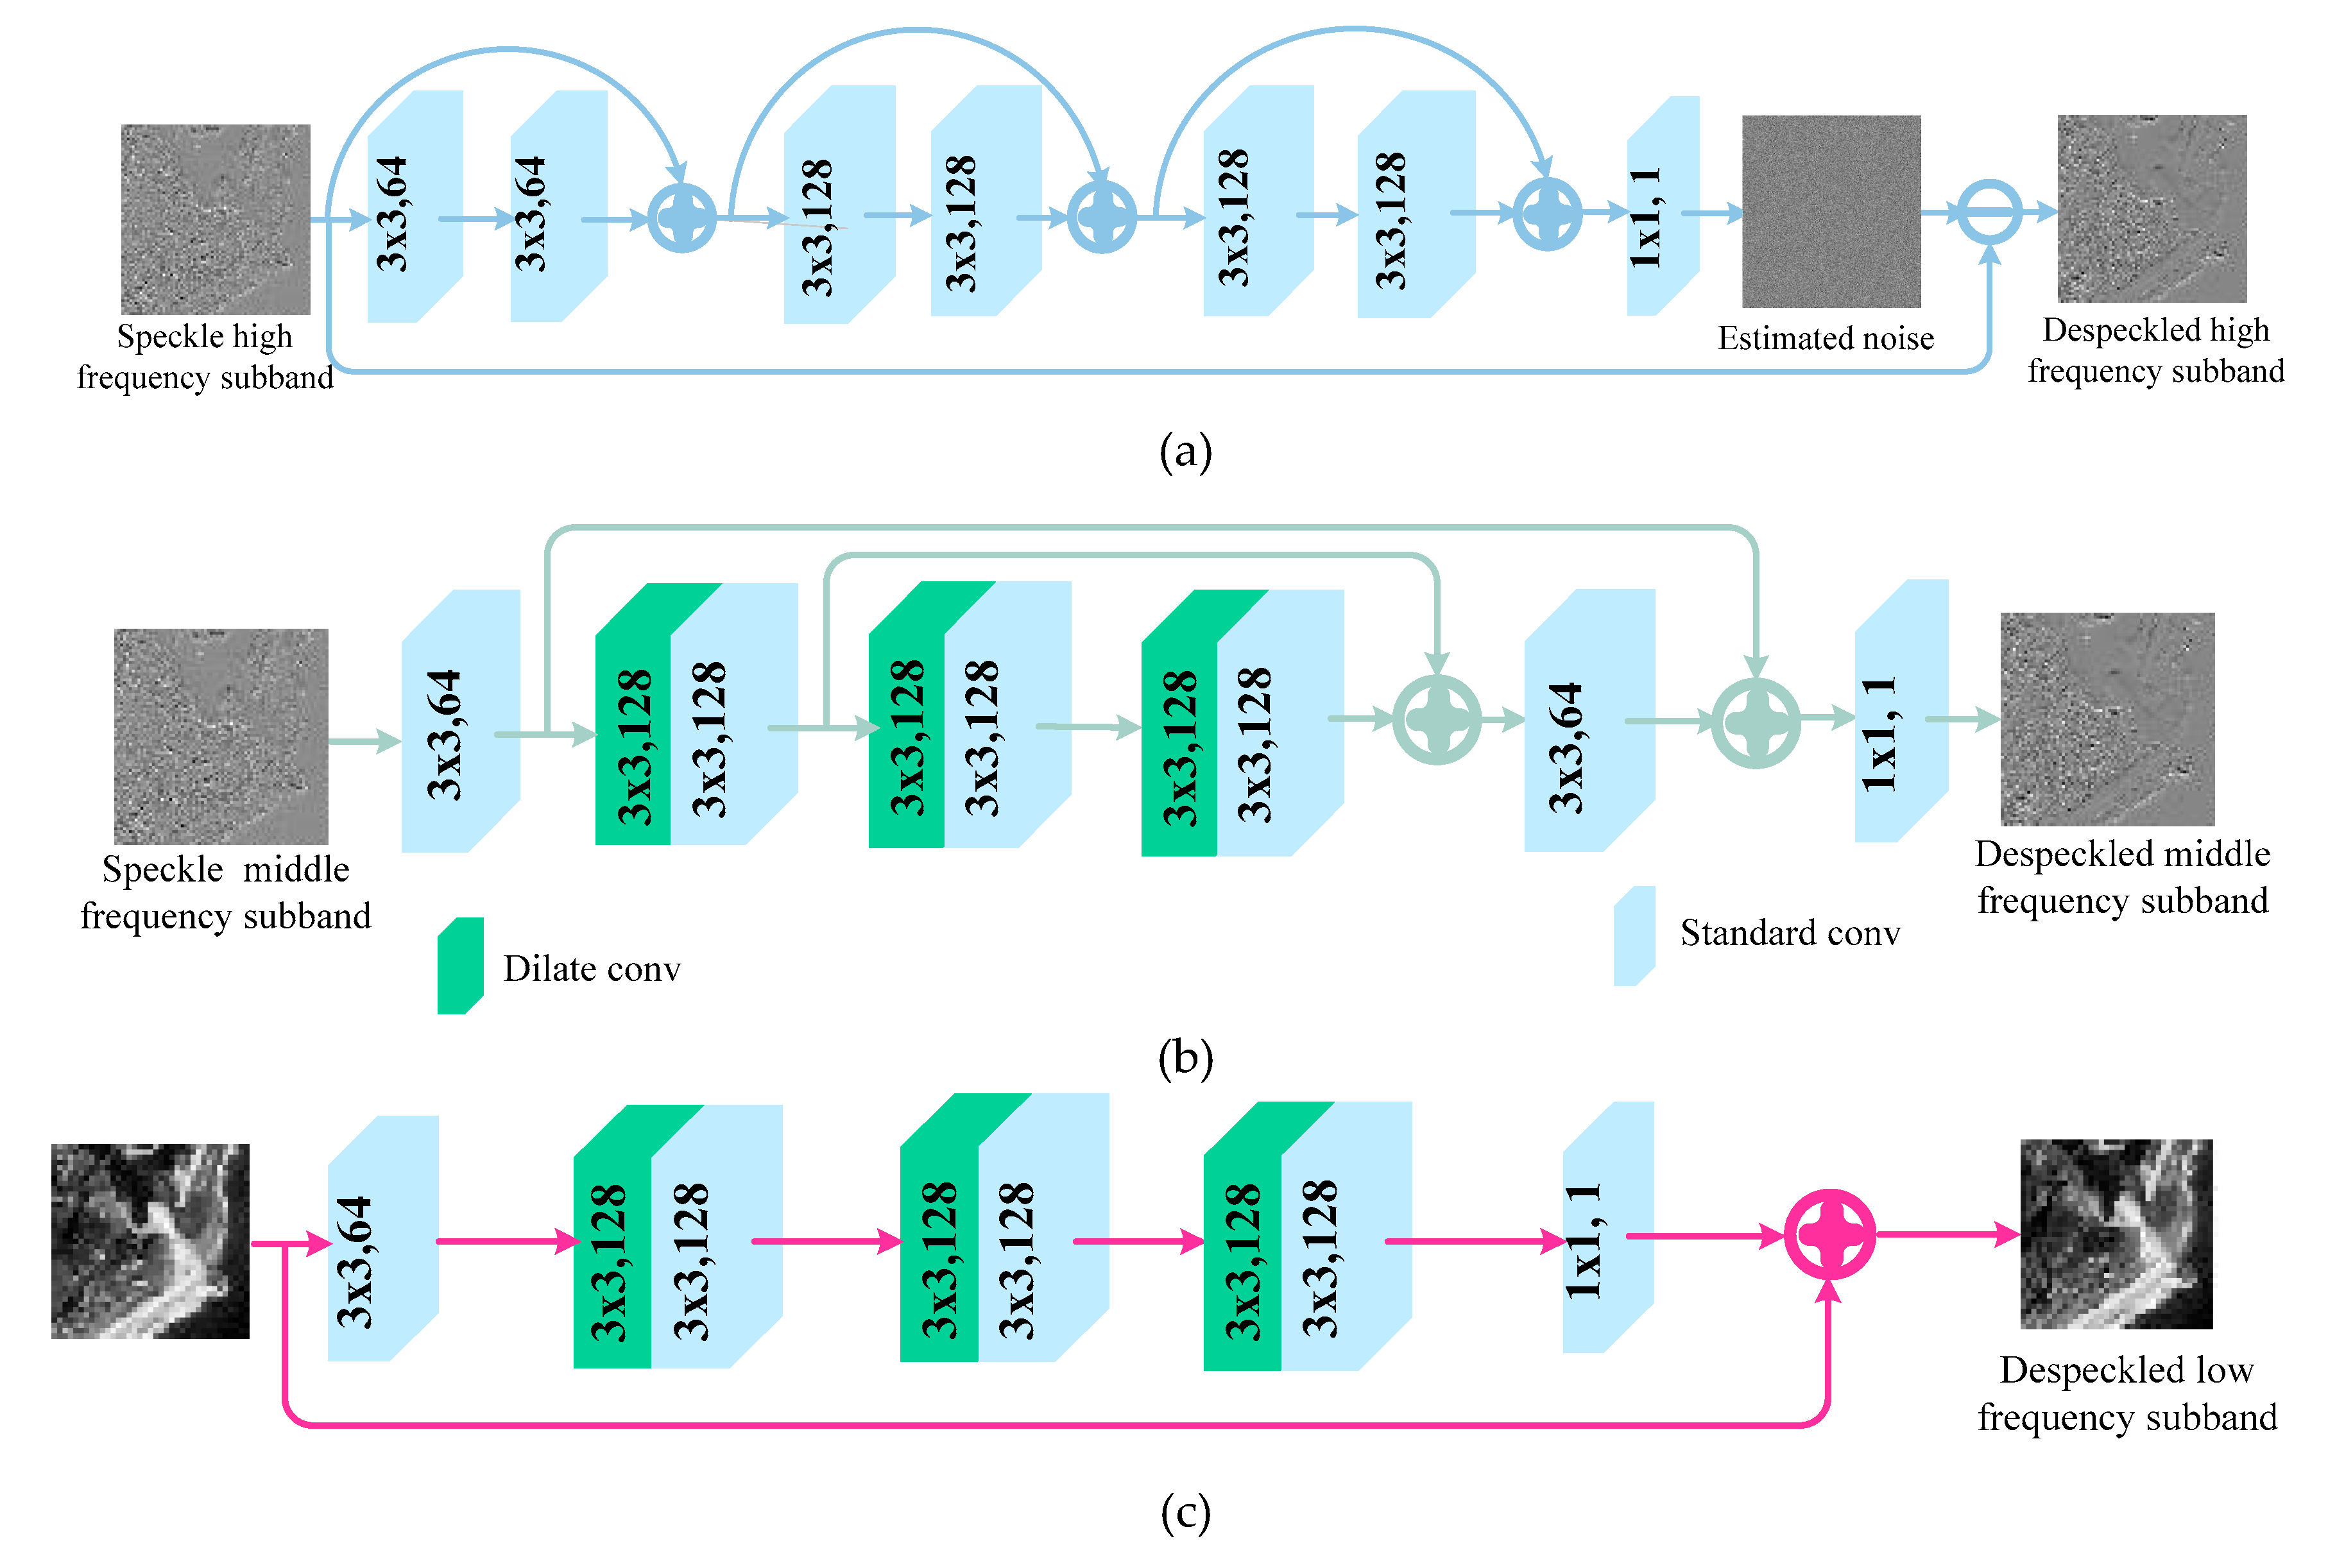
Figure 1 shows the overall structure of the CCNN based on 2-level Contourlet decomposition. We use the ResNet [22] structure to design the eight subnetworks (shown in Figure 2a) for training the directional sub-bands in the first level of the Contourlet transform. This is based on the fact that these sub-bands contain most of the speckle noise of SAR images. We use the subnetworks with residual learning to directly estimate speckle noise and then obtain the sub-band of the estimated image via skip connections. The subnetworks consist of six convolutional layers. The subnetworks that are responsible for training the directional sub-bands in the second level of the Contourlet are designed with the UNet structure (shown in Figure 2b, UNet1, UNet2, UNet3 and UNet4). This is based on the fact that UNet [21] can perform well in image segmentation and capture the features of the refined edges of an image. These subnetworks have five convolutional layers, among which three are mixed convolution layers. The mixed convolution layer is obtained from the dilated convolution and the standard convolution, which can not only enlarge the receptive field of suppressing speckle noise, but also fully capture the small features of the image, thus preserving as many of the detailed features as possible. S-CNN, shown in Figure 2c, which is responsible for training the coarse sub-band of the Contourlet, is composed of four convolution layers, among which are three mixed convolution layers. In addition, we add skip connections between the input and the output to ensure that the overall features of the image can be passed into the output. More details about each subnetwork setting are shown in Figure 2.

3.2. Loss Functions

Loss functions is key to ensuring the performance of the CCNN. We explored different loss functions and their combinations to effectively learn various tasks [26,27,28]. The per-pixel Euclidean loss was considered an effective quantitative assessment. However, we observed that it may cause the loss of image details and result in artifacts on the final estimated image if minimizing pixelwise error depends only on the per-pixel loss. Additionally, the loss of the image details can be evaluated by capturing the difference in the detailed features [29]. Considering this, we combine the total variation (TV) regularization term with the Euclidean loss (EL) as the final loss function to judge the visual quality of each sub-band (the output of each subnetwork). The Euclidean loss is defined as
E L = 1 C W H i = 1 W j = 1 H ( x ( i , j ) y ( i , j ) ) 2
The TV regularization term can be calculated as follows
T V = i = 1 W j = 1 H λ ( ( x i , j + 1 x i , j ) 2 + ( x i + 1 , j x i , j ) 2 2 )
Finally, the loss function can be represented as
L c s = T V + E L
where x(i, j) and y(i, j) represent the Contourlet coefficient values of the estimated SAR image and the corresponding clean image, respectively. C, W, and H represent the channel, width, and height of the input subband pair, respectively. The loss function use of the L c s metric can measure the difference between the sub-bands of the estimated image and that of the clean image, resulting in a relatively good peak signal to noise ratio (PSNR) for images.
However, the restored image with a higher PSNR does not mean that the image details are well preserved. To create a better balance between preserving the detail features and suppressing speckle noise, we introduce a weight of λ into the loss function L c s . Because the coarse sub-band hardly contains speckle noise energy, we set the weight λ of the loss function L c s of the low-frequency sub-band to 1. For the loss function, L c s , of the directional sub-bands, λ is obtained as follows
λ = { 1.1 if ( | x ( i , j ) | ave ) 0.9 else
where ave represents the average value of the Contourlet coefficients of each directional subband. It can be calculated as
a v e = 1 w h i = 1 w j = 1 h | x ( i , j ) |
Note that the ave of each directional subband is different and is closely related to the noise coefficients and the feature coefficients of each subband. Therefore, the loss function of each subband is also different. The image feature energy far surpasses the noise energy in images and noise has no directivity, meaning that the Contourlet coefficients of the image features are relatively larger, while the noise coefficients are relatively smaller. In computing the loss function of each subband, all coefficients larger than the ave threshold are considered to represent the features of the image details and are assigned a larger weight to enhance these features. All coefficients lower than the ave threshold are considered noise information and are assigned a smaller weight to suppress the noise.

3.3. Training Procedure

3.3.1. Training Set and Parameter Setting

We train two CCNN models: one using the synthetic SAR image dataset and one using the real SAR image dataset. The synthetic SAR image dataset was built using 2500 optical images by injecting single-look speckle, and were collected from ISLVRC 2012 [30] and the Waterloo Exploration Database [31]. The real SAR image dataset is from 800 images from the UC Merced Dataset [32], the UCID [33], and scraped Google Maps images [34]. For the real SAR image dataset, the challenge is to create corresponding pairs of speckled and target images. Now that it is not possible to physically obtain a thoroughly despeckled SAR image, we adopt an alternative strategy to obtain speckle-free references as target images. We obtain the speckle-free targets by averaging multilooked images (25 dates) and keeping only the regions that do not significantly change over time. Specifically, we pick out those objects that have continuous single-look images from the UC Merced Dataset and the UCID Dataset. The first image of each object was used as the speckle SAR image, and the next series of 25 images were used to calculate the speckle-free data. We discarded the regions with significant temporal changes and averaged the same regions of 25 images, yielding the “clean” data. Of course, such a reference is far from a “clean” image, not only for the presence of temporal changes, but also for the limited number of SAR images, resulting in imperfect rejection of speckle. We use this real SAR image dataset to fine-tune the CCNN, which has been well trained via the synthetic SAR image dataset. All images are resized to 256×256 and the training data are augmented by random combinations, such as vertical and horizontal flipping, 90° and 270° rotation, changes in image contrast, etc. The test images are from the PatternNet dataset [35] and BSD500. The entire network is implemented in the TensorFlow framework and is updated using the Adam optimizer [36]. The activation function used is ReLU [37]. The convolution kernels for feature extraction are 3×3, and the kernel size for feature aggregation is 1×1. The final convolution layer is 3 (corresponding to a color SAR image) or 1 (referring to a grayscale SAR image). The learning rate is initially set to 0.0002 for all the subnetworks and it decreases by one-quarter after every 25 epochs. It takes approximately 9 h to train the CCNN with an NVIDIA RTX 2080Ti in the case that the 13 subnetworks (both grayscale SAR images and color SAR images via Contourlet decomposition of two levels) can work in parallel.

3.3.2. Network Training

Both Contourlet transform and CNN are suitable for dealing with additive noise. Therefore, we need to use the homomorphic transform to change the multiplicative speckle noise that contaminates the SAR images into additive noise before the Contourlet transform is applied to the SAR images. At the output of the CCNN, after the inverse Contourlet transform is used to composite the estimated images, the exponential function is needed to map the estimated image back to the multiplicative domain. In the CCNN, we decompose the speckled images through the Contourlet two times and obtain the thirteen Contourlet sub-bands, which concentrate the image features of the vertical, horizontal, diagonal directions, etc., and highlight these detailed features. Meanwhile, the subnetworks that are responsible for training the directional sub-bands of the first level of the Contourlet are designed with the Resnet structure to directly train the speckle noise rather than to train the estimated images. Therefore, these subnetworks can achieve the best despeckling performance with relatively shorter run time, creating a better balance between the performance of suppressing speckle and running efficiency. Each sub-band of the speckled images, incorporated with the corresponding Contourlet sub-bands of the clean images, is input into its network for training. The loss function of each subnetwork is calculated using Equation (3), learning the function mapping from the noisy sub-band to the clean sub-band. When the loss function of each subnetwork reaches the minimum, the feature mappings of all the subnetworks are obtained. Subsequently, the CCNN is used to remove the speckle from a tested SAR image.

4. Results

We carried out experiments on both synthetic and real SAR images. The motivation for designing the CCNN was to improve the performance of suppressing convolutional neural network speckle while shortening the training time. To this end, multiple experiments were conducted to evaluate the performance of the CCNN. First, we investigated the advantages of each independently learned Contourlet sub-band. Second, we examined the impacts of the different structures of the subnetworks on the despeckling quality of the SAR images. Third, we investigated the effect of different subnetworks with different loss functions. These experiments belong to our ablation studies, displaying the impact of each basic component on the performance of the CCNN. Finally, we selected four representative despeckling methods as the comparison baselines to compare and comprehensively analyze the performance of the proposed CCNN method: three CNN-based methods (SAR-CNN [14], ID-CNN [15], and SAR-UNet [18]), and the representative traditional method (SAR-BM3D [13]).
We used the PSNR to evaluate the despeckling results of the synthetic SAR images. In addition, the structural similarity (SSIM) [38] was used to evaluate the ability to retain the image details. Sheikh et al. [39] discussed many quantitative metrics for the estimated images and stated that the SSIM index is good at assessing the fidelity of detailed features. The higher the values, the more similar the local feature of the image will be, and the better the fidelity of the image. For SAR images from real-world scenarios, speckle suppression ability is measured objectively using no-reference image quality evaluation such as the natural image quality evaluator (NIQE) [40] and the equivalent number of looks (ENL) [41], which are calculated on homogeneous regions of the despeckled SAR images. The former can objectively measure the ability to suppress speckle noise in the absence of clean reference images, and the latter is sensitive to the content sharpness, texture diversity, and detail contrast of the images. Therefore, they are suitable for evaluating the speckle suppressing results of SAR images from real-world scenarios. The larger the NIQE and the larger the ENL, the better the preserved image details will be, and the speckle results will be suppressed.

4.1. Ablation Studies

4.1.1. Subband Training

In this section, we aim to verify that each Contourlet sub-band being trained independently not only shortens the training time but is also helpful for enhancing the denoising quality. One of the advantages of the CCNN is that it can be divided into several subnetworks. These subnetworks can learn the feature mapping of each Contourlet subband on multiple computers in parallel, and the well-trained sub-band can then be integrated to obtain a clean image through the inverse Contourlet. The CCNN that is trained in this way is denoted as CCNN-1. The CCNN learns its feature mapping on a single computer. Here, we compare the CCNN with the SAR-BM3D [13], SAR-CNN [14], ID-CNN [15], and SAR-UNet [18], despeckling benchmark methods. The results of these methods, shown in Table 1, come from their paper or cite their paper.
Table 1 displays the averages of PSNRs/SSIMs/NIQEs/ENLs and the GPU runtime when the CCNN and the four comparison methods handle the 100 images from the BSD 500 (added with the speckle noise of σ = 0.08 ) and the PatternNet dataset. The CCNN-1 and the CCNN both achieved the best metric values, with a relatively shorter execution time when compared with state-of-the-art image despeckling methods. It can also be seen that the execution time and training time of the CCNN were slightly greater than those of CCNN-1. This is because the subnetworks of CCNN-1 can be independently trained on multiple computers in parallel. The subnetworks of the CCNN are confined to running on a single computer. Due to the multiscale and multidirectional decomposition of Contourlets, the sub-bands of the Contourlet can not only intensively represent common characteristics in a certain direction, but also use larger coefficients than those of the noise to represent these features (for example, the coefficients of the horizontal directional edges in the LH sub-bands are larger). Each sub-band does not lose any detailed features because it does not require clipping. Therefore, each subnetwork does not require a deep CNN with many convolution layers to capture the characteristics of these sub-bands; moreover, each subnetwork has a loss function, which can control and adjust the parameters of the subnetwork, to ensure that each sub-band is most similar to that of the clean SAR image. These measures ensure that the proposed CCNN can achieve better PSNR/SSIM/NIQE/ENL metrics than those of other comparison methods at a relatively faster speed, even if the CCNN works on a single computer.

4.1.2. The Structure of the Subnetwork

Here, we verify that the mechanism, i.e., each subnetwork that adopts a training structure to suit the characteristic of each sub-band, is helpful for improving the performance of the CCNN. In the CCNN, the structure of the subnetwork that is responsible for training each Contourlet sub-band can be different. We explore a CNN architecture that is fit for them according to each of their Contourlet sub-band attributes. The common feature of these subnetworks is that they all have few convolutional layers, which means that our proposed CCNN can have enough convolutional layers to capture the image features without causing the problem of vanishing/exploding gradients. The directional sub-bands in the low level contain most of the speckle noise of an SAR image and the size is larger. We adopt the ResNet structure to capture the speckle noise features from the sub-bands and learn the speckle noise feature mappings. Although these sub-bands are large, the subnetworks train the speckle noise features rather than the image content by using residual learning, which is not only easy to train but also reduces the learned parameters. This is based on the fact that there are far fewer contents to be learned from the noise than from an image. For the directional sub-bands in the highest level, the sub-bands contain more detailed features and less noise, and these detailed features may be very thin, which requires that the fine features extracted from the previous convolution layers can be passed to the subsequent convolution layers. Therefore, the subnetworks that are in charge of the directional sub-bands at the second level adopt the U-Net structure. Symmetric connections are added between the convolution layers and their corresponding layers, ensuring that the overall features captured by the previous convolution layers are passed into the subsequent feature maps. Furthermore, we also utilize dilate convolutions to enlarge the receptive field of the convolutional layers and to capture the thin features. For the coarse sub-bands in the highest level, the sub-bands contain much more overall image information, fewer detailed features and the least noise. The S-CNN that contains fewer mixed convolutional layers and has a skip connection will be competent enough to capture and learn the overall features of the coarse sub-bands.
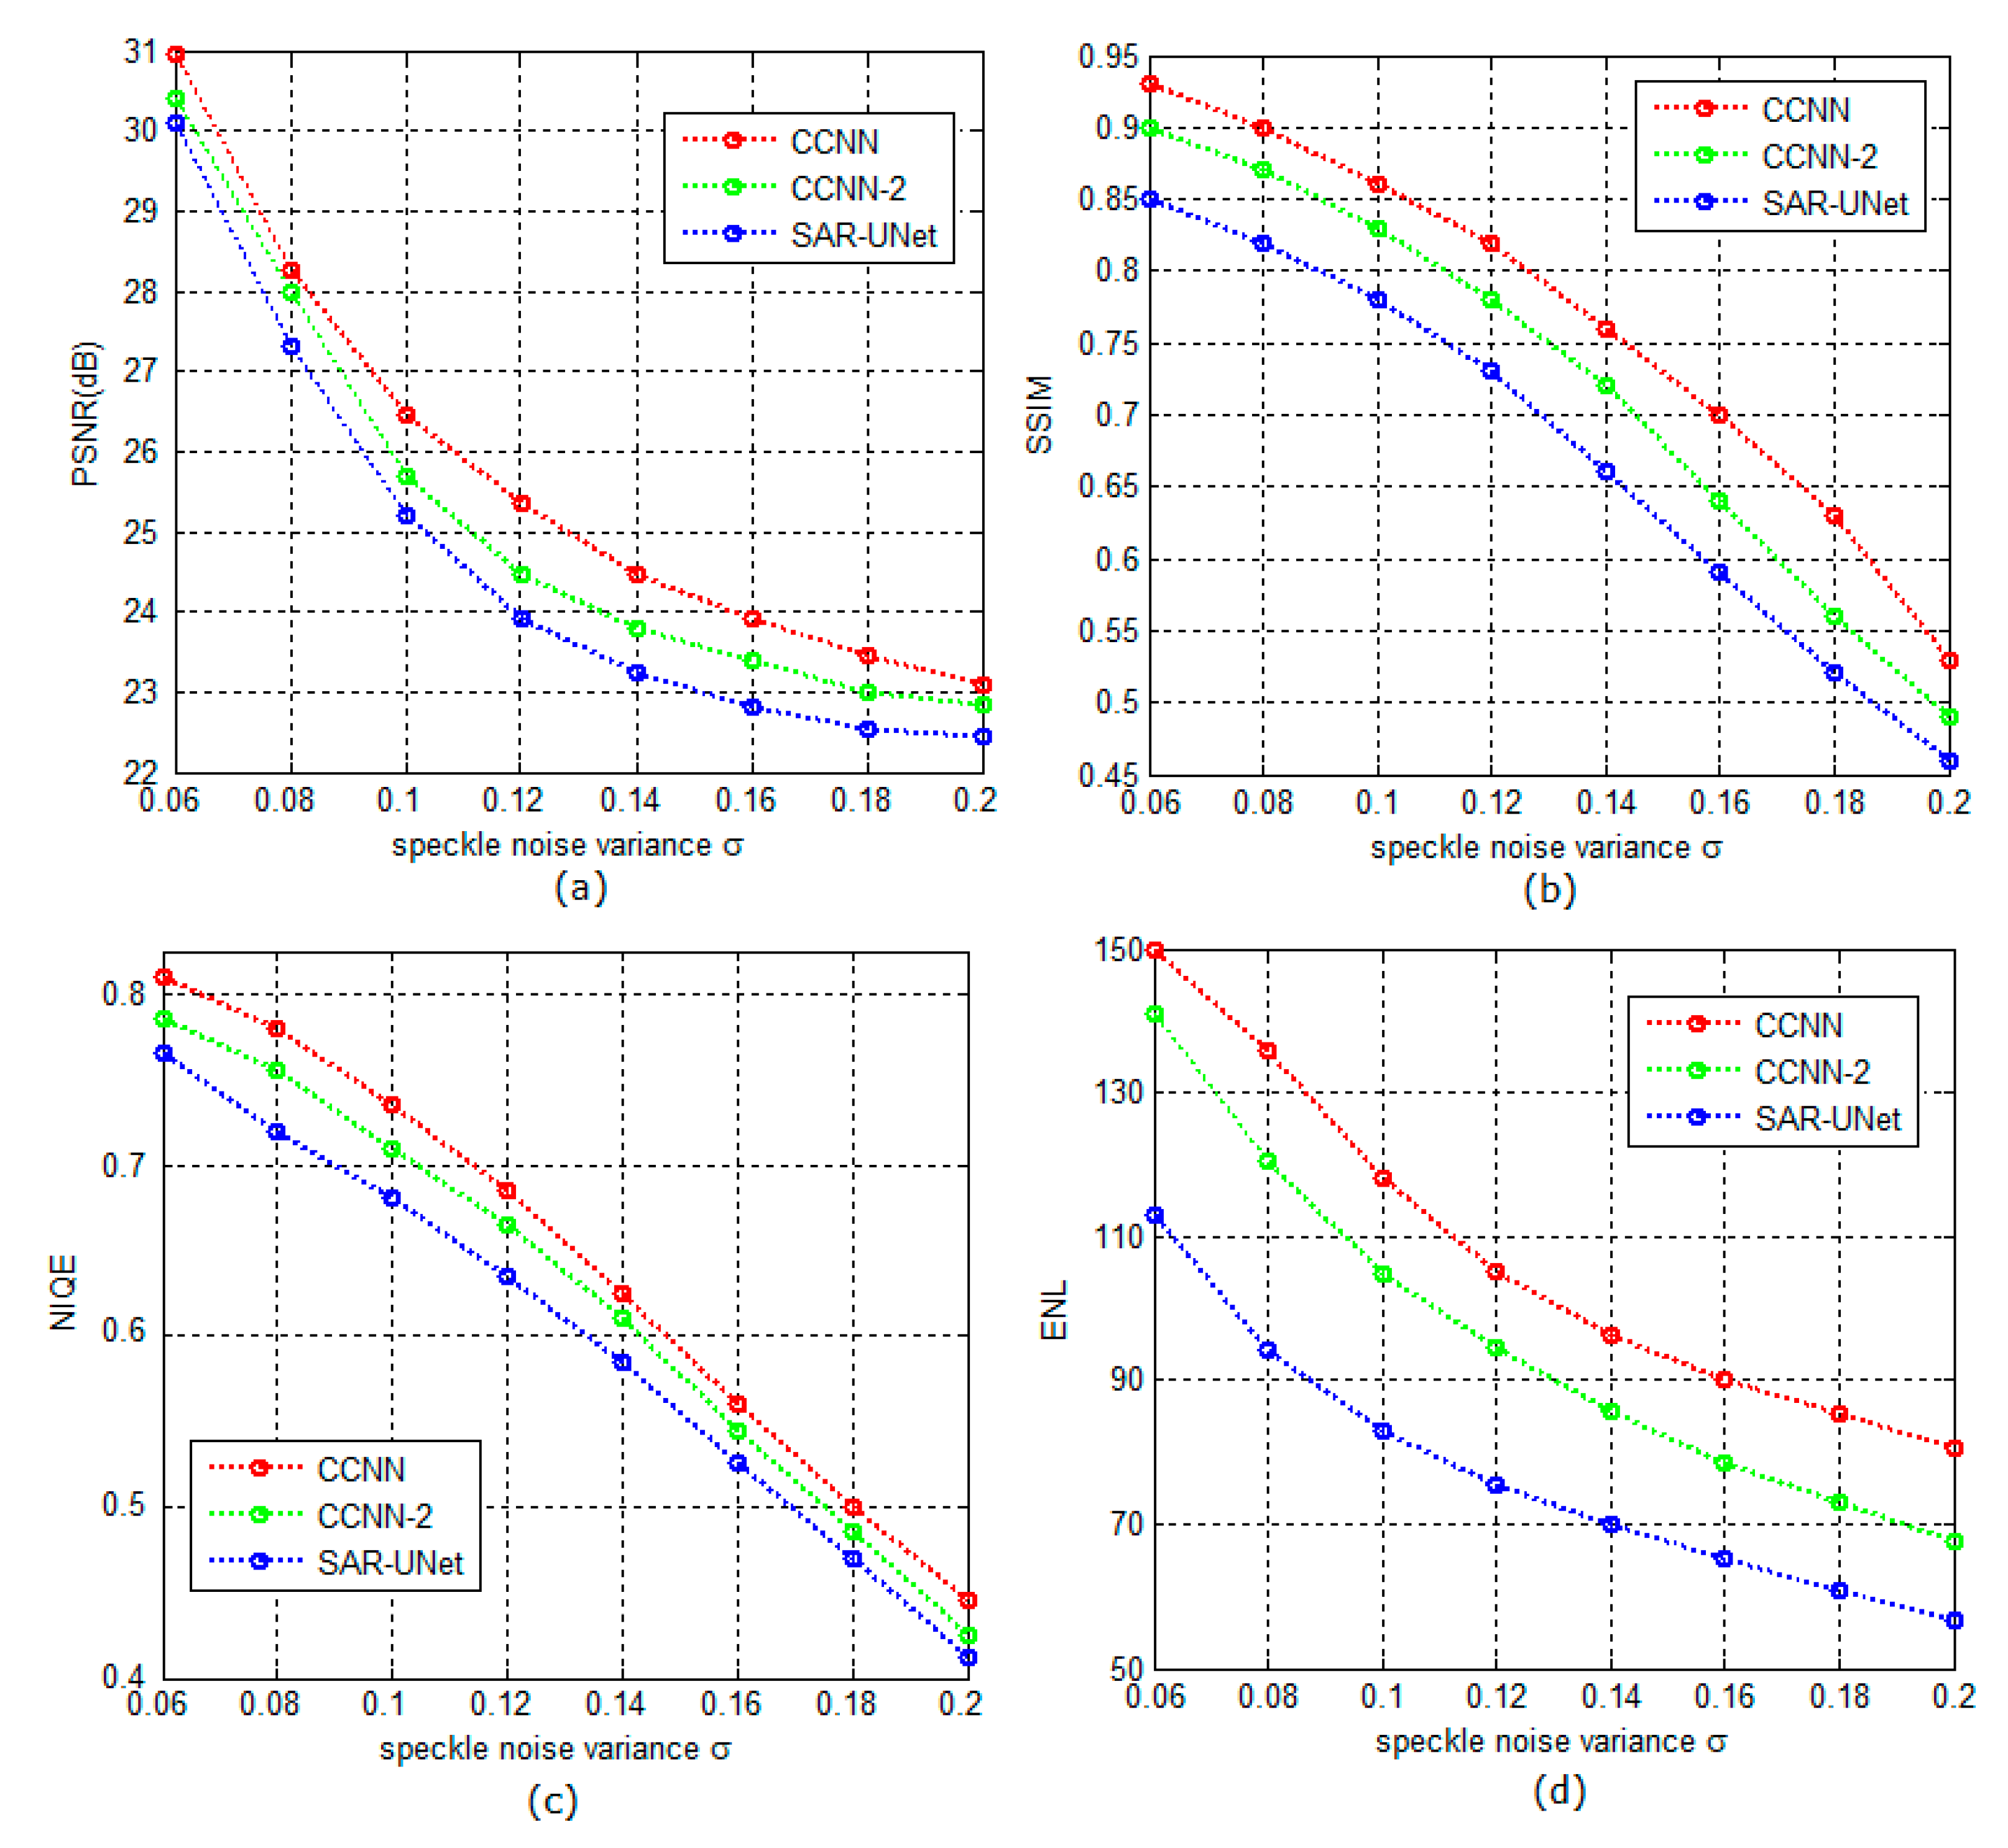
Figure 3 shows the positive impact of the subnetwork structures on the performance of the CCNN. The CCNN-2 represents a variant of the CCNN in which all the subnetworks are designed with the ResNet structure (i.e., the structure shown in Figure 2a) and each subnetwork has eight convolutional layers. We consider SAR-UNet [18] as a comparison baseline because it uses the same structure to extract detailed features at different scales. The comparison of the proposed CCNN method, the CCNN-2 method and the SAR-UNet method in terms of PSNRs/SSIMs/NIQEs/ENLs is shown in Figure 3a,d. These data are from the average of the 100 synthetic SAR images that included speckle noise with the variance σ = 0.06, 0.08, …, 0.2. Figure 3 illustrates that the performance of the CCNN is significantly superior to that of SAR-UNet. Additionally, the performance of CCNN-2 slightly surpasses that of the SAR-UNet method. This indicates that the strategy that uses the different CNN structures to train the different sub-bands can significantly improve the performance of suppressing speckles of the CCNN.

4.1.3. Loss Function

In the CCNN, the subnetwork used to independently train each Contourlet sub-band has not only its own structure but also its own loss function. As is known, the image contents and noise can be partially separated through multidirectional and multiscale Contourlet decomposition. The correlation of the image information is large, and the correlation of the noise information is small. Therefore, the amplitudes of most coefficients of the image details are higher than those of most of the noise coefficients, even if the noise intensity is high. Therefore, in the directional sub-bands, the high-magnitude coefficients convey most of the image detail energy and most of the low-magnitude coefficients are due to noise. If the high-magnitude coefficients can play a leading role in the loss function, it is conducive to the learning and preservation of image details and suppressing noise. Considering this point, we introduce a weight factor λ into the loss function of the directional sub-bands. The weight factor λ is set to two different values according to the coefficient values of the directional sub-band. Only coefficients greater than the average of the coefficients of each directional sub-band are assigned a higher λ value, and the rest are assigned a lower λ. However, the averages of the coefficients of each directional sub-band are bound to be different, which means that the objective function of each subnetwork has its own standard. This mechanism is helpful for suppressing speckle noise while preserving the feature details. To verify the effectiveness of this scheme, we conducted the following experiments: each subnetwork uses the same loss function, i.e., weight factor λ of Equation (1) is set to 1, to learn its feature mapping, and this CCNN is denoted as CCNN-3. Here, we consider the ID-CNN [15] as a comparison baseline because its weight factor λ of the loss function is also a constant.
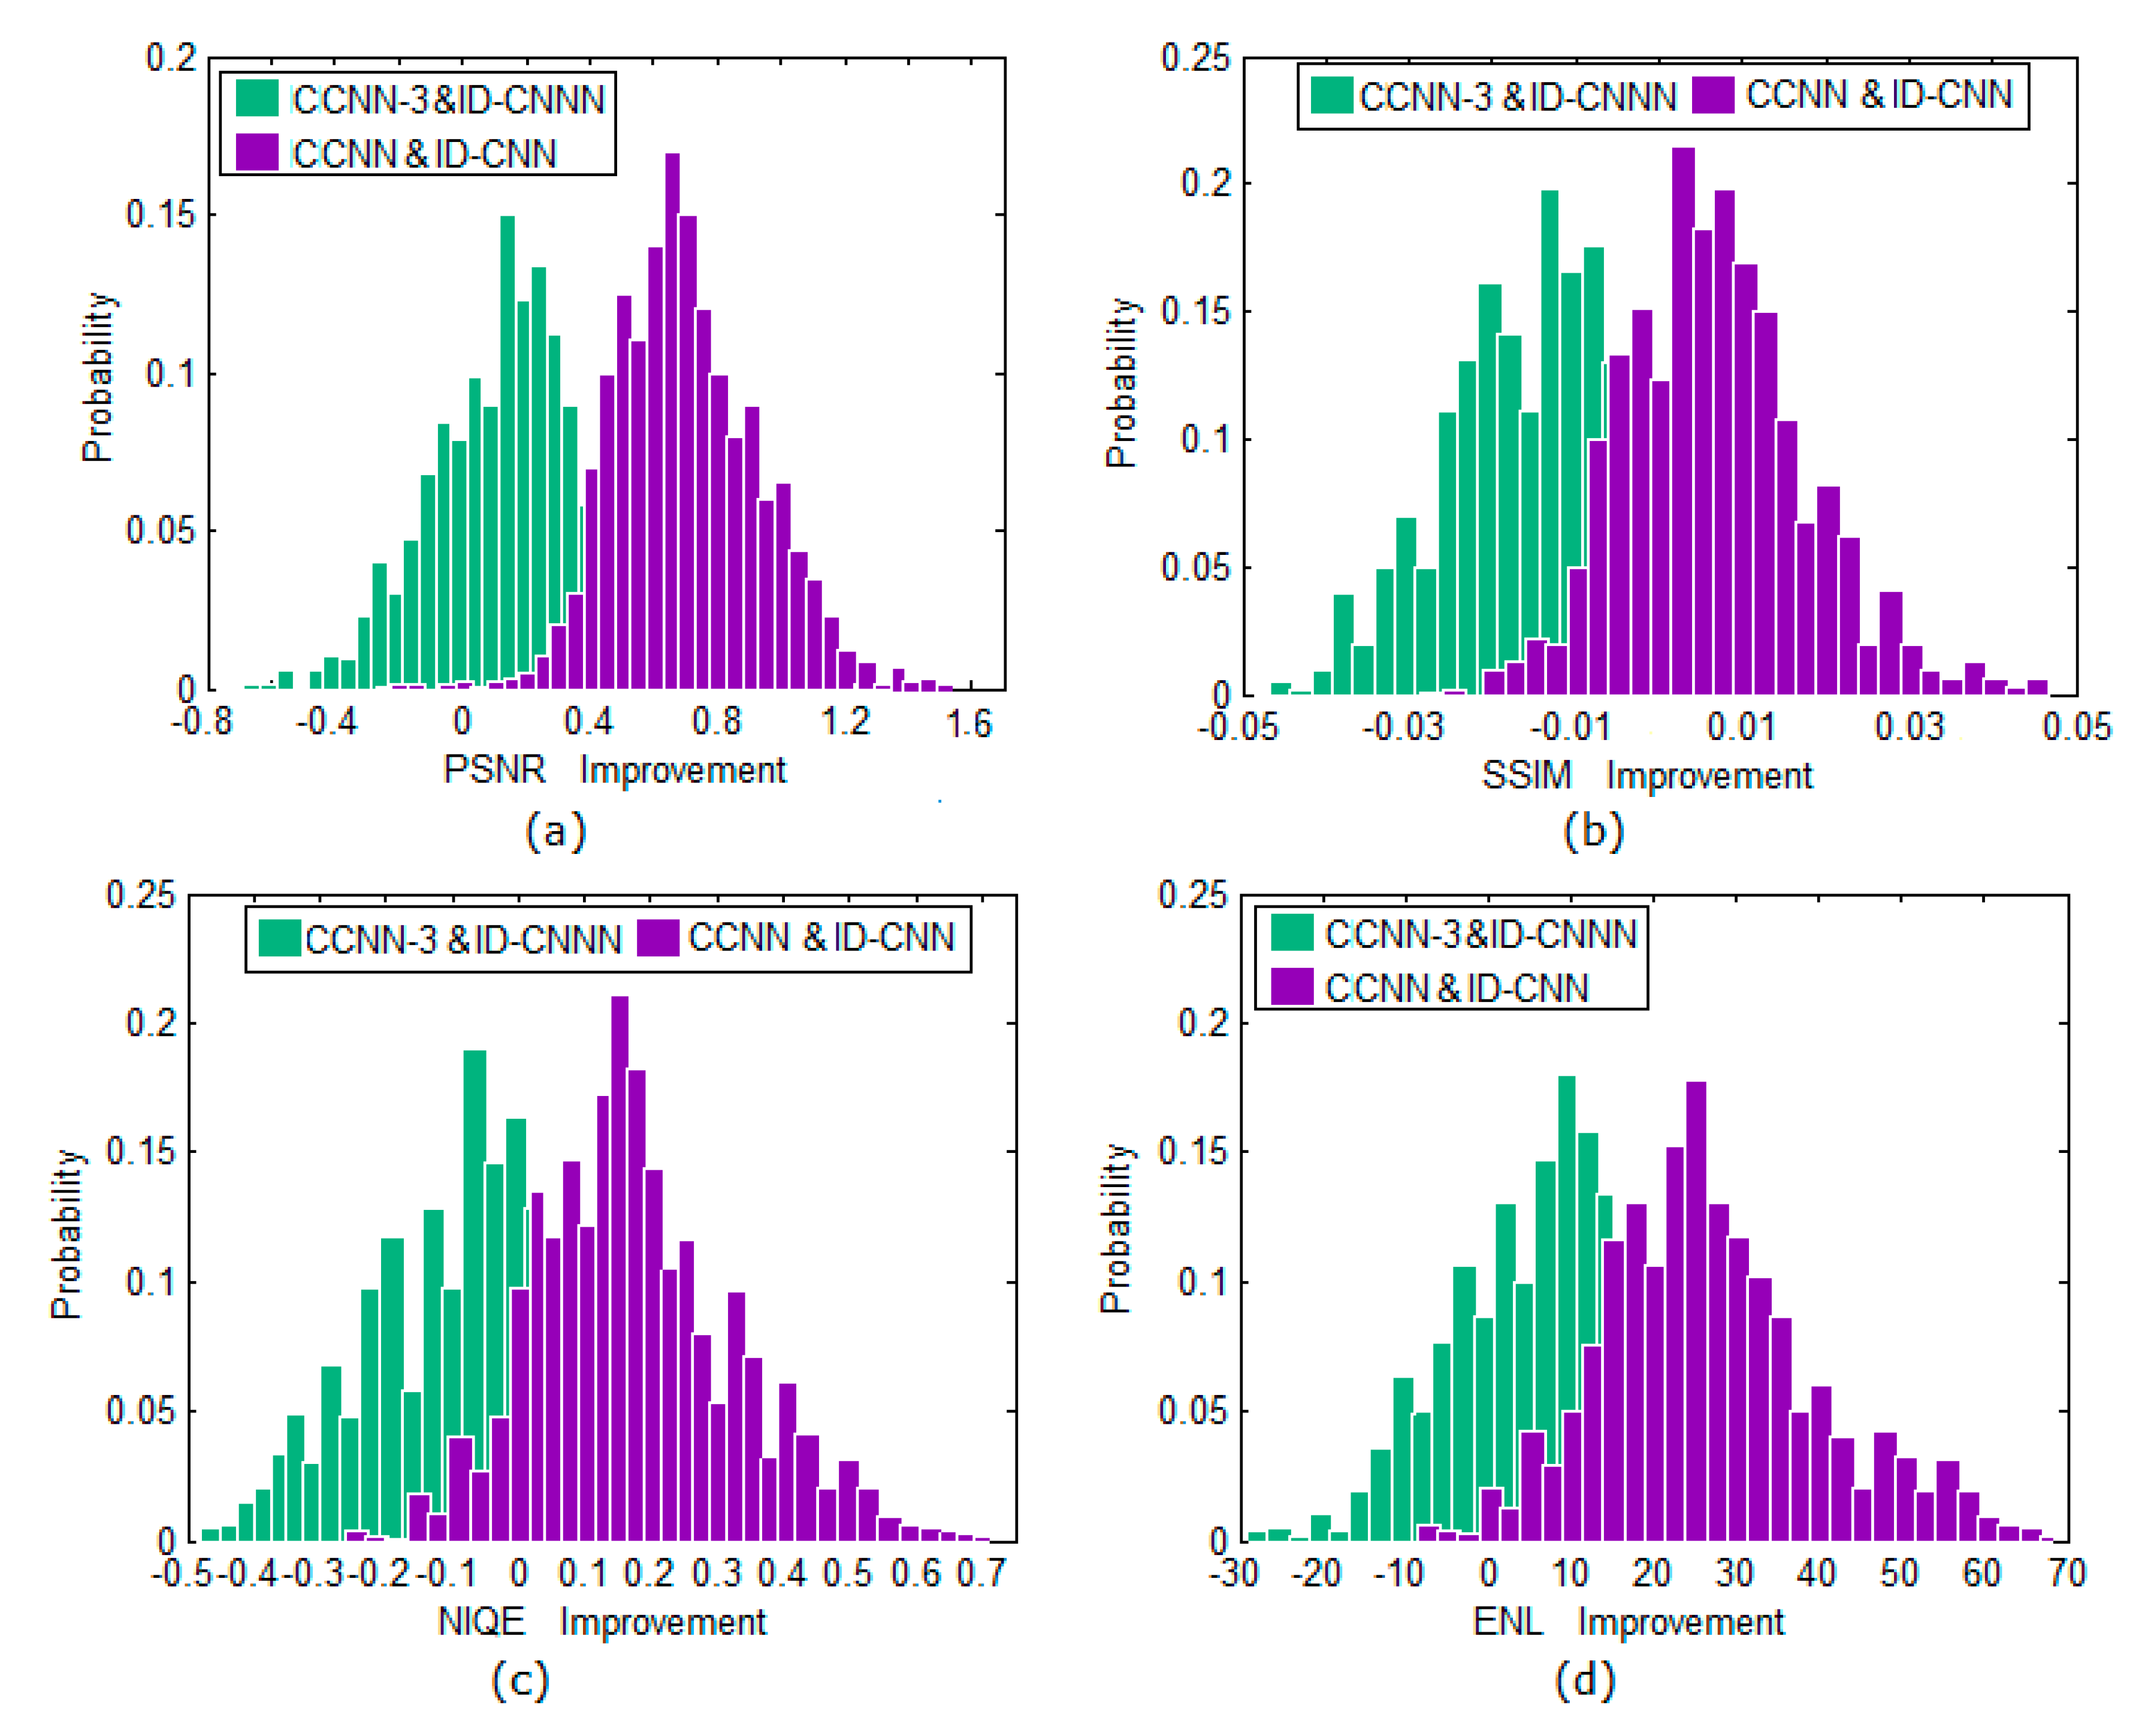
Figure 4 shows the probability distributions of the PSNR, SSIM, NIQE, and ENL gains of these 200 SAR images (100 synthetic and 100 real images). These gain values were obtained from the CCNN and CCNN-3 relative to the ID-CNN baseline. The PSNR/SSIM/NIQE/ENL gains shown in Figure 4 illustrate that the performance of the CCNN exceeds those of the ID-CNN by a large margin and that CCNN-3 is slightly superior to the ID-CNN, which demonstrates that using different loss functions to supervise learning of each sub-band is helpful for improving the despeckling performance of the CCNN.

4.2. The CCNN Performance

To comprehensively verify the CCNN performance, we investigate the despeckling results of the CCNN and the four comparison methods on synthetic SAR images and real SAR images. In particular, we also investigate the performance of the CCNN+, a variant of the CCNN, in which the number of convolutional layers increases to 10 or the number of the mixed convolution layers increases to five in each subnetwork. The regions of interest (ROIs) in each despeckled image are enlarged by two times using bicubic interpolation and are shown in the corners to highlight the details obtained from different methods.

4.2.1. Results on Synthetic SAR Images

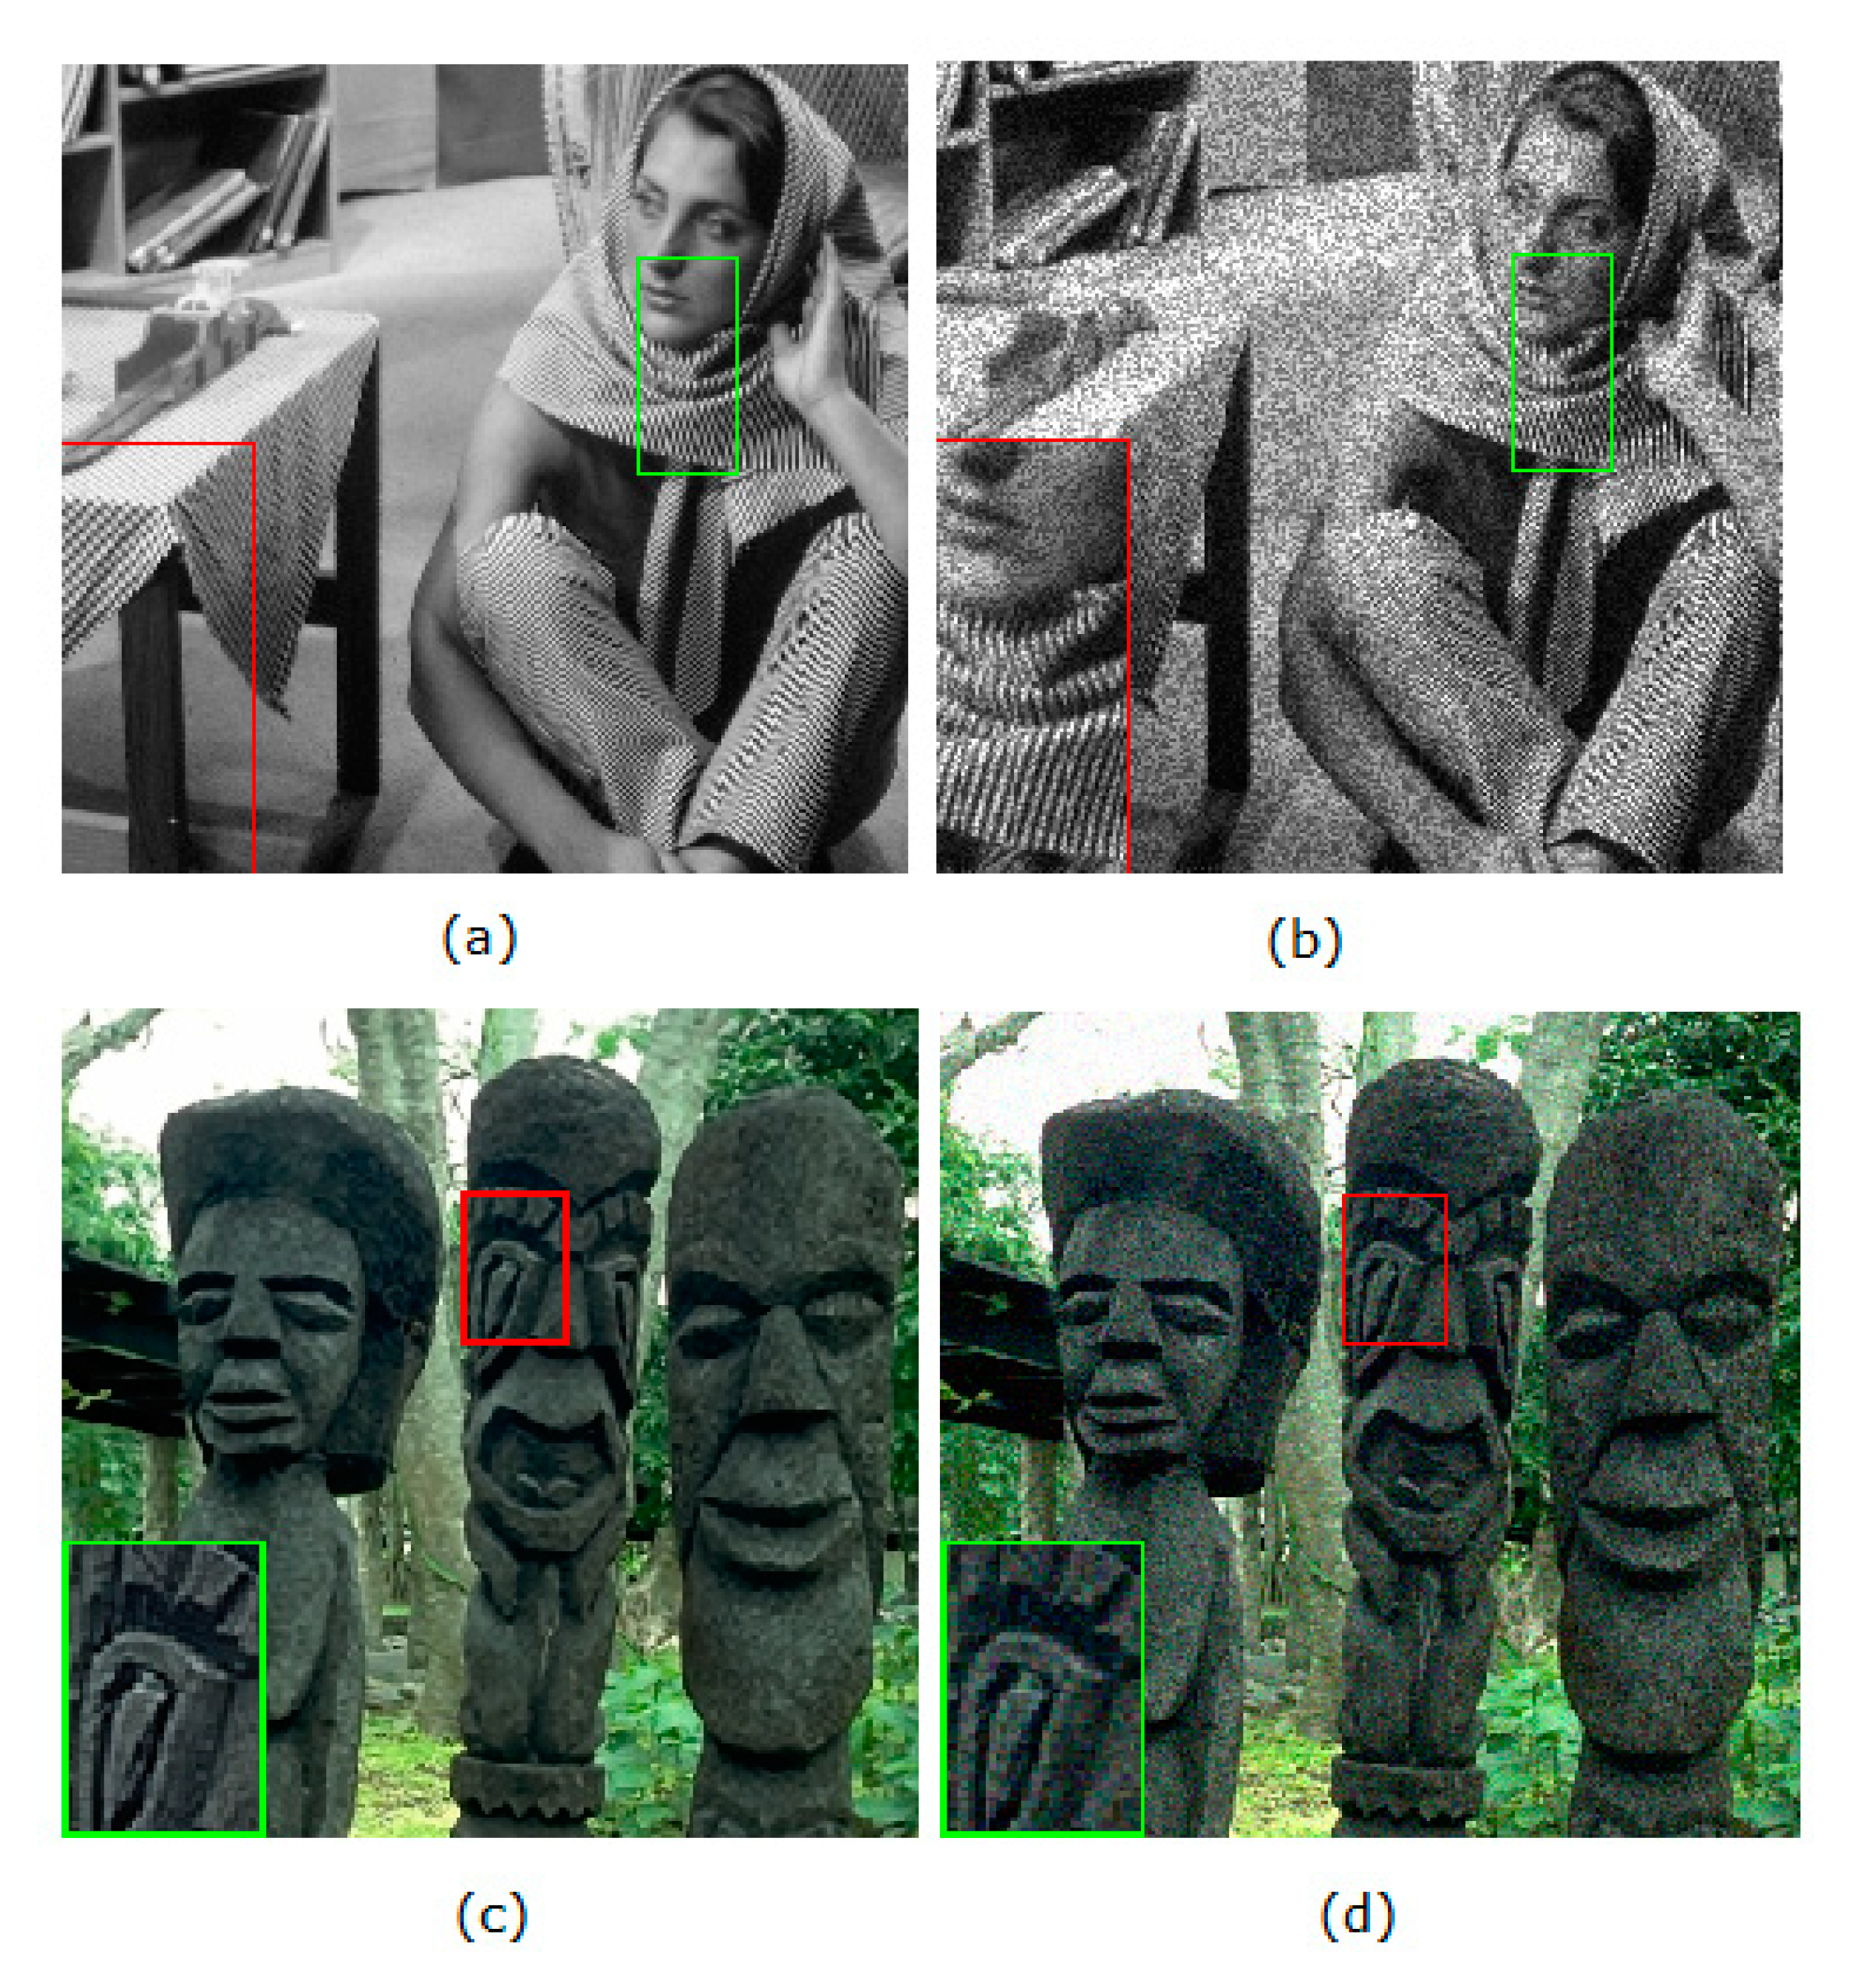
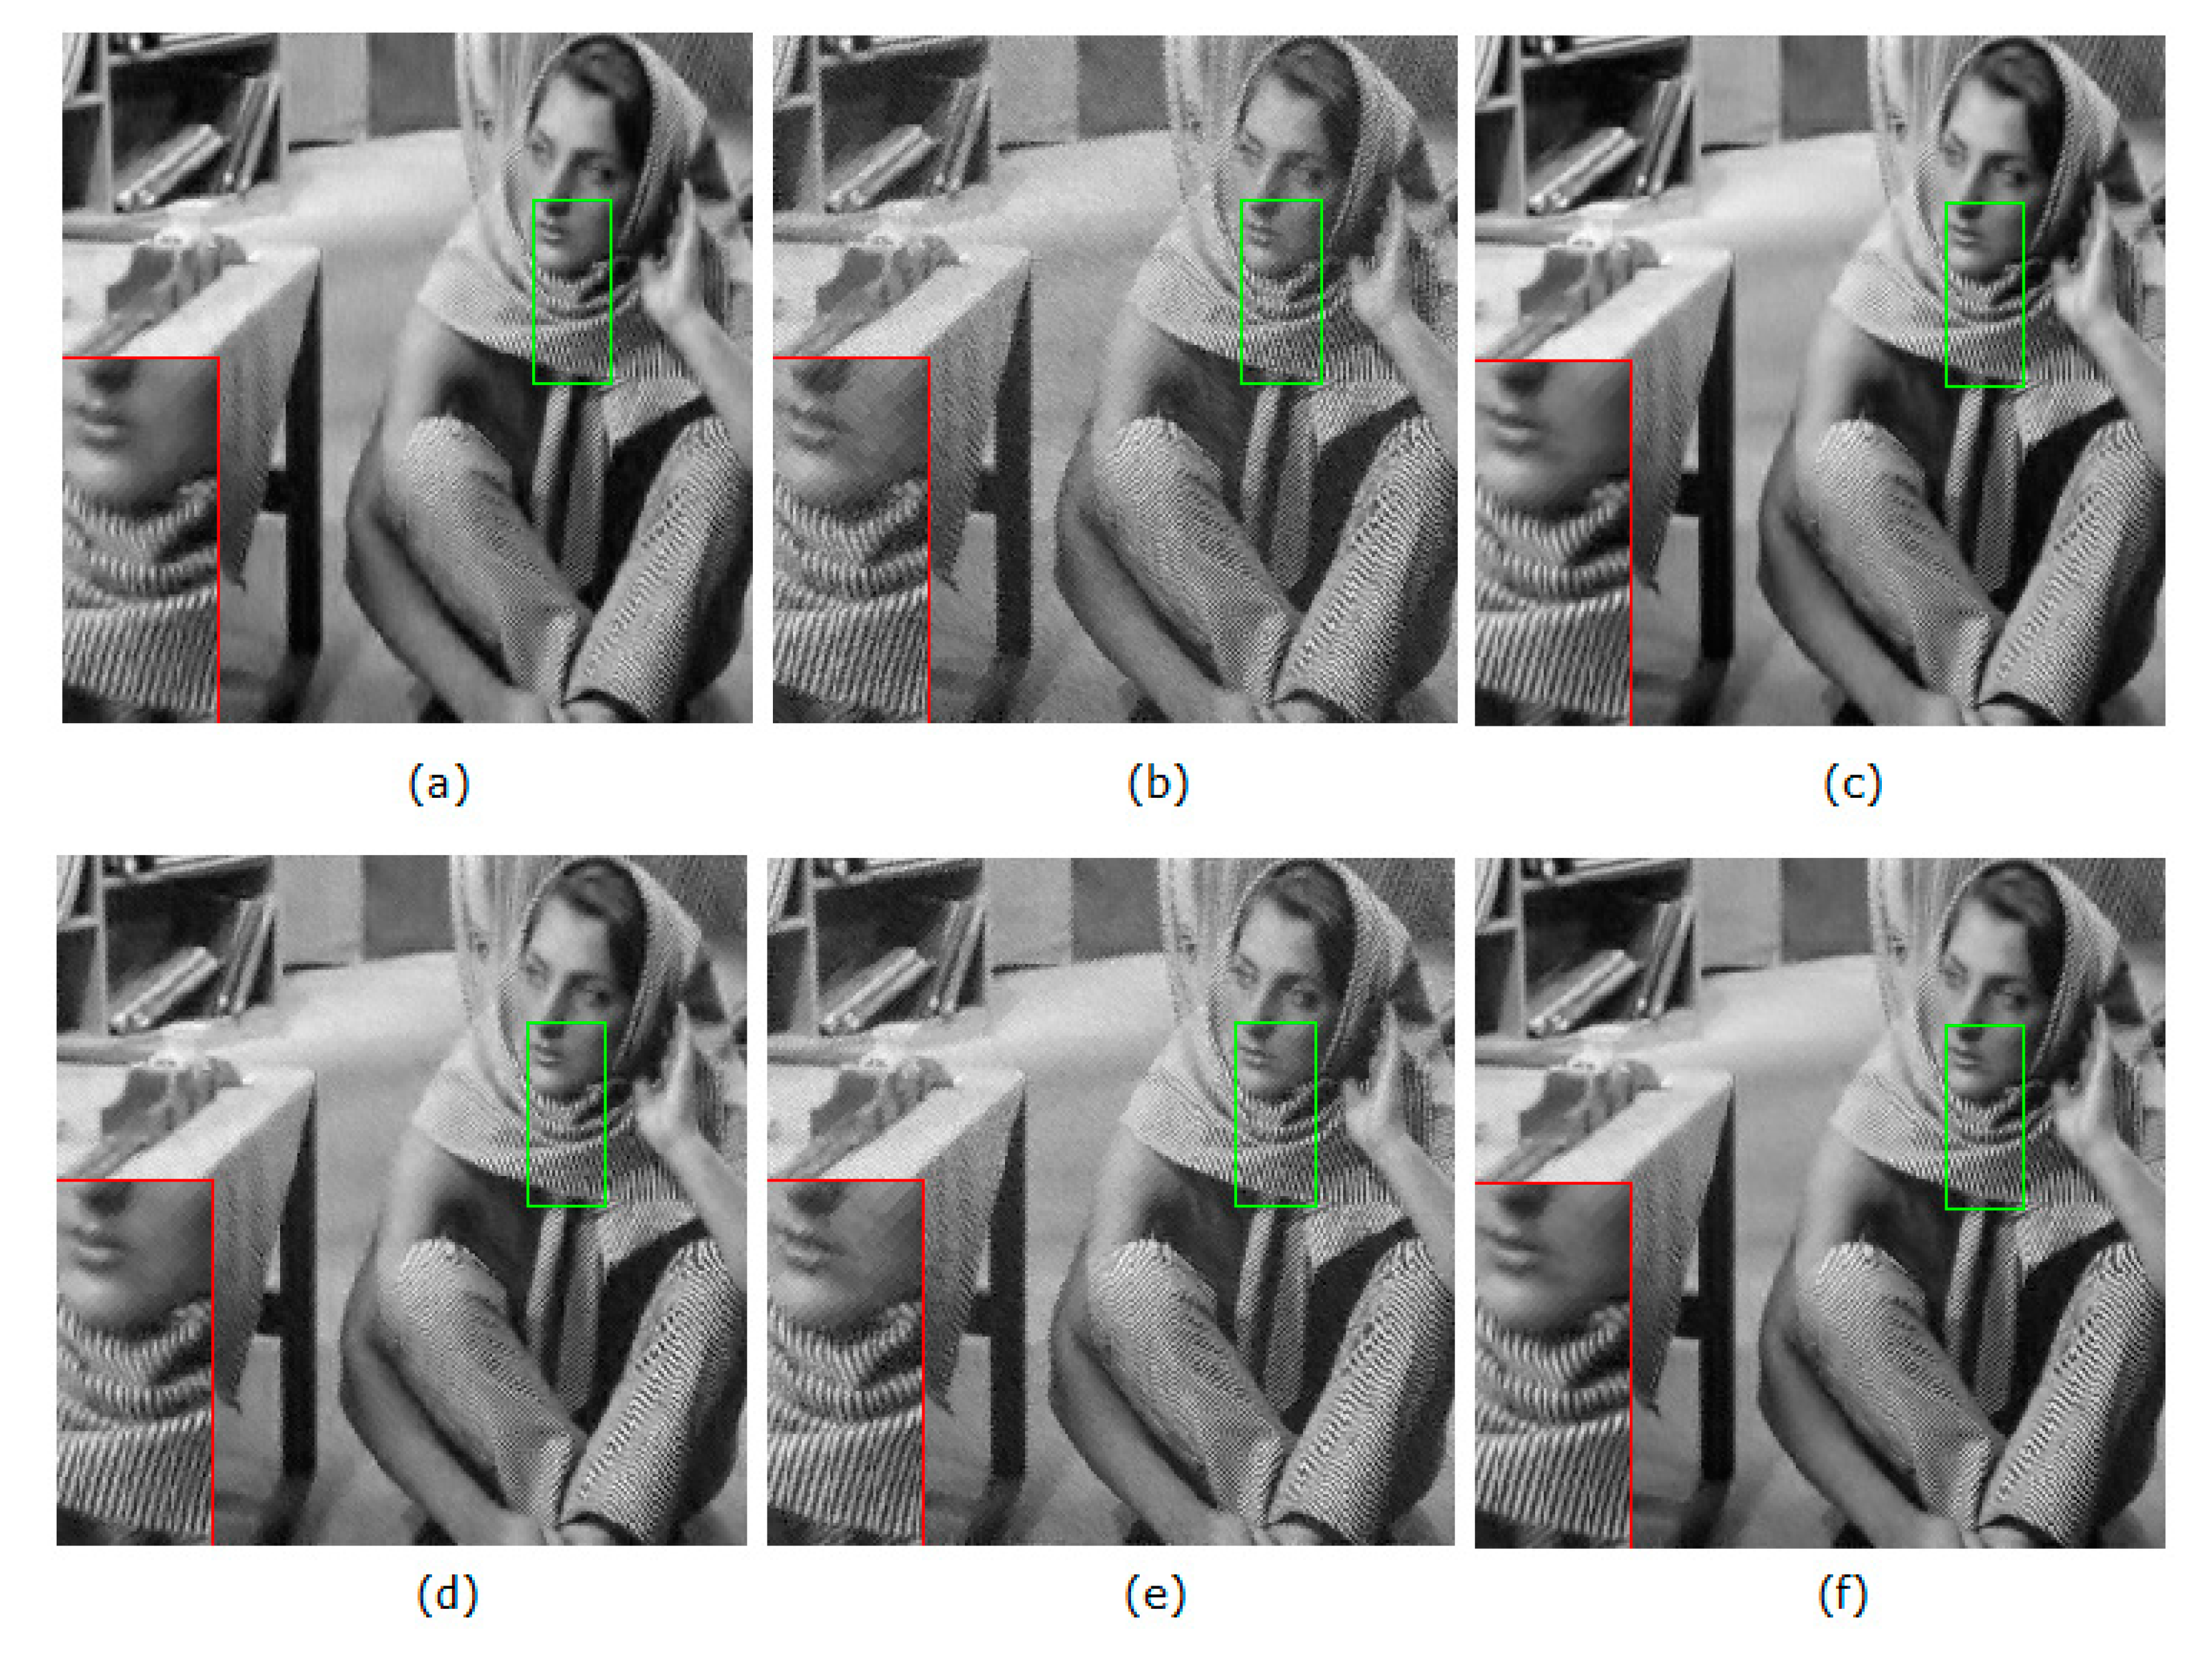
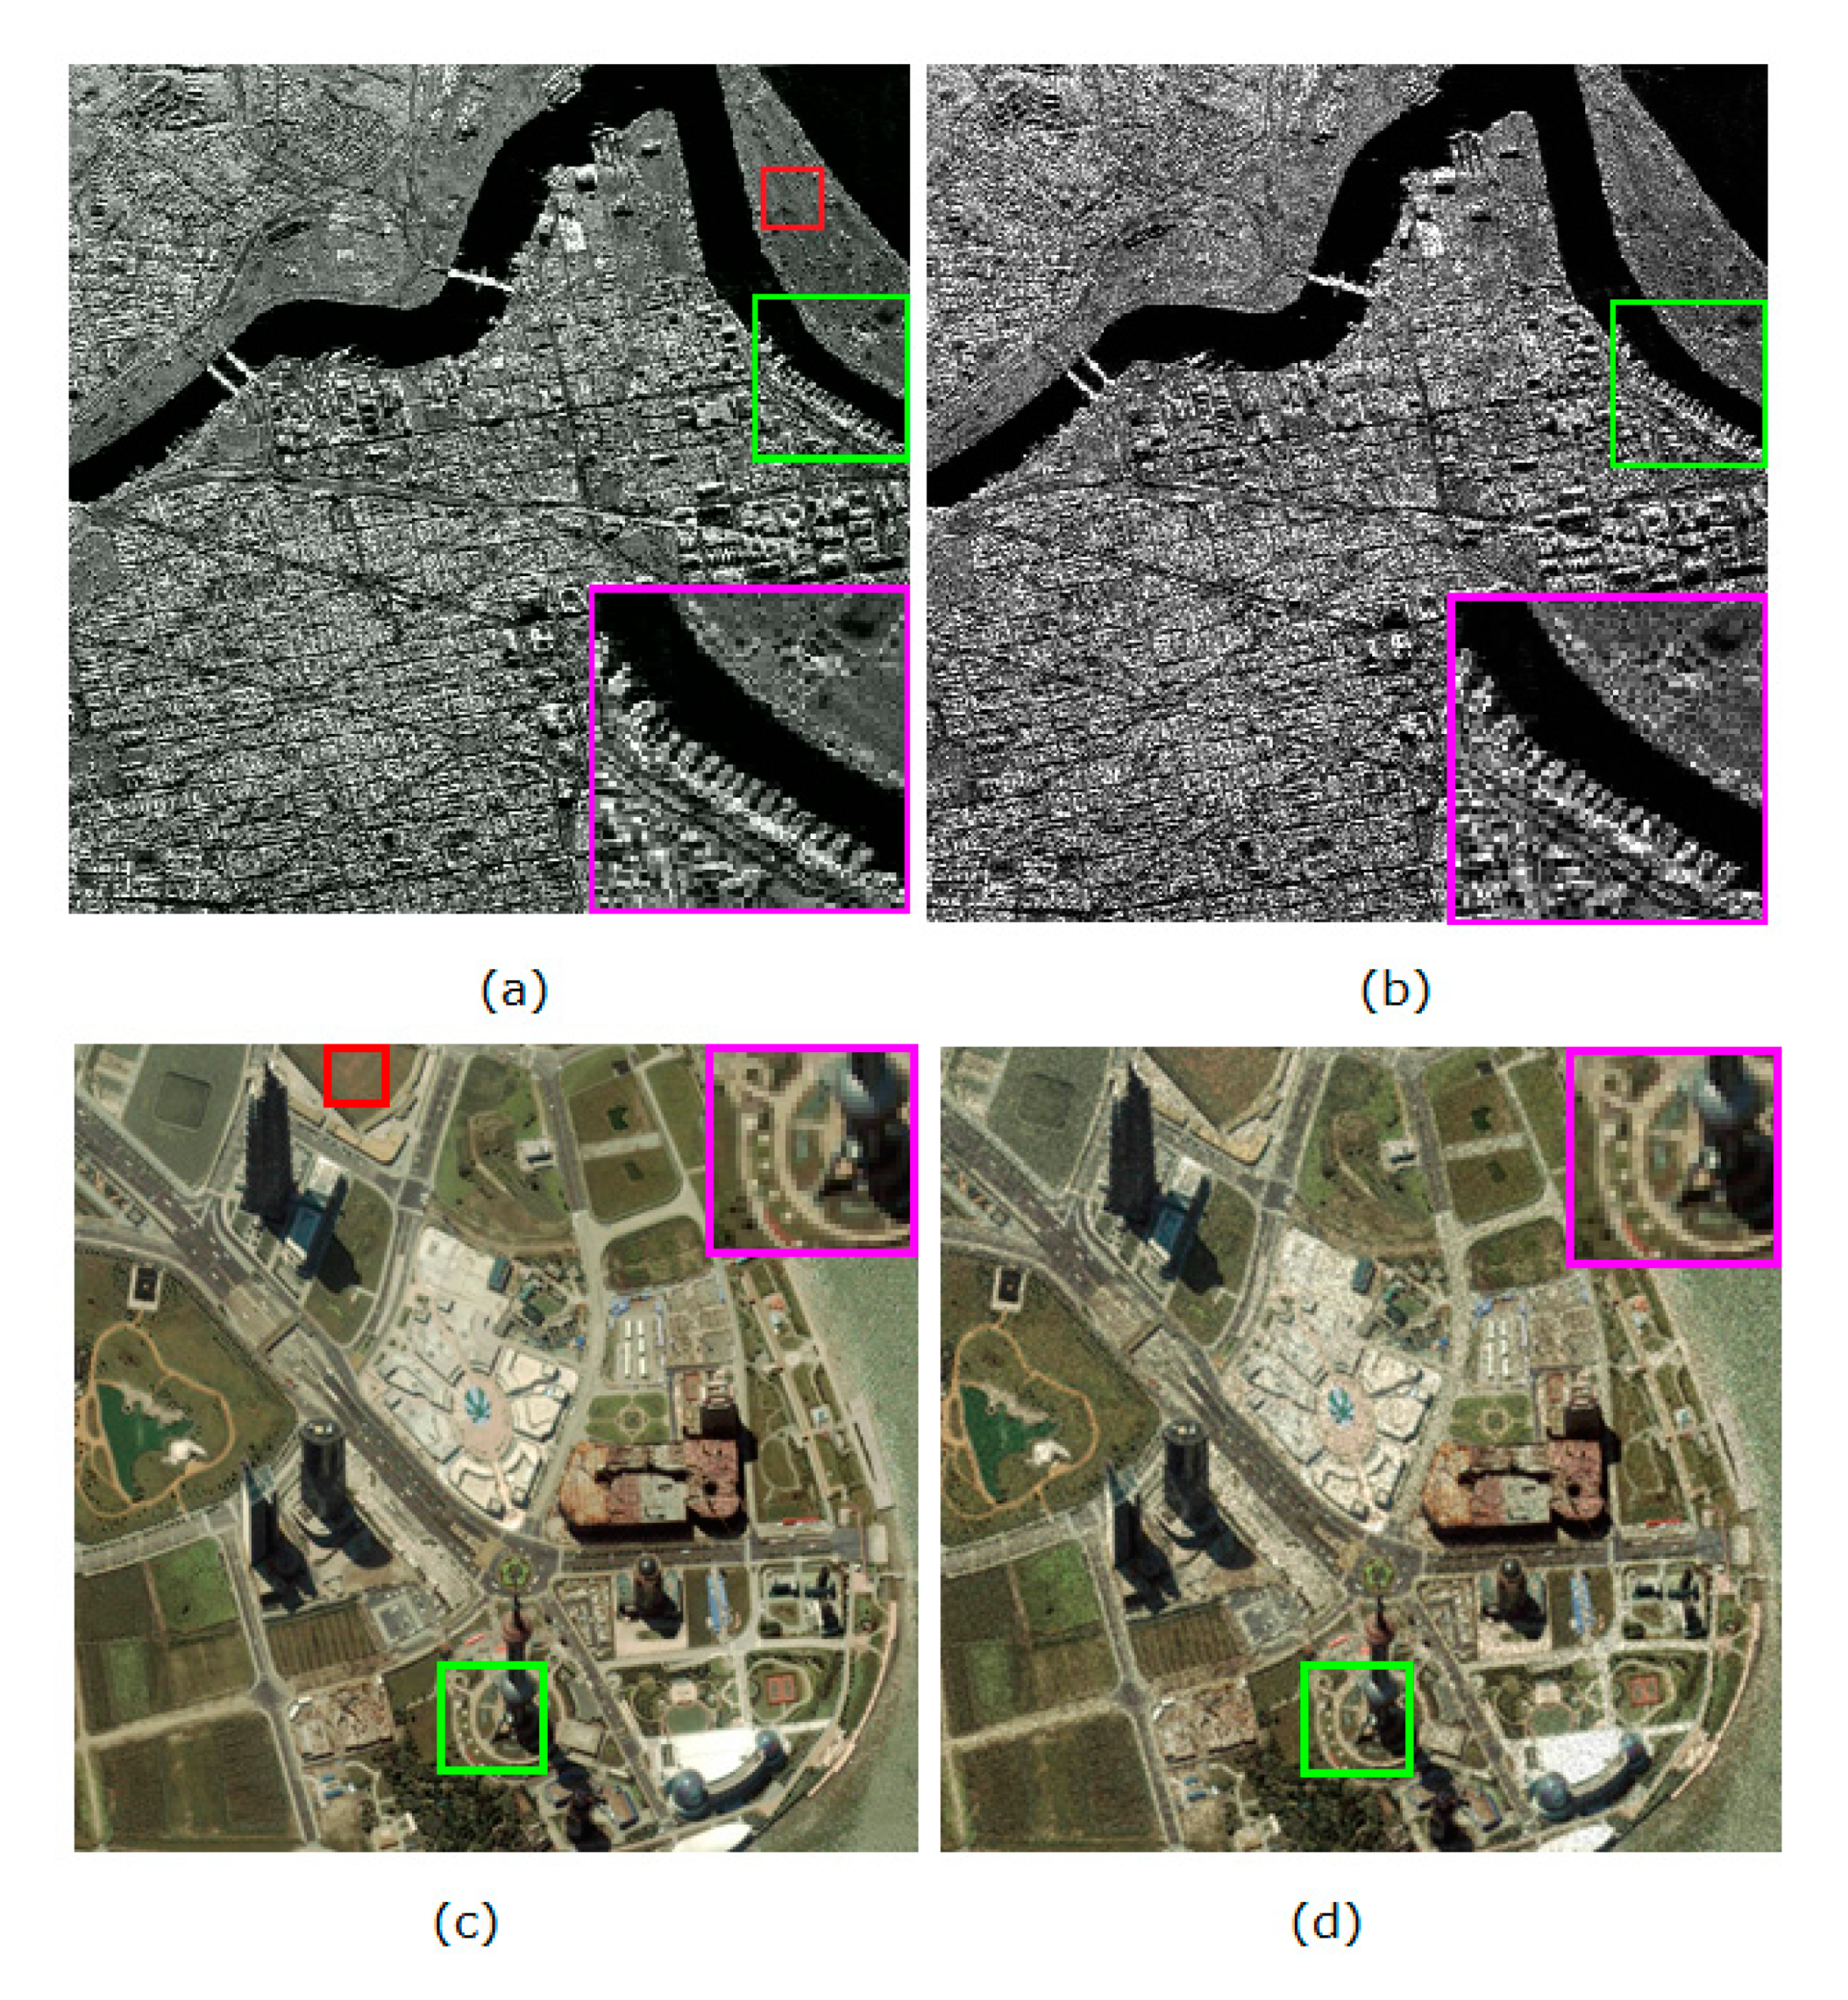
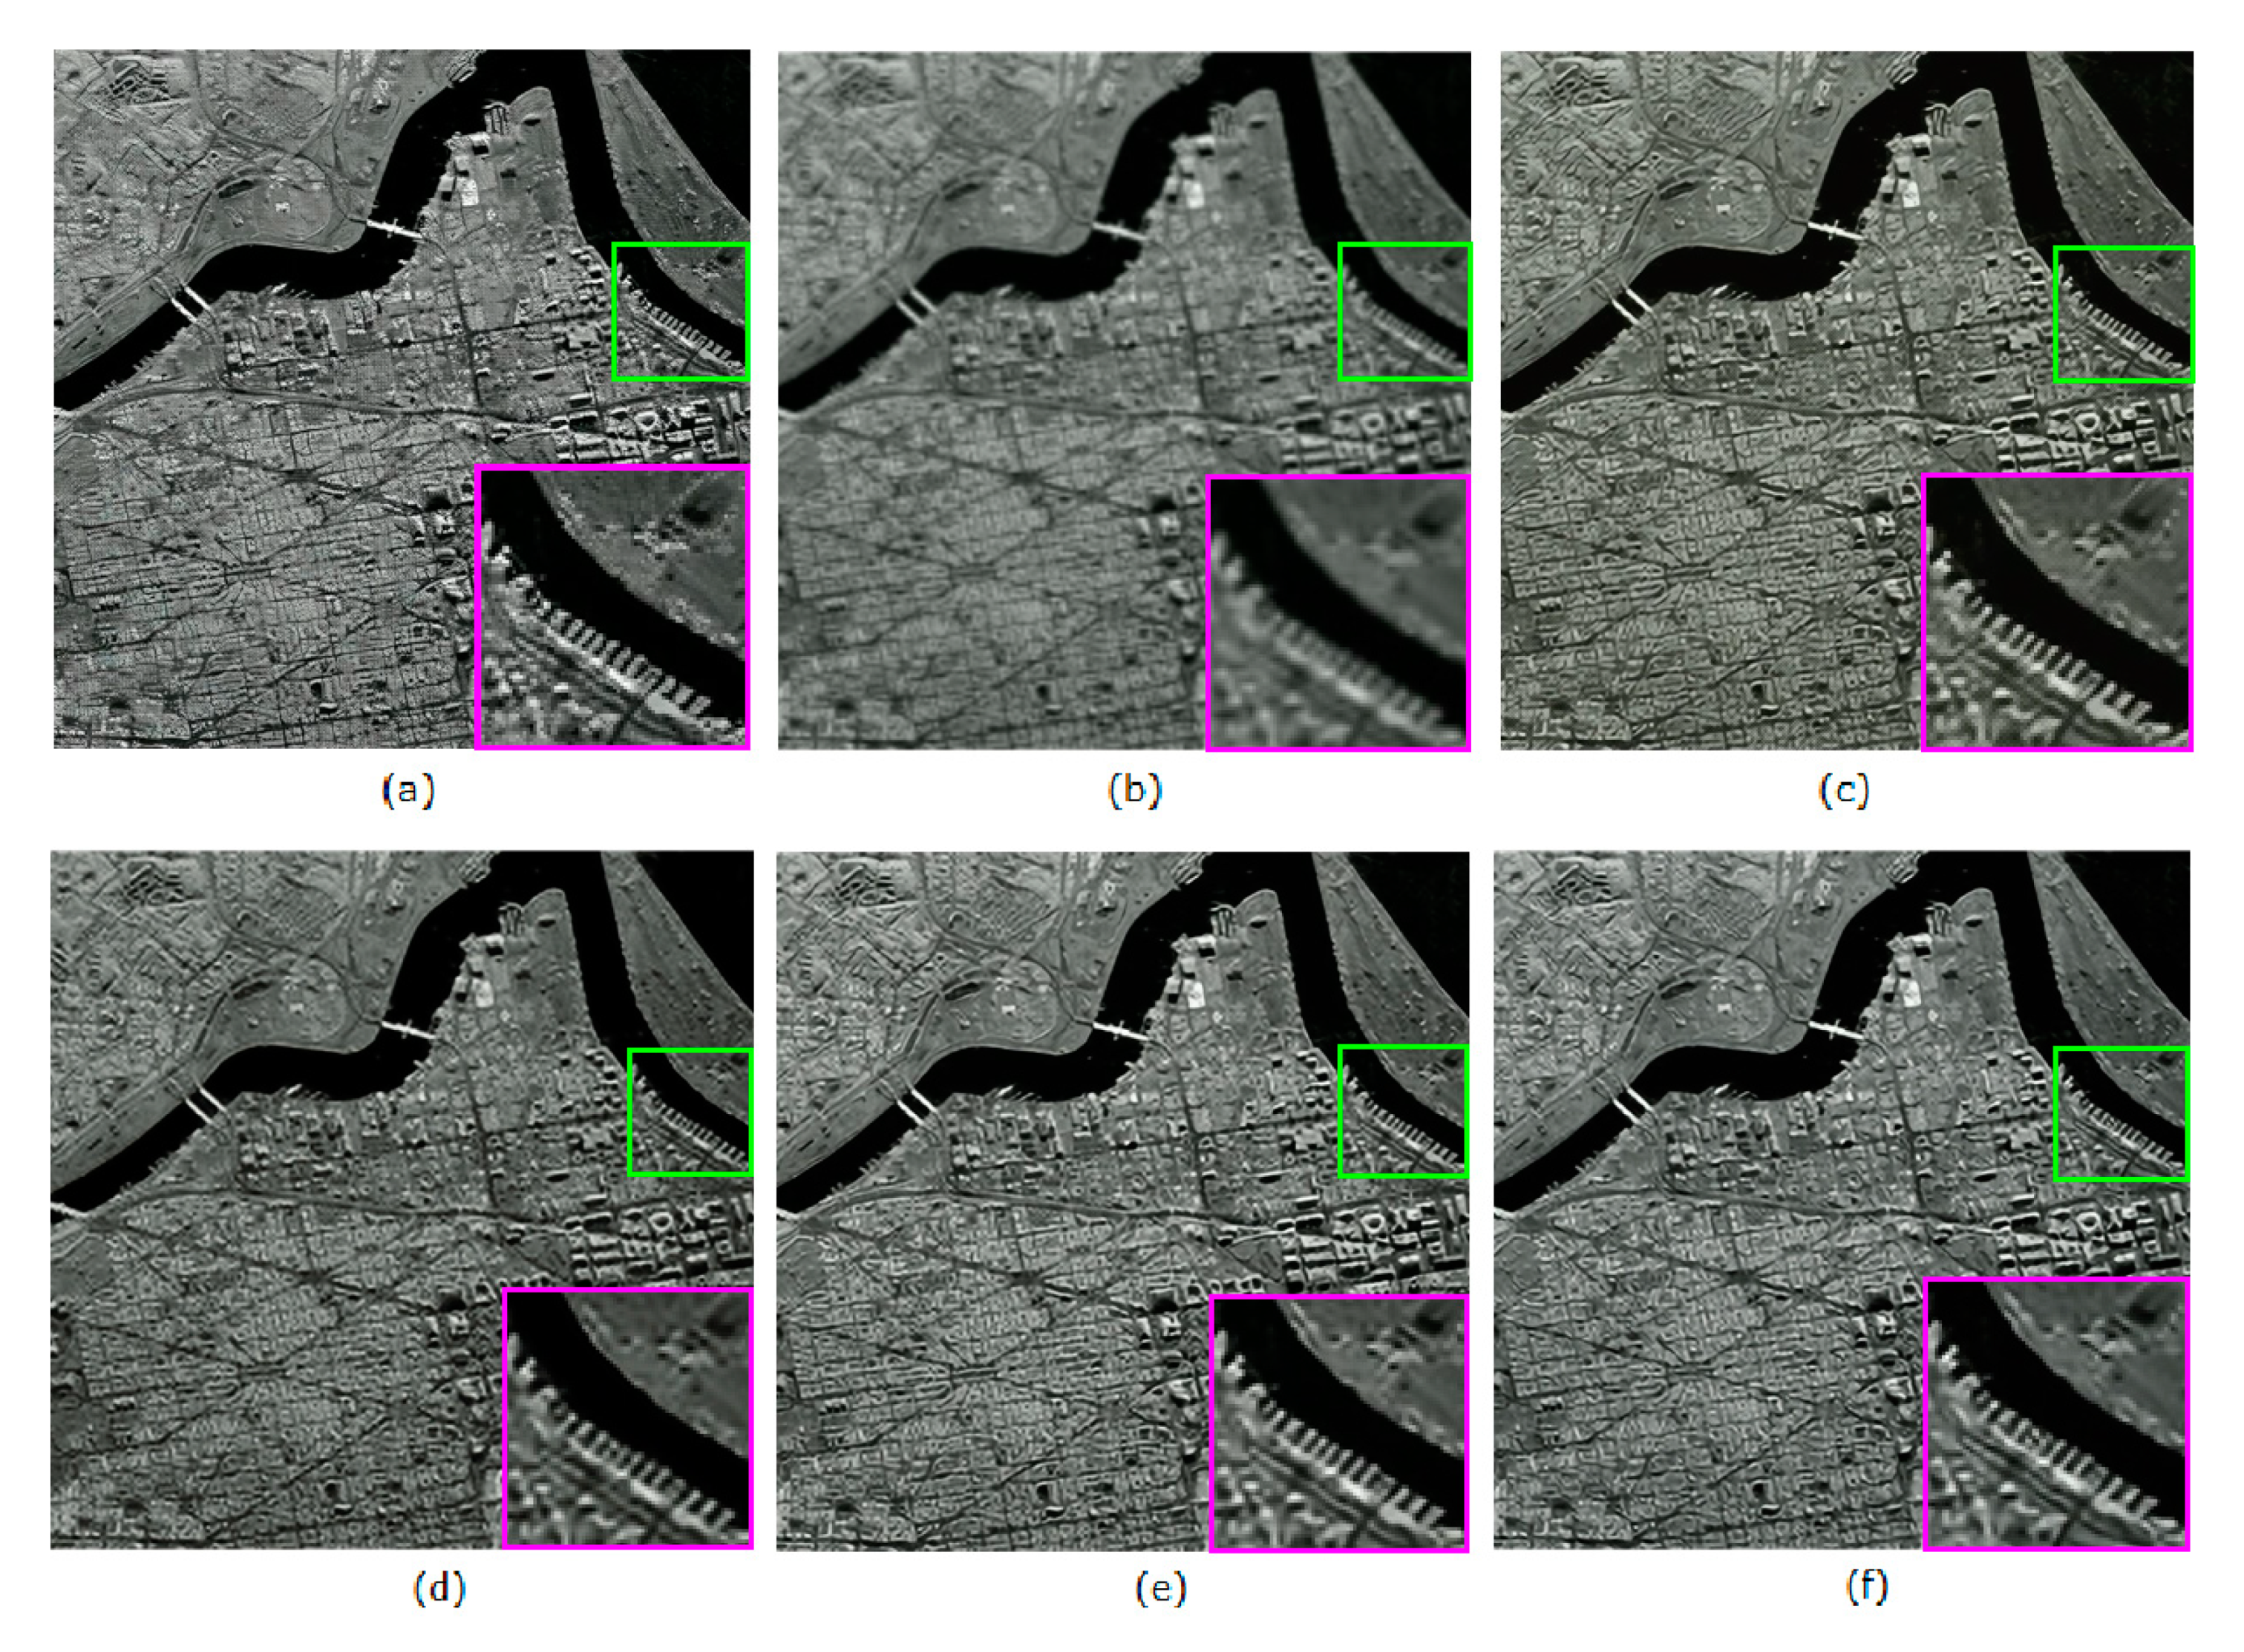
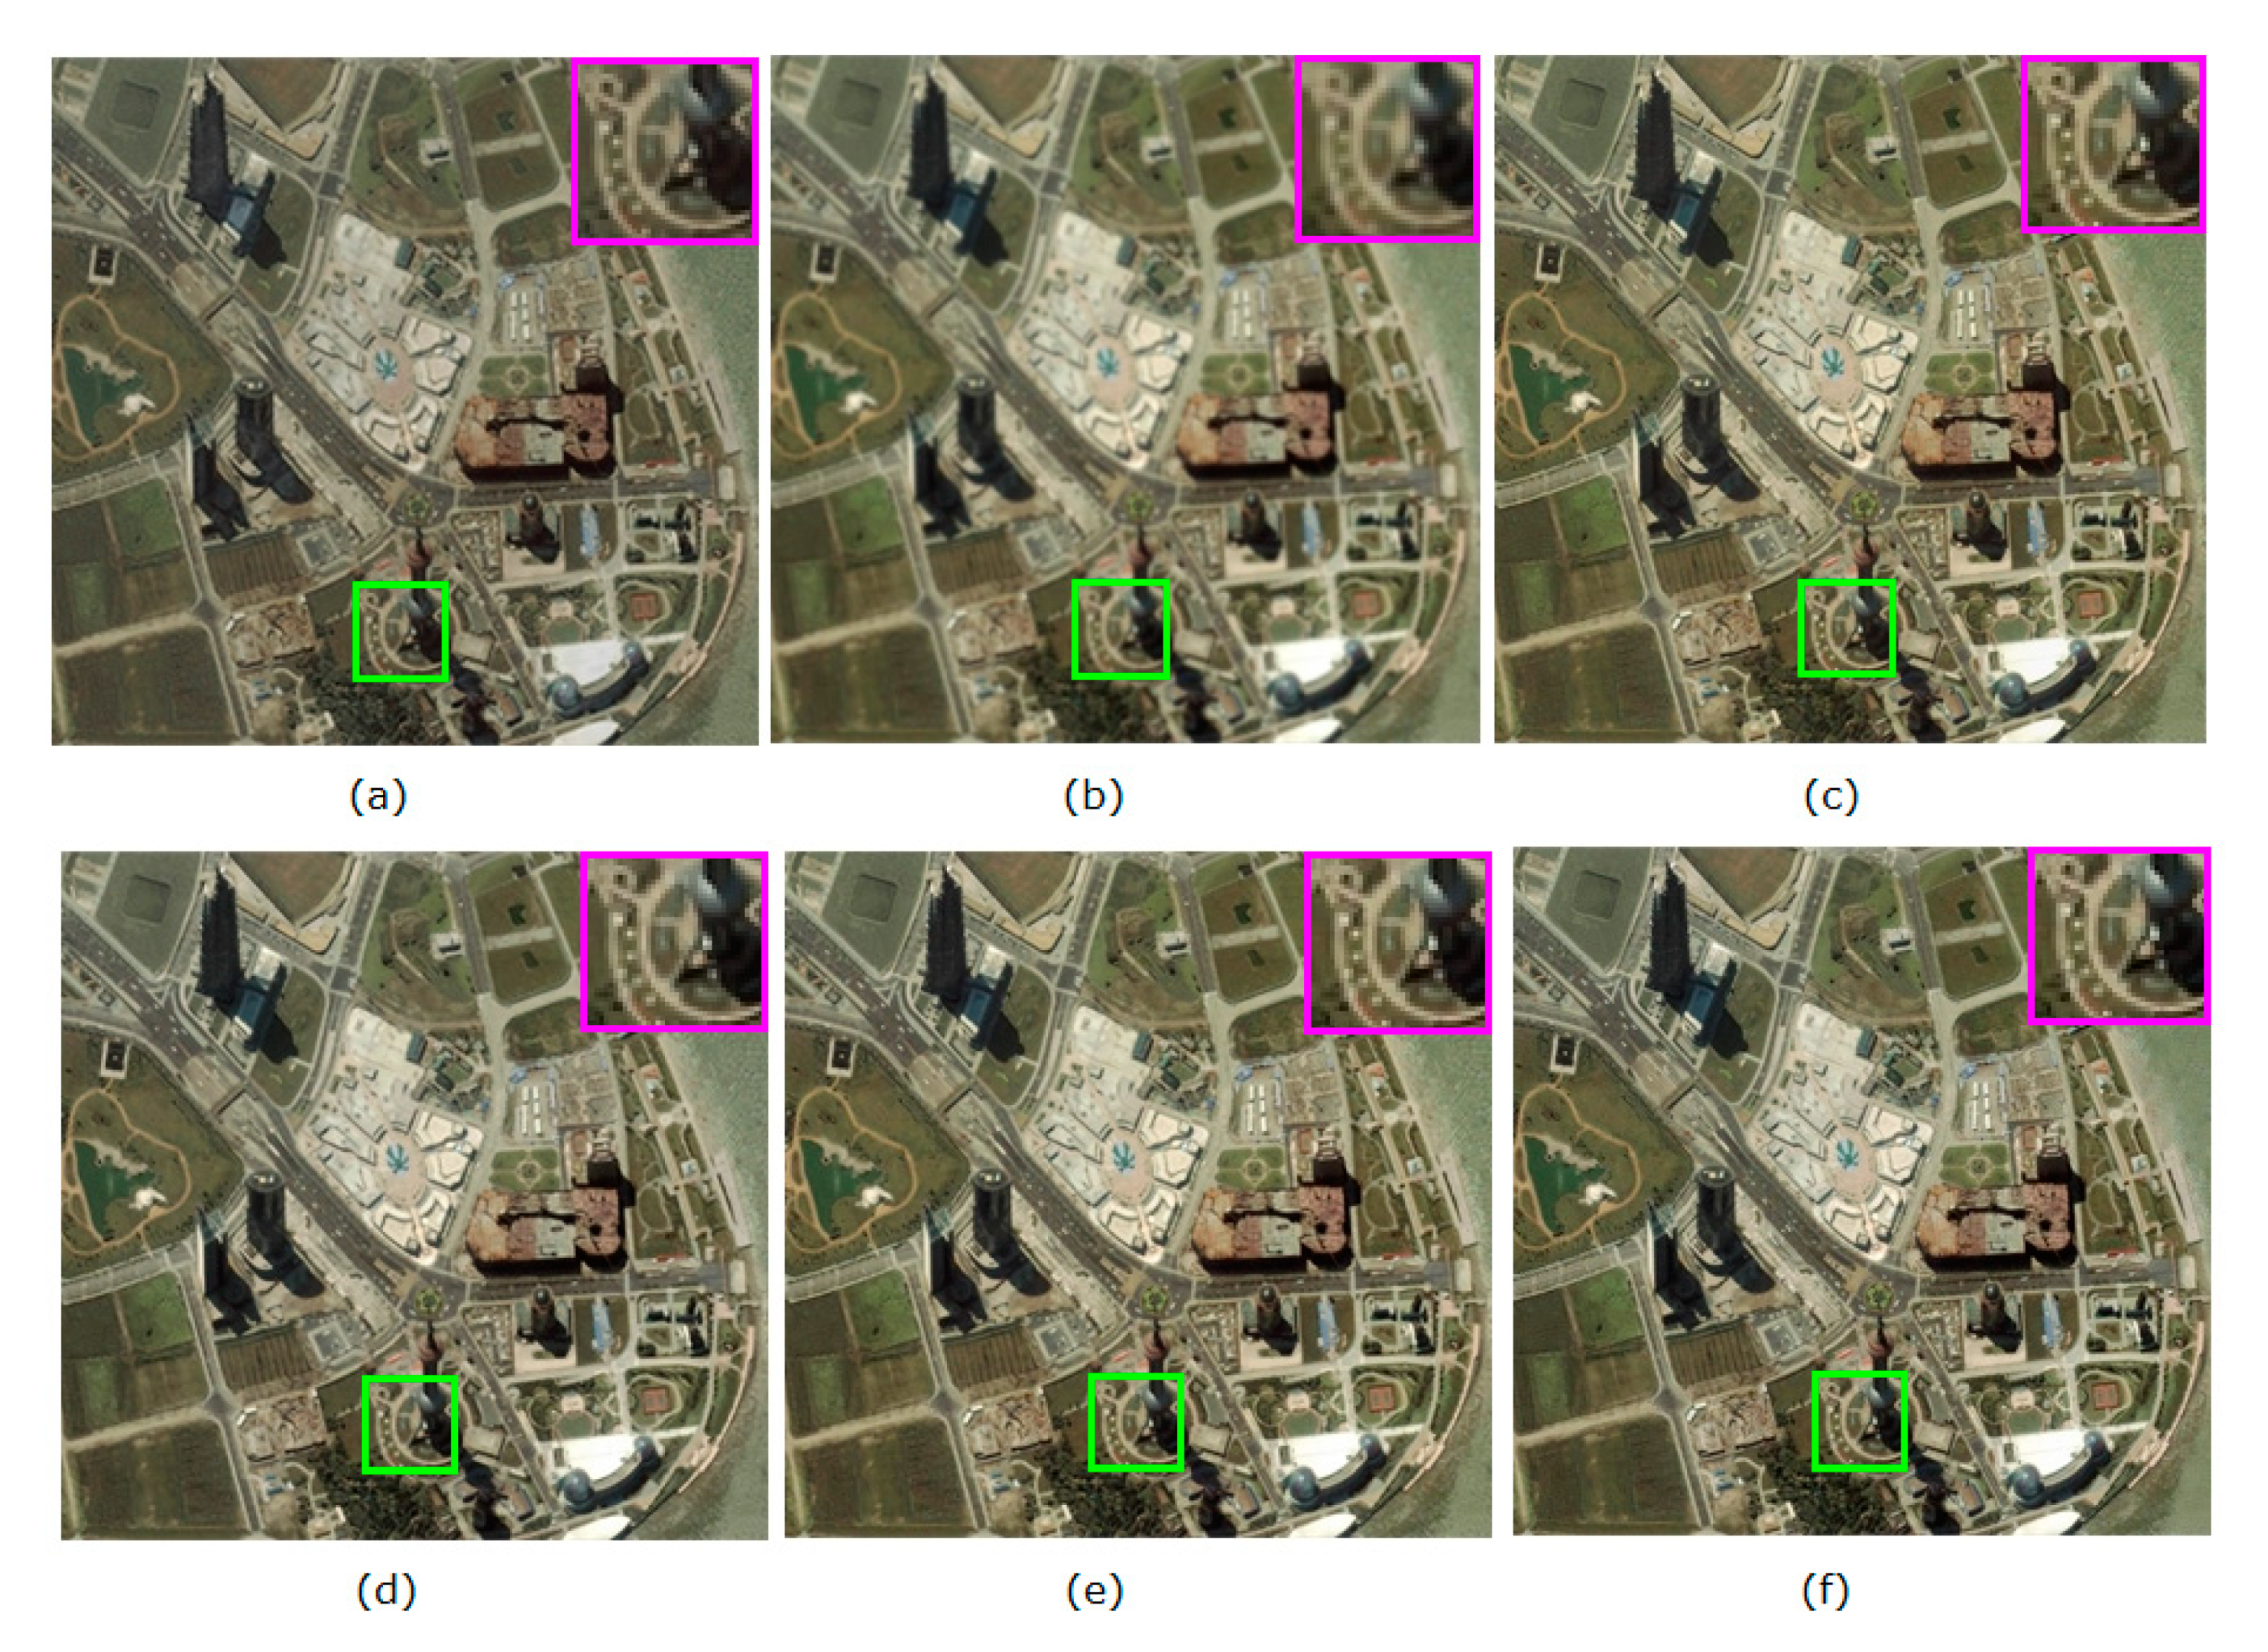
The 100 test images were randomly selected from the BSD500 and speckle noise was added with variance σ = 0.06, 0.08, …, and 0.2. Among them, the representatives of grayscale and color images and their corresponding single-look speckle synthetic images are shown in Figure 5. The two assessment values in terms of PSNR and SSIM (averaging values of 100 synthetic images obtained from these methods are presented in Table 2. The visual quality of the despeckled images is shown in Figure 6 and Figure 7.
The assessment values from the methods shown in Table 2 are high, illustrating that these methods all yield good speckle-suppressing results. High PSNR values indicate that the despeckled image is closest to the original clean image; high SSIM values demonstrate that the methods can retain the edge and texture details while suppressing speckle noise.
Overall, the assessment values obtained from the CNN-based methods (SAR-CNN,ID-CNN,SAR-UNet and CCNN) are superior to those of the traditional method (SAR-BM3D).This is because the traditional despeckling method distinguishes the image energy from the speckle noise based on image similarity and sparse representation, while the CNN-based methods can extract useful end-to-end data by integrating multiple convolutional layers and/or convolutional blocks, thus having a powerful learning capability and providing accurate predictive features for the estimated images. Figure 6 and Figure 7 indicate that the visual quality of images obtained from the traditional despeckling methods is indeed inferior to the image quality obtained from the CNN-based methods. There are significant block artifacts around the edges of images obtained from the SAR-BM3D method. With the help of residual learning, the SAR-CNN and the ID-CNN can retain the edge and texture details well while removing noise and they generate slight artifacts only at the sharp edges. In contrast, the visual results of the ID-CNN are surperior to those of the SAR-CNN, perhaps benefiting from the ID-CNN using the improved loss function. Due to introducing downscaling and upscaling convolutional layers, the numerical results of the despeckled images from SAR-UNet are relatively better; most of the details are preserved, although the details in the textural regions are lost. The CCNN learns the deep characteristics of the images in multiple scales and multiple directions by using the Contourlet transform to build a multiple-stream structure, thus estimating fully detailed image information. The obtained numerical results from the CCNN are desired and have not only the highest PSNR mean values, but also relatively high SSIMs. Additionally, the visual quality obtained from the CCNN is also outstanding, with few slight artifacts appearing only at some edges. Moreover, when the number of convolutional layers of the CCNN increases, namely, CCNN+, the obtained metrics are better in terms of the PSNRs/SSIMs. This indicates that there is still room for improvement in the structure and the performance of the CCNN.

4.2.2. Results on Real SAR Images

The experiments on the synthetic images cannot adequately validate the effectiveness of the proposed method since the synthetic images in the simulation experiments are not acquired in a real degradation way. Here, we repeat the experiments on real SAR images to illustrate the feasibility and robustness of the proposed CCNN in some real-world scenarios.
We selected eight SAR images that have multilooked images from the PatternNet dataset to test the CCNN. Two of these SAR images and their corresponding multilook references are shown in Figure 8. The red boxes on the multilooked images represent the regions used to compute the ENL. In this experiment, temporal multilooking was used as the reference image for training. This reference is quite different from the ideal “clean” image, which implies that the speckle noise cannot be completely suppressed. Therefore, we focus on the comparisons of the quantitative indicators NIQE and ENL.
The quantitative evaluation of the baseline methods and our CCNN are shown in Table 3. The metric NIQE can measure the quality of the despeckled images and is expressed as a simple distance between the despeckled images and the model that is constructed via statistical features collected from many real SAR images. The larger the metric NIQE is, the better the image detail preservation will be. The index ENL indicates the smooth degree of the despeckled image by calculating the mean and standard deviation of a homogeneous region. The larger the ENL is, the smoother the region will be and the better the speckle noise suppression.
In Table 3, the ENL of the SAR-CNN method is the lowest while the NIQE of the SAR-BM3D network is the lowest, which indicates that the former cannot effectively suppress speckle noise and the latter cannot preserve fine details in the textural region. Overall, the metrics obtained from the CCNN on the eight SAR images (#1, #2, …, #8) are the most satisfactory and have the highest ENL and NIQE, which indicates that the CCNN can effectively suppress speckle noise without significantly impairing the image resolution.
Figure 9 and Figure 10 show the visual qualities of the despeckled images obtained from the baseline methods and the proposed CCNN. In contrast, we observe that the SAR-BM3D, SAR-CNN, ID-CNN, and SAR-UNet lose details to some extent, blur some texture details and edges, or have a large level of residual speckle noise, while our proposed CCNN and the CCNN+ preserve most details well, even for thin lines and complex textures. Additionally, very few speckle noises are left and very few artifacts are introduced.

5. Discussion

In summary, the proposed CCNN provides very satisfying results considering despeckling performance and detail preservation. For real-world SAR images, we observe the same results with the synthetic SAR images as before, only less pronounced. This probably has to do with the imperfect reference images used for training the CCNN. In fact, a 25-look image (obtained by averaging a series of 25 SAR images) is not a true clean SAR image, but only an approximation of it, based on temporal multilooking. The regions characterized by a different average intensity from the rest of the image probably correspond to regions where the despeckled image approaches the reference image but not the original noisy image. Thus, the CCNN behaves as instructed to do based on bad examples. With this premise, the reference multilooking images can only provide bad results. If our conjecture is right, the CCNN performance will be further improved when better reference data are available.
The CCNN can be extended to higher level of Contourlet decomposition. Nevertheless, higher level inevitably results in deeper network and heavier computational burden. Thus, a suitable level is required to balance efficiency and performance. We examined the PSNR and runtime results of CCNNs with the levels of 1 to 3. We observed that CCNN with 2-level architecture performs much better than CCNN with 1-level, while CCNN with 3-level architecture only performs negligibly better than CCNN with 2-level in terms of the PSNR metric. Moreover, the speed of CCNN with 2-level is also moderate compared with many more decomposition levels. Taking both efficiency and performance gain into account, we choose CCNN with 2-level as the default setting.
6. Conclusions

In this paper, we proposed a convolutional neural network for suppressing speckle noise (CCNN) that captures feature details and suppresses speckle noise from multiple scales and multiple directions. The CCNN uses the Contourlet transform to decompose SAR image despeckling into multiple subproblems and then suppress speckle noise using multiple multidirectional and multiscale subnetworks. Each subnetwork is in charge of learning the feature mapping and suppressing the speckle noise coefficients of each Contourlet subband under the supervision of its loss function. Considering the attribute of each subband, we design a different structure and a different loss function for each subnetwork. The subnetworks do not require too many convolutional layers and a complex network structure to capture the features or speckle noise in a specific scale and specific direction of an image, which means that our proposed CCNN not only provides sufficient convolutional layers to capture the image features but also avoids the problem of vanishing/exploding gradients. The ability to preserve feature details of the CCNN can be significantly improved by capturing the detailed texture and clear structure at multiple scales and in multiple directions. In addition, these subnetworks can be executed in parallel on different computers, resulting in shortening the training time of the network. In addition, these subnetworks can be executed in parallel on different computers, resulting in shortening the training time of the network. The results for the synthetic and real SAR images show that the CCNN achieves the best performance with the lowest runtime when compared with the state-of-the-art methods for suppressing speckle, resulting in a good tradeoff between efficiency and performance.
In the future, we will explore a suitable generative model by exploiting the techniques [42,43] to generate training samples more similar to the data distribution of real SAR images.

Author Contributions

Conceptualization, G.L. and H.K.; methodology, Q.W.; software, H.K.; validation, Y.T., B.W. and H.K.; formal analysis, G.L.; resources, Q.W.; writing—original draft preparation, G.L.; writing—review and editing, G.L.; project administration, Q.W.; funding acquisition, Y.T. All authors have read and agreed to the published version of the manuscript.

Funding

This work was supported in part by the Shaanxi Key R&D Program (Grant No. 2019ZDLGY13-01) and the Science and Technology Projects of Xi’an, China (Grant number: 201809170CX11JC12).

Institutional Review Board Statement

Not applicable.

Informed Consent Statement

Not applicable.

Data Availability Statement

Not applicable

Conflicts of Interest

The authors declare no conflict of interest. The funders had no role in the design of the study; in the collection, analyses, or interpretation of data; in the writing of the manuscript, or in the decision to publish the results.

References

  1. Vitale, S.; Cozzolino, D.; Scarpa, G.; Verdoliva, L.; Poggi, G. Guided Patchwise Nonlocal SAR Despeckling. IEEE Trans. Geosci. Remote Sens. 2019, 57, 6484–6498. [Google Scholar] [CrossRef] [Green Version]
  2. Lee, J. Digital Image Enhancement and Noise Filtering by Use of Local Statistics. IEEE Trans. Pattern Anal. Mach. Intell. 1980, 2, 165–168. [Google Scholar] [CrossRef] [Green Version]
  3. Kuan, D.T.; Sawchuk, A.A.; Strand, T.C.; Chavel, P. Adaptive Noise Smoothing Filter for Images with Signal-Dependent Noise. IEEE Trans. Pattern Anal. Mach. Intell. 1985, 7, 165–177. [Google Scholar] [CrossRef]
  4. Frost, V.S.; Stiles, J.A.; Shanmugan, K.S.; Holtzman, J.C. A Model for Radar Images and Its Application to Adaptive Digital Filtering of Multiplicative Noise. IEEE Trans. Pattern Anal. Mach. Intell. 1982, 4, 157–166. [Google Scholar] [CrossRef]
  5. Solbo, S.; Eltoft, T. Homomorphic wavelet-based statistical despeckling of SAR images. IEEE Trans. Geosci. Remote Sens. 2004, 42, 711–721. [Google Scholar] [CrossRef]
  6. Yang, G.; Lu, Z.Z.; Yang, J.J.; Wang, Y.H. An Adaptive Contourlet HMM-PCNN Model of Sparse representation for Image Denoising. IEEE Access 2019, 7, 88243–88253. [Google Scholar] [CrossRef]
  7. Kiani, M.; Ghofrani, S. Two New Methods Based on Contourlet Transform for Despeckling Synthetic Aperture Radar Images. J. Appl. Remote Sens. 2014, 8, 083604. [Google Scholar] [CrossRef]
  8. Espinoza Molina, D.; Gleich, D.; Datcu, M. Evaluation of Bayesian Despeckling and Texture Extraction Methods Based on Gauss–Markov and Auto-Binomial Gibbs Random Fields: Application to Terra SAR-X Data. IEEE Trans. Geosci. Remote Sens. 2012, 50, 2001–2025. [Google Scholar] [CrossRef]
  9. Gu, F.; Zhang, H.; Wang, C. A Two-Component Deep Learning Network for SAR Image Denoising. IEEE Access. 2020, 8, 17792–17803. [Google Scholar] [CrossRef]
  10. Deledalle, C.A.; Denis, L.; Tupin, F. Iterative Weighted Maximum Likelihood Denoising With Probabilistic Patch-based Weights. IEEE Trans. Image Process. 2009, 18, 2661–2672. [Google Scholar] [CrossRef] [PubMed] [Green Version]
  11. Xin, S.; Deledalle, C.A.; Tupin, F.; Hong, S. Two-step Multitemporal Nonlocal Means for Synthetic Aperture Radar Images. IEEE Trans. Geosci. Remote Sens. 2014, 52, 6181–6196. [Google Scholar] [CrossRef]
  12. Deledalle, C.A.; Denis, L.; Tupin, F.; Reigber, A.; Jager, M. NL-SAR: A unified Nonlocal Framework for Resolution-Preserving(pol) (in) SAR Denoising. IEEE Trans. Geosci. Remote Sens. 2015, 53, 2021–2038. [Google Scholar] [CrossRef] [Green Version]
  13. Parrilli, S.; Poderico, M.; Angelino, C.V.; Verdoliva, L. A Nonlocal SAR Image Denoising Algorithm Based on LLMMSE Wavelet Shrinkage. IEEE Trans. Geosci. Remote Sens. 2012, 50, 606–616. [Google Scholar] [CrossRef]
  14. Chierchia, G.; Cozzolino, D.; Poggi, G.; Verdoliva, L. SAR Image Despeckling through Convolutional Neural Networks. arXiv 2017, arXiv:1704.00275. [Google Scholar]
  15. Wang, P.; Zhang, H.; Patel, V. SAR Image Despeckling Using a Convolutional Neural Network. IEEE Signal Process Lett. 2017, 24, 1763–1767. [Google Scholar] [CrossRef] [Green Version]
  16. Zhang, Q.; Yuan, Q.; Li, J.; Yang, Z.; Ma, X. Learning a Dilated Residual Network for SAR Image Despeckling. Remote Sens. 2018, 10, 196. [Google Scholar] [CrossRef] [Green Version]
  17. Yue, D.X.; Xu, F.; Jin, Y.Q. Sar Despeckling Neural Network with Logarithmic Convolutional Product model. Int. J. Remote Sens. 2018, 39, 7483–7505. [Google Scholar] [CrossRef]
  18. Lattari, F.; Leon, B.G.; Asaro, F. Deep Learning for SAR Image Despeckling. J. Remote Sens. 2019, 11, 1532. [Google Scholar] [CrossRef] [Green Version]
  19. Cozzolino, D.; Verdoliva, L.; Scarpa, G.; Poggi, G. Nonlocal CNN SAR Image Despeckling. Remote Sens. 2020, 12, 1006. [Google Scholar] [CrossRef] [Green Version]
  20. Krizhevsky, A.; Sutskever, I.; Hinton, G. ImageNet Classification with Deep Convolutional Neural Networks. Adv. Neural Inf. Process. Syst. 2012, 25, 1097–1105. [Google Scholar] [CrossRef]
  21. He, K.; Zhang, X.; Ren, S.; Sun, J. Deep Residual Learning for Image Recognition. In Proceedings of the IEEE Conference on Computer Vision and Pattern Recognition (CVPR), Las Vegas, NV, USA, 27–30 June 2016; pp. 770–778. [Google Scholar]
  22. Ronneberger, O.; Fischer, P.; Brox, T. U-net: Convolutional Networks for Biomedical Image Segmentation. In Proceedings of the International Conference on Medical Image Computing and Computer-assisted Intervention (MICCAI), Munich, Germany, 5–9 October 2015. [Google Scholar]
  23. Huang, G.; Liu, Z.; Weinberger, K.; Maaten, L. Densely Connected Convolutional Networks. In Proceedings of the 2017 IEEE Conference on Computer Vision and Pattern Recognition (CVPR), Honolulu, HI, USA, 21–26 July 2017; pp. 2261–2269. [Google Scholar] [CrossRef] [Green Version]
  24. Liu, J.; Liu, R.; Wang, Y. Image Denoising Searching Similar Blocks along Edge Directions. Signal Process-Image 2017, 57, 33–45. [Google Scholar] [CrossRef]
  25. Li, L.L.; Ma, L.Y.; Jiao, L.C.; Liu, F.; Sun, Q.G.; Zhao, J. Complex Contourlet-CNN for Polarimetric SAR Image Classification. Pattern Recognit. 2020, 100, 107110. [Google Scholar] [CrossRef]
  26. Dong, C.; Loy, C.C.; He, K.; Tang, X. Learning a Deep Convolutional Network for Image Super-resolution. Eur. Conf. Comput. Vision 2014, 8692, 184–199. [Google Scholar] [CrossRef]
  27. Long, J.; Shelhamer, E.; Darrell, T. Fully Convolutional Networks for Semantic Segmentation. In Proceedings of the IEEE Conference on Computer Vision and Pattern Recognition (CVPR), Boston, MA, USA, 7–12 June 2015; pp. 3431–3440. [Google Scholar]
  28. Gatys, L.A.; Ecker, A.S.; Bethge, M. Image Style Transfer Using Convolutional Neural Networks. In Proceedings of the IEEE Conference on Computer Vision and Pattern Recognition (CVPR), Las Vegas, NV, USA, 27–30 June 2016; pp. 2414–2423. [Google Scholar]
  29. Johnson, J.; Alahi, A.; FeiFei, L. Perceptual Losses for Real-time Style Transfer and Super-resolution. In Proceedings of the European Conference on Computer Vision (ECCV), Amsterdam, The Netherlands, 8–16 October 2016. [Google Scholar]
  30. Deng, J.; Dong, W.; Socher, R.; LiJia, L.; FeiFei, L. Imagenet: A Large-scale Hierarchical Image Database. In Proceedings of the IEEE Conference on Computer Vision and Pattern Recognition (CVPR), Miami, FL, USA, 20–25 June 2009. [Google Scholar]
  31. Ma, K.; Duanmu, Z.; Wu, Q. Waterloo Exploration Database: New Challenges for Image Quality Assessment Models. IEEE Trans. Image Process. 2017, 26, 1004–1016. [Google Scholar] [CrossRef]
  32. Yang, Y.; Newsam, S. Bag-of Visual-words and Spatial Extensions for Land-use Classification. In Proceedings of the 18th SIGSPATIAL International Conference on Advances in Geographic Information Systems, San Jos, CA, USA, 2–5 November 2010; pp. 270–279. [Google Scholar]
  33. Schaefer, G.; Stich, M. UCID—An Uncompressed Colour Image Database. Storage Retr. Methods Appl. Multimed. 2004, 5307, 472–480. [Google Scholar]
  34. Isola, P.; Zhu, J.Y.; Zhou, T.; Efros, A.A. Image-to-image Translation with Conditional Adversarial Networks. arXiv 2016, arXiv:1611.07004. [Google Scholar]
  35. Zhou, W.; Newsam, S.D.; Li, C.; Shao, Z. PatternNet: A Benchmark Dataset for Performance Evaluation of Remote Sensing Image Retrieval. arXiv 2017, arXiv:1706.03424. [Google Scholar] [CrossRef] [Green Version]
  36. Kingma, D.; Adam, J.B. A Method for Stochastic Optimization. In Proceedings of the 3rd Conference on Learning Representations, ICLR 2015, San Diego, CA, USA, 7–9 May 2015. [Google Scholar]
  37. Glorot, X.; Bordes, A.; Bengio, Y. Deep Sparse Rectifier Neural Networks. In Proceedings of the 14th Artificial Intelligence and Statistics (AISTATS), Fort Lauderdale, FL, USA, 11–13 April 2011. [Google Scholar]
  38. Wang, Z.; Bovik, A.C.; Sheikh, H.R.; Simoncelli, E.P. Image Quality Assessment: From Error Visibility to Structural Similarity. IEEE Trans. Image Process. 2004, 13, 600–612. [Google Scholar] [CrossRef] [Green Version]
  39. Sheikh., H.R.; Bovik, A.C.; Veciana, G.D. An Information Fidelity Criterion for Image Quality Assessment Using Natural Scene Statistics. IEEE Trans. Image Process. 2005, 14, 2117–2128. [Google Scholar] [CrossRef] [Green Version]
  40. Mittal, A.; Rajiv, S.; Alan, C.B. Making a ‘Completely Blind’ Image Quality Analyzer. IEEE Signal Process. Lett. 2012, 20, 209–212. [Google Scholar] [CrossRef]
  41. Lee, J.S. Speckle Analysis and Smoothing of Synthetic Aperture Radar Images. Comput. Graph. Image Process. 1981, 17, 24–32. [Google Scholar] [CrossRef]
  42. Dalsasso, E.; Yang, X.L.; Denis, L. SAR Image Despeckling by Deep Neural Networks: From a Pre-Trained Model to an End-to-End Training Strategy. Remote Sens. 2020, 12, 2636. [Google Scholar] [CrossRef]
  43. Pan, T.; Peng, D.; Yang, W. A Filter for SAR Image Despeckling Using Pre-Trained Convolutional Neural Network Model. Remote Sens. 2019, 11, 2379. [Google Scholar] [CrossRef] [Green Version]
Figure 1. The Contourlet convolutional neural network (CCNN) architecture.
Remotesensing 13 00764 g001
Figure 2. The structure of each subnetwork of the CCNN. (a) The subnetwork used to train the directional sub-bands of the first level; (b) The subnetwork used to train the directional sub-bands of the second level; (c) The subnetwork used to train the coarse sub-band.
Remotesensing 13 00764 g002
Figure 3. Study of the subnetwork structure of the CCNN. (a) PSNR; (b) SSIM; (c) NIQE; (d) ENL.
Remotesensing 13 00764 g003
Figure 4. Probability distributions of the PSNR, SSIM, NIQE and ENL gains for the 100 synthetic and 100 real SAR images. (a) PSNR; (b) SSIM; (c) NIQE; (d) ENL.
Remotesensing 13 00764 g004
Figure 5. The clean images and the corresponding single-look speckle (σ = 0.08) synthetic images. (a) Clean grayscale image (b) Speckled grayscale image (16.52 dB); (c) Clean color image; (d)Speckled color image (17.89 dB).
Remotesensing 13 00764 g005
Figure 6. Visual quality comparison of speckle removal of the synthetic grayscale image. (a)SAR-BM3D (26.96 dB); (b) SAR-CNN (27.28 dB); (c) ID-CNN (27.89 dB); (d) SAR-UNet (28.07 dB); (e) CCNN (28.32 dB); (f) CCNN+ (28.81 dB).
Remotesensing 13 00764 g006
Figure 7. Visual quality comparison of speckle removal of the synthetic color image. (a) SAR-BM3D (27.10 dB); (b) SAR-CNN (27.52 dB); (c) ID-CNN (28.13 dB); (d) SAR-UNet (28.43 dB); (e) CCNN (28.67 dB); (f) CCNN+ (28.98 dB).
Remotesensing 13 00764 g007
Figure 8. The single-look image and the corresponding multi-look references. (a) Grayscale multilook reference; (b) Grayscale single-look image; (c) Color multi-look reference; (d) Color single-look image.
Remotesensing 13 00764 g008
Figure 9. Visual quality comparison of speckle removal of the real grayscale SAR image. (a) SAR-BM3D; (b) SAR-CNN; (c) ID-CNN; (d) SAR-UNet; (e) CCNN; (f) CCNN+.
Remotesensing 13 00764 g009
Figure 10. Visual quality comparison of speckle removal of the real color SAR image. (a) SAR-BM3D; (b) SAR-CNN; (c) ID-CNN; (d) SAR-UNet; (e) CCNN; (f) CCNN+.
Remotesensing 13 00764 g010
Table 1. Average results of the comparison methods.
MetricsTraining Time (h)Run Time(s)Synthetic SAR ImagesReal SAR Images
Methods PSNR (dB)SSIMNIQEENL
SAR-BM3D-1.256127.560.82350.7462283.2
SAR-CNN240.015928.320.83110.7539290.9
ID-CNN480.058628.360.83420.7584296.2
SAR-UNet480.097328.480.84390.7757301.7
CCNN160.013728.760.86710.7894322.5
CCNN_190.011328.940.86810.7902331.3
Table 2. Numerical comparison in terms of average PSNR (dB)/SSIM of different methods.
MethodSAR-BM3DSAR-CNNID-CNNSAR-UNetCCNNCCNN+
σ GrayColorGrayColorGrayColorGrayColorGrayColorGrayColor
0.0629.06
0.8527
30.65
0.8538
29.27
0.8676
30.71
0.8696
29.32
0.8677
30.76
0.8745
29.46
0.8723
30.83
0.8854
29.95
0.8976
31.09
0.9061
30.15
0.9012
31.26
0.9112
0.0827.24
0.8223
28.15
0.8309
27.39
0.8277
28.22
0.8316
27.40
0.8357
28.25
0.8384
27.49
0.8472
28.32
0.8491
27.52
0.8669
28.31
0.8686
27.62
0.8684
28.49
0.8713
0.124.37
0.7496
27.92
0.7585
24.66
0.7571
25.02
0.7603
25.15
0.7714
25.66
0.7805
25.36
0.7808
25.84
0.7813
25.81
0.8116
25.98
0.8211
25.93
0.8152
26.05
0.8214
0.1221.34
0.7108
21.42
0.7153
21.56
0.7186
21.77
0.7204
21.73
0.7225
22.08
0.7279
22.27
0.7331
22.79
0.7334
24.29
0.7637
24.77
0.7785
24.36
0.7694
24.95
0.7849
0.1420.69
0.7524
20.29
0.7386
20.82
0.7598
20.69
0.7401
20.24
0.7621
20.74
0.7412
21.31
0.7634
21.86
0.7421
23.45
0.7647
23.86
0.7424
23.61
0.7827
23.92
0.7459
0.1620.64
0.6952
20.97
0.6773
20.69
0.6971
21.47
0.6793
20.84
0.6975
21.53
0.6806
21.05
0.6978
21.69
0.6783
22.03
0.6987
22.06
0.6782
22.35
0.6997
22.46
0.6804
0.1819.75
0.5207
20.18
0.5339
20.06
0.5218
20.33
0.5356
20.18
0.5229
20.35
0.5363
20.26
0.5289
20.43
0.5376
21.33
0.6025
21.78
0.6106
21.47
0.6134
21.84
0.6178
0.218.31
0.4403
19.39
0.4483
18.48
0.4432
19.04
0.4525
18.76
0.4477
19.32
0.4534
20.18
0.4682
20.42
0.4731
20.32
0.5086
20.61
0.5137
21.05
0.5188
21. 31
0.5265
Table 3. Numerical comparison in terms of NIQE/ENL of different methods.
Method.SAR-BM3DSAR-CNNID-CNNSAR-UNetCCNNCCNN+
Images
#10.7654/164.620.7718/157.360.7731/175.830.7835/184.540.8094/225.00.8127/236.2
#20.4295/106.350.4313/94.380.4326/125.690.4437/131.480.4731/168.780.4904/175.81
#30.6387/130.630.6416/125.210.6527/144.750.6736/154.630.6860/189.950.6949/200.94
#40.7299/150.740.7325/144.380.7335/160.550.7435/175.960.7825/196.230.7895/215.87
#50.5274/114.870.5304/105.880.5329/134.6305406/141.220.5434/175.730.5388/182.21
#60.6356/125.090.6389/120.740.6403/139.880.6528/149.660.6574/181.250.6593/192.36
#70.4884/110.630.4905/99.850.5146/124.390.5295/138.630.5312/166.220.5325/172.61
#80.5764/118.450.5803/110.230.5819/138.670.5872/150.260.5919/178.530.5941/183.45
Publisher’s Note: MDPI stays neutral with regard to jurisdictional claims in published maps and institutional affiliations.