Article

Ionospheric Turbulence and the Equatorial Plasma Density Irregularities: Scaling Features and RODI

1
Istituto Nazionale di Geofisica e Vulcanologia, Via di Vigna Murata 605, 00143 Roma, Italy
2
INAF—Istituto di Astrofisica e Planetologia Spaziali, Via del Fosso del Cavaliere 100, 00133 Roma, Italy
*
Author to whom correspondence should be addressed.
Remote Sens. 2021, 13(4), 759; https://doi.org/10.3390/rs13040759
Submission received: 31 December 2020 / Revised: 31 January 2021 / Accepted: 15 February 2021 / Published: 18 February 2021

Abstract

:
In the framework of space weather, the understanding of the physical mechanisms responsible for the generation of ionospheric irregularities is particularly relevant for their effects on global positioning and communication systems. Ionospheric equatorial plasma bubbles are one of the possible irregularities. In this work, using data from the ESA Swarm mission, we investigate the scaling features of electron density fluctuations characterizing equatorial plasma bubbles. Results strongly support a turbulence character of these structures and suggest the existence of a clear link between the observed scaling properties and the value of the Rate Of change of electron Density Index (RODI). This link is discussed, and RODI is proposed as a reliable proxy for the identification of plasma bubbles.

Graphical Abstract

1. Introduction

The equatorial ionospheric F region is characterized by the presence of electron density irregularities which are mainly created after sunset [1] by the nonlinear evolution of the Rayleigh–Taylor instability [2,3,4]. These irregularities, which are initially generated at relative low altitudes in the bottomside of the equatorial ionosphere, end up penetrating the top layers until they reach the topside of ionosphere up to altitudes as high as 1200 km or more [5,6]. Among these electron density irregularities are the so-called plasma bubbles. These are plasma structures aligned to the geomagnetic field in the night-time equatorial ionosphere where plasma density is from 1 to 3 orders of magnitude lower than the environmental one. The typical size of these plasma depletions ranges from a few meters to hundreds of kilometers [7,8], and their distribution in space and time is controlled by different geophysical parameters: local time, latitude, longitude, season, geomagnetic activity, and solar activity [9,10].
Nowadays, many characteristics of plasma bubbles are known, thanks to the great number of measurements made in the last decades from the ground and space. However, these plasma structures are still of interest to the scientific community. Many studies suggest that these irregularities are not only at the basis of the disturbances suffered by the propagation of radio waves in the ionosphere, but are also responsible for the degradation and occasionally disruption of signals received by the Global Navigation Satellite System (GNSS) [11,12,13]. Our society is increasingly dependent on positioning and timing services of GNSS and this makes the subject of extreme interest. The understanding of this phenomenon, as best as possible, means to pave the way to a possible mitigation of its effects on our infrastructures.
A feature of these irregularities is that their energy spectra obey to a power-law scaling suggesting their possible turbulent character. Indeed, it has been suggested that at high altitudes in the night-time equatorial ionosphere the environmental conditions support the development of classical two-dimensional turbulence processes characterized by the typical energy cascades in the inertial regimes [14,15]. The dynamical evolution of these irregularities has been studied through several numerical simulations [16,17] where the power spectrum of density fluctuations has been found ranging between 5 / 3 and 3 , implying the occurrence of energy and enstrophy cascades according to Kraichnan [18] and Kraichnan and Montgomery [19]. In the last years, the ionospheric models capable of describing the spatial and temporal evolution of electron density irregularities have been improved, and nowadays there are models able to reproduce the turbulent structures of equatorial plasma bubbles with high resolution (see for example Yokoyama et al. [20], Yokoyama [21]) under specific assumptions.
However, both the origin and the dynamics of the ionospheric irregularities are very complex and not yet fully understood. Instability and turbulence processes certainly play an important role, but they are not the only processes responsible for the onset and evolution of irregularities. Comprehensive reviews of the physics of ionospheric irregularities can be found in the books by Kelley [22] and Materassi et al. [23], and in several papers such as those by Kintner and Seyler [14], Tsunoda [24], Sahr and Fejer [25], Hysell [26], just to mention a few. Many electron density measurements have been collected in the past using different instruments installed on board rockets and satellites. These measurements have allowed analyzing the spectral features of the electron density in the equatorial region and investigating their properties at different spatial scales depending on the time resolution of the instruments used. One of the first measurements of the spectral properties dates back to almost fifty years ago, when Dyson et al. [27] found the power law nature of the electron density spectrum analyzing data recorded on board Ogo 6. Later, by analyzing the spectra of electron density data recorded from the Atmospheric Explorer-E satellite (AE-E) in the interval 20:00–02:00 LT (local time), Livingston et al. [28] found a distribution of spectral slopes in the range between 1 and 3 centered around 1.9. The same results were found by Cerisier et al. [29], who analyzed data on board the Aureol-3 satellite, while Hobara et al. [30] found a slope around 2.2. These are just some examples that show how the scientific literature reports a wide range of possible values for the spectral indices. This can be due to different reasons. For example, it is important to consider the range of analyzed scales: the use of instruments with a different sampling frequency allows probing different spatial scales, which can be of the order of meters, kilometers, or hundreds of kilometers. Moreover, further important elements to take into account are whether the electron density measurements are made on board rockets or satellites and lastly whether the observations are along the magnetic field (for near-polar orbiting satellites) or in a direction transverse to it (for low-inclination satellites). In such a context, the measurements made on board Swarm allow to investigate the spectral and scaling features of electron density fluctuations in the low-frequency domain, where observed spectral slopes are less steep than in the high-frequency domain.
The aim of our investigation is to analyze the scaling properties of the electron density irregularities, associated with equatorial plasma bubbles and recorded at low latitudes by Swarm A satellite, one of three satellites of ESA Swarm constellation, and compare them with the same properties of the environment plasma medium where plasma bubbles form. Specifically, we focus on the scaling properties of plasma bubbles to investigate their possible turbulent nature.
Last, we try to understand whether the Rate of change Of electron Density Index (RODI), which is a proxy of the occurrence of ionospheric electron density irregularities, may provide information on the scaling properties of electron density fluctuations and on the possible physical mechanisms at their origin. The idea is that the irregularities characterized by a turbulent nature are associated with high RODI values. Recently, it has been found that a crucial factor for causing the global positioning systems (GPS) signal loss is the large density gradients associated with ionospheric plasma irregularities [31,32]. In light of this, our analysis would support the hypothesis that a crucial factor for causing the GPS signal loss is the presence of plasma density irregularities generated by a turbulence mechanism.

2. Data

To investigate the scaling features of the low-latitude electron density irregularities, we use measurements recorded on board Swarm A satellite [33], which flies at an altitude 460 km. In detail, we consider measurements of in situ electron density, N e , at a rate of 1 Hz collected by the Langmuir Probes on board ESA satellite, during a period of 22 months (from 1 April 2014 to 31 January 2016), which have been downloaded from the ESA dissemination server (ftp://swarm-diss.eo.esa.int accessed on June 2019). The selected period is characterized by a high/moderate solar activity with an average value of the solar radio flux index (F10.7) equal to ( 100 ± 30 ) sfu.
In our study, we focus on the LT sector ranging from 18:00 to 24:00, consider a range of ± 40 in geographic latitude, and select periods characterized by low/moderate geomagnetic activity ( K p 3 ). In these conditions, the probability of observing plasma bubbles is the highest, as vastly documented in the previous literature on this matter see, e.g., and references therein [6,34,35]. Indeed, we remark that equatorial plasma bubbles are large-scale magnetic field-aligned plasma density depletions (negative density anomalies) which are widely documented as being generated by the Rayleigh–Taylor instability mechanism at the bottomside of the of the F region in the post-sunset ionosphere [22] with a high occurrence rate localized in the pre-midnight sector as shown by in situ and ground-based data see, e.g., and references therein [2,34,36,37,38,39,40,41,42,43,44,45,46]. According to this literature, our analysis is confined to the dusk-midnight sector.
To select the plasma bubble events, we use Swarm Level-2 Ionospheric Bubble Index (IBI) product (http://earth.esa.int/swarm accessed on September 2020). This index, which identifies the occurrence of plasma bubbles analyzing the magnetic field variations associated with electron density depletions, can assume three values [47]. It is equal to 0 when there are not plasma bubbles, i.e., the plasma ambient is quiet; equal to −1 when it is not possible to determine with absolute certainty the presence of a plasma bubble, i.e., when data are outside of the night-side region or the quality is poor; and finally equal to 1 when plasma bubbles are detected [47]. Furthermore, when IBI=1 there is an additional flag, the Bubble Flag (BF), indicating the quality of plasma bubbles detection (see https://earth.esa.int/documents/10174/1514862/Swarm_L2_IBI_product_description accessed on September 2020). In particular, if this additional flag is BF=1 then we are in presence of a high correlation between plasma density and magnetic field signatures. Here, we chose the condition IBI = 1 and BF = 1 for the occurrence of a plasma bubble. The IBI is evaluated for each of the three Swarm satellites and is available with a sampling rate of 1 Hz. The top panel of Figure 1 reports the accumulated plot of N e in the latitude–longitude plane according to aforementioned conditions for all the selected time interval (i.e., 22 months), while the bottom panel of Figure 1 reports the accumulated plot of N e associated with plasma bubbles identified using IBI = 1, and BF = 1.
This index is based on the diamagnetic effect according to which plasma density irregularities are always accompanied by magnetic field perturbations. This effect has been confirmed by simultaneous observations of magnetic field and electron density recorded by CHAMP satellite [34], which have shown a high correlation between the increase of a few nT of the main magnetic field intensity and the depletions of plasma density. Furthermore, some studies [34,35] revealed magnetic signatures that closely reflected that of the plasma bubbles previously obtained using different methods, such as GPS scintillation [10], in situ plasma density measurements [48], and radio wave propagation [49], thus suggesting the possibility to use the magnetic measurements as an indirect way of sampling plasma density structures. To obtain the IBI product, the plasma bubbles are identified by using the effect they produce on the magnetic field measurements, and their existence is then validated using plasma measurements, as described by the BF.

3. Method and Analysis Results

To investigate the scaling features of N e at different temporal scales we evaluate the so-called generalized qth-order structure function, namely, S q , which is defined according to the following expression:
S q ( τ ) N e ( t + τ ) N e ( t ) q ,
where t is the time, τ is the time increment, and . . . stands for a statistical average. It may happen that S q ( τ ) has a power-law behavior as a function of τ :
S q ( τ ) τ γ ( q ) ,
where γ ( q ) is the so-called scaling exponent. In this case, the analyzed signal is characterized by a scale invariant feature and the scaling exponent γ ( q ) allows defining the scaling nature of the increments of the signal under investigation.
In this work, we investigate the 1st- and 2nd-order structure function scaling exponents, which give information on some particular features of the signal under investigation such as the occurrence of scaling invariance, the persistence nature of the increments, and their spectral features. For instance, the 1st-order scaling exponent, γ ( 1 ) , is equivalent to the well-known Hurst exponent, H, which quantifies the persistence of signal increments (see, e.g., De Michelis et al. [50] and references therein). Furthermore, according to the well-known Wiener–Khinchin theorem it is possible to show that the 2nd-order scaling exponent, γ ( 2 ) , is related to the Fourier power spectral density (PSD) exponent, β , via the following relation:
β = γ ( 2 ) + 1 .
Furthermore, using the first two scaling exponents, γ ( 1 ) and γ ( 2 ) , it is possible to provide an estimation of the occurrence of anomalous scaling features, i.e., of intermittency. Indeed, in the case of signals characterized by simple scaling features, such as mono-fractal signals, the 2nd-order scaling exponent γ ( 2 ) is expected to be linearly related to the 1st-order one by the following relation:
γ ( 2 ) = 2 γ ( 1 ) .
Conversely, in the case of multifractal signals, which display anomalous scaling features, the last relation is not valid being the dependence of γ ( q ) on q nonlinear. Therefore, it is possible to introduce a correction to the linear scaling of the structure function exponents. This quantity can be treated as a sort of intermittency coefficient, although this is not exactly the usual intermittency value to be applied to the spectral correction. This intermittency coefficient, I, is defined as
I = 2 γ ( 1 ) γ ( 2 ) ,
which is a measure of the departure from a linear scaling of the structure function exponents. We remind that intermittency, i.e., the occurrence of an anomalous scaling of the structure functions, is a peculiar property of turbulent media and gives information on an inhomogeneous redistribution of energy from large scales to the small ones in the cascading mechanism [51]. The higher the intermittency, the greater the inhomogeneity with which the energy at a given scale is redistributed to the smaller and smaller scales.
In our study, the analyses and discussion focus on the relationship among γ ( 2 ) , the intermittency coefficient I and the features of the equatorial plasma bubbles.
The choice to perform the analysis of the spectral and scaling features of electron density local fluctuations using the structure function approach instead of the Fourier-based methods relates to the fact that results provided by this method are more stable than those provided by Fourier-based approaches when detection of features is made on local short time intervals. This is because the structure function method is based on an analysis in the time-domain using the increments of the time series under investigation that are expected to satisfy the quasi-stationarity for signals with a power spectral density characterized by a spectral slope in the range of [−3, −1] see, e.g., and reference therein [52].
To evaluate the local scaling features of the electron density time series, we refer to the local structure function analysis method discussed in De Michelis et al. [50]. In particular, the structure–function analysis is applied on a moving window of N = 301 points after having detrended the time series in the window using a linear function. The investigated time increments τ , and therefore the time scales, range from 1 to 40 s, and the estimated scaling exponents are associated with the position of the satellite corresponding to the center of the considered time window.
Before moving to the description of our analysis, we would like to elaborate on the requirement of stationarity of the analyzed time series. The signals under investigation are generally characterized by spectral features with exponents ranging from −3 to −1. According to Davis et al. [53], such kinds of signals are generally non-stationary with stationary increments (specifically see the discussion on fractional Brownian motions). Thus, we can assume that in our case the requirement of stationarity for the increments used in the structure function analysis is satisfied. Last, it is interesting to note that the analysis made in the temporal domain may also be valid in the spatial one (see, e.g., in [52,54] and references therein). Thus, taking into account the orbital velocity of Swarm A satellite, which is around 8 km/s, we can suppose that the results obtained in the temporal range between 1 and 40 s are valid in the spatial domain between 8 km and 300 km. Therefore, the analysis carried out on the scale properties of the electron density in correspondence with the plasma bubbles will allow studying the properties of these plasma irregularities in a range of scales between a few kilometers and a few hundred kilometers, thus allowing the investigation of the low-frequency (or wavenumber) part of the electron density fluctuations.
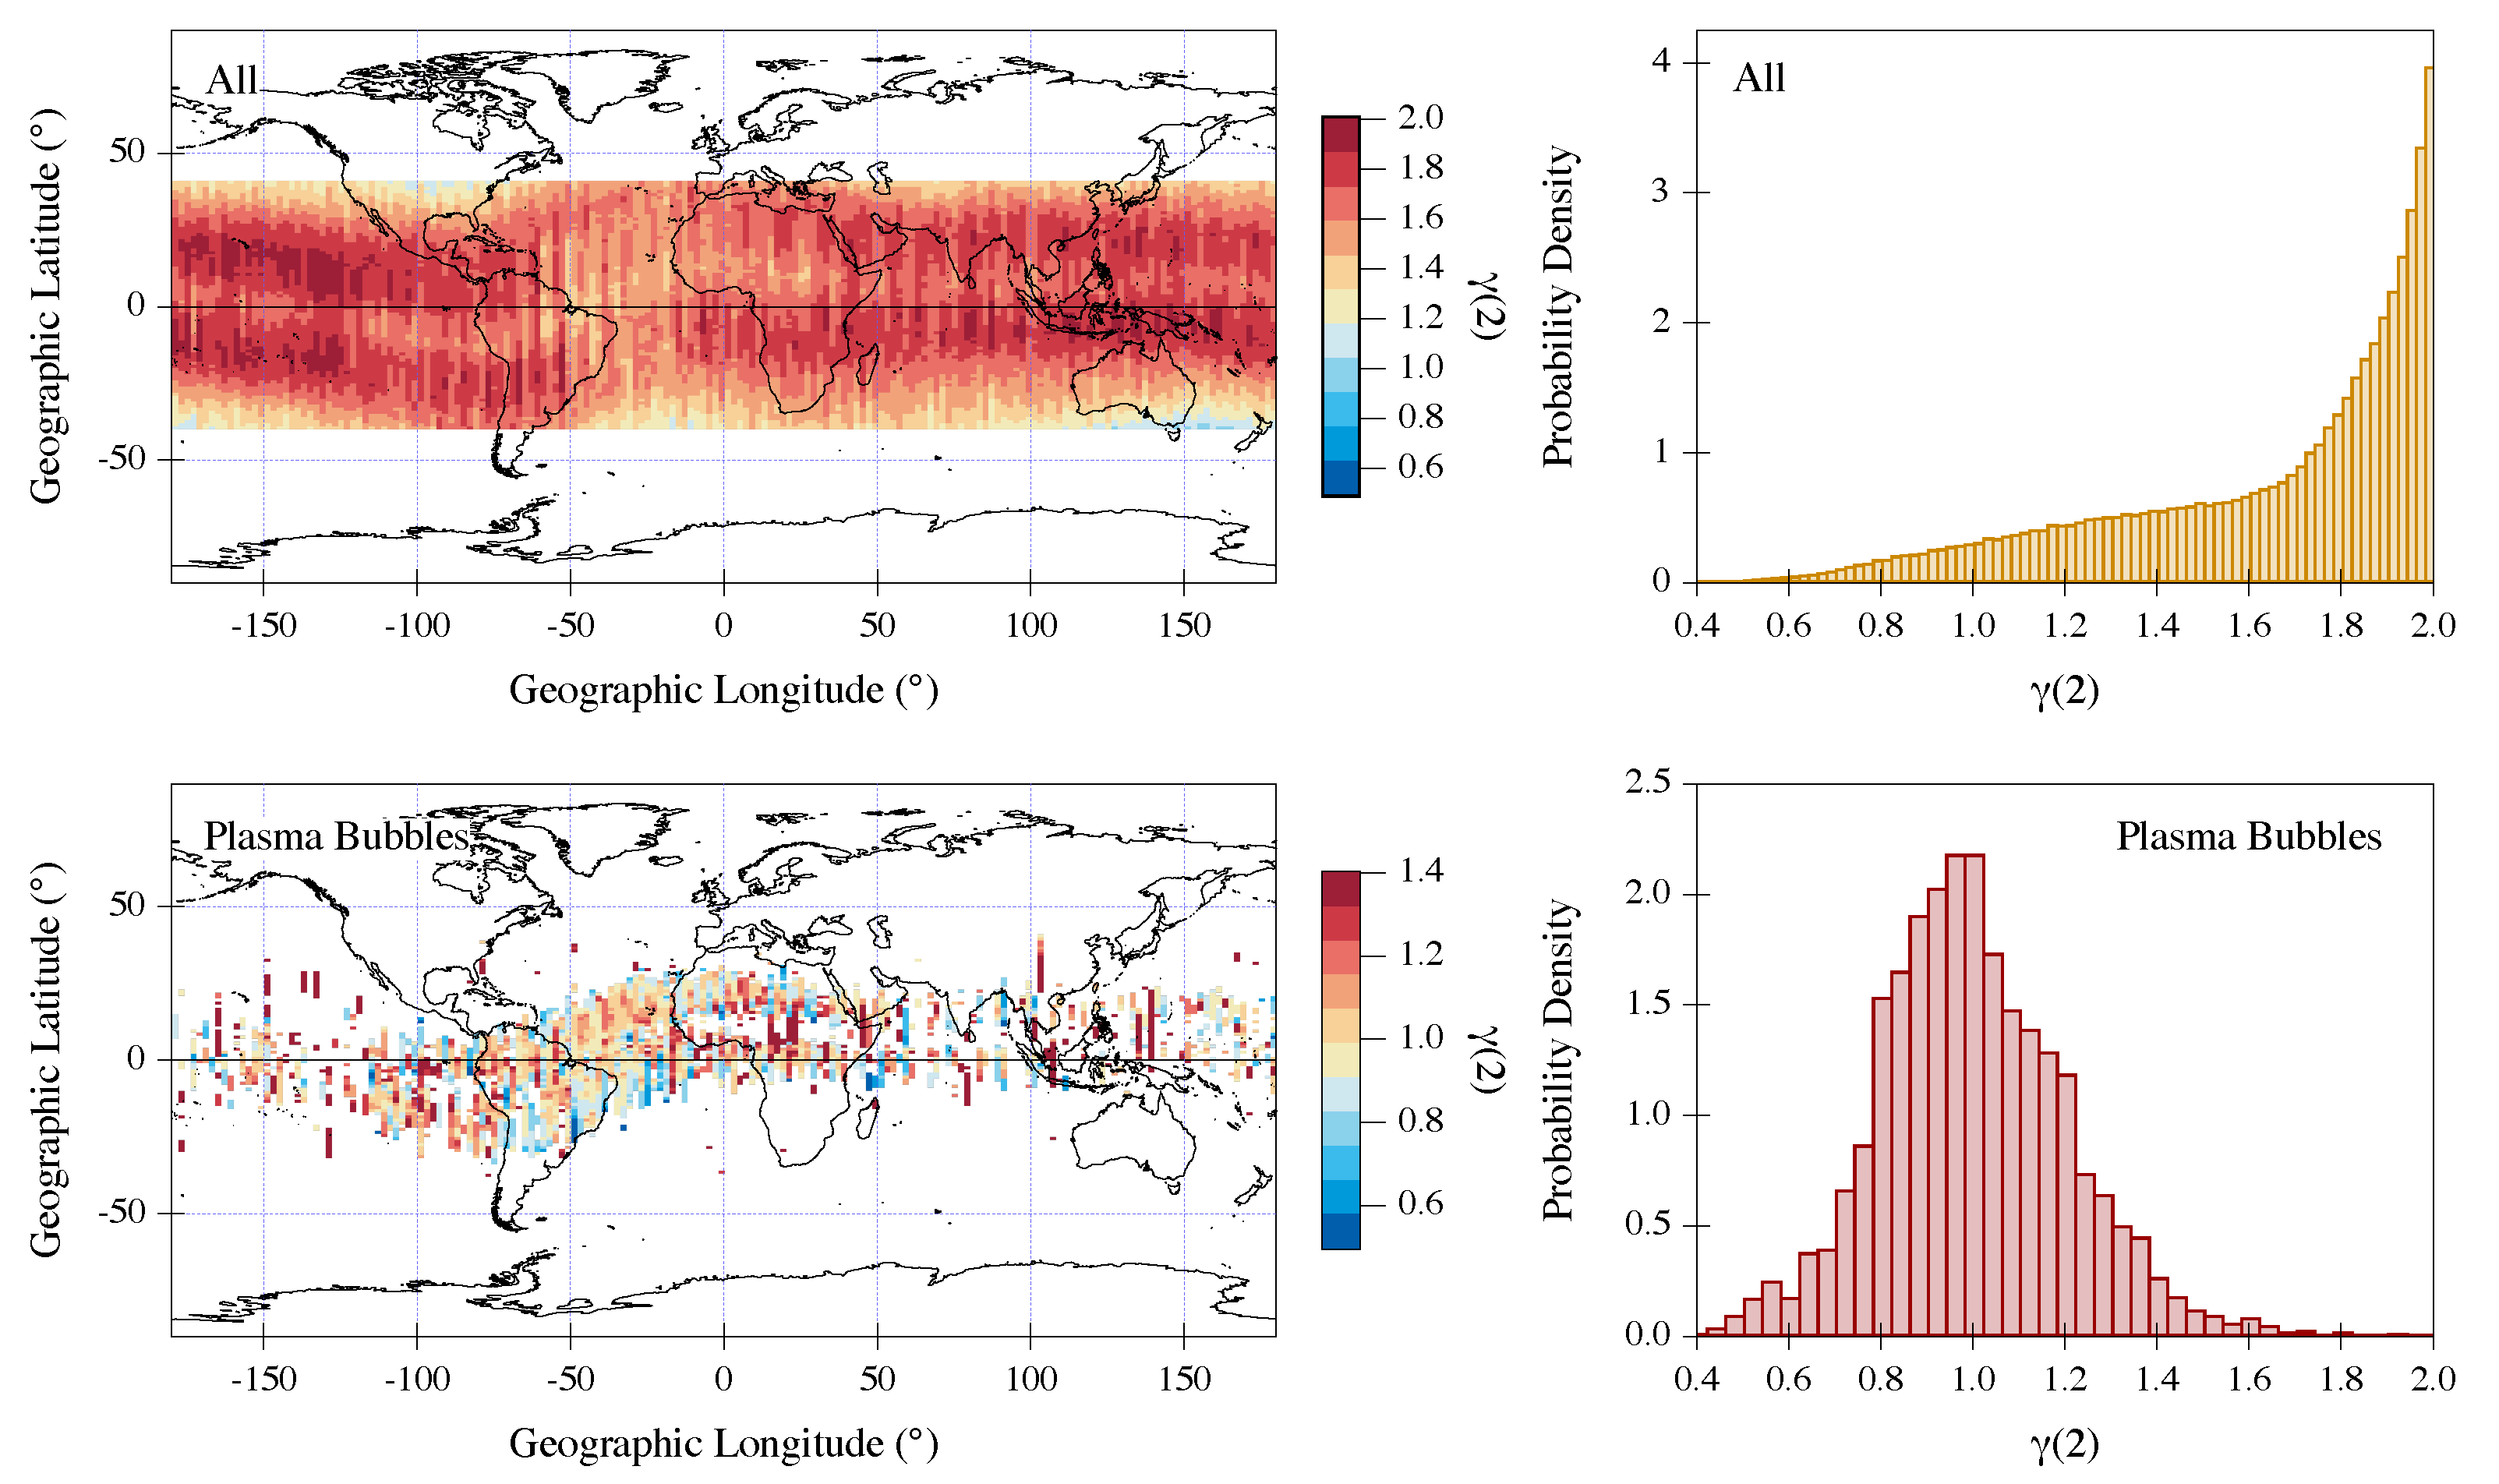
The analysis is done on the entire time series. This means that we initially work on time series of around 5 · 10 7 points (22 months with a time resolution of 1 Hz). Successively, we select the values of γ ( 2 ) associated with the occurrence of plasma bubbles. Figure 2 reports the obtained results. It shows the values of γ ( 2 ) associated with the plasma bubbles’ occurrence in the latitude–longitude plane (left bottom panel) and the corresponding histogram (right bottom panel). For comparison, the same figure on the top reports the distribution of γ ( 2 ) in the latitude–longitude plane relative to the whole electron density dataset for selected conditions (18:00–24:00 LT, ± 40 geographic latitude, K p 3 ) and the corresponding histogram.
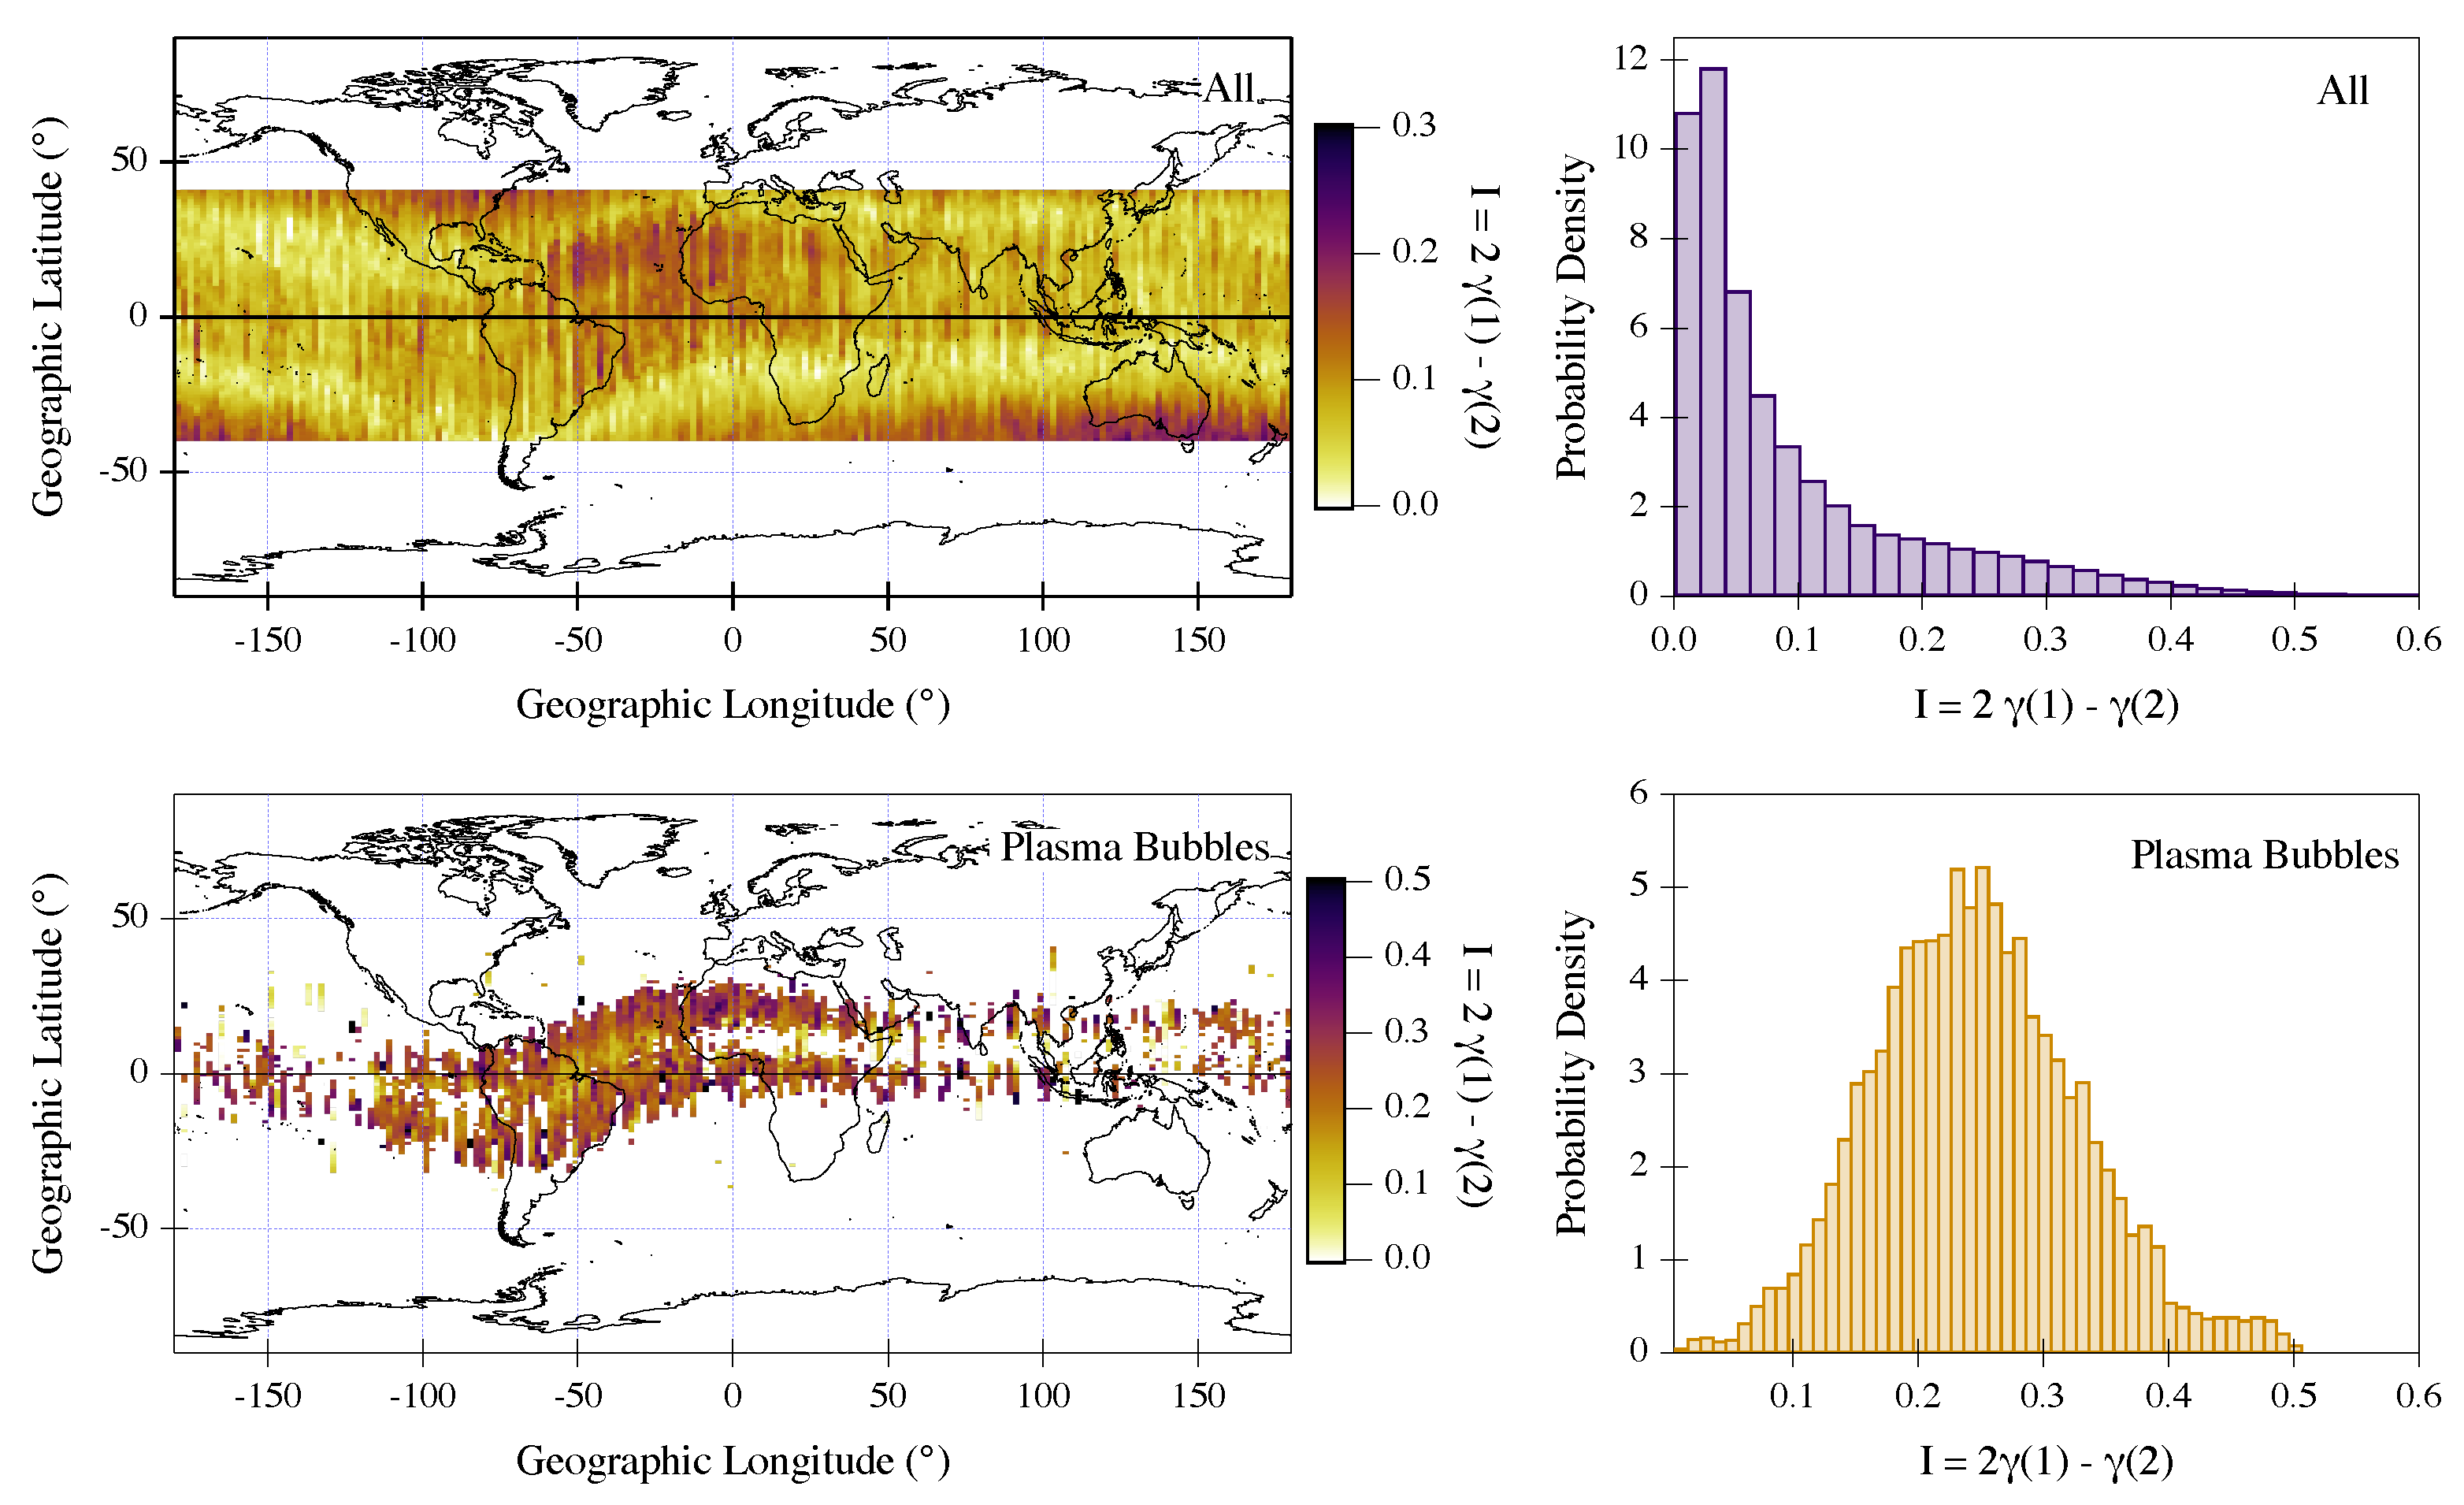
Last, using the same structure of Figure 2, we report in Figure 3 also the results of the analysis related to the intermittency coefficient.

4. Discussion

As stated above, in this work we focus on the scaling properties of the electron density time series recorded on board Swarm A in order to verify the possible turbulent nature of plasma bubbles. All the satellites of Swarm constellation are characterized by a nearly polar orbit, and consequently the electron density measurements recorded on board Swarm A permit to examine the structure of the plasma bubbles approximately along the magnetic field, which is the direction along which they are expected to move. In particular, our analysis offers the possibility to study the scaling properties of plasma bubbles and to evidence how these density structures appear significantly different from those that characterize the electron density fluctuations in the environment where plasma bubbles develop.
Figure 2 clearly shows that inside the plasma bubbles the 2nd-order structure function exponent in the investigated range of time scales spreads from 0.4 to 2 with the highest probability occurring for values around ( 0.98 ± 0.21 ) . Differently, the same quantity associated with the electron density fluctuations in the environment where the plasma bubbles are detected, though covers the same range between 0.4 and 2, shows values which cluster around 2. This means that, according to Equation (3), the electron density inside the plasma bubbles is characterized by a Fourier PSD exponent β = ( 1.98 ± 0.21 ) that is instead around 3 outside of them. This result suggests a dynamics of the electron density fluctuations significantly different inside and outside plasma bubbles. The different character of the fluctuations inside the plasma bubbles, as suggested by the values of γ ( 2 ) , could be due to the proposed turbulence origin of these irregularities at least at Swarm A altitude (∼460 km). These electron density irregularities are also characterized by high intermittency degree as estimated by a mean intermittency coefficient I = ( 0.24 ± 0.09 ) , which is about one order of magnitude larger than the value of the surrounding environment (see Figure 3). The occurrence of high values of intermittency correction suggests that the electron density fluctuations inside the plasma bubbles can be influenced by the local value of energy dissipation rate. In the case of classical Kolmogorov’s fluid turbulence, for which the statistical behavior of the electron density fluctuations should be characterized by a β = 5 / 3 power-law spectral exponent, the effect of intermittency is that to make the spectrum steeper [55,56,57]. Thus, it is possible to introduce an intermittency correction (not to be confused with our intermittency coefficient I) to the classical Kolmogorov’ spectral slope according to which the new spectral exponent β is β = ( 5 / 3 + μ ) . In our case, we get μ 0.3 , a value that supports the hypothesis that intermittency is extremely relevant for plasma bubbles.
Recently, it has been found that at high latitudes the RODI, which is a proxy of the occurrence of ionospheric electron density irregularities, is capable of providing information on the scaling properties of electron density fluctuations [58]. Very high values of RODI have been found to be correlated with the antipersistent character of electron density fluctuations and with the values around 5/3 of the power spectral density scaling exponent.
To understand whether this relation between the high values of RODI and some peculiar features of the scaling properties of the electron density fluctuations is valid also in the equatorial region, we analyze the value of RODI inside and outside the plasma bubbles. This index, which is essentially a measure of the standard deviation of the rate of change of electron density evaluated in a moving window of 10 s along the orbit of the satellite, has been computed using the standard method reported, for example, in De Michelis et al. [58], Pignalberi [59], Jin et al. [60] and Piersanti et al. [61].
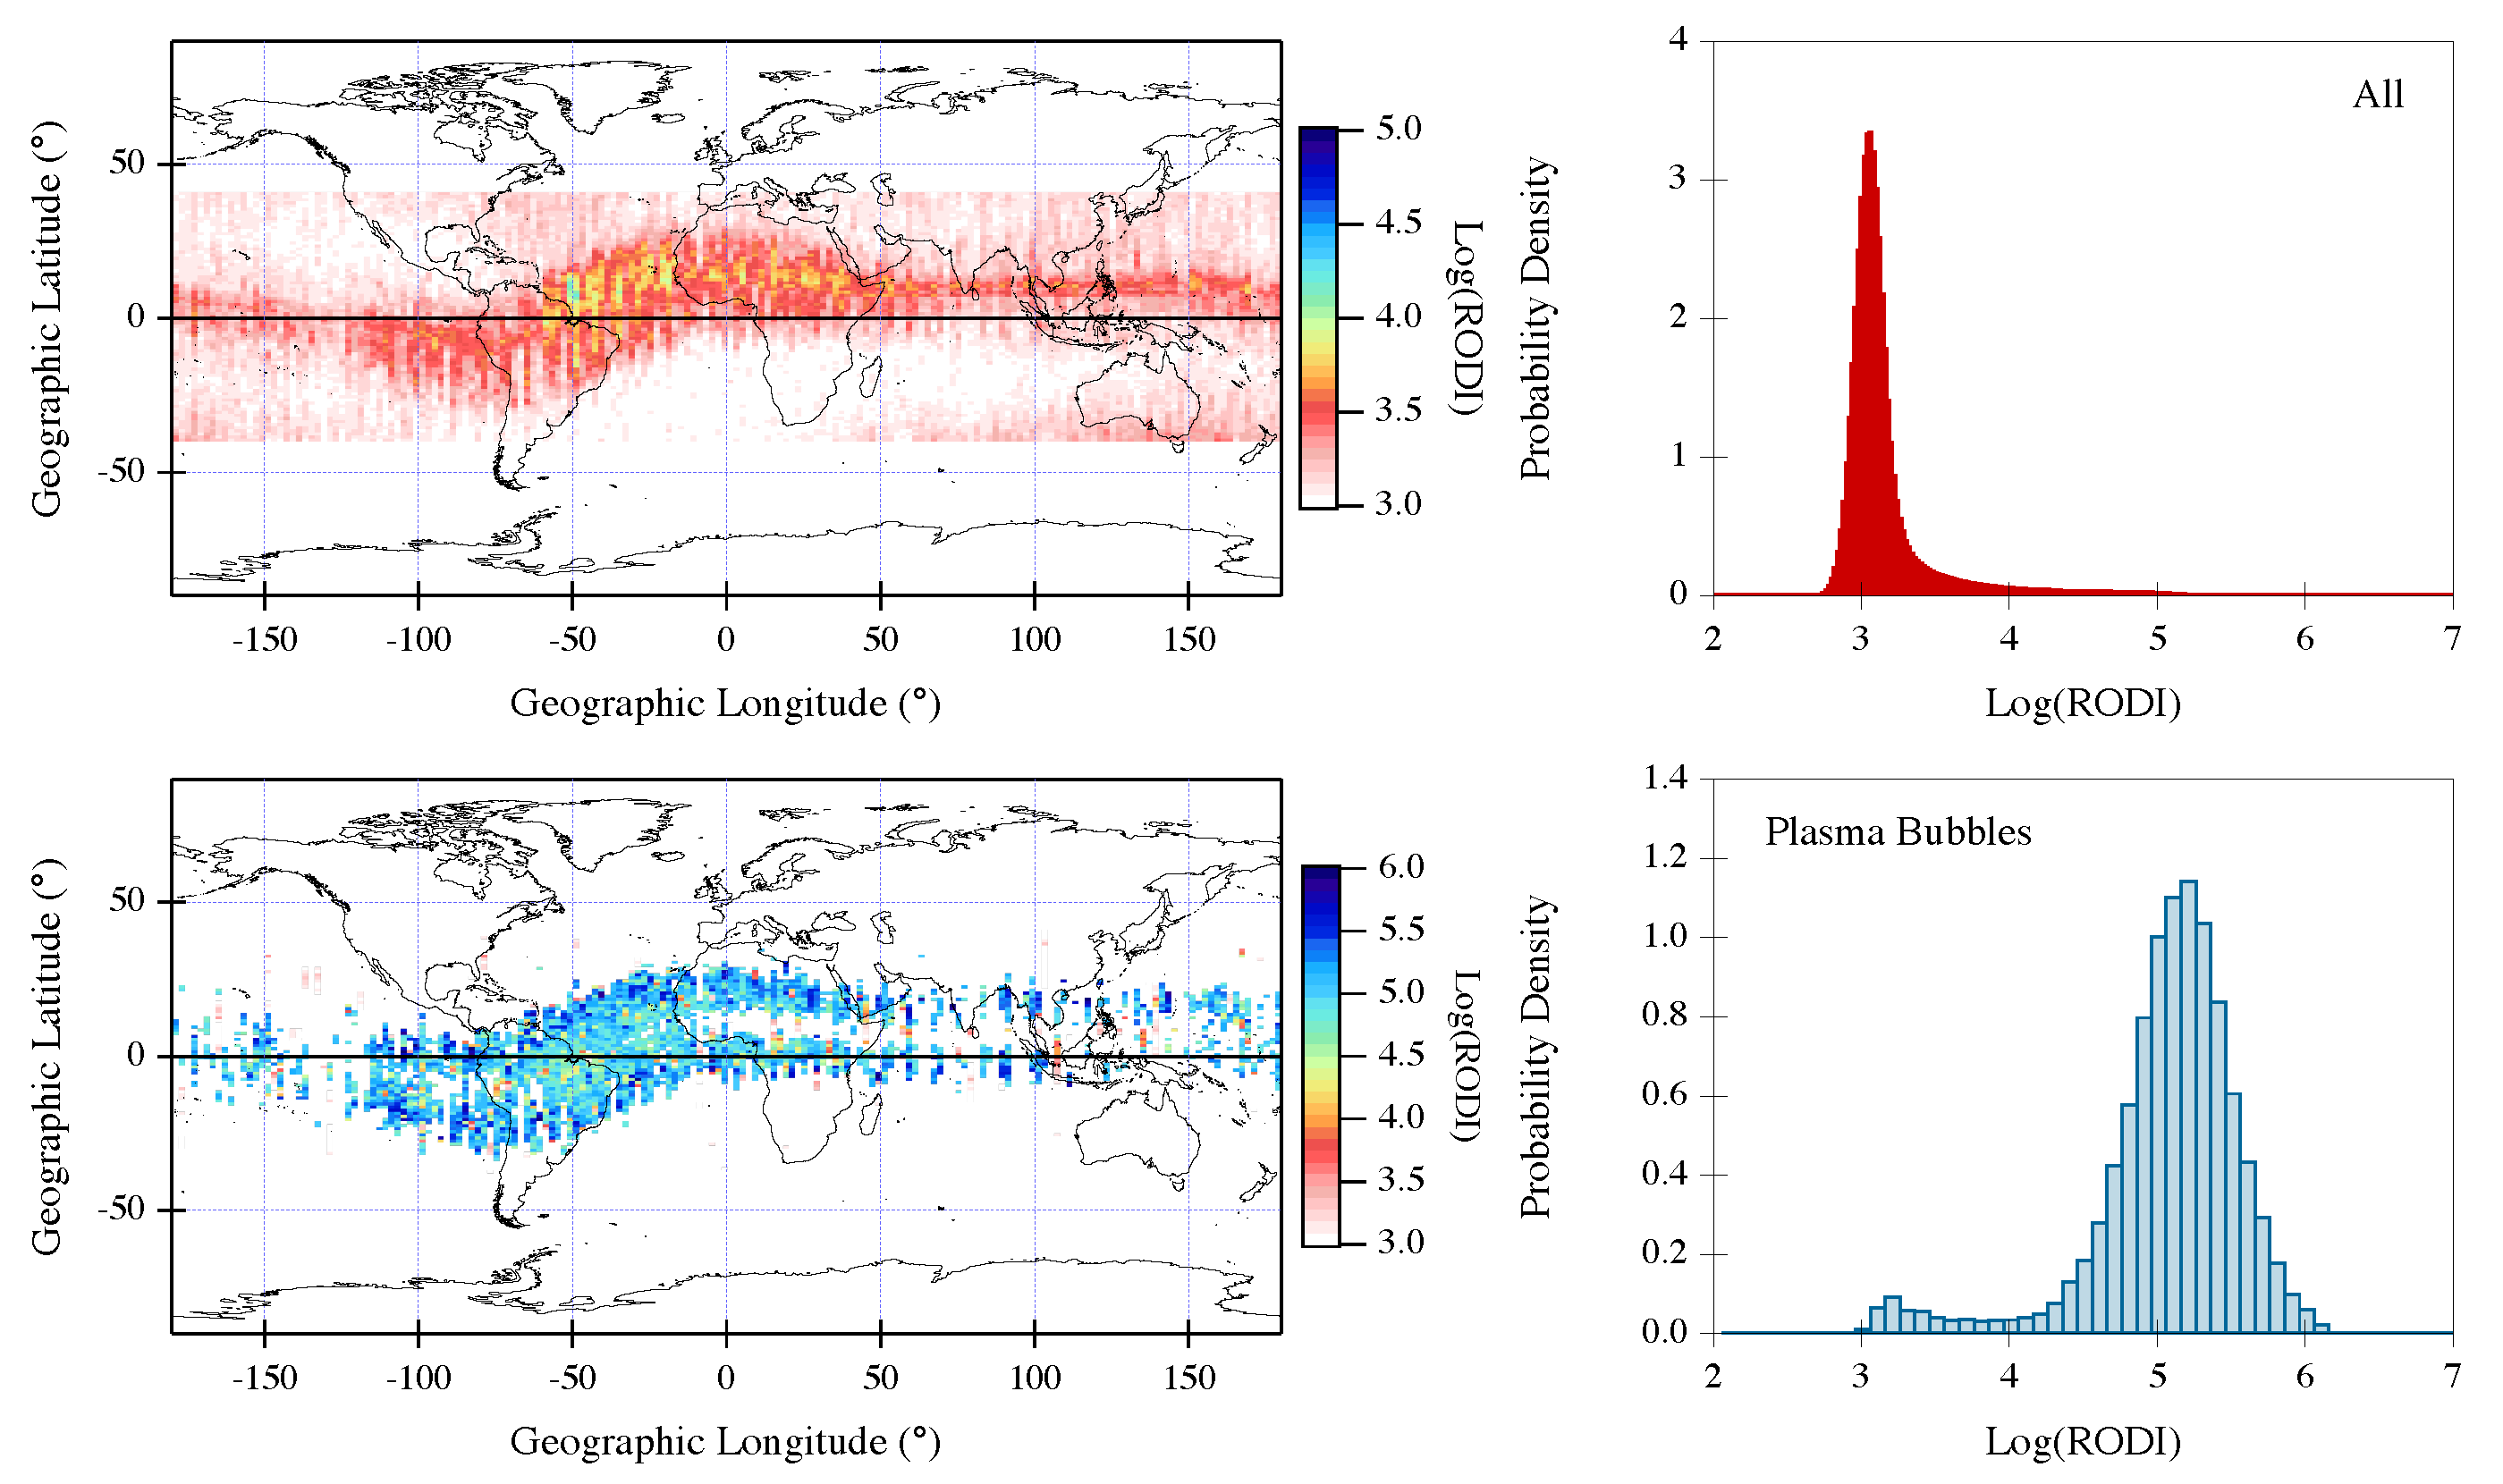
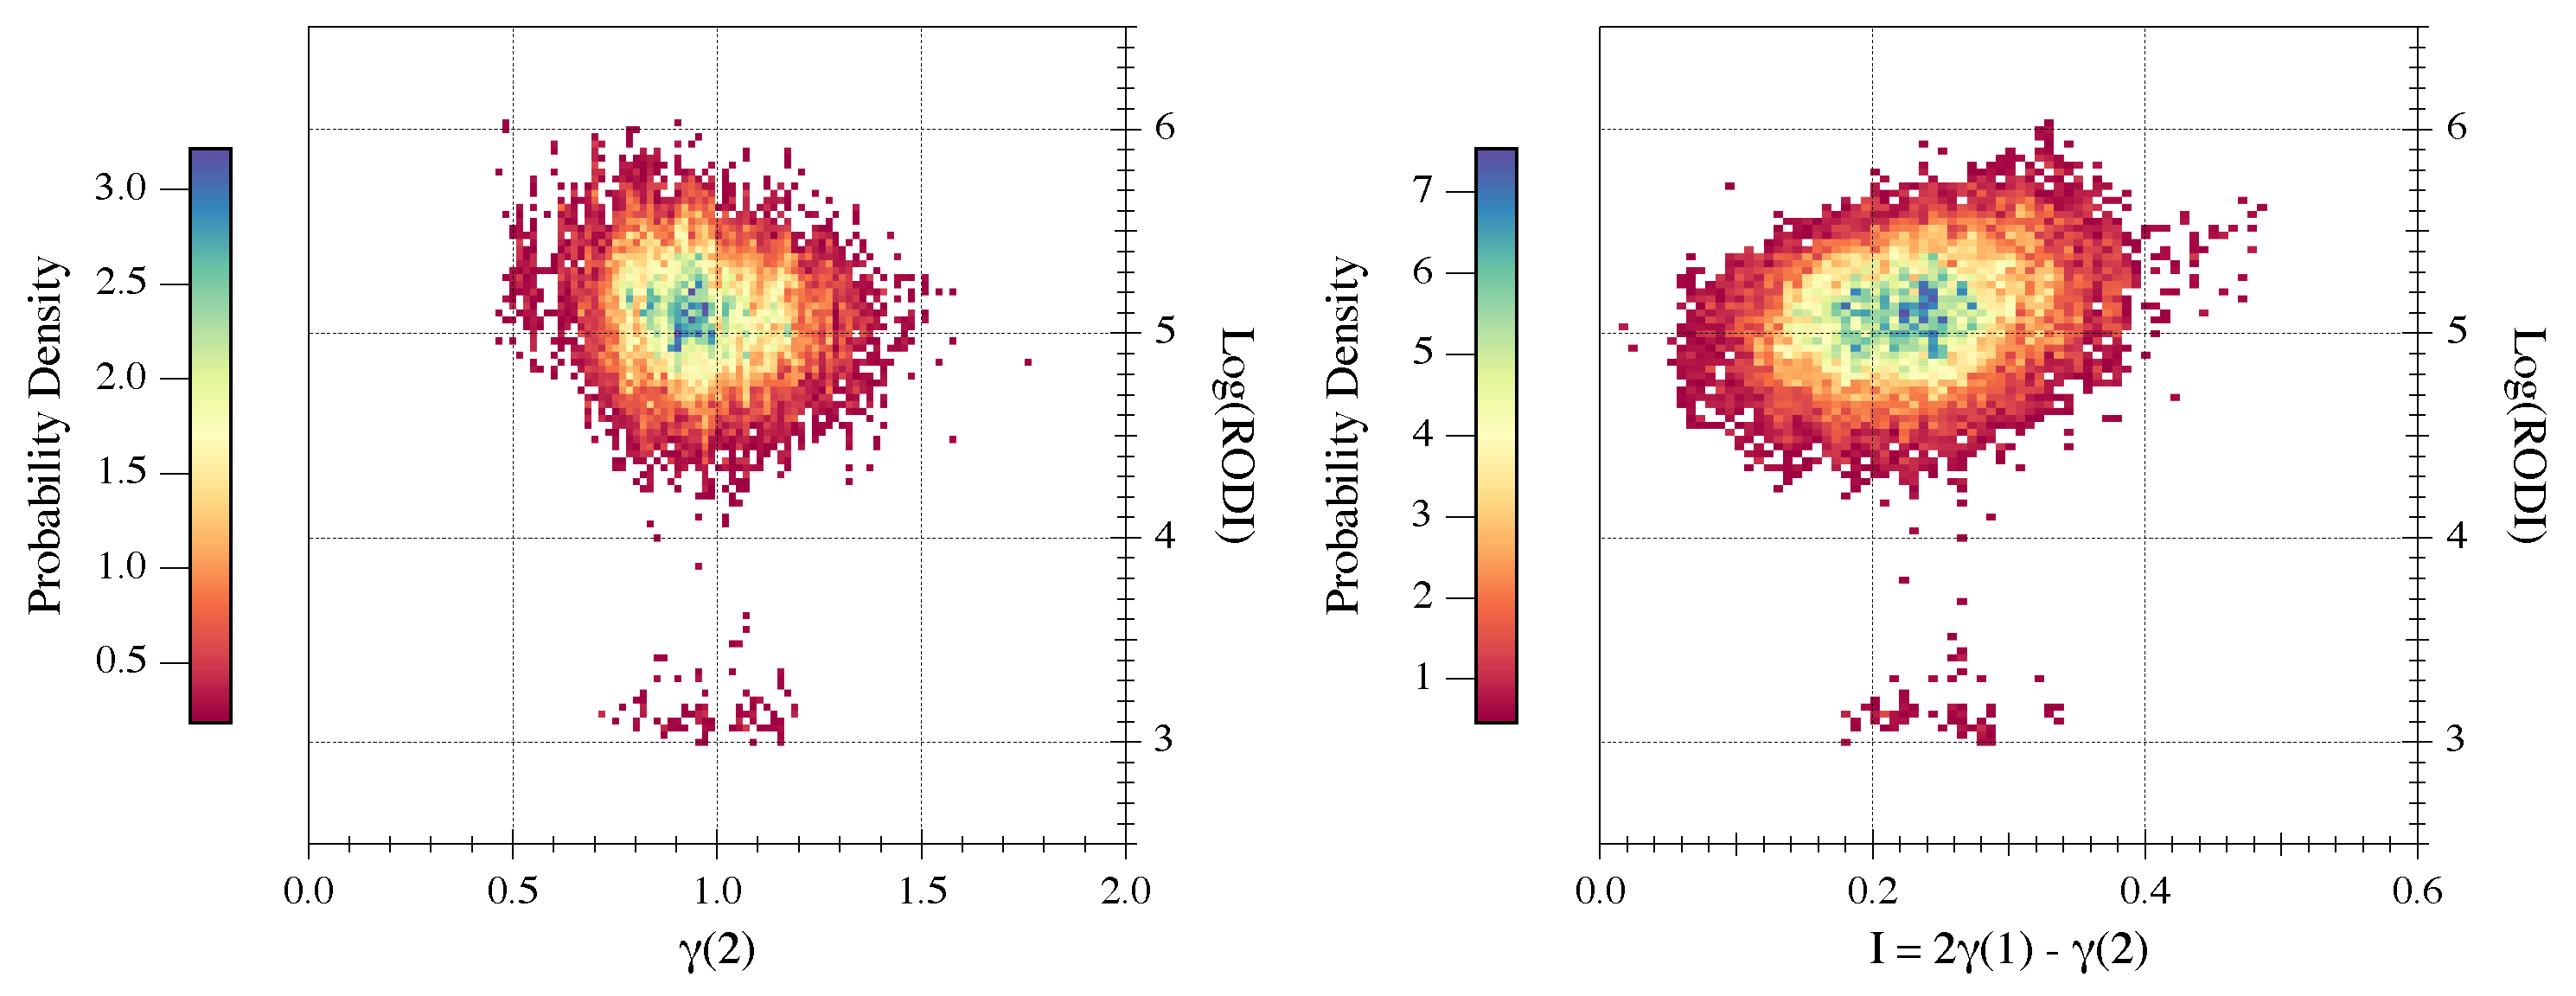
Figure 4 reports the obtained results. They show that inside the plasma bubbles RODI reaches high values (> 10 4 cm 3 s 1 ) which are not observed outside these irregularities where the mean value of RODI is around 10 3 cm 3 s 1 . A very small secondary peak for RODI values around 10 3 cm 3 s 1 is visible in the distribution related to the plasma bubbles. The origin of this peak could be due to some spurious effect in the detection of plasma bubbles. However, this second family is negligible. To better visualize our findings, we evaluate also the joint probability densities between RODI and 2nd-order scaling exponent, and between RODI and intermittency coefficient values inside plasma bubbles. Figure 5 reports our results. The plasma bubbles, which are characterized by scaling properties different from those of the electron density fluctuations outside these irregularities, are characterized by high RODI values. This means that inside plasma bubbles the electron density fluctuations, which seem to be characterized by a turbulent nature, also show large density gradients as highlighted by the associated RODI values.

5. Summary and Conclusions

The scaling properties of the electron density time series recorded on board Swarm A were analyzed in order to verify the possible turbulent character of plasma bubbles. These plasma density irregularities were selected using the Swarm Level-2 Ionospheric Bubble Index (IBI) product considering a period of 22 months, a local time interval of six hours (18:00–24:00 LT) and a geomagnetically quiet period ( K p 3 ). The selected period allowed analyzing a significant number of equatorial electron density irregularities associated with the occurrence of plasma bubbles. Using the classical structure function method, we evaluated the 1st- and 2nd-order structure functions and analyzed the relative spectral exponents. In detail, we analyzed the 2nd-order exponent and used the 1st-order one to evaluate the intermittent character of the electron density time series. The work shows a comparison between the scaling properties of the electron density fluctuations inside and outside the plasma bubbles. Under Taylor’s hypothesis, the results are valid in the spatial scales between 8 and 300 km, and refer to the electron density fluctuations recorded along the satellite orbit, which is in first approximation parallel to the geomagnetic field lines. Combining the occurrence of anomalous scaling as estimated by the intermittency coefficient to the classical Kolmogorov theory for fluid turbulence, our results support a possible turbulent nature of the electronic density fluctuations inside the plasma bubbles. Moreover, the occurrence of intermittency suggests that we are in presence of intermittent turbulence [62]. Clearly, in this fluid turbulence scenario we are assuming that the turbulence is mainly 3-dimensional. However, in the case of magnetohydrodynamic turbulence, the observed spectral features could be the result of a 2-dimensional intermittent turbulence due to the formation of coherent structures (the plasma bubbles) as shown by Wu and Chang [63] and in other works [62,64].
For what concerns the scaling features of the surrounding environment, the observation of a 2nd-order scaling exponent near 2 could be attributable to the occurrence of a 2-dimensional turbulence phenomenon in the presence of an enstrophy cascade [19]. In this situation, the power spectral features are expected to display a spectral exponent β near 3, i.e., a 2nd-order exponent γ ( 2 ) 2 . A possible mechanisms at the base of this could be the generation of large scale vortical structures due to shear flows associated with other current systems. An alternative explanation could be the occurrence of drift-wave turbulence that in the case of direct cascade, assuming the Taylor’s hypothesis for a high speed moving detector, could display spectral slopes β 3 [65]. However, this is just a speculative point that needs to be better investigated in future works.
Plasma bubbles exhibit scaling properties, which are completely different from the surrounding environment and are associated with large density gradients. These large density gradients, which are certainly the result of the turbulent nature of the irregularities, are reflected in high RODI values. As already observed at high latitudes [58], this index seems to be capable of identifying the presence of turbulence processes in the ionosphere. Therefore, also in this case, RODI could be used as a proxy of those ionospheric irregularities which are characterized by a turbulent nature. It is possible to set a minimum value of RODI equal to 10 4 cm 3 s 1 above which the index is able to identify this type of irregularities.
Recently, it has been shown that an important factor responsible for GPS losses of lock is the presence of large density gradients associated with ionospheric plasma irregularities [31,32]. The results of our study suggest that among all the possible ionospheric irregularities, those that can have a disruptive impact on our ground and space infrastructures are mainly those generated by turbulence processes.

Author Contributions

Conceptualization P.D.M.; methodology, P.D.M. and G.C.; investigation, P.D.M. and G.C.; formal analysis, P.D.M., G.C., and R.T.; writing—original draft preparation, P.D.M. and G.C.; data curation, A.P., F.G., I.C., M.P., M.F.M. and R.T.; writing—review and editing, All Authors. All authors have read and agreed to the published version of the manuscript.

Funding

This research received financial support from European Space Agency (ESA contract N. 4000125663/18/I-NB-“EO Science for Society Permanently Open Call for Proposals EOEP-5 BLOCK4” (INTENS)) and from the Italian MIUR-PRIN grant 2017APKP7T on “Circumterrestrial Environment: Impact of Sun–Earth Interaction”.

Institutional Review Board Statement

Not applicable.

Informed Consent Statement

Not applicable.

Data Availability Statement

Publicly available dataset were analyzed in this study. Elaborated data are available on request from the corresponding author.

Acknowledgments

The results presented rely on data collected by ESA-Swarm mission. We thank the European Space Agency that supports the Swarm mission. Swarm data can be accessed at http://earth.esa.int/swarm accessed on June 2019–September 2020. The authors kindly acknowledge V. Papitashvili and J. King at the National Space Science Data Center of the Goddard Space Flight Center for the use permission of 1 min OMNI data and the NASA CDAWeb team for making these data available (https://cdaweb.gsfc.nasa.gov/index.html/ accessed on September 2020).

Conflicts of Interest

The authors declare no conflict of interest. The funders had no role in the design of the study; in the collection, analyses, or interpretation of data; in the writing of the manuscript; or in the decision to publish the results.

Abbreviations

The following abbreviations are used in this manuscript:
ESAEuropean Space Agency
BFBubble Flag
GNSSGlobal Navigation Satellite System
GPSGlobal Positioning System
IBISwarm Level-2 Ionospheric Bubble Index
PSDPower Spectral density
RODIRate Of change of electron Density Index

References

  1. Kil, H.; Heelis, R.A. Global distribution of density irregularities in the equatorial ionosphere. J. Geophys. Res. 1998, 103, 407–418. [Google Scholar] [CrossRef]
  2. Woodman, R.F.; La Hoz, C. Radar observations of F region equatorial irregularities. J. Geophys. Res. 1976, 81, 5447–5466. [Google Scholar] [CrossRef]
  3. Kelley, M. The Earth’s Ionosphere: Plasma Physics and Electrodynamics; International Geophysics, Elsevier Science: Amsterdam, The Netherlands, 2009. [Google Scholar]
  4. Schunk, R.W.; Nagy, A.F. Ionospheres: Physics, Plasma Physics, and Chemistry; Cambridge Atmospheric and Space Science Series; Cambridge University Press: Cambridge, UK, 2009. [Google Scholar]
  5. Cherniak, I.; Zakharenkova, I.; Sokolovsky, S. Multi-Instrumental Observation of Storm-Induced Ionospheric Plasma Bubbles at Equatorial and Middle Latitudes. J. Geophys. Res. Space Phys. 2019, 124, 1491–1508. [Google Scholar] [CrossRef]
  6. Lühr, H.; Xiong, C.; Park, J.; Rauberg, J. Systematic study of intermediate-scale structures of equatorial plasma irregularities in the ionosphere based on CHAMP observations. Front. Phys. 2014, 2, 15. [Google Scholar] [CrossRef] [Green Version]
  7. Hysell, D.L.; Seyler, C.E. A renormalization group approach to estimation of anomalous diffusion in the unstable equatorial F region. J. Geophys. Res. 1998, 103, 26731–26738. [Google Scholar] [CrossRef]
  8. Tsunoda, R.T.; Livingston, R.C.; McClure, J.P.; Hanson, W.B. Equatorial plasma bubbles: Vertically elongated wedges from the bottomside F layer. J. Geophys. Res. 1982, 87, 9171–9180. [Google Scholar] [CrossRef] [Green Version]
  9. Kil, H.; Heelis, R.A.; Paxton, L.J.; Oh, S.J. Formation of a plasma depletion shell in the equatorial ionosphere. J. Geophys. Res. Space Phys. 2009, 114, A11302. [Google Scholar] [CrossRef]
  10. Tsunoda, R.T. Control of the seasonal and longitudinal occurrence of equatorial scintillations by the longitudinal gradient in integrated E region pedersen conductivity. J. Geophys. Res. 1985, 90, 447–456. [Google Scholar] [CrossRef]
  11. Prikryl, P.; Jayachandran, P.T.; Mushini, S.C.; Chadwick, R. Climatology of GPS phase scintillation and HF radar backscatter for the high-latitude ionosphere under solar minimum conditions. Ann. Geophys. 2011, 29, 377–392. [Google Scholar] [CrossRef] [Green Version]
  12. Jin, Y.; Moen, J.I.; Miloch, W.J. GPS scintillation effects associated with polar cap patches and substorm auroral activity: Direct comparison. J. Space Weather. Space Clim. 2014, 4, A23. [Google Scholar] [CrossRef]
  13. Jin, Y.; Moen, J.I.; Miloch, W.J. On the collocation of the cusp aurora and the GPS phase scintillation: A statistical study. J. Geophys. Res. Space Phys. 2015, 120, 9176–9191. [Google Scholar] [CrossRef]
  14. Kintner, P.M.; Seyler, C.E. The status of observations and theory of high latitude ionospheric and magnetospheric plasma turbulence. Space Sci. Rev. 1985, 41, 91–129. [Google Scholar] [CrossRef]
  15. Hysell, D.L.; Shume, E.B. Electrostatic plasma turbulence in the topside equatorial F region ionosphere. J. Geophys. Res. Space Phys. 2002, 107, 1269. [Google Scholar] [CrossRef] [Green Version]
  16. Hassam, A.B.; Hall, W.; Huba, J.D.; Keskinen, M.J. Spectral characteristics of interchange turbulence. J. Geophys. Res. 1986, 91, 13513–13522. [Google Scholar] [CrossRef]
  17. Zargham, S.; Seyler, C.E. Collisional and inertial dynamics of the ionospheric interchange instability. J. Geophys. Res. 1989, 94, 9009–9027. [Google Scholar] [CrossRef]
  18. Kraichnan, R.H. Inertial Ranges in Two-Dimensional Turbulence. Phys. Fluids 1967, 10, 1417–1423. [Google Scholar] [CrossRef] [Green Version]
  19. Kraichnan, R.H.; Montgomery, D. REVIEW ARTICLE: Two-dimensional turbulence. Rep. Prog. Phys. 1980, 43, 547–619. [Google Scholar] [CrossRef]
  20. Yokoyama, T.; Shinagawa, H.; Jin, H. Nonlinear growth, bifurcation, and pinching of equatorial plasma bubble simulated by three-dimensional high-resolution bubble model. J. Geophys. Res. Space Phys. 2014, 119, 10474–10482. [Google Scholar] [CrossRef] [Green Version]
  21. Yokoyama, T. A review on the numerical simulation of equatorial plasma bubbles toward scintillation evaluation and forecasting. Prog. Earth Planet. Sci. 2017, 4, 37. [Google Scholar] [CrossRef]
  22. Kelley, M.C. The Earth’s Ionosphere; Elsevier: Amsterdam, The Netherlands, 1989. [Google Scholar]
  23. Materassi, M.; Forte, B.; Coster, A.J.; Skone, S. (Eds.) The Dynamical Ionosphere; Elsevier: Amsterdam, The Netherlands, 2020. [Google Scholar]
  24. Tsunoda, R.T. High-latitude F-region irregularities: A review and synthesis. Rev. Geophys. 1988, 26, 719–760. [Google Scholar] [CrossRef] [Green Version]
  25. Sahr, J.D.; Fejer, B.G. Auroral electrojet plasma irregularity theory and experiment: A critical review of present understanding and future directions. J. Geophys. Res. 1996, 101, 26893–26910. [Google Scholar] [CrossRef]
  26. Hysell, D.L. An overview and synthesis of plasma irregularities in equatorial spread /F. J. Atmos. Sol. Terr. Phys. 2000, 62, 1037–1056. [Google Scholar] [CrossRef]
  27. Dyson, P.L.; McClure, J.P.; Hanson, W.B. In situ measurements of the spectral characteristics of F region ionospheric irregularities. J. Geophys. Res. 1974, 79, 1497. [Google Scholar] [CrossRef]
  28. Livingston, R.C.; Rino, C.L.; McClure, J.P.; Hanson, W.B. Spectral characteristics of medium-scale equatorial F region irregularities. J. Geophys. Res. 1981, 86, 2421–2428. [Google Scholar] [CrossRef]
  29. Cerisier, J.C.; Berthelier, J.J.; Beghin, C. Unstable density gradients in the high-latitude ionosphere. Radio Sci. 1985, 20, 755–761. [Google Scholar] [CrossRef]
  30. Hobara, Y.; Lefeuvre, F.; Parrot, M.; Molchanov, O.A. Low-latitude ionospheric turbulence observed by Aureol-3 satellite. Ann. Geophys. 2005, 23, 1259–1270. [Google Scholar] [CrossRef] [Green Version]
  31. Xiong, C.; Stolle, C.; Lühr, H.; Park, J.; Fejer, B.G.; Kervalishvili, G.N. Scale analysis of equatorial plasma irregularities derived from Swarm constellation. Earth Planets Space 2016, 68, 121. [Google Scholar] [CrossRef]
  32. Xiong, C.; Stolle, C.; Park, J. Climatology of GPS signal loss observed by Swarm satellites. Ann. Geophys. 2018, 36, 679–693. [Google Scholar] [CrossRef] [Green Version]
  33. Friis-Christensen, E.; Lühr, H.; Knudsen, D.; Haagmans, R. Swarm An Earth Observation Mission investigating Geospace. Adv. Space Res. 2008, 41, 210–216. [Google Scholar] [CrossRef]
  34. Stolle, C.; Lühr, H.; Rother, M.; Balasis, G. Magnetic signatures of equatorial spread F as observed by the CHAMP satellite. J. Geophys. Res. Space Phys. 2006, 111, A02304. [Google Scholar] [CrossRef]
  35. Xiong, C.; Lühr, H.; Ma, S.Y.; Stolle, C.; Fejer, B.G. Features of highly structured equatorial plasma irregularities deduced from CHAMP observations. Ann. Geophys. 2012, 30, 1259–1269. [Google Scholar] [CrossRef] [Green Version]
  36. Basu, S.; Basu, S. Equatorial scintillations: Advances since ISEA-6. J. Atmos. Terr. Phys. 1985, 47, 753–768. [Google Scholar] [CrossRef]
  37. Kelley, M.C.; Makela, J.J.; Ledvina, B.M.; Kintner, P.M. Observations of equatorial spread-F from Haleakala, Hawaii. Geophys. Res. Lett. 2002, 29, 2003. [Google Scholar] [CrossRef]
  38. Sahai, Y.; Fagundes, P.; Abalde, J.; Pimenta, A.; Bittencourt, J.; Otsuka, Y.; Rios, V. Generation of large-scale equatorial F-region plasma depletions during low range spread-F season. Ann. Geophys. 2004, 22, 15–23. [Google Scholar] [CrossRef] [Green Version]
  39. Hysell, D.L.; Burcham, J.D. JULIA radar studies of equatorial spread F. J. Geophys. Res. Space Phys. 1998, 103, 29155–29168. [Google Scholar] [CrossRef]
  40. Huang, C.Y.; Burke, W.J.; Machuzak, J.S.; Gentile, L.C.; Sultan, P.J. Equatorial plasma bubbles observed by DMSP satellites during a full solar cycle: Toward a global climatology. J. Geophys. Res. Space Phys. 2002, 107, 1434. [Google Scholar] [CrossRef]
  41. Burke, W.J.; Gentile, L.C.; Huang, C.Y.; Valladares, C.E.; Su, S.Y. Longitudinal variability of equatorial plasma bubbles observed by DMSP and ROCSAT-1. J. Geophys. Res. Space Phys. 2004, 109, A12301. [Google Scholar] [CrossRef]
  42. Burke, W.; Huang, C.; Gentile, L.; Bauer, L. Seasonal-longitudinal variability of equatorial plasma bubbles. Ann. Geophys. 2004, 22, 3089–3098. [Google Scholar] [CrossRef] [Green Version]
  43. Su, S.Y.; Liu, C.H.; Ho, H.H.; Chao, C.K. Distribution characteristics of topside ionospheric density irregularities: Equatorial versus midlatitude regions. J. Geophys. Res. Space Phys. 2006, 111, A06305. [Google Scholar] [CrossRef]
  44. Gentile, L.C.; Burke, W.J.; Rich, F.J. A climatology of equatorial plasma bubbles from DMSP 1989-2004. Radio Sci. 2006, 41. [Google Scholar] [CrossRef]
  45. Gentile, L.C.; Burke, W.J.; Rich, F.J. A global climatology for equatorial plasma bubbles in the topside ionosphere. Ann. Geophys. 2006, 24, 163–172. [Google Scholar] [CrossRef]
  46. Nishioka, M.; Saito, A.; Tsugawa, T. Occurrence characteristics of plasma bubble derived from global ground-based GPS receiver networks. J. Geophys. Res. Space Phys. 2008, 113. [Google Scholar] [CrossRef]
  47. Park, J.; Noja, M.; Stolle, C.; Lühr, H. The Ionospheric Bubble Index deduced from magnetic field and plasma observations onboard Swarm. Earth Planets Space 2013, 65, 1333–1344. [Google Scholar] [CrossRef] [Green Version]
  48. Park, J.; Min, K.W.; Kim, V.P.; Kil, H.; Lee, J.J.; Kim, H.J.; Lee, E.; Lee, D.Y. Global distribution of equatorial plasma bubbles in the premidnight sector during solar maximum as observed by KOMPSAT-1 and Defense Meteorological Satellite Program F15. J. Geophys. Res. Space Phys. 2005, 110, A07308. [Google Scholar] [CrossRef] [Green Version]
  49. Whalen, J.A. Dependence of equatorial bubbles and bottomside spread F on season, magnetic activity, and E × B drift velocity during solar maximum. J. Geophys. Res. Space Phys. 2002, 107, 1024. [Google Scholar] [CrossRef]
  50. De Michelis, P.; Consolini, G.; Tozzi, R. Magnetic field fluctuation features at Swarm’s altitude: A fractal approach. Geophys. Res. Lett. 2015, 42, 3100–3105. [Google Scholar] [CrossRef] [Green Version]
  51. Frisch, U. Turbulence: The Legacy of A.N. Kolmogorov; Cambridge University Press: Cambridge, UK, 1995. [Google Scholar]
  52. Consolini, G.; De Michelis, P.; Alberti, T.; Giannattasio, F.; Coco, I.; Tozzi, R.; Chang, T.T.S. On the Multifractal Features of Low-Frequency Magnetic Field Fluctuations in the Field-Aligned Current Ionospheric Polar Regions: Swarm Observations. J. Geophys. Res. Space Phys. 2020, 125, e27429. [Google Scholar] [CrossRef]
  53. Davis, A.; Marshak, A.; Wiscombe, W.; Cahalan, R. Multifractal characterizations of nonstationarity and intermittency in geophysical fields: Observed, retrieved, or simulated. J. Geophys. Res. Space Phys. 1994, 99, 8055–8072. [Google Scholar] [CrossRef]
  54. Basu, S.; MacKenzie, E.; Basu, S.; Coley, W.R.; Sharber, J.R.; Hoegy, W.R. Plasma structuring by the gradient drift instability at high latitudes and comparison with velocity shear driven processes. J. Geophys. Res. Space Phys. 1990, 95, 7799–7818. [Google Scholar] [CrossRef]
  55. Kraichnan, R.H. On Kolmogorov’s inertial-range theories. J. Fluid Mech. 1974, 62, 305–330. [Google Scholar] [CrossRef] [Green Version]
  56. Monin, A.S.; Yaglom, A.M. Statistical Fluid Mechanics: Mechanics of Turbulence; MIT Press: Cambridge, MA, USA, 1975. [Google Scholar]
  57. Rose, H.A.; Sulem, P.L. Fully developed turbulence and statistical mechanics. J. Phys. 1978, 39, 1938–1943. [Google Scholar] [CrossRef]
  58. De Michelis, P.; Pignalberi, A.; Consolini, G.; Coco, I.; Tozzi, R.; Pezzopane, M.; Giannattasio, F.; Balasis, G. On the 2015 St. Patrick’s Storm Turbulent State of the Ionosphere: Hints From the Swarm Mission. J. Geophys. Res. Space Phys. 2020, 125, e27934. [Google Scholar] [CrossRef]
  59. Pignalberi, A. TITIPy: A python tool for the calculation and mapping of topside ionosphere turbulence indices. Comput. Geosci. 2021, 104675. [Google Scholar] [CrossRef]
  60. Jin, Y.; Spicher, A.; Xiong, C.; Clausen, L.B.N.; Kervalishvili, G.; Stolle, C.; Miloch, W.J. Ionospheric Plasma Irregularities Characterized by the Swarm Satellites: Statistics at High Latitudes. J. Geophys. Res. Space Phys. 2019, 124, 1262–1282. [Google Scholar] [CrossRef]
  61. Piersanti, M.; De Michelis, P.; Del Moro, D.; Tozzi, R.; Pezzopane, M.; Consolini, G.; Marcucci, M.F.; Laurenza, M.; Di Matteo, S.; Pignalberi, A.; et al. From the Sun to Earth: Effects of the 25 August 2018 geomagnetic storm. Ann. Geophys. 2020, 38, 703–724. [Google Scholar] [CrossRef]
  62. Chang, T.S. An Introduction to Space Plasma Complexity; Cambridge University Press: Cambridge, UK, 2015. [Google Scholar]
  63. Wu, C.C.; Chang, T. Dynamical evolution of coherent structures in intermittent two-dimensional MHD turbulence. IEEE Trans. Plasma Sci. 2000, 28, 1938–1943. [Google Scholar] [CrossRef]
  64. Chang, T.; Tam, S.W.Y.; Wu, C.C. Complexity induced anisotropic bimodal intermittent turbulence in space plasmas. Phys. Plasmas 2004, 11, 1287–1299. [Google Scholar] [CrossRef] [Green Version]
  65. Pécseli, H.L. Spectral properties of electrostatic drift wave turbulence in the laboratory and the ionosphere. Ann. Geophys. 2015, 33, 875–900. [Google Scholar] [CrossRef]
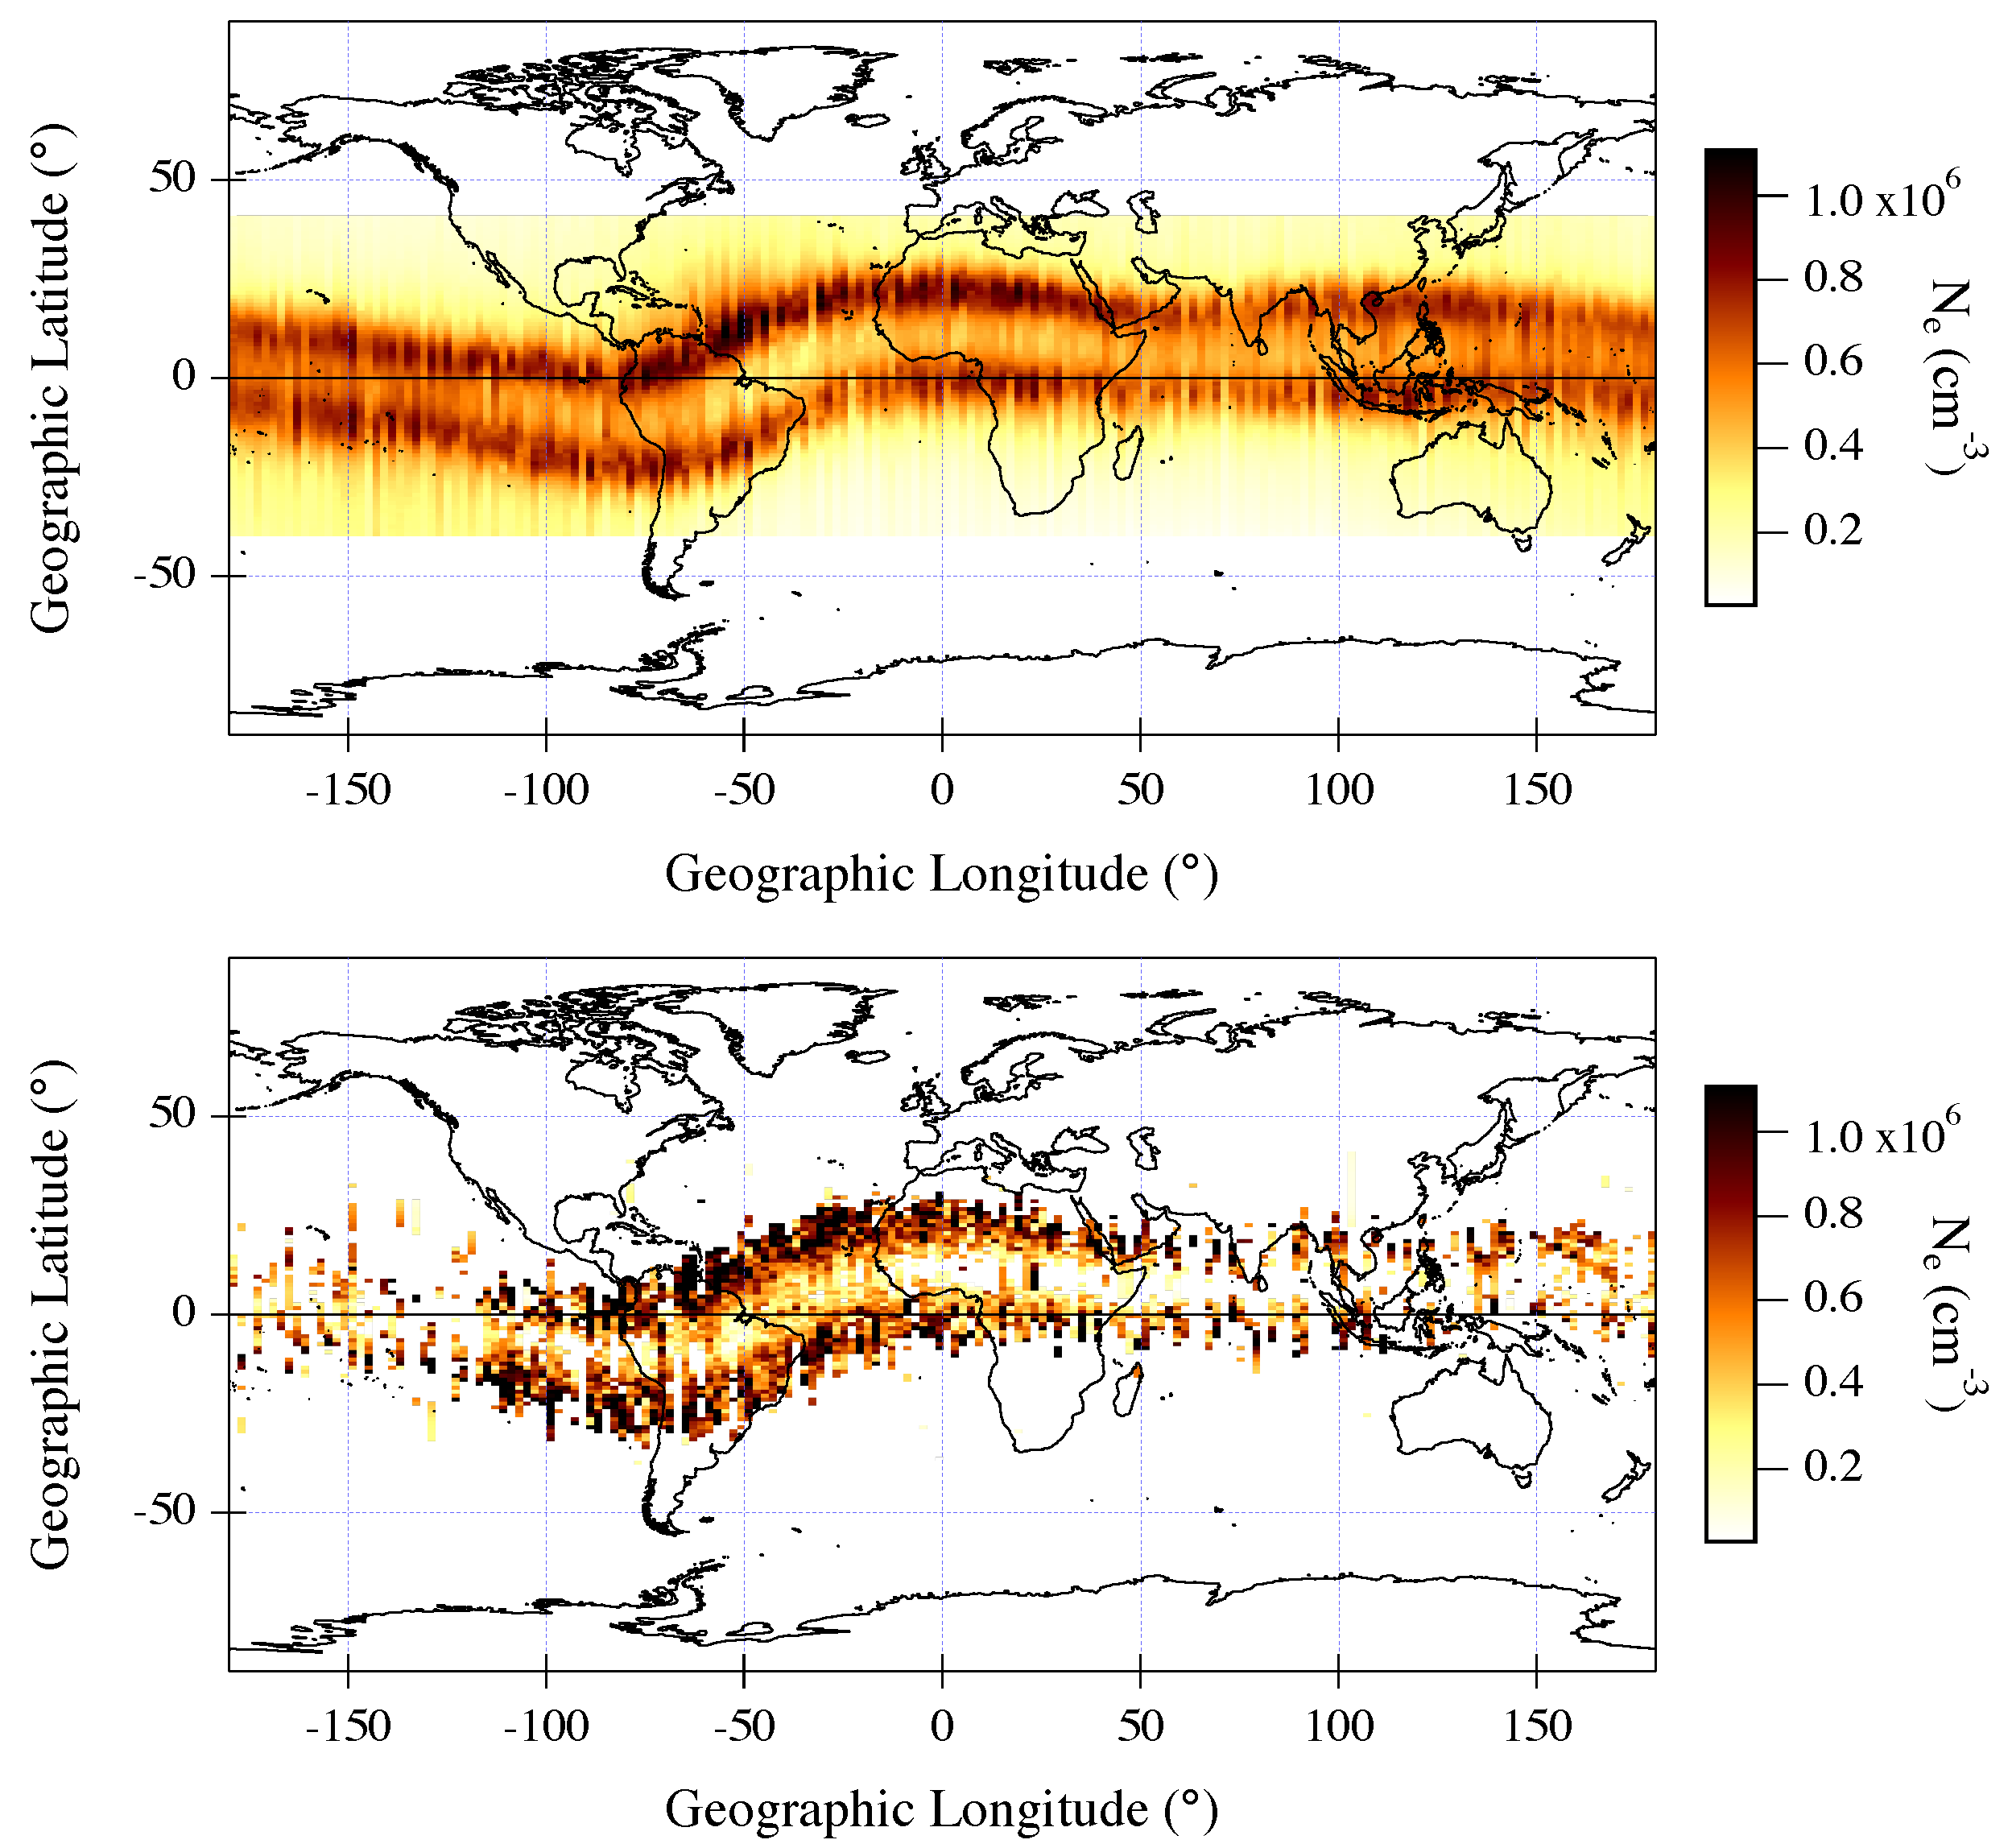
Figure 1. Top panel: Global accumulated plot of N e values as recorded on board Swarm A from April 2014 to 31 January 2016, for K p 3 and between 18:00 and 24:00 LT. Bottom panel: Accumulated plot of the subset of N e values corresponding to IBI = 1 and BF = 1, and therefore to the presence of plasma bubbles, over the same time interval considered in the top panel.
Remotesensing 13 00759 g001
Figure 2. (Top): γ ( 2 ) values associated with electron density data selected according to the following conditions: 18:00–24:00 LT, ± 40 geographic latitude, K p 3 in the latitude–longitude plane (left) and corresponding probability density (right). (Bottom): γ ( 2 ) values for electron density data associated with plasma bubbles in the latitude–longitude plane (left) and corresponding probability density (right).
Remotesensing 13 00759 g002
Figure 3. (Top): Intermittency values for electron density data selected under the following conditions: 18:00–24:00 LT, ± 40 geographic latitude, and K p 3 in the latitude–longitude plane (left) and corresponding probability density (right). (Bottom): Intermittency values for electron density data associated with plasma bubbles in the latitude–longitude plane (left) and corresponding probability density (right).
Remotesensing 13 00759 g003
Figure 4. (Top): Rate of change Of electron Density Index (RODI) values associated with electron density data selected under the following conditions: 18:00–24:00 LT, ± 40 geographic latitude, and K p 3 in the latitude–longitude plane (left) and corresponding probability density (right). (Bottom): RODI values associated with the plasma bubbles in the latitude–longitude plane (left) and corresponding probability density (right).
Remotesensing 13 00759 g004
Figure 5. Joint probability densities between RODI and γ ( 2 ) (on the left) and between RODI and Intermittency (on the right) inside plasma bubbles.
Remotesensing 13 00759 g005
Publisher’s Note: MDPI stays neutral with regard to jurisdictional claims in published maps and institutional affiliations.