Article

Impact of Lightning Data Assimilation on the Short-Term Precipitation Forecast over the Central Mediterranean Sea

by
Rosa Claudia Torcasio
1,
Stefano Federico
1,*,
Albert Comellas Prat
2,
Giulia Panegrossi
1,
Leo Pio D'Adderio
1 and
Stefano Dietrich
1
1
National Research Council of Italy—Institute of Atmospheric Sciences and Climate (CNR-ISAC), via del Fosso del Cavaliere 100, 00133 Rome, Italy
2
National Research Council of Italy—Institute of Atmospheric Sciences and Climate (CNR-ISAC), Strada Prov. le Lecce-Monteroni, 73100 Lecce, Italy
*
Author to whom correspondence should be addressed.
Remote Sens. 2021, 13(4), 682; https://doi.org/10.3390/rs13040682
Submission received: 28 December 2020 / Revised: 31 January 2021 / Accepted: 9 February 2021 / Published: 13 February 2021
(This article belongs to the Special Issue Satellite Observation for Atmospheric Modeling)

Abstract

:
Lightning data assimilation (LDA) is a powerful tool to improve the weather forecast of convective events and has been widely applied with this purpose in the past two decades. Most of these applications refer to events hitting coastal and land areas, where people live. However, a weather forecast over the sea has many important practical applications, and this paper focuses on the impact of LDA on the precipitation forecast over the central Mediterranean Sea around Italy. The 3 h rapid update cycle (RUC) configuration of the weather research and forecasting (WRF) model) has been used to simulate the whole month of November 2019. Two sets of forecasts have been considered: CTRL, without lightning data assimilation, and LIGHT, which assimilates data from the LIghtning detection NETwork (LINET). The 3 h precipitation forecast has been compared with observations of the Integrated Multi-satellitE Retrievals for Global Precipitation Mission (GPM) (IMERG) dataset and with rain gauge observations recorded in six small Italian islands. The comparison of CTRL and LIGHT precipitation forecasts with the IMERG dataset shows a positive impact of LDA. The correlation between predicted and observed precipitation improves over wide areas of the Ionian and Adriatic Seas when LDA is applied. Specifically, the correlation coefficient for the whole domain increases from 0.59 to 0.67, and the anomaly correlation (AC) improves by 5% over land and by 8% over the sea when lightning is assimilated. The impact of LDA on the 3 h precipitation forecast over six small islands is also positive. LDA improves the forecast by both decreasing the false alarms and increasing the hits of the precipitation forecast, although with variability among the islands. The case study of 12 November 2019 (time interval 00–03 UTC) has been used to show how important the impact of LDA can be in practice. In particular, the shifting of the main precipitation pattern from land to the sea caused by LDA gives a much better representation of the precipitation field observed by the IMERG precipitation product.

1. Introduction

Precipitation is one of the key elements of the hydrological, cycle and it is an important phenomenon that affects human lives. It is then critical to provide precipitation forecast for different time horizons. A short-range precipitation forecast is fundamental for flood forecasting, early warning, and hydrological applications [1,2,3,4].
Numerical weather prediction (NWP) models use the physical descriptions of the many atmospheric processes and have been used for the short-term forecast of precipitation [5,6,7,8]. NWP models have improved significantly in recent years both in their physical parameterizations and in their spatial resolutions, thanks to the continuous advancement of the knowledge and of the computational resources [9,10,11].
Despite the continuous improvement of NWP, the accurate prediction of high-impact weather is one of the challenges of state-of-the-art numerical weather prediction (NWP) models [12,13,14]. The NWP models for short-range forecasting purposes require more observational data and effective assimilation methods to overcome the spin-up problems [10,11]. Thanks to the ever-increasing computing power and to the possibility of assimilating different types of observations, the forecast of severe weather events has improved constantly in the past decades [15,16].
Lightning data have been widely used in the past two decades and have some advantages compared to other sources of data [17,18]. For example, an important source of data to improve effectively the precipitation forecast at short range is given by radars (reflectivity and radial winds) [19,20,21,22]. However, compared to lightning data assimilation (LDA), the assimilation of radar data is achieved through more sophisticated and computationally expensive techniques, such as three-dimensional variational assimilation (3DVAR) [23,24] and the ensemble Kalman filter [20,25,26]. Flashes are observed with a sub-kilometric position error (this error is less than the spatial horizontal resolution of the meteorological model used in this paper, i.e., 3 km) and time (the detection of the strokes is instantaneous and much lower than the time step used in meteorological models). Since lightning is associated with convective activity, a positioning of the lightning in space and time gives a positioning of the most intense convective areas in meteorological systems [27,28]. Lightning data are simple to transfer and do not require a wide-band network connection. The process of computing the lightning position from the electromagnetic signals detected by sensors is fast, making lightning observations available in real time.
For the above reasons, LDA is suitable for improving the forecast of intense convective weather events in rapid update cycle (RUC) data assimilation systems. Broadly speaking, LDA can be divided into two classes: LDA in models parameterizing convection (horizontal resolution > 3–5 km) and LDA in models explicitly resolving the convection (horizontal resolution < 3–5 km) [18,29,30].
The first attempts to assimilate lightning in NWP models were based on relationships between lightning and the rainfall rate estimated by microwave sensors on board polar-orbiting satellites [31,32,33,34]. These studies demonstrated not only the ability of LDA to improve the precipitation forecast but also the improvement of large-scale field forecasts, such as sea-level pressure. Benjamin et al. [35] used rain rates as a proxy for lightning and implemented LDA in an RUC data assimilation system. Papadopoulos et al. [36] used lightning to locate convection, and the simulated water vapor profile was nudged toward vertical profiles recorded during convective events. Mansell et al. [17] used lightning data to control the triggering function within the Kain–Fritch cumulus scheme [37] as a function of the flash rate. This method can also suppress the activation of the cumulus parameterization scheme whenever the model simulates unobserved lightning. The same method was also applied by Giannaros et al. [38] for eight events over Greece, showing improvement of the precipitation forecast given by LDA up to 24 h.
Fierro et al. [29] were the first to consider LDA in a convection resolving model (the weather research and forecasting (WRF) model at a 3 km horizontal resolution) using a methodology that imposed incremental increases in water vapor mass in the mixed-phase region (0 °C–20 °C layer) based on observed lightning flash density rates and simulated graupel mixing ratio. This same nudging method was applied for over 70 days during the 2013 warm season over the contiguous United States, showing the important and positive impact of LDA for a prolonged forecast period [39]. Fierro et al. [40] improved the forecast of a derecho event up to 6 h with LDA and showed that LDA can be comparable to that of three-dimensional variational assimilation (3DVAR) of radar data (radial winds and reflectivity factor).
Qie et al. [41] adapted the nudging function of Fierro et al. [29] to adjust graupel, snow, and ice crystal mixing ratios and applied it to a quasi-linear convective system over northern China, showing that the assimilation of graupel, snow, and ice crystals is important for outflow-dominated events.
Chen et al. [42] proposed a data assimilation scheme, based on the functions of Fierro et al. [29] and Qie et al. [41], which takes into account the dynamical and thermodynamic conditions.
Federico et al. [8] implemented the method of Fierro et al. [29] in the regional atmospheric modeling system (RAMS) model and obtained a substantial improvement of the quantitative precipitation forecast (QPF) for 20 cases over Italy that occurred during Hydrological Mediterranean Experiment-Special Observing Period 1 (HyMeX-SOP1) [43]. Recently, Comellas Prat et al. [30], using the WRF model, applied the method of Fierro et al. [29] to evaluate the impact of LDA for three case studies of severe weather that occurred over Italy. The three cases span a range of convective precipitation from a long-lived, wide-area intense-precipitation event to a heavy and localized rainfall case. WRF was used in an RUC data assimilation system (3 h and 6 h forecast). The LDA improved the quantitative precipitation forecast in all cases and for both temporal ranges.
The Mediterranean area is prone to heavy precipitation, and floods and flash floods are the most common and dangerous natural hazard in the area [44]. Several research studies have been carried out to explore these events in the Mediterranean. The HyMeX project [43,45] and previously the MEDEX (The Mediterranean Experiment) project [46] considered the water cycle in the Mediterranean basin, and the study of floods and flash floods were among the main topics of both projects.
Heavy-rainfall events over the Mediterranean occur mainly in fall and winter and have been reported in numerous papers ([44,47,48,49,50,51,52,53,54,55], among many others). The role of the Mediterranean Sea in heavy-precipitation storms has been also considered in the literature [56,57,58,59]. Because the Mediterranean Sea is a warm sea, it feeds the cyclones with large amounts of water vapor, reinforcing the cyclones and increasing their lifetime [60]. Often, storms form over the Mediterranean Sea [61,62,63], or spend most of their lifetime over the sea, as in the case of Medicanes [64,65,66], and are then advected toward land, causing floods, windstorm, and surges. For these cases, the air–sea interaction plays a major role in the storm evolution.
A better high-impact weather forecast over the sea would result in a more realistic simulation of its impact once it hits the coast and would be of practical importance for many sea-related activities (fishery, navigation, tourism, etc.). LDA is particularly important for improving the weather forecast over the Mediterranean Sea, considering that the ground-based radar coverage is not enough for monitoring weather systems more than 100–150 km away from the radar position and the evolution of weather systems over the Mediterranean Sea is partially unobserved by the Italian radars. For this reason, the impact of radar data assimilation over the Mediterranean Sea is limited and LDA plays a significant role in improving the weather forecast.
Thanks to the advent of the international Global Precipitation Measurement (GPM) mission [67,68], a new set of global precipitation products has become available for the meteorological scientific community. The GPM satellite constellation is made up of an ever-growing number of low-Earth-orbit (LEO) satellites equipped with cross-track and conical passive microwave (PMW) radiometers. The main satellite of the constellation is the NASA/JAXA (National Aeronautics and Space Administration/Japan Aerospace Exploration Agency) GPM Core Observatory (GPM-CO), which carries the most technologically advanced radiometer, the GPM Microwave Imager (GMI), and the dual-frequency Ku/Ka-band precipitation radar (DPR). The potential of the GPM constellation to analyze precipitation systems over the Mediterranean region (land and sea) has been demonstrated in several studies [69]. For instance, Panegrossi et al. [70] demonstrated the value of using precipitation retrievals from the GPM constellation for monitoring the evolution of different severe weather systems, in particular over sea regions or coastal areas with complex orography. On the other hand, Marra et al. [62] showed the capabilities of a single GPM-CO overpass over a violent hailstorm that developed offshore in front of Naples to capture in fine detail basic characteristics of the exceptional event, which was completely missed by numerical weather forecasting models. Furthermore, making use also of RAMS model forecasts, Marra et al. [64] documented how the PMW and DPR data from the GPM constellation can be fruitful to analyze the life cycle of the tropical-like cyclone (TLC) Numa, which developed on the Ionian Sea during 15–19 November 2017.
Apart from the insight that the information from these space-borne platforms provides for the study of individual weather events, the combination of the different sensor measurements offers unique and consistent precipitation estimations, which, combined with geosynchronous Earth orbit (GEO) infrared (IR) observations over the globe, provide precipitation products of unprecedented high spatial and temporal resolutions across the globe, such as the Integrated Multi-satellitE Retrievals for GPM (IMERG) [71].
In this paper, we focus on the impact of LDA on the short-term (3 h) precipitation forecast over the Mediterranean Sea using the WRF model. The rainfall forecast is verified against the IMERG dataset (Final Run) and by the rain gauge precipitation recorded at six stations located over small islands around the Italian peninsula.
The paper is organized as follows: In Section 2, we introduce the WRF model configuration and the IMERG dataset. Section 3 shows the results comparing the WRF precipitation forecast, with or without LDA, with the data from IMERG and from the rain gauges located in small Italian islands in the central Mediterranean Sea. Conclusions are reported in Section 4.

2. Datasets and Methodology

2.1. Satellite Precipitation Data

To perform the evaluation of the 3 h precipitation forecast over the sea, observational data were obtained from the IMERG Final Run (version 06B) at a horizontal resolution of 0.1° × 0.1° (about 10 × 10 km2) and a temporal resolution of 30 min from the Goddard Earth Sciences Data and Information Services Center (GES DISC) website. We used the complete calibrated precipitation field from the post-real-time final run product, which is the satellite-gauge combination available ~3.5 months after the observation month. To calculate it, first the precipitation estimates are computed using the Goddard Profiling Algorithm (GPROF2017) from the various satellite passive microwave sensors comprising the GPM constellation. These are then intercalibrated to the Combined Ku Radar-Radiometer Algorithm (CORRA) product, forward- and backward-morphed, and combined with microwave precipitation-calibrated GEO-IR fields, to be finally adjusted with seasonal Global Precipitation Climatology Project (GPCP) Satellite-Gauge (SG) surface precipitation data to provide the global half-hourly dataset [71].

2.2. Model Setup and Lightning Data Assimilation Procedure

The numerical model used in this study is the WRF model with advanced WRF dynamic (WRF-ARW), version 4.1.3 [72]. The simulations were conducted on one single domain, with 531 × 531 grid points and 42 vertical levels, with a model top at 50 hPa. The model domain (Figure 1) covers the central Mediterranean and the whole Italian territory and has a horizontal grid spacing of 3 km.
The physical schemes employed include the new Thompson microphysics scheme [73], the Yonsei University boundary layer scheme [74], the five-layer thermal diffusion for land surface processes scheme, the revised MM5 Monin–Obukhov scheme for surface layer physics [75], the Dudhia scheme [76], and the rapid radiative transfer model (RRTM) [77] as shortwave and longwave radiation schemes. No cumulus parameterization was activated.
The 3 h 0.25° operational analysis/forecast cycle, issued at 12 UTC on the day before each day of forecast, from the integrated forecast system (IFS) global model of the European Centre for Medium-Range Weather Forecasts (ECMWF) was used as initial and lateral boundary conditions.
To assess the impact of LDA on the precipitation forecast over the sea, we selected the period from 2 to 30 November 2019. This is because this period was characterized by abundant precipitation over Italy, especially in the first 20 days of the month.
For all the simulations, we employed a 3 h rapid update cycle (RUC) data assimilation scheme. The RUC configuration was chosen because LDA impacts the weather forecast mainly in the short range [38,39,78]. We ran two configurations for each forecast: the first, named CTRL, without LDA, and the second, named LIGHT, with LDA. Each simulation spanned a 9 h period after its initialization time. The first 6 h of each simulation were used for LDA in the LIGHT simulations and to spin-up the model for both configurations, while the last 3 h were used for the forecast. Therefore, eight simulations were needed to cover the forecast for a full day.
Lightning data used for assimilation were provided by the LIghtning detection NETwork (LINET) [79]). LINET includes more than 500 stations worldwide, more than 200 of which are in Europe. This network covers the Italian territory and the western Mediterranean Sea. LINET sensors detect very low frequency (VLF) and low-frequency (LF) waves emitted during the flash. LINET is a total lightning system since it is able to measure both intra-cloud (IC) and cloud-to-ground (CG) discharges. The data processing technique follows a 3D method (TOA, Time of Arrival, method, [80]), by which the height of IC lightning is also calculated. Position accuracy is about 75 m for CG lightning. All discharges recorded within a 1 s period and within a 10 km radius are considered as a single flash for data assimilation [81].
For LDA, we followed the method of Fierro et al. [29], based on nudging. The modeled water vapor is compared with that calculated by the following equation:
q v = A q s + B q s tanh ( C X ) ( 1 tanh ( D q g α ) )
In this experiment, the coefficients were set to A = 0.95, B = 0.07, C = 0.25, D = 0.25, and α = 2.2. The term qs represents the saturation water vapor content at model atmospheric temperature, while qg is the graupel mixing ratio (g kg−1). X is the number of total flashes per grid cell in each assimilation interval (10 min). The water vapor mixing ratio of Equation (1) increases with the flash rate (X) and decreases with the graupel mixing ratio (qg). Simulated water vapor is nudged to the water vapor calculated by Equation (1) when the latter is higher than the modeled one. The physical meaning of Equation (1) and nudging is that (a) the mixing ratio nudged by WRF increases as the flash rate increases, and (b) a convective environment is already represented in the model when graupel is simulated and the nudging term must decrease as the WRF graupel mixing ratio increases.
Setting A = 0.95 in Equation (1) gives a water vapor mixing ratio saturated or close to saturation, depending on the flash rate and graupel mixing ratio. When lightning is observed, the atmospheric column is saturated or close to saturation between the lifting condensation level (LCL) and −20 °C, the latter being the top of the charging zone [29]. For this reason, we change the modeled mixing ratio only when it is necessary to bring it close to saturation. In Fierro et al. [29], this substitution is done between 0 °C and −20°C. However, in recent studies [18,82], a vertical level below 0 °C has been employed as the lower level for LDA. In particular, in Fierro et al. [18], the LCL is employed as the lower level for assimilation. When using 0 °C, the level at which water vapor adjustment starts can be too high, resulting in worse performance compared to the LCL height. In this study, the assimilation is performed between the LCL and −20 °C and LDA is performed every 10 min within the assimilation period (first 6 h of each run).
The idea behind this setting is to maximize the impact of LDA on the forecast. Comellas Prat et al. [30], using a similar WRF setting, showed that choosing A = 0.85 (B = 0.17, i.e., A + B = 1.02) resulted in worse performance compared to A = 0.95 (B = 0.07), the latter giving more weight to LDA. We performed similar tests for some cases of November 2019 (not shown), and the results reveal that A = 0.95 (B = 0.0.7) gives a better precipitation forecast compared to A = 0.85 (B = 0.17). Using values of A greater than 0.95 gives more weight to LDA, but the model becomes computationally unstable for some cases. For these reasons, A = 0.95 (B = 0.07) has been used in this study. The coefficients C, D, and α were set in Fierro et al. [29] after careful research. A different setting of these values would require a large number of simulations and is out of the scope of this paper.
In this work, WRF was set up with 42 vertical levels, while in a similar study [30], we used 60 vertical levels. Increasing the number of levels would likely lead to a better forecast but would also increase the computational cost. In this work, the number of vertical levels is a compromise between forecast accuracy and computational resources. In addition, to have an idea of the distribution of WRF vertical levels, we note that there are between 7 and 15 vertical levels in the layer 0/−20 °C, depending on the date.

3. Results

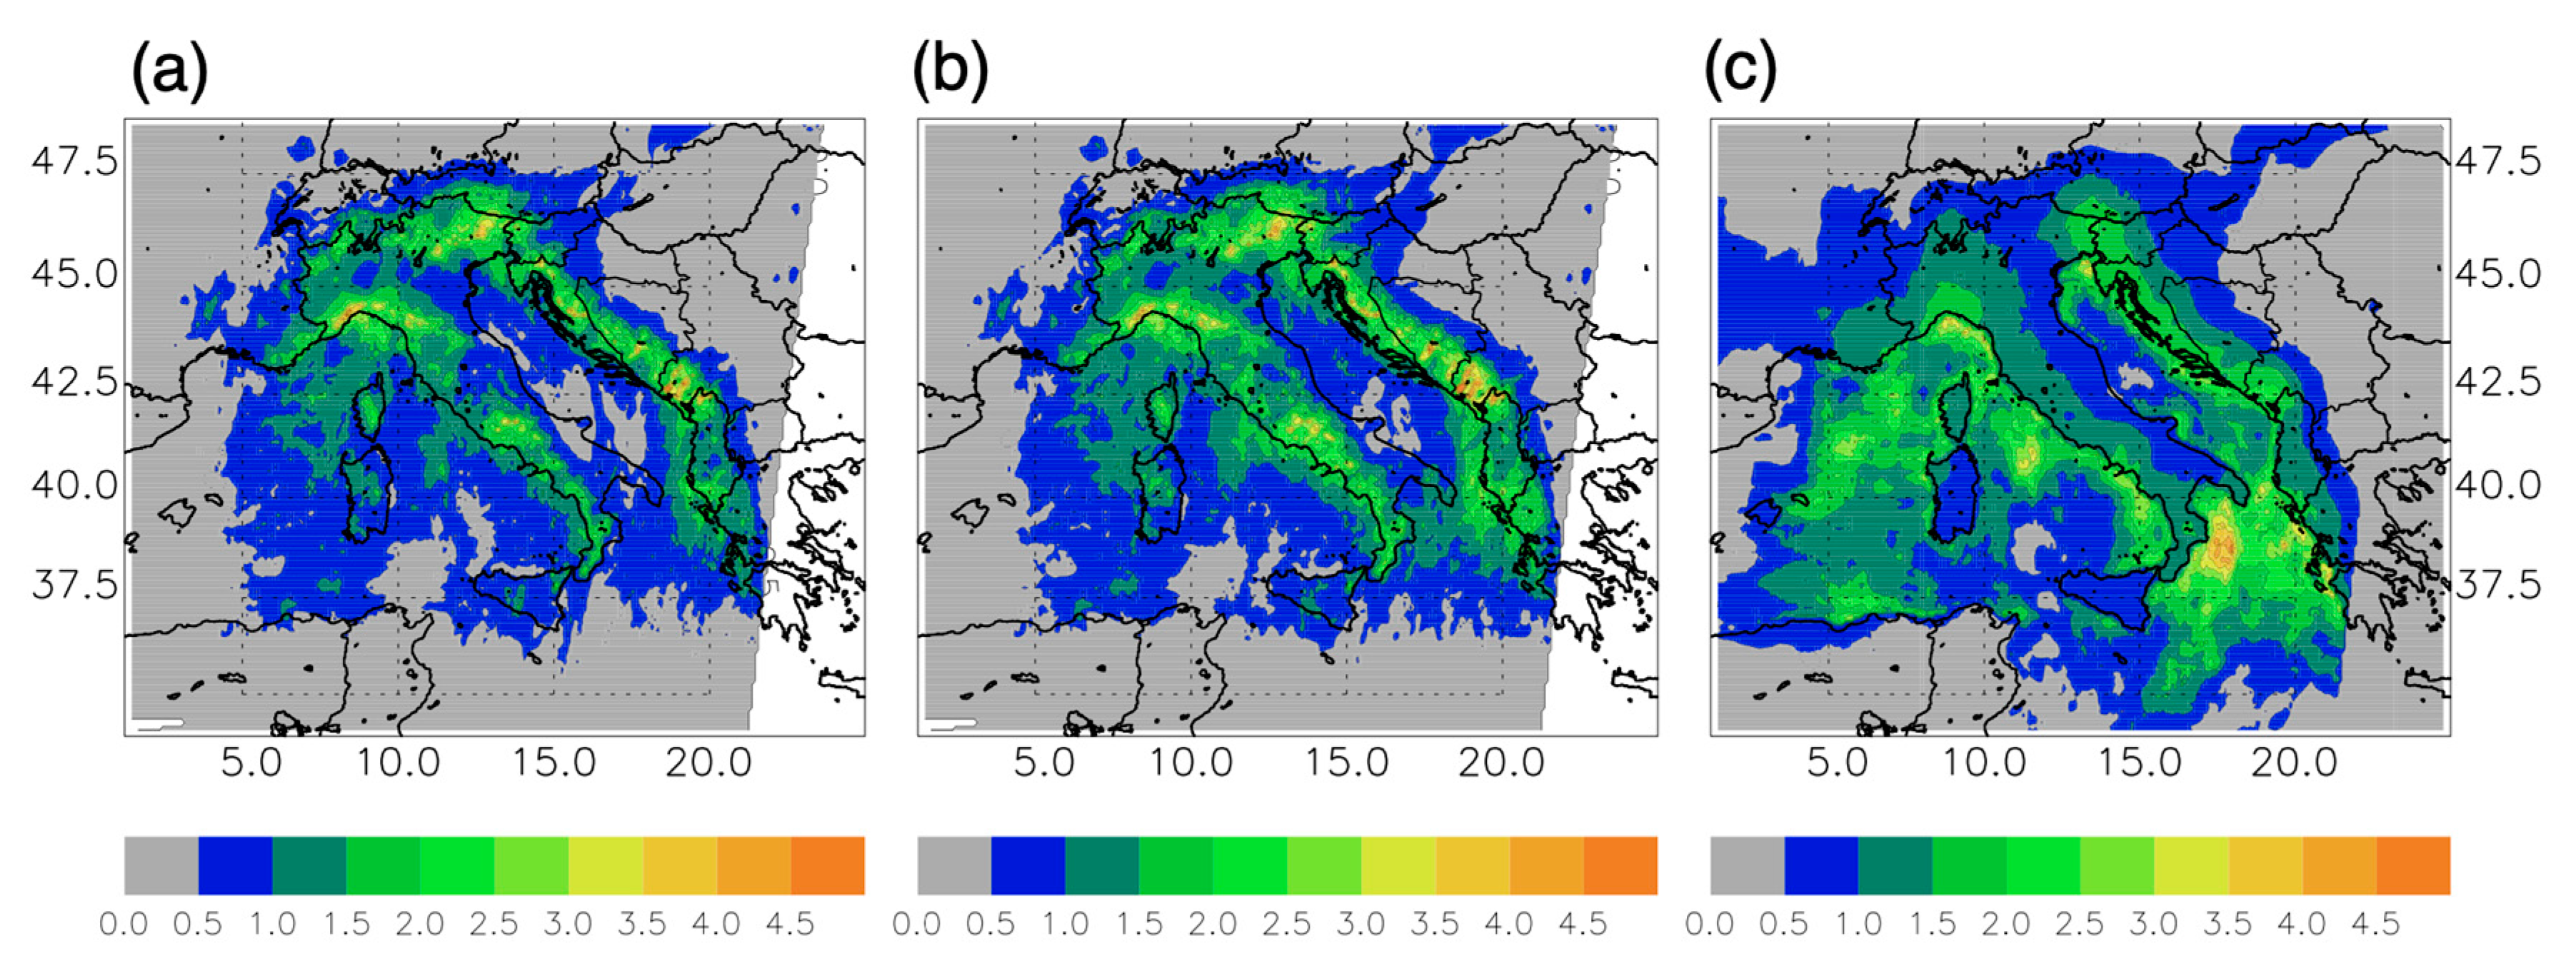
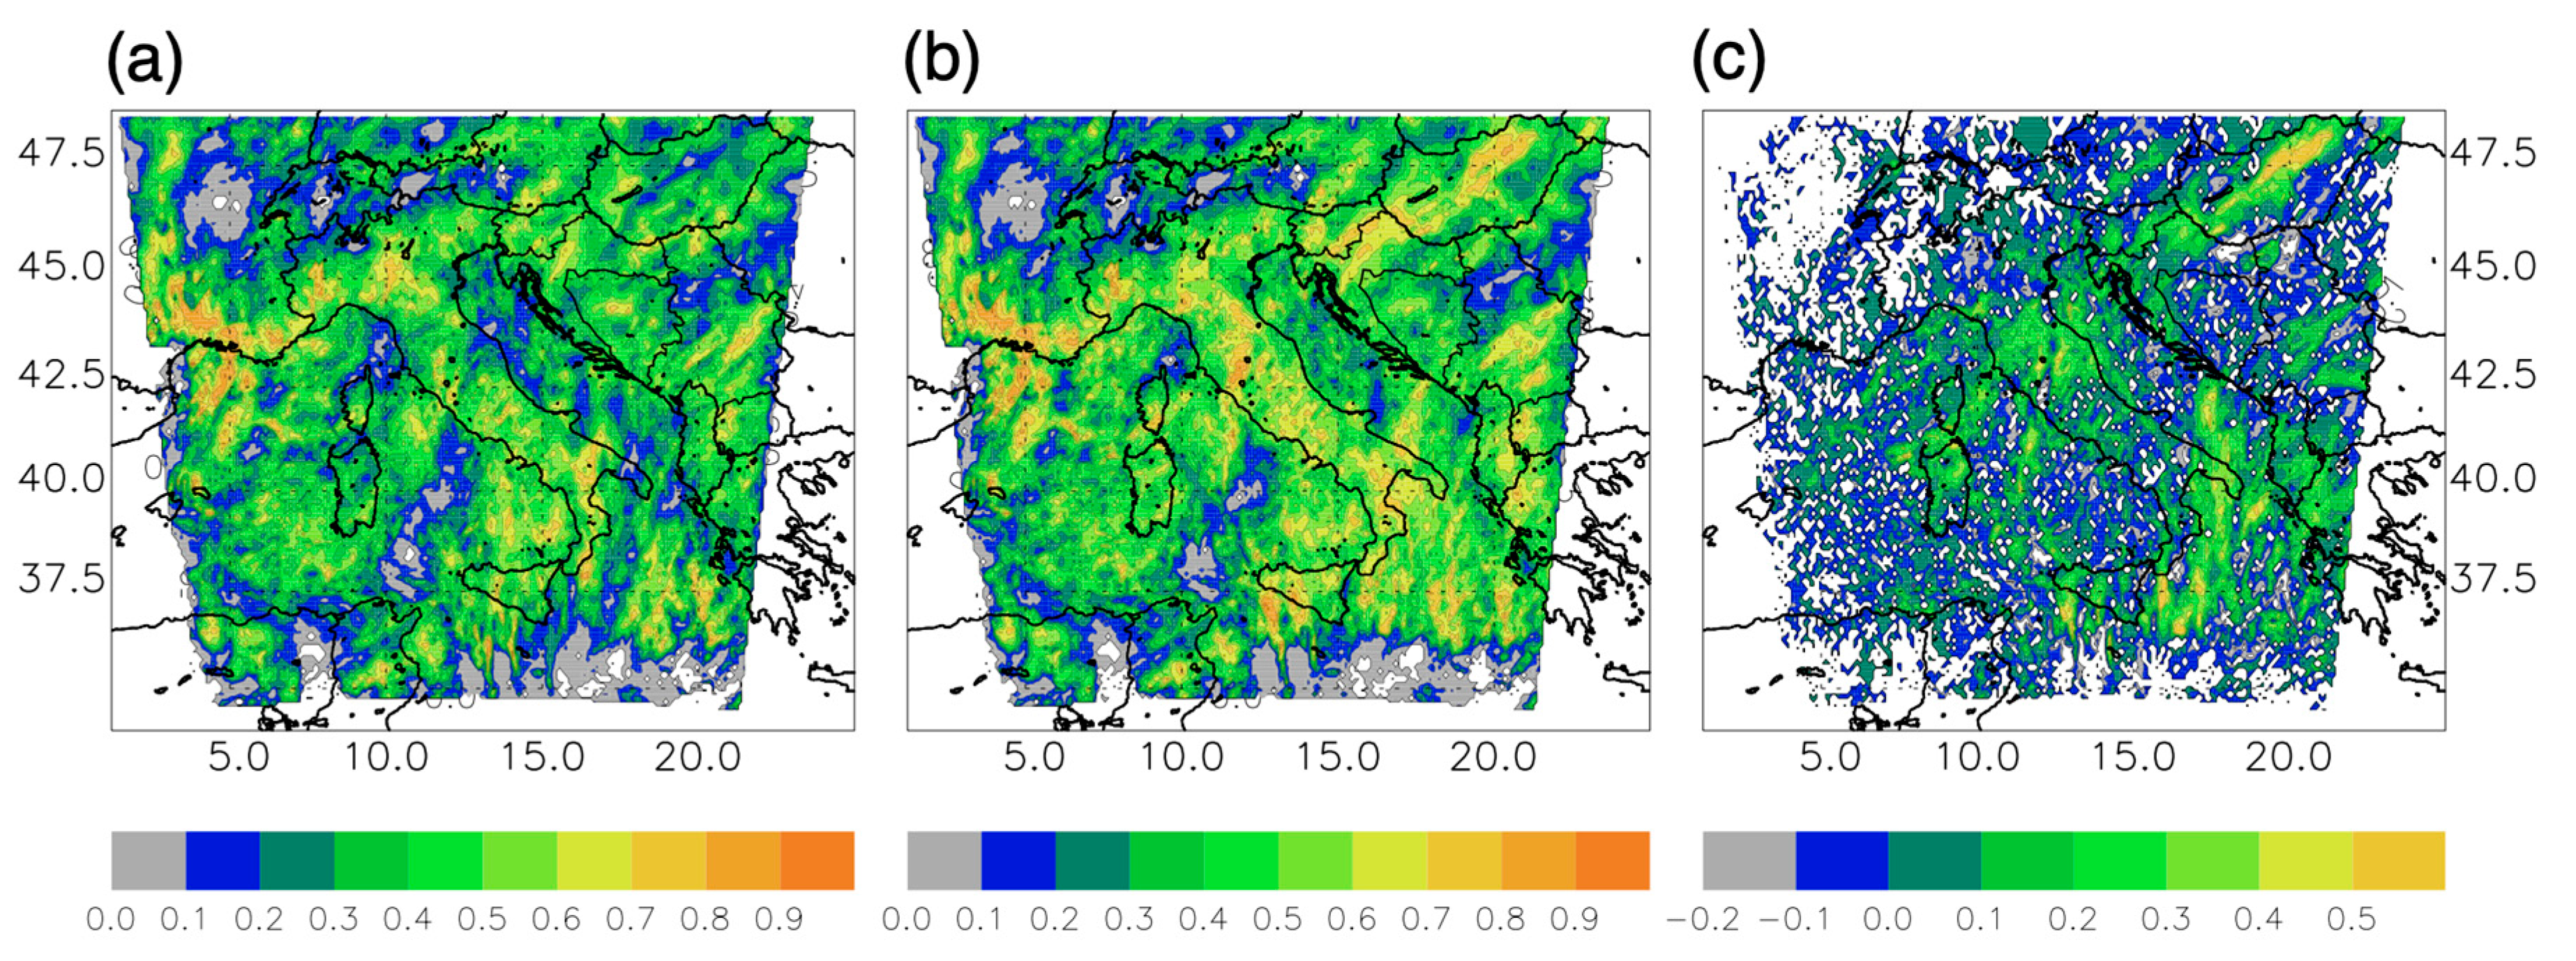
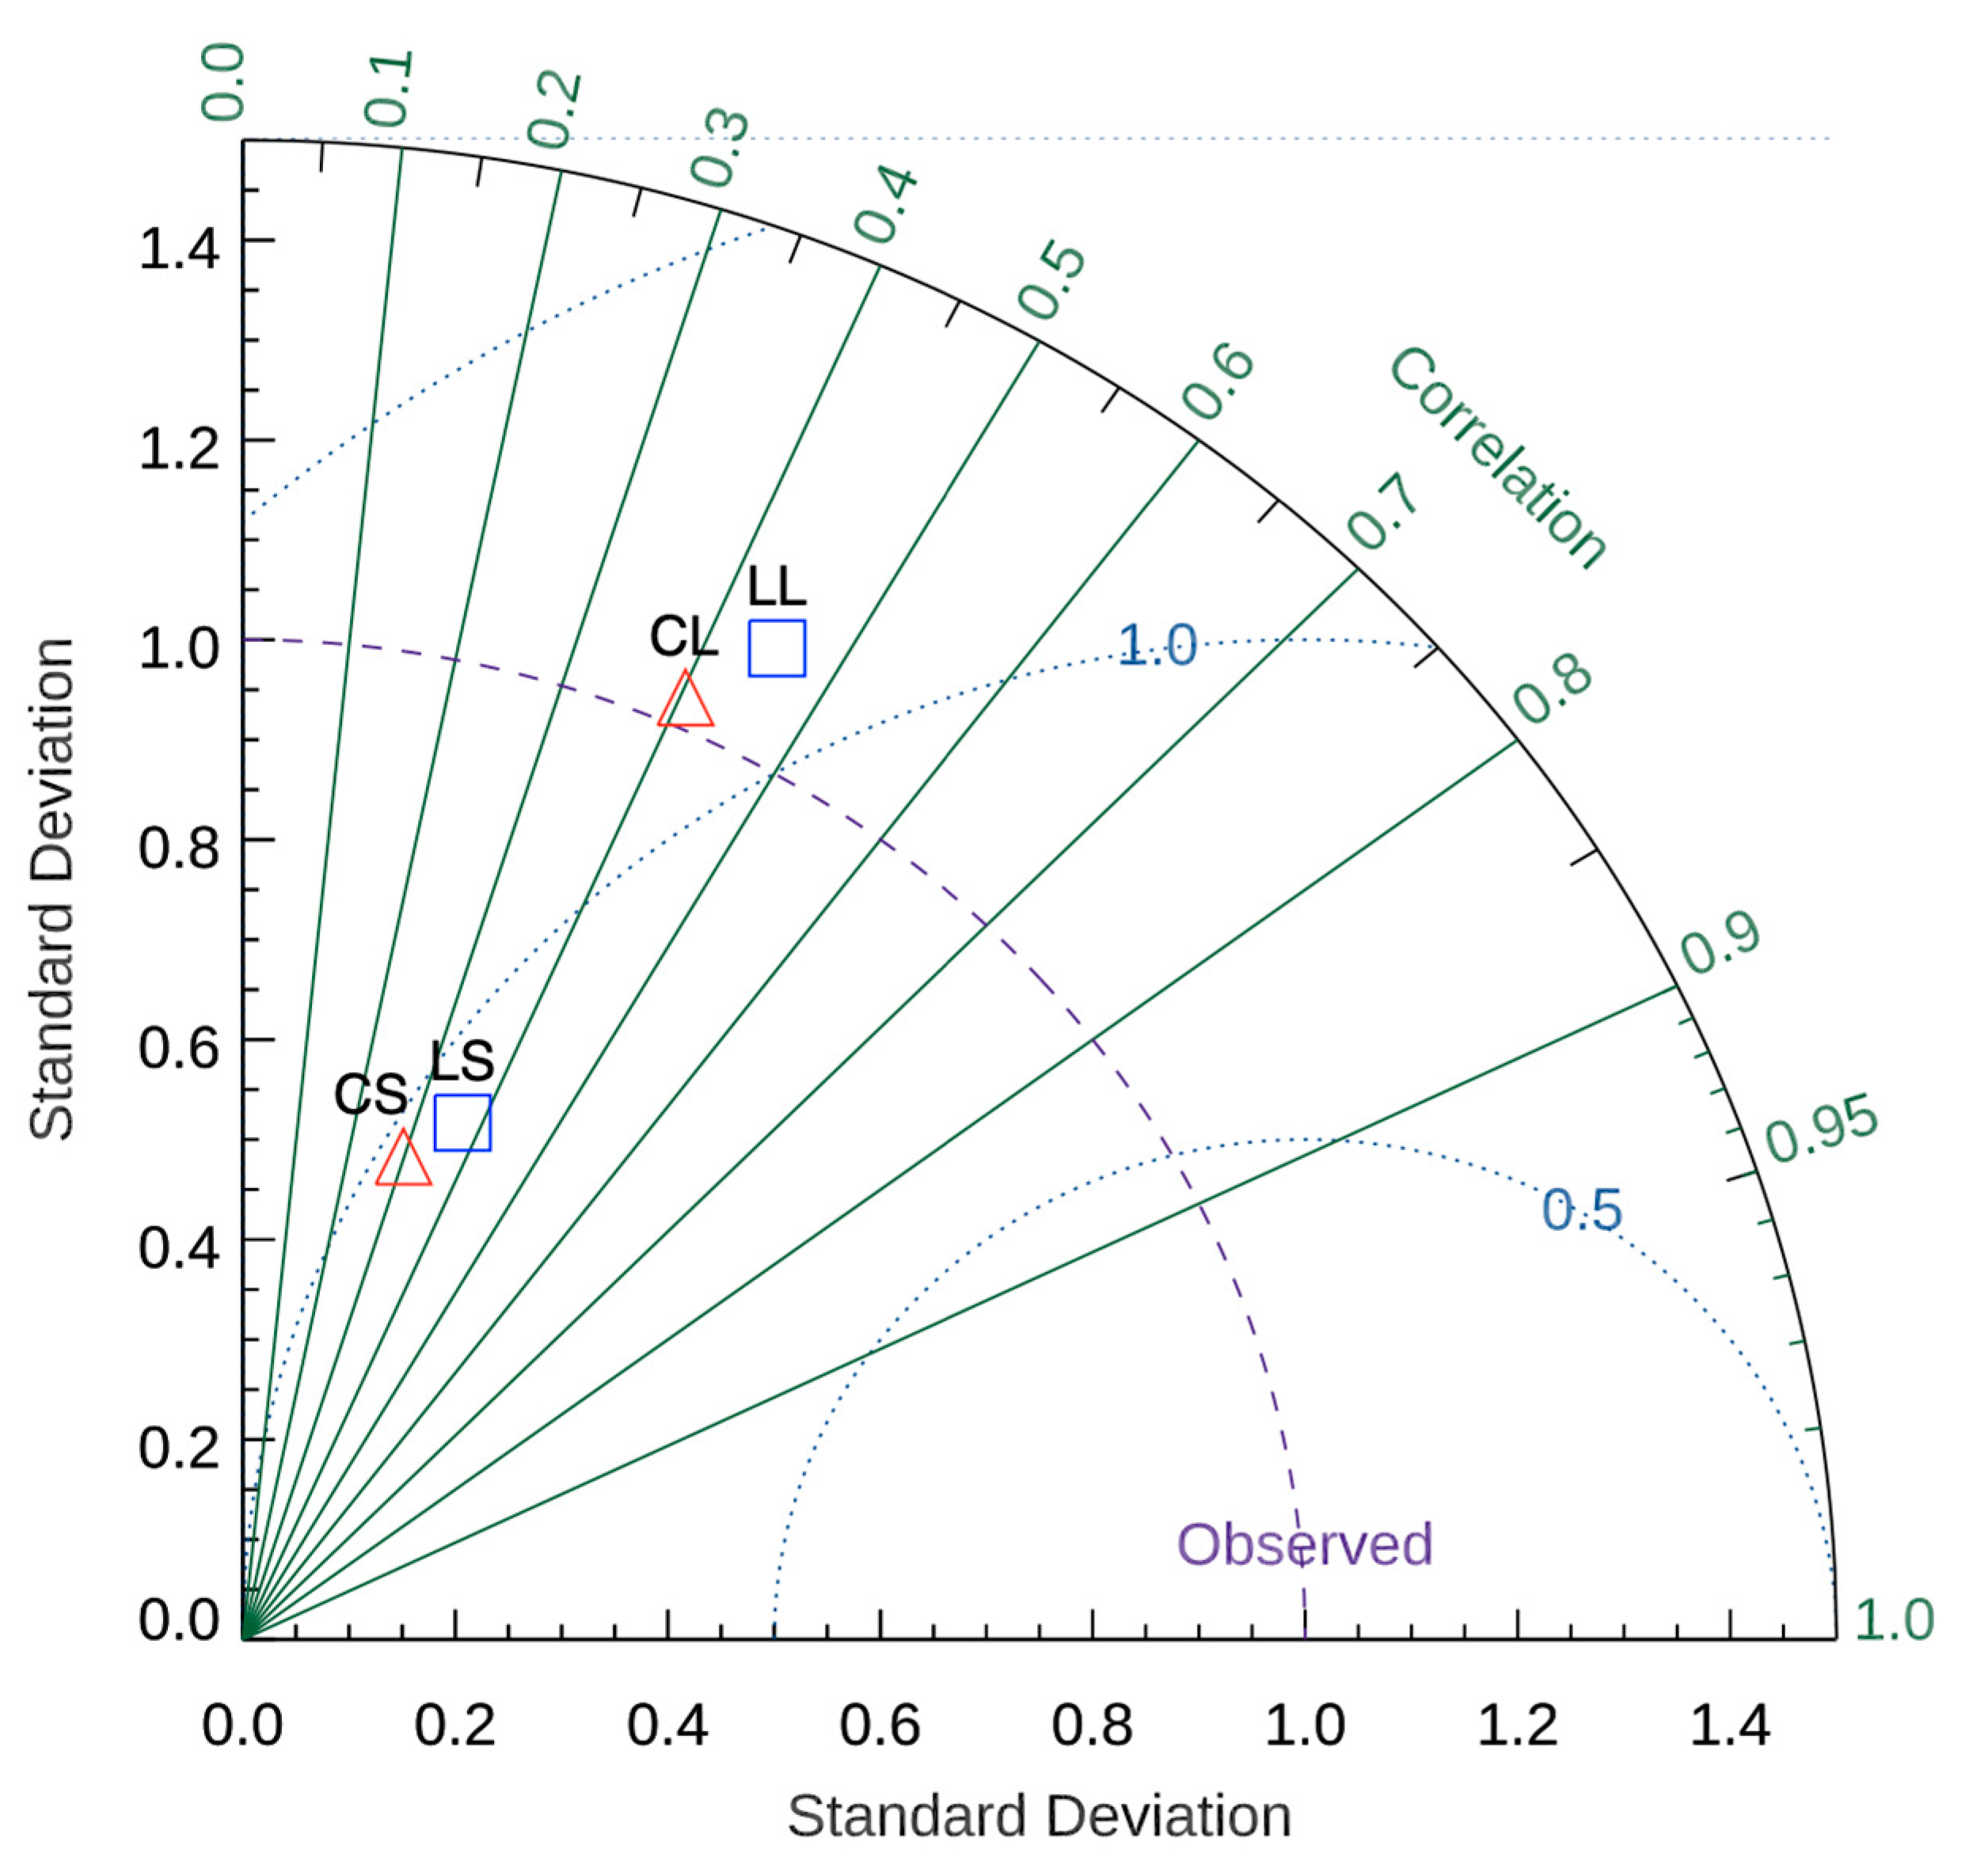
3.1. Pearson Correlation Coefficient, Anomaly Correlation, and Taylor Diagram

In this section, we consider the comparison between the WRF 3 h forecast and the corresponding IMERG precipitation. For this purpose, the WRF 3 h forecasts for the whole period were regridded onto the IMERG 0.1° × 0.1° grid by a remapping procedure that conserves, to a desired degree of accuracy, the total precipitation forecast of the WRF native grid [83,84].
The average precipitation over the whole period is shown in Figure 2. Comparing the results for CTRL and LIGHT, the precipitation increase given by LDA both over the sea and over land is apparent. This increase is larger over the Tyrrhenian Sea, especially close to the Italian mainland, and over northern and southern Adriatic Sea. The IMERG dataset shows higher precipitation values over the sea compared to CTRL and LIGHT, revealing rainfall underestimation for both model configurations. This underestimation is reduced in LIGHT, showing the positive contribution of LDA to the short-term precipitation forecast. Even if better than CTRL, LIGHT substantially underestimates the rainfall compared to IMERG, especially over the Tyrrhenian Sea (west of Sardinia) and over the Ionian Sea. An opposite behavior is observed over land, where CTRL and LIGHT show larger precipitation than IMERG. In particular, the IMERG dataset is not able to represent the impact of orography on the precipitation (western and north-eastern Italian mainland), which is evident in both CTRL and LIGHT.
The Pearson correlation coefficient for each grid point of the domain was computed:
r = i = 1 N ( y i y ¯ ) ( o i o ¯ ) ( i = 1 N ( y i y ¯ ) 2 i = 1 N ( o i o ¯ ) 2 ) 1 / 2
In Equation (2), yi is the precipitation 3 h forecast, oi is the corresponding observation given by IMERG dataset, N is the total number of data for each grid point (N = 232), and y ¯ and o ¯ are, respectively, the forecast and observed averages for each grid point.
The correlation results are shown in Figure 3.
The result for CTRL (Figure 3a) shows a good performance of the WRF forecast over Italy and the central Mediterranean because for most of the grid points (more than 98%, both for CTRL and LIGHT, on a total of 27,602 grid points), the correlation between the forecast and the observed precipitation is positive. About 1.5% of the grid points have a negative correlation coefficient for both LIGHT and CTRL.
Performance is improved by LDA (Figure 3b). A comparison of Figure 3a,b shows that LIGHT performs better, especially over the Adriatic and Ionian Seas. Differences between LIGHT and CTRL Pearson correlations (Figure 3c) help to visualize these results. From Figure 3c, the improvement of LIGHT forecast over CTRL is apparent both over sea and over land.
To highlight the added value of the LIGHT forecast compared to CTRL, we considered the correlation coefficient values over a reference threshold of 0.5. For the CTRL forecast, the correlation coefficient is above 0.5 for 5476 grid points, while for the LIGHT forecast, the correlation coefficient is over the 0.5 threshold for 8067 grid points. The same behavior is shown for different correlation thresholds (Table 1). In addition, the average of the correlation coefficient over the domain of Figure 3 is 0.59 for CTRL and 0.67 for LIGHT.
The anomaly correlation (AC) [85] is a measure of the association that operates on pairs of grid-point values in the forecast and observed fields, and it is designed to reward good forecasts of the pattern of the observed field, with less sensitivity to the correct magnitudes of the field variable.
The centered difference of the AC was computed:
A C = m = 1 M ( y m y ¯ ) ( o m o ¯ ) [ m = 1 M ( y m y ¯ ) 2 m = 1 M ( o m o ¯ ) 2 ] 1 2
y’ = y − cm
o’ = o − cm
where cm is the monthly average of the 3 h precipitation of the IMERG dataset for each grid point, y’m and o’m are the anomalies of the 3 h precipitation of the WRF forecast and IMERG with respect to cm, and M is the total number of land or sea grid points, depending on whether the AC is computed for land or for sea. Overbars are averages over the M grid-points.
The averages of the AC for CTRL and LIGHT for the whole period for the 3 h precipitation forecast are shown in Table 2.
Positive values of the AC show the ability of WRF to represent the observed precipitation spatial pattern. LDA improves the WRF performance for both sea and land, with an increase in the AC of 8% and 5%, respectively. The AC is higher for land grid points, showing a better performance of WRF over land. The performance gap between land and sea is reduced when LDA is applied, because LDA has a greater impact over the sea.
The time series of the AC over land and sea are shown in Figure 4.
The AC is positive and shows a good performance of WRF for most of the considered days, both for CTRL and for LIGHT. Values vary considerably among different times, being in some cases low and sometimes negative over land.
The AC is improved by LDA, as shown by its larger values for LIGHT with respect to CTRL. This improvement is larger until 20 November. From 20 to 30 November, a lower number of convective events occurred over Italy and, therefore, the impact of LDA is lower.
The impact of LDA is larger over the sea than over land. This result is partially determined by the lower performance of the WRF forecast over the sea, as confirmed by the average values of the AC over land and sea (Table 2 and Figure 4). Other factors, however, could contribute to this result. The smoothing of the precipitation field given by the regridding applied to the WRF forecast can penalize the impact of LDA over land, where, because of the complex orography of Italy, small-scale thunderstorms develop due to local forcing conditions. These thunderstorms are likely smaller than those developing over the sea, and regridding can impact unevenly the performance of LDA over land and sea.
The Taylor diagram was computed for the whole period for land and sea grid points, and it is shown in Figure 5.
The correlation between IMERG observations and the WRF forecast is improved by LDA both over land and over the sea. Moreover, the precipitation error is reduced when flashes are assimilated, because the points referring to LDA are closer to the observed point along the x axis (point of coordinates (1,0)). This improvement is larger over the sea than over land.
Figure 5 shows that the observation standard deviation is well represented by WRF over land, while it is underestimated over the sea. This result can be determined not only by an underestimation of the precipitation field standard deviation of WRF but also by an overestimation of the precipitation standard deviation given by the IMERG dataset. The IMERG Final Run dataset is calibrated using the GPCC (https://www.dwd.de/EN/ourservices/gpcc/gpcc.html; last access on 12 February 2021) monthly gauge analysis available (mostly) over land. The presence of intense precipitation gradients across the coastline (see Figure 2 or Section 3.3) reveals a possible overestimation of the IMERG precipitation over the sea because the values over land are corrected by the calibration with rain gauge measurements. As a matter of fact, other studies [86] have reported the overestimation of the uncalibrated IMERG product with respect to the calibrated product. Larger values of rainfall give, usually, larger values of precipitation standard deviation, and this could partially explain the WRF underestimation of the precipitation standard deviation over the sea.
The intense precipitation gradients across the coastline are not present if the Early Run of IMERG (uncalibrated) is considered, and we noticed this difference also for other case studies. In this regard, we plan to perform a comparison with other precipitation products (e.g., MW-based products provided within the EUMETSAT H SAF project, http://hsaf.meteoam.it; last access on 12 February 2021) that will become operational in the near future and that will provide daily precipitation rate over a regular grid.
Overall, the above results indicate that LDA improves the representation of the rainfall field over both land and sea.

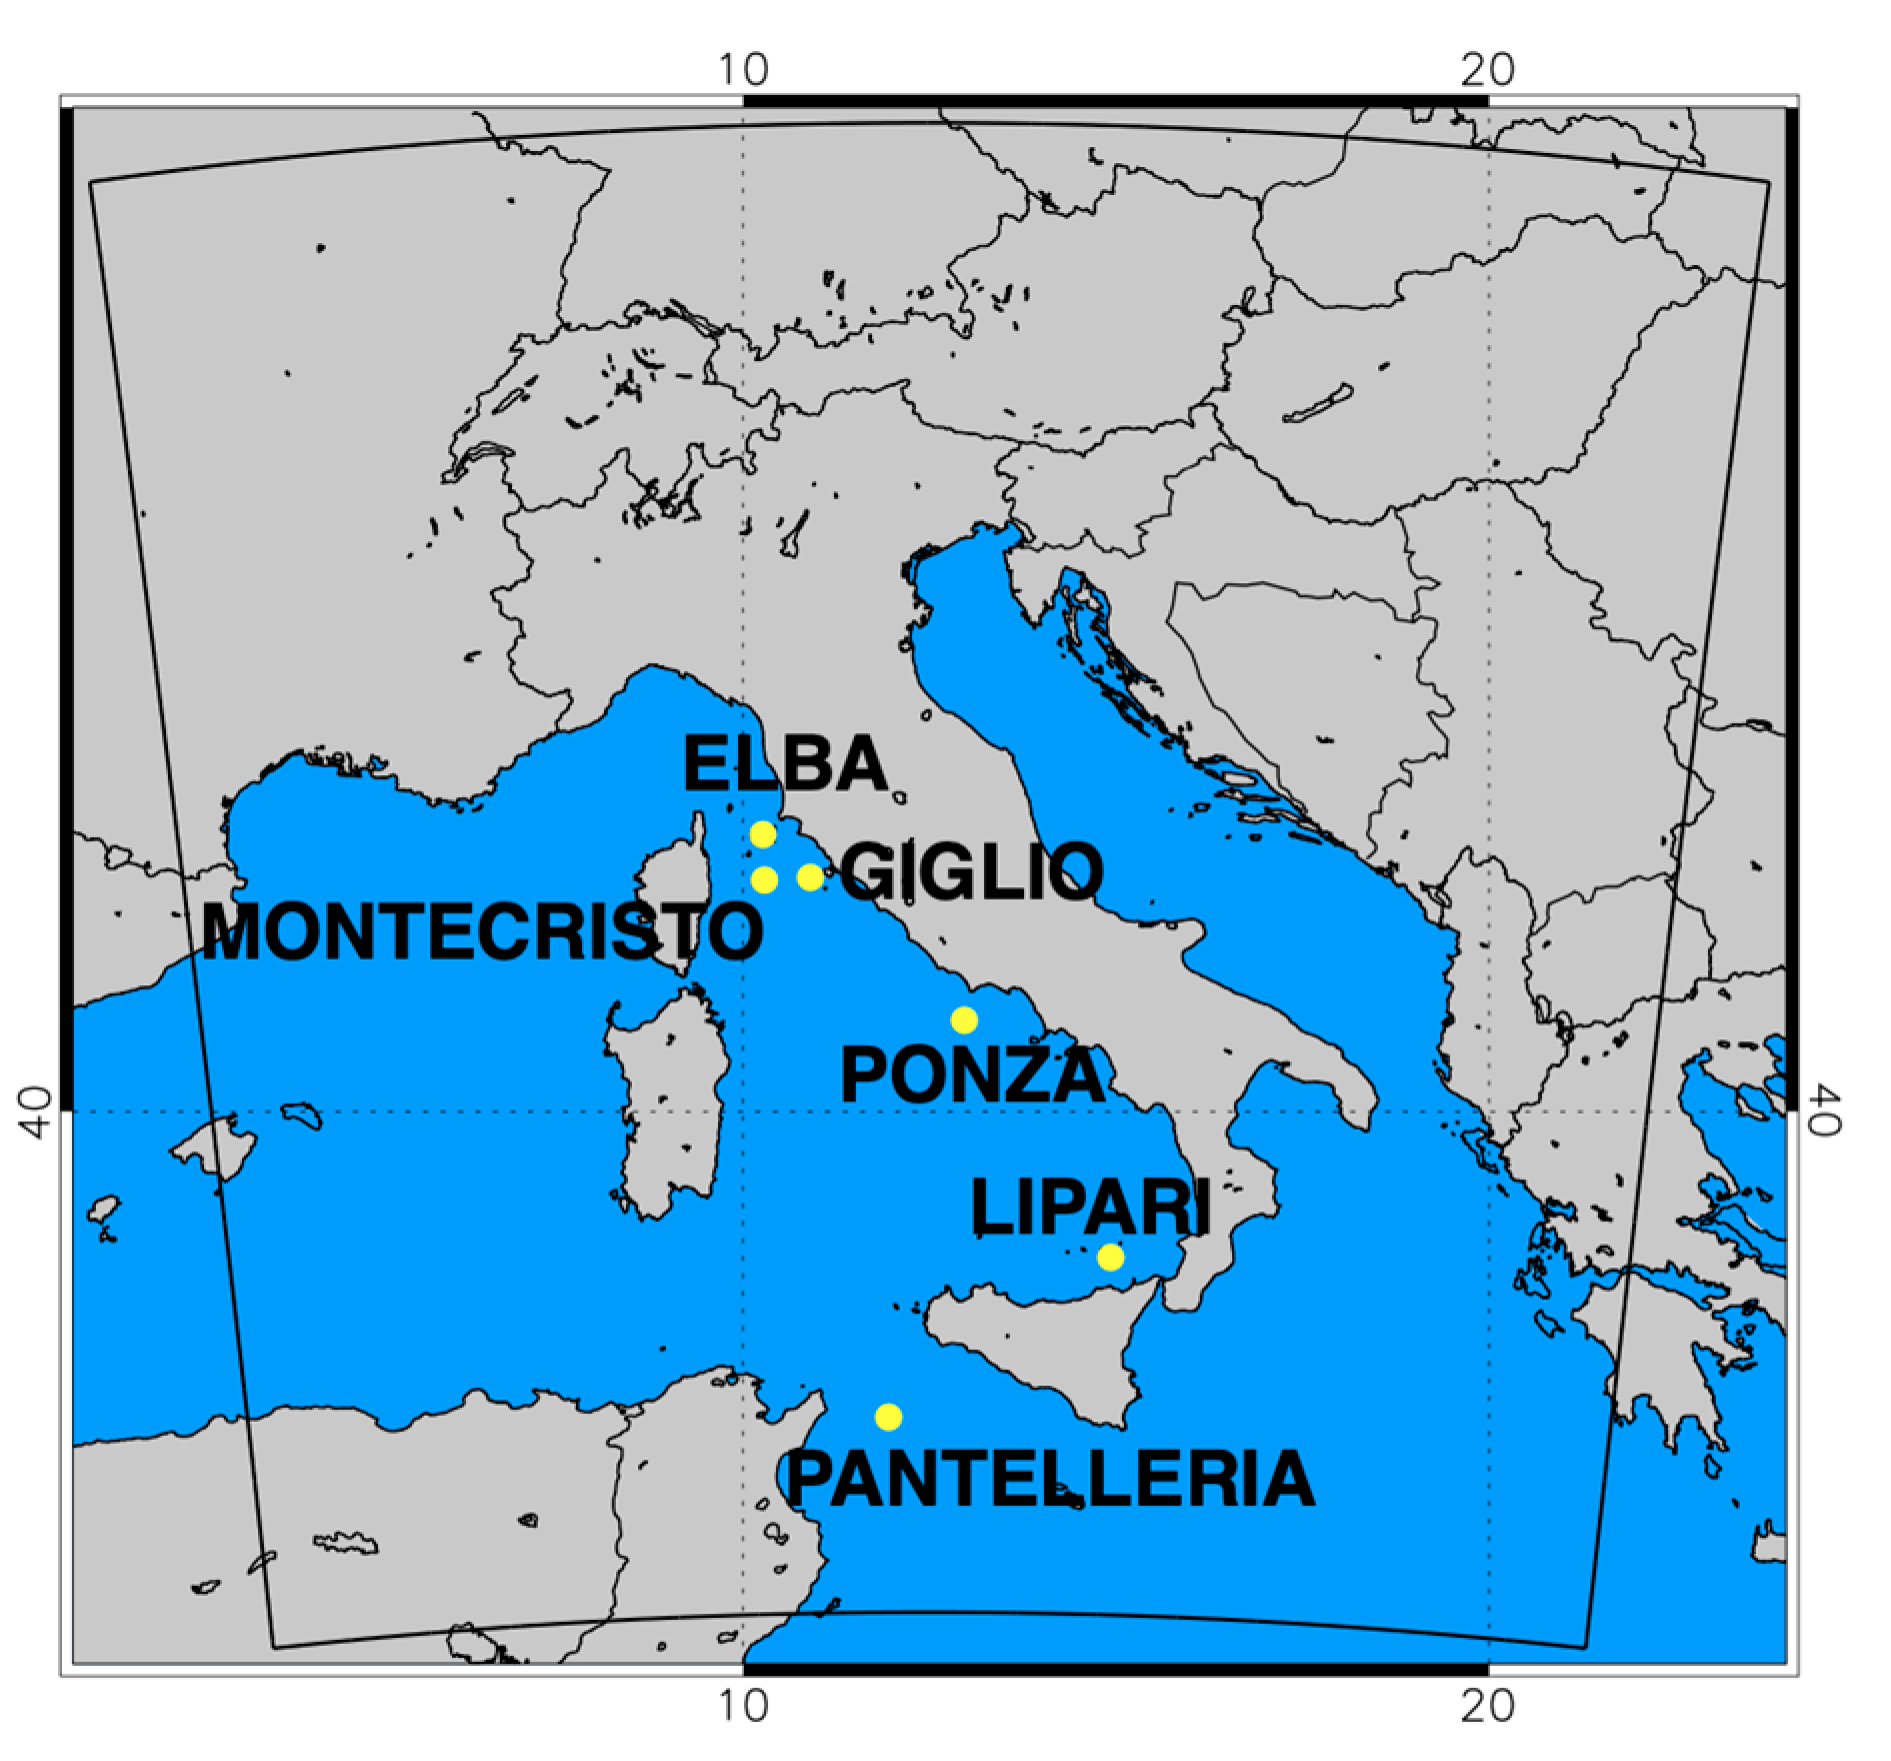
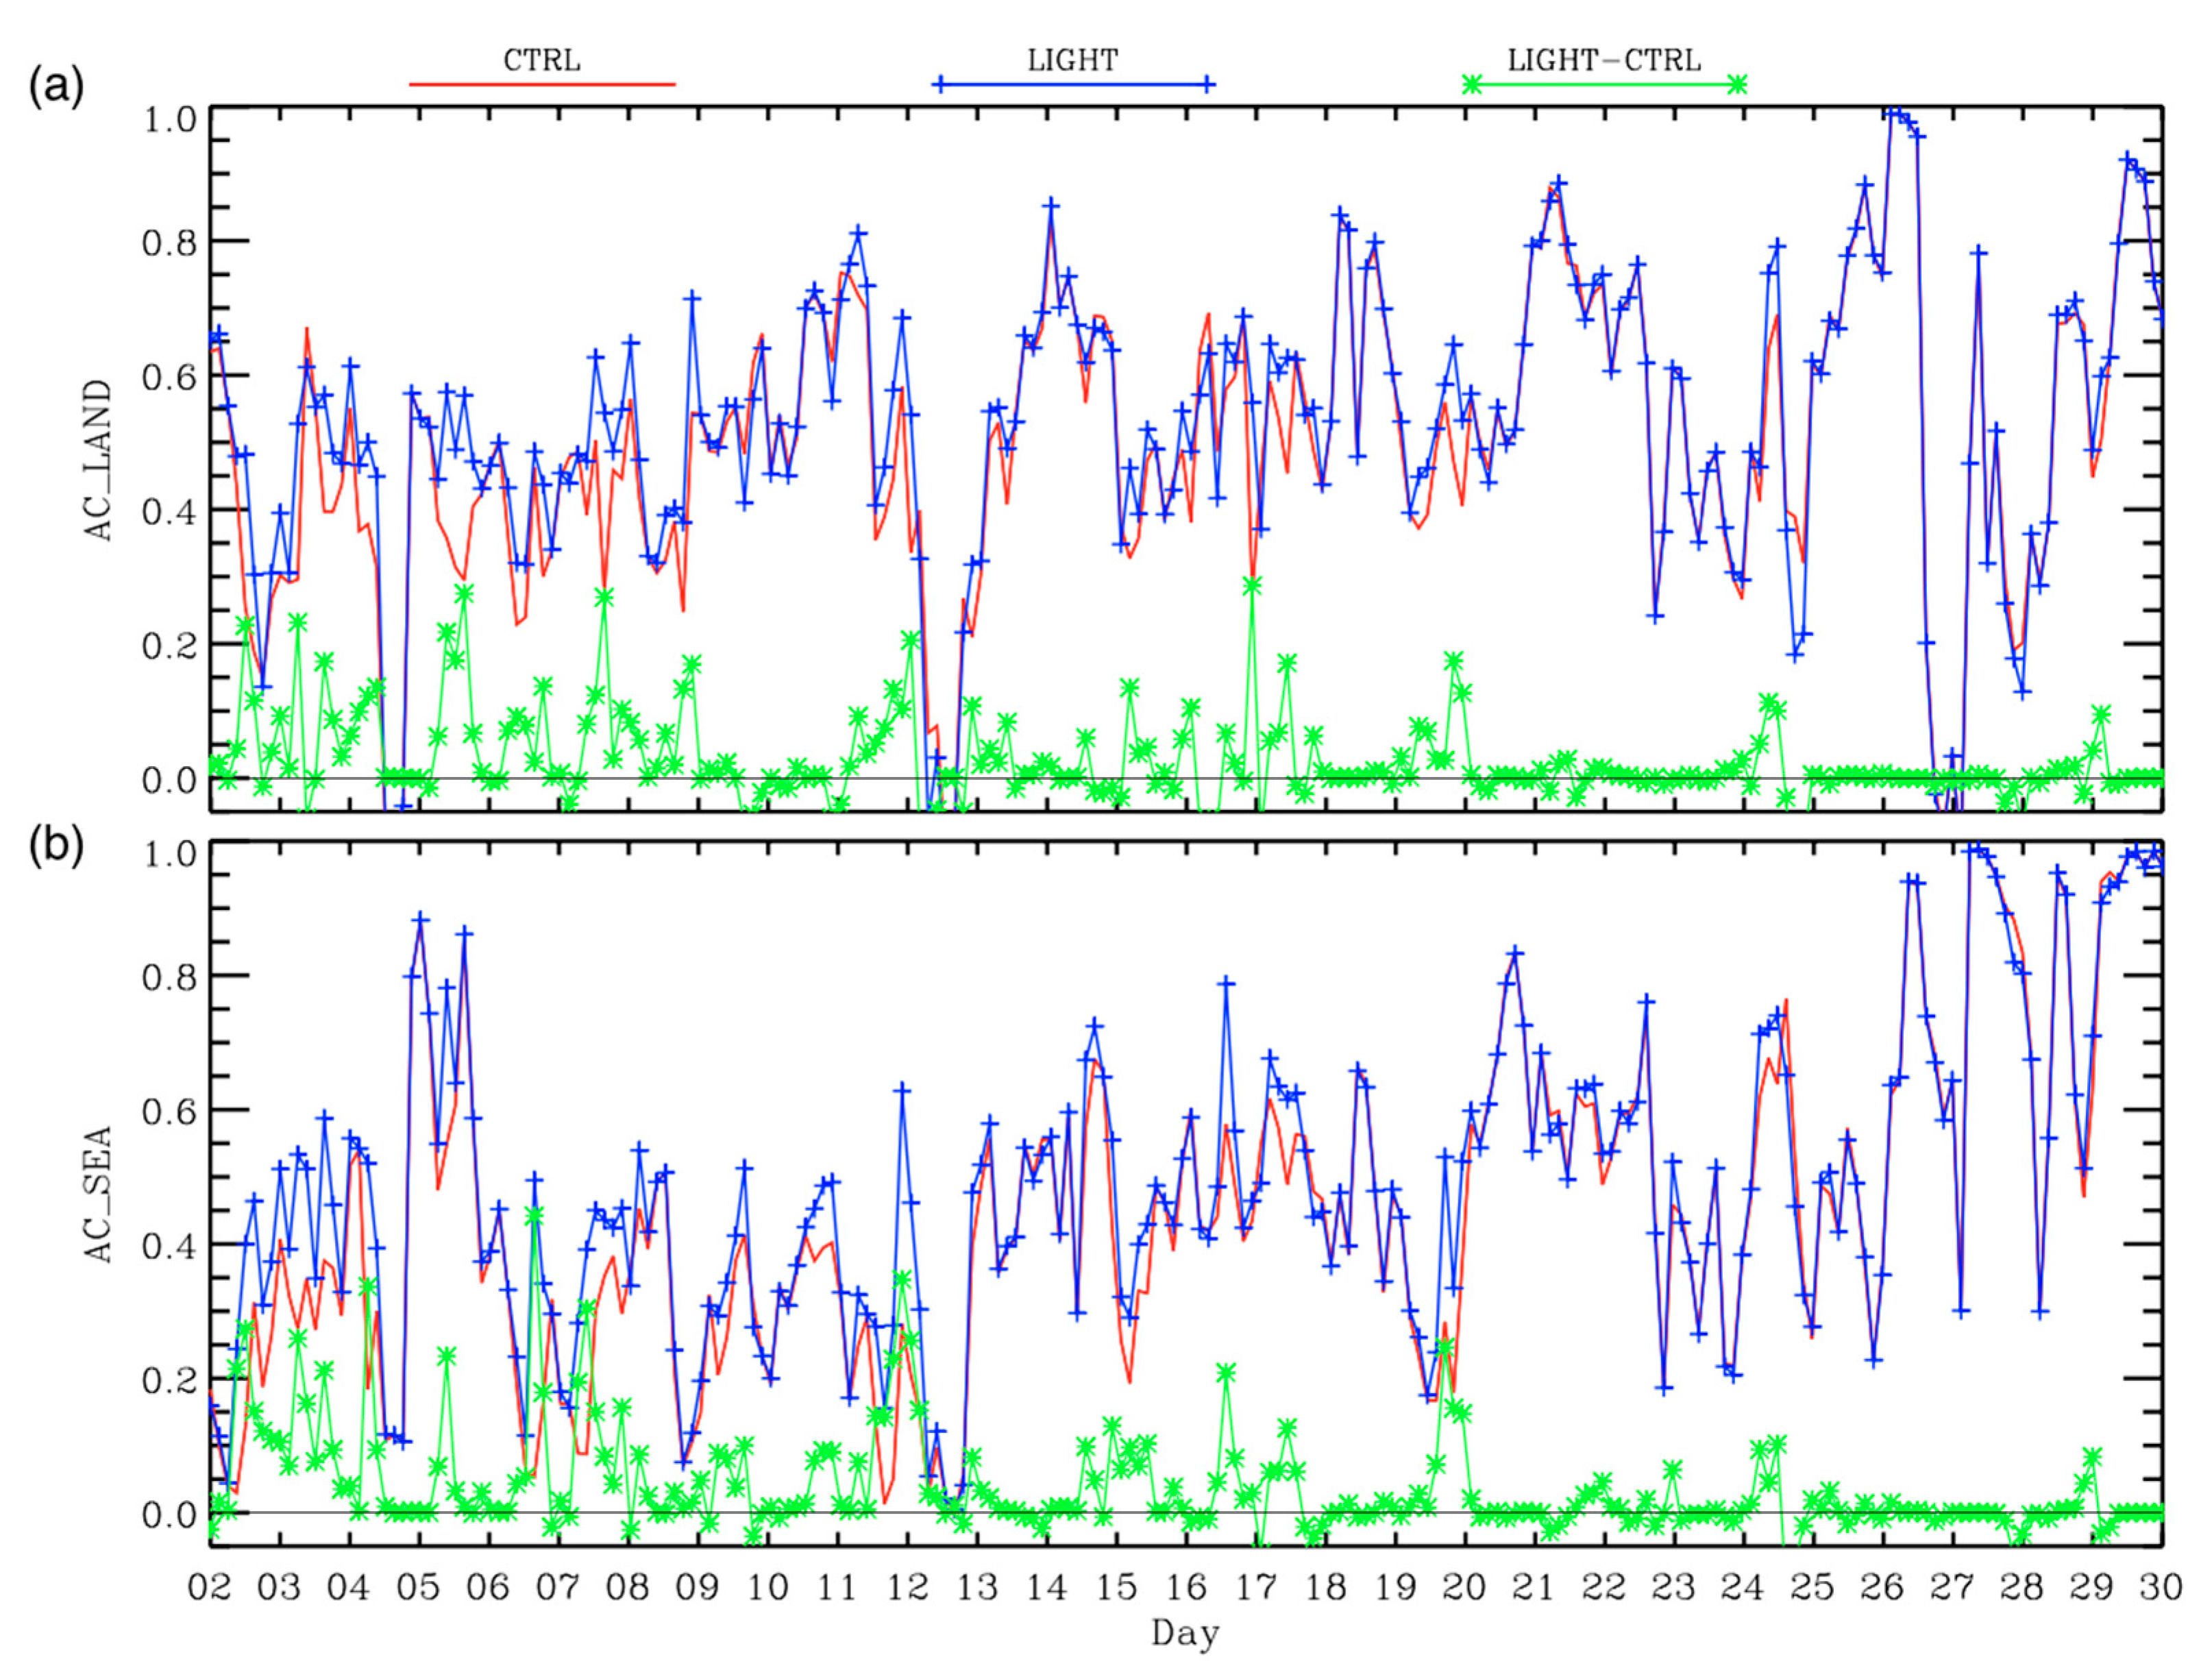
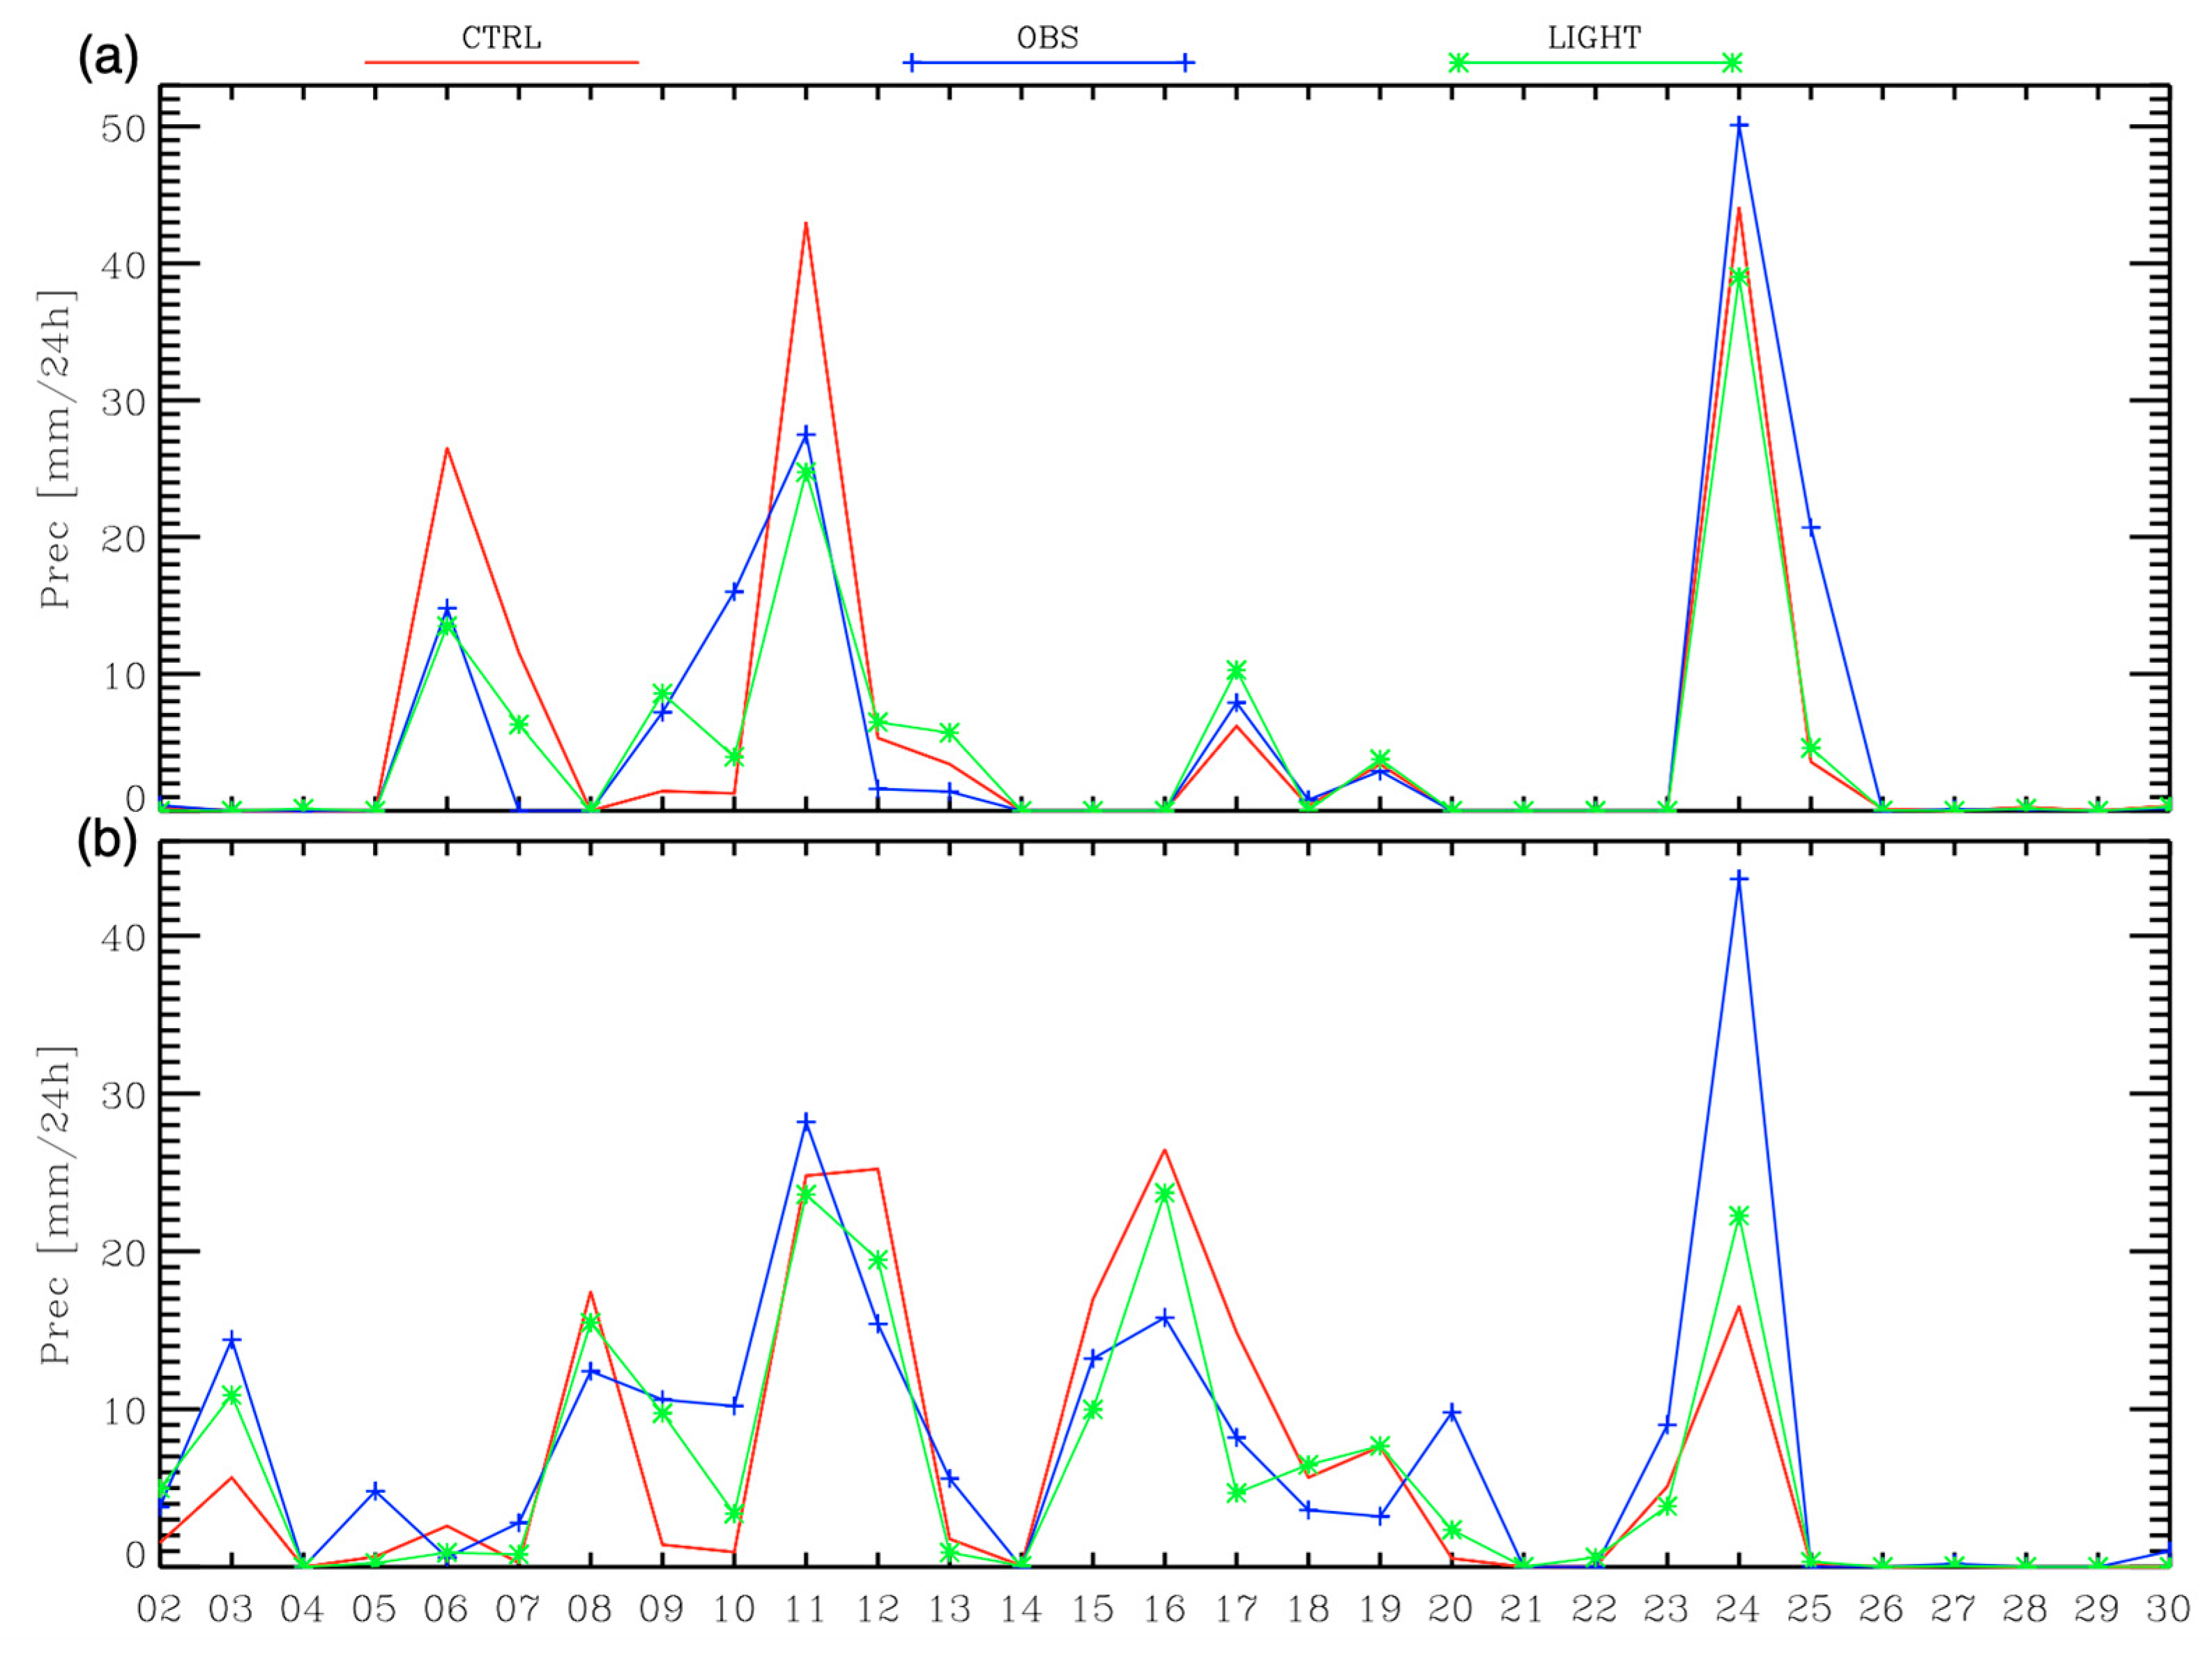
3.2. Impact on Small Islands

To further explore the impact of LDA over the sea, we consider the performance of WRF, both with and without lightning data assimilation, over six Italian small islands in the central Mediterranean Sea, with available rain gauges. Rain gauge data come from the Italian Department of Civil Protection (DPC) precipitation database, which accounts for more than 3000 rain gauges over Italy [8]. The selected islands are Elba, Giglio, Lipari, Montecristo, Pantelleria, and Ponza, and their locations are shown in Figure 1.
The performance of the 3 h precipitation forecast of the model is evaluated using RMSE (Root Mean Square Error) and the Pearson correlation coefficient (r).
To calculate the WRF rainfall corresponding to a rain gauge, the nearest-neighborhood method is used. More specifically, we consider the four grid points surrounding the rain gauge and we select the one among them with a predicted value in better agreement with the observation. This method allows a spatial error of the predicted precipitation field of Δ x 2 4.2   km , where Δx = 3 km is the WRF grid spacing. The nearest-neighborhood method is often used in the literature [61,87]. This method gives higher values of the model scores but tolerates a spatial error of the precipitation forecast (4.2 km in our case).
Statistics are presented for the 3 h precipitation forecast for the whole period. For clearer visualization, daily rainfall forecast time series at Lipari and Elba islands are also shown. For the daily (24 h) case, precipitation is obtained as the summation of the eight 3 h rainfall values belonging to the same day.
Table 3 shows the RMSE and correlation coefficient for the six islands for the WRF 3 h rainfall forecast. An improvement of the RMSE and r is seen for all islands except Ponza. The improvement given by LDA is larger for Elba and Lipari, while it is smaller for Giglio, showing a notable variability from one island to another. An inspection of the forecast for Ponza shows that the LIGHT forecast overestimates the precipitation on 11 November. In particular, about 55 mm/day (20 mm/day) is forecast by LIGHT (CTRL), while the observation is 10 mm/day. This determines a worse performance of the LIGHT forecast compared to CTRL for Ponza.
The time series of observed and forecast daily precipitation for CTRL and LIGHT simulations are shown in Figure 6, and the corresponding statistics are shown in Table 4.
A comparison with 3 h results reveals that daily analysis produces higher RMSE values and larger correlation coefficients.
Considering the time series for Lipari (Figure 6a), it is noted that LIGHT produces fewer false alarms than CTRL. This is especially evident on 6 and 11 November, when the LIGHT precipitation forecast is closer to the observed amount (about 15 mm/day and 28 mm/day, respectively). For Elba, there are days when LDA increases the rainfall forecast, matching better the observations (03, 09, 24), and days when LDA reduces the false alarms (12, 15, 17).

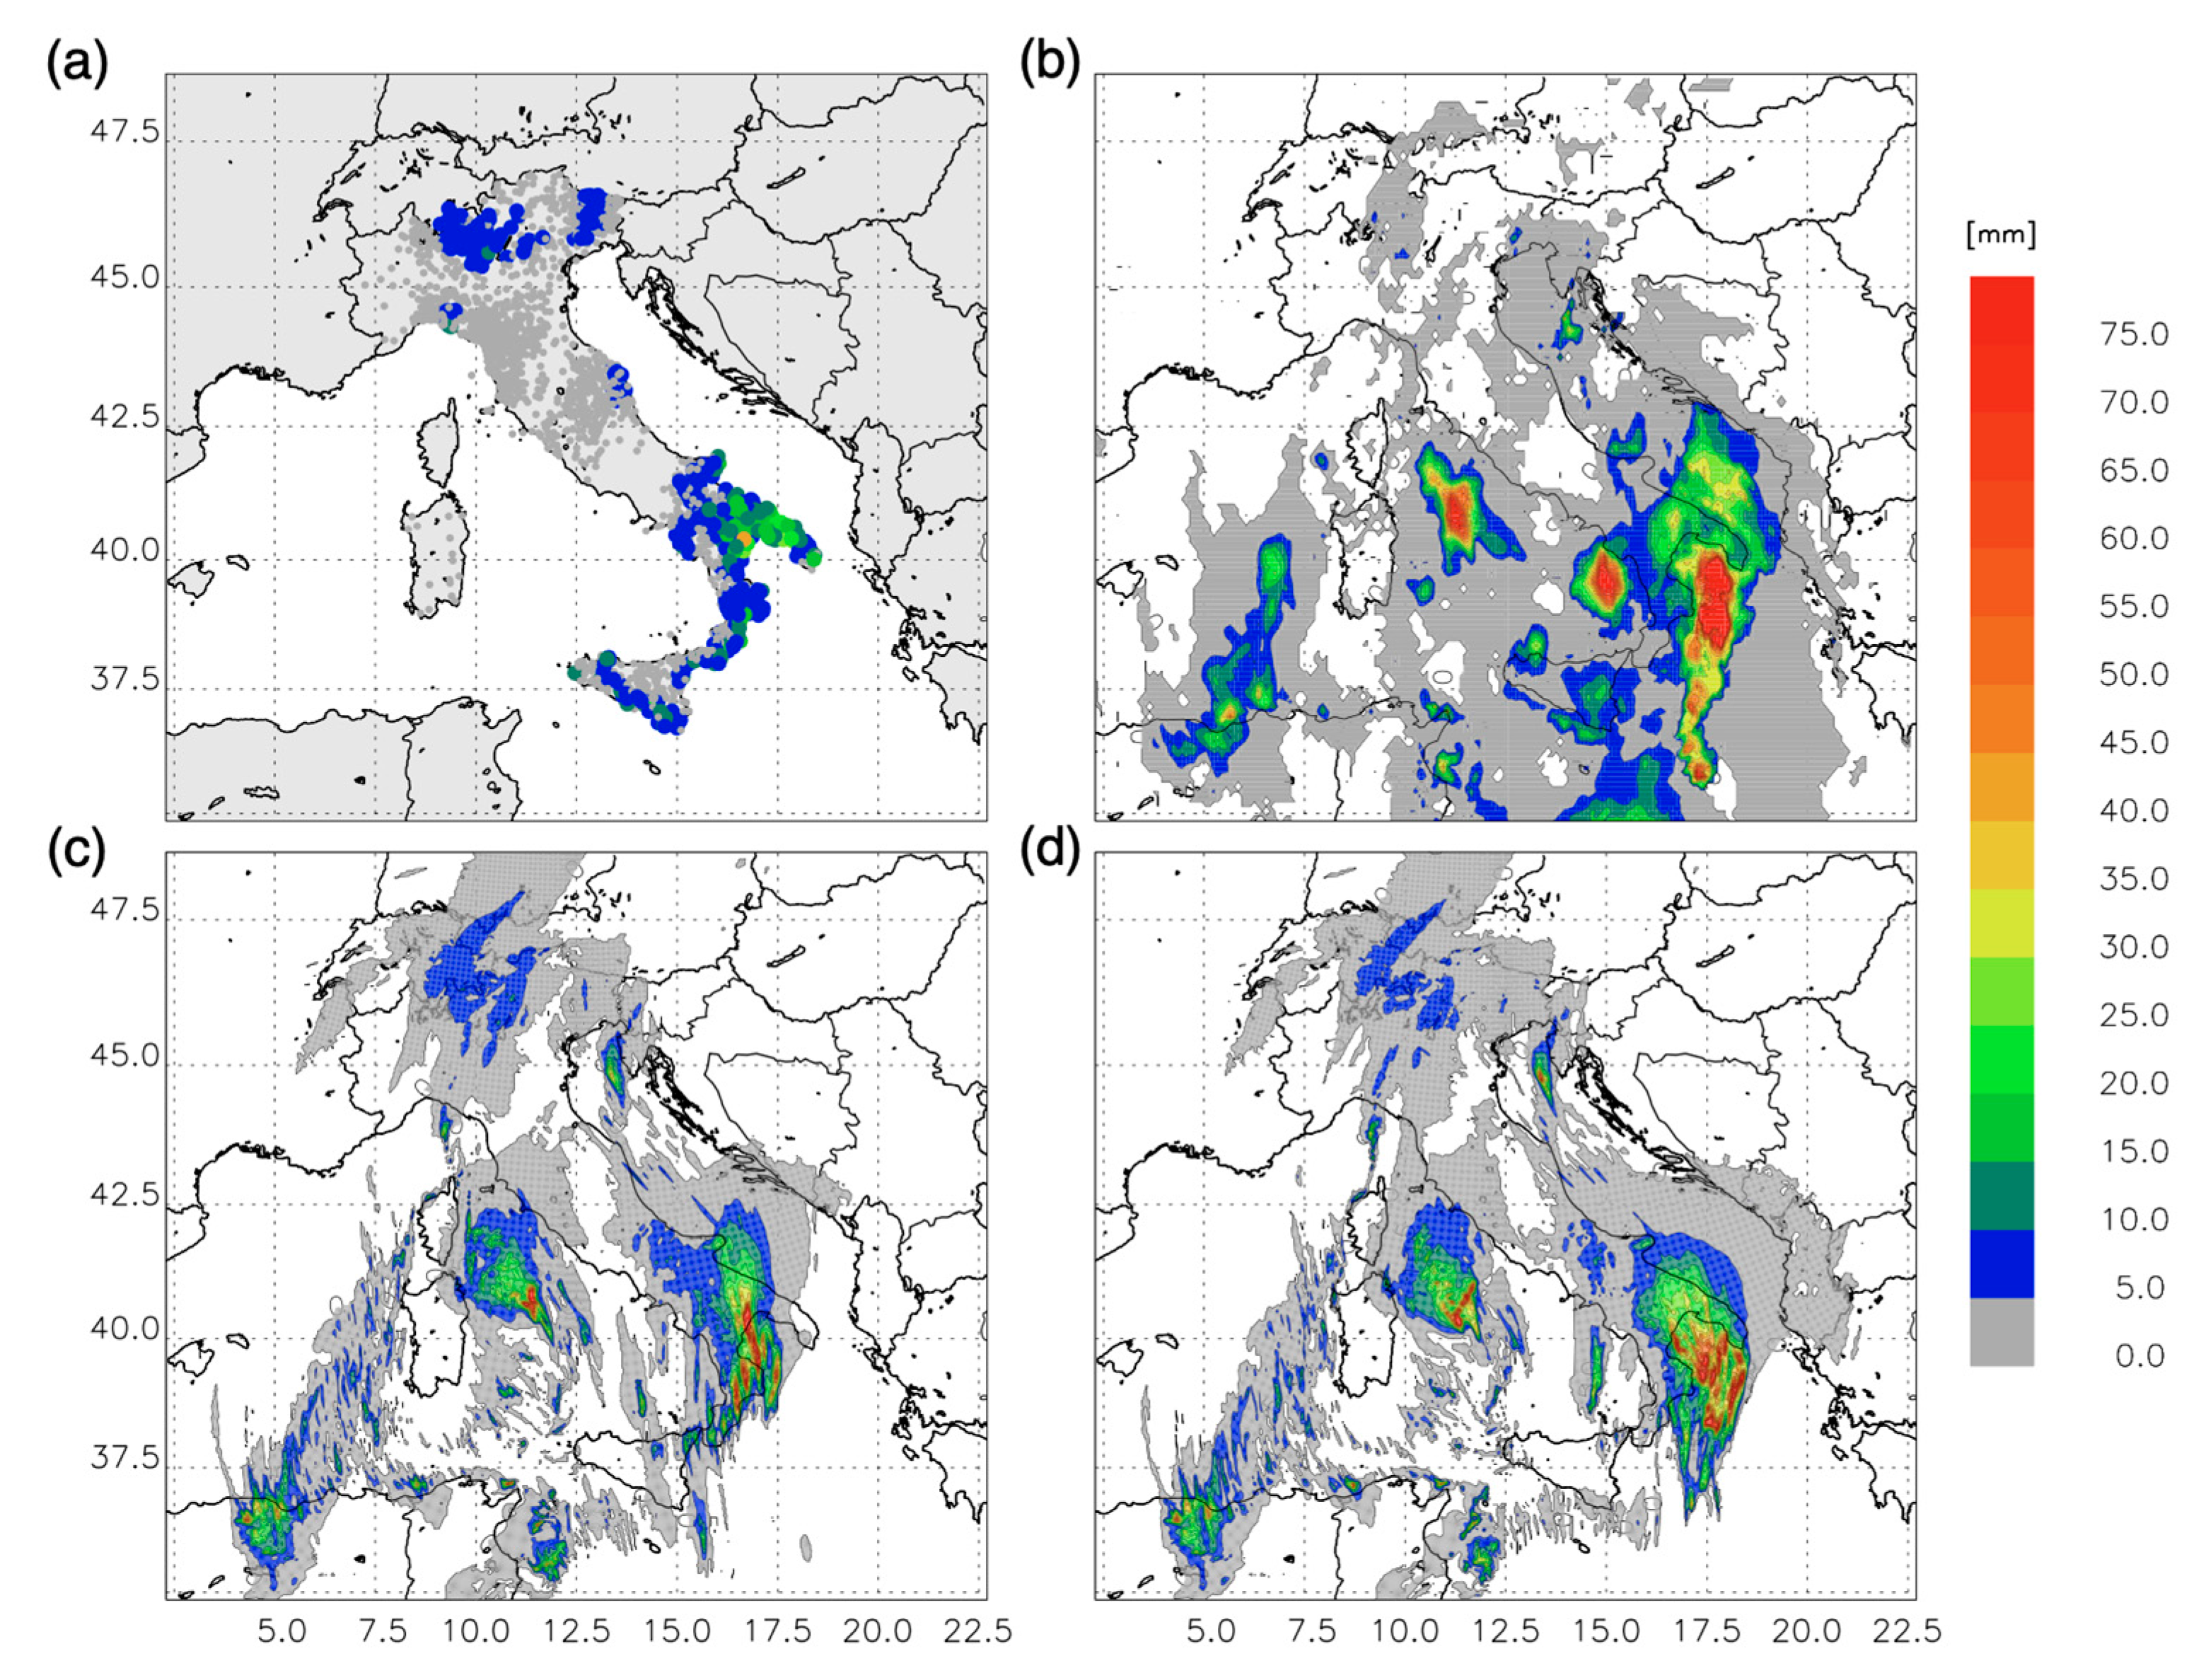
3.3. A Case Study: 12 November 2019

The purpose of this section is to point out the impact of LDA on the 3 h precipitation forecast over the sea for a specific case. The event occurred on 12 November 2019, and we focus on the 3 h precipitation between 00 and 03 UTC. For the scope of this case study, the WRF model native grid is considered, with a horizontal grid spacing of 3 km, and no remapping on the IMERG grid is performed.
In this time period, precipitation is located mainly on the southern part of the Apulia region (around 17.5° E–40.35° N), especially on the Salentine Peninsula, as recorded by rain gauges managed by DPC (Figure 7a). The precipitation intensity is moderate, reaching maxima of 30 mm/3 h.
GPM-IMERG precipitation (Figure 7b) is intense in some regions, in particular over the Ionian Sea. Moderate to intense precipitation is observed over the Adriatic Sea, and the IMERG estimation is in good agreement with rain gauge records on the Adriatic coast. As noted in Section 3.1, when discussing the Taylor diagram (Figure 5), the rainfall of IMERG shows an important change from sea to land, with smaller values over land (due to calibration). This precipitation gradient is sometimes observed in the IMERG dataset for the period considered in this paper and suggests that the rainfall over the central Mediterranean Sea can be overestimated by IMERG.
The CTRL run (Figure 7c) simulates an intense precipitation over eastern Calabria region (about 16.5–17° E and 38–40° N) and on the central part of the Apulia region, north of Salento. This intense precipitation over Calabria is not observed by rain gauges and satellites. Furthermore, the CTRL run gives an intense precipitation forecast over land, while the IMERG dataset shows a heavy precipitation over the Ionian Sea. Overall, for this 3 h time period, the CTRL run simulates the precipitation pattern to the west of the observed rainfall.
Results for the LIGHT run (Figure 7d) show a significant improvement in the precipitation forecast: the precipitation pattern over Calabria is shifted eastward, over the Ionian Sea. This precipitation shift reduces the rainfall amount over Calabria, in better agreement with both rain gauge and satellite observations, and increases the precipitation over the Ionian Sea, in better agreement with the IMERG dataset (although IMERG precipitation is likely overestimated).
Both CTRL and LIGHT runs give a reasonable representation of the precipitation maximum between northern Sardinia and the Italian peninsula (about 11° E–41.5° N). It is interesting to note that the LIGHT forecast shows a second maximum over the Tyrrhenian Sea, at about 14.5° E and 39.5° N, which is not forecast by the CTRL run. This maximum is evident in the IMERG precipitation.
In summary, the IMERG dataset (Figure 7b) shows a precipitation maximum over the Ionian Sea. The rainfall pattern corresponding to this maximum is better depicted by the LIGHT run compared to CTRL. In addition, LDA gives improvements over the Tyrrhenian Sea.

4. Conclusions

In this paper, we considered the impact of lightning data assimilation on the 3 h precipitation forecast over the central Mediterranean Sea. To achieve this goal, rapid update cycle (3 h) lightning data assimilation of the WRF model for the month of November 2019 was set up. This month was chosen because it was characterized by several precipitation events over Italy and the central Mediterranean area. A total of 232 three-hour-rainfall forecasts were considered for two different configurations of the WRF model, CTRL and LIGHT, the latter assimilating lightning data from the LINET network. To verify the model’s performance, two different datasets were used: an IMERG gridded dataset at 0.1° horizontal resolution and six rain gauges in six Italian islands in the central Mediterranean Sea.
LDA improves the precipitation forecast over the sea for the analyzed period. A comparison of the WRF forecast with the IMERG dataset clearly shows the positive impact of LDA, especially on the Ionian and Adriatic Seas.
The anomaly correlation shows a good ability of WRF to predict rainfall both over land and sea, with few exceptions. LDA improves the forecast, especially for the first 20 days of the month, when convective events occurred more frequently compared to the last part of the month. The impact of LDA is larger over the sea than over land. This is confirmed by the analysis of the Taylor diagram.
This diagram analysis, however, shows an underestimation of the precipitation standard deviation of the WRF model over the sea, which could be partially explained by a possible overestimation of the rainfall given by the IMERG dataset over the central Mediterranean Sea for the period selected in this paper.
The comparison between the WRF forecast and the rainfall recorded over small islands reveals a positive impact of LDA for all cases except Ponza. Both the reduction in the false alarms and the increase in correct forecasts contribute to overall performance improvement.
The case study of 12 November for the period 00–03 UTC shows how important LDA can be for specific cases. The CTRL forecast predicted the precipitation patterns a few tens of kilometers west of the real occurrence. This shift, however, has a notable impact on the precipitation forecast (double penalty error) because heavy precipitation is predicted over Calabria, where small amounts are recorded by rain gauges (false alarm), while the precipitation over the Ionian Sea is missed by the CTRL forecast (miss). Both errors are considerably reduced by LDA.
While the aim of the paper is to show the impact of LDA over the sea, the forecast was also verified over land with the IMERG dataset. Results show a positive impact of LDA over the Italian peninsula, in agreement with the results already found by the same authors in past studies with WRF and RAMS@ISAC numerical weather prediction models [8,30,55].
The findings of this paper are of practical importance for two main reasons: First, the rainfall forecast over the sea is important for navigation, fishing, and many sea-related activities; second, over Italy, and more in general over the Mediterranean region, convection can be generated or can evolve over the sea and is then advected over land, causing, sometimes, high-impact weather. Having a better representation of the convection over the sea can help to improve the forecast of these events and better predict their effect over the coastal regions, which can be often devastating.
While the results of this paper are encouraging, the seasonal variability of the Mediterranean climate requires further analysis to show the impact of LDA over the sea in different seasons. A dedicated study to evaluate the impact of LDA for convective events originating over the sea and advected over land is also necessary. These events are partially observed by radars, and LDA can contribute significantly to the improvement of precipitation forecast.
It is important to note that this paper limits its analysis to LDA. This likely causes an overestimation of the impact of LDA on the precipitation forecast, because no additional observations are considered in this study. The assimilation of other observations (e.g., radar, GNSS-ZTD (Global Navigation Satellite System – Zenit Total Delay), SYNOP) over land would be propagated over the sea by the model, while the assimilation of observations over the sea (e.g., SAR (Synthetic Aperture Radar), water vapor maps) would contribute directly to the precipitation forecast over the sea. Future studies, considering the assimilation of other observations in addition to LDA, will quantify more precisely the contribution of LDA to the improvement of the precipitation forecast over the central Mediterranean Sea. Another limitation of this study is that the impact of LDA is evaluated only for precipitation. The positive impact of LDA in predicting other surface parameters has been shown in some papers [17,21,88] and will be considered in future studies.

Author Contributions

Conceptualization, R.C.T., S.F. and G.P.; methodology, R.C.T., S.F., G.P. and S.D.; software, R.C.T., S.F., A.C.P. and L.P.D.; validation, R.C.T., S.F., A.C.P. and L.P.D.; writing—original draft preparation, R.C.T., S.F. and A.C.P.; writing—review and editing, all authors; project administration, G.P. and S.D.; funding acquisition, S.D. All authors have read and agreed to the published version of the manuscript.

Funding

This work was partially funded by the project PON ARS01 00405 OT4CLIMA Sviluppo di tecnologie innovative di Osservazione della Terra per lo studio del Cambiamento Climatico e dei suoi impatti sull’ambiente (Development of Innovative Earth Observation Technologies for the Study of Climate Change and Its Impacts on the Environment), funded by the Italian Ministry of Education, University and Research (MIUR), in the framework of the National Operational Programme (PON), Research and Innovation 2014–2020, Specialization Area Aerospace. This research was partially funded also by the agreement between the Italian Department of Civil Protection and ISAC-CNR. The support provided to L.P.D. by the Third Continuous Development and Operation Phase (CDOP-3) of the EUMETSAT Satellite Application Facility for Hydrology and Water Management (H SAF) program is also acknowledged.

Institutional Review Board Statement

Not applicable.

Informed Consent Statement

Not applicable.

Data Availability Statement

The WRF simulations output can be requested to the corresponding author. GPM-IMERG data can be downloaded from the website https://disc.gsfc.nasa.gov/datasets/GPM_3IMERGHH_06/summary (last access 12 February 2021). Rainfall data for the islands around the Mediterranean Sea can be requested to the Italian Department of Civil Protection (http://www.protezionecivile.gov.it; last access 12 February 2021). Flashes data from the LINET network can be requested to www.nowcast.de (last access 12 February 2021).

Acknowledgments

The computational resources were provided by ECMWF through the project SPITFEDE. LINET data were provided by Nowcast GmbH (https://www.nowcast.de/) within a scientific agreement between H.D. Betz and the Satellite Meteorological Group of CNR-ISAC in Rome. The DPC is acknowledged for providing rain gauge data. NASA is acknowledged for providing IMERG product data (https://disc.gsfc.nasa.gov/datasets/GPM_3IMERGHH_06/summary). The ECMWF and Centro Nazionale di Meteorologia e Climatologia Aeronautica (CNMCA) are acknowledged for the use of the Meteorological Archival and Retrieval System (MARS).

Conflicts of Interest

The authors declare no conflict of interest.

References

  1. Liu, X.; Yang, T.; Hsu, K.; Liu, C.; Sorooshian, S. Evaluating the streamflow simulation capability of PERSIANN-CDR daily rainfall products in two river basins on the Tibetan Plateau. Hydrol. Earth Syst. Sci. 2017, 21, 169–181. [Google Scholar] [CrossRef] [Green Version]
  2. Vasiloff, S.V.; Seo, D.-J.; Howard, K.; Zhang, J.; Kitzmiller, D.H.; Mullusky, M.G.; Krajewski, W.F.; Brandes, E.A.; Rabin, R.M.; Berkowitz, D.S.; et al. Improving QPE and Very Short Term QPF: An Initiative for a Community-Wide Integrated Approach. Bull. Am. Meteorol. Soc. 2007, 88, 1899–1911. [Google Scholar] [CrossRef] [Green Version]
  3. Zhu, Q.; Hsu, K.-L.; Xu, Y.-P.; Yang, T. Evaluation of a new satellite-based precipitation data set for climate studies in the Xiang River basin, southern China. Int. J. Clim. 2017, 37, 4561–4575. [Google Scholar] [CrossRef]
  4. Lagasio, M.; Parodi, A.; Pulvirenti, L.; Meroni, A.N.; Boni, G.; Pierdicca, N.; Marzano, F.S.; Luini, L.; Venuti, G.; Realini, E.; et al. A Synergistic Use of a High-Resolution Numerical Weather Prediction Model and High-Resolution Earth Observation Products to Improve Precipitation Forecast. Remote Sens. 2019, 11, 2387. [Google Scholar] [CrossRef] [Green Version]
  5. Nam, D.; Mai, D.T.; Udo, K.; Mano, A. Short-term flood inundation prediction using hydrologic-hydraulic models forced with downscaled rainfall from global NWP. Hydrol. Process. 2013, 28, 5844–5859. [Google Scholar] [CrossRef]
  6. Robertson, D.E.; Shrestha, D.L.; Wang, Q.J. Post-processing rainfall forecasts from numerical weather prediction models for short-term streamflow forecasting. Hydrol. Earth Syst. Sci. 2013, 17, 3587–3603. [Google Scholar] [CrossRef] [Green Version]
  7. Zahraei, A.; Hsu, K.-L.; Sorooshian, S.; Yong, B.; Hong, Y.; Behrangi, A. Short-term quantitative precipitation forecasting using an object-based approach. J. Hydrol. 2013, 483, 1–15. [Google Scholar] [CrossRef] [Green Version]
  8. Federico, S.; Petracca, M.; Panegrossi, G.; Dietrich, S. Improvement of RAMS precipitation forecast at the short-range through lightning data assimilation. Nat. Hazards Earth Syst. Sci. 2017, 17, 61–76. [Google Scholar] [CrossRef] [Green Version]
  9. Ballard, S.P.; Li, Z.; Simonin, D.; Caron, J.-F. Performance of 4D-Var NWP-based nowcasting of precipitation at the Met Office for summer 2012. Q. J. R. Meteorol. Soc. 2015, 142, 472–487. [Google Scholar] [CrossRef]
  10. Sun, J.; Xue, M.; Wilson, J.W.; Zawadzki, I.; Ballard, S.P.; Onvlee-Hooimeyer, J.; Joe, P.; Barker, D.M.; Li, P.-W.; Golding, B.; et al. Use of NWP for Nowcasting Convective Precipitation: Recent Progress and Challenges. Bull. Am. Meteorol. Soc. 2014, 95, 409–426. [Google Scholar] [CrossRef] [Green Version]
  11. Wang, G.; Yang, J.; Wang, D.; Liu, L. A quantitative comparison of precipitation forecasts between the storm-scale numerical weather prediction model and auto-nowcast system in Jiangsu, China. Atmos. Res. 2016, 181, 1–11. [Google Scholar] [CrossRef] [Green Version]
  12. Stensrud, D.J.; Xue, M.; Wicker, L.J.; Kelleher, K.E.; Foster, M.P.; Schaefer, J.T.; Schneider, R.S.; Benjamin, S.G.; Weygandt, S.S.; Ferree, J.T.; et al. Convective-scale Warn-On-Forecast system: A vision for 2020. Bull. Am. Meteor. Soc. 2009, 90, 1487–1499. [Google Scholar] [CrossRef]
  13. Fritsch, J.M.; Houze, R.A.; Adler, R.; Bluestein, H.; Bosart, L.; Brown, J.; Carr, F.; Davis, C.; Johnson, R.H.; Junker, N.; et al. Quantitative precipitation forecasting: Report of the eighth prospectus development team, U.S. Weather Research Program. Bull. Am. Meteorol. Soc. 1998, 79, 285–299. [Google Scholar] [CrossRef]
  14. Foresti, L.; Reyniers, M.; Seed, A.; Delobbe, L. Development and verification of a real-time stochastic precipitation nowcasting system for urban hydrology in Belgium. Hydrol. Earth Syst. Sci. 2016, 20, 505–527. [Google Scholar] [CrossRef] [Green Version]
  15. Johnson, A.; Wang, X.; Carley, J.R.; Wicker, L.J.; Karstens, C. A Comparison of Multiscale GSI-Based EnKF and 3DVar Data Assimilation Using Radar and Conventional Observations for Midlatitude Convective-Scale Precipitation Forecasts. Mon. Weather Rev. 2015, 143, 3087–3108. [Google Scholar] [CrossRef]
  16. Park, S.K.; Xu, L. Data Assimilation for Atmospheric, Oceanic and Hydrologic Applications (Vol. III). Assim. Atmos. Ocean. Hydrol. Appl. 2017, 2. [Google Scholar] [CrossRef]
  17. Mansell, E.R.; Ziegler, C.L.; MacGorman, D.R. A Lightning Data Assimilation Technique for Mesoscale Forecast Models. Mon. Weather Rev. 2007, 135, 1732–1748. [Google Scholar] [CrossRef]
  18. Fierro, A.O.; Wang, Y.; Gao, J.; Mansell, E.R. Variational Assimilation of Radar Data and GLM Lightning-Derived Water Vapor for the Short-Term Forecasts of High-Impact Convective Events. Mon. Weather Rev. 2019, 147, 4045–4069. [Google Scholar] [CrossRef]
  19. Houtekamer, P.L.; Mitchell, H. Data assimilation using an ensemble Kalman filter technique. Mon. Wea. Rev. 1998, 126, 796–811. [Google Scholar] [CrossRef]
  20. Godinez, H.C.; Reisner, J.M.; Fierro, A.O.; Guimond, S.R.; Kao, J. Determining Key Model Parameters of Rapidly Intensifying Hurricane Guillermo (1997) Using the Ensemble Kalman Filter. J. Atmos. Sci. 2012, 69, 3147–3171. [Google Scholar] [CrossRef] [Green Version]
  21. Wang, Y.; Yang, Y.; Liu, D.; Zhang, D.; Yao, W.; Wang, C. A Case Study of Assimilating Lightning-Proxy Relative Humidity with WRF-3DVAR. Atmosphere 2017, 8, 55. [Google Scholar] [CrossRef] [Green Version]
  22. Mazzarella, V.; Maiello, I.; Ferretti, R.; Capozzi, V.; Picciotti, E.; Alberoni, P.P.; Marzano, F.S.; Budillon, G. Reflectivity and velocity radar data assimilation for two flash flood events in central Italy: A comparison between 3D and 4D variational methods. Q. J. R. Meteorol. Soc. 2020, 146, 348–366. [Google Scholar] [CrossRef]
  23. Gao, J.; Stensrud, D.J. Assimilation of reflectivity data in a convective-scale, cycled 3DVAR framework with hydrometeor classification. J. Atmos. Sci. 2012, 69, 1054–1065. [Google Scholar] [CrossRef]
  24. Sun, J.; Wang, H. Radar Data Assimilation with WRF 4D-Var. Part II: Comparison with 3D-Var for a Squall Line over the U.S. Great Plains. Mon. Weather Rev. 2013, 141, 2245–2264. [Google Scholar] [CrossRef]
  25. Zhang, Y.; Weng-Sippel, J.A.; Meng, Z.; Bishop, C.H. Cloud- resolving hurricane initialization and prediction through assimilation of Doppler radar observations with an ensemble Kalman filter. Mon. Wea. Rev. 2009, 137, 2105–2125. [Google Scholar] [CrossRef] [Green Version]
  26. Aksoy, A.; Dowell, D.C.; Snyder, C. A Multicase Comparative Assessment of the Ensemble Kalman Filter for Assimilation of Radar Observations. Part I: Storm-Scale Analyses. Mon. Weather Rev. 2009, 137, 1805–1824. [Google Scholar] [CrossRef] [Green Version]
  27. Xu, W.; Rutledge, S.A.; Zhang, W. Relationships between total lightning, deep convection, and tropical cyclone intensity change. J. Geophys. Res. Atmos. 2017, 122, 7047–7063. [Google Scholar] [CrossRef]
  28. Zhang, W.; Zhang, Y.; Zheng, D.; Wang, F.; Xu, L. Relationship between lightning activity and tropical cyclone intensity over the northwest Pacific. J. Geophys. Res. Atmos. 2015, 120, 4072–4089. [Google Scholar] [CrossRef]
  29. Fierro, A.O.; Mansell, E.R.; Ziegler, C.L.; MacGorman, D.R. Application of a Lightning Data Assimilation Technique in the WRF-ARW Model at Cloud-Resolving Scales for the Tornado Outbreak of 24 May 2011. Mon. Weather Rev. 2012, 140, 2609–2627. [Google Scholar] [CrossRef]
  30. Prat, A.C.; Federico, S.; Torcasio, R.C.; Fierro, A.O.; Dietrich, S. Lightning data assimilation in the WRF-ARW model for short-term rainfall forecasts of three severe storm cases in Italy. Atmos. Res. 2021, 247, 105246. [Google Scholar] [CrossRef]
  31. Alexander, G.D.; Weinman, J.A.; Karyampudi, V.M.; Olson, W.S.; Lee, A.C.L. The Effect of Assimilating Rain Rates Derived from Satellites and Lightning on Forecasts of the 1993 Superstorm. Mon. Weather Rev. 1999, 127, 1433–1457. [Google Scholar] [CrossRef]
  32. Chang, D.-E.; Weinman, J.A.; Morales, C.A.; Olson, W.S. The Effect of Spaceborne Microwave and Ground-Based Continuous Lightning Measurements on Forecasts of the 1998 Groundhog Day Storm. Mon. Weather Rev. 2001, 129, 1809–1833. [Google Scholar] [CrossRef]
  33. Jones, C.D.; MacPherson, B. A latent heat nudging scheme for the assimilation of precipitation data into an operational mesoscale model. Meteorol. Appl. 1997, 4, 269–277. [Google Scholar] [CrossRef]
  34. Pessi, A.T.; Businger, S. Relationships among Lightning, Precipitation, and Hydrometeor Characteristics over the North Pacific Ocean. J. Appl. Meteorol. Clim. 2009, 48, 833–848. [Google Scholar] [CrossRef]
  35. Benjamin, S.G.; Dévényi, D.; Weygandt, S.S.; Brundage, K.J.; Brown, J.M.; Grell, G.A.; Kim, D.; Schwartz, B.E.; Smirnova, T.G.; Smith, T.L.; et al. An Hourly Assimilation–Forecast Cycle: The RUC. Mon. Weather Rev. 2004, 132, 495–518. [Google Scholar] [CrossRef]
  36. Papadopoulos, A.; Chronis, T.G.; Anagnostou, E.N. Improving Convective Precipitation Forecasting through Assimilation of Regional Lightning Measurements in a Mesoscale Model. Mon. Weather Rev. 2005, 133, 1961–1977. [Google Scholar] [CrossRef] [Green Version]
  37. Kain-John, S. The Kain–Fritsch convective parameterization: An update. J. Appl. Meteorol. 2004, 43, 170–181. [Google Scholar] [CrossRef] [Green Version]
  38. Giannaros, T.M.; Kotroni, V.; Lagouvardos, K. WRF-LTNGDA: A lightning data assimilation technique implemented in the WRF model for improving precipitation forecasts. Environ. Model. Softw. 2016, 76, 54–68. [Google Scholar] [CrossRef]
  39. Fierro, A.O.; Clark, A.J.; Mansell, E.R.; MacGorman, D.R.; Dembek, S.R.; Ziegler, C.L. Impact of Storm-Scale Lightning Data Assimilation on WRF-ARW Precipitation Forecasts during the 2013 Warm Season over the Contiguous United States. Mon. Weather Rev. 2015, 143, 757–777. [Google Scholar] [CrossRef]
  40. Fierro, A.O.; Gao, J.; Ziegler, C.L.; Mansell, E.R.; MacGorman, D.R.; Dembek, S.R. Evaluation of a Cloud-Scale Lightning Data Assimilation Technique and a 3DVAR Method for the Analysis and Short-Term Forecast of the 29 June 2012 Derecho Event. Mon. Weather Rev. 2014, 142, 183–202. [Google Scholar] [CrossRef] [Green Version]
  41. Qie, X.; Zhu, R.; Yuan, T.; Wu, X.; Li, W.; Liu, D. Application of total-lightning data assimilation in a mesoscale convective system based on the WRF model. Atmos. Res. 2014, 145–146, 255–266. [Google Scholar] [CrossRef]
  42. Chen, Z.; Qie, X.; Liu, D.; Xiong, Y. Lightning data assimilation with comprehensively nudging water contents at cloud- re-solving scale using WRF model. Atmos. Res. 2019, 221, 72–87. [Google Scholar] [CrossRef]
  43. Drobinski, P.; Ducrocq, V.; Alpert, P.; Anagnostou, E.; Béranger, K.; Borga, M.; Braud, I.; Chanzy, A.; Davolio, S.; Delrieu, G.; et al. HyMeX: A 10-Year Multidisciplinary Program on the Mediterranean Water Cycle. Bull. Am. Meteorol. Soc. 2014, 95, 1063–1082. [Google Scholar] [CrossRef]
  44. Llasat, M.C.; Llasat-Botija, M.; Petrucci, O.; Pasqua, A.A.; Rossello, J.L.; Vinet, F.; Boissier, L. Towards a database on societal impact of Mediterranean floods within the framework of the HYMEX project. Nat. Hazards Earth Syst. Sci. 2013, 13, 1337–1350. [Google Scholar] [CrossRef] [Green Version]
  45. Ducrocq, V.; Braud, I.; Davolio, S.; Ferretti, R.; Flamant, C.; Jansá, A.; Kalthoff, N.; Richard, E.; Taupier-Letage, I.; Ayral, P.-A.; et al. HyMeX-SOP1: The Field Campaign Dedicated to Heavy Precipitation and Flash Flooding in the Northwestern Mediterranean. Bull. Am. Meteorol. Soc. 2014, 95, 1083–1100. [Google Scholar] [CrossRef]
  46. Jansa, A.; Alpert, P.; Arbogast, P.; Buzzi, A.; Ivancanpicek, B.; Kotroni, V.; Llasat, M.C.; Ramis, C.; Richard, E.; Romero, R.; et al. MEDEX: A general overview. Nat. Hazards Earth Syst. Sci. 2014, 14, 1965–1984. [Google Scholar] [CrossRef] [Green Version]
  47. Romero, R.; Ramis, C.; Alonso, S. Numerical simulation of an extreme rainfall event in Catalonia: Role of orography and evaporation from the sea. Q. J. R. Meteorol. Soc. 1997, 123, 537–559. [Google Scholar] [CrossRef]
  48. Kotroni, V.; Lagouvardos, K.; Kallos, G.; Ziakopoulos, D. Severe flooding over central and southern greece associated with pre-cold frontal orographic lifting. Q. J. R. Meteorol. Soc. 1999, 125, 967–991. [Google Scholar] [CrossRef]
  49. Jansa, A.; Genoves, A.; Garcia-Moya, J.A. Western Mediterranean cyclones and heavy rain. Part 1: Numerical experiment concerning the Piedmont flood case. Meteorol. Appl. 2000, 7, 323–333. [Google Scholar] [CrossRef]
  50. Lee, K.-O.; Flamant, C.; Ducrocq, V.; Duffourg, F.; Fourrié, N.; Davolio, S. Convective initiation and maintenance processes of two back-building mesoscale convective systems leading to heavy precipitation events in Southern Italy during HyMeX IOP 13. Q. J. R. Meteorol. Soc. 2016, 142, 2623–2635. [Google Scholar] [CrossRef]
  51. Cassola, F.; Ferrari, F.; Mazzino, A. Numerical simulations of Mediterranean heavy precipitation events with the WRF model: A verification exercise using different approaches. Atmos. Res. 2015, 164–165, 210–225. [Google Scholar] [CrossRef]
  52. Dafis, S.; Lagouvardos, K.; Kotroni, V.; Giannaros, T.M.; Bartzokas, A. Observational and modeling study of a mesoscale convective system during the HyMeX—SOP1. Atmos. Res. 2017, 187, 1–15. [Google Scholar] [CrossRef]
  53. Avolio, E.; Federico, S. WRF simulations for a heavy rainfall event in southern Italy: Verification and sensitivity tests. Atmos. Res. 2018, 209, 14–35. [Google Scholar] [CrossRef]
  54. Davolio, S.; Della-Fera, S.; Laviola, S.; Miglietta, M.M.; Levizzani, V. Heavy Precipitation over Italy from the Mediterranean Storm “Vaia” in October 2018: Assessing the Role of an Atmospheric River. Mon. Weather Rev. 2020, 148, 3571–3588. [Google Scholar] [CrossRef]
  55. Torcasio, R.C.; Federico, S.; Puca, S.; Vulpiani, G.; Prat, A.C.; Dietrich, S. Application of Lightning Data Assimilation for the 10 October 2018 Case Study over Sardinia. Atmosphere 2020, 11, 541. [Google Scholar] [CrossRef]
  56. Federico, S.; Bellecci, C.; Colacino, M. Quantitative precipitation of the Soverato flood: The role of orography and surface fluxes. Nuovo Cimento C 2003, 26, 7–22. [Google Scholar]
  57. Federico, S.; Avolio, E.; Bellecci, C.; Lavagnini, A.; Colacino, M.; Walko, R.L. Numerical analysis of an intense rainstorm occurred in southern Italy. Nat. Hazards Earth Syst. Sci. 2008, 8, 19–35. [Google Scholar] [CrossRef]
  58. Senatore, A.; Mendicino, G.; Knoche, H.R.; Kunstmann, H. Sensitivity of Modeled Precipitation to Sea Surface Temperature in Regions with Complex Topography and Coastlines: A Case Study for the Mediterranean. J. Hydrometeorol. 2014, 15, 2370–2396. [Google Scholar] [CrossRef]
  59. Pastor, F.; Estrela, M.A.J.; Penarrocha, D.A.; Millán, M.M. Torrential Rains on the Spanish Mediterranean Coast: Modeling the Effects of the Sea Surface Temperature. J. Appl. Meteorol. 2001, 40, 1180–1195. [Google Scholar] [CrossRef]
  60. Miglietta, M.M.; Carnevale, D.; Levizzani, V.; Rotunno, R. Role of moist and dry air advection in the development of Mediterranean tropical-like cyclones (medicanes). Q. J. R. Meteorol. Soc. 2020, 1. [Google Scholar] [CrossRef]
  61. Moscatello, A.; Miglietta, M.M.; Rotunno, R. Numerical Analysis of a Mediterranean “Hurricane” over Southeastern Italy. Mon. Weather Rev. 2008, 136, 4373–4397. [Google Scholar] [CrossRef]
  62. Marra, A.; Porcù, F.; Baldini, L.; Petracca, M.; Casella, D.; Dietrich, S.; Mugnai, A.; Sanò, P.; Vulpiani, G.; Panegrossi, G. Observational analysis of an exceptionally intense hailstorm over the Mediterranean area: Role of the GPM Core Observatory. Atmos. Res. 2017, 192, 72–90. [Google Scholar] [CrossRef]
  63. Dafis, S.; Claud, C.; Kotroni, V.; Lagouvardos, K.; Rysman, J. Insights into the convective evolution of Mediterranean tropical-like cyclones. Q. J. R. Meteorol. Soc. 2020, 146, 4147–4169. [Google Scholar] [CrossRef]
  64. Marra, A.C.; Federico, S.; Montopoli, M.; Avolio, E.; Baldini, L.; Casella, D.; D’Adderio, L.P.; Dietrich, S.; Sanò, P.; Torcasio, R.C.; et al. The Precipitation Structure of the Mediterranean Tropical-Like Cyclone Numa: Analysis of GPM Observations and Numerical Weather Prediction Model Simulations. Remote Sens. 2019, 11, 1690. [Google Scholar] [CrossRef] [Green Version]
  65. Miglietta, M.M.; Rotunno, R. Development mechanisms for Mediterranean tropical-like cyclones (medicanes). Q. J. R. Meteorol. Soc. 2019, 145, 1444–1460. [Google Scholar] [CrossRef] [Green Version]
  66. Miglietta, M.M.; Moscatello, A.; Conte, D.; Mannarini, G.; Lacorata, G.; Rotunno, R. Numerical analysis of a Mediterranean ‘hurricane’ over south-eastern Italy: Sensitivity experiments to sea surface temperature. Atmos. Res. 2011, 101, 412–426. [Google Scholar] [CrossRef]
  67. Hou, A.Y.; Kakar, R.K.; Neeck, S.; Azarbarzin, A.A.; Kummerow, C.D.; Kojima, M.; Oki, R.; Nakamura, K.; Iguchi, T. The Global Precipitation Measurement Mission. Bull. Am. Meteorol. Soc. 2014, 95, 701–722. [Google Scholar] [CrossRef]
  68. Skofronick-Jackson, G.; Petersen, W.A.; Berg, W.; Kidd, C.; Stocker, E.F.; Kirschbaum, D.B.; Kakar, R.; Braun, S.A.; Huffman, G.J.; Iguchi, T.; et al. The Global Precipitation Measurement (GPM) Mission for Science and Society. Bull. Am. Meteorol. Soc. 2017, 98, 1679–1695. [Google Scholar] [CrossRef]
  69. Kidd, C.; Shige, S.; Vila, D.; Tarnavsky, E.; Yamamoto, M.K.; Maggioni, V.; Maseko, B. The IPWG Satellite Precipitation Validation Effort. In Advances in Global Change Research; Springer Nature: Cham, Switzerland, 2020; pp. 453–470. [Google Scholar]
  70. Panegrossi, G.; Casella, D.; Dietrich, S.; Marra, A.C.; Sanò, P.; Mugnai, A.; Baldini, L.; Roberto, N.; Adirosi, E.; Cremonini, R.; et al. Use of the GPM Constellation for Monitoring Heavy Precipitation Events Over the Mediterranean Region. IEEE J. Sel. Top. Appl. Earth Obs. Remote Sens. 2016, 9, 2733–2753. [Google Scholar] [CrossRef]
  71. Huffman, G.J.; Stocker, D.T.; Bolvin, E.J.; Nelkin-Jackson, T. GPM IMERG Final Precipitation L3 Half Hourly 0.1 Degree x 0.1 Degree V06; Goddard Earth Sciences Data and Information Services Center (GES DISC): Greenbelt, MD, USA. Available online: https://docserver.gesdisc.eosdis.nasa.gov/public/project/GPM/IMERG_ATBD_V06.pdf (accessed on 12 February 2021). [CrossRef]
  72. Skamarock, W.C.; Klemp, J.B.; Dudhia, J.; Gill, D.O.; Liu, Z.; Berner, J.; Wang, W.; Powers, J.G.; Duda, M.G.; Barker, D.M.; et al. A Description of the Advanced Research WRF Version 4; No. NCAR/TN-556+STR, NCAR Technical Note; National Center for Atmospheric Research: Boulder, CO, USA, 2019; 145p. [Google Scholar] [CrossRef]
  73. Thompson, G.; Field, P.R.; Rasmussen, R.M.; Hall, W.D. Explicit Forecasts of Winter Precipitation Using an Improved Bulk Microphysics Scheme. Part II: Implementation of a New Snow Parameterization. Mon. Weather Rev. 2008, 136, 5095–5115. [Google Scholar] [CrossRef]
  74. Hong, S.-Y.; Noh, Y.; Dudhia, J. A New Vertical Diffusion Package with an Explicit Treatment of Entrainment Processes. Mon. Weather Rev. 2006, 134, 2318–2341. [Google Scholar] [CrossRef] [Green Version]
  75. Jiménez, P.A.; Dudhia, J.; González-Rouco, J.F.; Navarro, J.; Montávez, J.P.; García-Bustamante, E. A Revised Scheme for the WRF Surface Layer Formulation. Mon. Weather Rev. 2012, 140, 898–918. [Google Scholar] [CrossRef] [Green Version]
  76. Dudhia, J. Numerical study of convection observed during the Winter Monsoon Experiment using a mesoscale two-dimensional model. J. Atmos. Sci. 1989, 46, 3077–3107. [Google Scholar] [CrossRef]
  77. Mlawer, E.J.; Taubman, S.J.; Brown, P.D.; Iacono, M.J.; Clough, S.A. Radiative transfer for inhomogeneous atmospheres: RRTM, a validated correlated-k model for the longwave. J. Geophys. Res. Space Phys. 1997, 102, 16663–16682. [Google Scholar] [CrossRef] [Green Version]
  78. Federico, S.; Petracca, M.; Panegrossi, G.; Transerici, C.; Dietrich, S. Impact of the assimilation of lightning data on the precipitation forecast at different forecast ranges. Adv. Sci. Res. 2017, 14, 187–194. [Google Scholar] [CrossRef] [Green Version]
  79. Betz, H.D.; Schmidt, K.; Laroche, P.; Blanchet, P.; Oettinger, W.P.; Defer, E.; Dziewit, Z.; Konarski, J. LINET—An international lightning detection network in Europe. Atmos. Res. 2009, 91, 564–573. [Google Scholar] [CrossRef]
  80. Betz, H.-D.; Schmidt, K.; Oettinger, P.; Wirz, M. Lightning detection with 3-D discrimination of intracloud and cloud-to-ground discharges. Geophys. Res. Lett. 2004, 31. [Google Scholar] [CrossRef]
  81. Federico, S.; Avolio, E.; Petracca, M.; Panegrossi, G.; Sanò, P.; Casella, D.; Dietrich, S. Simulating lightning into the RAMS model: Implementation and preliminary results. Nat. Hazards Earth Syst. Sci. 2014, 14, 2933–2950. [Google Scholar] [CrossRef] [Green Version]
  82. Dixon, K.; Mass, C.F.; Hakim, G.J.; Holzworth, R.H. The Impact of Lightning Data Assimilation on Deterministic and Ensemble Forecasts of Convective Events. J. Atmos. Ocean. Technol. 2016, 33, 1801–1823. [Google Scholar] [CrossRef]
  83. Accadia, C.; Mariani, S.; Casaioli, M.; Lavagnini, A.; Speranza, A. Sensitivity of Precipitation Forecast Skill Scores to Bilinear Interpolation and a Simple Nearest-Neighbor Average Method on High-Resolution Verification Grids. Weather Forecast. 2003, 18, 918–932. [Google Scholar] [CrossRef]
  84. Mesinger, F. Improvements in Quantitative Precipitation Forecasts with the Eta Regional Model at the National Centers for Environmental Prediction: The 48-km Upgrade. Bull. Am. Meteorol. Soc. 1996, 77, 2637–2649. [Google Scholar] [CrossRef] [Green Version]
  85. Levine, R.A.; Wilks, D.S. Statistical Methods in the Atmospheric Sciences. J. Am. Stat. Assoc. 2000, 95, 344. [Google Scholar] [CrossRef]
  86. Navarro, A.; García-Ortega, E.; Merino, A.; Sánchez, J.L.; Kummerow, C.; Tapiador, F.J. Assessment of IMERG Precipitation Estimates over Europe. Remote Sens. 2019, 11, 2470. [Google Scholar] [CrossRef] [Green Version]
  87. Fierro, A.O.; Gao, J.; Ziegler, C.L.; Calhoun, K.M.; Mansell, E.R.; MacGorman, D.R. Assimilation of Flash Extent Data in the Variational Framework at Convection-Allowing Scales: Proof-of-Concept and Evaluation for the Short-Term Forecast of the 24 May 2011 Tornado Outbreak. Mon. Weather Rev. 2016, 144, 4373–4393. [Google Scholar] [CrossRef]
  88. Pessi, A.T.; Businger, S. The Impact of Lightning Data Assimilation on a Winter Storm Simulation over the North Pacific Ocean. Mon. Weather Rev. 2009, 137, 3177–3195. [Google Scholar] [CrossRef] [Green Version]
Figure 1. Weather research and forecasting (WRF) model domain. Yellow dots represent the small islands’ positions.
Remotesensing 13 00682 g001
Figure 2. Mean precipitation over the month of November 2019 for (a) CTRL forecast, (b) LIGHT forecast, and (c) Integrated Multi-satellitE Retrievals for Global Precipitation Mission (IMERG).
Remotesensing 13 00682 g002
Figure 3. Pearson correlation coefficient of the WRF precipitation forecast over the central Mediterranean domain: (a) CTRL forecast, (b) LIGHT forecast, and (c) correlation coefficient differences between LIGHT and CTRL. The positive values (green-yellow) in panel (c) show a better performance of the LIGHT forecast.
Remotesensing 13 00682 g003
Figure 4. AC of the 3 h precipitation for the whole month of November 2019 for (a) land grid points and (b) sea grid points. CTRL is in red, LIGHT is in blue, and the difference between LIGHT and CTRL, in this order, is in green. A positive value of the green curve shows a better performance of the LIGHT forecast compared to CTRL.
Remotesensing 13 00682 g004
Figure 5. Taylor diagram for CTRL (red triangles) and LIGHT (blue squares) forecasts for land and sea. CS (CL) is for the CTRL forecast over the sea (over land) and LS (LL) is for the LIGHT forecast over the sea (over land).
Remotesensing 13 00682 g005
Figure 6. Time series of daily rainfall for Lipari (a) and Elba (b) islands. Observations are in blue, CTRL forecasts in red, and LIGHT forecasts in green.
Remotesensing 13 00682 g006
Figure 7. Precipitation between 00 and 03 UTC on 12 November. (a) Precipitation observed by the Italian rain gauge network, (b) precipitation estimation by GPM-IMERG Final Run, (c) precipitation simulated by the CTRL run, and (d) precipitation simulated by the LIGHT run.
Remotesensing 13 00682 g007
Table 1. Number of grid points out of a total of 27,602 grid points where the CTRL or LIGHT correlation coefficient is greater than a selected threshold.
Correlation Coefficient Threshold
R0.10.30.50.7
CTRL24,78316,2375476731
LIGHT24,90818,32780671242
Table 2. Average of the anomaly correlation (AC) for the whole period for the 3 h precipitation, for the CTRL forecast, the LIGHT forecast, and the improvement of LIGHT compared to CTRL in percentage (variation).
ACCTRLLIGHTVariation (%)
LAND_3 h0.500.535%
SEA_3 h0.440.49 8%
Table 3. RMSE (Root Mean Square Error) and Pearson correlation coefficients for six islands in the central Mediterranean basin around Italy. The statistics are computed considering all the 3 h rainfall forecasts for November 2019 (C is for CTRL; L is for LIGHT).
ElbaGiglioLipariMontecristoPantelleriaPonza
CLCLCLCLCLCL
RMSE (mm)1.761.364.364.222.341.502.262.151.391.322.462.60
r0.700.830.450.490.580.780.400.470.490.540.660.60
Table 4. RMSE and Pearson correlation coefficients for six islands in the Central Mediterranean basin around Italy. The statistics are computed considering the daily rainfall forecasts. The daily rainfall forecast is the summation of the eight 3 h forecasts within a day.
ElbaGiglioLipariMontecristoPantelleriaPonza
CLCLCLCLCLCL
RMSE (mm)7.095.2813.3311.646.194.658.208.194.453.789.9311.61
r0.710.850.500.600.850.920.480.480.810.910.620.58
Publisher’s Note: MDPI stays neutral with regard to jurisdictional claims in published maps and institutional affiliations.

