
Aerosol—Cloud Interaction with Summer Precipitation over Major Cities in Eritrea


Abstract
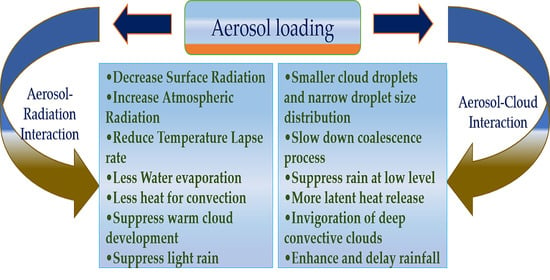
1. Introduction
2. Materials and Methods
2.1. Study Area and Meteorology
2.2. Satellite-Derived Data
2.3. Methods
2.3.1. Anomaly and Spatial Analysis
2.3.2. Correlation Coefficient
2.3.3. Hybrid Single-Particle Lagrangian Integrated Trajectory Analysis
3. Results and Discussion
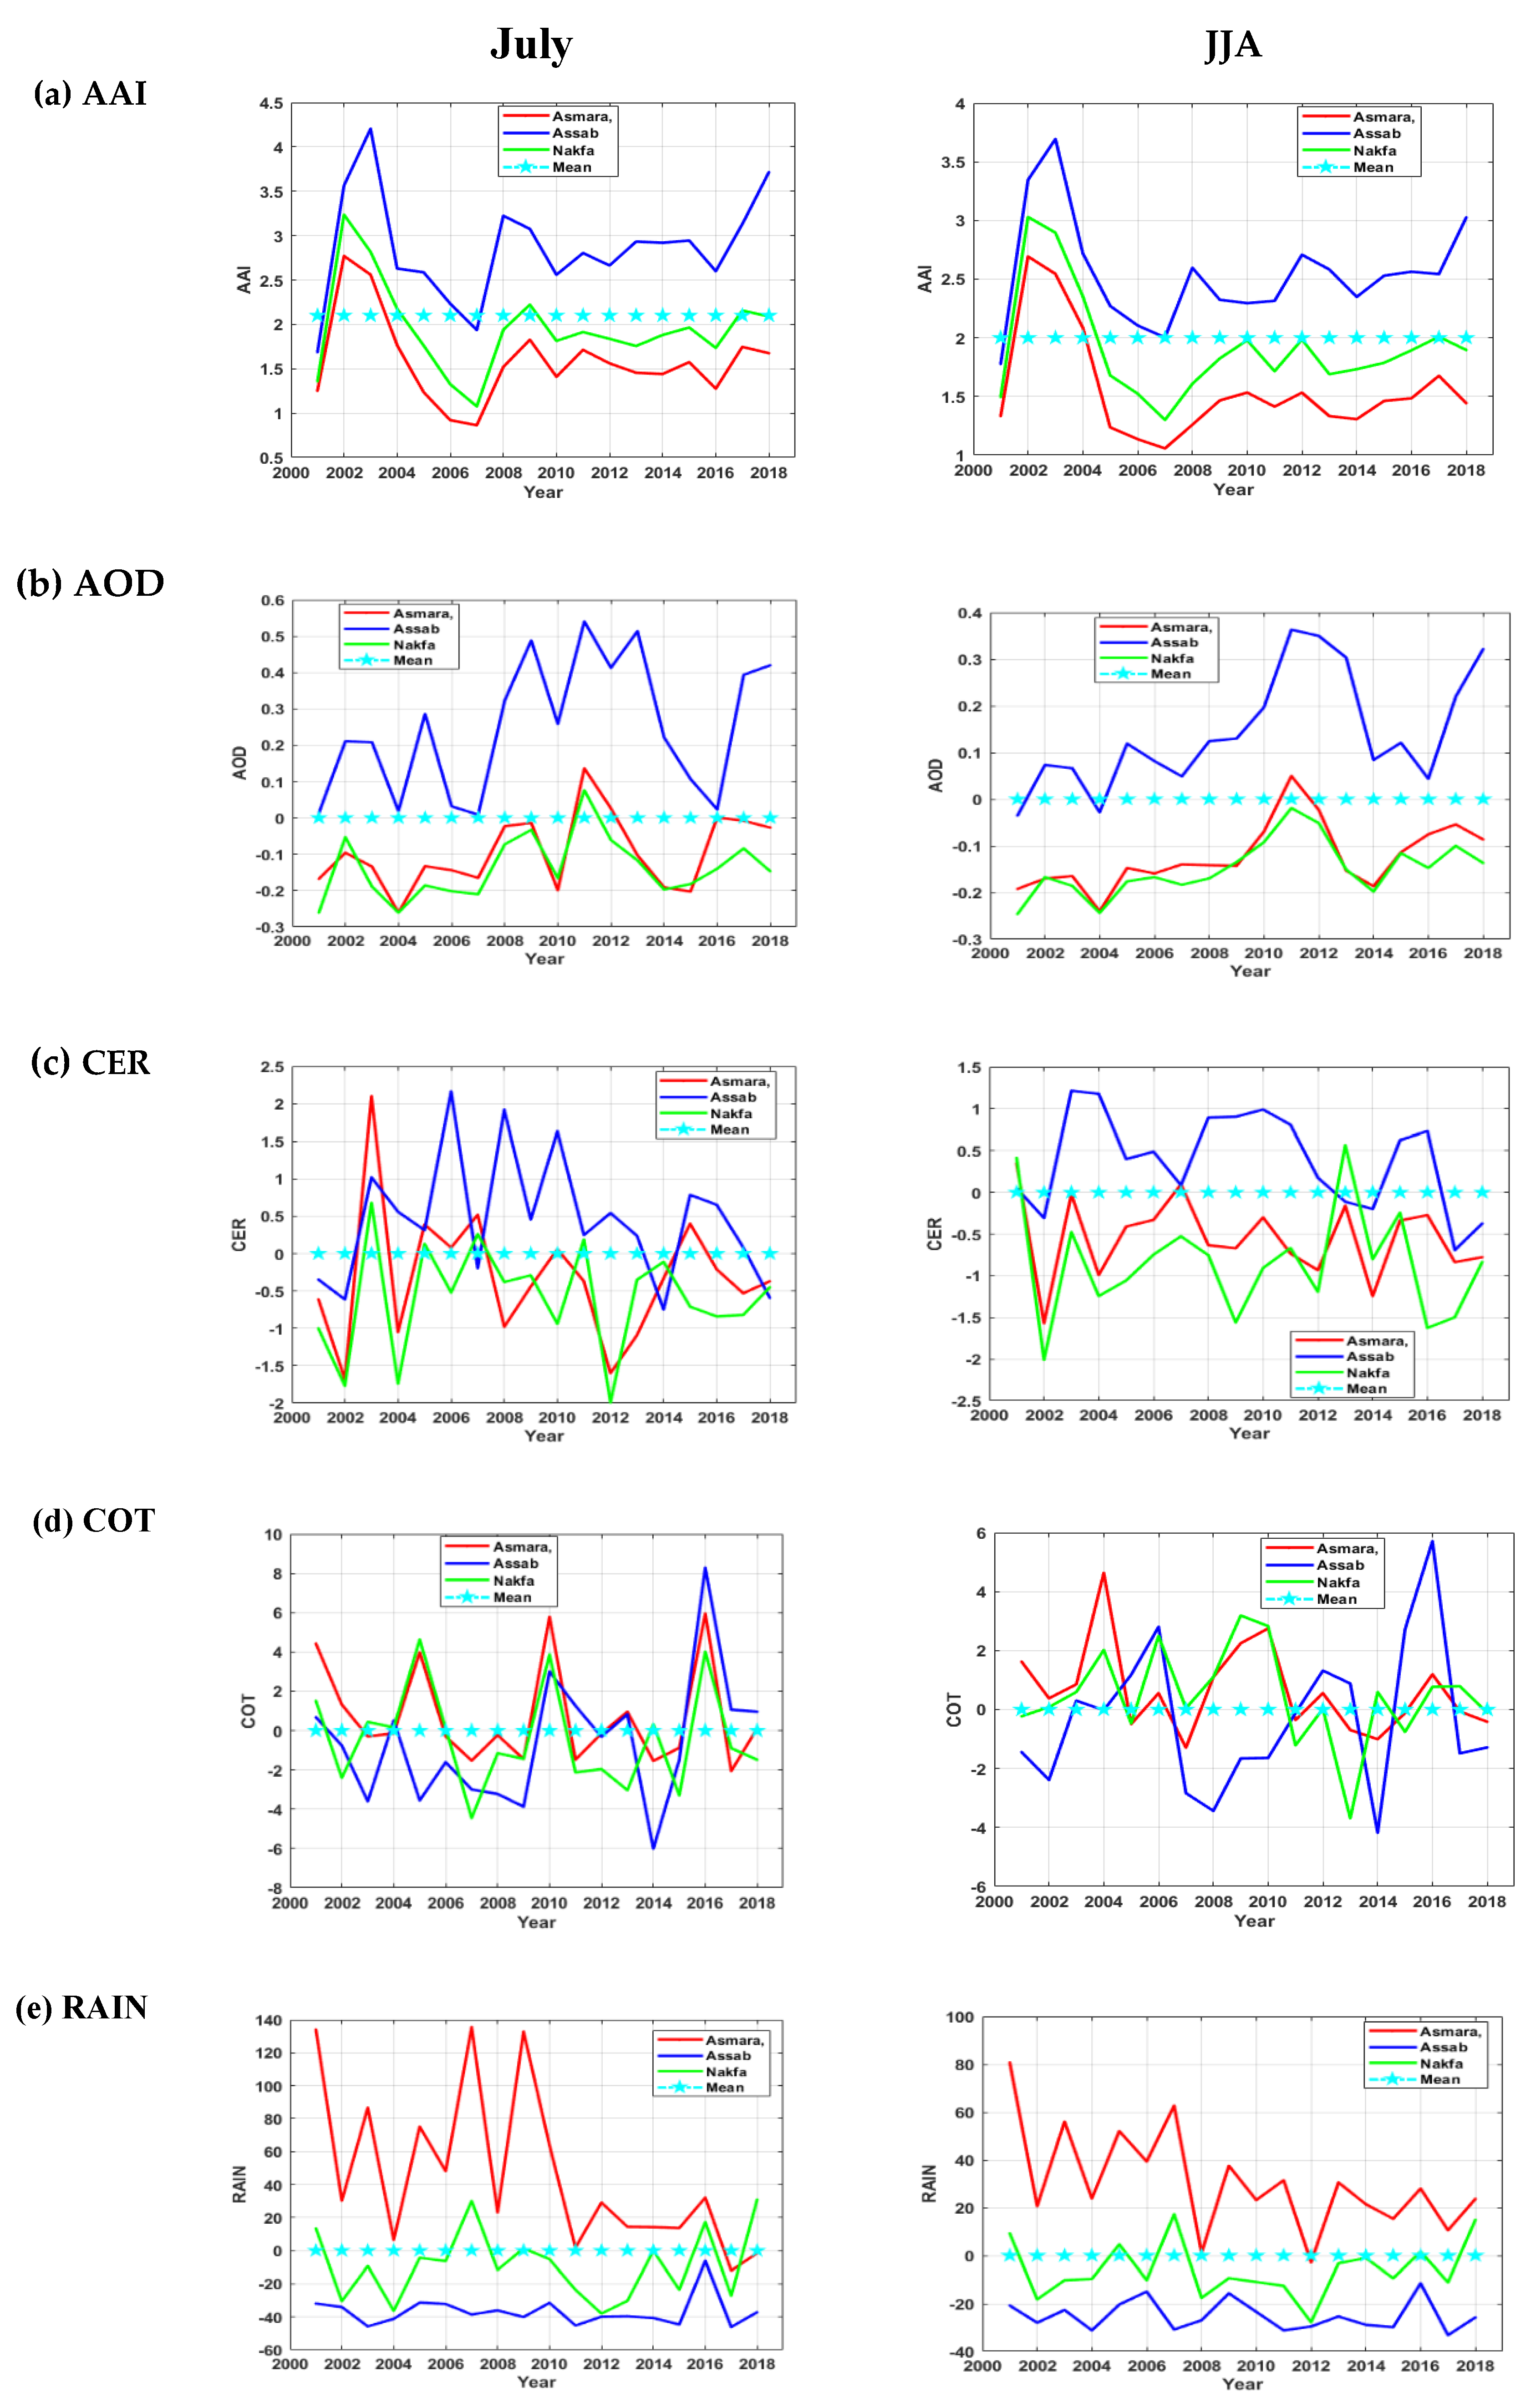
3.1. Time Series Analysis Based on Anomaly
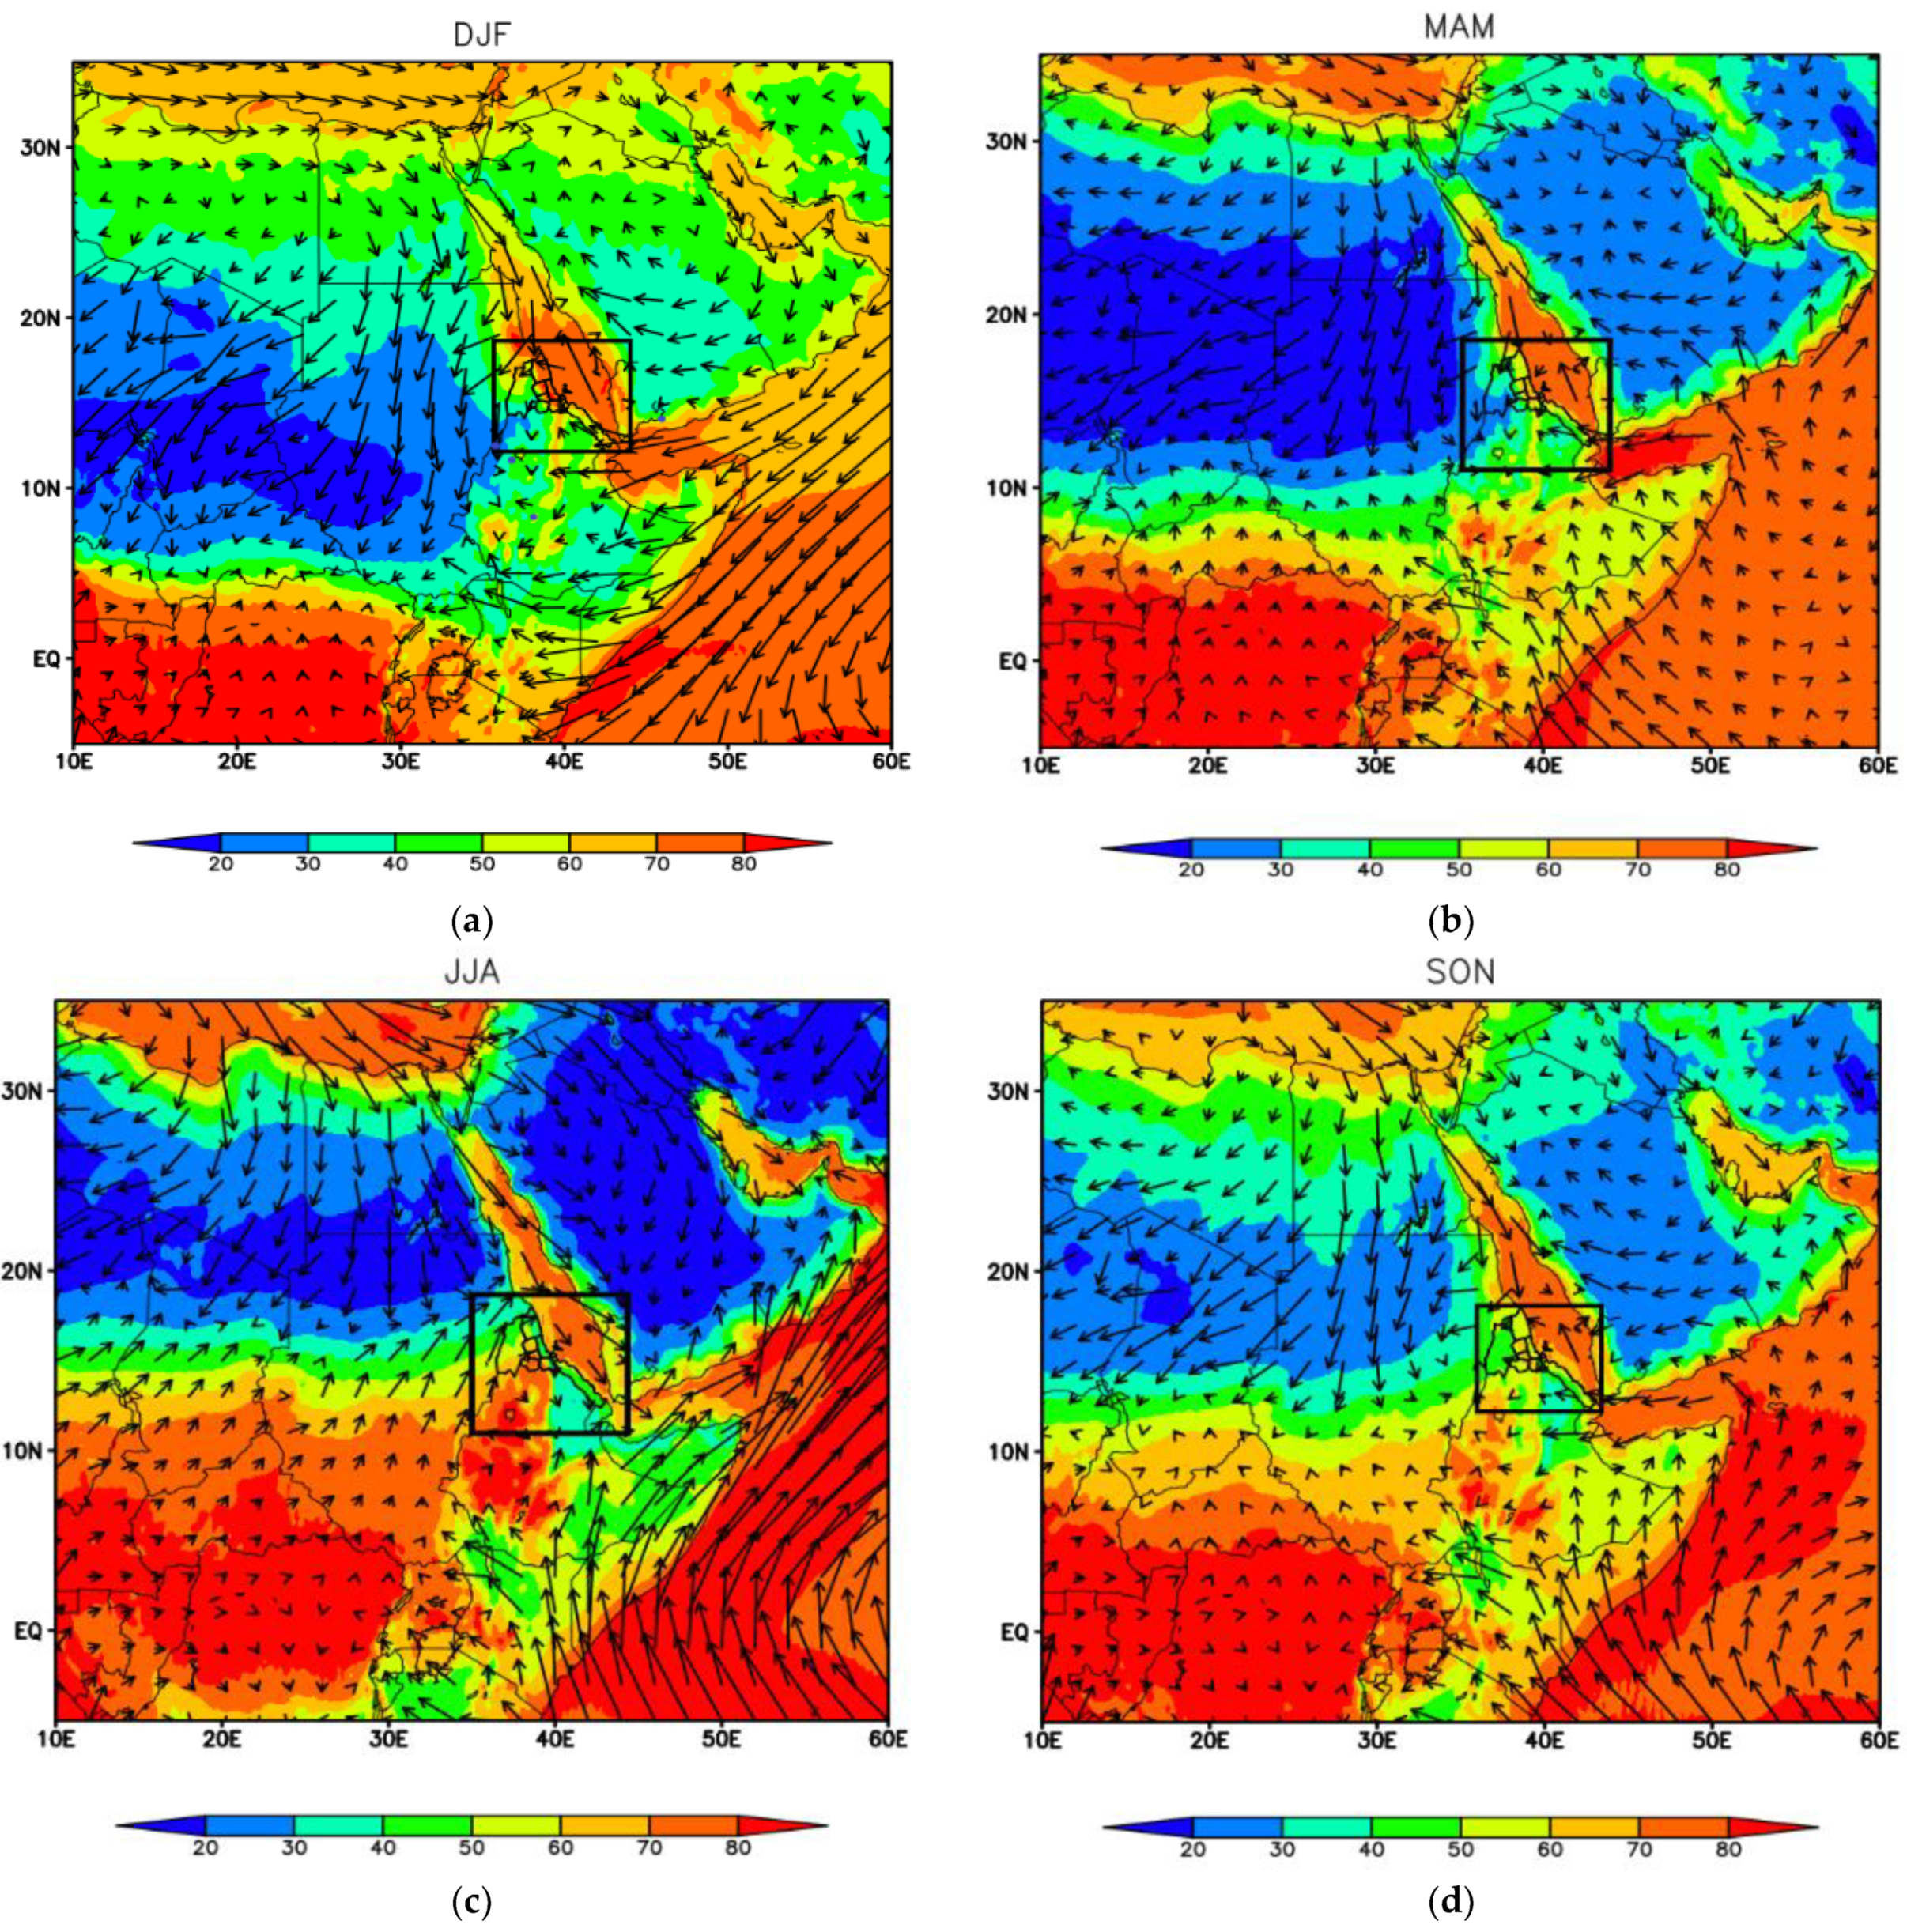
3.2. Monthly (July) and Seasonal (JJA) Spatial Plot
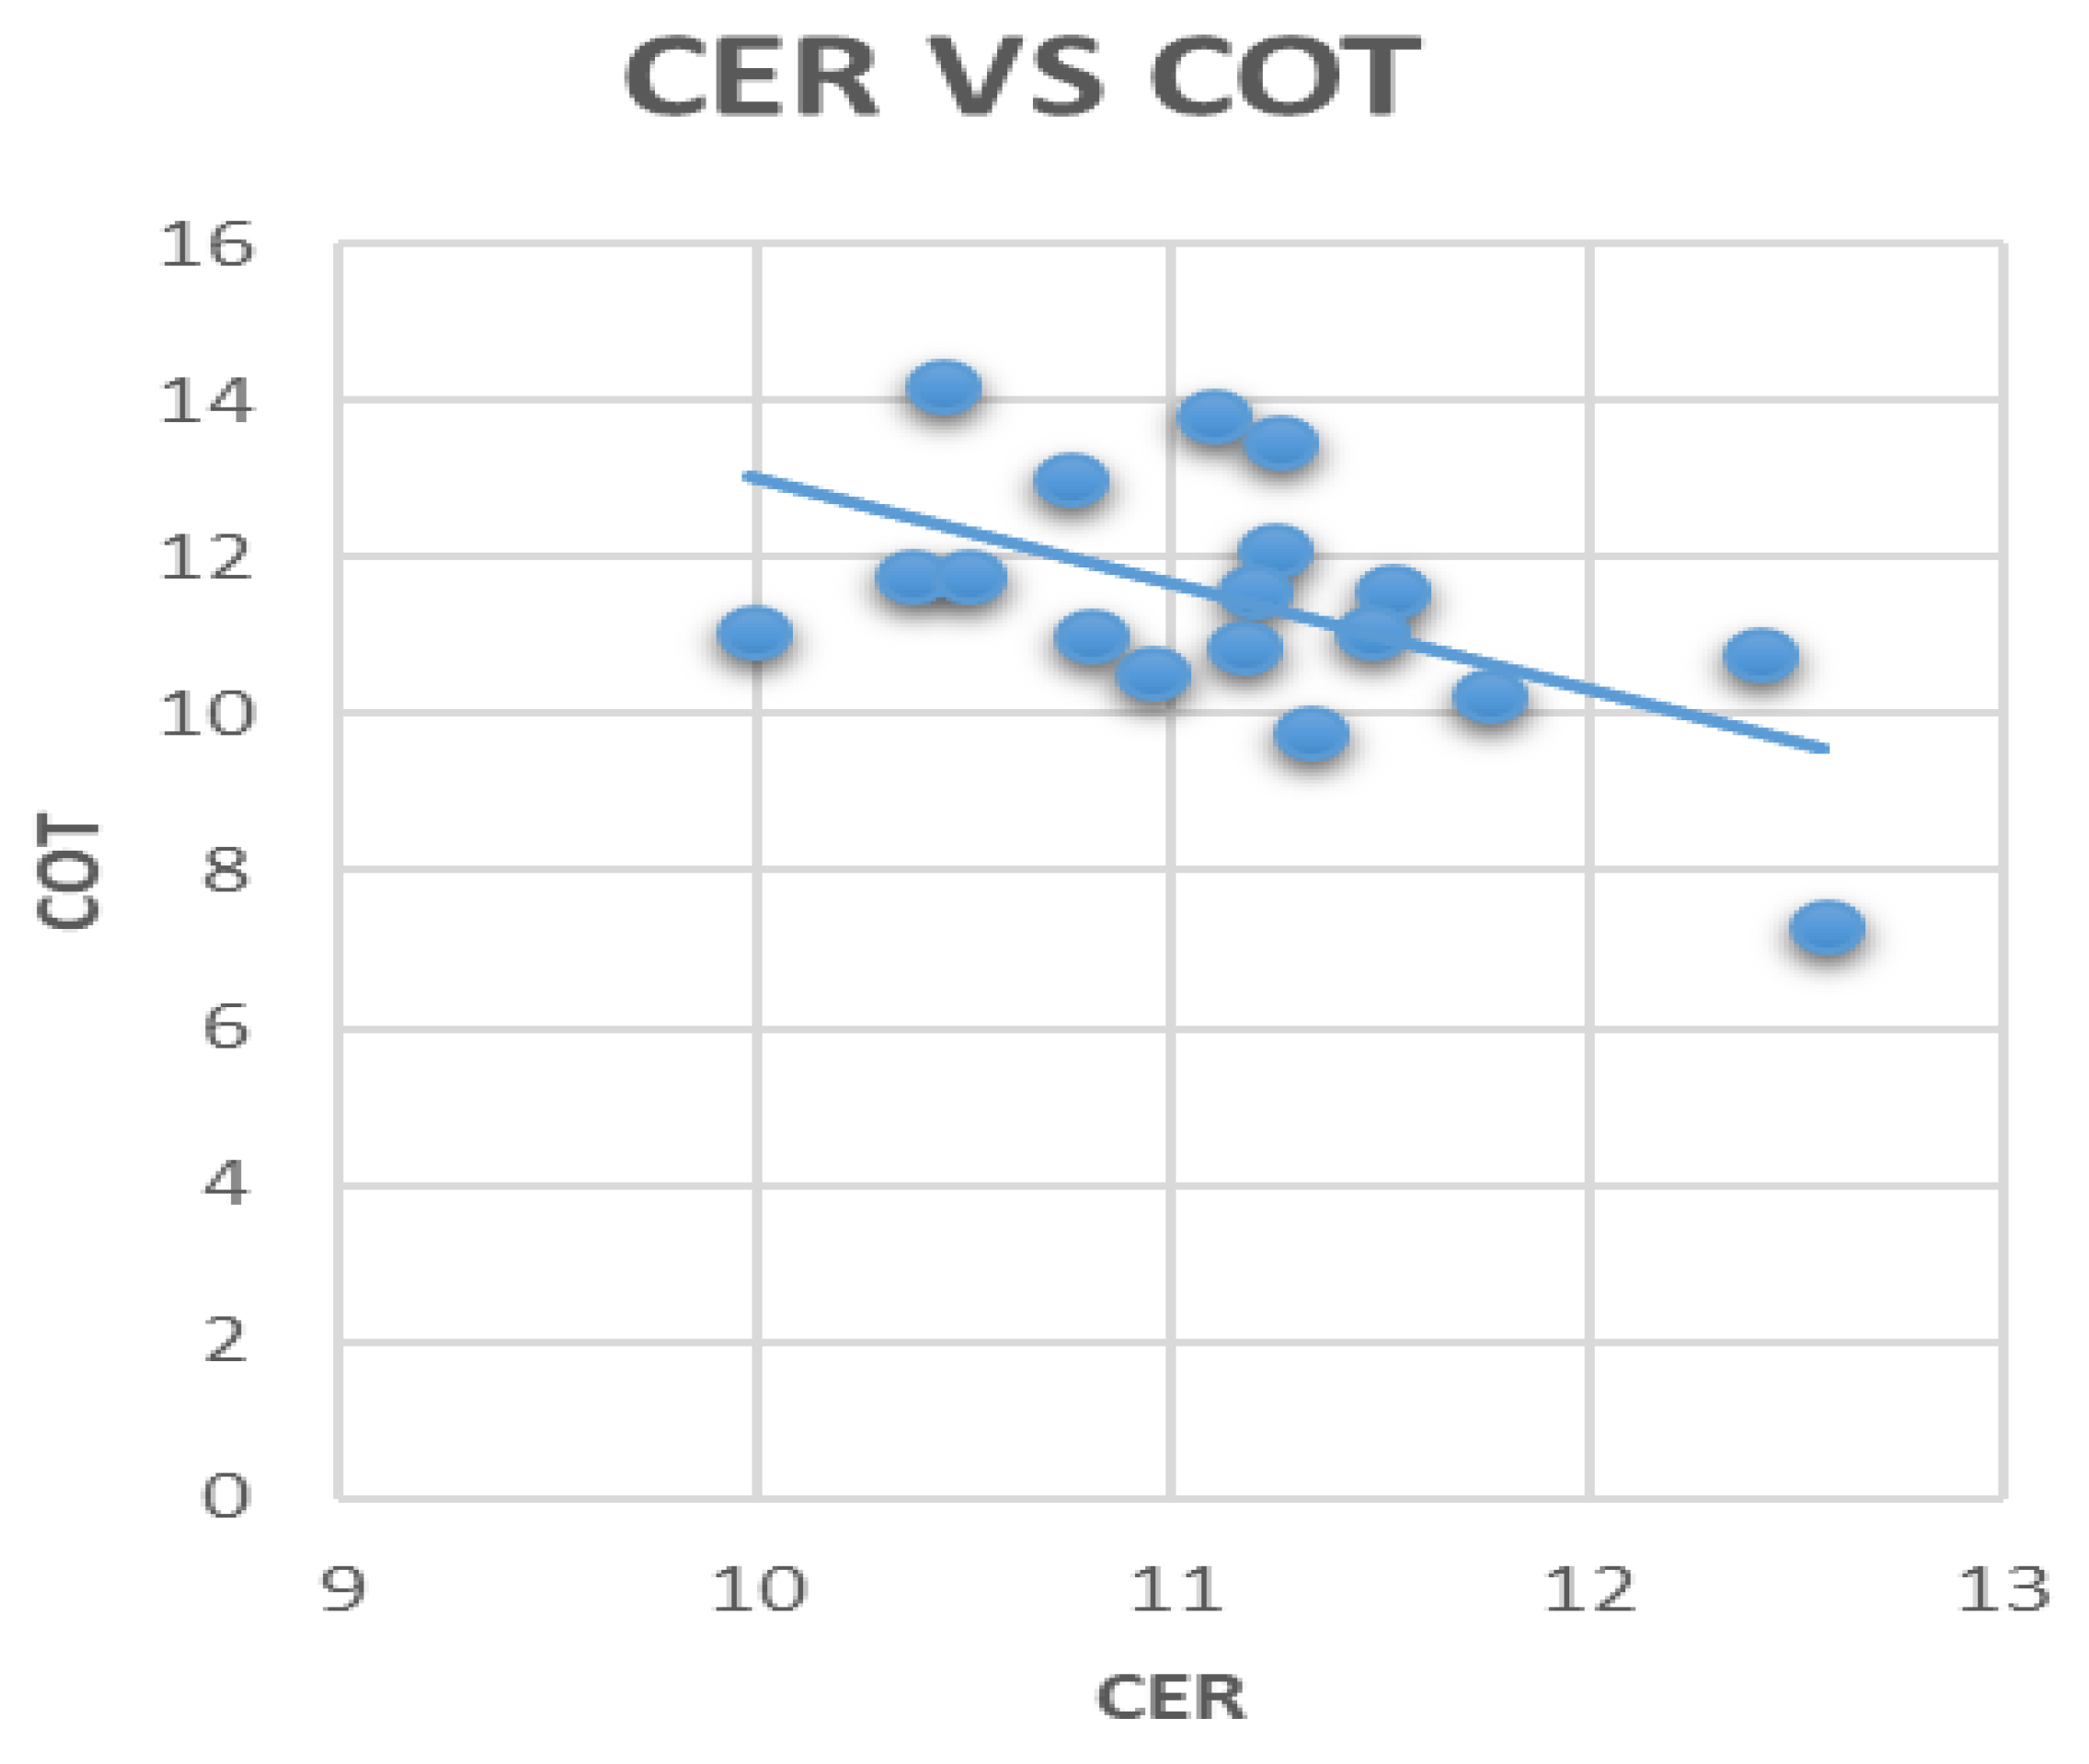
3.3. Correlation between Aerosols, Clouds, and Rainfall
3.4. HYSPLIT Model
4. Conclusions
Author Contributions
Funding
Acknowledgments
Conflicts of Interest
References
- Levin, Z.; Cotton, W.R. Aerosol Pollution Impact on Precipitation: A Scientific Review; Springer: Dordrecht, The Netherlands, 2009; ISBN 9781402086892. [Google Scholar]
- Gitau, W.; Ogallo, L.; Camberlin, P.; Okoola, R. Spatial coherence and potential predictability assessment of intraseasonal statistics of wet and dry spells over Equatorial Eastern Africa. Int. J. Climatol. 2013, 33. [Google Scholar] [CrossRef]
- Bates, B.C.; Kundzewicz, Z.W.; Wu, S.; Palutikof, J.P. Climate Change and Water; Technical Paper of the Intergovernmental Panel on Climate Change; The Intergovernmental Panel on Climate Change (IPCC): Geneva, Switzerland, 2008; ISBN 9789291691234. [Google Scholar]
- Majone, B.; Bovolo, C.I.; Bellin, A.; Blenkinsop, S.; Fowler, H.J. Modeling the impacts of future climate change on water resources for the Gllego river basin (Spain). Water Resour. Res. 2012, 48. [Google Scholar] [CrossRef]
- Schumacher, C.; Houze, R.A. Stratiform rain in the tropics as seen by the TRMM precipitation radar. J. Clim. 2003, 16, 1739–1756. [Google Scholar] [CrossRef]
- Li, W.; Zhang, F.; Yu, Y.; Iwabuchi, H.; Shen, Z.; Wang, G.; Zhang, Y. The semi-diurnal cycle of deep convective systems over Eastern China and its surrounding seas in summer based on an automatic tracking algorithm. Clim. Dyn. 2020, 1–23. [Google Scholar] [CrossRef]
- Seifert, A.; Köhler, C.; Beheng, K.D. Aerosol-Cloud-Precipitation effects over Germany as simulated by a convective-scale numerical weather prediction model. Atmos. Chem. Phys. 2012, 12, 709–725. [Google Scholar] [CrossRef]
- Huang, J.; Bu, L.; Kumar, K.R.; Khan, R.; Devi, N.S.M.P.L. Investigating the relationship between aerosol and cloud optical properties inferred from the MODIS sensor in recent decades over East China. Atmos. Environ. 2020, 239, 117812. [Google Scholar] [CrossRef]
- Yu, Q.R.; Zhang, F.; Li, J.; Zhang, J. Analysis of sea-salt aerosol size distributions in radiative transfer. J. Aerosol Sci. 2019, 129, 71–86. [Google Scholar] [CrossRef]
- Andreae, M.O.; Rosenfeld, D. Aerosol-Cloud-Precipitation interactions. Part 1. The nature and sources of cloud-active aerosols. Earth Sci. Rev. 2008, 89, 13–41. [Google Scholar] [CrossRef]
- Huang, J.; Zhang, C.; Prospero, J.M. African aerosol and large-scale precipitation variability over West Africa. Environ. Res. Lett. 2009, 4, 015006. [Google Scholar] [CrossRef]
- Talukdar, S.; Jana, S.; Maitra, A. Dominance of pollutant aerosols over an urban region and its impact on boundary layer temperature profile. J. Geophys. Res. 2017. [Google Scholar] [CrossRef]
- Zhang, F.; Yu, Q.-R.; Wang, Y.; He, Q.; Cheng, T.; Yu, X.; Liu, D.; Chen, C. Analysis of cirrus cloud over the Tibetan Plateau from CALIPSO data: An altitude perspective. Atmos. Chem. Phys. Discuss. 2020, 20, 1–28. [Google Scholar] [CrossRef]
- Solomon, S.D.; Qin, M.; Manning, Z.; Chen, M.; Marquis, K.B.; Averyt, M.T.; Miller, H.L.; Solomon, S.; Qin, D.; Manning, M.; et al. Summary for policymakers. In Climate Change 2007: The Physical Science Basis; Contribution of Working Group I to the Fourth Assessment Report of the Intergovernmental Panel on Climate, Change; Qin, D., Manning, M., Chen, Z., Marquis, M., Averyt, K., Tignor, M., Miller, H.L., Eds.; Cambridge University Press: New York, NY, USA, 2007. [Google Scholar] [CrossRef]
- Ramachandran, S.; Kedia, S. Aerosol-Precipitation interactions over India: Review and future perspectives. Adv. Meteorol. 2013, 2013. [Google Scholar] [CrossRef]
- Nenes, A.; Murray, B.; Bougiatioti, A. Mineral dust and its microphysical interactions with clouds. In Mineral Dust: A Key Player in the Earth System; Springer: Dordrecht, The Netherlands, 2014; ISBN 9789401789783. [Google Scholar]
- Tao, W.K.; Chen, J.P.; Li, Z.; Wang, C.; Zhang, C. Impact of aerosols on convective clouds and precipitation. Rev. Geophys. 2012, 50. [Google Scholar] [CrossRef]
- Fan, J.; Leung, L.R.; Demott, P.J.; Comstock, J.M.; Singh, B.; Rosenfeld, D.; Tomlinson, J.M.; White, A.; Prather, K.A.; Minnis, P.; et al. Aerosol impacts on California winter clouds and precipitation during calwater 2011: Local pollution versus long-range transported dust. Atmos. Chem. Phys. 2014, 14. [Google Scholar] [CrossRef]
- Measho, S.; Chen, B.; Trisurat, Y.; Pellikka, P.; Guo, L.; Arunyawat, S.; Tuankrua, V.; Ogbazghi, W.; Yemane, T. Spatio-Temporal analysis of vegetation dynamics as a response to climate variability and drought patterns in the Semiarid Region, Eritrea. Remote Sens. 2019, 11, 724. [Google Scholar] [CrossRef]
- Contributors, W.C. Bibliographic Details for File: Eritrea in Africa. (-Mini map -rivers).svg. Available online: https://commons.wikimedia.org/w/index.php?title=File:Eritrea_in_Africa_(-mini_map_-rivers).svg&oldid=507056334 (accessed on 2 January 2021).
- King, M.D.; Menzel, W.P.; Kaufman, Y.J.; Tanré, D.; Gao, B.C.; Platnick, S.; Ackerman, S.A.; Remer, L.A.; Pincus, R.; Hubanks, P.A. Cloud and aerosol properties, precipitable water, and profiles of temperature and water vapor from MODIS. IEEE Trans. Geosci. Remote Sens. 2003, 41, 442–458. [Google Scholar] [CrossRef]
- Holben, B.N.; Tanré, D.; Smirnov, A.; Eck, T.F.; Slutsker, I.; Abuhassan, N.; Newcomb, W.W.; Schafer, J.S.; Chatenet, B.; Lavenu, F.; et al. An emerging ground-based aerosol climatology: Aerosol optical depth from AERONET. J. Geophys. Res. Atmos. 2001, 16. [Google Scholar] [CrossRef]
- Remer, L.A.; Kleidman, R.G.; Levy, R.C.; Kaufman, Y.J.; Tanré, D.; Mattoo, S.; Martins, J.V.; Ichoku, C.; Koren, I.; Yu, H.; et al. Global aerosol climatology from the MODIS satellite sensors. J. Geophys. Res. Atmos. 2008, 113. [Google Scholar] [CrossRef]
- King, M.; Tsay, S.; Platnick, S.; Wang, M.; Liou, K.-N. Cloud Retrieval Algorithms for MODIS: Optical Thickness, Effective Particle Radius, and Thermodynamic Phase; MODIS Algorithm Theor. Basis Doc. No. ATBD-MOD-05; University of California: Los Angeles, CA, USA, 1997. [Google Scholar]
- Janssen, R.H.H.; Ganzeveld, L.N.; Kabat, P.; Kulmala, M.; Nieminen, T.; Roebeling, R.A. Estimating seasonal variations in cloud droplet number concentration over the boreal forest from satellite observations. Atmos. Chem. Phys. 2011, 11. [Google Scholar] [CrossRef]
- Chylek, P.; Dubey, M.K.; Lohmann, U.; Ramanathan, V.; Kaufman, Y.J.; Lesins, G.; Hudson, J.; Altmann, G.; Olsen, S. Aerosol indirect effect over the Indian Ocean. Geophys. Res. Lett. 2006, 33. [Google Scholar] [CrossRef]
- Nakajima, T.; King, M.D.; Radke, L.F.; Spinhirne, J.D. Determination of the optical thickness and effective particle radius of clouds from reflected solar radiation measurements. Part II: Marine stratocumulus observations. J. Atmos. Sci. 1991, 48, 728–751. [Google Scholar] [CrossRef]
- Torres, O.; Tanskanen, A.; Veihelmann, B.; Ahn, C.; Braak, R.; Bhartia, P.K.; Veefkind, P.; Levelt, P. Aerosols and surface UV products form ozone monitoring instrument observations: An overview. J. Geophys. Res. Atmos. 2007, 112. [Google Scholar] [CrossRef]
- Fisher, B.L. Climatological validation of TRMM TMI and PR monthly rain products over Oklahoma. J. Appl. Meteorol. 2004, 43, 519–535. [Google Scholar] [CrossRef]
- Simpson, J.; Adler, R.F.; North, G.R. A proposed tropical rainfall measuring mission (TRMM) satellite. Bull. Am. Meteorol. Soc. 1988, 69. [Google Scholar] [CrossRef]
- Kummerow, C.; Barnes, W.; Kozu, T.; Shiue, J.; Simpson, J. The tropical rainfall measuring mission (TRMM) sensor package. J. Atmos. Ocean. Technol. 1998, 15, 809–817. [Google Scholar] [CrossRef]
- Hu, K.; Kumar, K.R.; Kang, N.; Boiyo, R.; Wu, J. Spatiotemporal characteristics of aerosols and their trends over mainland China with the recent Collection 6 MODIS and OMI satellite datasets. Environ. Sci. Pollut. Res. 2018, 25, 6909–6927. [Google Scholar] [CrossRef]
- Srivastava, R.; Ramachandran, S.; Rajesh, T.A.; Kedia, S. Aerosol radiative forcing deduced from observations and models over an urban location and sensitivity to single scattering albedo. Atmos. Environ. 2011, 45, 6163–6171. [Google Scholar] [CrossRef]
- Rosenfeld, D. Suppression of rain and snow by urban and industrial air pollution. Science 2000, 287, 1793–1796. [Google Scholar] [CrossRef]
- Ramanathan, V.; Crutzen, P.J.; Kiehl, J.T.; Rosenfeld, D. Atmosphere: Aerosols, climate, and the hydrological cycle. Science 2001, 294, 2119–2124. [Google Scholar] [CrossRef]
- Patra, P.K.; Behera, S.K.; Herman, J.R.; Maksyutov, S.; Akimoto, H.; Yamagata, T. The Indian summer monsoon rainfall: Interplay of coupled dynamics, radiation and cloud microphysics. Atmos. Chem. Phys. 2005, 5. [Google Scholar] [CrossRef]
- Flossmann, A.I.; Hall, W.D.; Pruppacher, H.R. A theoretical study of the wet removal of atmospheric pollutants. Part I: The redistribution of aerosol particles captured through nucleation and impaction scavenging by growing cloud drops. J. Atmos. Sci. 1985, 42, 583–606. [Google Scholar] [CrossRef]
- Ramachandran, S.; Cherian, R. Regional and seasonal variations in aerosol optical characteristics and their frequency distributions over India during 2001–2005. J. Geophys. Res. Atmos. 2008, 113. [Google Scholar] [CrossRef]
- Rolph, G.; Stein, A.; Stunder, B. Real-Time environmental applications and display system: READY. Environ. Model. Softw. 2017, 95, 210–228. [Google Scholar] [CrossRef]
- Draxler, R.R.; Rolph, G.D. HYSPLIT (HYbrid Single-Particle Lagrangian Integrated Trajectory); NOAA Air Resources Laboratory: College Park, MD, USA, 2003. [Google Scholar]
- Ghebrezgabher, M.G.; Yang, X. Spatio-temporal Assessment of climate change in Eritrea based on precipitation and temperature variables. World Wide J. Multidiscip. Res. Dev. 2018, 4, 1–10. [Google Scholar]


| Month/Season | Year | Mean | |||||||||||||||||
|---|---|---|---|---|---|---|---|---|---|---|---|---|---|---|---|---|---|---|---|
| 2001 | 2002 | 2003 | 2004 | 2005 | 2006 | 2007 | 2008 | 2009 | 2010 | 2011 | 2012 | 2013 | 2014 | 2015 | 2016 | 2017 | 2018 | ||
| Asm | |||||||||||||||||||
| July | 185 | 81 | 138 | 58 | 126 | 99 | 187 | 74 | 184 | 115 | 53 | 80 | 65 | 65 | 65 | 83 | 39 | 50 | 97 ± 48 |
| Total JJA | 365 | 185 | 291 | 195 | 279 | 241 | 311 | 126 | 236 | 193 | 218 | 115 | 215 | 187 | 169 | 207 | 155 | 194 | 216 ± 64 |
| July % | 51 | 44 | 47 | 30 | 45 | 41 | 60 | 59 | 78 | 60 | 24 | 70 | 30 | 35 | 38 | 40 | 25 | 26 | 45 ± 16 |
| % diff in July | +91 | −16 | +42 | −41 | +30 | +2 | +92 | −24 | +90 | +18 | −46 | −17 | −33 | −33 | −33 | −14 | −60 | −49 | |
| % diff in total | +69 | −14 | +35 | −10 | +29 | +12 | +44 | −42 | +9 | −11 | +1 | −47 | −1 | −13 | −22 | −4 | −28 | −10 | |
| Month/Season | Year | Mean | |||||||||||||||||
|---|---|---|---|---|---|---|---|---|---|---|---|---|---|---|---|---|---|---|---|
| 2001 | 2002 | 2003 | 2004 | 2005 | 2006 | 2007 | 2008 | 2009 | 2010 | 2011 | 2012 | 2013 | 2014 | 2015 | 2016 | 2017 | 2018 | ||
| Asb | |||||||||||||||||||
| July | 19 | 17 | 5 | 10 | 20 | 19 | 12 | 15 | 11 | 20 | 6 | 11 | 11 | 10 | 6 | 45 | 5 | 14 | 14 ± 9 |
| Total JJA | 61 | 39 | 55 | 30 | 62 | 78 | 31 | 42 | 76 | 53 | 30 | 34 | 47 | 37 | 34 | 89 | 24 | 46 | 48 ± 19 |
| July % | 31 | 43 | 10 | 33 | 32 | 24 | 41 | 35 | 14 | 37 | 20 | 32 | 24 | 28 | 19 | 51 | 21 | 30 | 29 ± 10 |
| % diff in July | +37 | +22 | −62 | −30 | +41 | +35 | −11 | +7 | −22 | +40 | −59 | −20 | −19 | −26 | −54 | +220 | −65 | −1 | |
| % diff in total | +27 | −18 | +15 | −38 | +29 | +63 | −36 | −12 | +58 | +10 | −38 | −28 | −2 | −24 | −30 | +85 | −51 | −4 | |
| Month/Season | Year | Mean | |||||||||||||||||
|---|---|---|---|---|---|---|---|---|---|---|---|---|---|---|---|---|---|---|---|
| 2001 | 2002 | 2003 | 2004 | 2005 | 2006 | 2007 | 2008 | 2009 | 2010 | 2011 | 2012 | 2013 | 2014 | 2015 | 2016 | 2017 | 2018 | ||
| Nkf | |||||||||||||||||||
| July | 64 | 21 | 42 | 15 | 47 | 45 | 81 | 39 | 52 | 46 | 27 | 13 | 21 | 51 | 27 | 68 | 24 | 82 | 43 ± 21 |
| Total JJA | 151 | 68 | 92 | 94 | 137 | 92 | 175 | 70 | 95 | 90 | 85 | 40 | 113 | 120 | 95 | 128 | 90 | 168 | 106 ± 35 |
| July % | 43 | 30 | 45 | 16 | 34 | 48 | 46 | 56 | 55 | 51 | 32 | 33 | 18 | 42 | 29 | 53 | 26 | 49 | 39 ± 12 |
| % diff in July | +50 | −52 | −3 | −66 | +9 | +4 | +89 | −8 | +22 | +6 | −36 | −70 | −52 | +18 | −36 | +59 | −45 | +91 | |
| % diff in total | +42 | −35 | −13 | −11 | +29 | −13 | +65 | −34 | −10 | −15 | −19 | −62 | +7 | +13 | −11 | +21 | −15 | +58 | |
| Region | AOD | Rainfall | AAI | CER | COT |
|---|---|---|---|---|---|
| Asmara | |||||
| AOD | 1.0 | ||||
| Rainfall | −0.245 | 1.0 | |||
| AAI | 0.142 | −0.199 | 1.0 | ||
| CER | −0.264 | 0.374 | −0.058 | 1.0 | |
| COT | −0.175 | 0.222 | −0.188 | 0.005 | 1.0 |
| Region | AOD | Rainfall | AAI | CER | COT | |
|---|---|---|---|---|---|---|
| Assab | ||||||
| AOD | 1.0 | |||||
| Rainfall | −0.408 | 1.0 | ||||
| AAI | 0.456 | −0.323 | 1.0 | |||
| CER | −0.118 | 0.132 | −0.051 | 1.0 | ||
| COT | −0.092 | 0.602 | −0.179 | 0.071 | 1.0 |
| Region | AOD | Rainfall | AAI | CER | COT |
|---|---|---|---|---|---|
| Nakfa | |||||
| AOD | 1.0 | ||||
| Rainfall | −0.337 | 1.0 | |||
| AAI | 0.334 | −0.429 | 1.0 | ||
| CER | 0.008 | 0.446 | −0.186 | 1.0 | |
| COT | −0.332 | 0.213 | −0.090 | 0.000 | 1.0 |
| Region | AOD | Rainfall | AAI | CER | COT |
|---|---|---|---|---|---|
| Asmara | |||||
| AOD | 1.0 | ||||
| Rainfall | −0.364 | 1.0 | |||
| AAI | −0.206 | −0.100 | 1.0 | ||
| CER | −0.071 | 0.681 | −0.389 | 1.0 | |
| COT | −0.286 | −0.048 | 0.334 | −0.029 | 1.0 |
| Region | AOD | Rainfall | AAI | CER | COT |
|---|---|---|---|---|---|
| Assab | |||||
| AOD | 1.0 | ||||
| Rainfall | −0.303 | 1.0 | |||
| AAI | 0.125 | −0.156 | 1.0 | ||
| CER | −0.255 | 0.310 | 0.059 | 1.0 | |
| COT | 0.026 | 0.485 | 0.033 | 0.280 | 1.0 |
| Region | AOD | Rainfall | AAI | CER | COT |
|---|---|---|---|---|---|
| Nakfa | |||||
| AOD | 0.1 | ||||
| Rainfall | −0.441 | 1.0 | |||
| AAI | −0.052 | −0.444 | 1.0 | ||
| CER | −0.193 | 0.347 | −0.455 | 1.0 | |
| COT | −0.128 | −0.206 | 0.120 | −0.550 | 1.0 |
Publisher’s Note: MDPI stays neutral with regard to jurisdictional claims in published maps and institutional affiliations. |
© 2021 by the authors. Licensee MDPI, Basel, Switzerland. This article is an open access article distributed under the terms and conditions of the Creative Commons Attribution (CC BY) license (http://creativecommons.org/licenses/by/4.0/).
Share and Cite
Berhane, S.A.; Bu, L. Aerosol—Cloud Interaction with Summer Precipitation over Major Cities in Eritrea. Remote Sens. 2021, 13, 677. https://doi.org/10.3390/rs13040677
Berhane SA, Bu L. Aerosol—Cloud Interaction with Summer Precipitation over Major Cities in Eritrea. Remote Sensing. 2021; 13(4):677. https://doi.org/10.3390/rs13040677
Chicago/Turabian StyleBerhane, Samuel A., and Lingbing Bu. 2021. "Aerosol—Cloud Interaction with Summer Precipitation over Major Cities in Eritrea" Remote Sensing 13, no. 4: 677. https://doi.org/10.3390/rs13040677
APA StyleBerhane, S. A., & Bu, L. (2021). Aerosol—Cloud Interaction with Summer Precipitation over Major Cities in Eritrea. Remote Sensing, 13(4), 677. https://doi.org/10.3390/rs13040677