Abstract
Flooding is one of the most destructive natural events that severely damage the ground and inundate underground infrastructure. Subway systems in metropolitan areas are susceptible to flooding, which may be exacerbated when land subsidence occurs. However, previous studies have focused on flood risk evaluation on regional/watershed-scales and land subsidence monitoring in plains, instead of on subway flood risk evaluation and how land subsidence aggravates the flood risk in subway systems. Using the proposed risk indicators and field survey data, we present a method assessing the flood risk of metropolitan subway systems under a subsidence condition based on the fuzzy analytic hierarchy process (FAHP) combined with a geographic information system (GIS). We use the regional risk level within the 500 m buffer zone of the subway line to depict the flood risk of the subway system. The proposed method was used to evaluate the flood risk of the Beijing subway system. The results show that the flood risks of the Beijing subway show a ring-like distribution pattern—risk levels decreasing from the central urban area to the suburbs. Very high and high risks are mainly located within third and fourth ring roads, accounting for 63.58% (29.40 km2) and 63.83% (81.19 km2) of the total area. Land subsidence exacerbated the Beijing subway system’s flood risk level—the moderate to very high risk increased by 46.88 km2 (16.33%), indicating that land subsidence is an essential factor affecting the flood risk level of subway systems. In addition to enhancing flood warnings, future subway flooding could be reduced by elevating the height of the stations’ exit (entrance) and installing water stop plates and watertight doors. This study is of great significance for flood warning and prevention in the Beijing subway system; it provides a theoretical basis for flood risk evaluation in other metropolitan areas.
1. Introduction
Flooding is one of the most devastating natural disasters that can cause tremendous loss of life and economic damages [1,2,3]. According to a preliminary investigation, floods resulted in approximately 7 million deaths and more than USD 700 billion losses worldwide from 1900 to 2016 [4]. Flood risks will increase in the future due to global and regional climate changes which cause extreme hydrological events, land subsidence, land-use change, and increasing sediment supply to water bodies [5,6,7,8,9]. These issues pose serious challenges to the sustainable development of human society.
Recently, rapid urban development has led to the extensive construction of underground infrastructure in large cities [10,11]. As a key piece of subsurface engineering, the subway system has become a significant underground lifeline, which plays a vital role in alleviating urban traffic congestion [12]. However, subway systems exacerbate urban vulnerability to natural hazards (e.g., typhoons, rainstorms, flooding, storm surges, and earthquakes) in addition to providing convenience [13,14,15,16]. In China, many major cities have frequently suffered from urban flooding [17,18,19,20]. Besides triggering serious urban waterlogging on the surface, rainstorms and flooding events also severely inundate underground facilities, especially the subway systems of large cities [12,21,22]. Thus, it is necessary to incorporate the subway system’s flood risk evaluation and prevention into the current urban management.
The subway system can be considered a “high-risk objective” for metropolitan areas due to their relatively closed structures and high ridership densities [12]. The flooding of subway systems in large cities has been a frequent occurrence worldwide in recent years and has caused considerable losses. For example, Fukuoka experienced a rainfall event of 60 mm/h in June 1999, which inundated multiple subway lines and led to a fatal accident [23]. The assessment report in 2009 showed that 17 lines, 97 stations, and 147 km of tunnels in the Tokyo metropolitan area were completely submerged underwater [24]. Hurricane Sandy (29 October 2012) resulted in heavy rainstorms and storm surges that submerged the metro near Manhattan, New York, causing USD 359 million in direct economic damage [21]. On 10 May 2016, the Changpan station of the Guangzhou Metro was flooded and caused eight deaths [25]. On 23 June 2011, heavy rainstorms in Beijing caused road flooding (maximum depth of 1.2 m) (Figure 1) and inundated the Taoranting and Military Museum subway stations [26]. On 11 April 2019, the Chegongmiao station on Line 1 of the Shenzhen Metro was inundated [27]. Therefore, a quantitative evaluation of a subway system’s flood risk is essential to develop emergency plans, implement emergency response, and reduce flood damage.
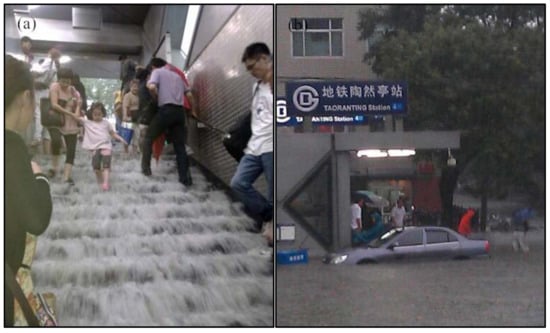
Figure 1.
The Beijing subway station was flooded during heavy rainfall on 23 June 2011. (a) Floodwater entered into the southwest exit (Exit D) of the Taoranting station along the escalator. (b) Road waterlogging outside the Taoranting subway station (Exit D).
However, very few studies conducted systematic flood risk evaluation and proposed corresponding flood management countermeasures for subways. Current studies focus on flood risk evaluation at regional and watershed scales. For example, Mishra and Sinha evaluated the flood risk in the Kosi river using a hydro-geomorphic approach based on multi-criteria decision analysis [28]. Wang et al. employed a random forest algorithm to investigate the flood risk zoning in the Dongjiang River Basin, China, and analyzed each indicator’s contribution to the assessment results [29]. Alfieri et al. presented a comprehensive assessment of future flood risk in Europe based on EURO-CORDEX RCP 8.5 (representative concentration pathway) climate scenarios [30]. Wang et al. investigated the flood risk levels in the Beijing-Tianjin-Hebei region of China using a fuzzy synthetic evaluation method with combined weights [31]. All the above studies have provided a scientific basis for reducing flood damages at regional and watershed scales. Nevertheless, they cannot depict the subway system’s flood risk level because many complex factors impact the flood risks of subway systems (e.g., weather, rivers, topography, geology, and passenger flow). Of course, flood risk estimation at regional and watershed scales does not involve key indicators that affect the flood risk of subways. Consequently, there is an urgent need to develop a risk indicator system and accurate models that allow reliable flood risk evaluation of subway systems.
Furthermore, it is unclear to what extent the land subsidence factor exacerbates the flood risk of subway systems. At least 200 cities worldwide have built subways, including New York [21], London [32], Beijing [33], Shanghai [34], and Seoul metropolitan area [35], all of which have suffered severe land subsidence. Land subsidence is an environmental geological phenomenon induced by over-exploiting underground resources and building pressure from above [36]. Uneven land subsidence not only results in the deformation of subway systems, but also increases their flood risk and threatens the stable operation of urban rail transit. Surface floodwaters can enter the subway system through low-lying subway stations, ground fissures, and faults and cause flooding. Previous studies focused on monitoring the subsidence of subway lines, but neglected its impact on flood risk. For example, Duan et al. monitored the Beijing subway network’s subsidence for the past 15 years using an improved multi-sensor MTI (multi-temporal interferometric synthetic aperture radar) time-series fusion method [37]. Hu et al. found that the spatial pattern of land subsidence was controlled by geological faults based on Sentinel-1 InSAR observations [38]. Moreover, a recent study reported that the most severe subsidence had been exhibited in eastern Beijing, with a maximum subsistence rate of more than 10 cm/year [39]. Such widespread and rapid subsidence poses potential threats to the subway system.
To address the aforesaid issues, we investigated and compared the flood risk levels in two scenarios, ignoring and considering land subsidence, respectively, using the Beijing subway as an example. The objectives of this study are (1) to develop a flood risk indicator system for metropolitan subway systems, (2) to propose an accurate method for assessing flood risk in metropolitan subway systems, (3) to evaluate the impact of land subsidence on the flood risk levels, and (4) to analyze the spatial pattern of flood risk in the Beijing subway system and provide a scientific basis for flood prevention. This paper is organized as follows. In Section 2, the study area is introduced. The data sources and methodology are presented in Section 3. Results and discussion are illustrated in Section 4 and Section 5, respectively, and the main findings are summarized in Section 6. We hope that our research can raise awareness among researchers and the public concerning flood risk in the subway system and provide more scientific and credible theoretical services for the decision-making process.
2. Study Area
Beijing is China’s political, cultural, international exchange, and technological innovation center, and one of the world’s most famous metropolises. Beijing consists of 16 districts with an area of 1.64 × 10⁴ km2 and a permanent population of 21.54 million in 2019 (Figure 2). The northern and western regions are surrounded by the Yanshan Mountains and the Taihang Mountains, respectively, covering 62% of the total area. The southeast area is the Beijing Plain and a component of the North China Plain (NCP) [38]. It has a warm temperate continental monsoon climate characterized by large seasonal variations in temperature and precipitation [40]. The average annual precipitation is approximately 532 mm (1981–2010), of which approximately 80% occurs from June to September [40]. Such climate characteristics and geomorphic patterns are highly susceptible to flooding.
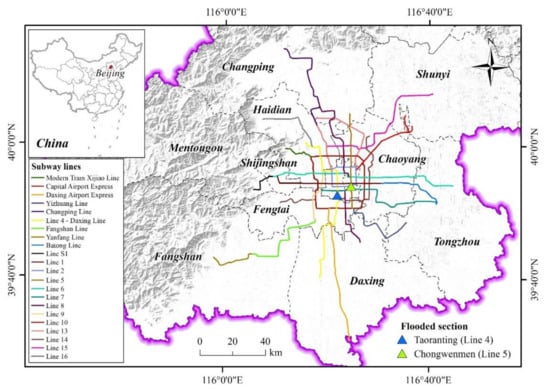
Figure 2.
The geographical location of the study area and the Beijing subway system.
There are 23 subway lines in Beijing (Figure 2) with approximately 700 km and 405 stations by 1 October 2020. Fifteen subway lines are under construction and four lines are planned. According to the official data of Beijing Subway (https://www.bjsubway.com/ (accessed on 29 December 2020)), the average daily passenger flow was 10.57 million in the first half of 2019. The maximum daily passenger flow was 13.75 million (on 12 July 2019), making it one of the world’s busiest rail transit systems. Many stations have suffered severe inundation due to extreme precipitation, land subsidence, and the subways’ accelerated growth and complexity [12]. For instance, On 4 July 2008, a large amount of rainwater entered Chongwenmen subway station on Line 5, resulting in a three-hour shutdown of 14 stations in both directions from Hepingxiqiao station to Songjiazhuang station (the green triangle in Figure 2). The southwest exit (Exit D) of the Taoranting station on Line 4 was inundated owing to urban flooding (Figure 1 and the blue triangle in Figure 2). These flooding events severely impacted the Beijing subway system’s safe operation and the sustainable development of the urban area. Thus, assessing the subway system’s flood risk in a subsidence environment has practical significance for urban risk management.
3. Methodology
The assessment process in this study has four phases. First, twenty risk assessment indicators were selected to establish a risk indicator system based on flood risk theory [41], covering meteorological-hydrological, topographic-landform, land cover, geology, and socio-economic indicators. All risk indicators were processed in a geographic information system platform (GIS) to obtain raster layers with a spatial resolution of 100 m × 100 m. Second, we calculated the indicator weights based on the analytic hierarchy process (AHP) and the fuzzy analytic hierarchy process (FAHP) methods, respectively. Subsequently, regional flood risk levels of Beijing were generated based on the raster layers and weighting results in GIS. Eventually, the flood risk levels of subway lines were extracted from regional flood risk levels and validated using historical flood records. It should be noted that we use the regional flood risk within the 500 m buffer zone of subway lines to depict the flood risk of the subway system. The Jenks method was used to classify the flood risk level. Figure 3 demonstrates the framework of the flood risk assessment for the metropolitan subway system.
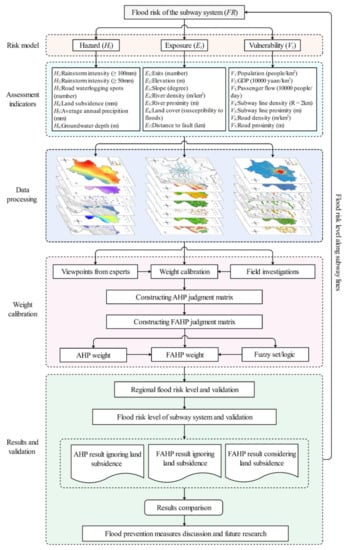
Figure 3.
Flowchart of the flood risk assessment for the Beijing subway system. (AHP is analytic hierarchy process; FAHP is fuzzy analytic hierarchy process.)
3.1. Risk Assessment Model
In our study, the subway system’s flood risk is considered to be a combination of flood hazard, exposure, and vulnerability [28]. The flood hazard mainly includes threatening natural events, such as the possibility and magnitude of precipitation, which are the direct cause of subway flooding. Flood exposure in this study emphasizes the exit numbers of subway stations and the impact of disaster-formative environment factors (e.g., topography, geology conditions, and land cover). Flood vulnerability refers to the human and socio-economic system’s endurance and response to the spatial variable forces produced by hazardous events [41]. Here, the conceptual evaluation model of flood risk in the subway system can be expressed as Equation (1).
Flood risk = f (H, E, V) = Hazard × Exposure × Vulnerability
Considering that the different risk evaluation indicators play different importance in flood risk results, we modified the conceptual model of flood risk assessment to Equation (2).
where FR is the flood risk of the subway system and αH, αE, and αV represent the weights of hazard, exposure, and vulnerability factors. Hi, Ej, and Vk are indicators of hazard, exposure, and vulnerability. Additionally, hi, ej, and vk indicate each indicator’s weights among the three factors of hazard, exposure, and vulnerability. The weight of each indicator was calculated by the AHP method and then calibrated using the FAHP method based on the fuzzy set and fuzzy logic. The detailed weight calculation procedure is described in Section 3.3.
3.2. Risk Indicator System and Data
3.2.1. Hazard Indicator
Six hazard assessment indicators were selected, including rainstorm intensity, road waterlogging spots, land subsidence, average annual precipitation, and groundwater depth. In China, meteorological departments define a rainstorm as a precipitation event in which the rainfall exceeds or equals 50 mm within 24 h. To reflect the effects of different rainfall intensities, we counted heavy rainstorm days (≥100 mm, H1), rainstorm days (≥50 mm, H2), and the average annual precipitation (H5) of Beijing meteorological stations according to the daily precipitation data in 1981–2010 [42]. The precipitation data were derived from the National Meteorological Science Data Center (http://data.cma.cn/ (accessed on 29 December 2020)). Then, indicator layers of rainstorm intensities (Figure 4) and average annual precipitation were generated using the Kriging interpolation method in GIS [43].
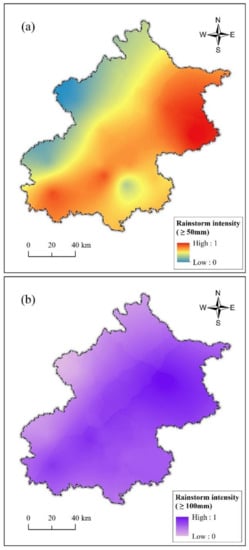
Figure 4.
Spatial distribution of precipitation intensity. (a) ≥50 mm; (b) ≥100 mm.
Land subsidence (H4) data in the Beijing Plain originated from Zhou et al. [44]. Figure 5a shows the spatial distribution of cumulative subsidence in the Beijing Plain from 1955 to 2012. The land subsidence data in Beijing were generated based on the level measuring data of the elevation reference network established by surveying and mapping departments and the synthetic aperture radar (SAR) remote sensing monitoring data. The land subsidence in the Beijing Plain exhibits an uneven pattern. The maximum cumulative subsidence area (≥1000 mm) is located in the central and southern parts of the Beijing Plain, which is primarily distributed in the Chaoyang, Tongzhou, Daxing, Shunyi, Haidian, and Changping districts.
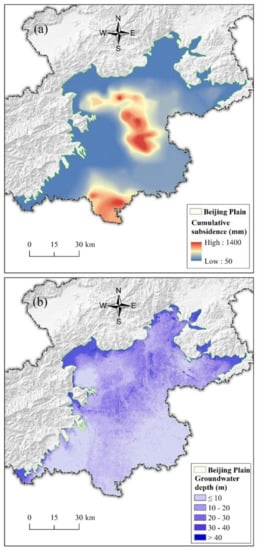
Figure 5.
Cumulative land subsidence in 1955–2012 (a) and groundwater depth (b) in the Beijing Plain.
The depth of the Beijing subway line is mostly 10–30 m underground, so the shallow groundwater is crucial to its safe operation. The groundwater depth (H6) was generated using a digital elevation model (DEM) and the groundwater level in GIS, which was provided by the Geocloud (http://geocloud.cgs.gov.cn (accessed on 29 December 2020)). Figure 5b shows that the groundwater depth in the southern part of the Beijing Plain is less than 10 m. The groundwater depth in the central urban area (such as Dongcheng, Xichen, Haidian, and Chaoyang districts) is greater than 20 m, which is mainly caused by excessive groundwater extraction and ineffective supplementation. The deeper groundwater in the northern regions is affected by the mountainous topography. Road waterlogging spots (H3) were derived from the Beijing Municipal Affairs Data Resource Network (https://data.beijing.gov.cn/ (accessed on 29 December 2020)) and historical flood records (e.g., the 21 July 2012 flood event).
3.2.2. Exposure Indicator
Exposure indicators include topographic features such as elevation and slope, exit numbers, density and proximity of the river network, land cover, and distance to faults. The elevation (E2) and slope (E3) layers were generated from a digital elevation model (DEM) using the 3D spatial analysis tool in GIS [45], and the original data were accessed from the Geospatial Data Cloud (http://www.gscloud.cn/ (accessed on 29 December 2020)). The number of stations and exits was obtained from the Beijing Subway website (https://www.bjsubway.com/ (accessed on 29 December 2020)) (Figure 6a). The station’s exit numbers (E1) are used to express the exposure level of the subway system during flooding. The river network’s density and proximity were used to indicate the degree of flooding impact on the subway system [46]. In this paper, river density (E4) is the length of river channels per square kilometer using a zonal statistical tool. The river proximity (E5) was generated using the multi-ring buffer tool in GIS, and the buffer distances were set to 200, 400, 600, 800, and 1000 m, respectively [43]. Land cover data (E6) with a 30 m resolution were accessed from Tsinghua University (Figure 7a). Susceptibility to floods was obtained based on the runoff coefficient of different land covers (Figure 7b). For example, the growth of impervious surfaces accelerates the rate of the convergence of urban surface runoff, whereas densely vegetated areas such as forests and grasslands have the reverse effect. Moreover, the faults in Beijing were from Geocloud (http://geocloud.cgs.gov.cn (accessed on 29 December 2020)), and the distance to faults (E7) was employed to analyze the adverse impact on the subway system (Figure 6b).
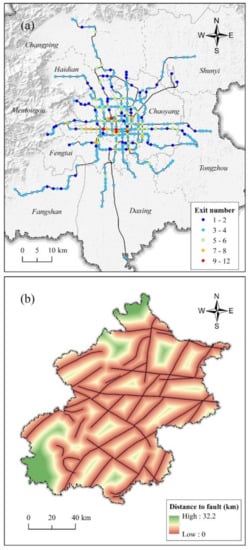
Figure 6.
Exposure indicators of subway station exit numbers (a) and distance to faults (b).
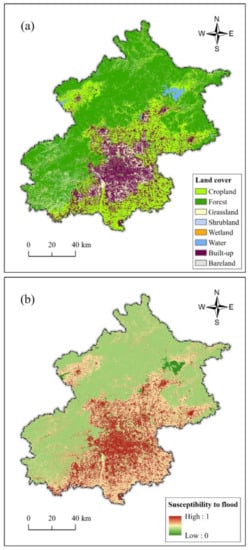
Figure 7.
Land cover (a) in Beijing and its susceptibility to floods (b).
3.2.3. Vulnerability Indicator
Vulnerability refers to the propensity or predisposition to be adversely affected, and it is closely related to human and socio-economic indicators [41]. Flood vulnerability in our study covers seven indicators: population (V1) and GDP (gross domestic product) density (V2), the daily passenger flow (V3), subway line density (V4) and proximity (V5), road density (V6) and proximity (V7). Population and GDP density data were obtained from the Resource and Environment Data Center, Chinese Academy of Sciences (http://www.resdc.cn/lds.aspx (accessed on 29 December 2020)). The subway passenger flow data originated from the official Beijing Subway website statistics (https://www.bjsubway.com/ (accessed on 29 December 2020)) and were rasterized using GIS tools [31]. The data are used to indicate the potential casualty levels when the subway system is inundated (Figure 8b). The subway density (Figure 8a) and proximity are utilized to reflect the sensitivity of the subway system to floods. We used the buffer tool in GIS to generate the proximity of the subway lines (buffers were set to 200, 400, 600, 800, and 1000 m). The subway system’s density raster layer was produced using the line density tool with a search radius of 2 km [28]. According to field investigations, subway exits are located in the middle or on both sides of the road. Road waterlogging during heavy rainfall increases the flooding risk of the subway system. Therefore, road density and proximity are also significant indicators affecting subway flooding. The proximity and density raster layers of the road network were created in the same way as the subway lines. All data sources for the flood risk evaluation of the Beijing subway system have been listed in Appendix A (Table A2).
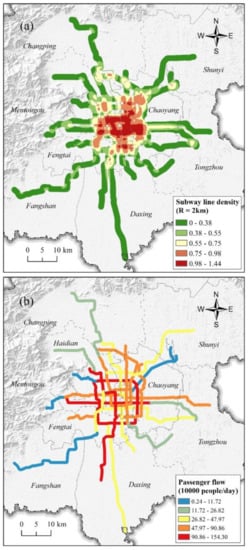
Figure 8.
The subway line density (R = 2 km) (a) and daily passenger flow (b) of the Beijing subway system.
3.3. Weight Calibration
3.3.1. AHP Weight
The analytic hierarchy process (AHP) is a structured decision-making technique widely accepted in various research fields [47,48]. It decomposes a complex problem into multiple levels, such as goals, criteria, and alternatives, and then performs a qualitative and quantitative assessment on this basis. The pairwise comparison was employed to construct the judgment matrix Au (Equation (3)), reflecting the relative importance of different indicators.
where Au represents the judgment matrix of each criterion; aij is the relative importance of factor i to indicator j. In the pairwise comparison, numbers ranging from 1 (equal importance) to 9 (extreme importance) were used to measure the relative importance of each indicator according to Saaty’s original proposal [49]. Since the indicator priority based on experts’ experience may not be perfect, the AHP method requires a consistency check of the pairwise comparison matrix using Equations (4) and (5).
where CR represents the consistency ratio. The judgment matrix is reasonable when the CR is less than 0.1. Otherwise, the judgment matrix must be reconstructed. CI and RI are the consistency index and average random consistency index, respectively [49]. λmax is the maximum eigenvalue of the judgment matrix, which is described in Equation (6).
where wi represents the weight of each indicator.
3.3.2. Fuzzy AHP Weight
Fuzzy AHP (FAHP) is an improved AHP weight calibration method based on the fuzzy set and fuzzy logic theory. A fuzzy set is defined according to the membership function, which can be regarded as a generalization of the classic binary set [50]. Fuzzy logic is a powerful tool different from traditional Boolean logic that can express fuzzy information [50]. To implement the FAHP approach, each element of the judgment matrix (Equation (3)) in the AHP method is replaced with a triangular fuzzy number (l, m, u), and the fuzzy judgment matrix can be obtained as shown in Equation (7) [51].
where Fn is the triangular fuzzy judgment matrix. Fij represents the triangular fuzzy number of indicator i to indicator j. (lij, mij, uij) represents triangular fuzzy numbers, in which parameters l and u indicate the minimum and maximum values, and m is the most likely value. Table A1 shows the quantitative scale and the essential description of triangular fuzzy numbers.
Based on the generated fuzzy judgment matrix Fn, the fuzzy synthetic extent (Pk) is obtained using Equations (8)–(11) [51].
where
where Si is the sum of the triangular fuzzy numbers.
Subsequently, we define the possible degree of M2 (l2, m2, u2) ≥ M1(l1, m1, u1) by using Equation (12).
where V(M2 ≥ M1) is the possible degree of M2 ≥ M1. As shown in Figure 9, d represents the ordinate of the intersection point D of the two triangular fuzzy numbers [51]. To compare M1 and M2, the values of V(M2 ≥ M1) and V(M1 ≥ M2) need to be calculated, respectively.
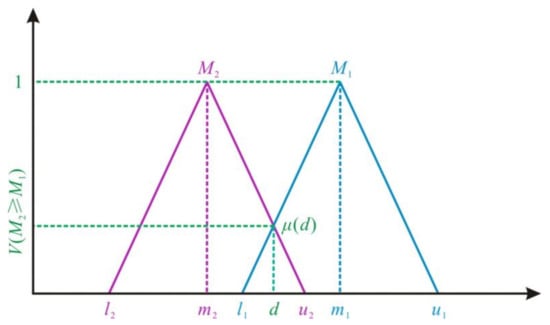
Figure 9.
Possible degree of two triangular fuzzy numbers μ(M2 ≥ M1).
Then, the possible degree a fuzzy number greater than k fuzzy numbers Mi is defined as Equation (13).
V(M > M1, M2,..., Mk) = minV(M > Mi), i = 1, 2, 3,..., k
We assume that for all k = 1, 2, 3,..., n, (k ≠ i), then
Ultimately, we normalize the weight vector by using Equations (15)–(16) and obtain the indicator weight W.
where W is a non-fuzzy number and An represents n indicators.
3.3.3. Implementation of the FAHP Weighting Method
We use the criterion layer (including hazard, exposure, and vulnerability factors) to illustrate the process of weight calculation using the FAHP method. According to the pairwise comparison, a judgment matrix Fcriterion was first created based on the AHP method.
where H, E, and V represent three factors: hazard, exposure, and vulnerability. Then, we calculated the weight of the criterion layer W = (H, E, V) = (0.460, 0.221, 0.319)T. The consistency ratio of the judgment matrix of the criterion layer CR = 0.002 (< 0.1) indicates that it has passed the consistency check. Triangular fuzzy numbers given by Appendix Table A1 were used to replace each component in the judgment matrix Fcriterion and obtain the fuzzy judgment matrix (Table 1).

Table 1.
The construction of fuzzy judgment matrix in criterion layer.
As demonstrated in Figure 9, we calculated the possible degree of the three risk assessment factors M ≥ Mi in the criterion layer. The possible degree between hazard (H) and exposure (E) was calculated as follows (Figure 10a):
μ(PH ≥ PE) = 1; μ(PE ≥ PH) = 0.6667
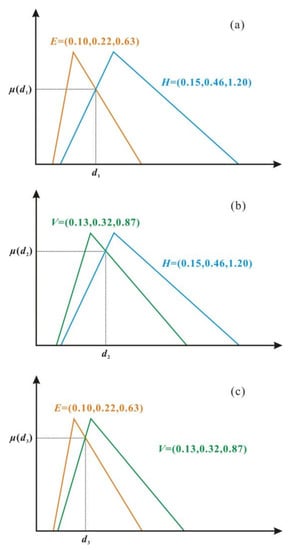
Figure 10.
The possible degree of three risk assessment factors (hazard, exposure, and vulnerability) in the criterion layer. (a) μ(PE ≥ PH), (b) μ(PV ≥ PH), (c) μ(PE ≥ PV).
The possible degree between hazard (H) and vulnerability (V) was calibrated as follows (Figure 10b):
μ(PH ≥ PV) = 1; μ(PV ≥ PH) = 0.8372
The possible degree between exposure (E) and vulnerability (V) was computed as follows (Figure 10c):
μ(PV ≥ PE) = 1; μ(PE ≥ PV) = 0.8333
Based on Equation (14), the weights of the three factors in the criterion layer were as follows:
W ′ = (1, 0.6667, 0.8372)T
After normalization, the weights of the criterion layer were generated.
W = (H, E, V)T = (0.399, 0.266, 0.334)T
Similarly, the fuzzy judgment matrix, fuzzy synthetic extent (Table 2, Table 3 and Table 4), and the weight of each risk assessment indicator (Table 5) of hazard (Hi), exposure (Ej), and vulnerability (Vk) were calculated using the FAHP approach.
Table 2.
Fuzzy judgment matrix and fuzzy synthetic extent of hazard indicators.
Table 3.
Fuzzy judgment matrix and fuzzy synthetic extent of exposure indicators.
Table 4.
Fuzzy judgment matrix and fuzzy synthetic extent of vulnerability indicators.
Table 5.
The weight of each risk indicator was calculated based on the AHP and FAHP methods.
4. Results and Validation
4.1. Level Maps of Hazard, Exposure, and Vulnerability
Based on the selected assessment indicators and the corresponding weights, level maps of hazard, exposure, and vulnerability were generated using overlay analysis. Figure 11a shows the hazard levels ignoring land subsidence at the pixel level (100 × 100 m) and exhibits a significant spatial variability. High hazard is primarily distributed in Shunyi, Haidian, Shijingshan, Fengtai, and Changping districts, as well as the plain area of Huairou, Pinggu, and Miyun districts. Figure 11b displays the spatial distribution of hazard level when considering the land subsidence; high hazard is mainly located in Chaoyang, Changping, Daxing, Haidian, Tongzhou, and Shunyi districts, with the largest high level area in Chaoyang district. According to the weight results of the flood hazard indicators in Table 5, the hazard evaluation result for the subway system in Figure 11a reflects the dominance of precipitation-related indicators. In comparison, the hazard result in Figure 11b displays an integrated effect of precipitation indicators and land subsidence on the subway system. Low hazard level is distributed in the west and north of Beijing, regardless of whether land subsidence is considered. These regions mainly cover most of Mentougou and Yanqing, the west of Changping, and the north of Huairou districts.
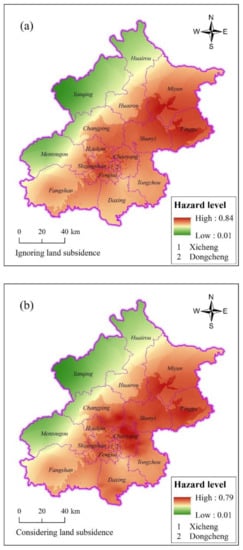
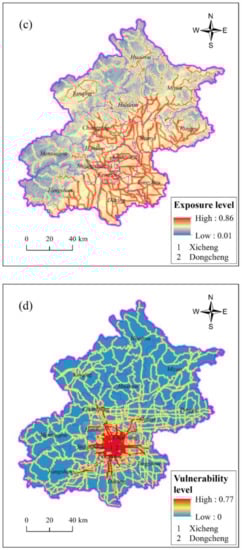
Figure 11.
Level maps of hazard (a,b), exposure (c), and vulnerability (d) in Beijing. (a,b) denote the hazard levels ignoring and considering the land subsidence, respectively.
Figure 11c depicts the spatial distribution of exposure levels for the Beijing subway system. Overall, exposure levels are higher in the plains than in mountainous areas. High exposure is mainly located in the vicinity of river channels since rivers serve as water catchments and drainage channels during flooding. As floods rage eastward from the western mountains, the flood velocity slows down due to the flat terrain and gentle slope of the Beijing Plain, causing high water levels and even overflowing the river channel on to the floodplain. Therefore, the subway lines and stations near river channels have higher exposure levels. Affected by topography and slope, the low exposure zones are mainly distributed in the western and northern mountainous areas excluding river valleys, such as Fangshan, Mentougou, Yanqing, Huairou, Miyun, and Pinggu districts.
Seven thematic layers were employed to generate the flood vulnerability level map: population and GDP density, daily passenger flow, subway line density and proximity, and road density and proximity. As shown in Figure 11d, the vulnerability levels show an uneven and concentrated distribution pattern. Highly vulnerable zones are located in the central urban area and adjacent districts, including Xicheng, Dongcheng, Haidian, Daxing, Fengtai, and Chaoyang. In addition to population and property density, the high vulnerability areas are significantly affected by subway lines and passenger flow, displaying a distribution characteristic along the subway lines. For example, such distribution pattern is mainly observed in Fangshan, Daxing, Changping, Tongzhou, and Shunyi districts. Other districts with relatively high vulnerability are mainly controlled by the road network density, which presents a typical net-like spatial distribution pattern, such as Yanqing, Huairou, Miyun, Pinggu, and Mentougou.
4.2. Spatial Distribution of Regional Flood Risk Levels and Validation
The regional flood risk level maps of Beijing were generated in the model builder according to Equation (2). Figure 12a,b exhibit the regional flood risk levels map in two scenarios: ignoring and considering the land subsidence indicator, respectively. By comparison, the overall spatial distribution patterns of regional flood risk levels shown in Figure 12a,b are similar—the high flood risk areas in the Beijing Plain were larger than the western and northern mountainous regions. High risk was mainly located in the six central urban areas of Beijing, including Dongcheng, Xicheng, Haidian, Fengtai, Chaoyang, and Shijingshan. The high risk of the other ten districts (Daxing, Fangshan, Tongzhou, Mentougou, Shunyi, Changping, Pinggu, Miyun, Huairou, and Yanqing districts) was mainly distributed in a zonal pattern. Yanqing, Huairou, and Mentougou were the three districts with the highest share of low risk areas in Beijing. However, notable distinctions in the regional flood risk levels are present in two scenarios. The color differences reveal that the land subsidence exacerbated the flood risk in central urban areas and adjacent districts, especially in Chaoyang, Daxing, Tongzhou, Changping, and Shunyi (Figure 12a,b).
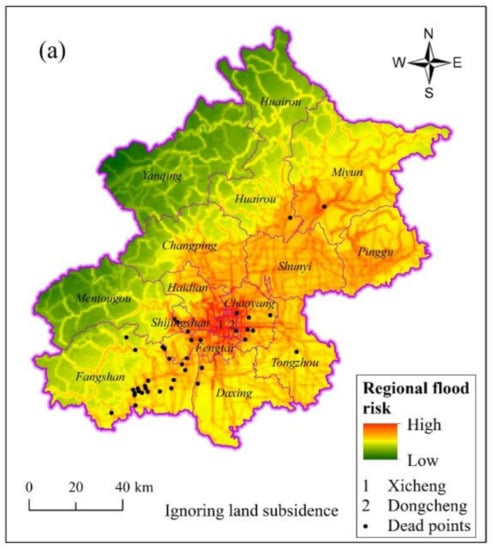
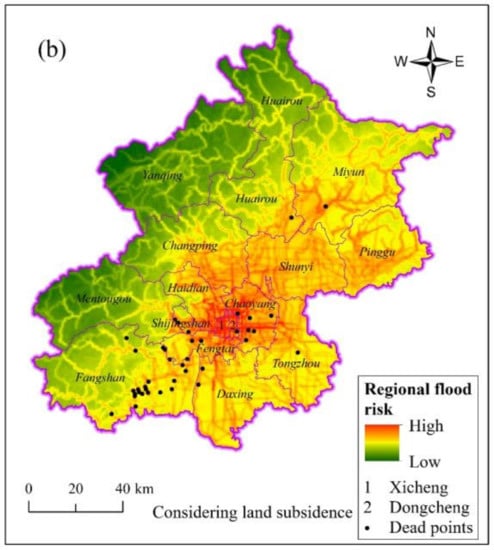
Figure 12.
Regional flood risk level map of Beijing. Dead points were derived from the historical flood event on 21 July 2012. (a) Ignoring land subsidence; (b) Considering land subsidence.
The dead point data were used to verify the accuracy of regional flood risk assessment results. The dead point data of the Beijing “7.21” (21 July 2012) catastrophic flood event were obtained from the Beijing Municipal Affairs Data Resource Network. The “7.21” extreme rainfall event covered more than 86% of Beijing and lasted approximately 3–4 h, with an average precipitation of 170 mm. The rainstorm center was located in the Hebei town of Fangshan district with a maximum rainfall of 541 mm (approximately equal to Beijing’s annual precipitation) [31]. Hence, the extreme rainfall event (approximately 60-year flood) caused a severe torrential flood in mountain regions and wide waterlogging in central urban areas. The fatalities (79 people) were mainly distributed in the Fangshan district and central urban areas (Figure 12) [52]. The point data were vectorized and overlaid with the regional assessment results. As shown in Figure 12a,b, the death point data of this catastrophic flood event all match the moderate to high risk level zones, indicating that the risk assessment results based on the FAHP method are accurate.
4.3. Flood Risk of the Subway System and Validation
4.3.1. Spatial Distribution Pattern of Risk Levels in the Subway System
The subway system’s flood risk was extracted from the regional flood risk assessment results and reflected by the risk level within the 500 m buffer zone of the subway line (i.e., 1000 m width). To explicitly identify the risk level of the subway system, we used the Jenks method to classify the flood risk into five levels: very high, high, moderate, low, and very low. Figure 13 presents the spatial distribution risk levels for the Beijing subway system based on the FAHP approach.
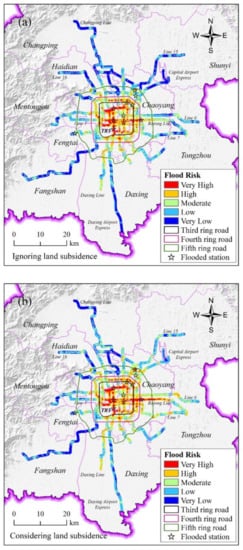
Figure 13.
Flood risk levels within the 500 m buffer zone of the subway lines. (a) Ignoring land subsidence; (b) Considering land subsidence.
The flood risks show a ring-like distribution pattern with risk levels decreasing from the central urban area to the suburbs. As shown in Figure 13, the very high risk zones were primarily distributed within the third ring road, both with and without considering land subsidence. The areas of the very high risk categories within the third ring road in Figure 13a (ignoring land subsidence) and Figure 13b (considering land subsidence) were 27.98 and 29.40 km2, accounting for 75.40% and 63.58% of the total very high risk area of the subway system, respectively. High risk is relatively dispersed and located mainly within the fourth ring road compared to very high risk. The high risk areas within the fourth ring road in Figure 13a,b were 80.75 and 81.19 km2, occupying 75.37% and 63.83% of the total high risk area of the subway system, respectively.
The moderate risk areas within the fifth ring road in Figure 13a,b were 102.59 and 96.98 km2, comprising 71.84% and 60.42% of the total moderate risk area, respectively. The low and very low risk areas covered 320.17 (Figure 13a) and 273.29 km2 (Figure 13b), which were mainly outside the fourth and fifth ring roads and accounted for 52.73% and 45.01% of the total area, respectively. The area higher than the moderate risk (including moderate risk) was 287.04 (Figure 13a) and 333.92 km2 (Figure 13b), respectively, making up 47.27% and 54.99% of the total area (607.21 km2). These relatively high risks were concentrated in central urban areas with a high population and economic density, such as Dongcheng, Xicheng, Haidian, Chaoyang, and Fengtai. As a result, the subway system in central Beijing has higher flood risk levels.
4.3.2. Flood Risk Level Distribution of Subway Lines and Stations Considering Land Subsidence
To supply policymakers with useful information for flood risk management in the subway system, we identified the flood risk level distribution of 23 subway lines and 405 stations in a land subsidence environment.
Figure 14 shows the area distribution of different flood risk levels for each Beijing subway line. The areas from the very high to the very low risk level were 95.98 (13.99%), 191.18 (27.86%), 181.15 (26.40%), 153.53 (22.38%), and 64.40 (9.38%) km2 (the intersection areas between subway lines are double-counted since they comprise different subway lines). Accordingly, the risk levels with the largest area and the widest distribution are high risk and moderate risk, respectively. There are five subway lines with high and very high risk areas accounting for more than half of their lines, namely Line 2 (95.92%), Line 10 (62.56%), Line 1 (56.90%), Line 4—Daxing line (56.34%), and Batong Line (54.13%). Most of these lines are located in or through the central urban area. Seven subway lines have a moderate risk area exceeding 30% of their lines, which are Line 6 (42.29%), Line 5 (39.43%), Line 7 (38.02%), Line 14 (36.52%), Line 9 (34.16%), Line 8 (33.88%), and Line 4—Daxing (30.91%). Eleven subway lines have relatively low flood risk levels (very low and low risk area > 50%), including Line S1 (91.22%), Changping Line (88.82%), Fangshan Line (88.80%), Xijiao Line (85.65%), Line 16 (84.43%), Yan—Fang Line (80.38%), Daxing Airport Express (78.18%), Line 15 (63.12%), Yizhuang Line (59.30%), and Captial Airport Express (53.18%). Most of these lines are situated in the suburban areas of Beijing.
Figure 14.
Area distribution at different risk levels for each subway line.
Moreover, the flood risk levels of 405 subway stations were identified using GIS tools. Excluding 62 transfer stations (65 duplicate counts), the actual number of stations in the Beijing subway system is 341. The number of very high and high risk subway stations was 73 and 103, accounting for 51.61% of the total. This ratio indicates that there is a high potential flood risk in the Beijing subway system. Eighty-nine subway stations were moderate risk, representing 26.10% of the total. The remaining 76 stations were low and very low risk, making up 22.29% of the total. As shown in Figure 15, subway stations with very high and high risk were primarily located on Line 10 (19 stations), Line 2 (16 stations), Line 1 (14 stations), Line 4—Daxing (11 stations), and Line 14 (9 stations). These stations were mainly distributed in the central urban area and were mostly interchange stations. The very low and low risk stations were mainly located in the suburbs on the Fangshan Line (11 stations), Yan—Fang Line (9 stations), Line 8 (8 stations), Changping Line (7 stations), Line S1 (7 stations), Line 16 (6 stations), Line 15 (5 stations), Yizhuang Line (5 stations), and Xijiao Line (5 stations). Moreover, the risk levels for each subway station are shown in Supplementary Materials (Excel file). Identifying very high and high risk subway lines and stations can provide fundamental data for the optimal allocation of flood mitigation resources and risk management.
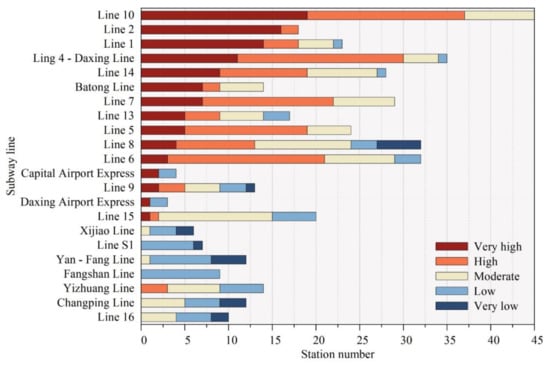
Figure 15.
The number distribution of subway stations with different risk levels of each subway line.
4.3.3. Results Validation
Historical flooding records of subway stations were used to verify the risk assessment results for the Beijing subway system. To guarantee the accuracy of the flood records, we field investigated 116 subway stations and interviewed neighboring residents concerning the flooding of subway stations. Subsequently, 11 subway stations with severe leakage and flooding were selected and superimposed with the risk assessment results (see Figure 13). The 11 subway stations were almost consistent with very high and high risk zones in the evaluation results (82% and 91% for Figure 15). For example, floodwaters surged into the southwest exit (Exit D) of Taoranting station (Line 4) along the escalator and caused its temporary shutdown during the “7.21” catastrophic flood event (Figure 1 and Figure 13). By comparison, we discovered that the Tauranting station falls in the very high risk zone in the risk evaluation results. The results validation indicates that the risk evaluation of the Beijing subway system based on the FAHP method is reliable.
5. Discussion
5.1. Land Subsidence Aggravates the Flood Risk Level of the Subway System
The Beijing region has been affected by land subsidence since 1935 [53]. Previous studies showed that the leading cause of land subsidence is intensive groundwater extraction [54]. By the end of 2017, the maximum cumulative subsidence was over 1.8 m among the subsidence centers, which poses a significant threat to the safe operation of the subway system [55].
Figure 16 reveals the area distribution of the different flood risk levels for the subway system under two scenarios: ignoring and considering the land subsidence indicator. In comparison, the area at moderate to very high risk of the subway system increased by 46.88 km2 (16.33%) under the land subsidence scenario. Table 6 shows the area proportions of each risk level in the two scenarios. Compared with the ignoring land subsidence scenario, the area shares of very high, high, and moderate risk levels increased by 1.50% (9.13 km2), 3.30% (20.05 km2), and 2.91% (17.70 km2), respectively.
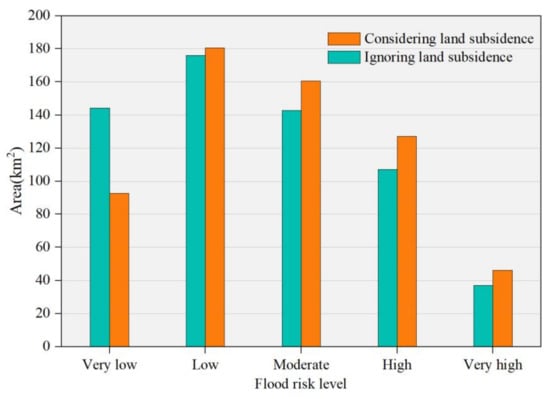
Figure 16.
The area distribution of different flood risk levels in the subway system.
Table 6.
Area proportion of each risk level in different scenarios.
The very high risk areas of the four subway lines increased by more than 1 km2 when the land subsidence indicator was considered, namely Batong Line (3.40 km2), Line 1 (2.63 km2), Line 10 (1.5 km2), and Line 14 (1.11 km2); two subway lines, Line 2 (0.91 km2) and Line 7 (0.89 km2), have area growth between 0.5 and 1 km2 in the very high risk level. In terms of spatial distribution, the subway lines and stations impacted by land subsidence were mainly located in Chaoyang, Daxing, Tongzhou, Changping, Shunyi, Haidian, and Dongcheng, of which Chaoyang was the most affected. For example, the very high and high risk levels of the Batong Line located in Chaoyang increased by 3.4 and 3.79 km2 under the land subsidence scenario, with growth rates of 2615.38% and 119.56%, respectively. Thus, land subsidence is a crucial indicator of aggravating the flood risk level of the subway system [35,55].
5.2. Indicator System Analysis in Flood Risk Assessment of Subway Systems
In our study, subway systems’ flood risk is indirectly reflected using the regional flood risk level within a 500 m radius of subway lines. Thus, the selection of regional risk indicators is critical to risk results. Previous flood risk evaluations at the regional and watershed scales commonly omit key factors (e.g., subway line density, passenger flow) that affect subway flooding. For example, in the flood risk evaluation of the Beijing-Tianjin-Hebei region, Wang et al. mainly considered natural and socio-economic indicators such as precipitation, rivers, topography, geomorphology, population, and gross domestic product [31]. Lai et al. selected 14 risk indicators on precipitation, topography, runoff, soil, and socio-economics in their study of flood risk evaluation in the Dongjiang River basin [45]. Consequently, the above risk indicator system cannot effectively depict the flood risk of the subway system.
Considering that the inundation in the subway system primarily results from extreme rainfall events [21], we employed rainstorm intensity (H1, H2), road waterlogging spots (H3), and average annual precipitation (H5) as hazard indicators. Previous studies have shown that the Beijing subway system experienced segmental and uneven subsidence during 2003–2018 [11,55]. In addition, the mean groundwater depth in the Beijing Plain rose by 3 m (2015–2019) since the Middle Route of the SNWDP (the South-to-North Water Diversion Project) started to operate [56]. The continuous rise of groundwater level combined with uneven land subsidence can increase the subway system’s flood risk. Thus, cumulative land subsidence (H4) and groundwater depth (H6) were included in the hazard indicators.
The direct cause of flooding in the subway system is the ingress of surface floodwaters; that is, more station exits indicate a higher exposure level of the subway system to flooding. Of course, whether flooding enters the subway system is dominated by the station’s elevation and slope except for rainfall. Rivers act as confluence channels during flooding. Their overflow often leads to the inundation of adjacent subway lines and stations [21]. Moreover, the fault activity deformed the subway system and caused tunnel collapse and water leakage. The land covers affect the confluence and infiltration rate of urban surface water flooding. The rapid growth of impervious surfaces increases the urban flood risk [57]. Therefore, we incorporated these factors into the exposure indicator system (Figure 3).
Areas with high population and GDP densities tend to have well-developed stormwater drainage systems. Thus, these two indicators can reflect regional resilience. The passenger flow of each subway line was used to reflect the potential threat to passengers when flooding occurs. Floodwater entering a subway station may flow along the subway tunnel and affect adjacent lines. As a result, extreme flooding may cause a more significant loss in areas with high line densities [21,24]. Moreover, the road network acts as a temporary drainage channel when surface flooding exceeds the underground drainage system’s capacity during heavy rainfall. However, station exits are distributed on roadsides or in the middle of the main road, which increases the risk of surface flooding entering the subway system [24]. Finally, seven risk indicators were selected to characterize the vulnerability level (Figure 3).
Taken together, we selected 20 indicators from hazard, exposure, and vulnerability to create a flood risk indicator system for the subway system. The results validation also proves that the risk indicator system we constructed is reasonable.
5.3. Assessment Efficiency Based on FAHP Method
Flood risk is essentially a three-dimensional concept related to non-profitability, uncertainty, and complexity [58]. The topographic, geological, meteorological, land cover, and socio-economic statistical information used to demonstrate the flood risk levels have multiplicity, complexity, uncertainty, inaccuracy, and diversity of assessment methods, making risk assessment a global problem facing the field of risk science and technology [31]. In addition to the rationality and integrity of the risk indicator selection mentioned above, the weight calibration of risk assessment indicators also affects the accuracy of risk results.
AHP has been widely accepted and used in geography, environmental science, biology, and social sciences [43]. This method is a structured technique for determining complex systems’ weight based on multi-critical indicators, including many interrelated objectives or criteria [50]. The weights of these objectives and criteria are defined after they are ranked according to their relative importance. Saaty defined a scale from 1 to 9 (or their reciprocals) with assigned linguistic terms to indicate the relative importance of pairwise comparisons [49]. However, there is a great deal of bias in the weight values after ranking the relative importance of risk indicators using a single and crisp value (numbers 1–9 and their reciprocals). Therefore, the traditional AHP method is developed into the fuzzy AHP method based on the fuzzy set and the fuzzy logic theory.
In the FAHP approach, the fuzzy synthetic extent describes the importance of risk indicators using a triangular fuzzy number (see Appendix Table A1) [52]. Compared with the binary logic of traditional AHP, FAHP is a form of multi-valued logic, which provides a systematic basis for expressing ambiguous information instead of precise knowledge (Equation (7)). For example, ‘‘likelihood” is a linguistic variable; its values are very low, low, moderate, high, and very high, and fuzzy numbers can represent these linguistic variables. In our study, the triangular fuzzy membership maps the interest domain to the interval [0,1]. It indicates the degree to which a specified value belongs to the set, which reduces the uncertainties during a risk assessment [50].
Figure 17 shows the flood risk level of the Beijing subway system based on the AHP method. Compared with the evaluation result based on the FAHP approach, the very high and high risk areas using the AHP approach were decreased by 6.96 (15%) and 27.43 km2 (22%), whereas the very low and low risk areas were increased by 23.84 (26%) and 7.62 km2 (4%). Eight of the 11 flooded subway stations matched the very high risk areas in the risk results based on the FAHP method (72.73%) (Figure 13b), whereas only five coincided with the very high risk zones in the results using the AHP approach (45.45%) (Figure 17). Therefore, the FAHP method is superior in identifying high risk areas of the subway system, which generates more accurate and reliable risk assessment results.
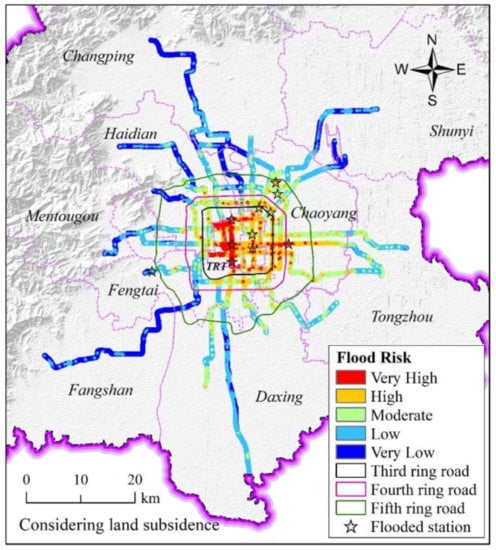
Figure 17.
Spatial distribution of flood risk levels in the Beijing subway system based on the AHP method.
5.4. Flood Prevention Measures of the Subway System
There are four main entries for the subway system: entrances/exits (elevators and stairs for both personnel and commuters), emergency exits, ventilation grates, and tunnel entries [21]. In particular, station exits are the main channel for surface flooding into the subway system because of their numerous and widespread distribution. Hence, priority flood prevention measures must effectively prevent flood intrusion into subway stations [59]. Based on field investigations, the height of some Beijing subway stations’ exit steps is reduced by the increased height of the road surface (e.g., Qianmen and Xisi stations), which raises the possibility of surface flooding entering the stations during heavy rainfall. We suggest elevating the height of the exit (entrance) to prevent flooding into subway stations and tunnels, especially for low-lying stations (Figure 18a).
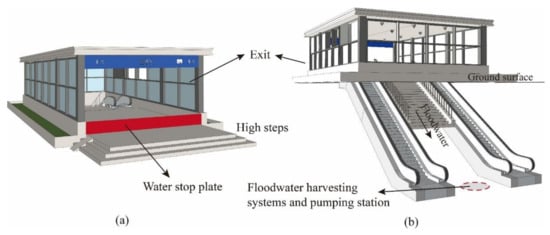
Figure 18.
Flood prevention measures for subway stations. (a) Water stop plate and high steps; (b) Floodwater harvesting system and pumping stations.
Another useful measure to protect the station and tunnel from flooding is to install water stop plates or waterproof doors at exits (entrances) (Figure 18a) [24]. The height of the waterproof door should take into account the return period of urban flooding and waterlogging. Previous research showed that traditional positive-pressure hinged doors could not resist flooding because most of these exits (entrances) are located on both sides of sidewalks and roads and have space constraints [24]. Thus, new types of waterproof doors should be developed for different exits (entrances), such as counter-pressure doors, hinged double doors, shutters, and bi-fold doors.
The municipal drainage pipe network operates at full capacity or is overloaded during heavy rainfall. Floodwater harvesting systems and pumping stations should be installed in subway stations to ensure that entered floodwater can be quickly discharged (Figure 18b). Floodwater entering the underground tunnel via exits (entrances) and ventilation grates would flow through the tunnel into other subway lines and cause more severe damage. We recommend that watertight doors be installed at interchange stations in subway tunnels to prevent flooding from affecting other subway lines [24]. Of course, the drainage pipe network diameter should be increased in urban construction to improve drainage capacity.
In addition to structural measures, soft adaptation strategies also play a crucial role in flood prevention in subway systems. Soft adaptations refer to the use of available information and low-cost strategies such as behavioral, institutional, and strategic changes to enhance the ability to withstand floods [57]. These measures include building codes, urban planning, forecasting and early warning systems (EWS), flood insurance, land use planning, capacity building of education and awareness, and other nature-based measures [57]. We advise the related departments to improve the subway system’s design and construction standards, especially flood resisting and drainage capabilities. We believe it is crucial to undertake flood control measures at subway station entrances and exits immediately based on real-time weather forecast information. Moreover, it is important to strengthen flood prevention measures in urban underground space planning, design, and construction while raising public awareness of flood risk. We recommend combining structural and soft-adaptive measures to enhance the flood protection level of the subway system.
5.5. Remaining Deficiency and Future Research
This study has several limitations, despite the fact that the FAHP method can efficiently and accurately assess the subway system’s flood risk level. First, the indirect risk evaluation approach we employed may introduce some uncertainty into the risk results. For example, we describe the subway system’s flood risk level using the regional flood risk level within the 500 m buffer zone of subway lines. Second, the subway system’s flood risk is affected by various complex factors, such as the underground pipe network’s drainage capacity adjacent to the subway lines. The risk indicator system we have constructed remains to be further improved. Moreover, the flood risk assessment in this paper was based on historical precipitation data (1981–2010) and land subsidence data (1955–2012), while the constant changes in rainfall intensity and impervious surfaces in Beijing in recent years and the future bring uncertainties to the risk results.
Global warming and urban construction make the subway flood risk in the future highly uncertain. Therefore, future research should focus more on the flood risk of the subway system under changing scenarios. Local climate models and subsidence monitoring data should be employed to project the intensity of extreme urban flood events and subsidence rates in future periods. In addition, the MIKE 1D/2D (a one-dimensional and two-dimensional river hydrodynamic model) and SWMM (Stormwater Management Model) models should be used to simulate the extent and depth of inundation of the subway system for different rainfall intensity scenarios (e.g., 10-, 20-, 50-, 100-, and 500-year). These simulations will facilitate more accurate flood risk results for subway systems under climate change and rapid urbanization scenarios.
6. Conclusions
In the context of the increase in extreme precipitation events and rapid urbanization, flooding in metropolitan areas under the subsidence environment severely affects subway systems’ safe operation. This study presents a method that investigated the flood risk of metropolitan subway systems under a subsidence condition based on FAHP and GIS. The method was employed to assess the Beijing subway system’s flood risk level and was validated by historical flood records. The main conclusions are as follows.
- (1)
- This study proposed a method for quickly and accurately assessing flood risk levels in metropolitan subway systems based on FAHP and GIS. According to the constructed risk indicator system, the regional risk within the 500 m buffer of the subway lines depicts the flood risk level of the subway system. This approach has the advantages of being regional to local, qualitative to quantitative. This evaluation can provide a theoretical basis for flood risk assessment in other metropolitan subway systems.
- (2)
- Land subsidence is an essential risk assessment indicator that exacerbates the flood risk level of the metropolitan subway system. Compared with the risk result ignoring land subsidence, the moderate to very high risk zones of the Beijing subway system increased by 46.88 km2 (16.33%) considering land subsidence. Subway lines and stations with increased flood risk levels are mainly located in Chaoyang, Daxing, Tongzhou, Changping, Shunyi, Haidian, and Dongcheng. We expect our study to draw the attention of the public and related sectors to subway flooding.
- (3)
- The FAHP method yields a more reasonable and accurate flood risk than the AHP method. By comparison, the very high and high risk areas using the FAHP method were increased by 6.96 (15%) and 27.43 km2 (22%), respectively. The flood risk of the Beijing subway system shows a ring-like distribution pattern. The very high and high risk zones are primarily distributed within the third ring road and fourth ring road, accounting for 63.58% and 63.83% of the total very high and high risk areas. Moreover, we identified the flood risk levels of 23 subway lines and 405 stations and proposed flood prevention measures. This study provides more informative decision-making in developing disaster plans for subway systems and the sustainable development of metropolitan areas.
- (4)
- Global warming and rapid urbanization have led to changes in flood risk in subway systems. This paper’s flood risk assessment was based on historical precipitation data and land subsidence data, while these data may not be suitable for future flood risk evaluation. Thus, future research should focus on the flood risk of subway systems under the climate change scenario, for example, forecasting future extreme rainfall intensity and land subsidence rates and employing them in flood risk evaluation studies. Additionally, hydrological-hydraulic models (e.g., MIKE 1D/2D and SWMM) should be used to simulate the inundation depth/extent of the subway system under different rainfall intensity scenarios (e.g., 10-, 20-, 50-, 100-, and 500-year); the difference in the drainage capacity of the underground pipe network adjacent to the subway system should also be considered in the risk evaluation process. These simulations will provide more accurate flood risk results for subway systems.
Supplementary Materials
The following are available online at https://www.mdpi.com/2072-4292/13/4/637/s1.
Author Contributions
Conceptualization, G.W., and L.L.; data curation and investigation, G.W., Y.L. (Yong Liu), Z.H., G.Z., J.L., Y.L. (Yanli Lyu), Y.G., X.H., Q.Z., and L.L.; methodology, G.W., and L.L.; writing—original draft, G.W.; writing—review and editing, G.W., and L.L. All authors have read and agreed to the published version of the manuscript.
Funding
The study was supported by the National Key Research and Development Project (Research and demonstration of key technologies for comprehensive prevention of multiple major natural disasters in metropolitan areas, Grant No. 2017YFC1503000).
Institutional Review Board Statement
Not applicable.
Informed Consent Statement
Not applicable.
Data Availability Statement
The sources of flood risk evaluation data for the Beijing subway are all listed in Appendix A (Table A2).
Acknowledgments
The authors would like to thank the four anonymous reviewers for their valuable comments and the two editors (Soheil Sabri and Nikola Stojanovic) for their help with this article.
Conflicts of Interest
The authors declare no conflict of interest.
Appendix A
Table A1.
Quantitative scale and important description of triangular fuzzy numbers.
Table A1.
Quantitative scale and important description of triangular fuzzy numbers.
| Fuzzy Number | Important Description | Quantitative Scales | Reciprocal Triangular Fuzzy Number |
|---|---|---|---|
| 1 | Equally important | (1,1,1) | (1,1,1) |
| 1̃ | Almost equally important | (1,1,3) | (1/3,1,1) |
| 2̃ | Intermediate value | (1,2,4) | (1/4,1/2,1) |
| 3̃ | Moderately more important | (1,3,5) | (1/5,1/3,1) |
| 4̃ | Intermediate value | (2,4,6) | (1/6,1/4,1/2) |
| 5̃ | Strongly more important | (3,5,7) | (1/7,1/5,1/3) |
| 6̃ | Intermediate value | (4,6,8) | (1/8,1/6,1/4) |
| 7̃ | Very strongly more important | (5,7,9) | (1/9,1/7,1/5) |
| 8̃ | Intermediate value | (6,8,10) | (1/10,1/8,1/6) |
| 9̃ | Extremely more important | (7,9,11) | (1/11,1/9,1/7) |
Table A2.
Data sources of flood risk assessment indicators.
Table A2.
Data sources of flood risk assessment indicators.
| Data Description | Data Source | ||
|---|---|---|---|
| Risk indicator | Hazard | Rainstorm (≥100 mm, ≥50 mm) | http://data.cma.cn/ (accessed on 29 December 2020) |
| Average annual precipitation | http://data.cma.cn/ (accessed on 29 December 2020) | ||
| Road waterlogging spots | https://data.beijing.gov.cn/ (accessed on 29 December 2020) | ||
| Land subsidence | Zhou et al. | ||
| Groundwater depth | http://geocloud.cgs.gov.cn (accessed on 29 December 2020) | ||
| Exposure | Station exits | https://www.bjsubway.com/ (accessed on 29 December 2020) | |
| Elevation and slope | http://www.gscloud.cn/ (accessed on 29 December 2020) | ||
| River network (2017) | http://www.ngcc.cn/ngcc/ (accessed on 29 December 2020) | ||
| Land cover | http://data.ess.tsinghua.edu.cn/ (accessed on 29 December 2020) | ||
| Fault | http://geocloud.cgs.gov.cn (accessed on 29 December 2020) | ||
| Vulnerability | Population and GDP | http://www.resdc.cn/lds.aspx (accessed on 29 December 2020) | |
| Passenger flow | https://www.bjsubway.com/ (accessed on 29 December 2020) | ||
| Subway line | https://data.beijing.gov.cn/ (accessed on 29 December 2020) | ||
| Road network (2017) | https://www.webmap.cn/commres.do?method=result25W (accessed on 29 December 2020) | ||
| Administrative divisions of Beijing (2017) | https://www.webmap.cn/commres.do?method=result25W (accessed on 29 December 2020) | ||
References
- Chen, B.; Gong, H.; Chen, Y.; Li, X.; Zhou, C.; Lei, K.; Zhu, L.; Duan, L.; Zhao, X. Land subsidence and its relation with groundwater aquifers in Beijing Plain of China. Sci. Total Environ. 2020, 735, 139111. [Google Scholar] [CrossRef]
- Lee, K.D.; Torell, G.L.; Newman, S. A once-in-one-hundred-year event? A survey assessing deviation between perceived and actual understanding of flood risk terminology. J. Environ. Manag. 2020, 277, 111400. [Google Scholar]
- Toosi, A.S.; Calbimonte, G.H.; Nouri, H.; Alaghmand, S. River basin-scale flood hazard assessment using a modified multi-criteria decision analysis approach: A case study. J. Hydrol. 2019, 574, 660–671. [Google Scholar] [CrossRef]
- EM-DAT Disaster Profiles. The OFDA/CRED International Disaster Database. 2016. Available online: http://www.emdat.be/database (accessed on 31 January 2016).
- Temmerman, S.; Meire, P.; Bouma, T.J.; Herman, P.M.; Ysebaert, T.; De Vriend, H.J. Ecosystem-based coastal defence in the face of global change. Nature 2013, 504, 79–83. [Google Scholar] [CrossRef]
- Woodruff, J.D.; Irish, J.L.; Camargo, S.J. Coastal flooding by tropical cyclones and sea-level rise. Nature 2013, 504, 44–52. [Google Scholar] [CrossRef] [PubMed]
- Montanari, A.; Koutsoyiannis, D. Modeling and mitigating natural hazards: Stationarity is immortal! Water Resour. Res. 2014, 50, 9748–9756. [Google Scholar] [CrossRef]
- Zheng, F.; Westra, S.; Leonard, M.; Sisson, S.A. Modelling dependence between extreme rainfall and storm surge to estimate coastal flooding risk. Water Resour. Res. 2014, 50, 2050–2071. [Google Scholar] [CrossRef]
- Zhu, Z.; Chen, Z.; Chen, X.; He, P. Approach for evaluating inundation risks in urban drainage systems. Sci. Total Environ. 2016, 553, 1–16. [Google Scholar] [CrossRef]
- Qian, Q. Present state, problems and development trends of urban underground space in China. Tunn. Undergr. Space Technol. 2016, 55, 280–289. [Google Scholar]
- Chen, Z.L.; Chen, J.Y.; Liu, H.; Zhang, Z.F. Present status and development trends of underground space in Chinese cities: Evaluation and analysis. Tunn. Undergr. Space Technol. 2018, 71, 253–270. [Google Scholar] [CrossRef]
- Forero-Ortiz, E.; Martínez-Gomariz, E.; Porcuna, M.C.; Locatelli, L.; Russo, B. Flood Risk Assessment in an Underground Railway System under the Impact of Climate Change—A Case Study of the Barcelona Metro. Sustainability 2020, 12, 5291. [Google Scholar] [CrossRef]
- Shen, S.L.; Wu, H.N.; Cui, Y.J.; Yin, Z.Y. Long-term settlement behaviour of metro tunnels in the soft deposits of Shanghai. Tunn. Undergr. Space Technol. 2014, 40, 309–323. [Google Scholar] [CrossRef]
- Shen, S.L.; Wu, Y.X.; Misra, A. Calculation of head difference at two sides of a cut-off barrier during excavation dewatering. Comput. Geotech. 2017, 91, 192–202. [Google Scholar] [CrossRef]
- Tan, Y.; Zhu, H.; Peng, F.; Karlsrud, K.; Wei, B. Characterization of semi-top-down excavation for subway station in Shanghai soft ground. Tunn. Undergr. Space Technol. 2017, 68, 244–261. [Google Scholar] [CrossRef]
- Wang, X.W.; Yang, T.L.; Xu, Y.S.; Shen, S.L. Evaluation of optimized depth of waterproof curtain to mitigate negative impacts during dewatering. J. Hydrol. 2019, 577, 123969. [Google Scholar] [CrossRef]
- Tang, S.; Li, X. Study on design water level of flood control for metro stations: A case study of hefei line 5. Chin. J. Undergr. Space Eng. 2018, 14 (Suppl. 2), 881–886, 899. (In Chinese) [Google Scholar]
- Lyu, H.; Shen, S.; Yan, X.; Yujin, S.Y.; Xu, Y. Risk assessment of metro system induced by land subsidence in Shanghai. J. Nanjing Univ. 2019, 55, 392–400. (In Chinese) [Google Scholar]
- Xu, Y.S.; Yan, X.X.; Shen, S.L.; Zhou, A.N. Experimental investigation on the blocking of groundwater seepage from a waterproof curtain during pumped dewatering in an excavation. Hydrogeol. J. 2019, 27, 2659–2672. [Google Scholar] [CrossRef]
- Sun, L.; Luo, J. For the Passengers to Return Home Safely—Beijing Subway Fights Extremely Heavy Rainfall. China Road Transp. 2012, 9, 32–34. [Google Scholar]
- Vermeij, D.A.A.N. Flood Risk Reduction Interventions for the New York City Subway System: A Research on the Impact of Storm Surge and Sea Level Rise on the Safety Against Flooding in Urban Delta’s. 2016. Available online: https://repository.tudelft.nl/islandora/object/uuid:db184167-b1b7-4dd1-b7f0-623df2352fe0 (accessed on 16 September 2020).
- Sosa, E.; Thompson, G.; Barbero, E. Testing of full-scale inflatable plug for flood mitigation in tunnels. Transp. Res. Rec. J. Transp. Res. Board 2014, 2407, 59–67. [Google Scholar] [CrossRef]
- Herath, S.; Dutta, D. Modeling of urban flooding including underground space. In Proceedings of the Second International Conference of Asia-Pacific Hydrology and Water Resources Association, Tokyo, Japan, 5–8 July 2004; pp. 55–63. [Google Scholar]
- Aoki, Y.; Yoshizawa, A.; Taminato, T. Anti-inundation measures for underground stations of Tokyo Metro. Procedia Eng. 2016, 165, 2–10. [Google Scholar] [CrossRef]
- Lyu, H.M.; Wang, G.F.; Shen, J.S.; Lu, L.H.; Wang, G.Q. Analysis and GIS mapping of flooding hazards on May 10, 2016, Guangzhou, China. Water 2016, 8, 447. [Google Scholar] [CrossRef]
- CDN. Chinadaily News, Heavy Rain Disrupts Beijing Traffic. 2011. Available online: http://www.chinadaily.com.cn/ethnic/photo/2011-06/23/content_12763843_2.htm (accessed on 29 November 2020).
- XLN. Xinlang News, 4.11 Flood Event Caused 11 Deaths: Successive Death after Meteorological Warning. 2019. Available online: https://news.sina.cn/2019-04-14/detailihvhiqax2511646.d.html?pos=3&vt=4 (accessed on 9 July 2019).
- Mishra, K.; Sinha, R. Flood risk assessment in the Kosi megafan using multi-criteria decision analysis: A hydro-geomorphic approach. Geomorphology 2020, 350, 106861. [Google Scholar] [CrossRef]
- Wang, Z.; Lai, C.; Chen, X.; Yang, B.; Zhao, S.; Bai, X. Flood hazard risk assessment model based on random forest. J. Hydrol. 2015, 527, 1130–1141. [Google Scholar] [CrossRef]
- Alfieri, L.; Feyen, L.; Dottori, F.; Bianchi, A. Ensemble flood risk assessment in Europe under high end climate scenarios. Glob. Environ. Chang. Hum. Policy Dimens. 2015, 35, 199–212. [Google Scholar] [CrossRef]
- Wang, G.; Liu, Y.; Hu, Z.; Lyu, Y.; Zhang, G.; Liu, J.; Liu, Y.; Gu, Y.; Huang, X.; Zheng, H.; et al. Flood Risk Assessment Based on Fuzzy Synthetic Evaluation Method in the Beijing-Tianjin-Hebei Metropolitan Area, China. Sustainability 2020, 12, 1451. [Google Scholar] [CrossRef]
- Bonì, R.; Meisina, C.; Cigna, F.; Herrera, G.; Notti, D.; Bricker, S.; McCormack, H.; Tomás, R.; Béjar-Pizarro, M.; Mulas, J.; et al. Exploitation of satellite A-DInSAR time series for detection, characterization and modelling of land subsidence. Geosciences 2017, 7, 25. [Google Scholar] [CrossRef]
- Chen, B.; Gong, H.; Li, X.; Lei, K.; Zhu, L.; Gao, M.; Zhou, C. Characterization and causes of land subsidence in Beijing, China. Int. J. Remote Sens. 2017, 3, 808–826. [Google Scholar] [CrossRef]
- Dong, S.; Samsonov, S.; Yin, H.; Ye, S.; Cao, Y. Time-series analysis of subsidence associated with rapid urbanization in Shanghai, China measured with SBAS InSAR method. Environ. Earth Sci. 2014, 72, 677–691. [Google Scholar] [CrossRef]
- Fadhillah, M.F.; Achmad, A.R.; Lee, C.W. Integration of InSAR Time-Series Data and GIS to Assess Land Subsidence along Subway Lines in the Seoul Metropolitan Area, South Korea. Remote Sens. 2020, 12, 3505. [Google Scholar] [CrossRef]
- Galloway, D.L.; Burbey, T.J. Regional land subsidence accompanying groundwater extraction. Hydrogeol. J. 2011, 19, 1459–1486. [Google Scholar] [CrossRef]
- Duan, L.; Gong, H.; Chen, B.; Zhou, C.; Lei, K.; Gao, M.; Yu, H.; Cao, Q.; Cao, J. An Improved Multi-Sensor MTI Time-Series Fusion Method to Monitor the Subsidence of Beijing Subway Network during the Past 15 Years. Remote Sens. 2020, 12, 2125. [Google Scholar] [CrossRef]
- Hu, L.; Dai, K.; Xing, C.; Li, Z.; Tomás, R.; Clark, B.; Shi, X.; Chen, M.; Zhang, R.; Qiu, Q.; et al. Land subsidence in Beijing and its relationship with geological faults revealed by Sentinel-1 InSAR observations. Int. J. Appl. Earth Obs. Geoinf. 2019, 82, 101886. [Google Scholar] [CrossRef]
- Chen, M.; Tomás, R.; Li, Z.; Motagh, M.; Li, T.; Hu, L.; Gong, H.; Li, X.; Yu, J.; Gong, X. Imaging land subsidence induced by groundwater extraction in Beijing (China) using satellite radar interferometry. Remote Sens. 2016, 8, 468. [Google Scholar] [CrossRef]
- Zhao, N.; Jiao, Y.; Ma, T.; Zhao, M.; Fan, Z.; Yin, X.; Liu, Y.; Yue, T. Estimating the effect of urbanization on extreme climate events in the Beijing-Tianjin-Hebei region, China. Sci. Total Environ. 2019, 688, 1005–1015. [Google Scholar] [CrossRef] [PubMed]
- IPCC Secretariat. Climate Change 2014-Impacts, Adaptation and Vulnerability (Part A: Global and Sectoral Aspects); IPCC: Geneva, Switzerland, 2014. [Google Scholar]
- Dou, X.; Song, J.; Wang, L.; Tang, B.; Xu, S.; Kong, F.; Jiang, X. Flood risk assessment and mapping based on a modified multi-parameter flood hazard index model in the Guanzhong Urban Area, China. Stoch. Environ. Res. Risk Assess. 2018, 32, 1131–1146. [Google Scholar] [CrossRef]
- Ghosh, A.; Kar, S.K. Application of analytical hierarchy process (AHP) for flood risk assessment: A case study in Malda district of West Bengal, India. Nat. Hazards 2018, 94, 349–368. [Google Scholar] [CrossRef]
- Zhou, Y.; Luo, Y.; Guo, G.X.; Luo, Y.; Lei, K.C.; Wang, R. A study of the characteristics of land subsidence and the main control factors in the alluvial plain: A case study of Beijing plain. Geol. Bull. China 2016, 35, 2100–2110. (In Chinese) [Google Scholar]
- Lai, C.; Shao, Q.; Chen, X.; Wang, Z.; Zhou, X.; Yang, B.; Zhang, L. Flood risk zoning using a rule mining based on ant colony algorithm. J. Hydrol. 2016, 542, 268–280. [Google Scholar] [CrossRef]
- Hu, S.; Cheng, X.; Zhou, D.; Zhang, H. GIS-based flood risk assessment in suburban areas: A case study of the Fangshan District, Beijing. Nat. Hazards 2017, 87, 1525–1543. [Google Scholar] [CrossRef]
- Radwan, F.; Alazba, A.A.; Mossad, A. Flood risk assessment and mapping using AHP in arid and semiarid regions. Acta Geophys. 2019, 67, 215–229. [Google Scholar] [CrossRef]
- Chakraborty, S.; Mukhopadhyay, S. Assessing flood risk using analytical hierarchy process (AHP) and geographical information system (GIS): Application in Coochbehar district of West Bengal, India. Nat. Hazards 2019, 99, 247–274. [Google Scholar] [CrossRef]
- Saaty, T. The Analytic Hierarchy Process; McGraw-Hill: New York, NY, USA, 1980. [Google Scholar]
- Akter, M.; Jahan, M.; Kabir, R.; Karim, D.S.; Haque, A.; Rahman, M.; Salehin, M. Risk assessment based on fuzzy synthetic evaluation method. Sci. Total Environ. 2019, 658, 818–829. [Google Scholar] [CrossRef]
- Chang, D.Y. Applications of the extent analysis method on fuzzy AHP. Eur. J. Oper. Res. 1996, 95, 649–655. [Google Scholar] [CrossRef]
- Zhang, Y.; Hong, Y.; Wang, X.; Gourley, J.J.; Xue, X.; Saharia, M.; Ni, G.; Wang, G.; Huang, Y.; Chen, S.; et al. Hydrometeorological Analysis and Remote Sensing of Extremes: Was the July 2012 Beijing Flood Event Detectable and Predictable by Global Satellite Observing and Global Weather Modeling Systems? J. Hydrometeorol. 2015, 16, 381–395. [Google Scholar] [CrossRef]
- Xu, Y.; Shen, S.; Cai, Z.; Zhou, G. The state of land subsidence and prediction approaches due to groundwater withdrawal in China. Nat. Hazards 2008, 45, 123–135. [Google Scholar] [CrossRef]
- Zhang, Y.; Gong, H.; Gu, Z.; Wang, R.; Li, X.; Zhao, W. Characterization of land subsidence induced by groundwater withdrawals in the plain of Beijing City, China. Hydrogeol. J. 2014, 22, 397–409. [Google Scholar] [CrossRef]
- Du, Z.; Ge, L.; Ng, A.H.M.; Zhu, Q.; Yang, X.; Li, L. Correlating the subsidence pattern and land use in Bandung, Indonesia with both Sentinel-1/2 and ALOS-2 satellite images. Int. J. Appl. Earth Obs. Geoinf. 2018, 67, 54–68. [Google Scholar] [CrossRef]
- Long, D.; Yang, W.; Scanlon, B.R.; Zhao, J.; Liu, D.; Burek, P.; Pan, Y.; You, L.; Wada, Y. South-to-North Water Diversion stabilizing Beijing’s groundwater levels. Nat. Commun. 2020, 11, 1–10. [Google Scholar]
- Wang, G.; Hu, Z.; Liu, Y.; Zhang, G.; Liu, J.; Lyu, Y.; Gu, Y.; Huang, X.; Zhang, Q.; Tong, Z.; et al. Impact of Expansion Pattern of Built-Up Land in Floodplains on Flood Vulnerability: A Case Study in the North China Plain Area. Remote Sens. 2020, 12, 3172. [Google Scholar] [CrossRef]
- Jiang, W.; Deng, L.; Chen, L.; Wu, J.; Li, J. Risk assessment and validation of flood disaster based on fuzzy mathematics. Prog. Nat. Sci. 2009, 19, 1419–1425. [Google Scholar] [CrossRef]
- Jakoubek, M. Flood Protection of Prague Metro after the 2002 Flood; Barták, H., Romancov, Z., Eds.; The 4th Dimension of Metropolises; Taylor & Francis Group: London, UK, 2007; pp. 1303–1308. [Google Scholar]


Publisher’s Note: MDPI stays neutral with regard to jurisdictional claims in published maps and institutional affiliations. |
© 2021 by the authors. Licensee MDPI, Basel, Switzerland. This article is an open access article distributed under the terms and conditions of the Creative Commons Attribution (CC BY) license (http://creativecommons.org/licenses/by/4.0/).