Article

Evaluation of IMERG Level-3 Products in Depicting the July to October Rainfall over Taiwan: Typhoon Versus Non-Typhoon

Department of Earth Sciences, National Taiwan Normal University, Taipei 11677, Taiwan
*
Author to whom correspondence should be addressed.
Remote Sens. 2021, 13(4), 622; https://doi.org/10.3390/rs13040622
Submission received: 17 January 2021 / Revised: 31 January 2021 / Accepted: 4 February 2021 / Published: 9 February 2021
(This article belongs to the Special Issue Estimating Meteorological Variables by Remote Sensing Data)

Abstract

:
This study assesses the performance of satellite precipitation products (SPPs) from the latest version, V06B, Integrated Multi-satellitE Retrievals for Global Precipitation Mission (IMERG) Level-3 (including early, late, and final runs), in depicting the characteristics of typhoon season (July to October) rainfall over Taiwan within the period of 2000–2018. The early and late runs are near-real-time SPPs, while final run is post-real-time SPP adjusted by monthly rain gauge data. The latency of early, late, and final runs is approximately 4 h, 14 h, and 3.5 months, respectively, after the observation. Analyses focus on the seasonal mean, daily variation, and interannual variation of typhoon-related (TC) and non-typhoon-related (non-TC) rainfall. Using local rain-gauge observations as a reference for evaluation, our results show that all IMERG products capture the spatio-temporal variations of TC rainfall better than those of non-TC rainfall. Among SPPs, the final run performs better than the late run, which is slightly better than the early run for most of the features assessed for both TC and non-TC rainfall. Despite these differences, all IMERG products outperform the frequently used Tropical Rainfall Measuring Mission 3B42 v7 (TRMM7) for the illustration of the spatio-temporal characteristics of TC rainfall in Taiwan. In contrast, for the non-TC rainfall, the final run performs notably better relative to TRMM7, while the early and late runs showed only slight improvement. These findings highlight the advantages and disadvantages of using IMERG products for studying or monitoring typhoon season rainfall in Taiwan.

Graphical Abstract

1. Introduction

Located in East Asia, Taiwan (120°E–122°E, 22°N–25.2°N; about 144 km wide, 394 km long) is an island with complex terrains (Figure 1a), making it a valuable location for studying the effects of topography on the movement and structure of typhoons and their related rainfall variations [1,2]. On average, 3–5 typhoons (Figure 1b) affect Taiwan each year (Figure 1c) [3,4]. From July to October (hereinafter JASO), i.e., the typhoon season, more than 40% of seasonal rainfall in Taiwan is attributed to typhoon-related rainfall (hereinafter TC rainfall; Figure 1d) [5,6]. As TC rainfall frequently leads to flooding, debris flows, and large economic losses [7,8], many studies have focused on understanding the spatio-temporal characteristics of TC rainfall in Taiwan over various timescales [9,10,11]. Local researchers might generally use high-density rain-gauge observations [11,12] or the weather radar network data [13,14,15,16,17,18] for the study of TC rainfall; however, the raw data of these observations usually are not free accessible for “non-local” researchers. Instead, free accessible satellite precipitation products (SPPs) become an important source of information for “non-local” researchers interested in studying TC rainfall over Taiwan. Thus, it is crucial to conduct studies to evaluate the performance of SPPs in estimating TC rainfall over Taiwan. However, on comparison with the number of studies carried out in other regions evaluating similar issues [18,19,20,21,22], the performance of SPPs in estimating TC rainfall over Taiwan remains significantly understudied.
The Tropical Rainfall Measuring Mission 3B42 v7 (hereinafter TRMM7), which was launched in November 1997 and ceased in December 2019, has been the most frequently used SPP for the study of rainfall variations in East Asia [23,24,25], including Taiwan [26], over the past 20 years. To continue the monitoring of global precipitation, the Global Precipitation Measurement (GPM) Core Observatory Satellite was launched in February 2014 [27]. In March 2019, the National Aeronautics and Space Administration (NASA) released the newest version (v6) of Integrated Multi-satellitE Retrievals for GPM (IMERG) Level-3 products, which include TRMM-era data since June 2000 [28]. The IMERG Level-3 consists of three different SPPs, namely, early, late, and final run (hereinafter IMERG-E, IMERG-L, and IMERG-F, respectively), based on the release time. The IMERG-E and IMERG-L are released around 4 h and 14 h after the nominal observation time, respectively, and are frequently considered as the near real-time (NRT) products [28]. Unlike the NRT products, IMERG-F ingests monthly Global Precipitation Climatology Center (GPCC) gauge analyses for bias adjustment and is released approximately three months after the nominal observation time. For the details of features of the different versions of IMERG Level-3 products, please refer to [28].
Because IMERG-F was suggested by NASA for most research purposes, more recent studies have evaluated the performance of IMERG-F in depicting the local rainfall over various regions [29,30,31,32,33]. For example, [29] compared the ability of IMERG-F v3 and TRMM7; they noted that IMERG-F v3 exhibits an overall better performance than TRMM7 in depicting the TC-related rainfall during 2014 to 2015 for eight TCs over the coastal region of China. However, [29] did not focus on the TC-related rainfall over Taiwan. Recently, [30] assessed the ability of IMERG-F v5 and noted that it can qualitatively depict multiple timescale variations in rainfall over Taiwan, similar to the local rain-gauge observations. In [33], the differences among IMERG-F v5, IMERG-F v6, and TRMM7 were compared; they suggested that IMERG-F v6 outperformed both IMERG-F v5 and TRMM7 in capturing the interannual variation of summer convective afternoon rainfall events over Taiwan within the period of 2000–2018. However, neither [30] nor [33] examined the performance of IMERG-E and IMERG-L products, nor did they focus on TC-related rainfall features. It was known that relative to IMERG-F, the NRT products (i.e., IMERG-E and IMERG-L) can provide rapid information on rainfall features, which are beneficial for estimating the effects of heavy rainfall events. However, the number of studies assessing the robustness of IMERG-E and IMERG-L products in depicting rainfall features over Taiwan is relatively small, compared to those of IMERG-F. Therefore, this study primarily aims to clarify this issue, with a focus on TC-related rainfall features.
Further objectives of this study were to clarify: (1) whether the use of SPPs from IMERG Level-3 v6 (instead of TRMM7) is advantage to the study of TC rainfall features, and (2) whether the differences between the abilities of these SPPs to depict TC and non-TC rainfall features are obvious. Clarifying these issues will help understanding the advantages and disadvantages of using IMERG Level-3 products for studying or monitoring typhoon season rainfall in Taiwan. The remainder of this manuscript is organized as follows. Information on the data and statistical methodology are introduced in Section 2. The evaluation and application of SPPs in studying the multiple timescale variations of TC and non-TC rainfall over Taiwan are documented in Section 3. Explanations for why the examined statistic scores have provided those values are given in Section 4, and the summary is provided in Section 5.

2. Data and Methods

2.1. Data

In this study, we used gridded hourly rain-gauge data, generated from more than 400 rain gauges provided by the Central Weather Bureau in Taiwan (hereinafter, CWB data) as the reference base for evaluation. Four selected SPPs were evaluated, including the latest versions of (1) IMERG-E, IMERG-L, and IMERG-F (i.e., v6; available at https://pmm.nasa.gov/data-access/downloads/gpm) [28] and (2) TRMM7 (i.e., v7; available at https://pmm.nasa.gov/data-access/downloads/trmm) [34]. The IMERG products provide calibrated and uncalibrated precipitation estimations, and we used the calibrated precipitation estimates in the evaluations. Production details for calibrated precipitation estimates of these IMERG products are described in [28]. For the purpose of this study, however, some of the processing steps for IMERG-E, IMERG-L, and IMERG-F pointed out by [28] were documented here. For IMERG-L and IMERG-F, the precipitation estimates were propagated forward and backward (allowing interpolation) in time. In contrast, for IMERG-E, only the forward propagation method (which basically amounts to extrapolation forward in time) was applied. In addition, the bias adjustment using “monthly” GPCC gauge analyses was applied only for IMERG-F, but not IMERG-E and IMERG-L.
Basic information of time delay, the spatio-temporal resolution of SPPs examined in this study is documented in Table 1. The original spatial resolution of IMERG products is 0.1 × 0.1 with a 30 min temporal resolution, and for TRMM7, the original resolutions are 0.25 × 0.25 and 3 h, respectively. To compare with the CWB data, all of these SPPs were interpolated linearly into a 0.1 × 0.1 spatial resolution. Daily (monthly) data were produced by accumulating rainfall during a day (month), for the time period 2000–2018 JASO. In addition, we utilized: (1) wind circulation data from the fifth generation of the ECMWF ReAnalysis (available at ERA5; https://www.ecmwf.int/) [35] to help with the construction of Figure 1b, and (2) the GPCC data (available at https://opendata.dwd.de/climate_environment/GPCC/full_data_daily_V2018_05) [36] to aid discussions in Section 4.

2.2. Identification of TC and Non-TC Rainy Days

The calculation of TC rainfall and non-TC rainfall was performed in several steps. First, a “rainy day” is determined when the area-averaged daily rainfall recorded by the CWB is greater than 0.1 mm per day (hereinafter mm·d−1) [33]. Second, following [33], when the distance between Taiwan’s coastline (Figure 1a) and the center of a TC is within 300 km on a rainy day, it is defined as a TC rainy day (hereinafter TC day). The TC track information was obtained from the best track data provided by the Joint Typhoon Warning Center (https://www.metoc.navy.mil/jtwc/jtwc.html). Other rainy days are defined as non-TC rainy days (hereinafter non-TC days). In total, 2224 rainy days are defined during the period 2000–2018 JASO, with 282 TC days and 1942 non-TC days.

2.3. Statistical Methods for Comparison

Statistical methods used for the quantitative evaluation included the relative bias (RB, perfect score = 0), root-mean-square error (RMSE, perfect score = 0), relative root-mean-square error (RRMSE, perfect score = 0), probability of detection (POD, perfect score = 1), critical success index (CSI; also known as the threat score, perfect score = 1), and false alarm ratio (FAR, perfect score = 0) [37]. The RB, RMSE, and RRMSE were calculated using the following equations:
RB   =     ( SPP CWB )   ( CWB ) ,
RMSE   =   ( SPP CWB ) 2 N   ,
RRMSE   =   1 N   ( SPP CWB ) 2 1 N   ( CWB ) ,
where N is the sample sizes used for the comparison between SPP and CWB. The POD, CSI, and FAR are defined as follows:
POD   = hits hits + misses ,
CSI   =   hits hits + false   alarms + misses ,
  FAR   = false   alarms hits + false   alarms .
The definition of hits, misses, and false alarms is presented in Table 2, and the definition of these contingency score parameters (including POD, CSI, and FAR) are discussed in detail by [37].
In addition, the spatio-temporal similarities between CWB and SPPs are calculated based on the spatial correlation coefficient (Scorr, perfect score = 1) and temporal correlation coefficient (Tcorr, perfect score = 1), respectively. The correlation coefficient (Corr) between CWB and SPP is calculated based on Equation (7).
  Corr   =   ( SPP SPP ¯ ) ( CWB CWB ¯ )   ( SPP SPP ¯ ) 2   ( CWB CWB ¯ ) 2 ,
where N is the sample size (i.e., number of spatial grid points for Scorr; number of temporal points for Tcorr), SPP ¯ is the mean of all sample sizes of SPP, and CWB ¯ is the mean of all sample sizes of CWB. Probability density function (PDF) of an analyzed variable is calculated based on Equation (8).
PDF   ( % )   =   number   of   analyzed   variable   at   selected   threshold   number   of   analyzed   variables   at   all   thresholds   100 % .
The selection of all these statistical scores were based on what the features (temporal similarity or spatial similarity or quantitative rainfall estimation, etc.) we were interested to examine in Section 3.

3. Results

3.1. Seasonal Mean

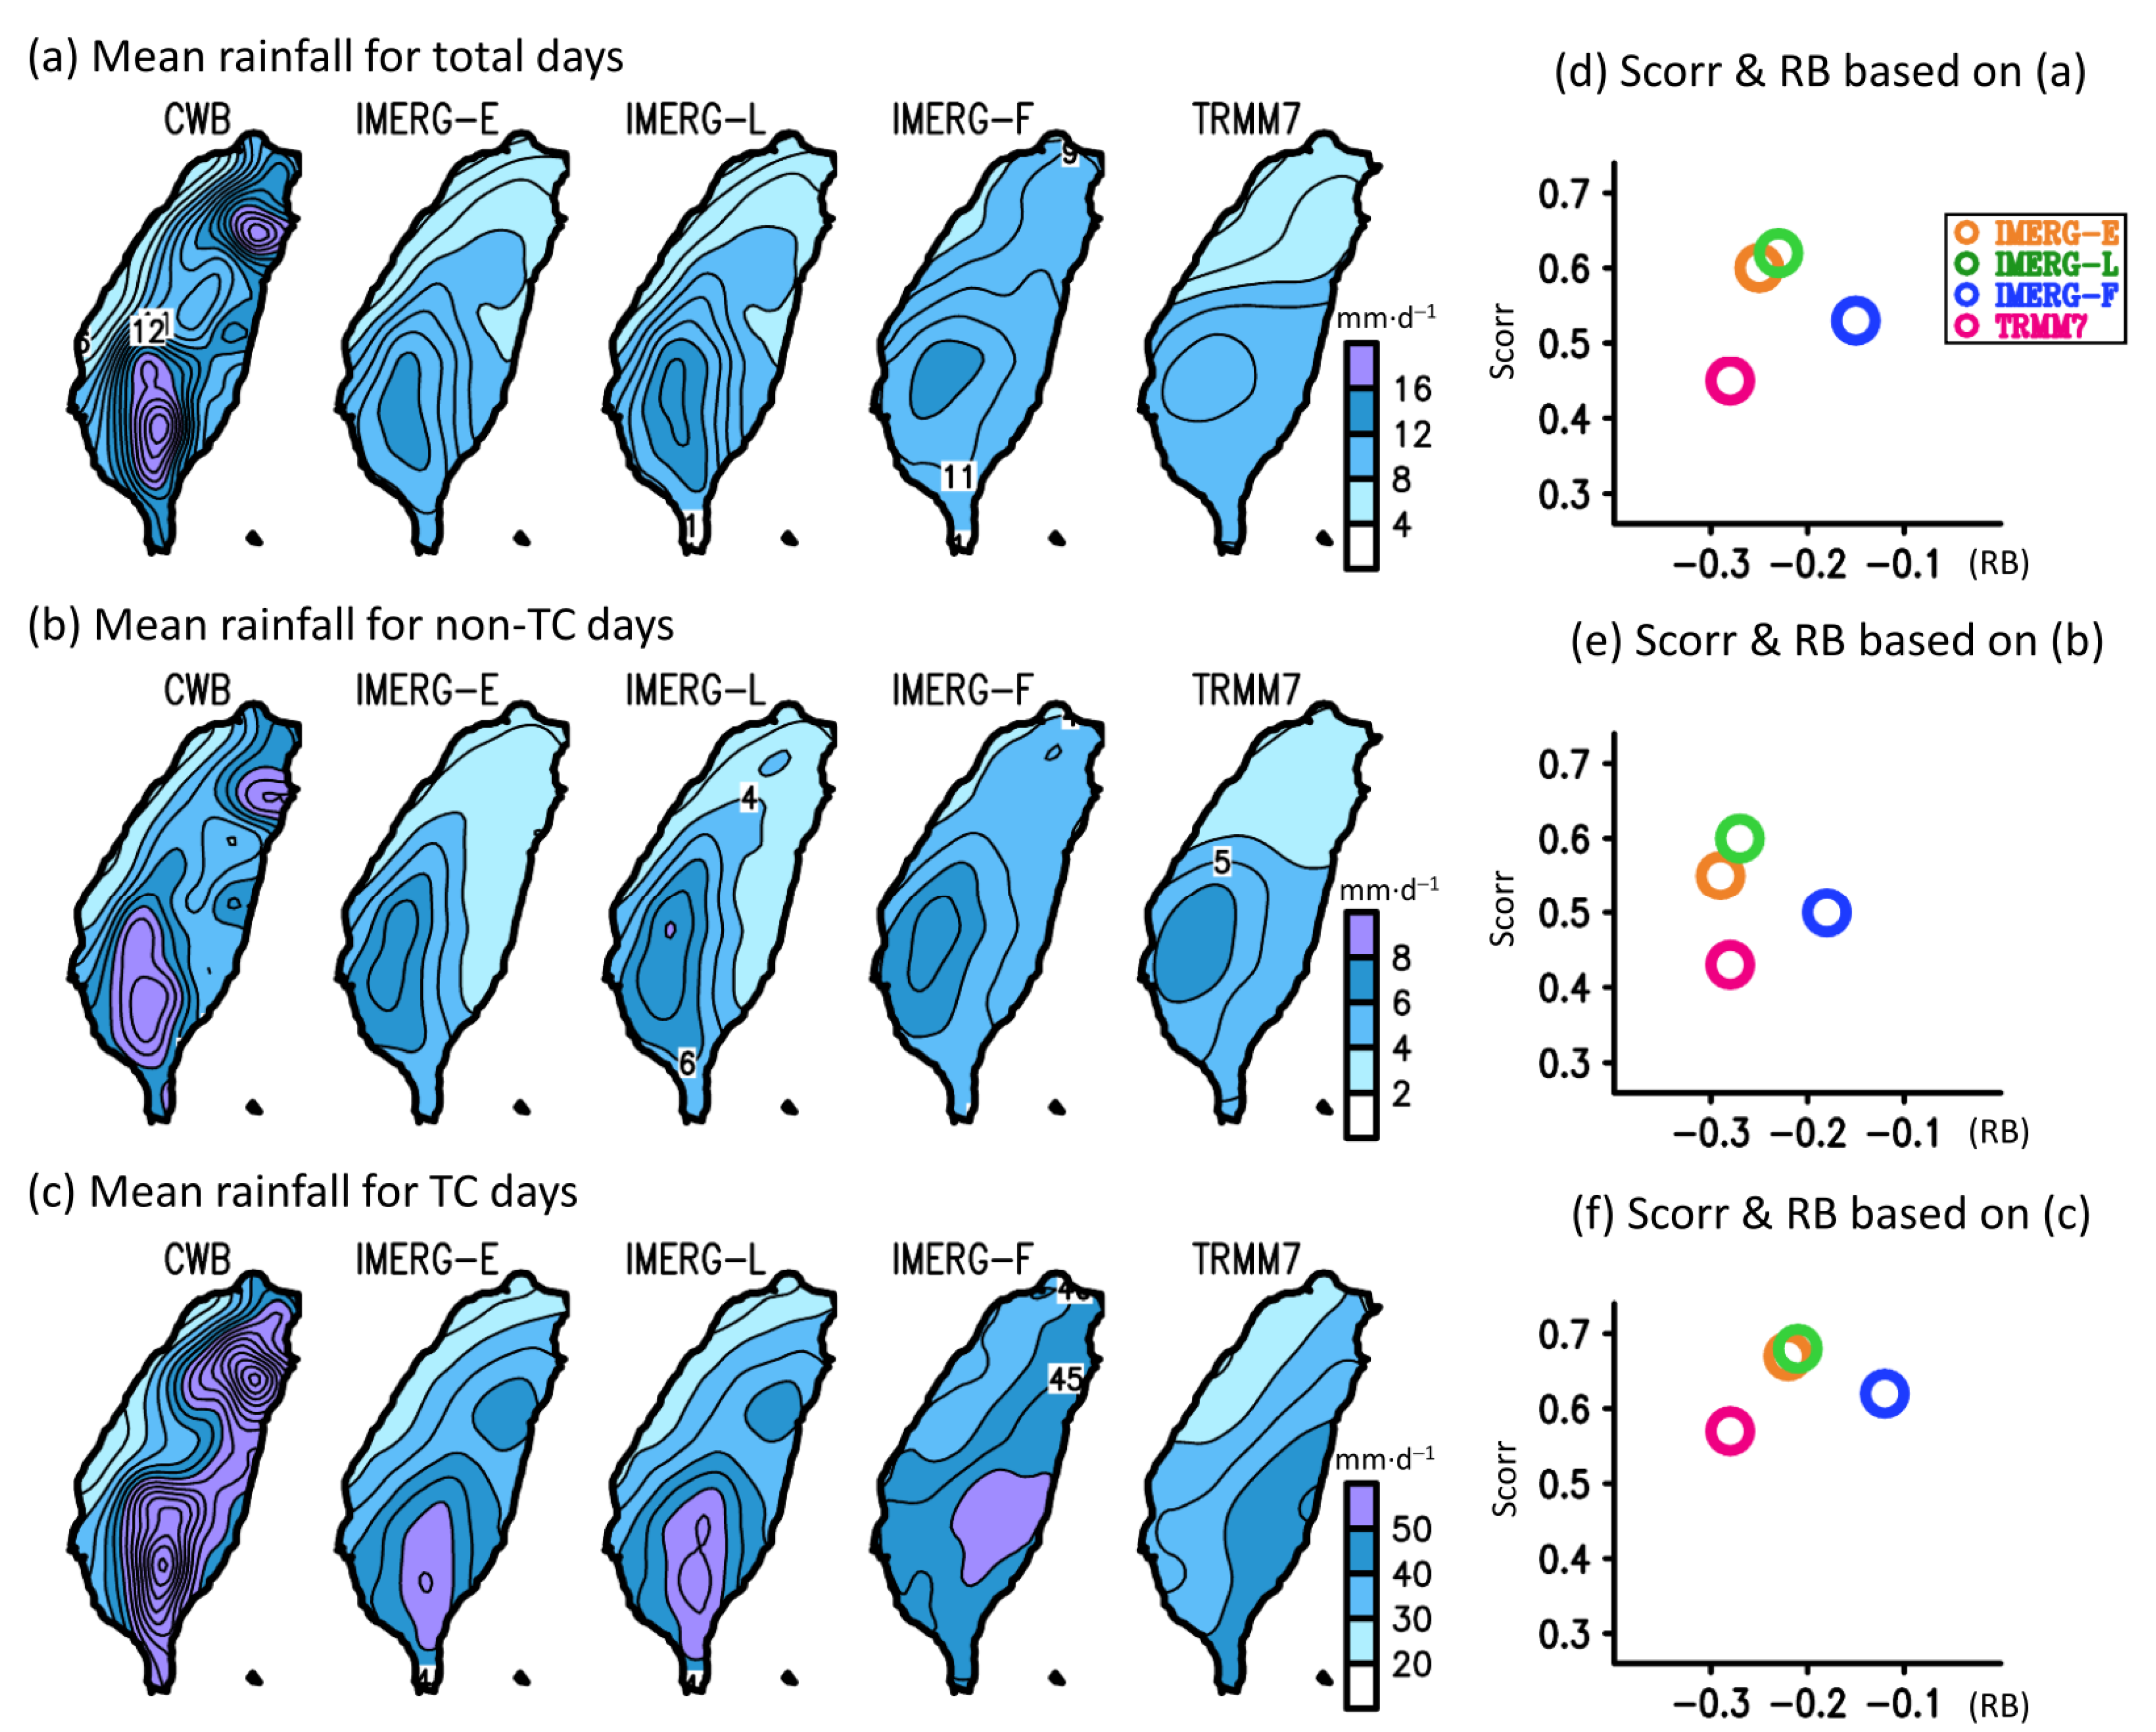
Figure 2a shows the horizontal distribution of the seasonal mean total rainfall over Taiwan, averaged during 2000–2018 JASO and estimated from the CWB and selected SPPs. Focusing on the CWB of Figure 2a, there are two maximum rainfall centers, one each in southern and northeastern Taiwan. The formation of these two maximum centers is caused mainly by the interactions between the topography and monsoonal flows [38,39]. By separating the total rainfall (Figure 2a) into non-TC (Figure 2b) and TC (Figure 2c) rainfall, we note from CWB that both also consist of two maximum centers, similar to those for total rainfall. However, relative to non-TC rainfall, TC rainfall distribution shows a more evident east–west contrast, with greater rainfall over eastern than western Taiwan. This feature, which was also noted in previous studies [40], might arise because TCs tend to make landfall more frequently over eastern Taiwan than over western Taiwan [4,41].
By comparing the features documented in Figure 2a–c, we note that all IMERG products tend to underestimate the total, non-TC, and TC rainfall. The use of IMERG products to estimate rainfall distribution over Taiwan seems minimizing the topographic effect (i.e., too smooth compared to CWB). Among IMERG products, IMERG-F has an area-averaged rainfall value much closer to that of CWB, whereas the value of IMERG-E is much less than that of CWB (see Table 3). Despite the magnitude difference, all IMERG products can depict the southern (but not northern) maximum center, for the total and non-TC rainfall. As inferred from [30], two possible reasons might explain why IMERG has bias in underestimating precipitation over northern Taiwan: (1) the brightness temperature of warm orographic clouds is generally too warm for infrared thresholds, and (2) the ice content within warm orographic clouds is generally too low to be detected by passive microwave sensors. For the TC rainfall, IMERG-E and IMERG-L have depicted two maximum rainfall centers similar to CWB, while IMERG-F shows only one maximum center and a more distinct east–west contrast, with greater rainfall over eastern Taiwan than western Taiwan. Overall, the rainfall distribution suggested by the two NRT products (i.e., IMERG-E and IMERG-L) is similar, but the rainfall magnitude in IMERG-L is slightly greater than that in IMERG-E and closer to CWB. Relative to IMERG-E and IMERG-L, it seems that IMERG-F reduces the bias in underestimating the rainfall magnitude but increases the bias in illustrating the spatial distribution.
To further clarify the performance difference among IMERG products, we calculated RB and Scorr between CWB and SPPs for those patterns shown in Figure 2a–c; the results are shown in Figure 2d–f. All SPPs were found to have negative RB values, suggesting that all SPPs have a bias toward underestimating typhoon season rainfall (Table 3). Among SPPs, IMERG-F has the value of RB closest to 0 (−0.15 for total rainfall, −0.18 for non-TC rainfall, and −0.12 for TC rainfall), suggesting that its performance in the quantitative estimation of examined rainfall is better than that of other SPPs. After IMERG-F, IMERG-L has a slightly better overall performance for RB (−0.23 for total rainfall, −0.27 for non-TC rainfall, and −0.21 for TC rainfall) than IMERG-E (−0.25 for total rainfall, −0.29 for non-TC rainfall, and −0.22 for TC rainfall). Overall, IMERG-L had the highest Scorr values for total rainfall (~0.62), non-TC rainfall (~0.60), and TC rainfall (~0.68), while IMERG-E has higher Scorr values than IMERG-F for all assessed rainfall. This confirms the earlier suggestion that IMERG NRT products are more skilled than IMERG-F in illustrating the spatial distribution of examined rainfall, especially for TC rainfall.
It is noteworthy that [33] recently demonstrated that IMERG-F is better than TRMM7 in capturing the summer rainfall variations over Taiwan. Based on the findings of [33], we conducted the horizontal distribution of seasonal mean rainfall for total, non-TC, and TC days estimated from TRMM7 (Figure 2a–c) and compared these with the IMERG products. As seen from Figure 2d–f, IMERG-F performs better than TRMM7 in terms of RB and Scorr for all examined rainfall. Furthermore, IMERG-E and IMERG-L tended to perform better than TRMM7, especially for TC rainfall. To clarify whether the findings revealed in Section 3.1 are also true for the daily variations, we conducted related evaluations as discussed below.

3.2. Daily Variation

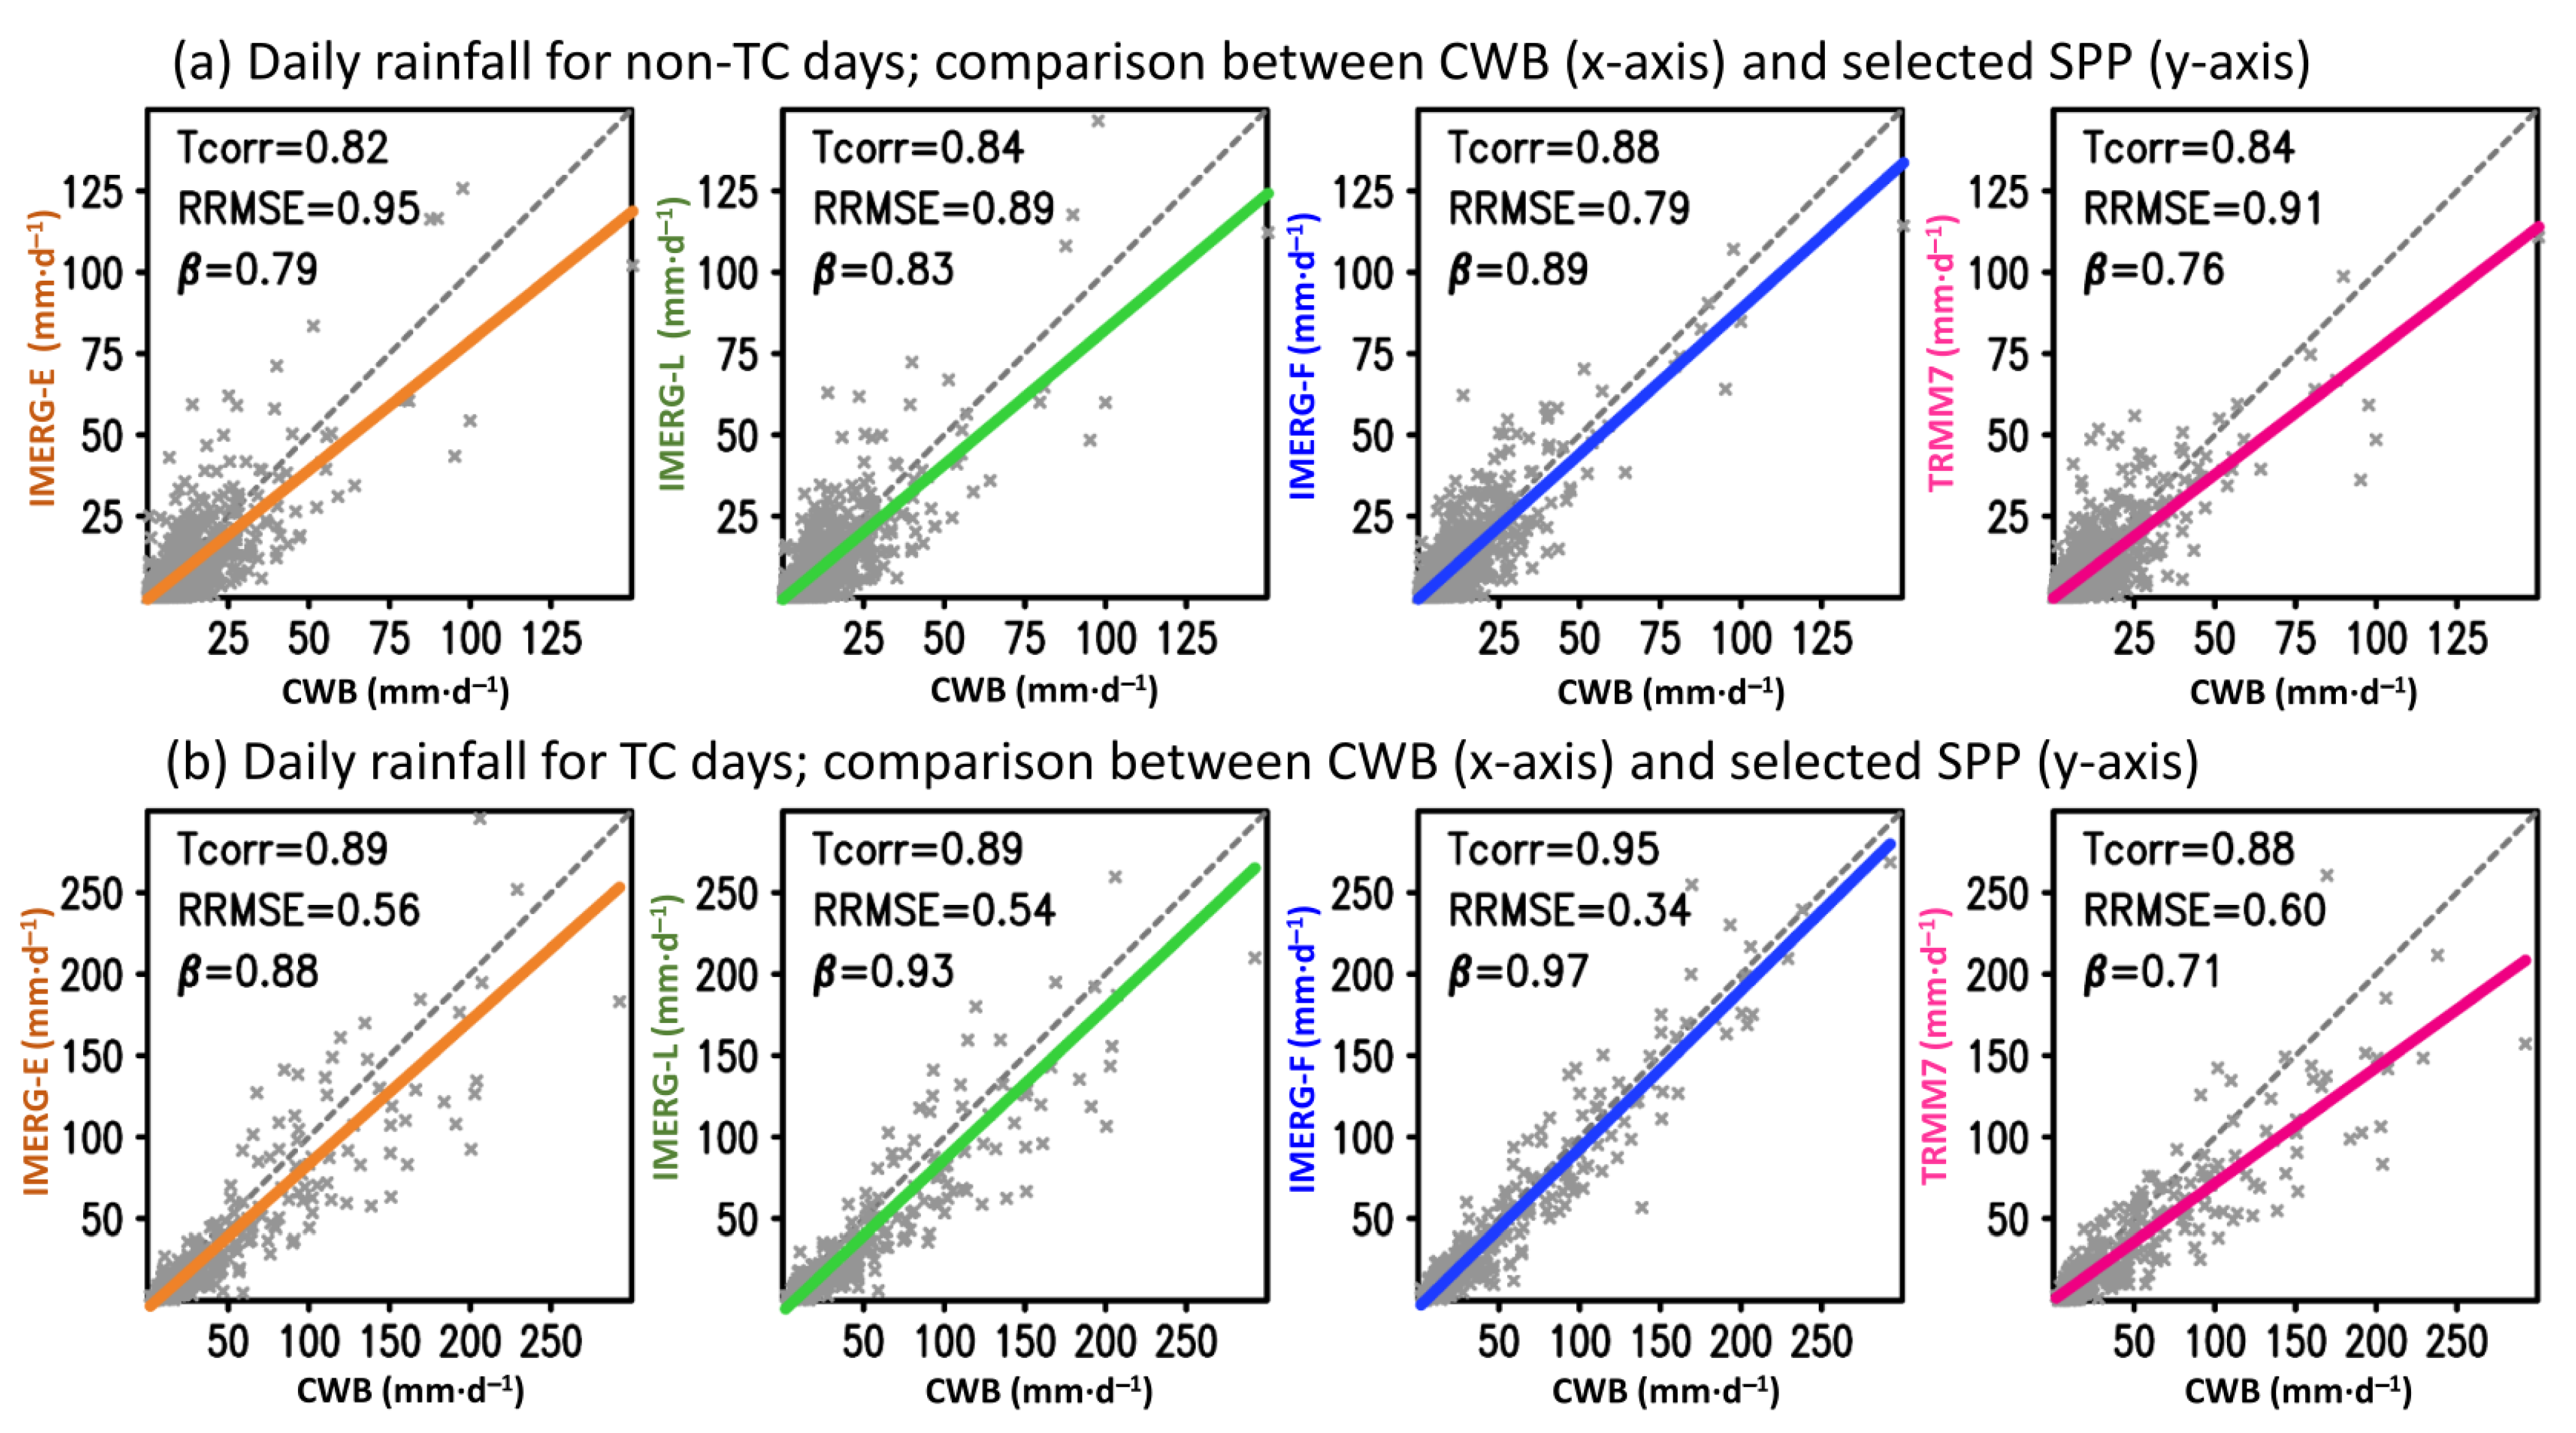
Figure 3 shows the comparison of daily rainfall area-averaged over Taiwan between CWB and selected SPPs for non-TC days (Figure 3a) and TC days (Figure 3b). The evaluations are based on the Tcorr and RRMSE. It is understood that when the values of Tcorr and RRMSE closer to the perfect score (i.e., 1 and 0, respectively), it implies that the SPP has better performance skill. Therefore, for non-TC rainfall in Figure 3a, we concluded that IMERG-F had the best performance (Tcorr = 0.88, RRMSE = 0.79), followed by IMERG-L (Tcorr = 0.84, RRMSE = 0.89), TRMM7 (Tcorr = 0.84, RRMSE = 0.91), and IMERG-E (Tcorr = 0.82, RRMSE = 0.95), in that order. With regard to TC rainfall (Figure 3b), IMERG-F (Tcorr = 0.95, RRMSE = 0.34) also performed best, followed by IMERG-L (Tcorr = 0.89, RRMSE = 0.54), IMERG-E (Tcorr = 0.89, RRMSE = 0.56), and TRMM7 (Tcorr = 0.88, RRMSE = 0.60).
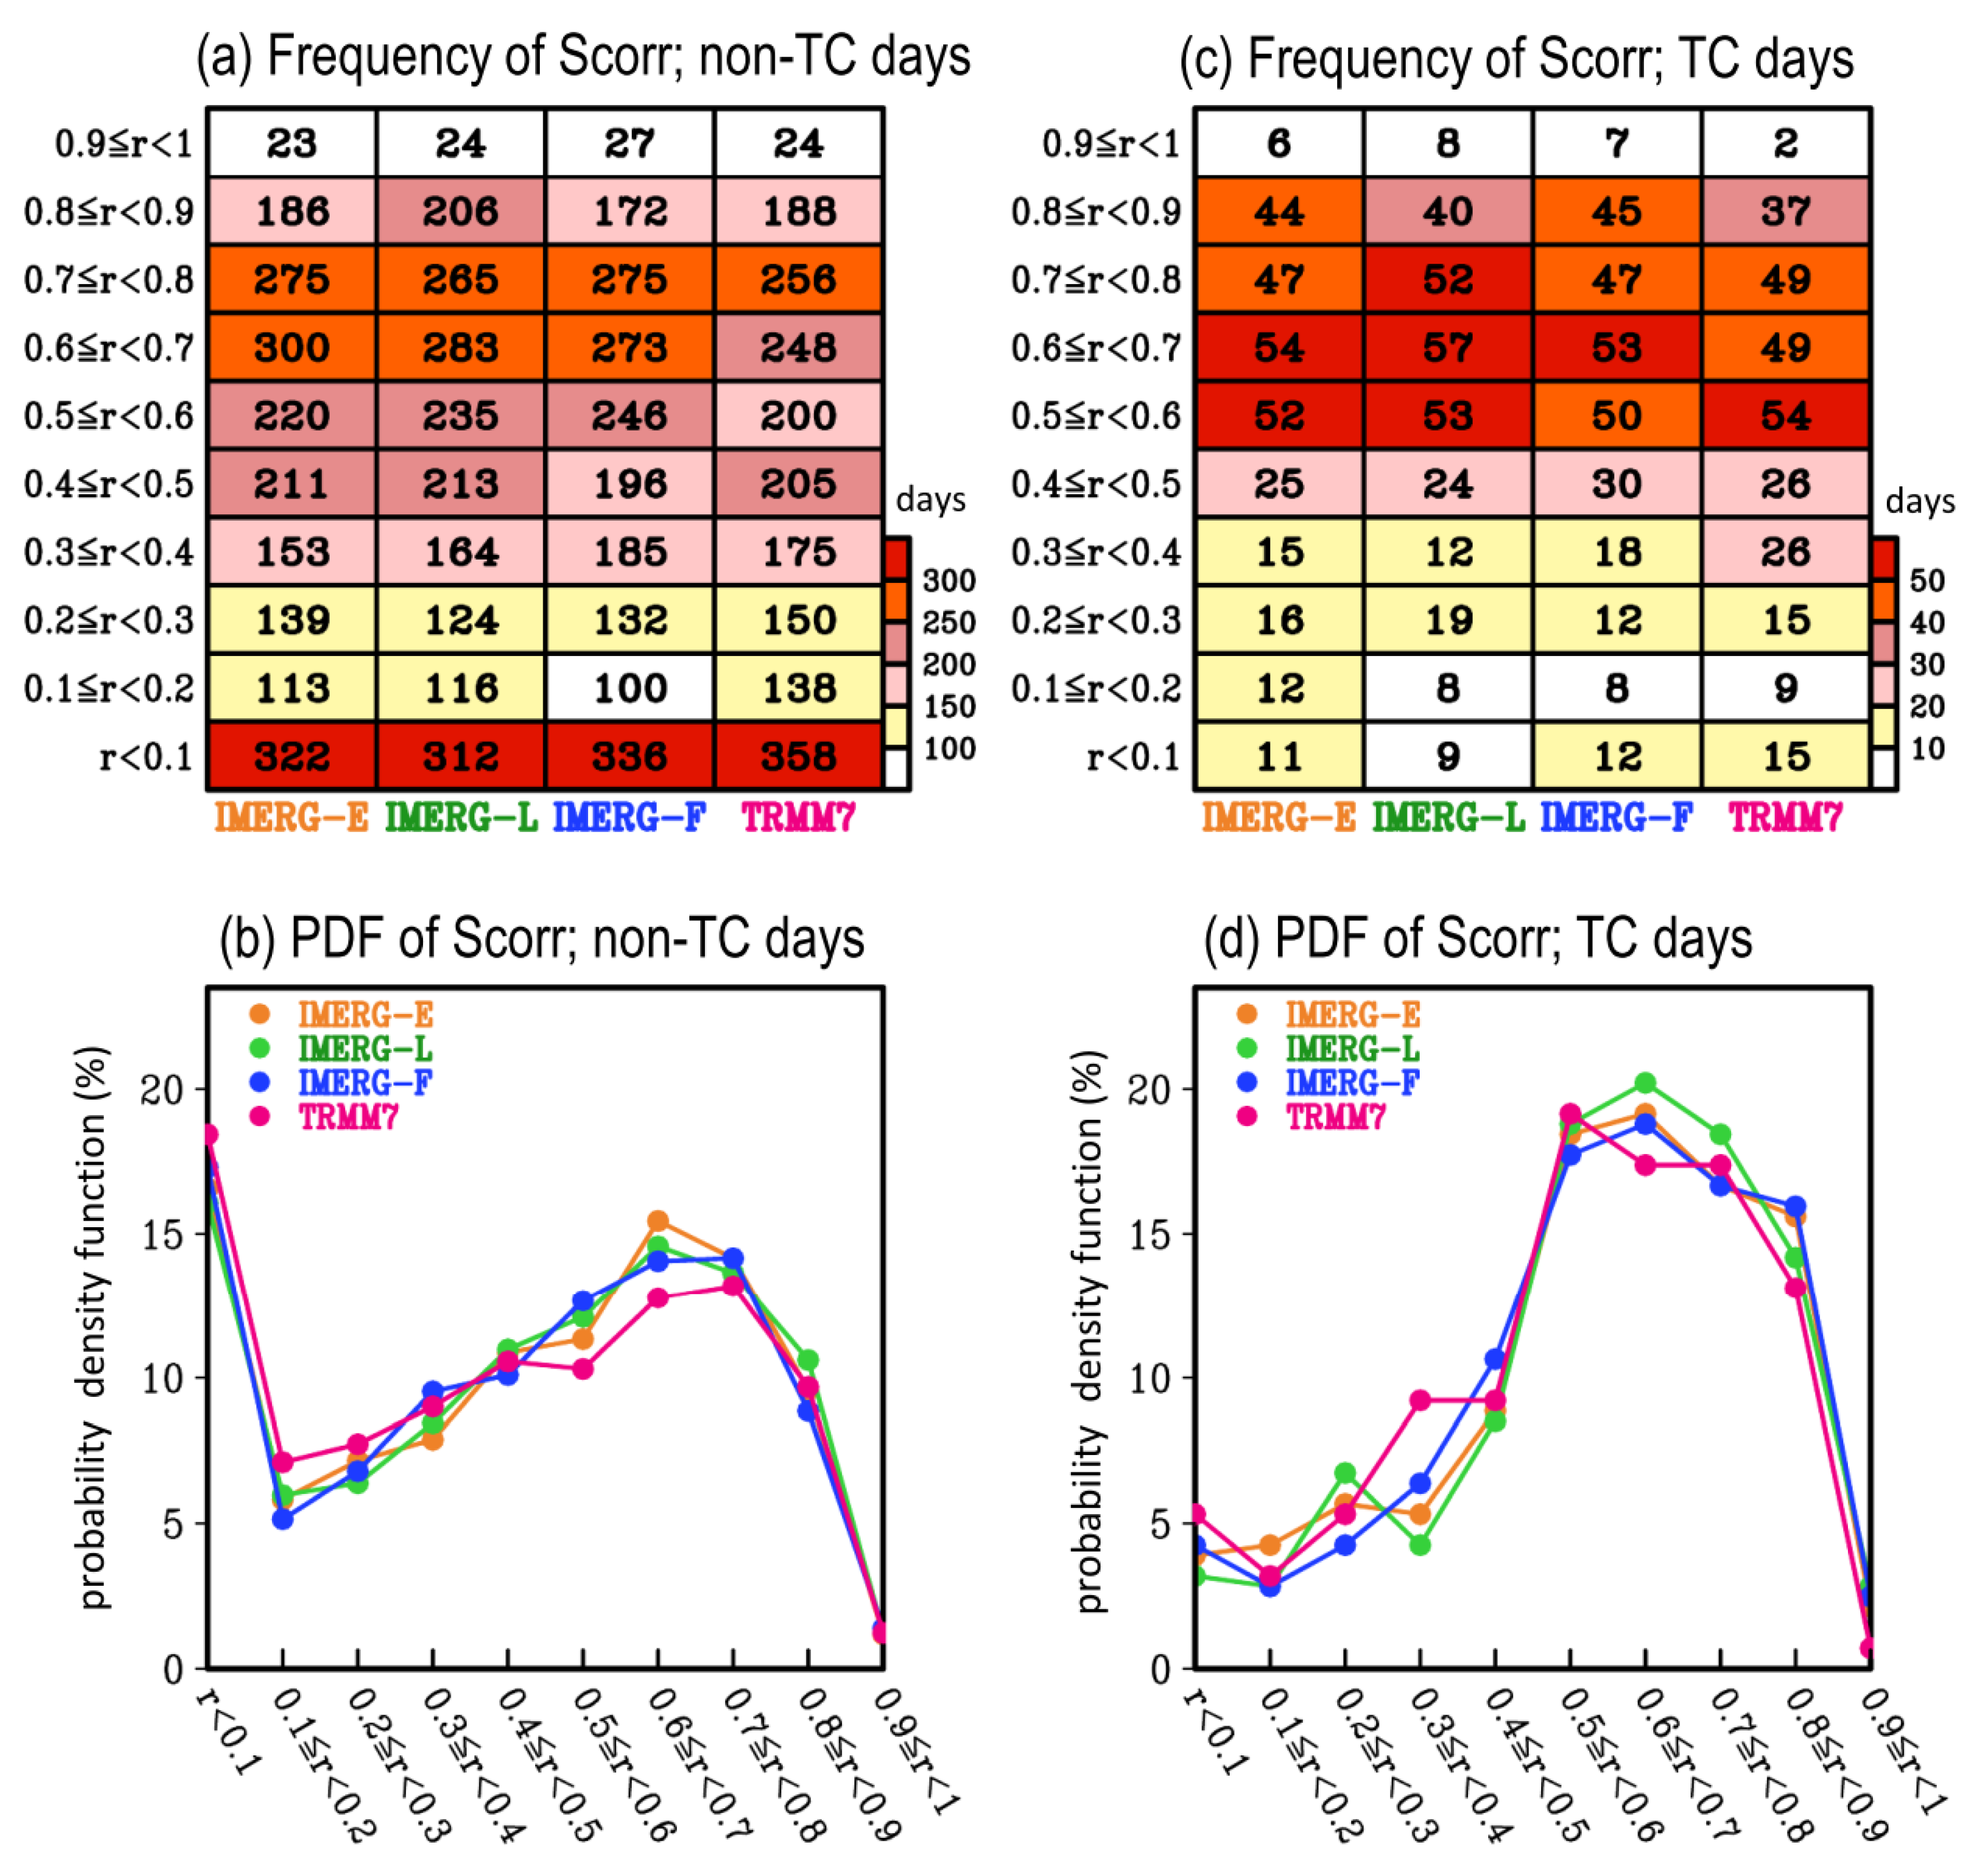
To assess the ability of SPPs to illustrate the spatial distribution of daily rainfall over Taiwan, we calculated the values of Scorr between CWB and selected SPPs for each of the non-TC and TC days. The Scorr-related occurrence frequency is shown in Figure 4a (non-TC) and Figure 4c (TC) with the probability density function given in Figure 4b (non-TC) and Figure 4d (TC). As noted in Figure 4a,b, the non-TC days have the top three Scorr occurrence frequencies with values of <0.1, (0.6–0.7), and (0.7–0.8). In contrast, Figure 4c,d show that the TC days have the top three Scorr occurrence frequencies at (0.5–0.6), (0.6–0.7), and (0.7–0.8). All SPPs appear to perform better in representing the Scorr for TC days than for non-TC days. Indeed, by accumulating the percentage with Scorr values ≥ 0.5 in Figure 4b,d, we note from Table 4 that about 67.7% to 74.5% of TC days have Scorr values ≥ 0.5, whereas only about 47.2% to 52.2% of non-TC days have Scorr values ≥ 0.5. This implies that, overall, all SPPs are more capable of illustrating the spatial distribution of daily rainfall for TC days than for non-TC days. This is consistent with the results shown in Figure 2e,f. Figure 4 and Table 4 also demonstrate that all IMERG products showed increases within 3.9–6.8% in the accumulated percentage of Scorr ≥ 0.5 for non-TC days as well as TC days, relative to TRMM7. Among the IMERG products, IMERG-L has the best Scorr performance, and IMERG-F has the poorest, although the difference among IMERG products shown in Table 4 is only <2.9% and <1.1% for TC and non-TC days, respectively. The possible reasons why IMERG NRT products are better than IMERG-F in terms of Scorr values will be discussed in Section 4.
It is noted that the results shown in Figure 3 and Figure 4 do not provide information on the ability of SPPs to capture the rainfall occurrence frequency at different intensity thresholds. This information is important for constructing Table 1, which provides the necessary elements for calculating POD, CSI, and FAR. Therefore, we examined the ability of SPPs to capture the occurrence frequency of non-TC and TC rainfall at various intensity thresholds (Figure 5). In total, 761,264 grids counted from 1942 non-TC days, and 110,544 grids from 282 TC days were used to construct Figure 5a,b. The method for the calculation of the number of grids is explained in the caption of Figure 5.
Overall, as shown in Figure 5a,b, IMERG-F (TRMM7) performs better (poor) than other SPPs for capturing the occurrence frequency of rainfall events at most rainfall thresholds; this finding is true for both non-TC days and TC-days. To better compare the difference among SPPs and the difference between non-TC and TC days, we further utilized the information provided in Figure 5a,b to calculate the related probability density function for five different ranges of rainfall intensity: 0–0.1 mm⋅d−1 as non-rainy, 0.1–5 mm⋅d−1 as light rainfall, 5–20 mm⋅d−1 as moderate rainfall, 20–80 mm⋅d−1 as heavy rainfall, and >80 mm mm⋅d−1 as extreme rainfall. The selection of criteria for non-rainy to heavy rainfall followed the method of [33], while the definition of extreme rainfall was defined according to [42].
As shown in Figure 5c,d, all SPPs overestimate the non-rainy percentage, and the related bias (i.e., the difference between CWB and SPPs) is much greater in Figure 5c than in Figure 5d. For light rainfall, all SPPs tend to underestimate the percentage of its occurrence frequency, and the related bias is also greater in Figure 5c than in Figure 5d. Among SPPs, IMERG products perform better than TRMM7 in capturing the non-rainy and light rainfall occurrence frequencies, not only for non-TC days (Figure 5c) but also for TC days (Figure 5d). Other features that were observed during the comparison between Figure 5c,d are as follows: (1) the capabilities of all SPPs in depicting the percentage of moderate to extreme rainfall for non-TC days are similar; (2) overall, TRMM7 has poor performance than all IMERG products in depicting the percentage of heavy to extreme rainfall for TC days; (3) IMERG-F is better than others for extreme TC rainfall, while IMERG-L is better for light to heavy TC rainfall. Using all the rainy grids identified in Figure 5, we calculated POD, CSI, and FAR based on Equations (4)–(6) to evaluate the capabilities of SPPs for quantitative rainfall estimation at different thresholds (Figure 6).
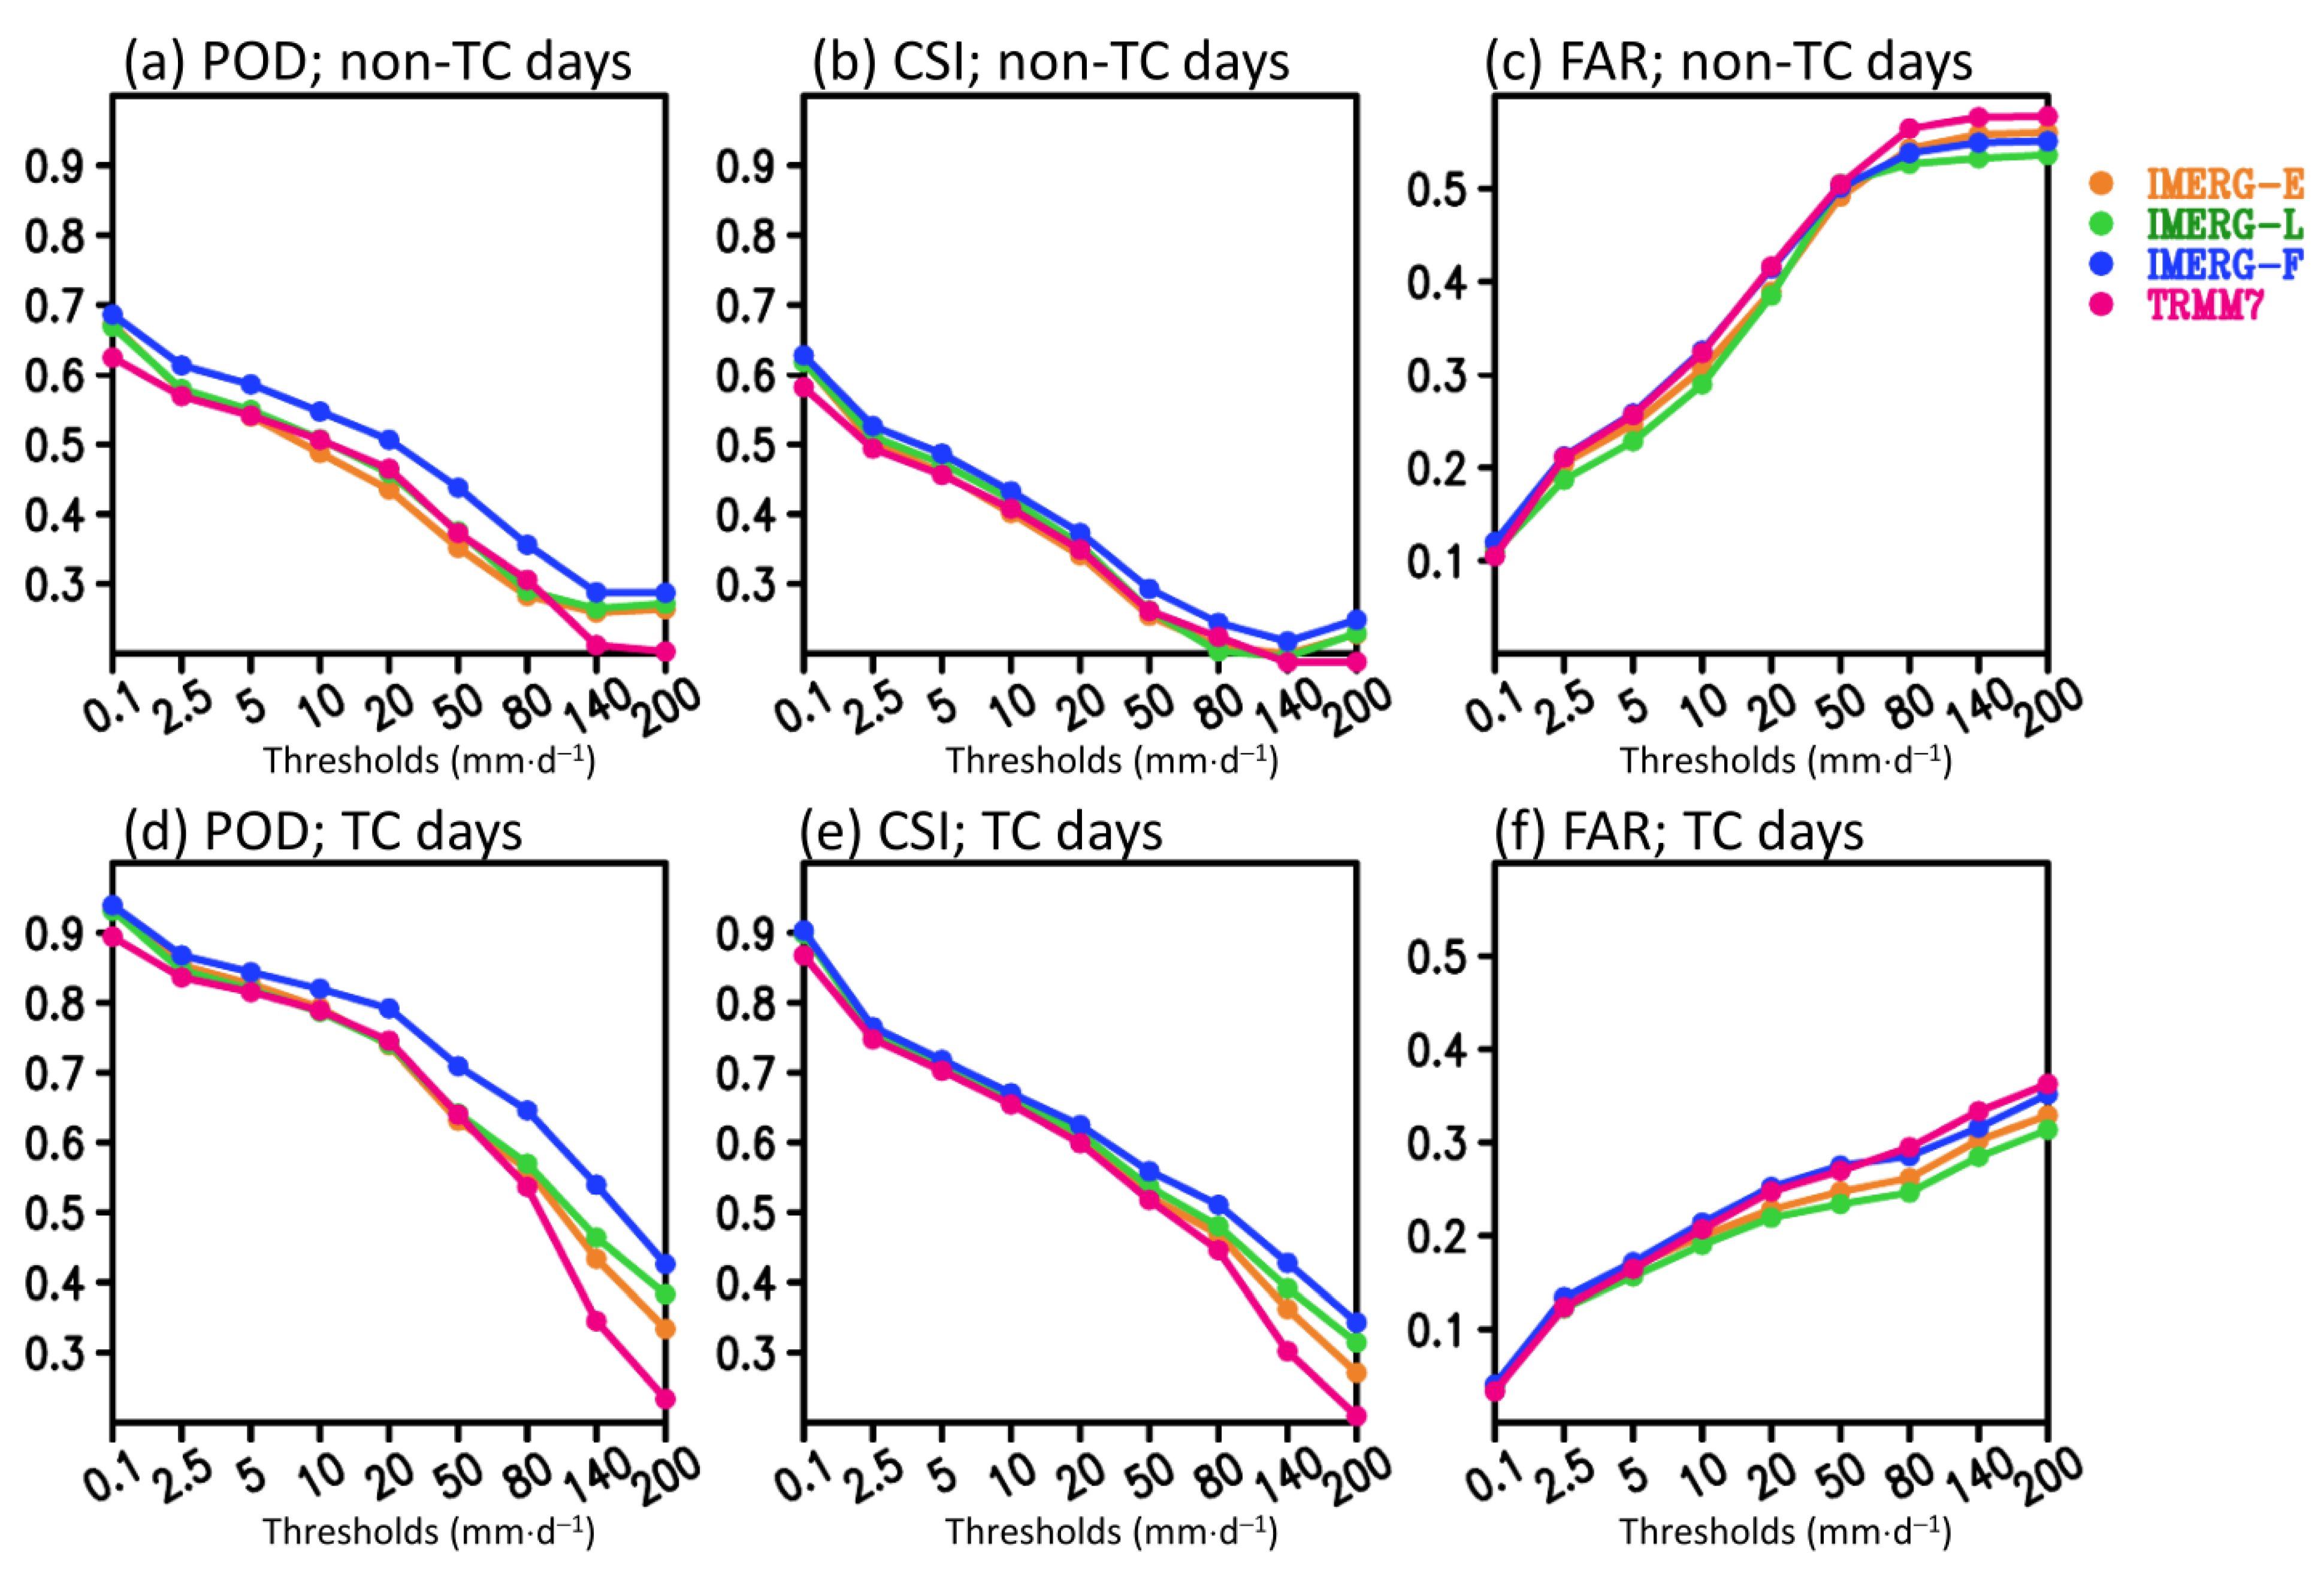
It is known that the higher the POD value, the higher the CSI value, and the lower the FAR value, the better the performance in quantitative rainfall estimation [43]. As shown in Figure 6, IMERG-F has the highest POD and CSI values among other SPPs at most rainfall thresholds; this is not only the case for non-TC days (Figure 6a,b) but also for TC days (Figure 6d,e). Conversely, the value of FAR in IMERG-L is the lowest among SPPs at most rainfall thresholds; this is also true for both non-TC (Figure 6c) and TC days (Figure 6f). Relative to IMERG-E and TRMM7, IMERG-L also had higher POD and CSI values for TC days at rainfall thresholds > 80 mm⋅d−1, suggesting that its performance in quantitative estimation for extreme rainfall on TC days is better than IMERG-E and TRMM7. However, for non-TC days, IMERG-L has POD and CSI values closer to IMERG-E and TRMM7 at most rainfall thresholds.
It is worthy of note that TRMM7 has a poor performance than all IMERG products in terms of illustrating POD, CSI, and FAR for TC days, especially at rainfall thresholds > 80 mm⋅d−1 (Figure 6d–f). This suggests that, relative to TRMM7, IMERG products can provide more accurate rainfall estimations for studying and monitoring TC rainfall in Taiwan. Furthermore, it can be inferred from Figure 6d–f that areas with more intense rainfall would likely have larger errors in quantitative rainfall estimation for TC days. Indeed, by calculating the point-to-point RMSE between CWB and SPPs for TC days during the 2000–2018 JASO (Figure 7b), we note that all SPPs tend to have more bias over southern mountainous regions and northeastern Taiwan—areas of more intense rainfall—as demonstrated in the CWB of Figure 2c. For the non-TC days, we noted that there are also two maximum RMSE centers (Figure 7a), the locations of which are consistent with the two maximum centers revealed in the CWB (Figure 2b). Overall, relative to Figure 7a which shows no significant difference among SPPs, Figure 7b clearly demonstrates that all IMERG products outperform TRMM7 in the quantitative rainfall estimation of TC days. This is consistent with the results shown in Figure 3, Figure 4, Figure 5 and Figure 6.

3.3. Interannual Variation

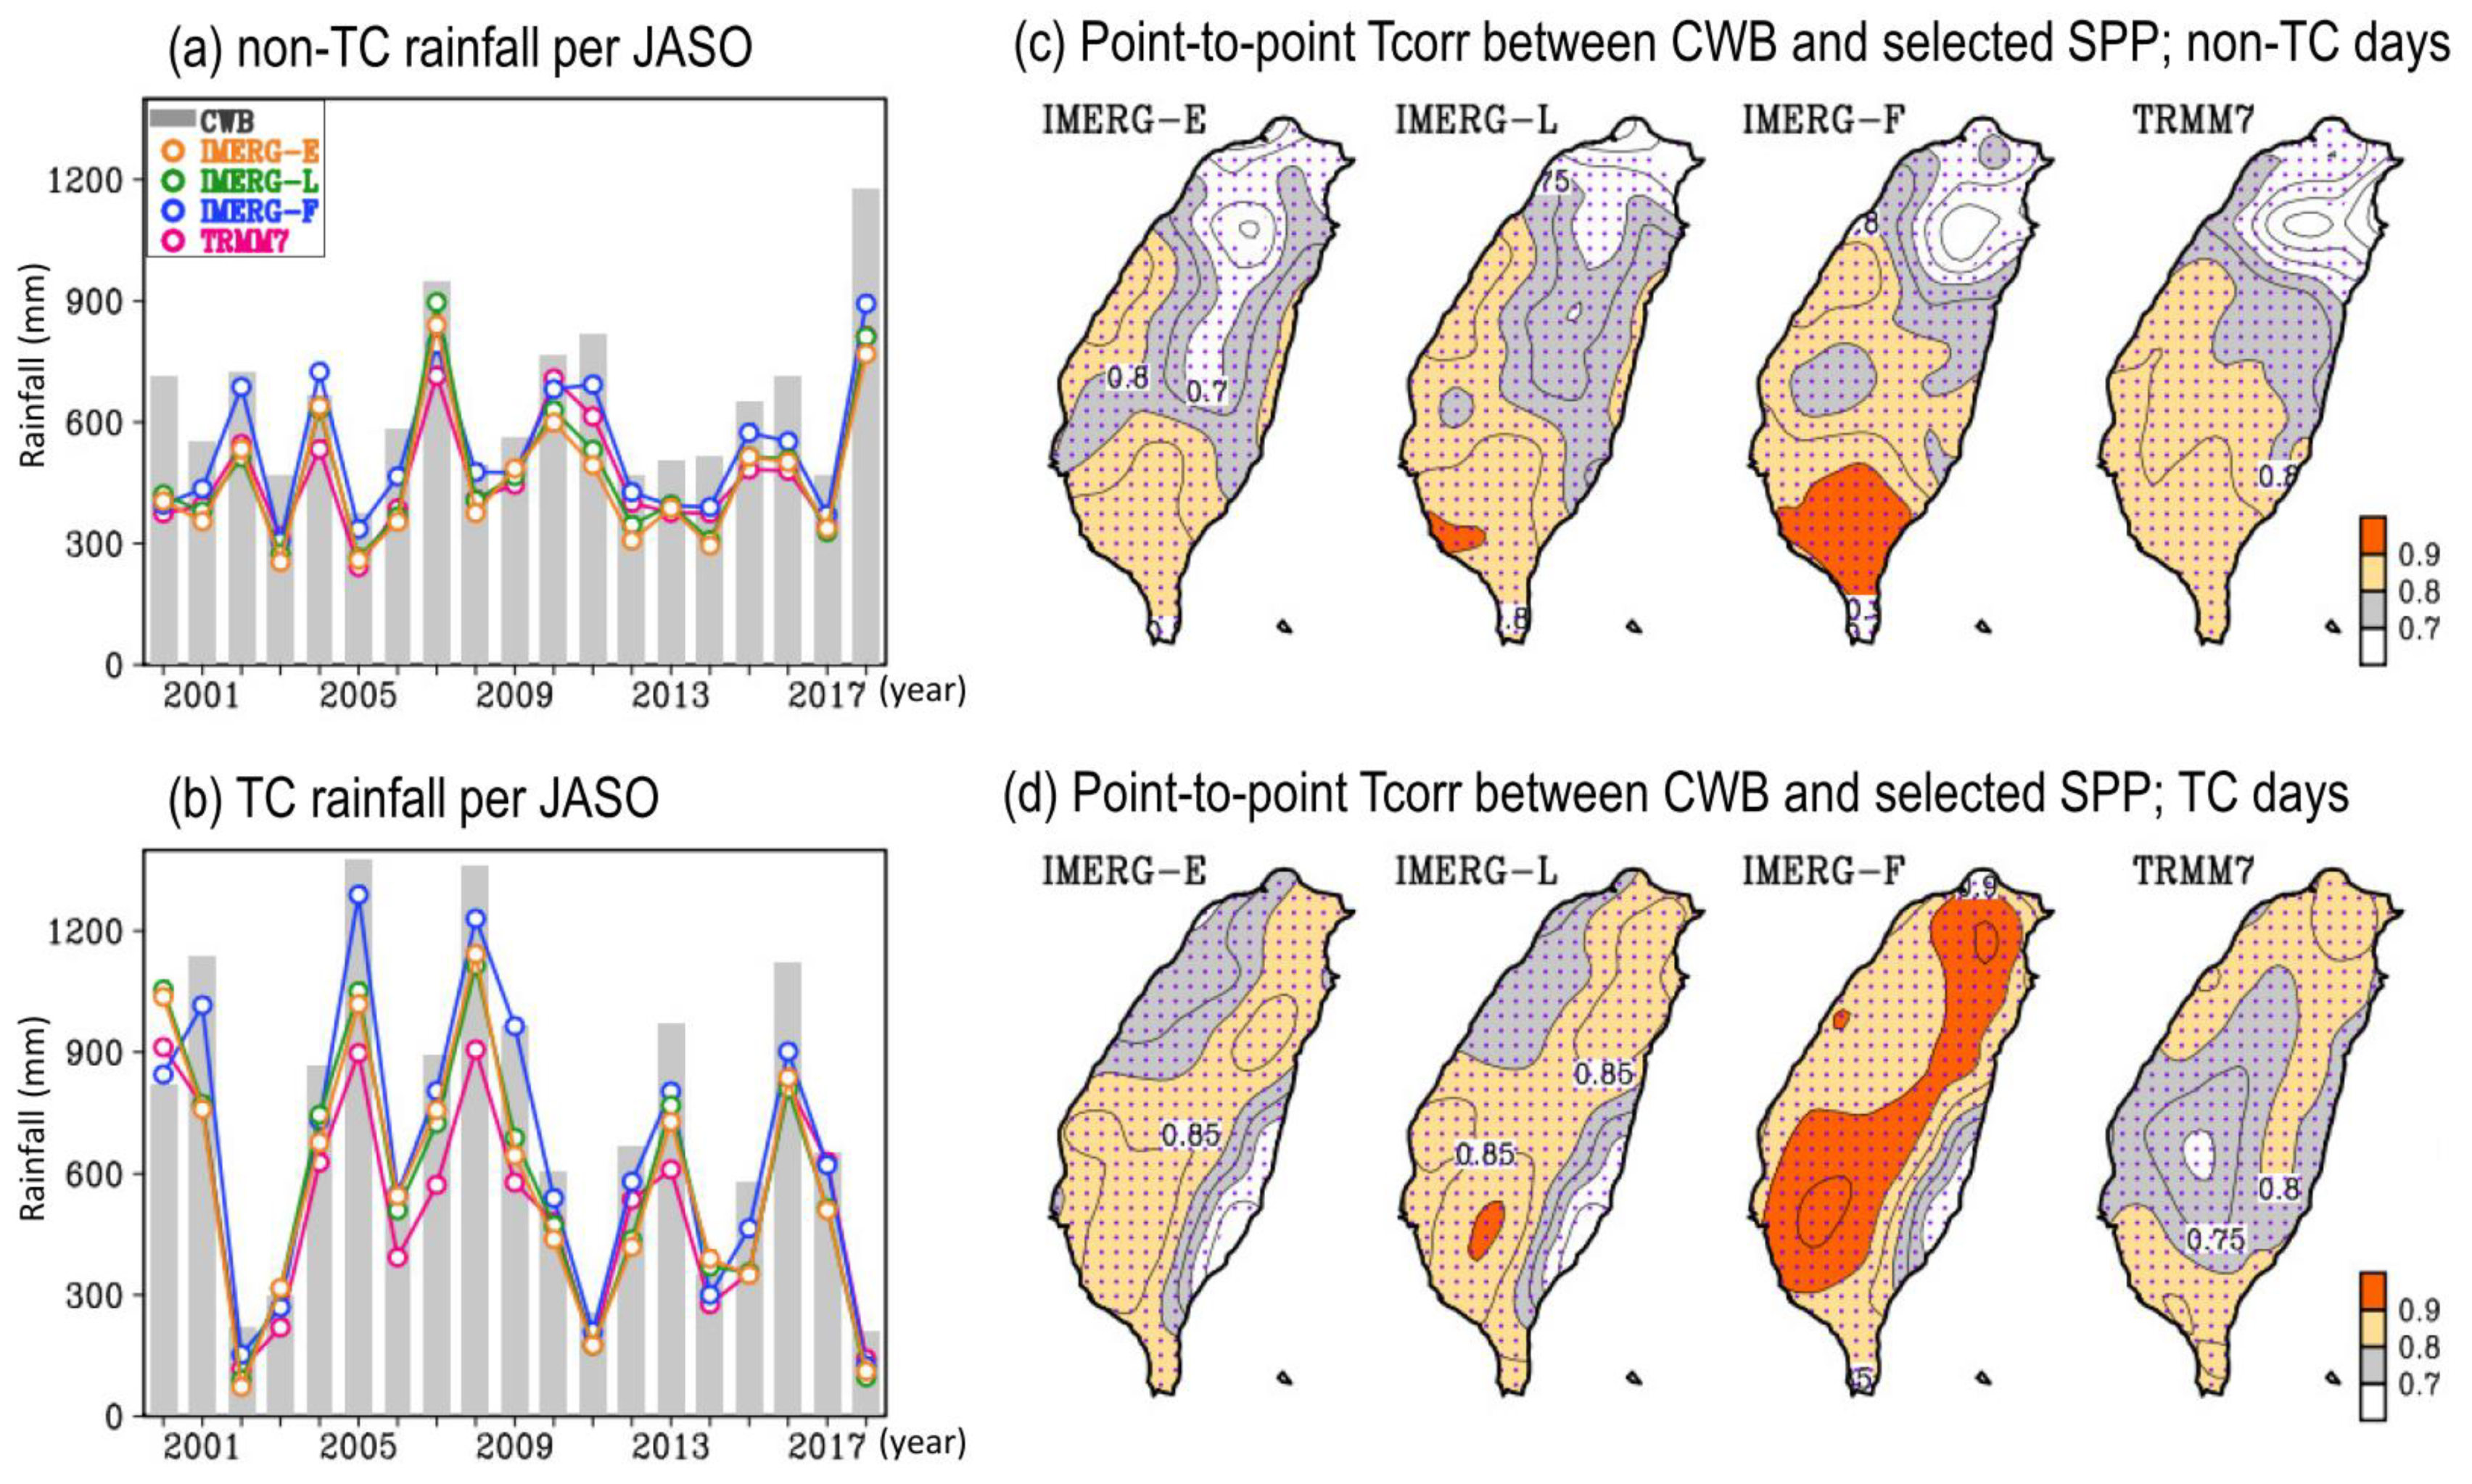
In addition to the seasonal mean and daily variation, the interannual variation of TC rainfall in Taiwan is also an issue that has attracted research attention [2,9,10]. Here, we examined the ability of SPPs to depict the temporal evolution of interannual variations in non-TC (Figure 8a) and TC rainfall (Figure 8b), area-averaged in Taiwan during the period 2000–2018 JASO. By focusing on the CWB in Figure 8a,b, it is noted that TC rainfall has a greater interannual variability than non-TC rainfall; this is consistent with the results of previous studies [10]. Despite the bias in underestimating the rainfall intensity, all SPPs seem to be able to capture the phase evolution of the interannual variation of non-TC and TC rainfall, similar to those estimated by the CWB. To clarify this hypothesis, we further calculated the related Tcorr between the CWB and selected SPPs using the time series in Figure 8a,b, and the results are given in Table 5.
As shown in Table 5, all SPPs had a Tcorr of ≥0.88 (passing a 99% significance t-test), confirming that all SPPs are highly capable of capturing the phase evolution for the interannual variation in rainfall for both non-TC and TC days. Spatially, the point-to-point Tcorr shown in Figure 8c suggests that all SPPs tend to better illustrate the interannual variation of non-TC rainfall over southwestern Taiwan. In the case of TC rainfall, all SPPs tend to better illustrate its interannual variation not only over southwestern Taiwan but also in northeastern Taiwan. The differences shown in Figure 8c,d are consistent with those in Figure 2c,d, which show that all SPPs tend to capture the northeastern maximum rainfall center better for TC days than for non-TC days.
It is also noted from Figure 8 that IMERG-F is much better than the other SPPs at illustrating the temporal evolution of TC rainfall and slightly better for non-TC rainfall on the interannual timescale. Consistent with this result, we note from Table 5 that IMERG-F also has a much smaller RRMSE value than the others when comparing the time series of TC rainfall (Figure 8b) and a slightly smaller value for non-TC rainfall (Figure 8a). After IMERG-F, IMERG-L ranks second in Table 5, with higher Tcorr values and smaller RRMSE values than those of IMERG-E and TRMM7. This is true for both TC and non-TC rainfall.

4. Discussions

It can be inferred from Section 3 that the overall performance of all IMERG products is better than that of TRMM7 in depicting the typhoon season rainfall over Taiwan. In particular, non-rainy to light rainfall detection is more accurate in the IMERG products than in TRMM7 (Figure 5c,d). Possible reasons for this include: (1) the spatio-temporal resolution of all IMERG products is finer than that of TRMM7 and can, thus, better represent short-lived and finer-scale rainfall events, and (2) the extension of the GPM sensors (e.g., the dual-frequency precipitation radar) used in IMERG is more sensitive to light rain, increasing the ability of IMERG to detect precipitation [44,45,46]. Furthermore, as demonstrated in Section 3, IMERG-F has superior performance among all SPPs in most of the assessed features, but its spatial rainfall distribution (i.e., Scorr in Figure 2 and Figure 4) is inferior to that of IMERG-E and IMERG-L. Possible reasons for this are discussed below.
According to [28], IMERG-F is adjusted to monthly GPCC data, whereas IMERG-L/IMERG-E is not; it is, therefore, assumed that the process of adjusting monthly GPCC data might increase the bias of IMERG-F in Scorr performance. To assess this hypothesis, we followed the methods in Figure 2a–c to construct Figure 9a–c, using GPCC. In addition, we calculated the Scorr between GPCC and IMERG products for the spatial distribution of seasonal mean rainfall for the total, non-TC, and TC days (Table 6).
As presented in Table 6, IMERG-F has the highest Scorr values among the IMERG products, confirming that its spatial rainfall distribution over Taiwan is closest to GPCC during the typhoon season. This explains why the Scorr shown in Figure 2d–f for the comparison between IMERG-F (IMERG-E/IMERG-L) and CWB is more (less) close to those shown in Figure 9d for the comparison between GPCC and CWB. It can also be noted from Figure 9a–c that only one maximum rainfall center is suggested in GPCC; this is in contrast to the two maximum centers demonstrated in the CWB (Figure 2a–c). It is likely that, compared to the number of rain gauges used in CWB (>400 gauges; [33]), the number used in the GPCC over Taiwan (<30 gauges; [36]) is too small to represent the spatial details of rainfall features. Therefore, by adjusting the monthly GPCC to produce IMERG-F, the Scorr performance in Figure 2 and Figure 4 for IMERG-F is poorer than those for IMERG-E and IMERG-L. In contrast, because GPCC has better RB performance than IMERG-E and IMERG-L (Figure 9d and Figure 2d–f), IMERG-F also has better RB performance than IMERG-E and IMERG-L (Figure 2d–f). With regard to the performance of IMERG-E and IMERG-L, we note from Section 3 that IMERG-L is slightly better than IMERG-E for both quantitatively and qualitatively representing the spatio-temporal variations of all examined rainfall over Taiwan. This is consistent with previous studies [47,48,49] that examined rainfall over other regions, suggesting that the use of both forward and backward propagation methods in IMERG-L may help reduce the errors in rainfall estimation as compared to IMERG-E, which only applies the forward propagation method.
Finally, we note from Section 3 that all SPPs tend to perform better for TC rainfall than non-TC rainfall. A similar feature has also been noted in previous studies [50,51], where it was found that satellite-based retrievals tend to capture more intense rain events better than less intense events. This may be due to the higher signal to noise ratio of the passive microwave-based precipitation sensors used in IMERG [28] and TRMM7 [34], which are favorable for convective precipitation measurements. Furthermore, the differences in performance between TC and non-TC rain may be attributed to the greater persistence and uniformity of the rain areas of the TC cases compared to the more transient nature of isolated convection in the non-TC cases that may not be captured by satellite observations with lower temporal resolution than rain gauges.

5. Conclusions

In this study, the performance of IMERG-E, IMERG-L, and IMERG-F in depicting the typhoon season rainfall over Taiwan during the period 2000–2018 JASO was evaluated, and the performance capabilities of these IMERG Level-3 products with the performance capability of TRMM7 were compared. Analyses focus on clarifying two issues: (1) whether using IMERG Level-3, instead of TRMM7, adds value to the study of TC rainfall features and (2) the identification of the differences between the abilities of SPPs to depict TC and non-TC rainfall features. The evaluations used more than 400 rain gauges over Taiwan (i.e., the CWB) as a reference base for comparisons, and examinations included multiple timescale features, including seasonal mean, daily variation, and interannual variation. The performance capabilities of SPPs were quantified based on the statistical analysis of RB, RMSE, RRMSE, PDF, POD, CSI, FAR, and the spatio-temporal Corr formulated in Section 2.
Our results show that all IMERG products tend to perform better than TRMM7 for most of the examined rainfall features over Taiwan. The difference in the performance of IMERG products and TRMM7 is more evident for TC rainfall than for non-TC rainfall. Among IMERG products, IMERG-F performs better than IMERG-L, which is slightly better than IMERG-E for most of the feature examined (other than Scorr) for both TC and non-TC rainfall. The difference observed in the performance of IMERG-F and IMERG-E/IMER-L is attributed to IMERG-F being adjusted to the monthly GPCC data, whereas IMERG-E/IMERG-L is not. It was found that adjusting the monthly GPCC, reduced the errors in quantitative rainfall estimation for IMERG-F, but increased its errors in illustrating the spatial rainfall distribution over Taiwan. With regard to the difference between IMERG-E and IMERG-L, we suggest that the use of both forward and backward propagation methods in IMERG-L may help reduce the errors in rainfall estimation as compared to IMERG-E, which only applies the forward propagation method. Our discussions also explain that IMERG products outperform TRMM7 in depicting typhoon season rainfall over Taiwan might be attributed to the finer spatio-temporal resolution and the extension of the GPM sensors used in IMERG products. These findings highlight the advantages and disadvantages of using IMERG Level-3 products for studying or monitoring typhoon season rainfall in Taiwan.
Finally, as all IMERG-Level 3 products have problem in accurate quantitative rainfall estimates (i.e., underestimating the rainfall) over Taiwan, we suggest that an improvement in the precipitation retrieval algorithm should be considered to improve the current IMERG validation scheme.

Author Contributions

Conceptualization, W.-R.H.; Data curation, W.-R.H., P.-Y.L., Y.-H.C., and C.-A.L.; Investigation, W.-R.H.; Software, P.-Y.L. and Y.-H.C.; Writing—original draft, W.-R.H.; Writing—review and editing, W.-R.H., P.-Y.L., Y.-H.C., and C.-A.L. All authors have read and agreed to the published version of the manuscript.

Funding

This work was supported by the Ministry of Science and Technology of Taiwan under MOST 106-2628-M-003-001-MY4, MOST 108-2625-M-003-004 and MOST 109-2625-M-003-004.

Institutional Review Board Statement

Not applicable

Informed Consent Statement

Not applicable

Data Availability Statement

Not applicable

Acknowledgments

We thank the provider of IMERG, TRMM, and CWB data.

Conflicts of Interest

The authors declare no conflict of interest.

References

  1. Chen, C.; Chen, Y.; Liu, C.; Lin, P.; Chen, W. Statistics of Heavy Rainfall Occurrences in Taiwan. Weather Forecast. 2007, 22, 981–1002. [Google Scholar] [CrossRef]
  2. Chen, J.; Li, T.; Shih, C. Tropical Cyclone–and Monsoon-Induced Rainfall Variability in Taiwan. J. Clim. 2010, 23, 4107–4120. [Google Scholar] [CrossRef]
  3. Wu, C.; Kuo, Y. Typhoons Affecting Taiwan: Current Understanding and Future Challenges. Bull. Am. Meteorol. Soc. 1999, 80, 67–80. [Google Scholar] [CrossRef]
  4. Hung, C.W.; Shih, M.F.; Lin, T.Y. The Climatological Analysis of Typhoon Tracks, Steering Flow, and the Pacific Subtropical High in the Vicinity of Taiwan and the Western North Pacific. Atmosphere 2020, 11, 543. [Google Scholar] [CrossRef]
  5. Wang, S.Y.; Chen, T.C. Measuring East Asian Summer Monsoon Rainfall Contributions by Different Weather Systems over Taiwan. J. Appl. Meteorol. Climatol. 2008, 47, 2068–2080. [Google Scholar] [CrossRef] [Green Version]
  6. Chen, T.C.; Huang, W.R.; Yen, M.C. Interannual variation of the late spring–early summer monsoon rainfall in the northern part of the South China Sea. J. Clim. 2011, 24, 4295–4313. [Google Scholar] [CrossRef]
  7. Tsou, C.Y.; Feng, Z.Y.; Chigira, M. Catastrophic landslide induced by typhoon Morakot, Shiaolin, Taiwan. Geomorphology 2011, 127, 166–178. [Google Scholar] [CrossRef] [Green Version]
  8. Xie, B.; Zhang, F. Impacts of typhoon track and island topography on the heavy rainfalls in Taiwan associated with Morakot (2009). Mon. Weather Rev. 2012, 140, 3379–3394. [Google Scholar] [CrossRef]
  9. Su, S.H.; Kuo, H.C.; Hsu, L.H.; Yang, Y.T. Temporal and spatial characteristics of typhoon extreme rainfall in Taiwan. J. Meteorol. Soc. Jpn. 2012, 90, 721–736. [Google Scholar] [CrossRef] [Green Version]
  10. Tu, J.Y.; Chou, C. Changes in precipitation frequency and intensity in the vicinity of Taiwan: Typhoon versus non-typhoon events. Environ. Res. Lett. 2013, 8, 014023. [Google Scholar] [CrossRef]
  11. Wu, C.; Yen, T.; Huang, Y.; Yu, C.; Chen, S. Statistical Characteristic of Heavy Rainfall Associated with Typhoons near Taiwan Based on High-Density Automatic Rain Gauge Data. Bull. Am. Meteorol. Soc. 2016, 97, 1363–1375. [Google Scholar] [CrossRef]
  12. Cheung, K.K.W.; Huang, L.R.; Lee, C.S. Characteristics of rainfall during tropical cyclone periods in Taiwan. Nat. Hazards Earth Syst. Sci. 2008, 8, 1463–1474. [Google Scholar] [CrossRef]
  13. Chang, P.; Zhang, J.; Tang, Y.; Tang, L.; Lin, P.; Langston, C.; Kaney, B.; Chen, C.; Howard, K. An Operational Multi-Radar Multi-Sensor QPE System in Taiwan. Bull. Am. Meteorol. Soc. 2020, 1–56. [Google Scholar] [CrossRef]
  14. Chen, S.; Hong, Y.; Cao, Q.; Kirstetter, P.E.; Gourley, J.J.; Qi, Y.; Zhang, J.; Howard, K.; Hu, J.; Wang, J. Performance evaluation of radar and satellite rainfalls for Typhoon Morakot over Taiwan: Are remote-sensing products ready for gauge denial scenario of extreme events? J. Hydrometeorol. 2013, 506, 4–13. [Google Scholar] [CrossRef]
  15. Wang, Y.; Zhang, J.; Ryzhkov, A.V.; Tang, L. C-Band Polarimetric Radar QPE Based on Specific Differential Propagation Phase for Extreme Typhoon Rainfall. J. Atmos. Ocean. Technol. 2013, 30, 1354–1370. [Google Scholar] [CrossRef]
  16. Wang, Y.; Zhang, J.; Chang, P.L.; Langston, C.; Kaney, B.; Tang, L. Operational C-Band Dual-Polarization Radar QPE for the Subtropical Complex Terrain of Taiwan. Adv. Meteorol. 2016, 4294271. [Google Scholar] [CrossRef]
  17. Zhang, J.; Howard, K.; Chang, P.L.; Chiu, P.T.K.; Chen, C.R.; Langston, C.; Xia, W.; Kaney, B.; Lin, P.F. High-Resolution QPE System for Taiwan. In Data Assimilation for Atmospheric, Oceanic and Hydrologic Applications, 1st ed.; Park, S.K., Xu, L., Eds.; Springer: Berlin/Heidelberg, Germany, 2009; pp. 147–162. [Google Scholar]
  18. Li, X.; Chen, Y.; Wang, H.; Zhang, Y. Assessment of GPM IMERG and radar quantitative precipitation estimation (QPE) products using dense rain gauge observations in the Guangdong-Hong Kong-Macao Greater Bay Area, China. Atmos. Res. 2020, 236, 104834. [Google Scholar] [CrossRef]
  19. Yu, Z.; Yu, H.; Chen, P.; Qian, C.; Yue, C. Verification of Tropical Cyclone–Related Satellite Precipitation Estimates in Mainland China. J. Appl. Meteorol. Climatol. 2009, 48, 2227–2241. [Google Scholar] [CrossRef] [Green Version]
  20. Chen, Y.; Ebert, E.E.; Walsh, K.J.E.; Davidson, N.E. Evaluation of TRMM 3B42 precipitation estimates of tropical cyclone rainfall using PACRAIN data. J. Geophys. Res. Atmos. 2013, 118, 2184–2196. [Google Scholar] [CrossRef]
  21. Chen, F.; Huang, H. Comparisons of Gauge, TMPA and IMERG Products for Monsoon and Tropical Cyclone Precipitation in Southern China. Pure Appl. Geophys. 2018, 176, 1767–1784. [Google Scholar] [CrossRef]
  22. Omranian, E.; Sharif, H.O.; Tavakoly, A.A. How Well Can Global Precipitation Measurement (GPM) Capture Hurricanes? Case Study: Hurricane Harvey. Remote Sens. 2018, 10, 1150. [Google Scholar] [CrossRef] [Green Version]
  23. Xu, W. Precipitation and Convective Characteristics of Summer Deep Convection over East Asia Observed by TRMM. Mon. Weather Rev. 2013, 141, 1577–1592. [Google Scholar] [CrossRef]
  24. Hsu, H.H.; Zhou, T.; Matsumoto, J. East Asian, Indochina and Western North Pacific Summer Monsoon—An update. Asia-Pacific. J. Atmos. Sci. 2014, 50, 45–68. [Google Scholar]
  25. Fu, Y.F.; Pan, X.; Yang, Y.J.; Chen, F.J.; Liu, P. Climatological characteristics of summer precipitation over East Asia measured by TRMM PR: A review. J. Meteorol. Res. 2017, 31, 142–159. [Google Scholar] [CrossRef]
  26. Huang, W.R.; Wang, S.Y. Impact of land–sea breezes at different scales on the diurnal rainfall in Taiwan. Clim. Dyna. 2014, 43, 1951–1963. [Google Scholar] [CrossRef]
  27. Huffman, G.J.; Bolvin, D.T.; Braithwaite, D.; Hsu, K.; Joyce, R.; Xie, P.; Yoo, S.H. Algorithm Theoretical Basis Document (ATBD) Version 4.5: NASA Global Precipitation Measurement (GPM) Integrated Multi-Satellite Retrievals for GPM (IMERG); NASA/GSFC: Greenbelt, MD, USA, 2015. [Google Scholar]
  28. Huffman, G.J.; Bolvin, D.T.; Nelkin, E.J.; Stocker, E.F.; Tan, J. V06 IMERG Release Notes; NASA/GSFC: Greenbelt, MD, USA, 2019. [Google Scholar]
  29. Wang, R.; Chen, J.; Wang, X. Comparison of IMERG Level-3 and TMPA 3B42V7 in Estimating Typhoon-Related Heavy Rain. Water 2017, 9, 276. [Google Scholar] [CrossRef] [Green Version]
  30. Huang, W.R.; Chang, Y.H.; Liu, P.Y. Assessment of IMERG precipitation over Taiwan at multiple timescales. Atmos. Res. 2018, 214, 239–249. [Google Scholar] [CrossRef]
  31. Satgé, F.; Hussain, Y.; Bonnet, M.P.; Hussain, B.M.; Martinez-Carvajal, H.; Akhter, G.; Uagoda, R. Benefits of the Successive GPM Based Satellite Precipitation Estimates IMERG–V03, –V04, –V05 and GSMaP–V06,–V07 Over Diverse Geomorphic and Meteorological Regions of Pakistan. Remote Sens. 2018, 10, 1373. [Google Scholar] [CrossRef] [Green Version]
  32. Cui, W.; Dong, X.; Xi, B.; Feng, Z.; Fan, J. Can the GPM IMERG Final Product Accurately Represent MCSs’ Precipitation Characteristics over the Central and Eastern United States? J. Hydrometeorol. 2020, 21, 39–57. [Google Scholar] [CrossRef]
  33. Huang, W.R.; Liu, P.Y.; Chang, Y.H.; Liu, C.Y. Evaluation and Application of Satellite Precipitation Products in Studying the Summer Precipitation Variations over Taiwan. Remote Sens. 2020, 12, 347. [Google Scholar] [CrossRef] [Green Version]
  34. Huffman, G.J.; Bolvin, D.T.; Neklin, E.J.; Wolff, D.B.; Adler, R.F.; Gu, G.J.; Hong, Y.; Bowman, K.P.; Stocker, E.F. The TRMM Multisatellite Precipitation Analysis (TMPA): Quasi-global, multiyear, combined-sensor precipitation estimates at fine scales. J. Hydrometeorol. 2007, 8, 38–55. [Google Scholar] [CrossRef]
  35. Hersbach, H.; Bell, B.; Berrisford, P.; Hirahara, S.; Horányi, A.; Munoz-Sabater, J.; Nicolas, J.; Peubey, C.; Radu, R.; Schepers, D.; et al. The ERA5 Global Reanalysis. Quart. J. Roy. Met. Soc. 2020. [Google Scholar] [CrossRef]
  36. Schneider, U.; Finger, P.; Meyer-Christoffer, A.; Ziese, M.; Becker, A. Global Precipitation Analysis Products of the GPCC. Global Precipitation Climatology Centre (GPCC); Deutscher Wetterdienst: Offenbach, Germany, 2018; Available online: http://gpcc.dwd.de (accessed on 31 December 2020).
  37. Wilks, D.S. Statistical Methods in the Atmospheric Sciences, 1st ed.; Academic Press: Cambridge, MA, USA, 1995; p. 467. [Google Scholar]
  38. Yen, M.C.; Chen, T.C. Seasonal variation of the rainfall over Taiwan. Int. J. Climatol. 2000, 20, 803–809. [Google Scholar] [CrossRef]
  39. Chen, C.; Chen, Y. The Rainfall Characteristics of Taiwan. Mon. Weather Rev. 2003, 131, 1323–1341. [Google Scholar] [CrossRef]
  40. Huang, W.R.; Chang, Y.H.; Hsu, H.H.; Cheng, C.T.; Tu, C.Y. Dynamical Downscaling Simulation and Future Projection of Summer Rainfall in Taiwan: Contributions from Different Types of Rain Events. J. Geophys. Res. Atmos. 2016, 121, 13973–13988. [Google Scholar] [CrossRef]
  41. Huang, W.R.; Chan, C.L. Dynamical Downscaling Forecasts of Western North Pacific Tropical Cyclone Genesis and Landfall. Clim. Dyna. 2014, 42, 2227–2237. [Google Scholar] [CrossRef]
  42. Kusumastuti, C.; Weesakul, S. Extreme rainfall indices for tropical monsoon countries in Southeast Asia. Civ. Eng. Dimens. 2014, 16, 112–116. [Google Scholar]
  43. Ebert, E. Methods for verifying satellite precipitation estimates. In Measuring Precipitation from Space; Levizzani, V., Bauer, P., Turk, F.J., Eds.; Springer: Dordrecht, The Netherlands, 2007; Volume 28, pp. 345–356. [Google Scholar]
  44. Wei, G.; Lü, H.; Crow, W.T.; Zhu, Y.; Wang, J.; Su, J. Comprehensive Evaluation of GPM-IMERG, CMORPH, and TMPA Precipitation Products with Gauged Rainfall over Mainland China. Adv. Meteorol. 2018, 1–18. [Google Scholar] [CrossRef] [Green Version]
  45. Su, J.; Lü, H.; Zhu, Y.; Cui, Y.; Wang, X. Evaluating the hydrological utility of latest IMERG products over the Upper Huaihe River Basin, China. Atmos. Res. 2019, 225, 17–29. [Google Scholar] [CrossRef]
  46. Wu, Y.; Zhang, Z.; Huang, Y.; Jin, Q.; Chen, X.; Chang, J. Evaluation of the GPM IMERG v5 and TRMM 3B42 v7 Precipitation Products in the Yangtze River Basin, China. Water 2019, 11, 1459. [Google Scholar] [CrossRef] [Green Version]
  47. Foelsche, U.; Kirchengast, G.; Fuchsberger, J.; Tan, J.; Petersen, W.A. Evaluation of GPM IMERG Early, Late, and Final rainfall estimates using WegenerNet gauge data in southeastern Austria. Hydrol. Earth Syst. Sci. 2017, 21, 6559–6572. [Google Scholar]
  48. Taghizadeh, E.; Ahmadi-Givi, F. Evaluation of GPM precipitation products and mapping soil moisture using SMAP data in the northwest of Iran. Iran. J. Geophys. 2018, 12, 70–86. [Google Scholar]
  49. Tang, S.; Li, R.; He, J.; Wang, H.; Fan, X.; Yao, S. Comparative Evaluation of the GPM IMERG Early, Late, and Final Hourly Precipitation Products Using the CMPA Data over Sichuan Basin of China. Water 2020, 12, 554. [Google Scholar] [CrossRef] [Green Version]
  50. Tian, Y.D.; Peters-Lidard, C.D. A global map of uncertainties in satellite-based precipitation measurements. Geophys. Res. Lett. 2010, 37, L24407. [Google Scholar] [CrossRef]
  51. Tan, M.L.; Ibrahim, A.L.; Duan, Z.; Cracknell, A.P.; Chaplot, V. Evaluation of Six High-Resolution Satellite and Ground-Based Precipitation Products over Malaysia. Remote Sens. 2015, 7, 1504–1528. [Google Scholar] [CrossRef] [Green Version]
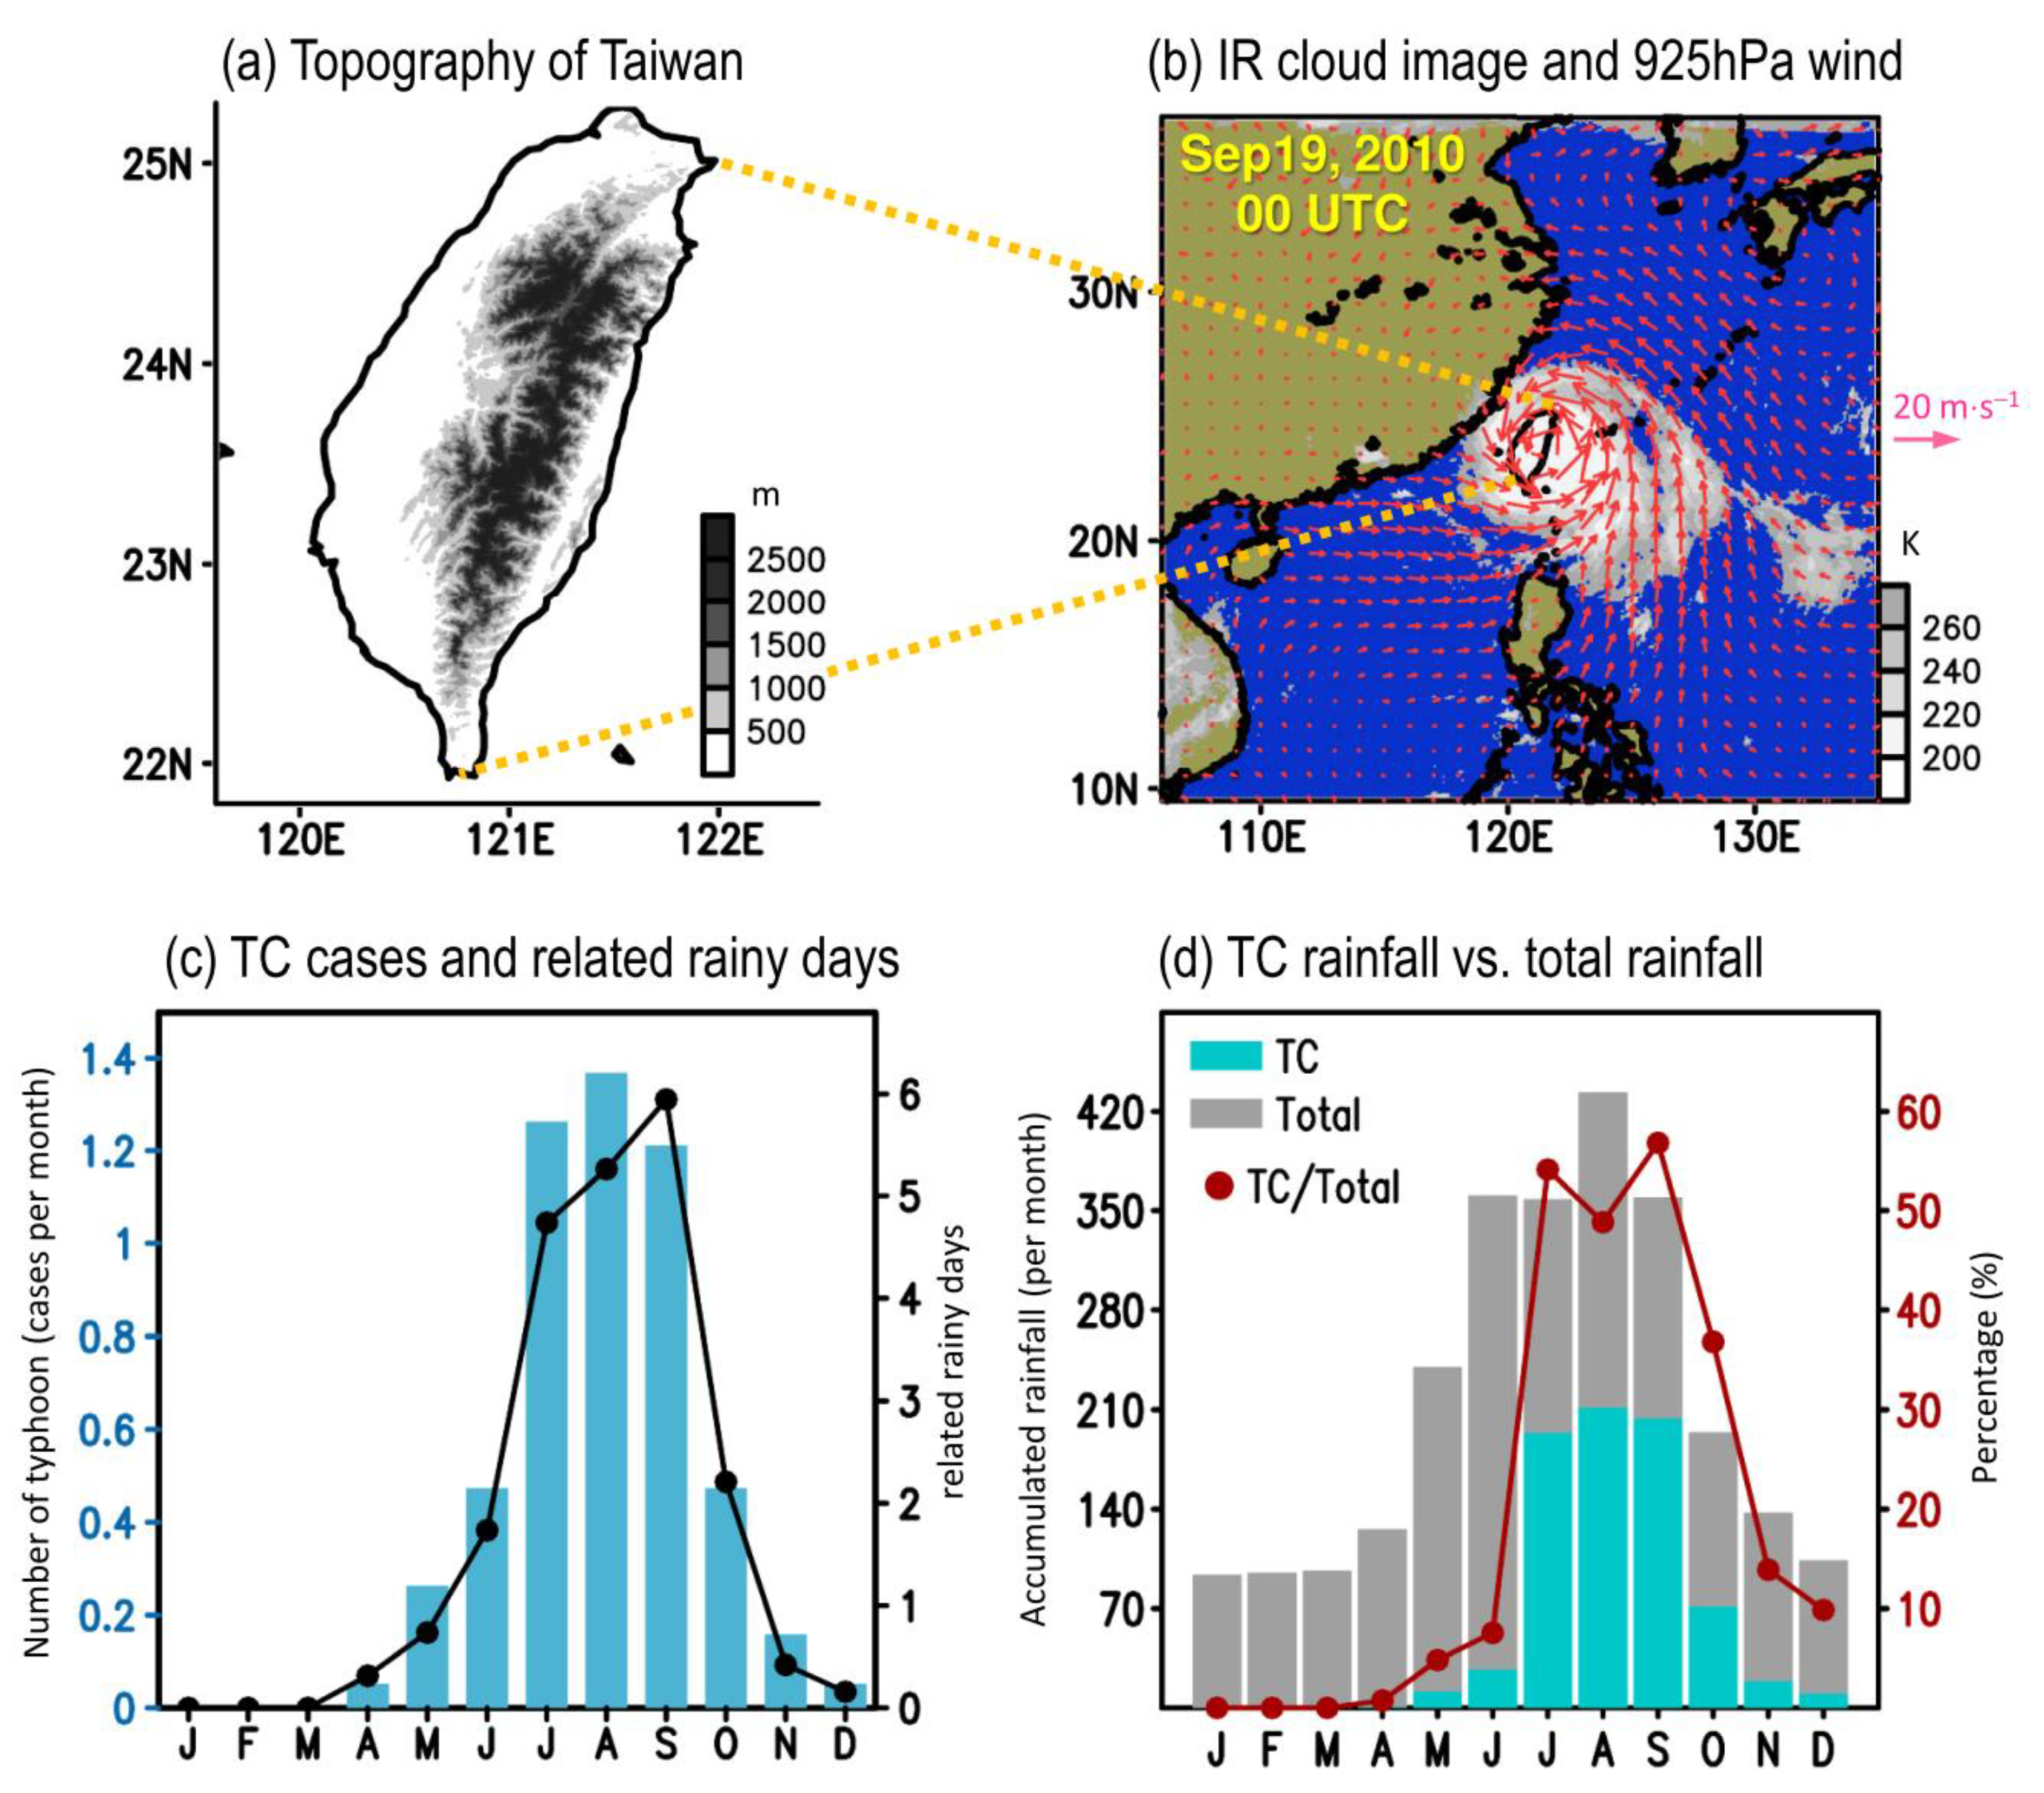
Figure 1. (a) Topography of Taiwan. (b) Infrared cloud image obtained from Gridded Satellite B1 Observations (https://www.ncdc.noaa.gov/gridsat/) and 925 hPa wind filed obtained from ERA5 reanalysis (https://www.ecmwf.int/), for a representative typhoon event that occurred on 19 September 2010, 00 UTC. (c) Annual evolution of monthly mean of typhoon-related (TC) cases (bars) and TC rainy days (black line) affecting Taiwan, averaged within the period of 2000–2018. The methods used for identifying TC cases and TC rainy days are documented in Section 2. Corresponding to (c), (d) shows the monthly accumulation of rainfall for TC rainy days (blue bars), total rainy days (gray bars), and percentage of TC rainfall accumulation relative to total rainfall (red line), estimated from the CWB rain gauge data averaged within the period of 2000–2018.
Remotesensing 13 00622 g001
Figure 2. Horizontal distribution of seasonal mean rainfall averaged from (a) total days, (b) non-TC days, and (c) TC days during 2000–2018 July to October (JASO) for the CWB and four SPPs (including IMERG-E, IMERG-L, IMERG-F, and TRMM7). (df) show the spatial correlation (Scorr) and the relative bias (RB) for the comparison between CWB and SPPs in (ac), respectively.
Remotesensing 13 00622 g002
Figure 3. Scatter plots of the daily area-averaged rainfall over Taiwan, estimated from CWB (x-axis) and selected SPPs (y-axis), for (a) non-TC days and (b) TC days during 2000–2018 JASO. Plots include the 1:1 line (dotted line), and the least-squares regression line (solid line), using rainfall estimated by CWB as the independent variable and those by SPP as the dependent variable. Statistical values of Tcorr, relative root-mean-square error (RRMSE), and the regression coefficient (β) for the comparison between CWB and SPPs are given in the top left corner of each plot.
Remotesensing 13 00622 g003
Figure 4. (a) Occurrence frequency of Scorr between CWB and selected SPPs (x-axis) for non-TC days during 2000–2018 JASO, and for different ranges of Scorr values (denoted as r). Corresponding to (a), (b) is the Scorr-related probability density function for non-TC days. (c,d) is similar to (a,b), respectively, but for the statistical values that estimated from TC days during 2000–2018 JASO.
Remotesensing 13 00622 g004
Figure 5. Rainfall occurrence frequency at different intensity thresholds over Taiwan for (a) 1942 non-TC days (sample size = 761,264 grids for 1942 days with 392 grids per day) and (b) 282 TC days (sample size = 110,544 grids). (c,d) corresponds to (a,b) but shows the probability density function for the occurrence frequency of grids with rainfall intensity at five different ranges, including non-rainy (0–0.1 mm⋅d−1), light (0.1–5 mm⋅d−1), moderate (5–20 mm⋅d−1), heavy (20–80 mm⋅d−1), and extreme (>80 mm⋅d−1).
Remotesensing 13 00622 g005
Figure 6. Statistical evaluations based on non-TC days in Taiwan during 2000–2018 JASO: (a) probability of detection (POD), (b) critical success index (CSI), and (c) false alarm ratio (FAR). (df) are similar to (ac), respectively, but for statistical evaluations based on TC-days in Taiwan during 2000–2018 JASO.
Remotesensing 13 00622 g006
Figure 7. Spatial distribution for the RMSE between CWB and selected SPPs estimated from (a) non-TC days and (b) TC days, during 2000–2018 JASO. RMSE values that pass the 99% significance t-test are marked by dots.
Remotesensing 13 00622 g007
Figure 8. Interannual variation of (a) non-TC rainfall and (b) TC rainfall accumulated from July to October and area-averaged over Taiwan within the period of 2000–2018. Horizontal distribution of point-to-point Tcorr between CWB and selected SPPs for the interannual variation of (c) non-TC rainfall and (d) TC rainfall during 2000–2018 JASO. Tcorr values that pass the 99% significance t-test are marked by dots in (c,d).
Remotesensing 13 00622 g008
Figure 9. Similar to Figure 2a–c, but for the season mean rainfall of (a) total days, (b) non-TC days, and (c) TC days, estimated from Global Precipitation Climatology Center (GPCC). In (a,c), gray shows areas with no data. (d) Scorr and RB between GPCC in (a,c) and CWB in Figure 2a–c. For comparison with CWB, the GPCC with original spatial resolution of 0.5° × 0.5° is interpolated linearly into 0.1° × 0.1°.
Remotesensing 13 00622 g009
Table 1. Summary of Integrated Multi-satellitE Retrievals for Global Precipitation Mission Level-3 (IMERG-E, IMERG-L, and IMERG-F) and Tropical Rainfall Measuring Mission 3B42 v7 (TRMM7) Satellite Products.
Satellite ProductUpload Delay TimeSpatial ResolutionTime ResolutionMorphing Algorithm
IMERG-E4 h0.1° × 0.1°30 minforward
IMERG-L14 h0.1° × 0.1°30 minforward and backward
IMERG-F3.5 month0.1° × 0.1°30 minforward and backward
TRMM72.5 month0.25° × 0.25°3 h-
Table 2. Contingency table used for the comparison between rain-gauge observations provided by Taiwan Central Weather Bureau (CWB) and satellite precipitation products (SPPs).
CWB ≥ Rainfall ThresholdCWB < Rainfall Threshold
SPPrainfall thresholdhitsfalse alarms
SPP <rainfall thresholdmissescorrect rejections
Table 3. Area-averaged rainfall over Taiwan, estimated from Figure 2a–c (units: mm⋅d−1).
CWBIMERG-EIMERG-LIMERG-FTRMM7
Total rainfall11.768.819.0010.018.52
Non-TC rainfall6.314.474.625.164.56
TC rainfall49.2938.6639.1343.5735.48
Table 4. Accumulated number and percentage (%) of days in Figure 4 with Scorr values ≥ 0.5. Highest values are bold.
Non-TC RainfallTC Rainfall
SPP Days%Days%
IMERG-E100451.720372.0
IMERG-L101352.221074.5
IMERG-F99351.120271.6
TRMM791647.219167.7
Table 5. Statistical values for the comparison of the interannual variation in rainfall between CWB and SPPs shown in Figure 8a,b. Values closest to perfect scores (Tcorr ~1 and RRMSE ~0) are bold.
Non-TC Rainfall TC Rainfall
SPP TcorrRRMSETcorrRRMSE
IMERG-E0.880.320.92 0.29
IMERG-L0.900.290.93 0.28
IMERG-F0.910.230.990.14
TRMM70.900.300.91 0.35
Table 6. Scorr values between GPCC for Figure 9a–c and IMERG products in Figure 2a–c. Highest values are bold.
Total RainfallNon-TC RainfallTC-Rainfall
IMERG-E vs. GPCC0.490.400.64
IMERG-L vs. GPCC0.520.460.65
IMERG-F vs. GPCC0.710.590.83
Publisher’s Note: MDPI stays neutral with regard to jurisdictional claims in published maps and institutional affiliations.