Article

Monitoring the Coastal Changes of the Po River Delta (Northern Italy) since 1911 Using Archival Cartography, Multi-Temporal Aerial Photogrammetry and LiDAR Data: Implications for Coastline Changes in 2100 A.D.

Department of Civil, Environmental and Architectural Engineering, University of Padova, Via Marzolo, 9-35131 Padova, Italy
Remote Sens. 2021, 13(3), 529; https://doi.org/10.3390/rs13030529
Submission received: 22 January 2021 / Accepted: 29 January 2021 / Published: 2 February 2021
(This article belongs to the Special Issue Remote Sensing Applications in Coastal Environment)

Abstract

:
Interaction between land subsidence and sea level rise (SLR) increases the hazard in coastal areas, mainly for deltas, characterized by flat topography and with great social, ecological, and economic value. Coastal areas need continuous monitoring as a support for human intervention to reduce the hazard. Po River Delta (PRD, northern Italy) in the past was affected by high values of artificial land subsidence: even if at low rates, anthropogenic settlements are currently still in progress and produce an increase of hydraulic risk due to the loss of surface elevation both of ground and levees. Many authors have provided scenarios for the next decades with increased flooding in densely populated areas. In this work, a contribution to the understanding future scenarios based on the morphological changes that occurred in the last century on the PRD coastal area is provided: planimetric variations are reconstructed using two archival cartographies (1911 and 1924), 12 multi-temporal high-resolution aerial photogrammetric surveys (1933, 1944, 1949, 1955, 1962, 1969, 1977, 1983, 1990, 1999, 2008, and 2014), and four LiDAR (light detection and ranging) datasets (acquired in 2006, 2009, 2012, and 2018): obtained results, in terms of emerged surfaces variations, are linked to the available land subsidence rates (provided by leveling, GPS—global positioning system, and SAR—synthetic aperture radar data) and to the expected SLR values, to perform scenarios of the area by 2100: results of this work will be useful to mitigate the hazard by increasing defense systems and preventing the risk of widespread flooding.

Graphical Abstract

1. Introduction

Land subsidence afflicts many areas in the world involving high population communities and extensive agriculture with great impact on the ecological and economic fields [1]; the effects of this global problem are more evident along transitional environments, such as coastal areas, deltas, wetlands, and lagoons, which are becoming increasingly vulnerable to flooding, storm surges, salinization, and permanent inundation [2,3,4,5]: half a billion people live, in fact, in delta regions threatened by land subsidence, and concerns for their well-being are increasing [6]. Land subsidence can be origin by natural and/or anthropogenic causes: natural subsidence is due to the compaction of lithological layers of soil and oxidation of peat; anthropogenic subsidence derives from aquifer-system compaction associated with groundwater or hydrocarbon withdrawals, drainage of organic soils, underground mining, natural compaction, sinkholes, and thawing permafrost [7]; the connections and coexistence of these phenomena have a strong negative impact on the territory, and can lead to environmental degradation, damage to buildings, and interruption of services.
The monitoring of these territories, in many cases characterized by high population concentration and low elevation compared to the mean sea level, is crucial to increase and improve the areas from flooding risk [5]: knowing the evolution of the temporal and spatial distribution of the movements is in fact essential to delineate the areas most affected by ground displacements and understand the mechanisms involved [8]. Moreover, the information deriving from the monitoring activities allows us to prevent damage to buildings and infrastructure, plan more sustainable urban development, and hence mitigate the risk.
Several geomatics methodologies can be used to monitor large areas affected by land subsidence: while in the past only geometric leveling had widespread use for the acquisition of high precision data, in recent decades the development of GPS (global positioning system), GNSS (global navigation satellite system), and SAR (synthetic aperture radar) techniques has made it possible to obtain high precision and high resolution data [9,10], which, in many cases, can integrate and/or replace the leveling measurements. Aerial digital photogrammetric [11,12] and LiDAR (with ALS–airborne laser scanning approach) [13] surveys can also be used, but the accuracy in elevation of these methodologies does not allow the high precision analysis necessary in the study of low rates, as typically occurs in the study of land subsidence. In this case, these methodologies can provide useful data in the study of planimetric changes: along the coastal area, with low elevations compared to the mean sea level, low subsidence rates can provide high planimetric changes of the coastline, with submersion of large areas that can be evaluated using photogrammetric and LiDAR data. For more limited areas, unmanned aerial vehicle (UAV) [14,15] and terrestrial laser scanning (TLS) [16,17,18] systems can also be used successfully.
In this work, archival cartography, digital aerial photogrammetry, and LiDAR (light detection and ranging) geomatic methodologies are used to reconstruct the coastline evolution of the PRD area (Figure 1) from 1911 to 2018, based on two cartographic data (1911 and 1924); 12 photogrammetric surveys performed in 1933, 1944, 1949, 1955, 1962, 1969, 1977, 1983, 1990, 1999, 2008, and 2014; and four LiDAR data acquired in 2006, 2009, 2012, and 2018.
The coastline was extracted from each survey and compared with the previous and subsequent dataset, and the results are provided in terms of emerged/submerged surfaces in the analyzed period. These data are correlated with available land subsidence rates (from leveling-for the past-and from GPS (2012–2017) and SAR data for the period 1992–2017 [19]) and SLR previsions [20]: the expected SLR values in the Po River Delta (PRD) are obtained from [21]: using all these data, a scenario of the study area projected in 2100 is performed in terms of emerged/submerged surfaces outside the levees.
Many authors, using different techniques, have studied land subsidence and coastal changes in PRD in the past [22,23,24] and recently [19,25,26], but no author has carried out studies on the emerged/submerged surfaces trend linked to the values of land subsidence rates and SLR expected for the next decades in this area.

2. Study Area and Instability Process

The PRD covers about 400 km2 in the northern Italy and was formed by the deposit of sediments carried by the Po, the largest river in Italy that runs west–east for about 690 km from the Monviso Mont before flowing into the northern Adriatic Sea (Figure 1); the geology of the delta is mainly composed of terrigenous sediments up to 2000 m thick, and it is a complex multi-aquifer freshwater system [27].
Ground deformations in the PRD are mainly due to land subsidence of different origin: tectonic, sediment compaction, and artificial (anthropic). Long-term subsidence is mainly the result of deep tectonics, glacial isostatic adjustments, and geodynamic movements that provide a maximum rate of 2.5 mm/year [28,29]. Artificial subsidence is due to draining of wetlands, land reclamation, and, mostly, pumping of methane water from the medium-depth Quaternary deposits (200–600 m), which was highly intense between 1938 and 1961, when the Italian government suspended such operations [30].
This type of deformation, which may be attributed to large-scale human activities, caused vertical displacements in the analyzed area in the order of 2–3 m during and after the extraction processes (from 1940 to 1980), as documented by many authors: [23,31] indicate a maximum land subsidence rate in the order of 250 mm/year for the period 1951–1957 and 180 mm/year between 1958 and 1962. Later (1962–1967), these rates fell to 33 mm/year, matching the gradual reduction in pumping, and to 37.5 mm/year from 1967 to 1974. These last data clearly show the benefits obtained by halting extraction. Subsequently, the rate decreased still further: recent studies (using geometric leveling, GPS and InSAR data) have shown that land subsidence, albeit reduced, is still ongoing [19,26,32,33,34,35] (Figure 2). Nowadays, the effects of the great land subsidence that occurred in the last century are evident: most of the PRD now lies below the mean sea level and is characterized by the lengthening of the deltaic branches, anthropogenic stabilization of the hydrographical network, elevated borders seawards (levees, flood protection structures), and a significant depression in the center [27].
Sediment compaction and anthropogenic land subsidence may lead to serious environmental problems in this area, especially in connection with the relative SLR (RSLR) caused by climate variations worldwide [21,36,37,38,39,40,41,42,43]. Due to great ecological and economic value, high populations, and extensive agriculture, constant monitoring of deformations throughout the complex ecosystem of the PRD is necessary to provide information about displacements in order to implement territorial defense systems against flooding [1,2,3,4,5,6].

3. Materials and Methods

3.1. Available Datasets

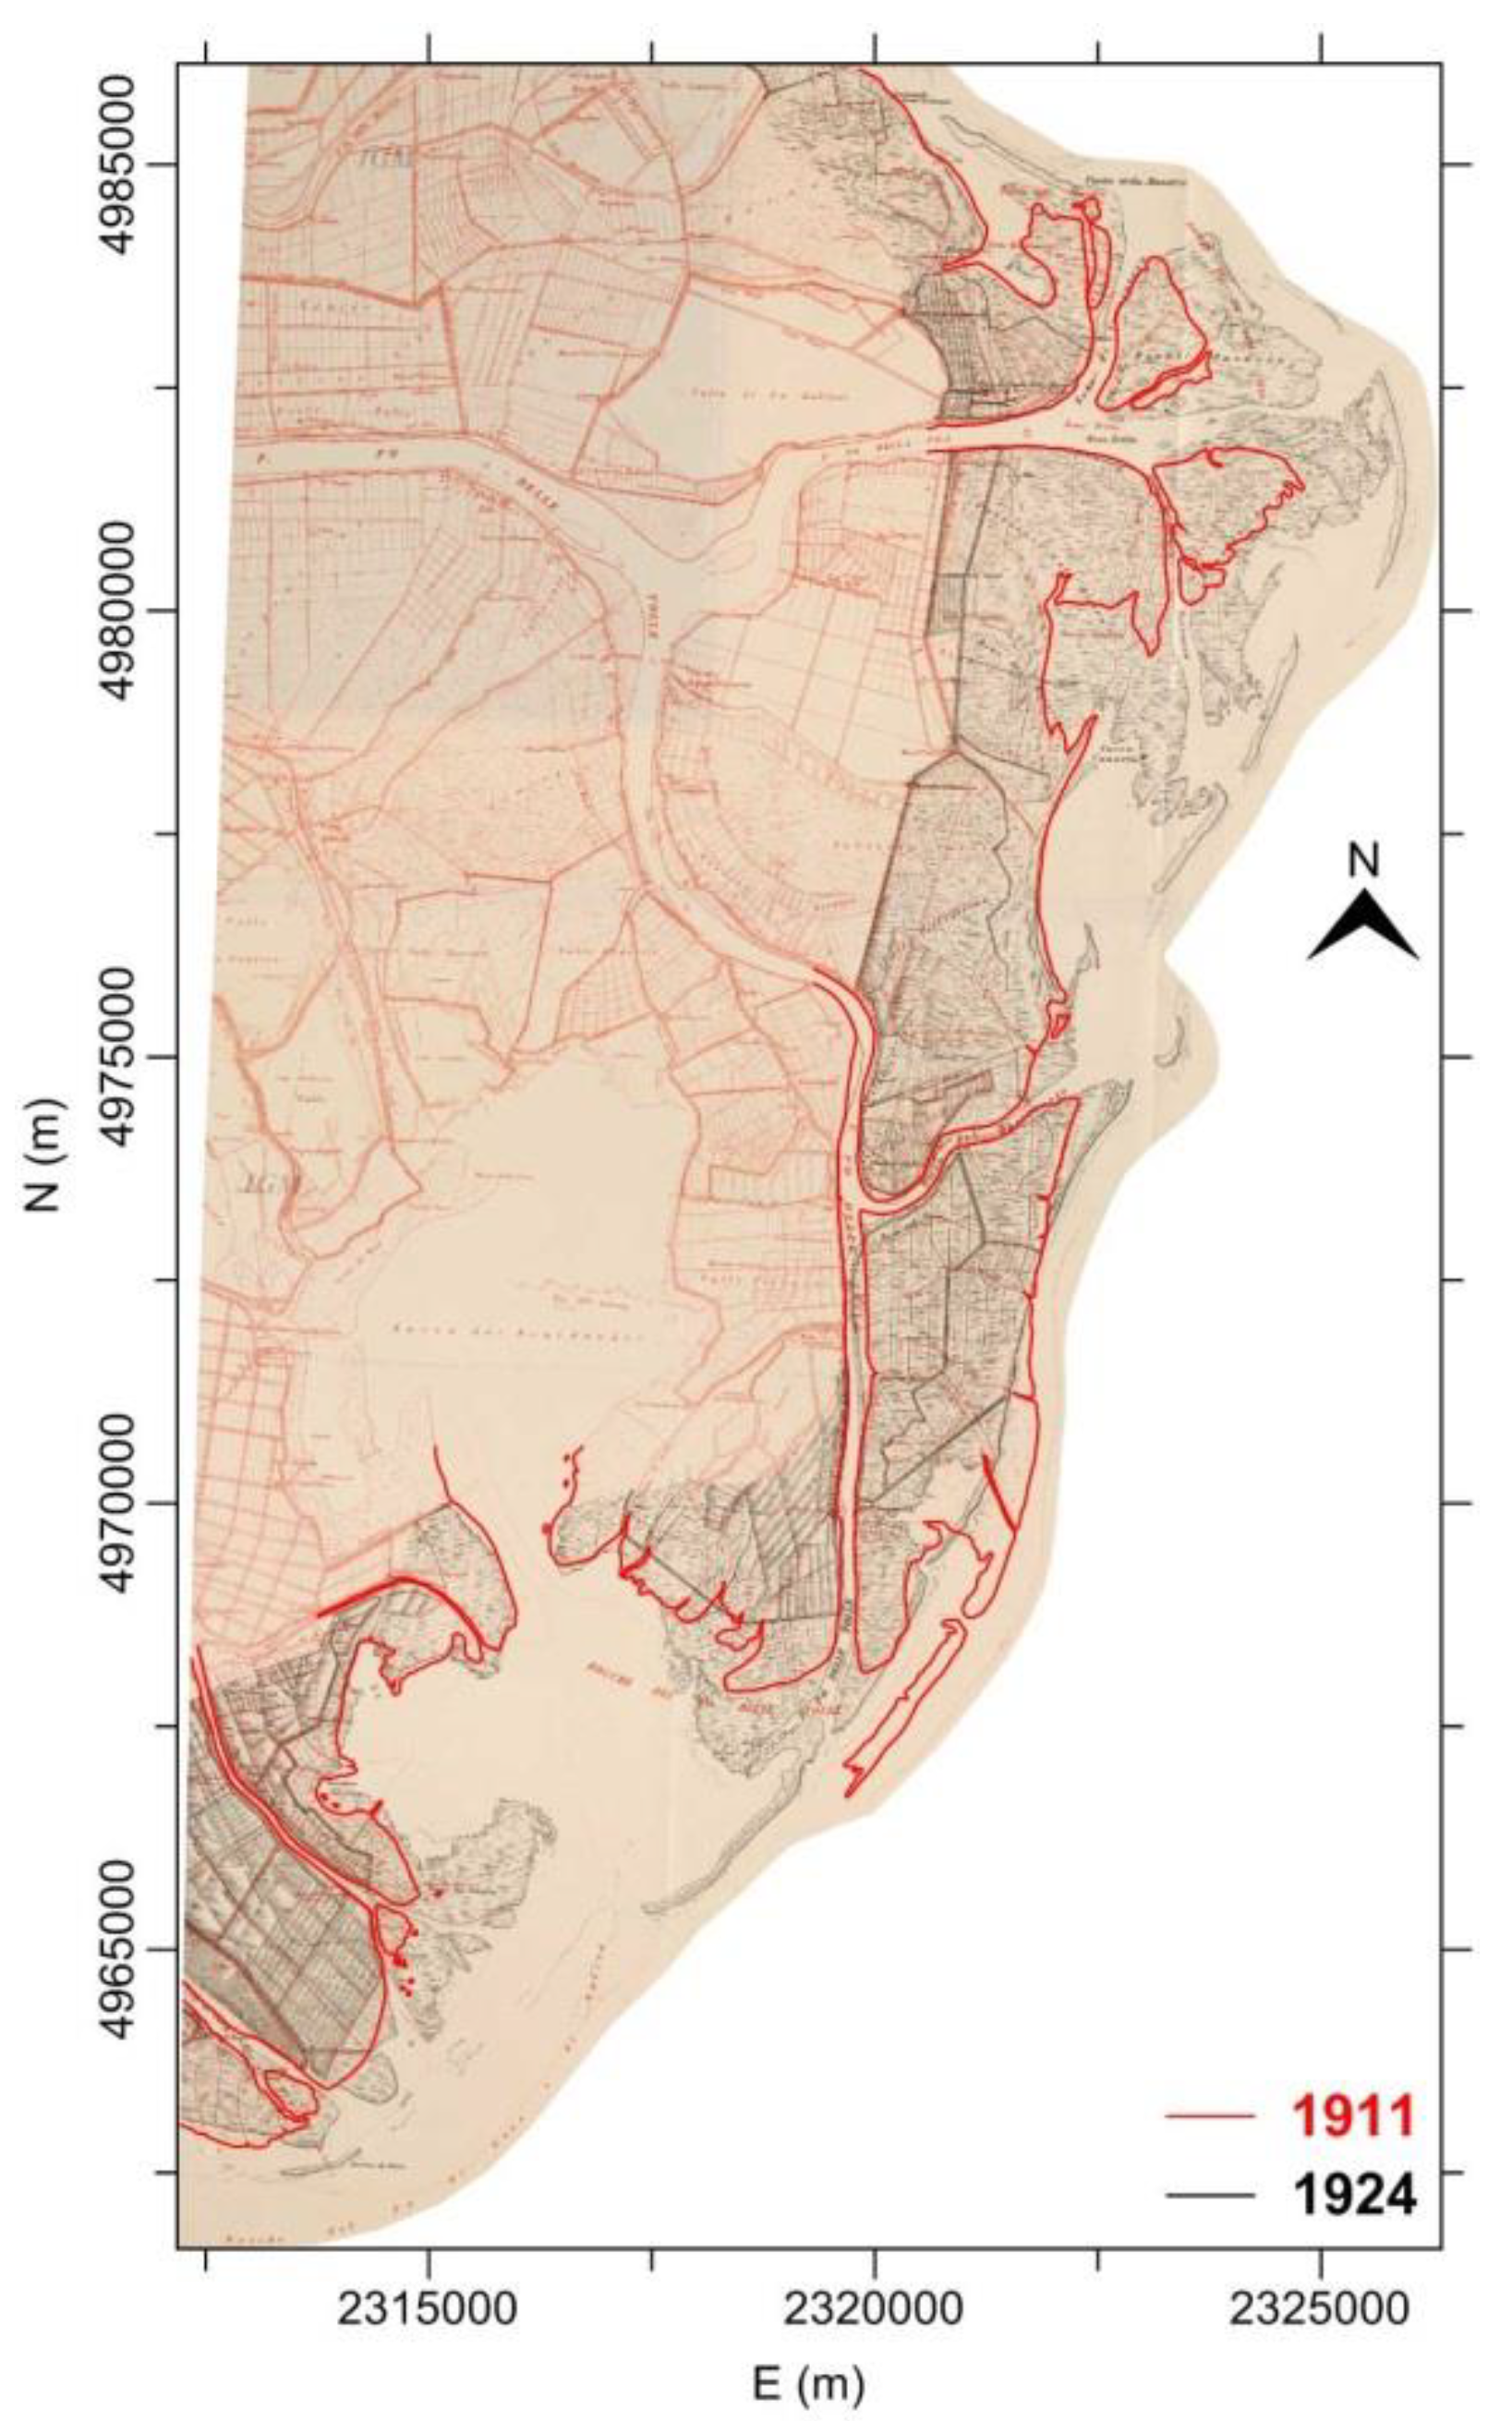
3.1.1. Archival Cartographies

The study of coastline changes was performed using data from two archival cartographies derived from the IGMI (Istituto Geografico Militare Italiano): the representations are overlapped on a map where the complete survey of the eastern portion of PRD was performed in 1911 using classical topographic techniques, while only the easternmost coastal area was updated in 1924. The map, in a local reference system, represents the area from Po di Maistra to Po di Goro, in the north–south direction (Figure 1), and describes the Po river mouths in 1:25,000 scale.

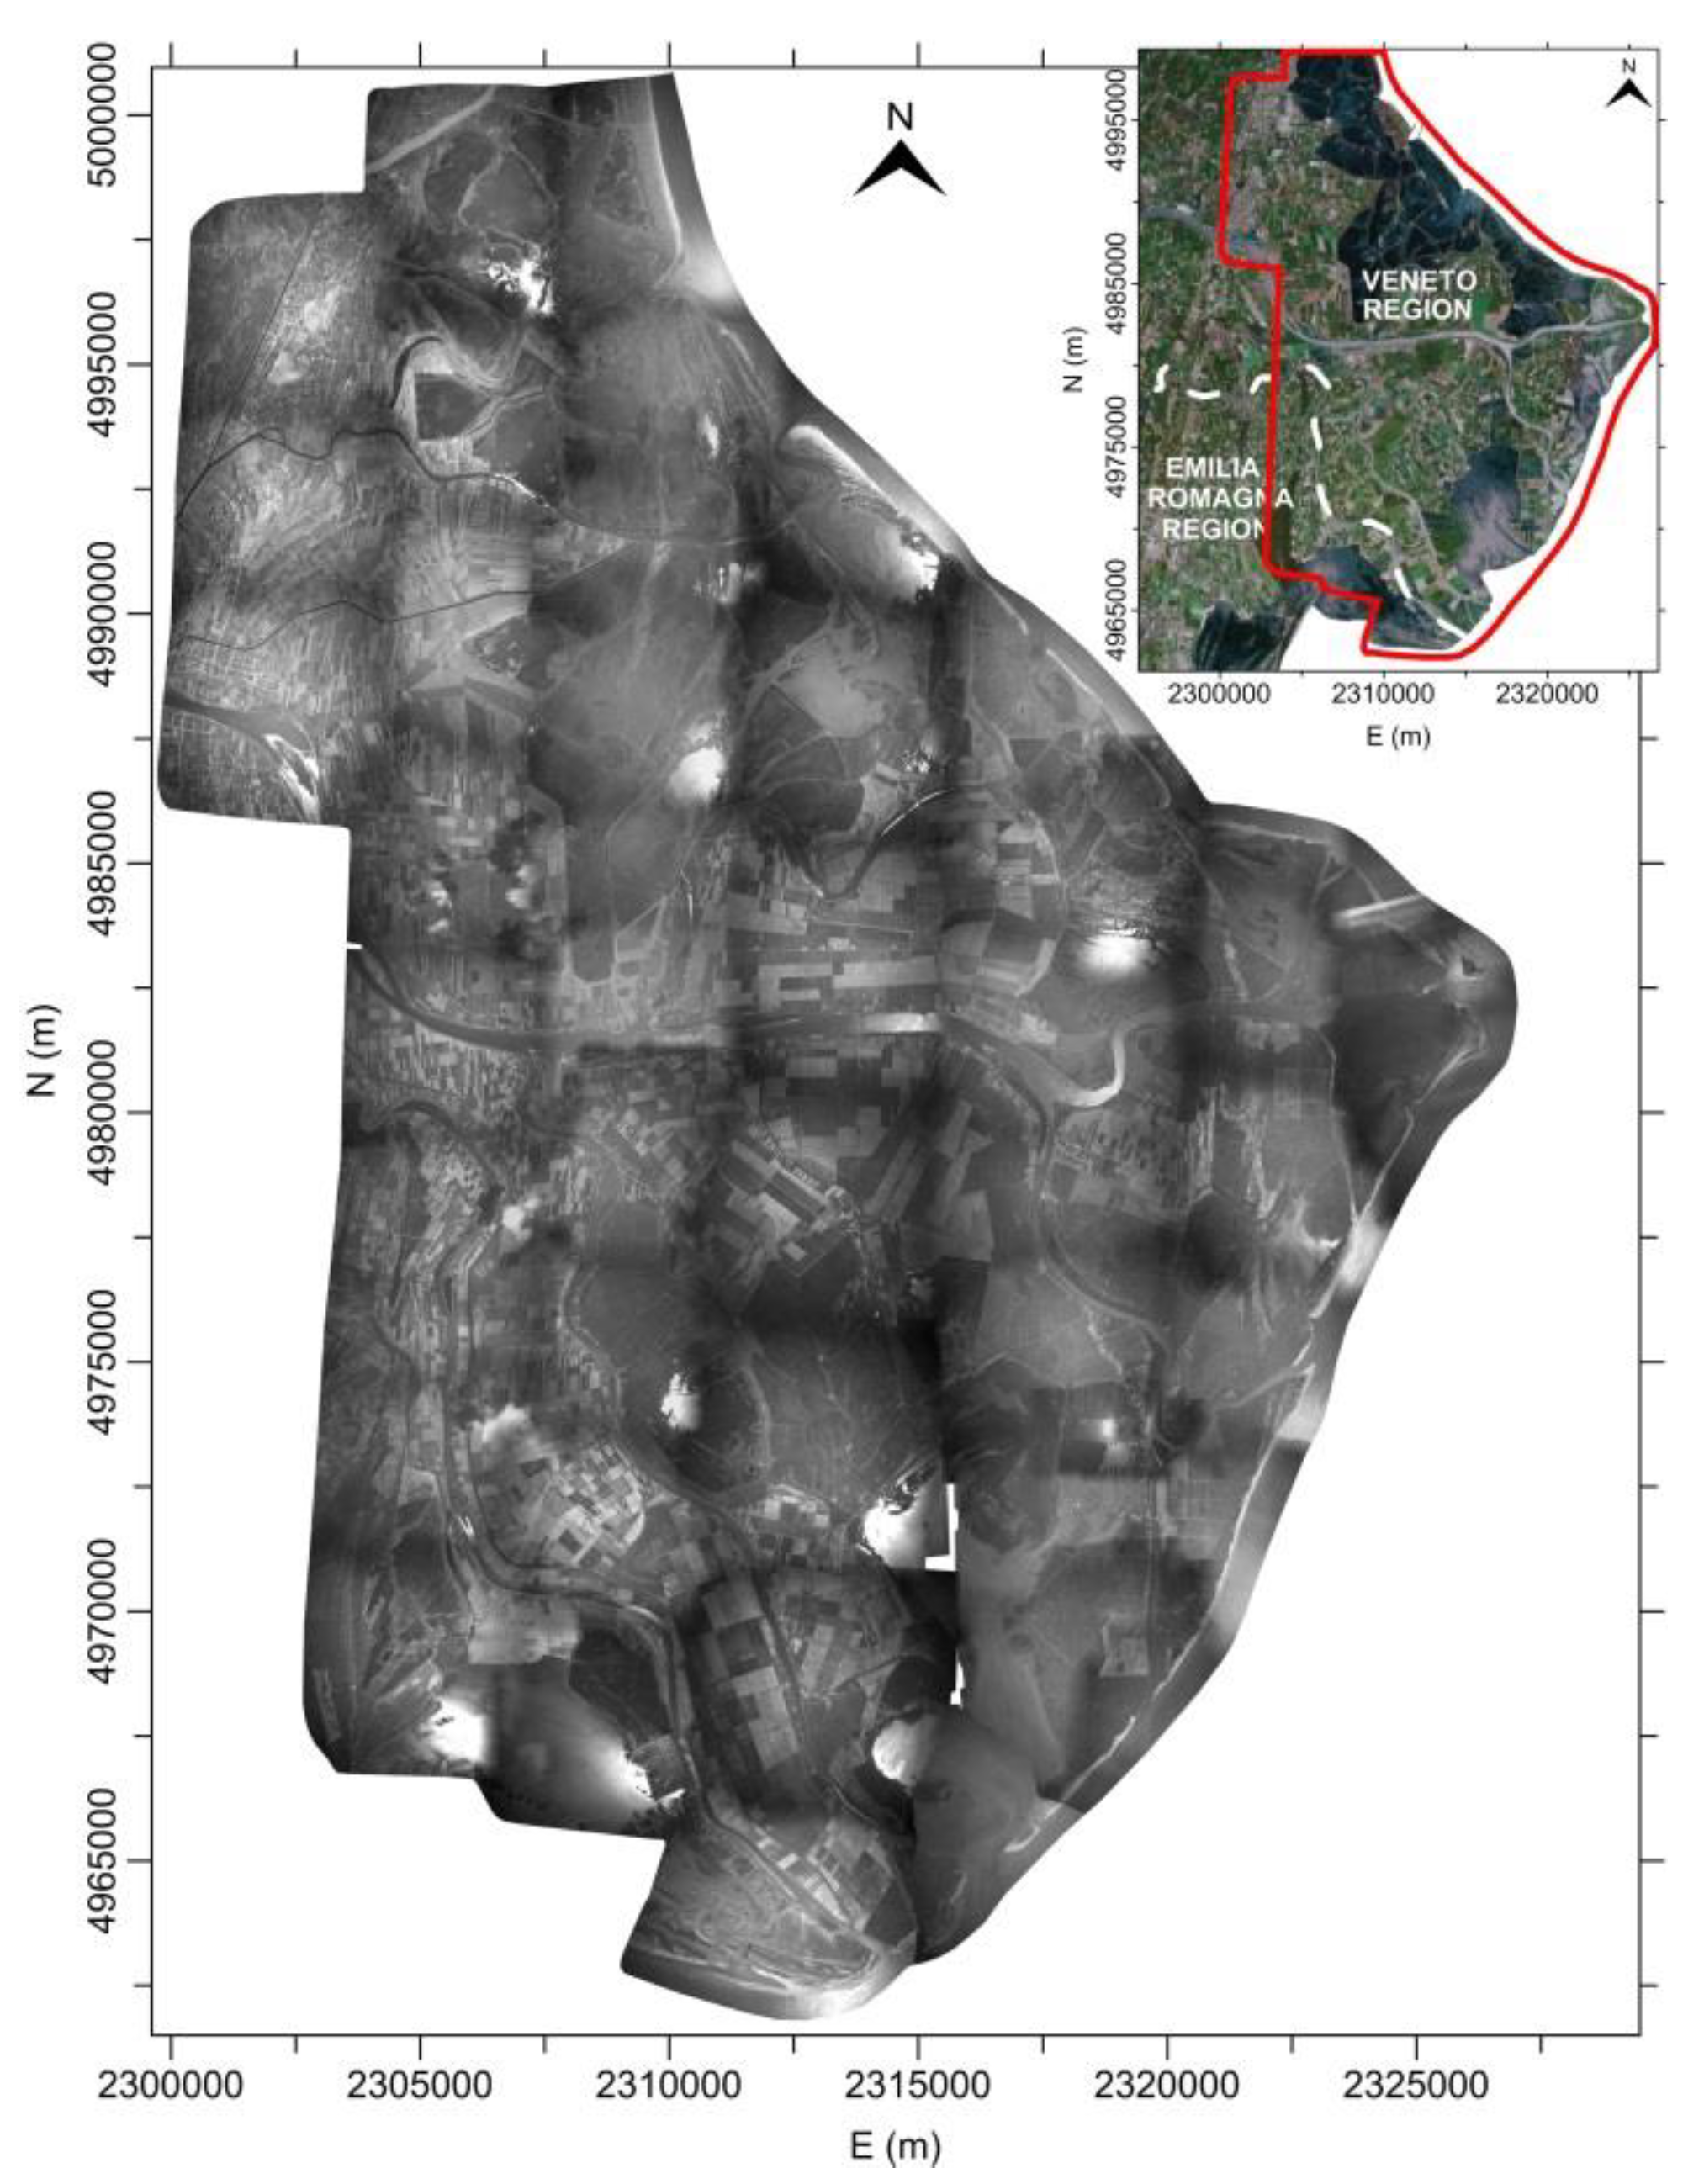
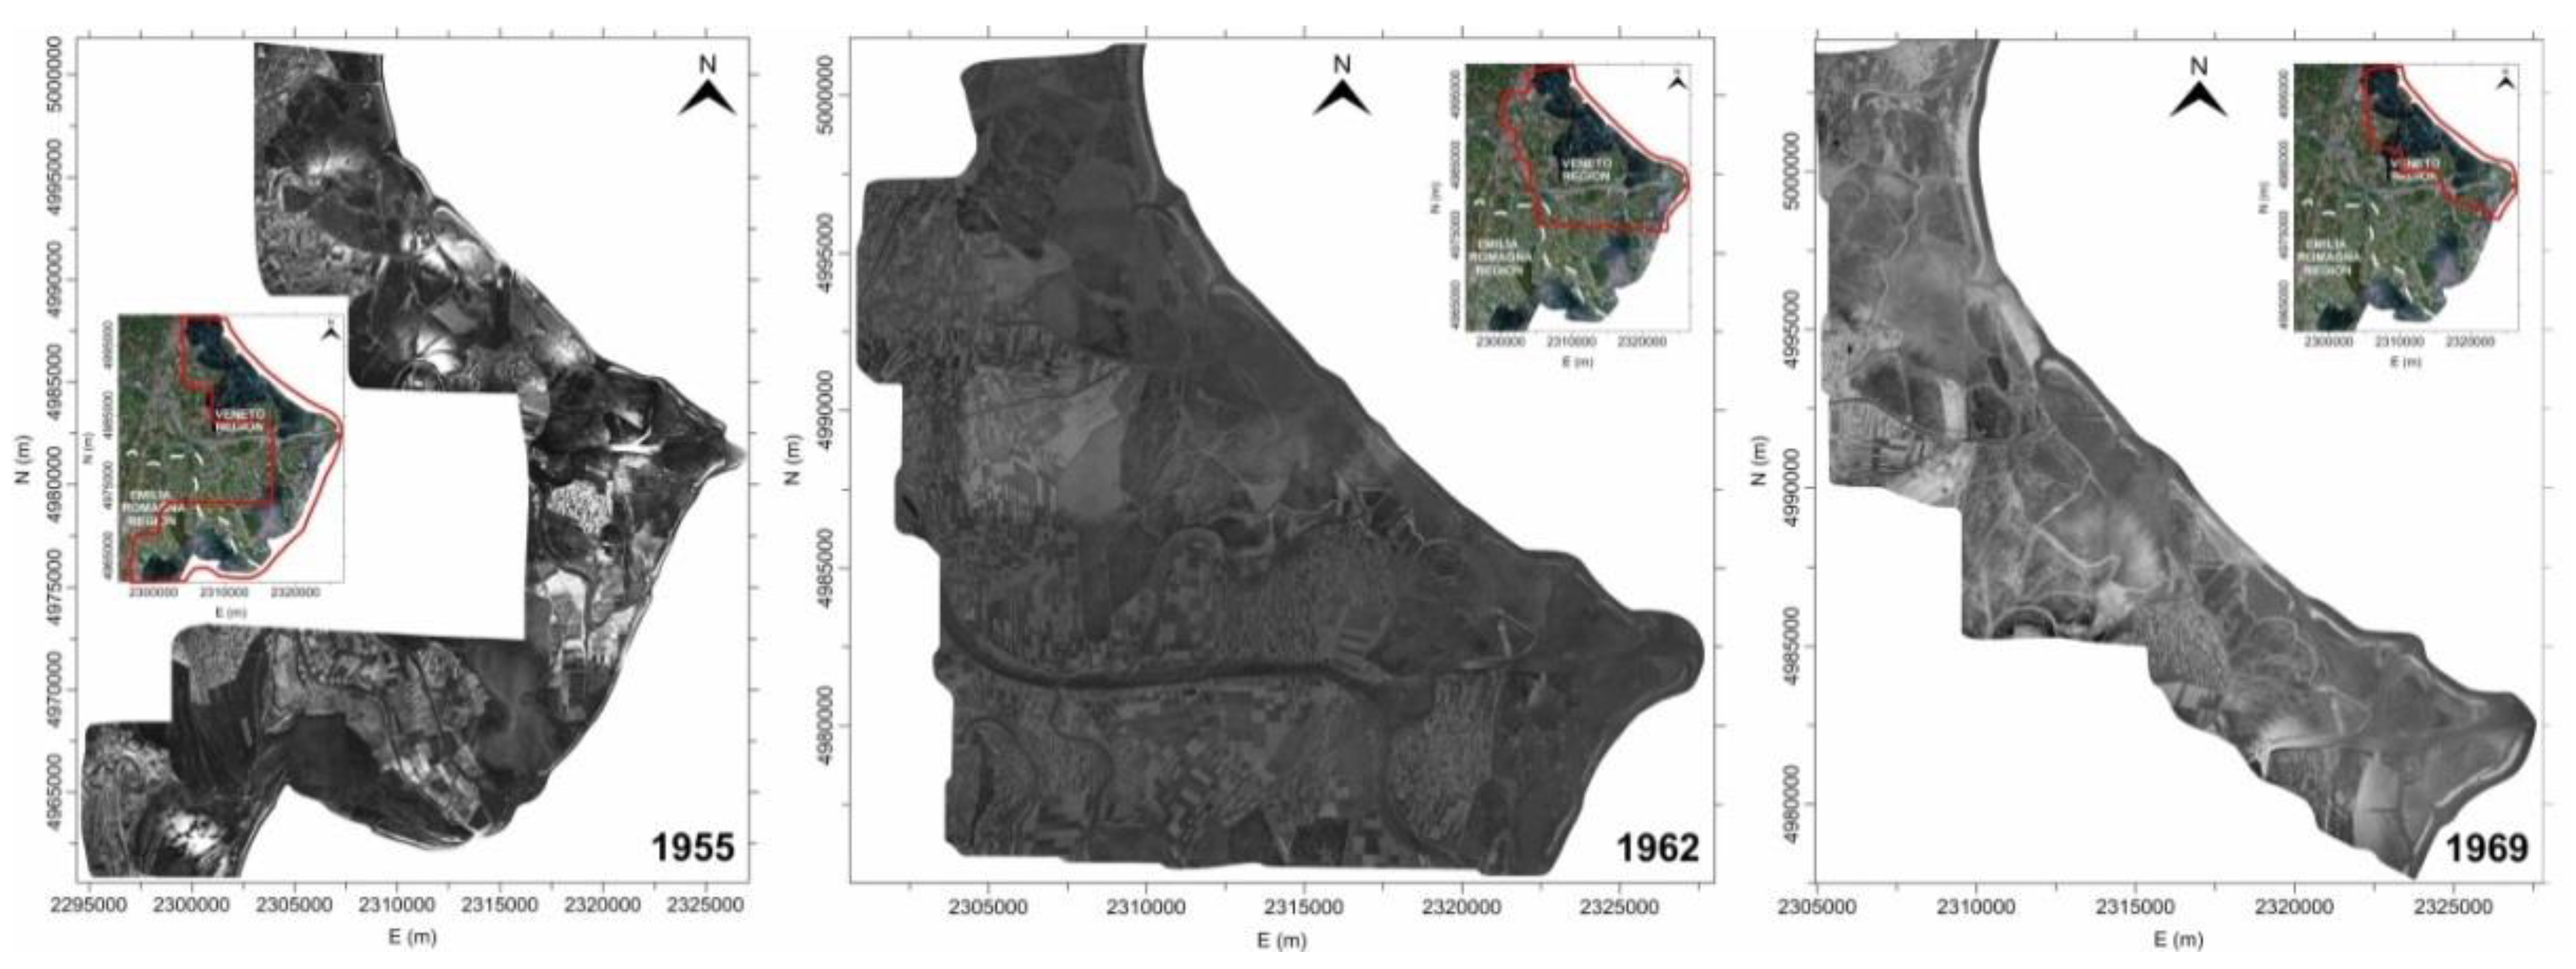
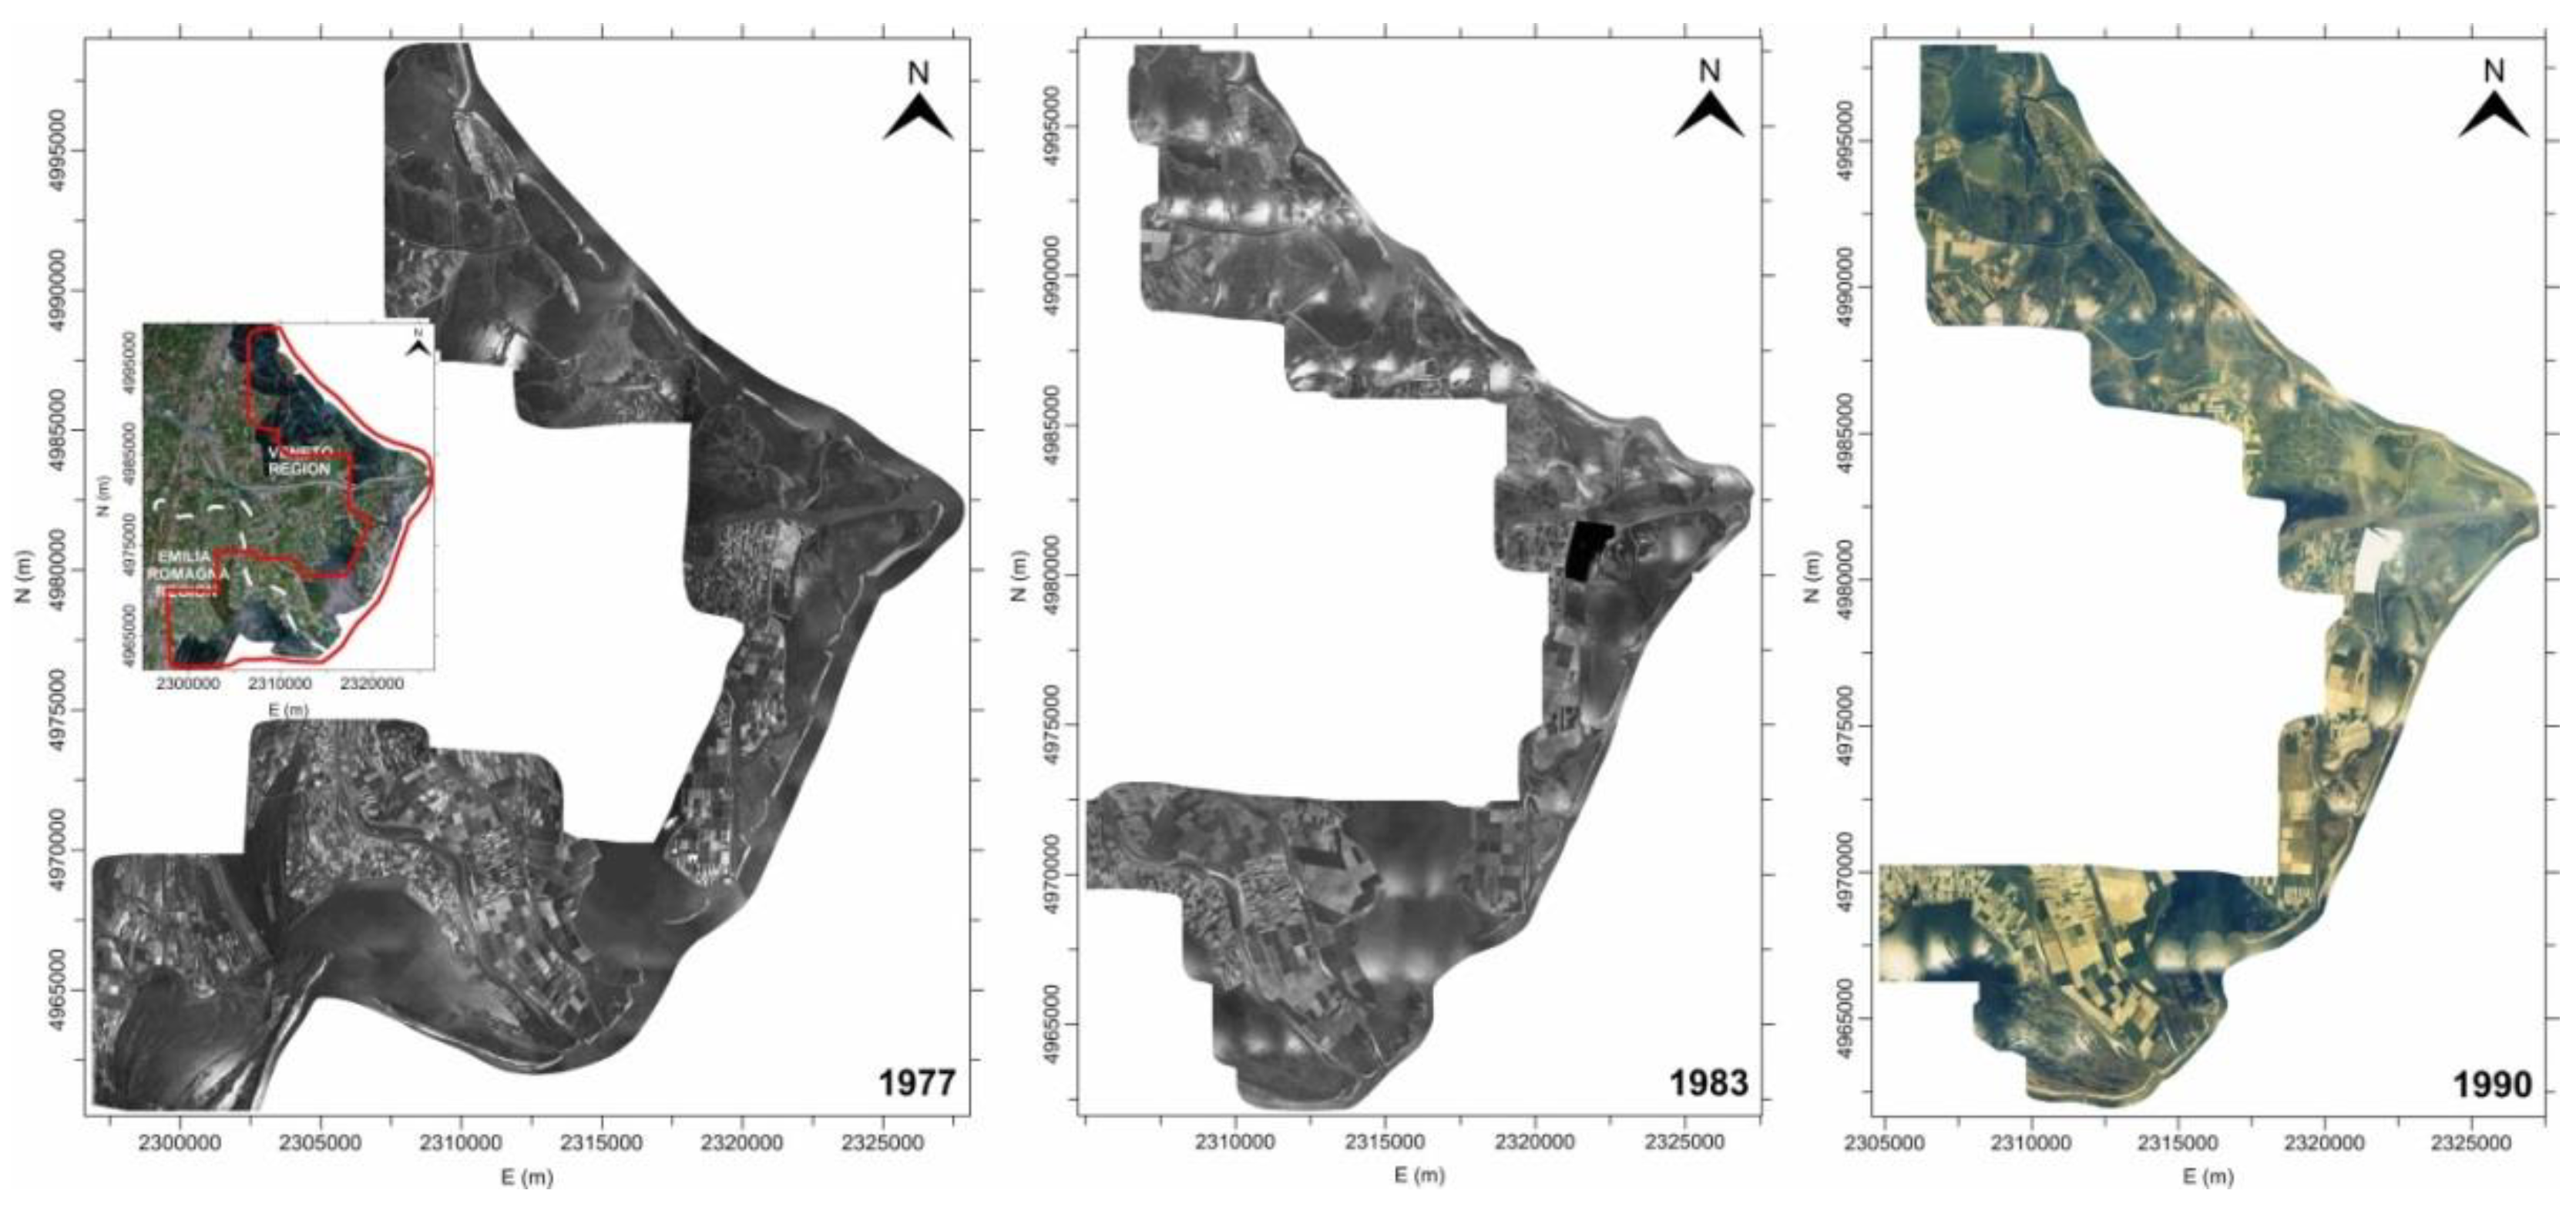
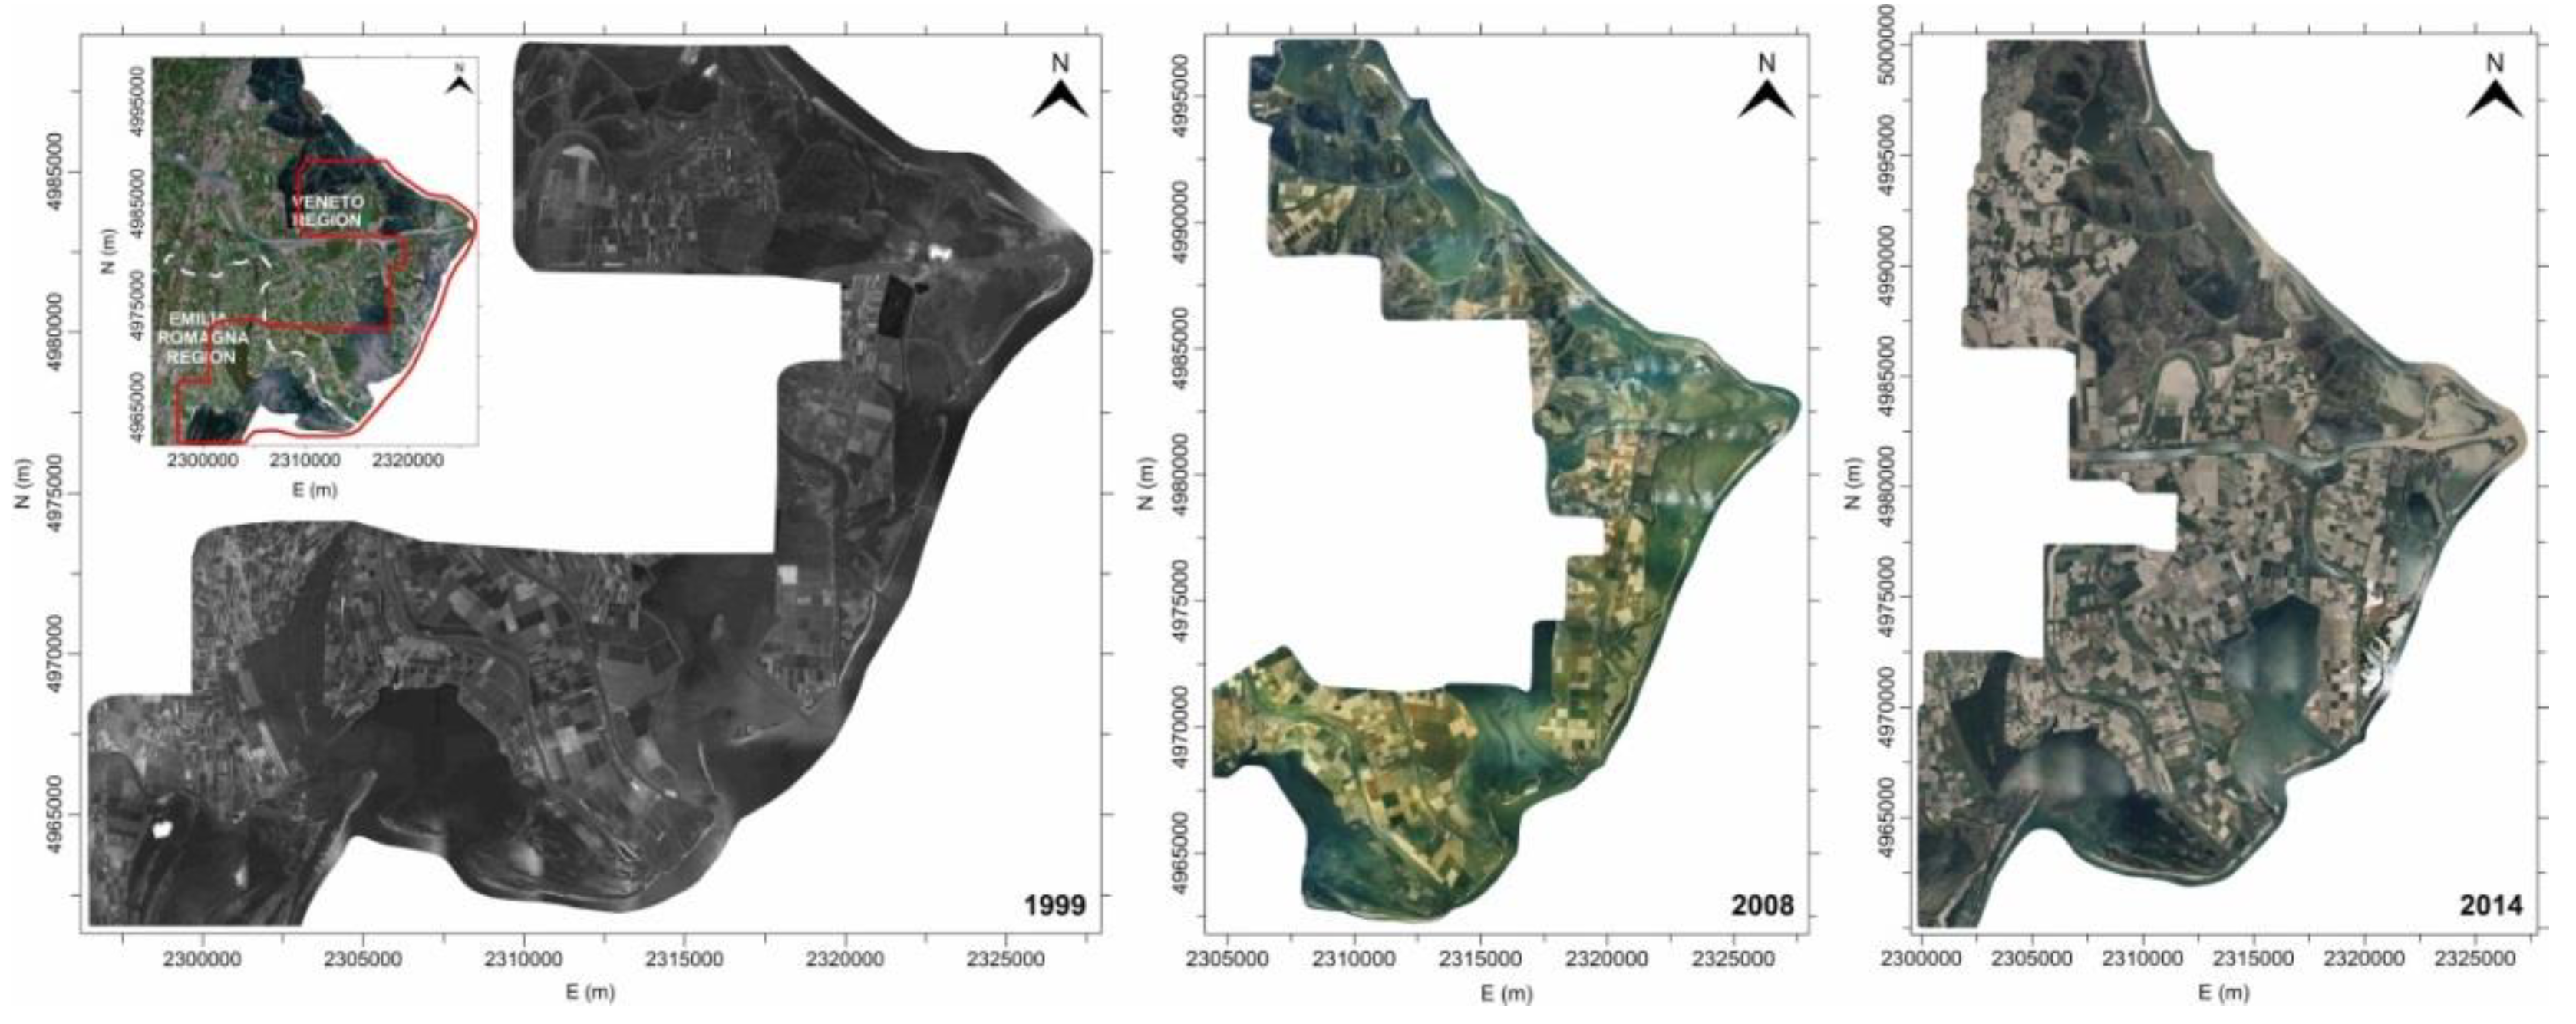
3.1.2. Aerial Photogrammetric Surveys
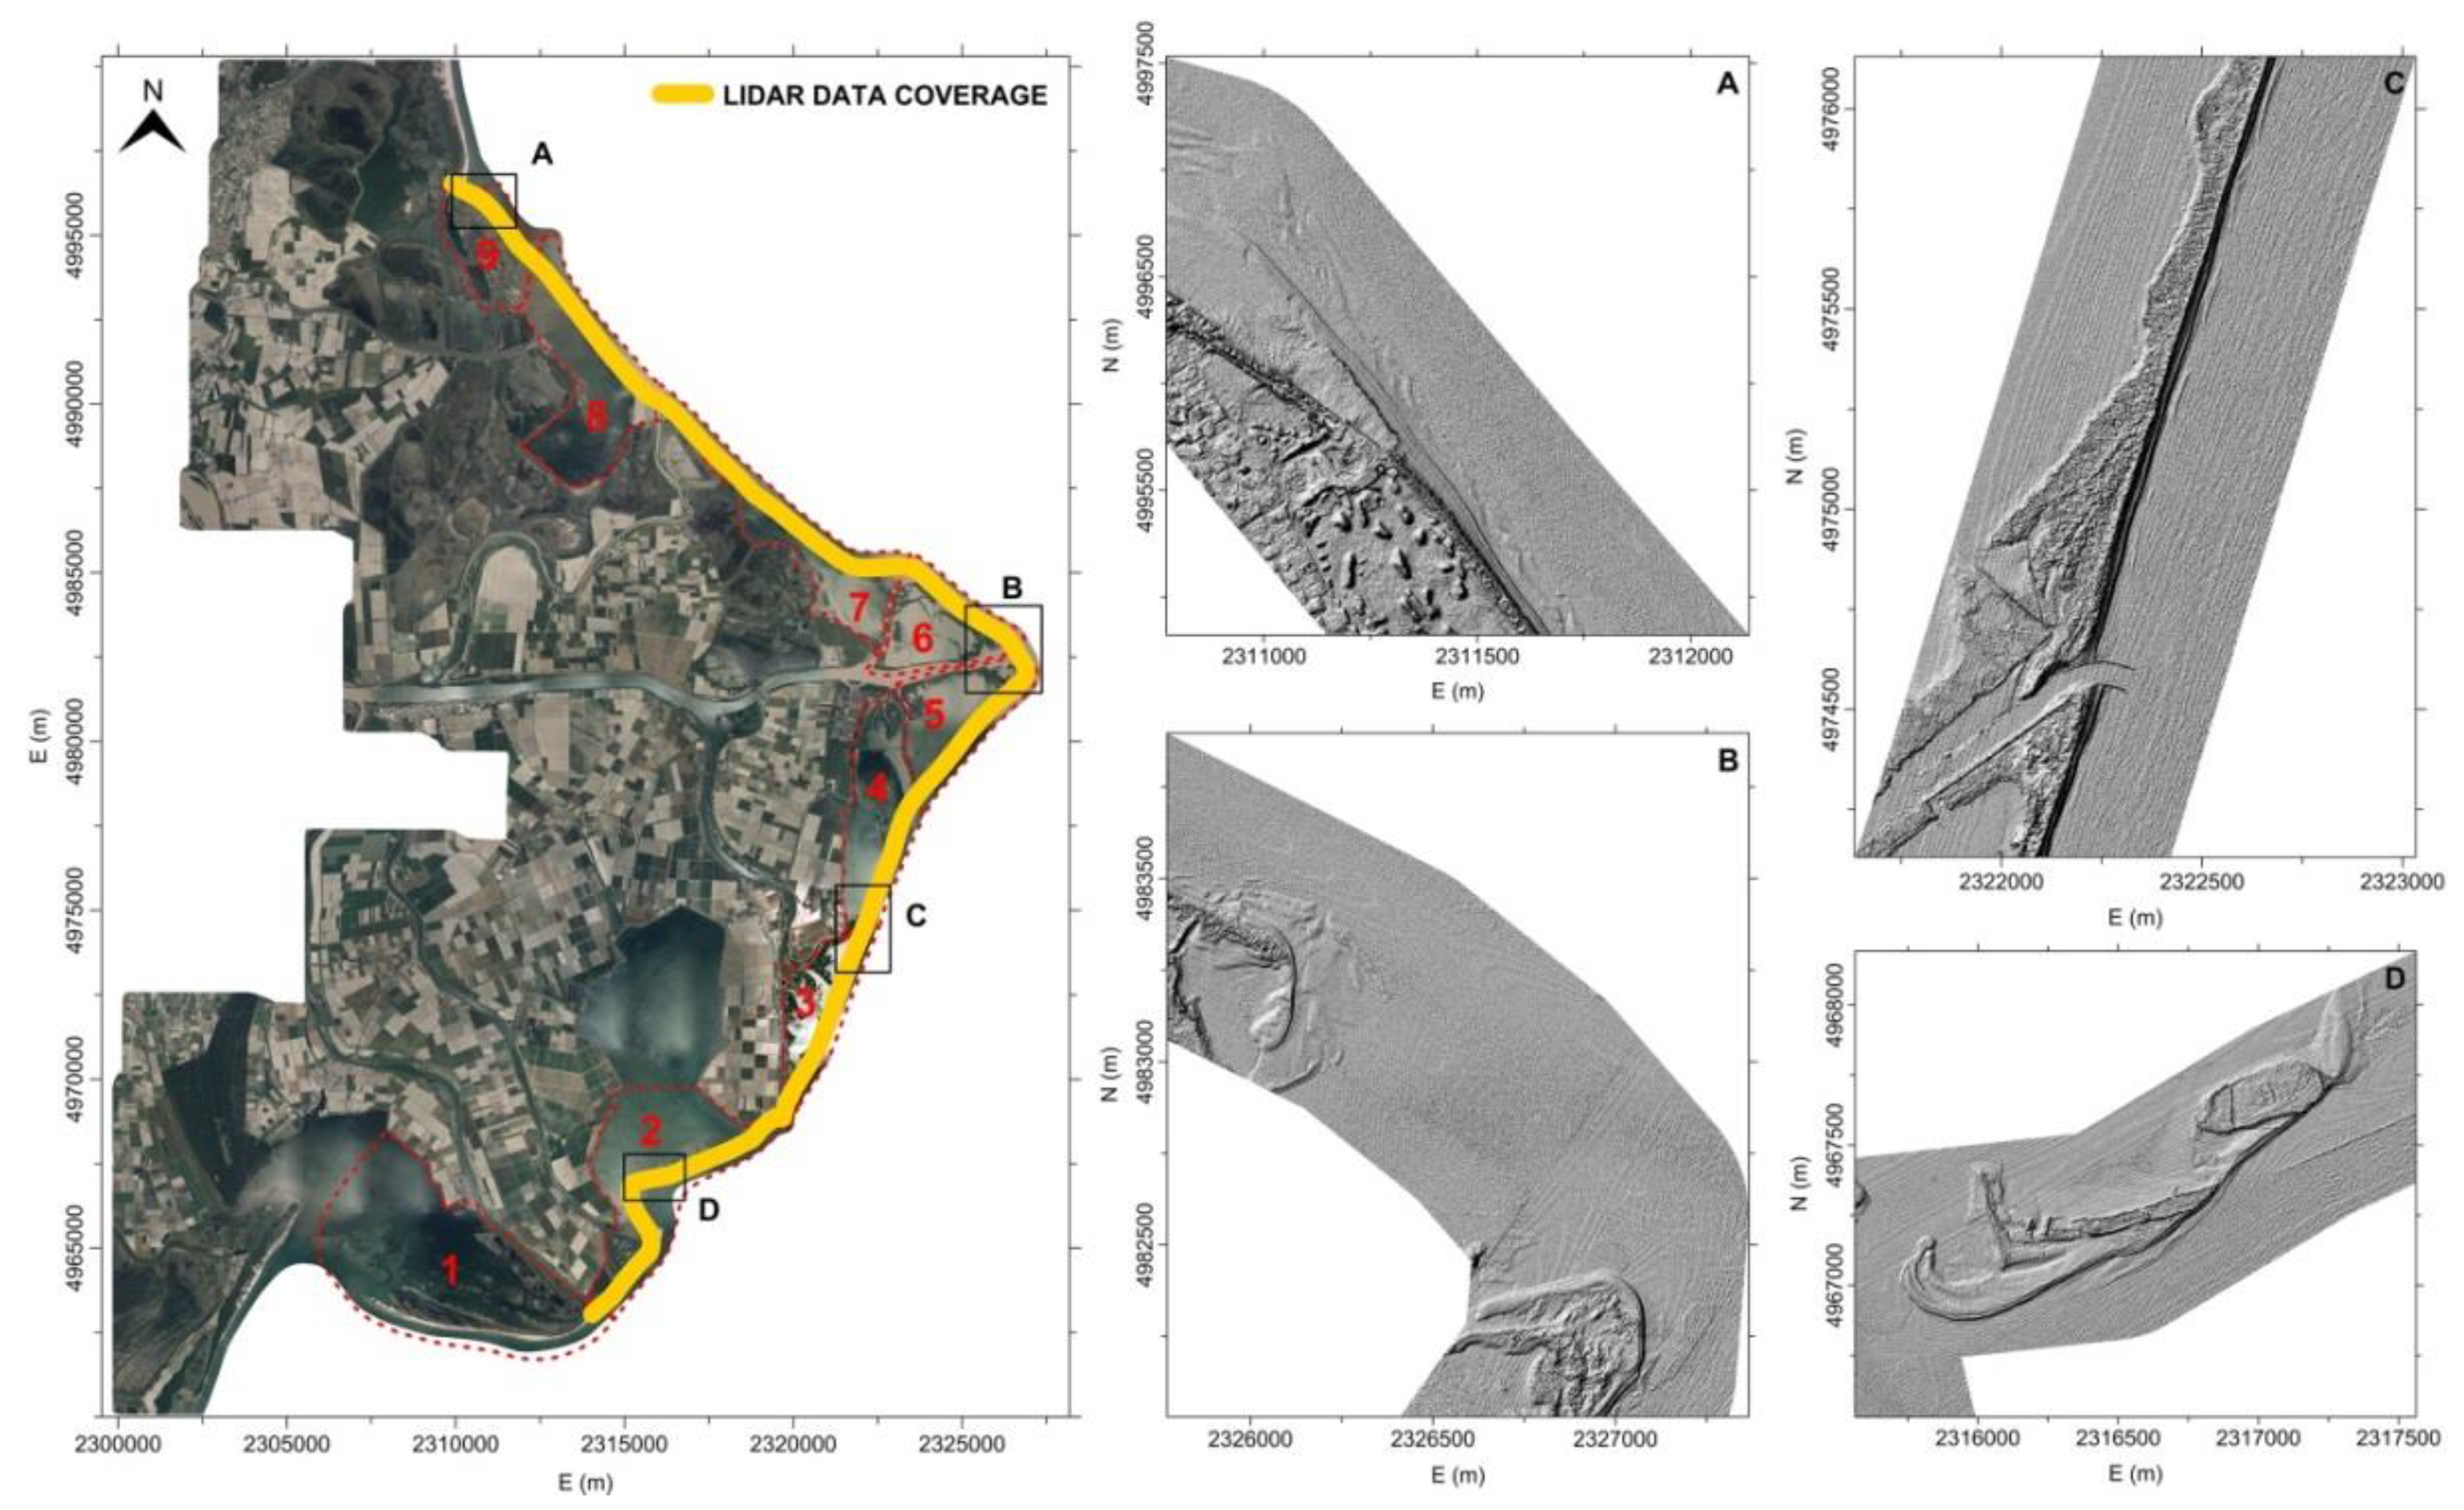
The aerial photogrammetric surveys of the PRD used in this study were carried out in 1933, 1944, 1949, 1955, 1962, 1969, 1977, 1983, 1990, 1999, 2008, and 2014: in detail, the strips along the coastline were analyzed from Porto Caleri (Rovigo) to the border between the Veneto and Emilia Romagna Regions (Figure 1: a small area in Emilia Romagna). Unfortunately, the coverage of 1933 is incomplete in the northern portion (some photographs on glass plates were lost); the 1944 survey has limited coverage for both Veneto and Emilia Romagna, the 1962 and 1969 surveys are restricted in the southern portion, and the 1999 one is limited to the northern part of the study area: in these cases, the comparisons between the data were reduced in the multi-temporal analysis.
All aerial photos were acquired with analogic cameras, except the 2014 ones: the frames of 1944, 1955, 1977, and 1999 were digitized using the Wehrli Raster Master RM2 photogrammetric scanner at 1000 dpi (for the 1944 ones at 1200 dpi); the 1933, 1949, 1962, and 1969 images were available from IGMI, while the photographs of the 1983, 1990, and 2008 surveys from the Veneto Region were at 800 dpi. The most recent survey of 2014 was performed using a Vexcel UltraCam-Xp digital camera with a pixel size of 6 μm; all these data provide ground sample distance (GSD) between 30 and 80 cm for all images used here. These resolutions are more than adequate to detect the coastline, thanks to the uncertain ground–sea transition, frequent in the coastal areas of the delta [44]. The main characteristics of the aerial photogrammetric surveys are listed in Table 1.
The aerial photogrammetric surveys from 1955 to 2014 show stereoscopic coverage of the ground, while those from 1933, 1944, and 1949 partially show the same coverage: processing of the latter data was only possible to generate the photo-plan mosaic of the area, without 3-D representation.

3.1.3. LiDAR Data

LiDAR surveys in PRD coastal area, outside the levees, were carried out in 2006, 2009, 2012, and 2018 to monitor sand islets, which are storm surge barriers and protect the levees from erosive action of sea waves motion. LiDAR data, together with ortho-images acquired simultaneously (with GSD of 20 cm), are available at the Veneto Region (Unità di Progetto per il Sistema Informativo Territoriale e la Cartografia and Unità Organizzativa Genio Civile di Rovigo) and the Local Authority of “Parco Regionale Veneto del Delta del Po”.
The surveys were performed from March to September using Optech sensors and georeferencing the 3D acquired points using an integrated GNSS/INS (Inertial Navigation System) system; to increase information in the ground-sea transition area, surveys were carried out during low tide elevation, and with altitude of about 1500 m.
Acquired data cover portions of the eastern PRD coast from the Adige river mouth to the border between Veneto and Emilia Romagna Regions, with a width that only in the last survey covers most of the areas acquired by the aerial photogrammetric surveys (Table 2). Ellipsoidal elevation of the acquired points was converted into orthometric using the geoid model grids provided by the IGMI.

3.2. Methods for the Coastline Changes Evaluation

3.2.1. Aerial Photogrammetric Images Orientation and Coastline Restitution

In a previous paper [44], analyzing the aerial photogrammetric surveys performed in the PRD in 1944, 1955, 1962, 1977, 1999, 2008, and 2014, the same used herein, we described in detail the procedures adopted for (i) external orientation of photogrammetric images using GCPs (ground control points, measured with the GPS technique for the orientation of the most recent surveys, and transferred from the oriented photogrammetric models in order to orientate the oldest images, with the correction of elevation due to the land subsidence occurred in the analyzed periods, based on rates values available in literature); (ii) evaluation of the horizontal co-registration of the extracted photogrammetric models; (iii) coastline restitutions taking into account the tide elevation value referred to the period in which the archival photogrammetric surveys were performed; (iv) emerged surfaces balance and accuracy, with the definition of the nine sub-areas outside to the levees (red dashed lines in Figure 1: sub-areas with borders defined by levees and river banks were chosen, due to the fluvial stability in the multi-temporal analysis; therefore, surface variations depend only on natural and/or anthropic causes, without the influence of the levees; emerged surfaces were measured within each sub-area), using a procedure based on the restitution of the coastline performed by five different operators, to evaluate the accuracy of the computed emerged surfaces and analyze the variations over time of the areas (for more details see [44]).
The same procedures were applied to study the other aerial photogrammetric surveys used here (1933, 1949, 1969, 1983, and 1990).

3.2.2. Co-Registration between Archival Cartographic and Photogrammetric Data

Similarly to the co-registration procedure between the different aerial photogrammetric surveys, the cartography of 1911–1924 was aligned with the photogrammetric data using the coordinates of new points, clearly visible on the 1955 images and map, located in presumably stable areas, manually measured on the photogrammetric model of 1955 (reference model for the orientation of the 1933, 1944, and 1949 surveys) from stereoscopic views and used as GCPs for georeferencing the archival cartography (15 GCPs). Subsequently, restitution of the 1911 and 1924 coastlines was performed in the same reference system of the photogrammetric data (Gauss–Boaga Italian reference system).
The horizontal co-registration between cartographic and photogrammetric data was evaluated by measuring and comparing 2-D coordinates of 18 natural and/or artificial clearly visible points both on the 1911–1924 map and the subsequent photogrammetric model.

3.2.3. Emerged Surfaces Computation from LiDAR Data

LiDAR data, acquired using GPS/INS systems, are aligned with the cartographic and photogrammetric surveys from inception. Evaluation of co-registration was carried out measuring homologous natural and/or artificial 3-D points both on LiDAR datasets and the photogrammetric model of 2014 (due to small GSD, Table 1), clearly visible on the two surveys and located in stable areas.
Vertical co-registration between LiDAR surveys can be checked, also comparing the acquired data on stable areas: in this way, involving a large amount of points, more significant statistic parameters can be obtained.
LiDAR data are useful to generate DTMs (digital terrain models) [45,46] of the surveyed areas: from each model, the 0 level contour line can be extracted; this contour line is checked using the ortho-rectified images of the area and manually corrected where the automatic contour level did not follow the coastline visible on the ortho-images, due to outliers that can generate artifacts in the interpolation of the 3-D points, frequent in the ground–sea transition areas. Due to the different coverage of the multi-temporal LiDAR data (Table 2), the comparisons are performed only in common portions, using the boundaries of the more limited survey in the multi-temporal analysis. Finally, the emerged surfaces are computed and compared using the corrected 0 level contour lines for each of the eight sub-areas that subdivide the PRD coastal zone (LiDAR data are limited to the Veneto region: sub-area 1, in the Emilia Romagna region, was not surveyed).

3.2.4. Scenario of Emerged Surfaces by 2100

The DTMs obtained from the LiDAR surveys can be used to perform a prevision of the emerged surfaces outside to the levees in 2100, taking into account SLR and land subsidence values in the analyzed area projected to 2100 [47,48,49]. These phenomena, which proceed in opposite directions, (i) increase the flooding risks of the PRD due to the decrease in the safety margin between the top of the levees and the mean sea level and (ii) could increase the levees instability due to the reduction of the sandy cords (emerged surfaces) that protect themselves from the erosive action by the sea waves motion.
Projection by 2100 for PRD area was performed by [21] and [50] taking into account several SLR prevision models and considering the contribution of isostasy and tectonics: [50], assuming isostasy and tectonic rates of −1.5 mm/year in the study area, provides RSLR for the year 2100 between 315 mm (lower impact scenario IPCC—Intergovernmental Panel on Climate Change—2007 B1, +180 mm, www.ipcc.ch) and 1535 mm (higher impact scenario [51], +1400 mm); [21], using isostasy rates of −0.21 mm/year and tectonic vertical movements of −0.95 mm/year for the analyzed area, provides RSLR scenario by 2100 between 594 and 999 mm for IPCC 8.5 [52] minimum and maximum, respectively, and maximum of 1395 mm for [51].

4. Results

4.1. Data Processing and 3-D Models Extraction

Following the procedures described in a previous paper [44], natural GCPs, measured in 2008 with GPS technique, were used to generate the photogrammetric model related to the data acquired in that year with the Socet Set (SoftCopy Exploitation Tool Set) software.
The same GCPs, after the correction of elevations, were used to extract the photogrammetric models of the 2014, 1999, 1990, 1983, and 1977 surveys, obtaining residuals in the order of some tens of centimeters (up to 0.50 m). The oldest data (1933, 1944, 1949, 1955, 1962, and 1969) were processed using GCPs measured on the 1977 model, correcting elevations until 1955 images (1933, 1944, and 1949 have no stereoscopic coverage) to refer the coordinates at the same time as the flights: in these cases, the photogrammetric models were extracted with residuals of about 0.8–1 m. New points, clearly visible both on the photogrammetric model of 1955 and on the cartography of 1911–1924, were measured with stereoscopic devices and used as GCPs (2-D) for the co-registration of the map in the Gauss–Boaga Italian reference system: the obtained result, with residuals of about 2.4–2.8 m, is shown in Figure 3.
2-D GCPs were used to generate the photo-plan mosaic of 1933, 1944 (Figure 4, with lack of images on the study area, more for the 1944 ones), and 1949 (Figure 5, with complete planimetric coverage) surveys.
Starting from the photogrammetric model, a DEM (Digital Elevation Model) with a grid size of 5 m was extracted automatically for each survey acquired with stereoscopic coverage (from 1955 to 2014) [53]; subsequently, using stereoscopic viewing devices, correction of the DEMs in the areas where automatic correlation failed (mainly in lagoons, due to the sunlight reflected from the water) was performed, adapting the contour lines to the real ground morphology. Thus, an orthophoto with a GSD of 1.5 m was generated automatically (Figure 6, Figure 7 and Figure 8).
LiDAR datasets were used to generate DTMs of the surveyed area: from each acquisition, the last return of the laser beam was used together with procedures for objects/vegetation filtering, and data were gridded with a regular size of 1 m. Finally, four multi-temporal DTMs (2006, 2009, 2012, and 2018) were obtained (Figure 9).

4.2. Co-Registration Accuracy

Co-registration between photogrammetric models and photo-plans (including the cartography of 1911–1924) was checked, measuring and comparing 2-D coordinates of natural homologous points in the multi-temporal series. The alignment between the cartography and the photogrammetric data should be checked with the first available photo-plan (1933): unfortunately, the lack of a significant number of common points clearly visible in the two subsequent datasets, due to the limited ground coverage both for the 1933 and 1944 surveys, has required the evaluation of the data co-registration using the first aerial photogrammetric survey with significant coverage, that is, the 1949 one. Table 3 lists the results of comparisons.
The standard deviation values of Table 3 show peaks of about 2 m in the comparison between photogrammetric data; this is also the level of expected accuracy for proper restitution of the coastline, mainly in the ground–sea transition area, due to waves’ motion on the beach: more precise data are not necessary for the objectives of this study. Higher values (greater than 3 m) are obtained in the comparison with the archival cartographic data: it is worth noting that in this case the area was surveyed with classical topographic methods for which there is no information about the procedures adopted for tracing the ground–sea line; here, the decision-making component should be added to the co-registration accuracy linked to the restitution choices made by the operators that, at present, cannot be quantified.
The same approach was used for the co-registration check of the LiDAR data: the alignment was verified by identifying and measuring coordinates, in the multi-temporal series of the four surveys, of clearly visible homologous points located in stable areas, like corners of buildings and flat roofs, piers, artifacts, etc. The co-registration between LiDAR and photogrammetric data was checked using the 2014 survey, the most recent and characterized by small pixel size (Table 1). Results of comparison are shown in Table 4.
Table 4 shows standard deviation values greater than 0.5 m only when comparison involves the photogrammetric model of 2014: in the other cases, the values are reduced by more than 50%.
Moreover, the vertical co-registration between LiDAR data was checked, comparing the subsequent surveys on stable areas: due to the variability of the PRD coastal area and the small width that covers non-deformed portions and the data acquired in different periods of the year (which can also introduce changes in the development of vegetation), the availability of stable areas are very limited.
However, this comparison was carried out on about 300,000 points mainly located in the urbanized portions of Albarella island and Barricata village (Table 5).
Table 5 shows that, involving many points that provide a more robust statistic, the vertical co-registration of the LiDAR data is less than 25 cm, and in agreement with the comparison between the coordinates of the manually measured points (Table 4).

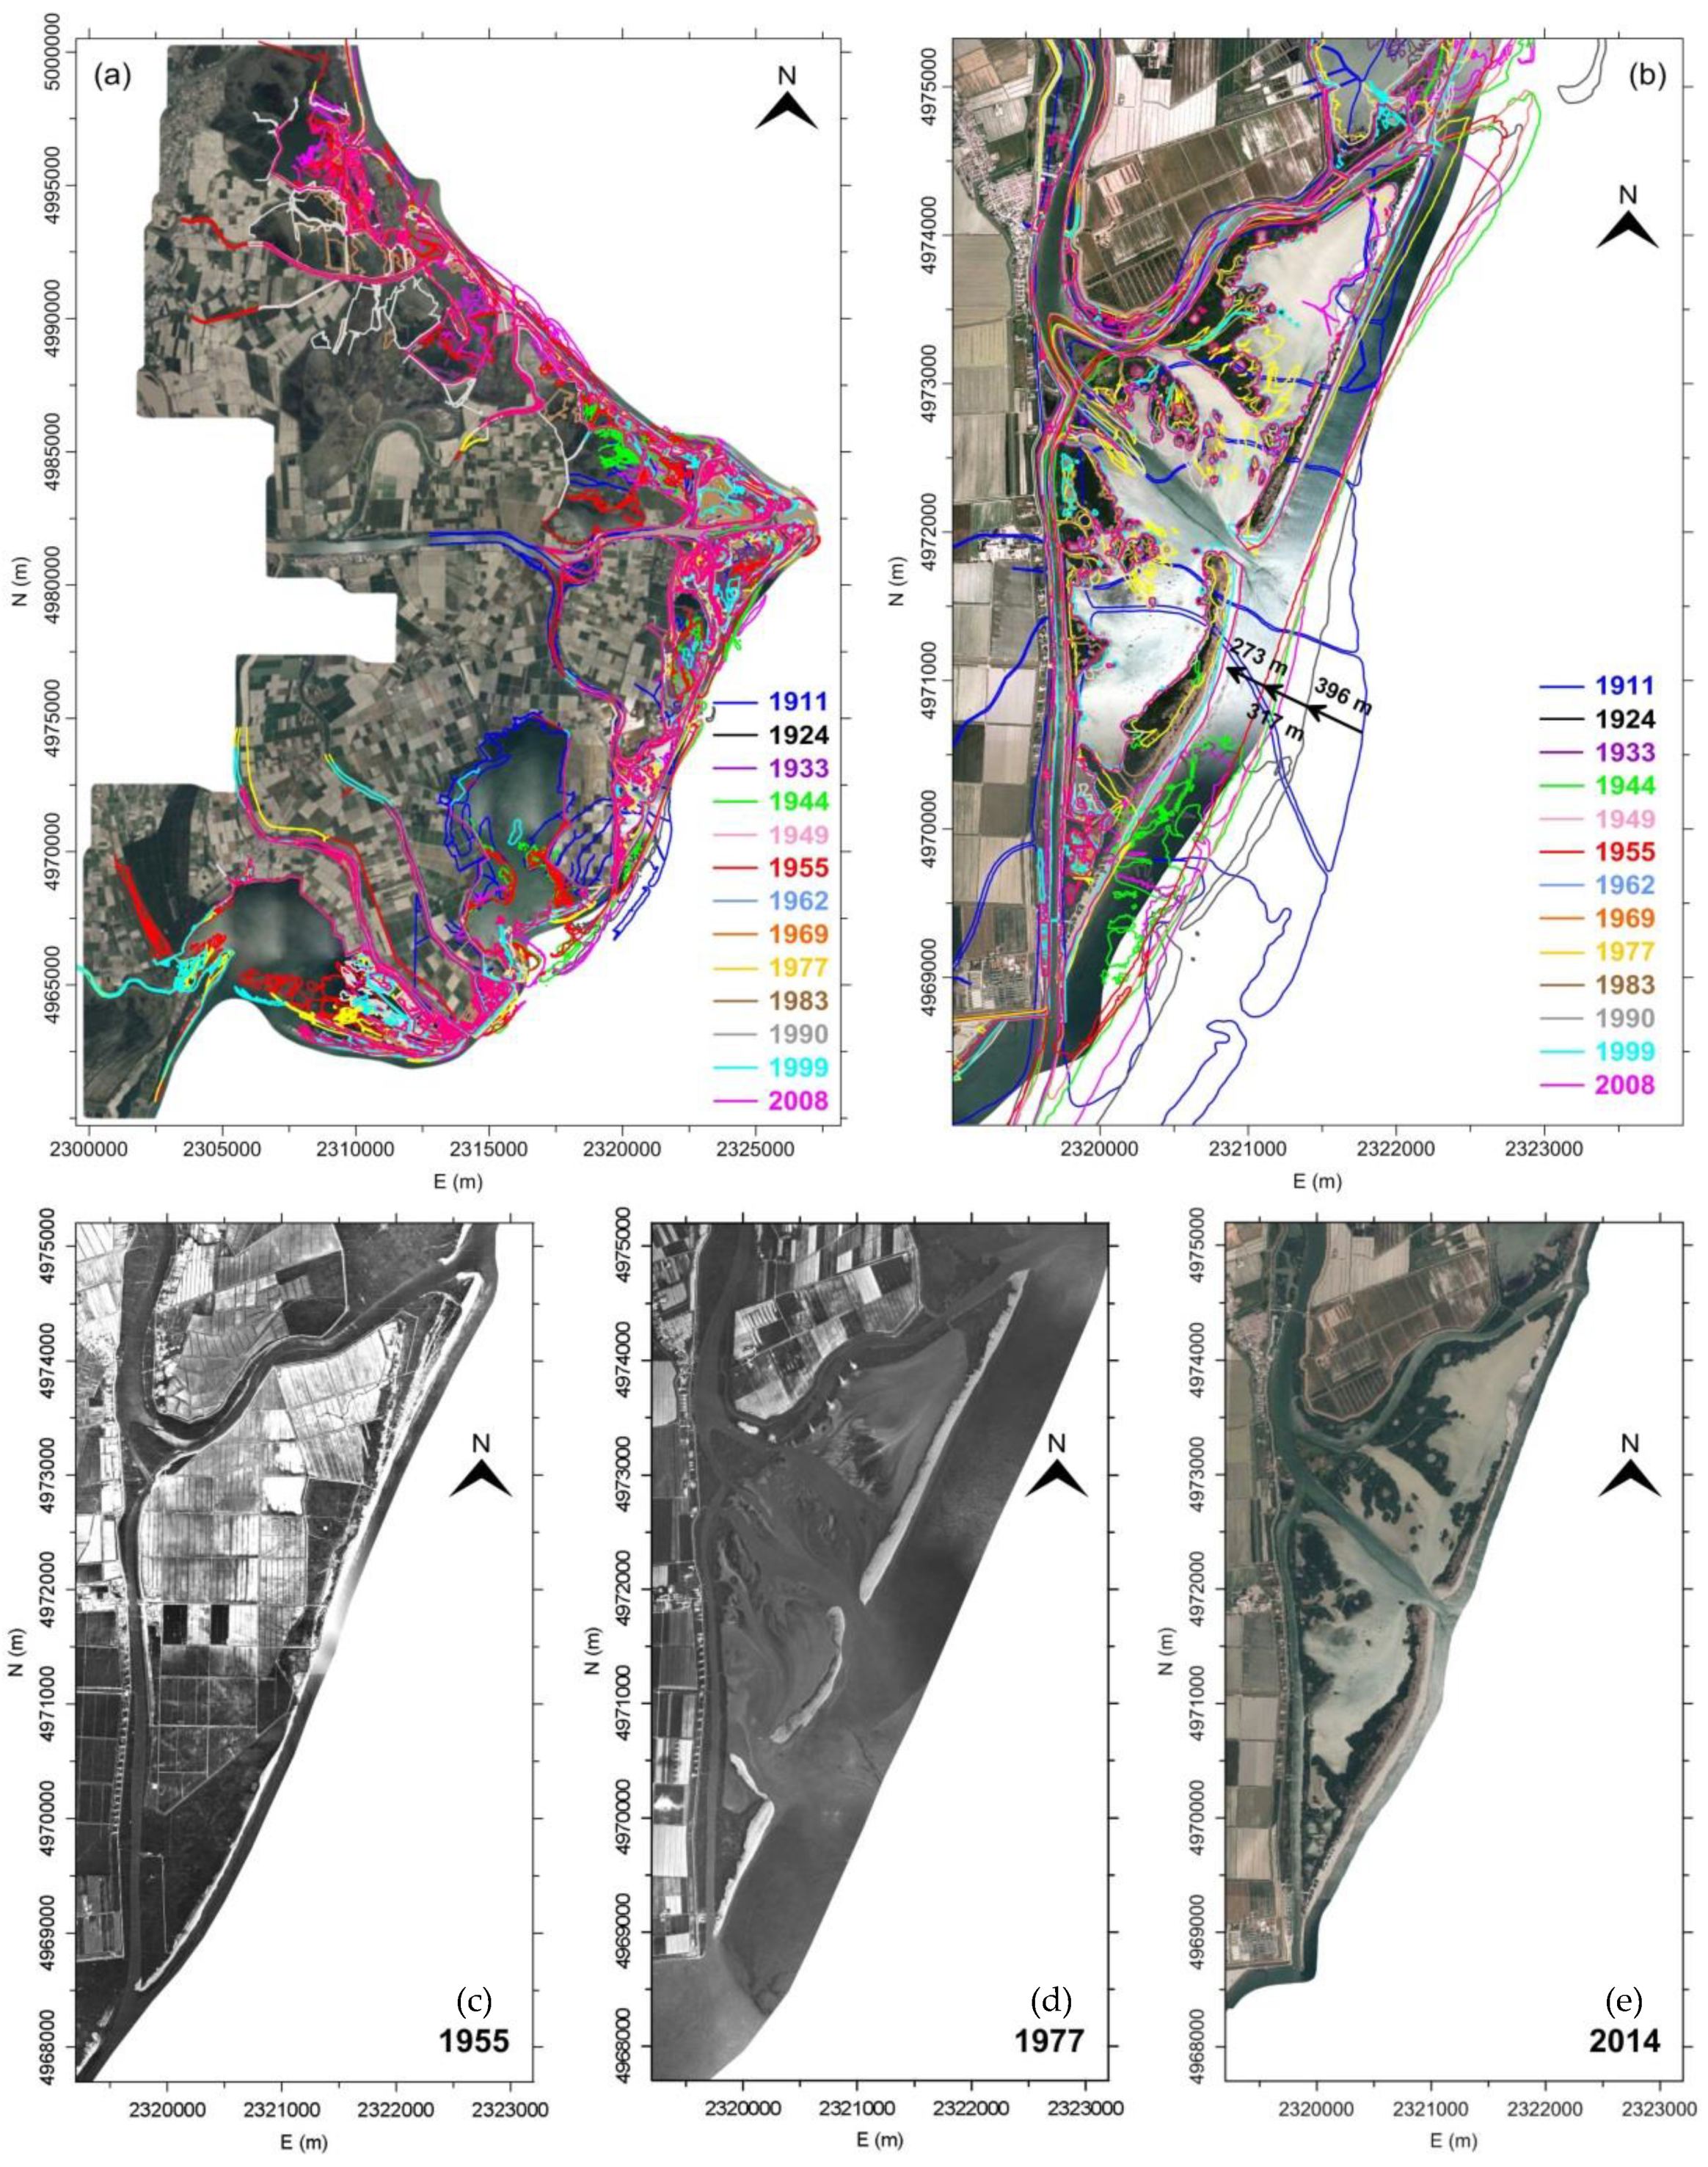
4.3. Coastline Restitutions and Changes Detection

Coastlines were drawn taking into account the tide levels (for details on the coastline restitution and analysis of accuracy see [44]: the same procedures are used here): this part of the study was performed only for the photogrammetric surveys of 1983, 1990, 1999, 2008, and 2014, due to the lack of tidal elevation data for the older surveys (no meaning for planimetric data such as photo-plans and cartographies), while the acquisition of LiDAR data was carried out at low tide (Table 2). Coastlines resulting from the 1911, 1924, 1933, 1944, 1949, 1955, 1962, 1969, 1977, 1983, 1990, 1999, and 2008 surveys were overlapped to the orthophoto extracted from the 2014 one (Figure 10).
Figure 10 shows significant changes in the coastline between the analyzed surveys. In particular, the greatest variations occurred at the beginning of the study period and between the 1950s and 1970s of the 20th century (the detail in Figure 10 shows the Bonelli Levante basin, sub-area 3, see Figure 1): while in the first case the changes were due to the land reclamation that took place in the area, which caused a disequilibrium in the coastal area and then in the coastline, in the last case, the great changes occurred during the most intense phase of methane-water pumping in the PRD, with a very high subsidence rate [23,24].
Using the DTMs obtained from LiDAR surveys, coastlines (derived from the 0 m contour level) were automatically extracted for each model and manually corrected on the basis of the ortho-rectified images acquired simultaneously with the LiDAR measurements: this was done to reduce errors due to the outliers in the acquired data and/or artifacts produced by the interpolation algorithm in the DTMs extraction. The final corrected contours are assumed to be the real coastline (0 m contour level).

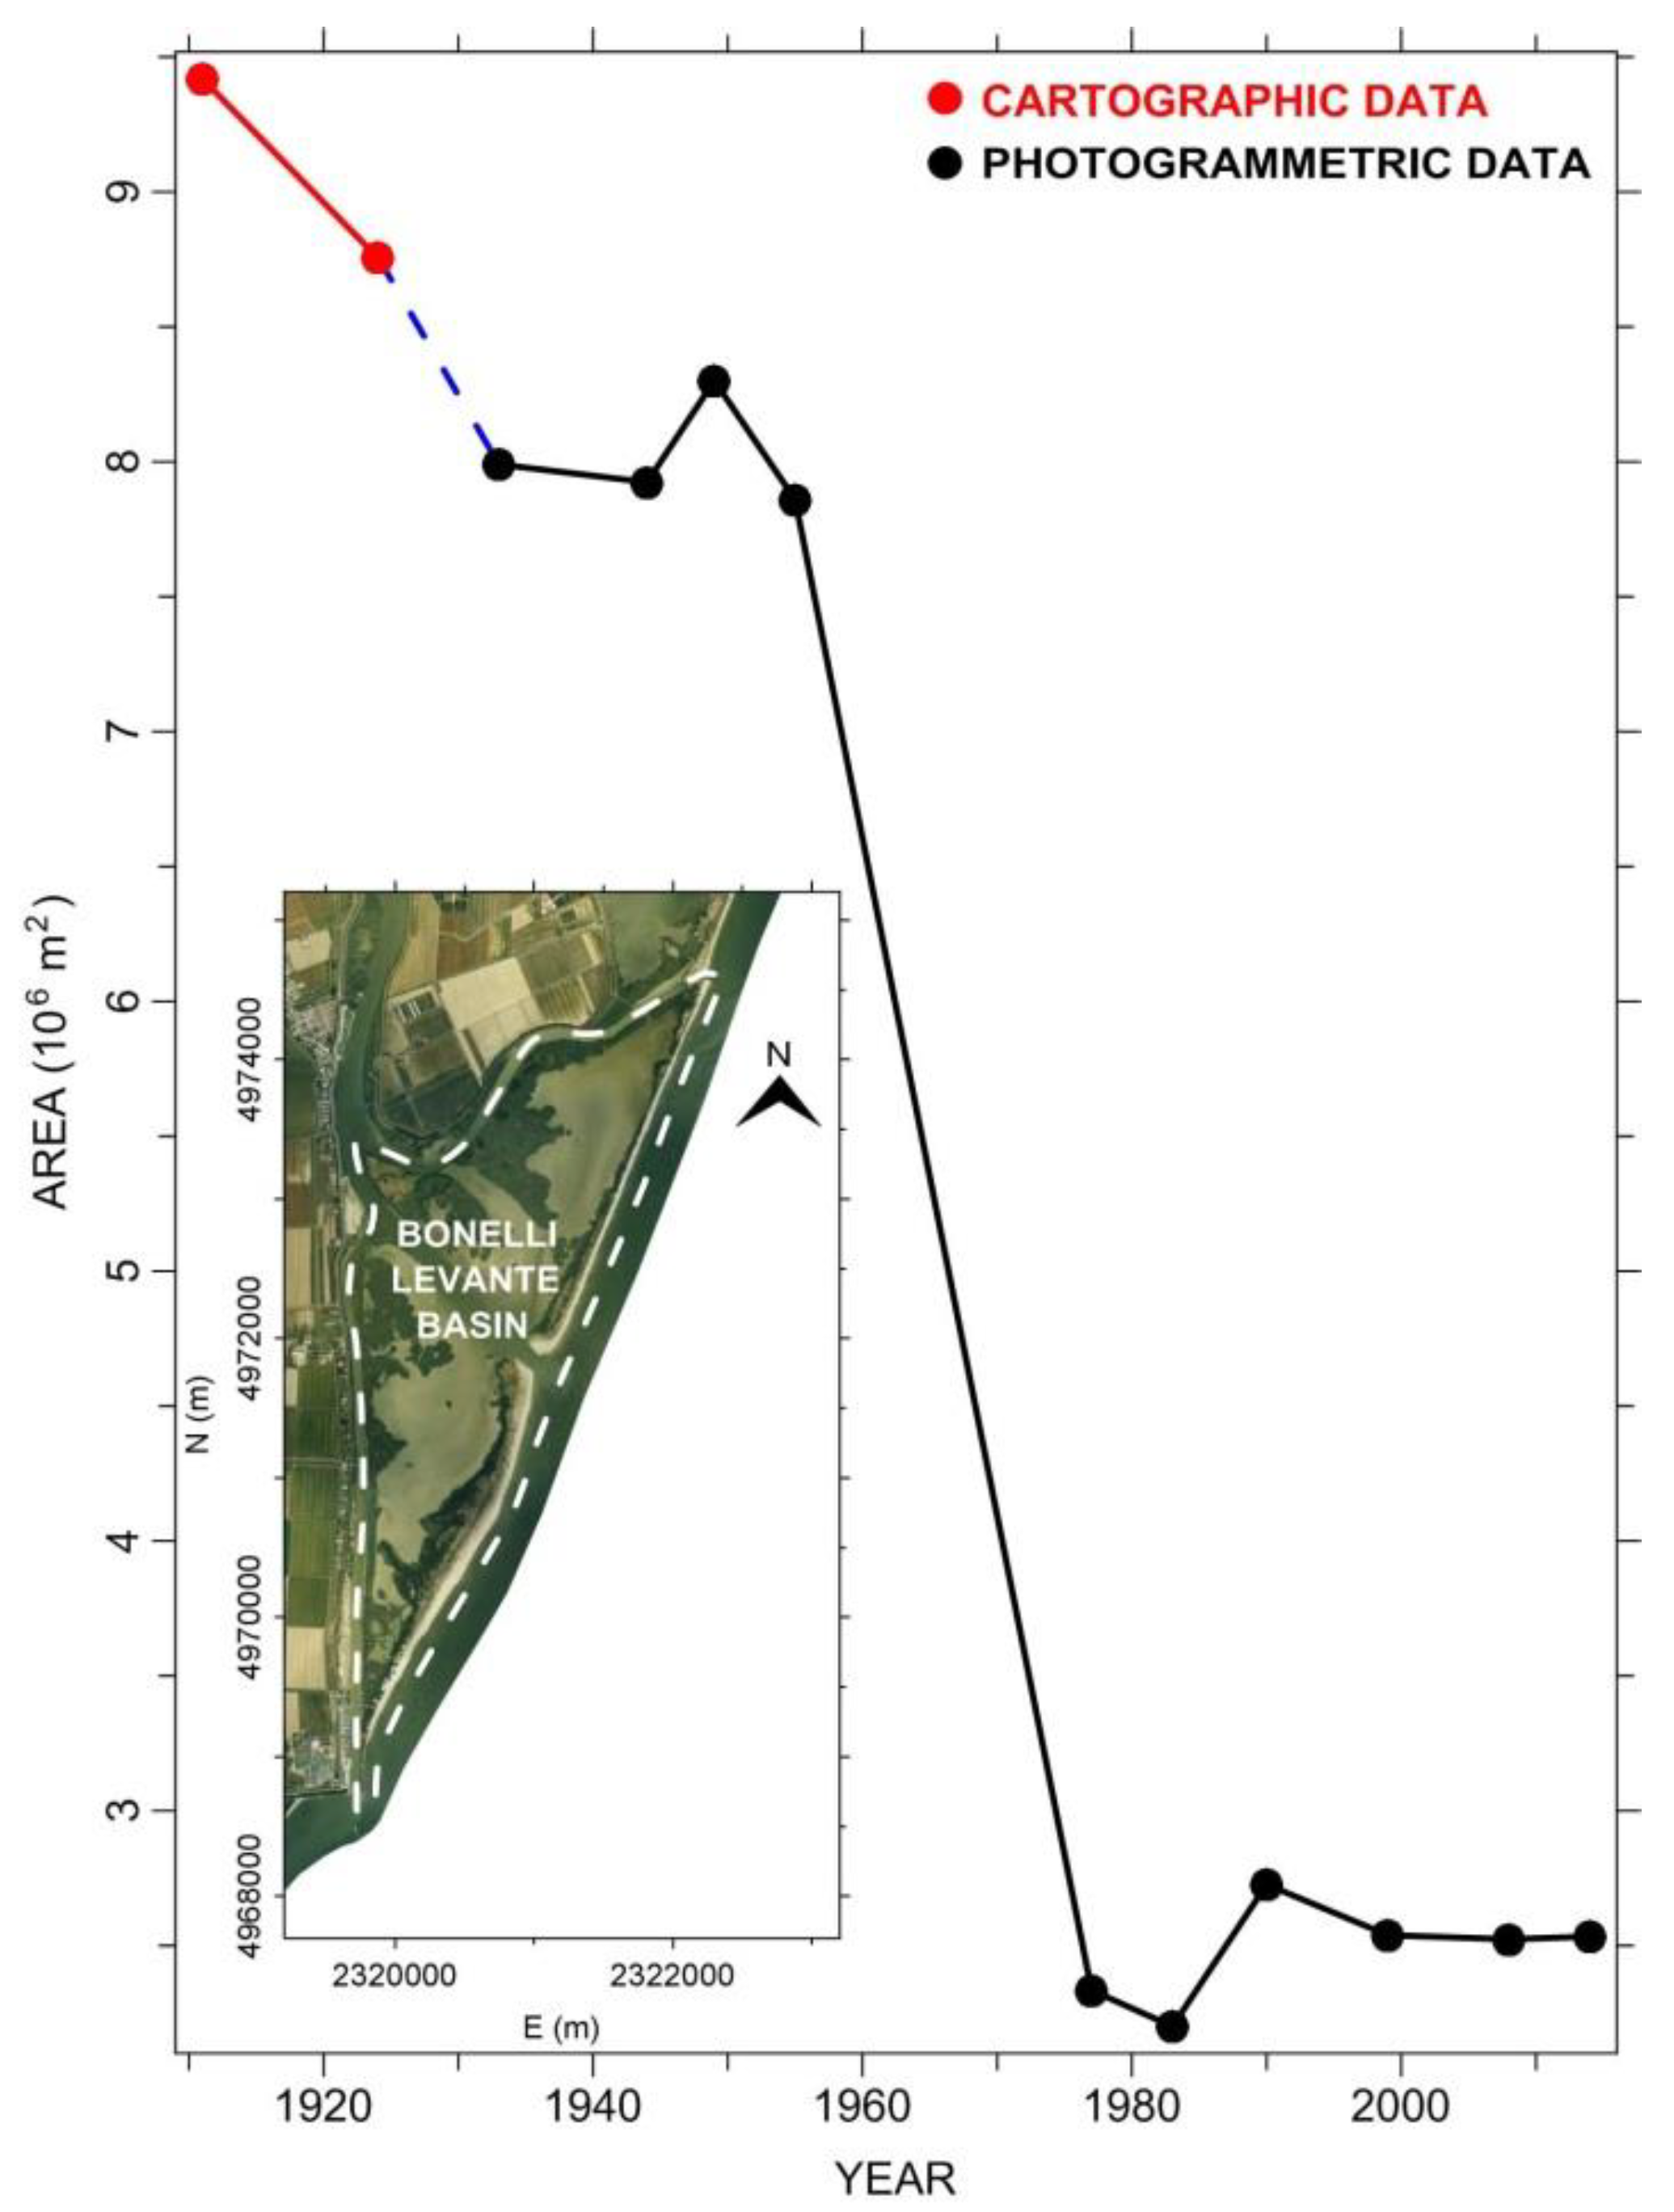
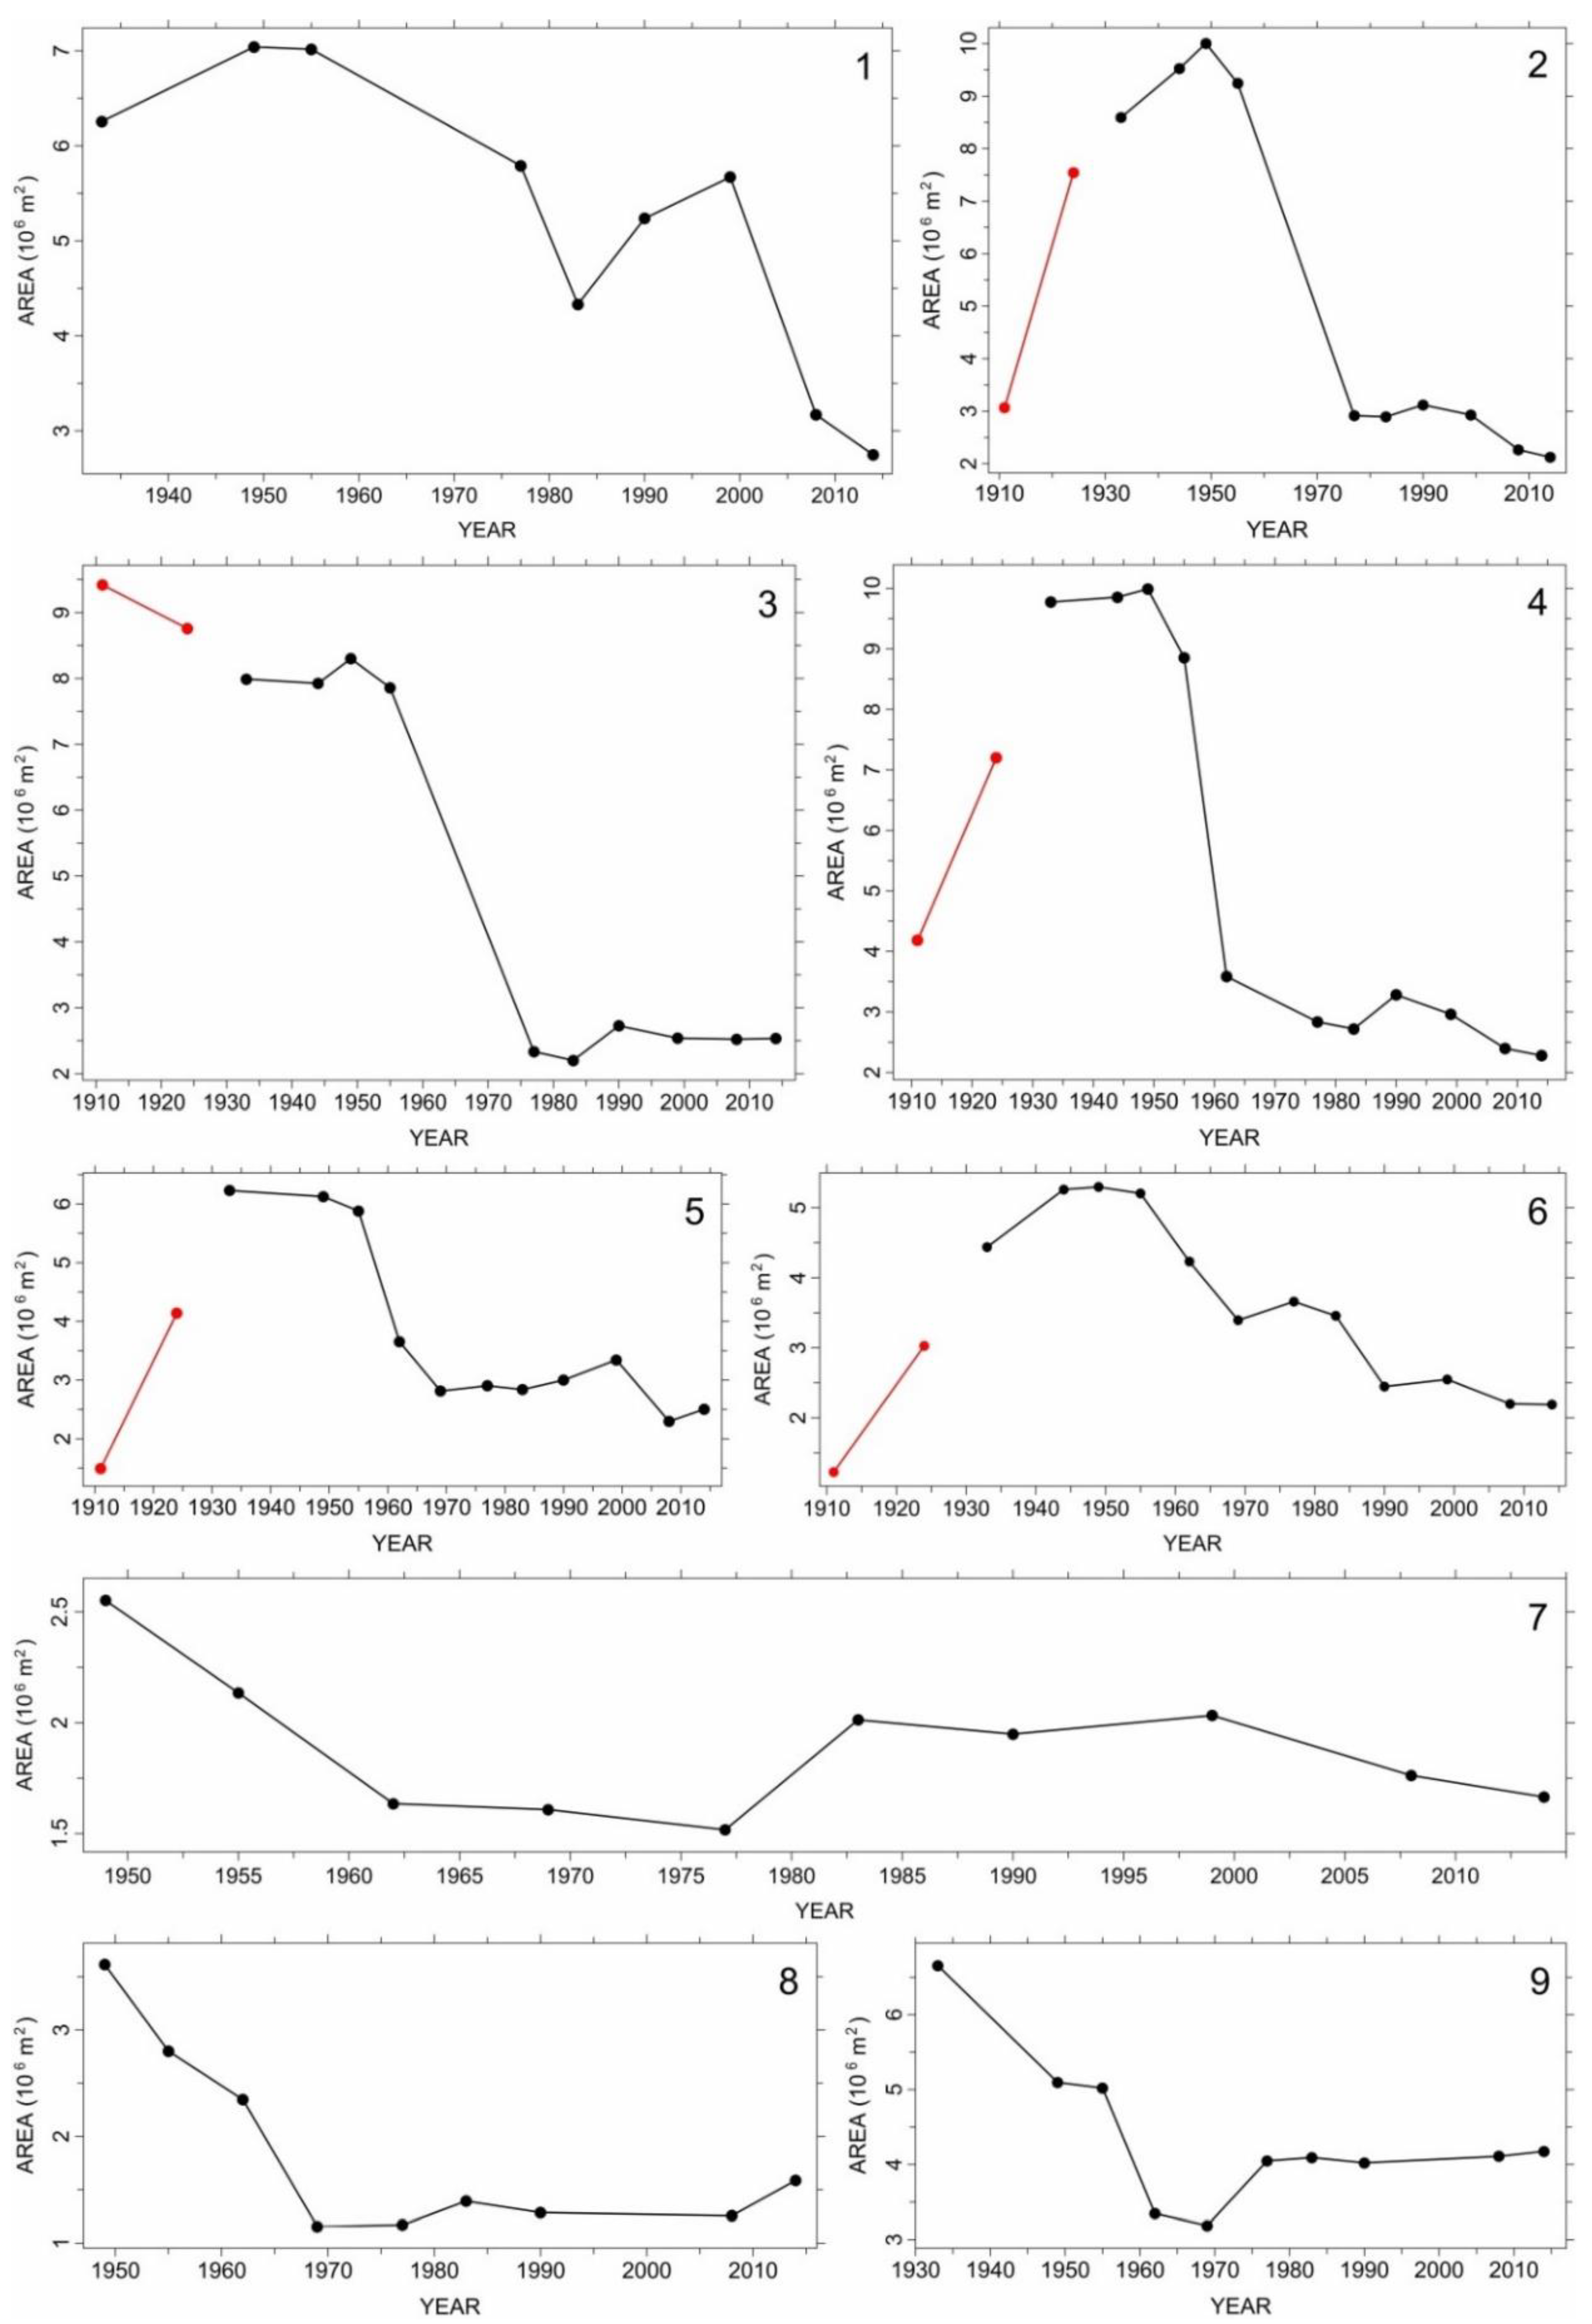
4.4. Sub-Aerial Surface Changes

Surface measurements were performed for the nine sub-areas, analyzing the data in time: Figure 11 shows the result for sub-area 3 of Figure 1 (and the detailed portion of Figure 10, the Bonelli Levante basin) using cartographic and photogrammetric data.
Analysis of Figure 11 shows four phases: after the first period (1911–1933), in which the area was significantly reduced, a stable trend was reached (1933–1955). Subsequently, due to the persistent land subsidence and after the freak storm of November 10, 1957 [30], Bonelli Levante basin was abandoned. This event was intercepted in the comparison between the 1955 and 1977 aerial photogrammetric surveys (Figure 10c,d). The 1957 event reduced the basin area from 7.86 to 2.17 Mm2 (millions of m2); in the latest analyzed surveys, the emerged area has reached a new equilibrium phase (Figure 11).
The progression of multi-temporal emerged surfaces measured in the 1911–2014 period (cartographic and photogrammetric data) for the nine sub-areas of Figure 1 is shown in Figure 12.
The trend of emerged surfaces in the analyzed period (1911–2018) requires the integration between photogrammetric and LiDAR data; even if it has been verified by the common reference system, this integration has two problems: (i) the coverage of LiDAR data, which, mostly, involved only small portions of the eight sub-areas relating to the photogrammetric and the cartographic surveys (Table 2) and (ii) the direct comparison of emerged surfaces between photogrammetric and LiDAR data that, in common areas, has provided significant discrepancies. The comparison was made, randomly, between the surfaces obtained from the 2008 (photogrammetry) and 2009 (LiDAR) surveys, and, more completely, between the surfaces of 2014 (photogrammetry) and 2018 (LiDAR, due to the greater coverage of this survey).
Differences range from 2% (sub-area 9) to 25% (sub-area 7), which only partially can be explained by the elapsed time between the surveys (it is worth noting that for sub-area 7 in the 2012–2018 period, using only LiDAR data, the variation of the emerged surface is about 16%). More likely, these large differences may be due to the difficult interpretation of the emerged surfaces performed by the operators in the restitutions of the coastline on the photogrammetric models, as explained in detail in [44]. For these reasons, photogrammetric and LiDAR emerged surfaces are analyzed separately.
From the LiDAR DTMs, the final obtained coastlines together with the common boundaries between the different surveys (common coverage between the multi-temporal data) were used to compute the emerged surfaces of the eight sub-areas of PRD: in Table 6 the differences are shown.

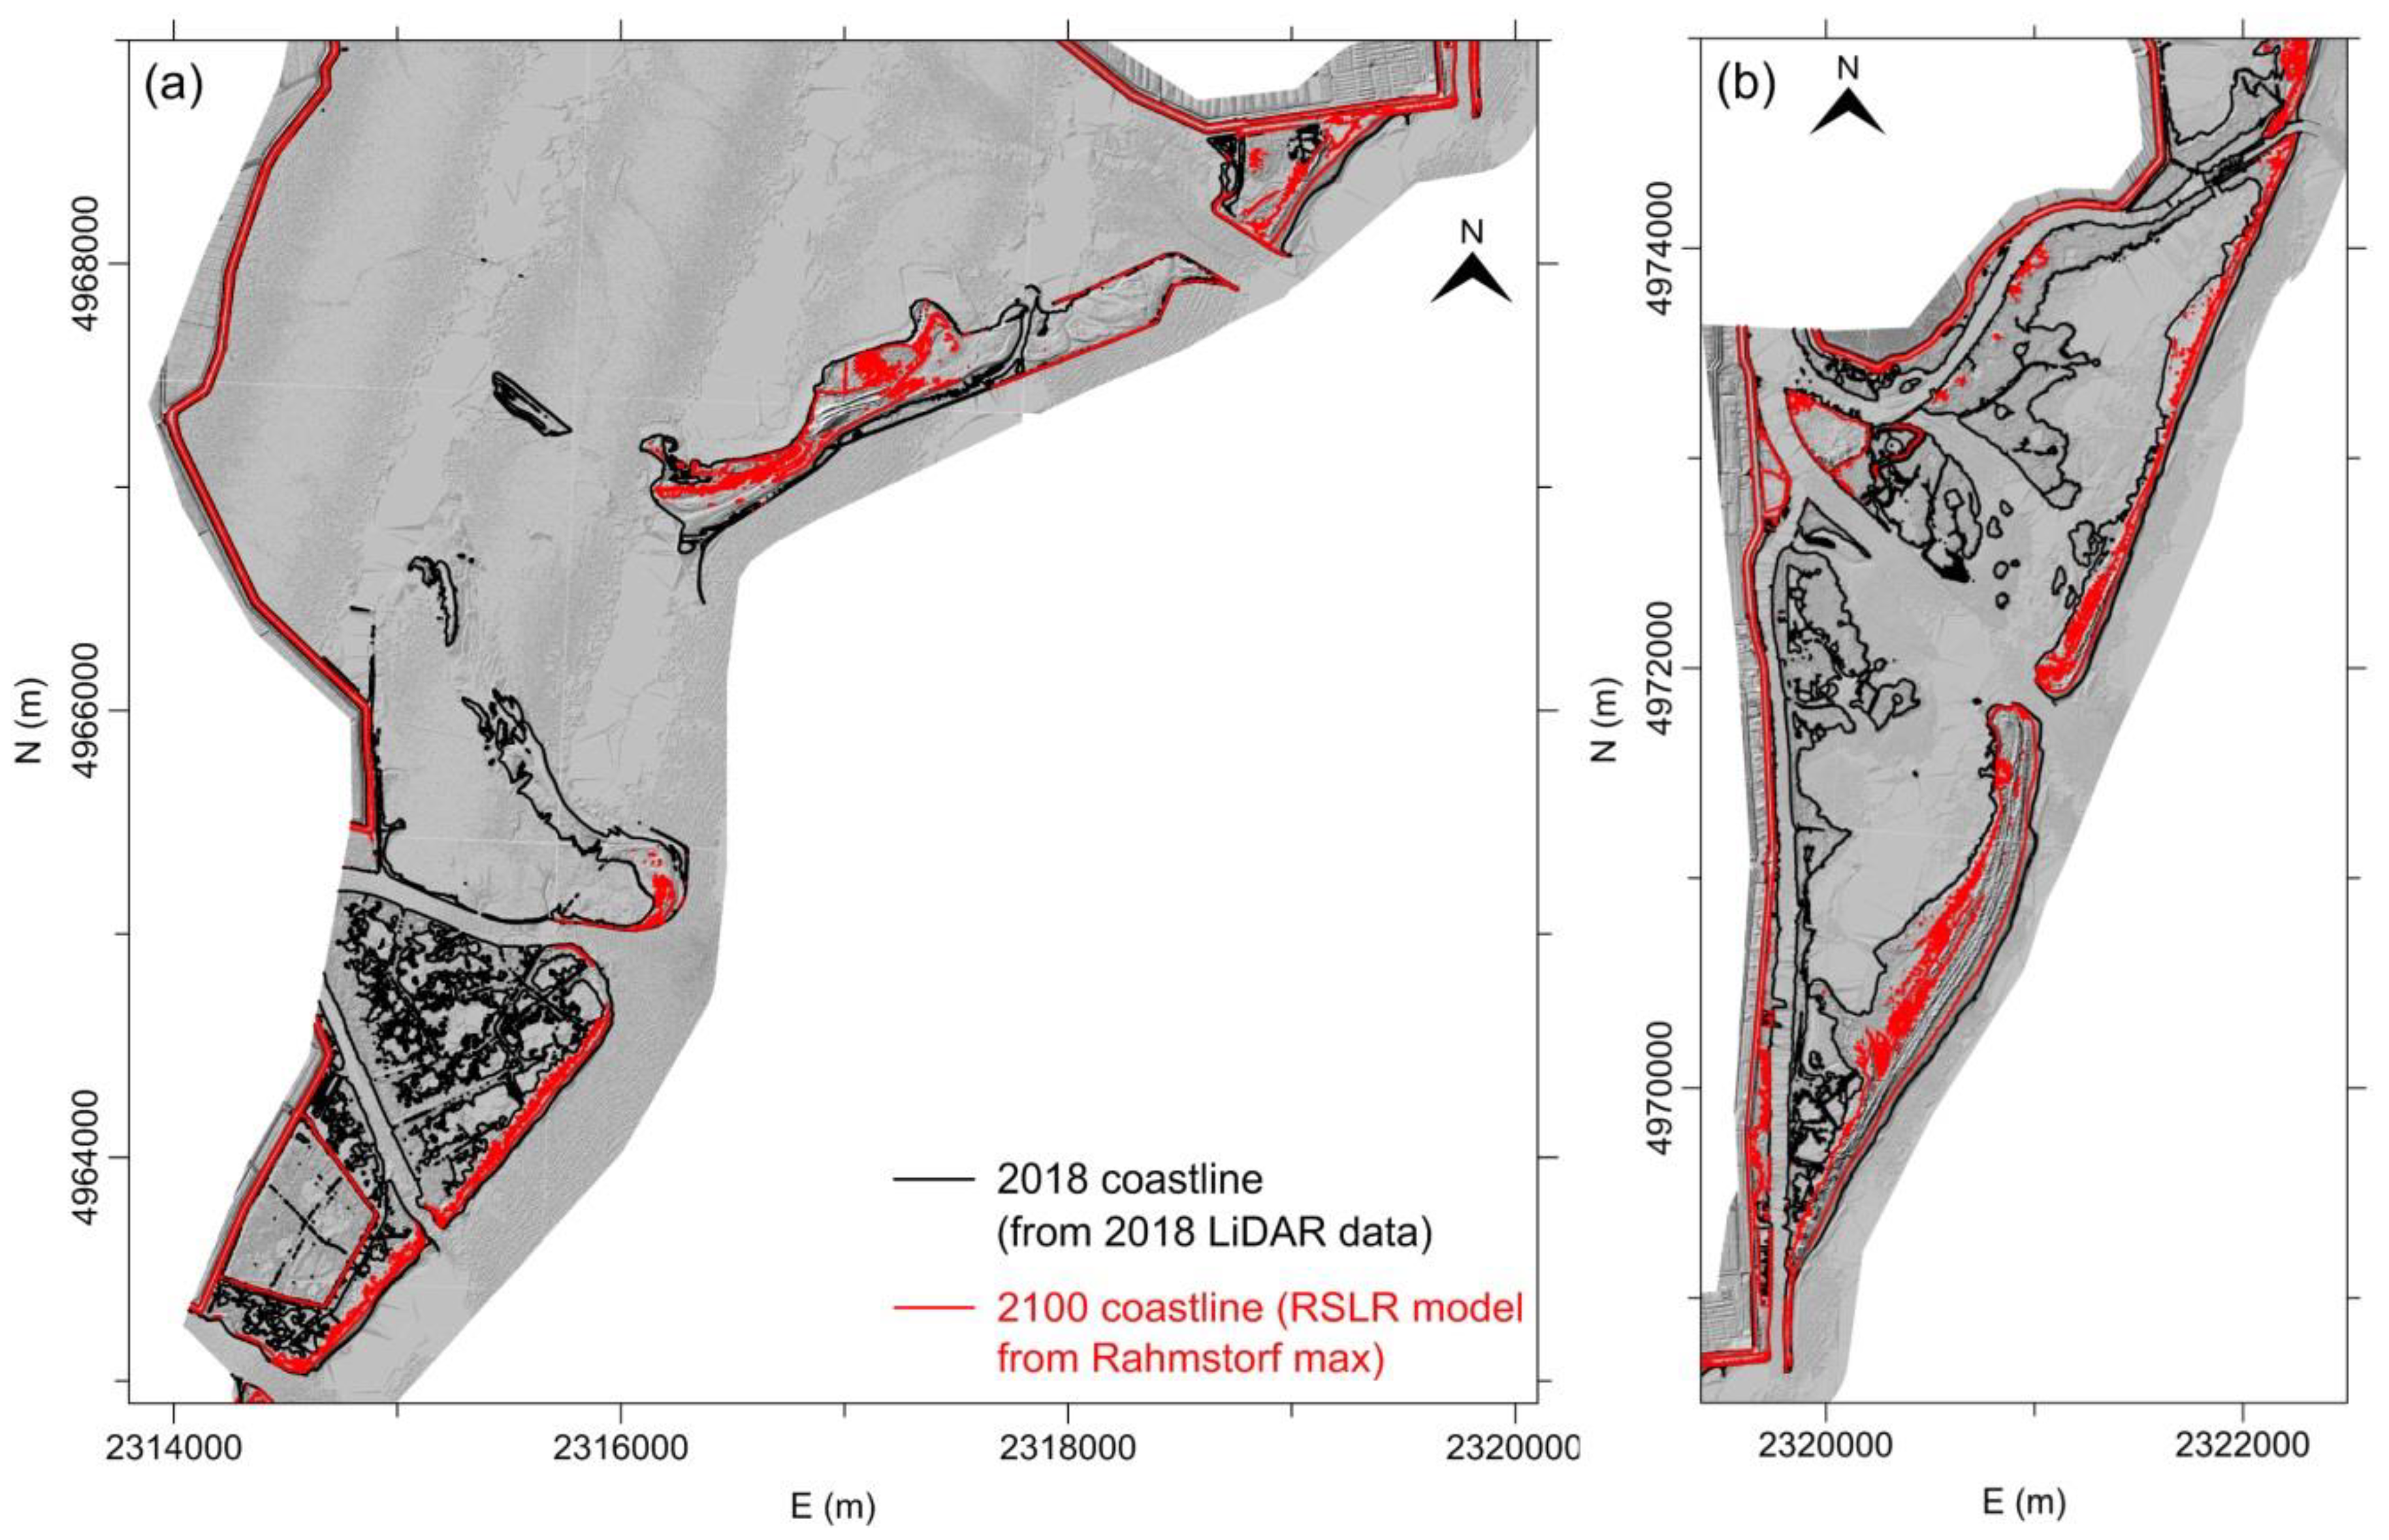
4.5. Prevision of Emerged Surfaces in 2100

The DTM of the latest LiDAR survey (2018), characterized by a large land cover compared to 2006, 2009, and 2012, is used to simulate the emerged surfaces by 2100 for the eight sub-areas analyzed here, based on the RSLR previsions with GIA (glacio(hydro)-isostatic adjustment) and tectonic movements provided by [21]. RSLR projections in 2100 for the IPCC 8.5 scenario minimum (594 mm) and maximum (999 mm) and for the maximum RSLR projection for the investigated area in 2100 based on the [51] model (1395 mm) were used. The contour levels relating to the three cases were extracted from the 2018 DTM (projected to 2100), and the emerged surfaces resulting from the coastlines prevision in 2100 were computed both for each model and sub-area.
Table 7 summarizes the obtained values, and Figure 13 shows the coastlines from the 2018 LiDAR DTM and those obtained using the most pessimistic model of RSLR by 2100 [51] for the most critical sub-areas 2 and 3.

5. Discussion

The changes of the emerged surfaces from 1911 to 2018 in PRD coastal area involved data were characterized by different precision: even if the cartographic products provide co-registration with the photogrammetric models in the order of some meters and the oldest photogrammetric data provide alignments greater than 1 m with each other (Table 3), the great changes of the emerged surfaces that took place up to the 1970s were identified with a rigorous approach that provided reliable computed surfaces. Figure 12 shows large deformations for the nine sub-areas analyzed here: for all the studied portions, the general trend shows an increase in the emerged surfaces (expansion of the delta) in the order of 0.87 Mm2/year up to 1933 (except sub-area 3); subsequently, a stability phase can be identified in the period 1933–1955 with rates of −0.02 Mm2/year (except sub-area 9), followed by a rapid decrease in the surfaces from 1955 to 1977 (rates of −1.22 Mm2/year, less evident in sub-area 7) and a new stabilization up to 2014 (with the exception of sub-area 1, Figure 12).
The different changes of the PRD coastal area are correlated to natural and anthropogenic factors: the increase in the emerged surfaces in the first analyzed period was caused by documented reclamation works that took place in the study area at the beginning of the 20th century [30]; it is worth noting that, given that the cartographic map of 1911–1924 was surveyed with classical topographical methods, during the period of the reclamation activities, with ponds, lakes, and lagoons probably located along the coastline, the description of the coastal area may not be very detailed. On the contrary, the restitution on the photogrammetric models provides a description of emerged surfaces with greater precision and detail. In the period 1955–1977, the strong reduction (in total −26.84 Mm2) occurred concurrently with the highest measured land subsidence (from 250 mm/year to 37.5 mm/year, as described in Section 2) and intercepted the storm surge event of November 10, 1957, which contributed to the loss of large areas of emerged surfaces, not only for sub-area 3, but also for portions 2 and 4 (Figure 12: this event has probably also contributed to changes in the other sub-areas analyzed in this study, because a great storm can be more devastating than the anthropogenic activities).
The general stabilization observed from 1977 to 2014 must be related to the accuracy of the aerial photogrammetric surveys (Table 3) combined with coastal works: using high-precision (Table 4 and Table 5) and high-resolution (Table 2) LiDAR data, acquired in low tide elevation and together with the ortho-rectified images, the definition of the coastline and then the computation of the emerged surfaces, is improved. In this context, the comparison between the emerged surfaces from LiDAR DTMs provides −0.17 Mm2 in the first period (2006–2009), +1.93 Mm2 in the second period (2009–2012), and +0.61 Mm2 in the 2012–2018 comparison (Table 6). The significant increase observed from 2009 to 2012 could be due to (i) the coastal works documented in the sub-areas [54] or (ii) the seasonal variations linked to the vegetation effects in the ground–sea transition area (mainly reeds that emerges from the water in some seasons that could be interpreted as emerged surfaces: survey of 2012 was carried out in September, while all the others were performed in spring, Table 2).
It is worth noting that the comparison between the 2006–2012 LiDAR data provides variation of the emerged surfaces of +1.76 Mm2, while the 2008–2014 ones, using the photogrammetric data (without the sub-area 1, not acquired by the LiDAR surveys), provide a difference of +0.25 Mm2: even if the ground coverage is different (wider for the photogrammetric data), the comparison period is only partially overlapped and the accuracy of the data is hardly comparable, the two techniques provide the same positive trend.
This increase in the emerged surfaces occurred together with land subsidence: [19], using SAR methodology from the A-DInSAR (Advanced-Differential Interferometric Synthetic Aperture Radar) method, processed ERS-1/2 (European Remote-Sensing, data from 10 May 1992, to 13 December 2000), ENVISAT (ENVIronmental SATellite, data from 17 March 2004, to 22 September 2010) and Sentinel-1A (data from 17 November 2014, to 17 May 2017) satellites images, providing land subsidence rates in the coastal area of PRD in the order of 1 cm along the LOS (line of sight) of the satellites. In the same period, using the linear trend, photogrammetric emerged surfaces (sub-areas from 1 to 6 due to the continuity of the data from 1992 to 2014–the 1999 photogrammetric survey does not cover sub-areas 7, 8, and 9, Figure 8) were reduced by 5.7 Mm2, matching the lowering of the ground with the loss of coastal areas also in the recent time span [44]. This result shows agreement between land subsidence rate and areas submerged by the sea, although they are also strongly influenced by the accuracy of the data, by human activities, and by the SLR, which increasingly exposes the area to the risk of widespread flooding.
However, the comparison between the more precise LiDAR data from 2009 to 2018 shows an opposite trend, with an increase in emerged surfaces occurring together with the land subsidence; this effect can be explained by taking into account the morpho-sedimentary processes active in the whole PRD complex [54], the different analyzed period (2009–2018 compared to 1992–2014), and the significant impact of anthropogenic activities: in fact, since the 90s, relevant hydraulic works were carried out in the PRD lagoons by local and regional authorities (in particular in sub-areas 2-Sacca degli Scardovari, 4-Sacca del Canarin, 5-Laguna Basson, 6-Laguna del Burcio, 7-Laguna di Barbamarco, and 8-Laguna Vallona, Figure 1) to improve the internal circulation of sea water, promoting an adequate change of lagoon water for fish farms aims that needed more efficient environmental hydraulic reorganization [30,55]: these works, necessary for the economic development of the area, have contributed to modified natural trend of emerged surfaces.
Changes in the emerged surfaces in PRD are also linked to the Adriatic Sea eustatism. Although the SLR values for the analyzed area are still limited (were quantified between 1.20 and 2 mm/year [40,41]), and therefore did not contribute significantly to the submersion of the coastal areas, different scenarios for the near future provide increasing values due to climate change. Table 7 shows the emerged surfaces by 2100 in PRD coastal area using data of the RSLR previsions derived from [21] and the 2018 LiDAR DTM projected to 2100: except the sub-area 9 (Albarella Island), all portions could be partially submerged with values from 19% (sub-area 5, IPCC 8.5 min) to 89% (sub-area 2, [51] max) of the current surface. In detail, the IPCC 8.5 min scenario could submerge 29% of the 2018 surface (higher value of 47% for sub-area 2), the IPCC 8.5 max up to 46% (higher value of 72% again for sub-area 2), and [51] max up to 60% of the current emerged surfaces. In this context, sub-area 2, the most important in the PRD coastal area for fish farms activities and, in general, the economic impact for the local population, could suffer the worst consequences (Figure 13).
It is worth noting that results of [21] were obtained by analyzing the CGPS (continuous GPS) observations of the Taglio di Po (TGPO) and Porto Tolle (PTO1) stations. Results obtained by [19] show an increase in land subsidence rates eastward, with values along the coastal area up to double of those related to CGPS stations. This effect, if confirmed in the next decades, could lead to an underestimation of the computed emerged surfaces by 2100.
The great reduction of the emerged surfaces and coastal elements could represent a serious problem in the study area: these portions are essential for the protection of the earthen levees from the erosive action by the sea waves motion; the disappearance of these elements exposes the defense infrastructures to the risk of breaks and/or collapses [56]. In addition, the reduction of the safety margin between the mean sea level and the top of the levees, in the order of 3–4 m at present day, will increase the frequency and extent of flooding and, in general, the overall hydraulic risk of the area.
For all these reasons, risk mitigation strategies in the PRD coastal area must be implemented in the next period, not only with the reinforcement and raising of the earthen levees, but also with activities that must protect and safeguard the emerged surfaces.

6. Conclusions

In this work, archival cartography, multi-temporal aerial photogrammetry, and LiDAR techniques together with available land subsidence rates values, tides elevation data, and RSLR previsions by 2100 were used to study the evolution of the emerged surfaces in PRD coastal area (an area affected by land subsidence, northern Italy), in the 1911–2018 period, and to perform different scenarios by 2100 for the first time.
LiDAR surveys acquired at low tide together with simultaneous ortho-images for the correction of the data in the land–sea transition allowed the extraction of the coastline with high resolution and accuracy in the order of a few tens of centimeters; on the other hand, using the aerial photogrammetric approach, it was possible to extend over time the analyzed area with precision in the restitution of the coastline, which depends on many factors, mainly the relative flight altitude and the resolution and quality of the images (more for archival photos); however, generally, only recent photogrammetric surveys can reach the accuracies of LiDAR data. In any case, the restitution of the coastline should be performed on the photogrammetric models (if stereoscopic acquisitions are available) extracted using a procedure that allows to correct the GCPs elevation according to the archival subsidence rates, to report the reference points to the time in which the aerial photogrammetric survey was carried out, and taking into account the tide elevation value at the time of images acquisition: this procedure allows the increase of the accuracy of the obtained coastline. Archival cartography, which does not permit the 3-D restitution, allows the further extension over time of the study with precision of the data that can deteriorate up to few meters, but is useful in many applications, such as for the study of the coastline modifications in flat areas.
Multi-temporal changes of the PRD coastal area outside the levees were detected by comparing the emerged surfaces of nine homologous sub-areas between the subsequent surveys. Results provided expansion of the Delta up to 1933, high contraction of the emerged surfaces from 1955 to 1977, simultaneously with the higher measured land subsidence rates together with the great storm surge event of 10 November 1957, and a new phase of slight expansion from 2009 to 2018, probably caused by anthropic works which took place in the study area. However, this positive progression of emerged surfaces could collide with the effects of the SLR previsions in near future due to the ongoing climate change: for the investigated area, assuming 594 and 999 mm (IPCC 8.5 min and max respectively) and 1395 mm [51] max of RSLR projection by 2100 with GIA and tectonic movements (www.ipcc.ch, [21,51], using the 2018 LiDAR DTM considered in the projections), the emerged surfaces outside the levees in PRD coastal area could be reduced, except for Albarella island, from 19% to 89% compared to the 2018 surface. These large losses could cause both breaks and/or collapses of the defense infrastructures, exposing the levees to the erosive activity of the sea waves, and the reduction of the safety margin between the mean sea level and the top of the levees (up to 35% of the 2018 value) implies that the investigated coastal area can become highly susceptible to marine inundation: for these reasons, risk mitigation actions must be adopted in the next years.
Finally, the method presented in this work for the PRD coastal area, which includes the integration between different types of data for the evaluation of emerged surfaces and projection scenarios by 2100 based on RSLR previsions, can be applied worldwide in other coastal areas expected to be affected by land subsidence and emerged surface variations also caused by the climate change effects.

Funding

This research was funded by the Department of Civil, Environmental, and Architectural Engineering of the Padova University (Italy) with the Projects “Integration of Satellite and Ground-Based InSAR with Geomatic Methodologies for Detection and Monitoring of Structures Deformations” and “High Resolution Geomatic Methodologies for Monitoring Subsidence and Coastal Changes in the Po Delta area”.

Acknowledgments

The Author would like to thank the “Unità di Progetto per il Sistema Informativo Territoriale e la Cartografia” and “U.O. Genio Civile di Rovigo” (Veneto Region) for the supply of aerial photogrammetric surveys of 1983, 1990, and 2008, and the LiDAR surveys of 2006, 2009, and 2012; the “Parco Regionale Veneto del Delta del Po” for supply of the 2018 LiDAR survey; and the students of the Civil and Environmental Engineering Courses of the Padova University for their contribution in data processing.

Conflicts of Interest

The author declare no conflict of interest.

References

  1. Ericson, J.P.; Vörösmarty, C.J.; Dingman, S.L.; Ward, L.G.; Meybeck, M. Effective sea-level rise and deltas: Causes of change and human dimension implications. Glob. Planet. Chang. 2006, 50, 63–82. [Google Scholar] [CrossRef]
  2. Brooks, B.A.; University of Hawaii; Bawden, G.; Manjunath, D.; Werner, C.; Knowles, N.; Foster, J.H.; Dudas, J.; Cayan, D.; Survey, U.G.; et al. Contemporaneous Subsidence and Levee Overtopping Potential, Sacramento-San Joaquin Delta, California. San Francisco Estuary Watershed Sci. 2012, 10, 10. [Google Scholar] [CrossRef] [Green Version]
  3. Wolstencroft, M.; Shen, Z.; Törnqvist, T.E.; Milne, G.A.; Kulp, M. Understanding subsidence in the Mississippi Delta region due to sediment, ice, and ocean loading: Insights from geophysical modeling. J. Geophys. Res. Solid Earth 2014, 119, 3838–3856. [Google Scholar] [CrossRef] [Green Version]
  4. Minderhoud, P.S.J.; Erkens, G.; Pham, V.H.; Bui, V.T.; Erban, L.; Kooi, H.; Stouthamer, E. Impacts of 25 years of groundwater extraction on subsidence in the Mekong delta, Vietnam. Environ. Res. Lett. 2017, 12, 064006. [Google Scholar] [CrossRef] [PubMed]
  5. Saleh, M.; Becker, M. New estimation of Nile Delta subsidence rates from InSAR and GPS analysis. Environ. Earth Sci. 2018, 78, 6. [Google Scholar] [CrossRef]
  6. Syvitski, J.P.M.; Kettner, A.J.; Overeem, I.; Hutton, E.W.H.; Hannon, M.T.; Brakenridge, G.R.; Day, J.W.; Vorosmarty, C.J.; Saito, Y.; Giosan, L.; et al. Sinking deltas due to human activities. Nat. Geosci. 2009, 2, 681–686. [Google Scholar] [CrossRef]
  7. National Research Council. Mitigating Losses from Land Subsidence in the United States; The National Academies Press: Washington, DC, USA, 1991; p. 58. [Google Scholar] [CrossRef]
  8. Yerro, A.; Corominas, J.; Monells, D.; Mallorquí, J.J. Analysis of the evolution of ground movements in a low densely urban area by means of DInSAR technique. Eng. Geol. 2014, 170, 52–65. [Google Scholar] [CrossRef]
  9. Costantini, M.; Ferretti, A.; Minati, F.; Falco, S.; Trillo, F.; Colombo, D.; Novali, F.; Malvarosa, F.; Mammone, C.; Vecchioli, F.; et al. Analysis of surface deformations over the whole Italian territory by interferometric processing of ERS, Envisat and COSMO-SkyMed radar data. Remote. Sens. Environ. 2017, 202, 250–275. [Google Scholar] [CrossRef]
  10. Hung, W.-C.; Hwang, C.; Chen, Y.-A.; Zhang, L.; Chen, K.-H.; Wei, S.-H.; Huang, D.-R.; Lin, S.-H. Land Subsidence in Chiayi, Taiwan, from Compaction Well, Leveling and ALOS/PALSAR: Aquaculture-Induced Relative Sea Level Rise. Remote. Sens. 2017, 10, 40. [Google Scholar] [CrossRef] [Green Version]
  11. Baldi, P.; Fabris, M.; Marsella, M.; Monticelli, R. Monitoring the morphological evolution of the Sciara del Fuoco during the 2002–2003 Stromboli eruption using multi-temporal photogrammetry. ISPRS J. Photogramm. Remote. Sens. 2005, 59, 199–211. [Google Scholar] [CrossRef]
  12. Baldi, P.; Cenni, N.; Fabris, M.; Zanutta, A. Kinematics of a landslide derived from archival photogrammetry and GPS data. Geomorphology 2008, 102, 435–444. [Google Scholar] [CrossRef]
  13. Fabris, M.; Baldi, P.; Anzidei, M.; Pesci, A.; Bortoluzzi, G.; Aliani, S. High resolution topographic model of Panarea Island by fusion of photogrammetric, lidar and bathymetric digital terrain models. Photogramm. Rec. 2010, 25, 382–401. [Google Scholar] [CrossRef]
  14. Mancini, F.; Dubbini, M.; Gattelli, M.; Stecchi, F.; Fabbri, S.; Gabbianelli, G. Using Unmanned Aerial Vehicles (UAV) for High-Resolution Reconstruction of Topography: The Structure from Motion Approach on Coastal Environments. Remote. Sens. 2013, 5, 6880–6898. [Google Scholar] [CrossRef] [Green Version]
  15. Huang, C.; Zhang, H.; Zhao, J. High-Efficiency Determination of Coastline by Combination of Tidal Level and Coastal Zone DEM from UAV Tilt Photogrammetry. Remote. Sens. 2020, 12, 2189. [Google Scholar] [CrossRef]
  16. Pesci, A.; Fabris, M.; Conforti, D.; Loddo, F.; Baldi, P.; Anzidei, M. Integration of ground-based laser scanner and aerial digital photogrammetry for topographic modelling of Vesuvio volcano. J. Volcanol. Geotherm. Res. 2007, 162, 123–138. [Google Scholar] [CrossRef]
  17. Pesci, A.; Teza, G.; Casula, G.; Fabris, M.; Bonforte, A. Remote Sensing and Geodetic Measurements for Volcanic Slope Monitoring: Surface Variations Measured at Northern Flank of La Fossa Cone (Vulcano Island, Italy). Remote. Sens. 2013, 5, 2238–2256. [Google Scholar] [CrossRef] [Green Version]
  18. Jaud, M.; Bertin, S.; Beauverger, M.; Augereau, E.; Delacourt, C. RTK GNSS-Assisted Terrestrial SfM Photogrammetry without GCP: Application to Coastal Morphodynamics Monitoring. Remote. Sens. 2020, 12, 1889. [Google Scholar] [CrossRef]
  19. Fiaschi, S.; Fabris, M.; Floris, M.; Achilli, V. Estimation of land subsidence in deltaic areas through differential SAR interferometry: The Po River Delta case study (Northeast Italy). Int. J. Remote Sens. 2018, 39, 8724–8745. [Google Scholar] [CrossRef]
  20. Anzidei, M.; Bosman, A.; Carluccio, R.; Casalbore, D.; Caracciolo, F.D.; Esposito, A.; Nicolosi, I.; Pietrantonio, G.; Vecchio, A.; Carmisciano, C.; et al. Flooding scenarios due to land subsidence and sea-level rise: A case study for Lipari Island (Italy). Terra Nova 2017, 29, 44–51. [Google Scholar] [CrossRef]
  21. Antonioli, F.; Anzidei, M.; Amorosi, A.; Presti, V.L.; Mastronuzzi, G.; Deiana, G.; De Falco, G.; Fontana, A.; Fontolan, G.; Lisco, S.; et al. Sea-level rise and potential drowning of the Italian coastal plains: Flooding risk scenarios for 2100. Quat. Sci. Rev. 2017, 158, 29–43. [Google Scholar] [CrossRef] [Green Version]
  22. Zambon, M. Abbassamento del Suolo per Estrazioni di Acqua e Gas: Deduzioni ed Indirizzi Logicamente Conseguenti per la Sistemazione del Delta del Fiume Po. In Proceedings of the 23nd National Conference on “Bonifiche”, Rome, Italy, 20 May 1967; pp. 345–370. [Google Scholar]
  23. Caputo, M.; Pieri, L.; Unguendoli, M. Geometric investigation of the subsidence in the Po Delta. Boll. Geofis. Teor. Appl. 1970, 47, 187–207. [Google Scholar]
  24. Caputo, M.; Folloni, G.; Gubellini, A.; Pieri, L.; Unguendoli, M. Survey and geometric analysis of the phenomena of subsidence in the region of Venice and its hinterland. Riv. Ital. Geofis. 1972, 21, 19–26. [Google Scholar]
  25. Bock, Y.; Wdowinski, S.; Ferretti, A.; Novali, F.; Fumagalli, A. Recent subsidence of the Venice Lagoon from continuous GPS and interferometric synthetic aperture radar. Geochem. Geophys. Geosystems 2012, 13, 03023. [Google Scholar] [CrossRef]
  26. Tosi, L.; Da Lio, C.; Strozzi, T.; Teatini, P. Combining L- and X-Band SAR Interferometry to Assess Ground Displacements in Heterogeneous Coastal Environments: The Po River Delta and Venice Lagoon, Italy. Remote. Sens. 2016, 8, 308. [Google Scholar] [CrossRef] [Green Version]
  27. Simeoni, U.; Corbau, C. A review of the Delta Po evolution (Italy) related to climatic changes and human impacts. Geomorphology 2009, 107, 64–71. [Google Scholar] [CrossRef]
  28. Carminati, E.; Martinelli, G. Subsidence rates in the Po Plain, northern Italy: The relative impact of natural and anthropogenic causation. Eng. Geol. 2002, 66, 241–255. [Google Scholar] [CrossRef]
  29. Carminati, E.; Martinelli, G.; Severi, P. Influence of glacial cycles and tectonics on natural subsidence in the Po Plain (Northern Italy): Insights from14C ages. Geochem. Geophys. Geosystems 2003, 4, 1–14. [Google Scholar] [CrossRef]
  30. Colombo, C.; Tosini, L. Sessant’anni di Bonifica Nel Delta del Po, 1st ed.; Papergraf S.p.a. Publisher: Padova, Italy, 2009; pp. 3–217. ISBN 978-88-87264-70-8. [Google Scholar]
  31. Borgia, G.; Brighenti, G.; Vitali, D. La Coltivazione dei Pozzi Metaniferi del Bacino Polesano e Ferrarese. Esame Critico della Vicenda. Ina Georisorse Territ. 1982, 425, 13–23. [Google Scholar]
  32. Bitelli, G.; Bonsignore, F.; Unguendoli, M. Levelling and GPS networks to monitor ground subsidence in the Southern Po Valley. J. Geodyn. 2000, 30, 355–369. [Google Scholar] [CrossRef]
  33. Baldi, P.; Casula, G.; Cenni, N.; Loddo, F.; Pesci, A. GPS-based monitoring of land subsidence in the Po Plain (Northern Italy). Earth Planet. Sci. Lett. 2009, 288, 204–212. [Google Scholar] [CrossRef]
  34. Tosi, L.; Teatini, P.; Strozzi, T.; Carbognin, L.; Brancolini, G.; Rizzetto, F. Ground surface dynamics in the northern Adriatic coastland over the last two decades. RENDICONTI Lince- 2010, 21, 115–129. [Google Scholar] [CrossRef]
  35. Cenni, N.; Viti, M.; Baldi, P.; Mantovani, E.; Bacchetti, M.; Vannucchi, A. Present vertical movements in Central and Northern Italy from GPS data: Possible role of natural and anthropogenic causes. J. Geodyn. 2013, 71, 74–85. [Google Scholar] [CrossRef]
  36. Gornitz, V. Sea-level rise: A review of recent past and near-future trends. Earth Surf. Process. Landforms 1995, 20, 7–20. [Google Scholar] [CrossRef]
  37. Carbognin, L.; Tosi, L. Interaction between Climate Changes, Eustacy and Land Subsidence in the North Adriatic Region, Italy. Mar. Ecol. 2002, 23, 38–50. [Google Scholar] [CrossRef]
  38. Carbognin, L.; Teatini, P.; Tosi, L. Eustacy and land subsidence in the Venice Lagoon at the beginning of the new millennium. J. Mar. Syst. 2004, 51, 345–353. [Google Scholar] [CrossRef]
  39. Carbognin, L.; Teatini, P.; Tomasin, A.; Tosi, L. Global change and relative sea level rise at Venice: What impact in term of flooding. Clim. Dyn. 2009, 35, 1039–1047. [Google Scholar] [CrossRef]
  40. Carbognin, L.; Teatini, P.; Tosi, L.; Strozzi, T.; Tomasin, A. Present relative sea level rise in the northern Adriatic coastal area. In Coastal and Marine Spatial Planning. Marine Research at CNR-Theme 3; Brugnoli, E., Cavarretta, G., Mazzola, S., Trincardi, F., Ravaioli, M., Santoleri, R., Eds.; CNR-DTA Publisher: Rome, Italy, 2011; pp. 1123–1138. [Google Scholar]
  41. Vilibić, I.; Šepić, J.; Pasarić, M.; Orlić, M. The Adriatic Sea: A Long-Standing Laboratory for Sea Level Studies. Pure Appl. Geophys. PAGEOPH 2017, 174, 3765–3811. [Google Scholar] [CrossRef]
  42. Antonioli, F.; De Falco, G.; Presti, V.L.; Moretti, L.; Scardino, G.; Anzidei, M.; Bonaldo, D.; Carniel, S.; Leoni, G.; Furlani, S.; et al. Relative Sea-Level Rise and Potential Submersion Risk for 2100 on 16 Coastal Plains of the Mediterranean Sea. Water 2020, 12, 2173. [Google Scholar] [CrossRef]
  43. Elias, P.; Benekos, G.; Perrou, T.; Parcharidis, I. Spatio-Temporal Assessment of Land Deformation as a Factor Contributing to Relative Sea Level Rise in Coastal Urban and Natural Protected Areas Using Multi-Source Earth Observation Data. Remote. Sens. 2020, 12, 2296. [Google Scholar] [CrossRef]
  44. Fabris, M. Coastline evolution of the Po River Delta (Italy) by archival multi-temporal digital photogrammetry. Geomat. Nat. Hazards Risk 2019, 10, 1007–1027. [Google Scholar] [CrossRef] [Green Version]
  45. Baldi, P.; Coltelli, M.; Fabris, M.; Marsella, M.; Tommasi, P. High precision photogrammetry for monitoring the evolution of the NW flank of Stromboli volcano during and after the 2002–2003 eruption. Bull. Volcanol. 2007, 70, 703–715. [Google Scholar] [CrossRef]
  46. Marsella, M.A.; Baldi, P.; Coltelli, M.; Fabris, M. The morphological evolution of the Sciara del Fuoco since 1868: Reconstructing the effusive activity at Stromboli volcano. Bull. Volcanol. 2011, 74, 231–248. [Google Scholar] [CrossRef]
  47. Vecchio, A.; Anzidei, M.; Serpelloni, E.; Florindo, F. Natural Variability and Vertical Land Motion Contributions in the Mediterranean Sea-Level Records over the Last Two Centuries and Projections for 2100. Water 2019, 11, 1480. [Google Scholar] [CrossRef] [Green Version]
  48. Anzidei, M.; Doumaz, F.; Vecchio, A.; Serpelloni, E.; Pizzimenti, L.; Civico, R.; Greco, M.; Martino, G.; Enei, F. Sea Level Rise Scenario for 2100 A.D. in the Heritage Site of Pyrgi (Santa Severa, Italy). J. Mar. Sci. Eng. 2020, 8, 64. [Google Scholar] [CrossRef] [Green Version]
  49. Scardino, G.; Sabatier, F.; Scicchitano, G.; Piscitelli, A.; Milella, M.; Vecchio, A.; Anzidei, M.; Mastronuzzi, G. Sea-Level Rise and Shoreline Changes Along an Open Sandy Coast: Case Study of Gulf of Taranto, Italy. Water 2020, 12, 1414. [Google Scholar] [CrossRef]
  50. Lambeck, K.; Antonioli, F.; Anzidei, M.; Ferranti, L.; Leoni, G.; Scicchitano, G.; Silenzi, S. Sea level change along the Italian coast during the Holocene and projections for the future. Quat. Int. 2011, 232, 250–257. [Google Scholar] [CrossRef]
  51. Rahmstorf, S. A Semi-Empirical Approach to Projecting Future Sea-Level Rise. Sci. 2007, 315, 368–370. [Google Scholar] [CrossRef] [Green Version]
  52. IPCC. Climate Change 2013: The Physical Science Basis. In Contribution of Working Group I to the Fifth Assessment Report of the Intergovernmental Panel on Climate Change; Stocker, T.F., Qin, D., Plattner, G.-K., Tignor, M., Allen, S.K., Boschung, J., Nauels, A., Xia, Y., Bex, V., Midgley, P.M., Eds.; Cambridge University Press: Cambridge, UK; New York, NY, USA, 2013; p. 1535. [Google Scholar]
  53. Fabris, M.; Pesci, A. Automated DEM extraction in digital aerial photogrammetry: Precisions and validation for mass movement monitoring. Ann. Geophys. 2005, 48, 57–72. [Google Scholar] [CrossRef]
  54. Bosman, A.; Romagnoli, C.; Madricardo, F.; Correggiari, A.; Remia, A.; Zubalich, R.; Fogarin, S.; Kruss, A.; Trincardi, F. Short-term evolution of Po della Pila delta lobe from time lapse high-resolution multibeam bathymetry (2013–2016). Estuar. Coast. Shelf Sci. 2020, 233, 106533. [Google Scholar] [CrossRef]
  55. Consorzio di Bonifica Delta del Po. Le Lagune del Delta del Po; Consorzio di Bonifica del Delta del Po: Rovigo, Italy, 2013; pp. 4–83.
  56. Özer, I.E.; Rikkert, S.J.H.; Van Leijen, F.J.; Jonkman, S.N.; Hanssen, R.F. Sub-seasonal Levee Deformation Observed Using Satellite Radar Interferometry to Enhance Flood Protection. Sci. Rep. 2019, 9, 2646. [Google Scholar] [CrossRef] [Green Version]
Figure 1. Location of PRD area in northern Italy, the river branches, the main villages, and subdivision of emerged surfaces outside the levees in nine sub-areas (red dashed lines): (1) Sacca di Goro; (2) Sacca degli Scardovari; (3) Bacino Bonelli Levante; (4) Sacca del Canarin; (5) Laguna Basson; (6) Laguna del Burcio; (7) Laguna di Barbamarco; (8) Laguna Vallona; (9) Isola di Albarella. Coordinates are in the Gauss–Boaga Italian reference system.
Remotesensing 13 00529 g001
Figure 2. Subsidence rate changes from 1950 to 2017 based on the available data [19,22,23,24,25,26,30,31,32,33,34,35].
Remotesensing 13 00529 g002
Figure 3. Coverage and alignment of the 1911 (in red)–1924 (in black) archival cartography (1:25,000 scale) in the Gauss–Boaga Italian reference system.
Remotesensing 13 00529 g003
Figure 4. Photo-plan mosaic of the 1933 and 1944 aerial photogrammetric surveys: coverage is restricted to the coastal area; some photographs on glass plates (1933) and on film (1944) were lost, producing lack of data in the planimetric representation; available aerial images are characterized by poor visibility.
Remotesensing 13 00529 g004
Figure 5. Photo-plan mosaic of the 1949 aerial photogrammetric survey: available images cover most of the PRD area in Veneto region and a portion of the Emilia Romagna region; visibility on aerial photographs increases, although not yet optimal.
Remotesensing 13 00529 g005
Figure 6. Orthophotos of the 1955, 1962, and 1969 aerial photogrammetric surveys: coverage in the PRD coastal area is complete for the 1955 one and restricted in the northern portion both for the 1962 and the 1969 data.
Remotesensing 13 00529 g006
Figure 7. Orthophotos of the 1977, 1983, and 1990 aerial photogrammetric surveys: for these data, coverage in the PRD coastal area is complete, together with good visibility on the aerial images.
Remotesensing 13 00529 g007
Figure 8. Orthophotos of the 1999, 2008, and 2014 aerial photogrammetric surveys: coverage is incomplete only for the 1999 data, and the aerial images are characterized by good/optimal visibility.
Remotesensing 13 00529 g008
Figure 9. Coverage of the 2006 DTM from LiDAR data (last return laser beam together with procedures for objects/vegetation filtering, gridded with regular size of 1 m) and shaded relief visualization of some details (AD) in PRD coastal area, outside the levees.
Remotesensing 13 00529 g009
Figure 10. Coastline restitutions from archival cartography (1911–1924), photo-plans (aerial photogrammetric surveys performed in 1933, 1944, and 1949), and photogrammetric models (surveys carried out in 1955, 1962, 1969, 1977, 1983, 1990, 1999, and 2008) using stereoscopic devices were overlapped to the orthophoto of the last aerial photogrammetric survey (performed in 2014), (a) a detail related to the sub-area 3 (Bacino Bonelli Levante) is also shown (b) together with the orthophotos obtained from 1955 (c), 1977 (d), and 2014 (e) surveys, highlighting large deformations in emerged surfaces in the comparison 1955–1977.
Remotesensing 13 00529 g010
Figure 11. Multi-temporal emerged surfaces relating to sub-area 3 (Bacino Bonelli Levante) from 1911 to 2014 (two cartographic and 12 photogrammetric data): the storm surge event of 10 November 1957 [30], was intercepted in the comparison 1955–1977.
Remotesensing 13 00529 g011
Figure 12. Progression of emerged surfaces for each of the nine sub-areas outside to the levees in PRD coastal area and defined in Figure 1 (19): due to the different accuracy, the cartographic data are in red (photogrammetric data in black).
Remotesensing 13 00529 g012
Figure 13. Coastlines representation from the 2018 LiDAR DTM (corrected 0 m contour line level, in black) and with the application of the RSLR projection in 2100 from the [51] max model (1395 mm, in red) for the most critical sub-areas 2 (Sacca degli Scardovari, (a)) and 3 (Bacino Bonelli Levante, (b)) in the PRD coastal area.
Remotesensing 13 00529 g013
Table 1. Characteristics of the aerial photogrammetric surveys used in this study (GSD: ground sample distance).
YearDateN. StripsN. ImagesScalePhoto Size (cm)Calibrated Focal Length (mm)Visibility on ImagesScans
(dpi)
GSD
(cm)
1933-6106-13 × 18-very poor120030
1944-8571:25,00024 × 24, 18 × 2424, 20 inch 1poor120055
194910–19 July 9601:18,00030 × 30200.500 1poor120040
19551 June–22 July8331:35,00023 × 23154.170 1poor100080
19628–11 July8491:31,00023 × 23153.030poor100080
196916–17 July6251:29,00023 × 23152.720poor100070
197710 October 8321:30,00023 × 23152.620good100070
198310 May–5 June13781:17,00023 × 23153.330good80050
19905–30 May 13701:20,00023 × 23151.770good80060
199910 September5241:34,00023 × 23152.900good100080
200821–22 August141251:16,00023 × 23153.875good80050
20146–24 May8721:78,00011310 × 17310 pi × el100.500good423350
1 No other information about the camera calibration.
Table 2. Main characteristics of the LiDAR surveys analyzed in this study (ALTM: Airborne Laser Terrain Mapping).
YearDateSensorTide (m)Resolution (Points/m2)Average Covered Area (km × km)
200626 AprilOptech ALTM 3033−0.371.840.75 × 57
20097 MarchOptech ALTM Gemini−0.321.840.75 × 57
201217 SeptemberOptech ALTM Gemini−0.302.031 × 57
201814 AprilOptech ALTM Galaxy−0.352.381–5 × 57
Table 3. Comparisons between coordinates of homologous natural points, manually measured on archival cartography, photo-plans, and photogrammetric models (for the last, using stereoscopic viewing devices) (E: East; N: North; St. Dev.: Standard Deviation).
ComparisonMeasured Points Average (m)St. Dev. (m)
1924–194918E1.193.27
N−1.252.94
1933–194421E0.681.86
N−0.581.75
1944–194938E−0.231.41
N−0.581.33
1949–195554E0.531.21
N0.321.13
1955–196266E−0.340.84
N0.420.75
1962–196966E−0.310.78
N0.270.73
1969–197766E0.210.76
N−0.080.84
1977–198388E0.280.77
N0.190.65
1983–199086E−0.250.67
N0.290.71
1990–199984E0.190.63
N−0.220.68
1999–200884E−0.330.59
N0.270.57
2008–2014100E0.140.55
N−0.090.49
Table 4. Comparisons between coordinates of homologous natural points, manually measured on LiDAR datasets and the photogrammetric model of 2014 using stereoscopic viewing devices (E: East; N: North; V: Vertical; St. Dev.: Standard Deviation).
ComparisonMeasured Points Average (m)St Dev. (m)
2006–200933E−0.080.22
N0.110.20
V0.070.24
2009–201231E0.050.18
N−0.010.18
V0.090.19
2012–201428E−0.130.53
N0.100.57
V−0.090.48
2014–201842E0.150.55
N0.110.49
V0.120.56
2012–201831E−0.060.20
N−0.040.16
V0.050.18
Table 5. Average and standard deviation of the vertical comparison between subsequent LiDAR surveys performed on PRD in stable areas (portions of Albarella island and Barricata village).
ComparisonAverage (m)Standard Deviation (m)
2006–20090.030.22
2009–20120.060.15
2012–20180.030.16
Table 6. Comparison between the emerged surfaces for the eight sub-areas of the PRD computed using the 0 m contour lines level, extracted from LiDAR data, and corrected on the basis of the simultaneous ortho-images (final coastlines) together with the common boundaries between the different surveys.
Comparisons/Area23456789
2006–2009
(106 m2)
−0.12−0.020.01−0.08−0.030.000.060.01
2009–2012
(106 m2)
0.420.280.170.160.270.290.280.06
2012–2018
(106 m2)
0.030.03−0.030.09−0.030.350.21−0.04
Table 7. Values of emerged surfaces of the eight sub-areas outside the to the levees taking into account prevision of the RSLR scenarios by 2100 based on the IPCC 8.5 min and max, and [51] max models in PRD.
Model/AreaYear23456789
LiDAR DTM (106 m2)20183.602.941.271.491.432.492.014.23
IPCC 8.5 min (106 m2)21001.891.850.851.210.871.501.344.21
IPCC 8.5 max (106 m2)21001.020.920.611.020.591.091.194.12
Rahmstorf max (106 m2)21000.380.680.380.520.300.700.834.00
Publisher’s Note: MDPI stays neutral with regard to jurisdictional claims in published maps and institutional affiliations.

