1. Introduction
Tropospheric moisture affects the planet Earth’s energy balance [
1]. It is associated with cloud formation as well as infrared radiation absorption that both impact the global warming and cooling at the top of the atmosphere. Long term trends in moisture distribution obviously play an important role in the evolution of our planet’s energy budget. To date, studies of moisture trends have used long term satellite records of measurements in the visible/near infrared, infrared, and microwave spectral regions, complemented by radio occultation and ground observations; these have been integrated in model reanalyses. The Global Energy and Water cycle Exchanges (GEWEX) sub-committee on moisture (GVAP) has published several documents on the various groups and summarized their results [
2,
3].
The GVAP comparison of Total Precipitable Water Vapor (TPW) records over a six year period (January 2003–December 2008) revealed many regions of strong agreement among the data records in the moisture trends especially in clear sky over ocean; but also there were regions of distinct differences over polar and mountain regions. When separated into all-sky, cloudy-sky and clear-sky classes, a spread of the TPW time series within each class was evident; visible/near infrared and infrared difficulties with and differences in cloud screening separated their results from the microwave and reanalysis results. Trends are present, especially in the microwave data over oceans [
4] but differences between the sensor/analyses results are difficult to reconcile in some regions.
Complementarity of infrared and microwave measurements is noted by Fetzer et al. [
5]; when clouds preclude infrared moisture determinations, microwave samples of TPW under most conditions. The NASA Water Vapor Project (NVAP) Making Earth System Data Records for Use in Research Environments (NVAP-M) moisture record was created from polar orbiter infrared and microwave data along with radiosondes and surface-based Global Positioning System measurements [
6]. These climatologies offer the opportunity to address many questions concerning atmospheric water vapor.
The focus of this work is the High-resolution Infrared Radiation Sounder (HIRS) moisture records that start in 1980 and continue to the present; the HIRS isntruments offer the longest continuous set of satellite measurements sensitive to tropospheric moisture. Infrared measurements from the Atmospheric Infrared Sounder (AIRS) and the Moderate Resolution Imaging Spectro-radiometer (MODIS) in the Aqua platform of the Earth Observing System, starting in 2000 and likely extending into the late 2020s, offer an opportunity for day and night intercomparison of moisture retrievals with those from the longer HIRS record. Since the Aqua MODIS and HIRS instruments share the same spectral bands and their radiance measurements are processed using very similar algorithms, these two moisture records are ideal for intercomparison. The overlap period in 2003 to 2013 is studied here in an attempt to validate HIRS moisture determinations and to increase confidence in the whole HIRS data record from 1980 onwards.
MODIS also offers total column water vapor derived from the attenuation by water vapor of near-IR solar radiation [
7] over areas where there is a reflective surface in the near IR, during the daytime. As day and night determinations are necessary to provide a comparison with the HIRS data record, the MODIS near infrared record is not used in this work.
Thus, in this paper, we compare the TPW (also often referred to as Total Column Water Vapor, TCWV) and Upper Tropospheric Precipitable Water Vapor (UTPW) determinations from HIRS versus Aqua MODIS measurements from 2003 to 2013. If the spatial and temporal patterns of HIRS moisture estimates compare with those from MODIS for these eleven years, the entire HIRS record from 1978 onwards can be viewed with more confidence (even though there is some variation in the HIRS instruments on the different platforms over the years). In addition, the MODIS results will be accorded more credibility if the records show similar behavior through the years. This work is a clear sky moisture companion to the cloud parameter study of Frey and Menzel [
8], wherein they reported on the HIRS and MODIS detection of high clouds for the same time period; it foreshadows the opportunity for using these data records to study the connection between cloud and clear sky moisture trends.
2. Instruments, Data, and Algorithms
HIRS have been onboard National Oceanic and Atmospheric Administration (NOAA) platforms beginning with the first satellite of the Television Infrared Observation Satellite series (TIROS-N), followed by NOAA-6 through NOAA-19. HIRS have also flown on the Polar Orbiting Meteorological Satellites (MetOp) A and -B platforms operated by the European Organisation for the Exploitation of Meteorological Satellites (EUMETSAT). HIRS has been paired with the Advanced Very High Resolution Radiometer (AVHRR) on all of these satellites since 1978. MODIS have been included the on the morning (Terra) and afternoon (Aqua) platforms of the National Aeronautics and Space Administration (NASA) Earth Observing System with the data record extending back to 2000.
The HIRS sensor takes measurements in 19 infrared (IR) channels and one solar channel. Adjustments in the sensor over the years have improved the field of view (FOV), modified the spectral bands, and enhanced the signal to noise in the radiance measurements. The spatial resolution of HIRS at nadir evolved from contiguous 20 km on HIRS/2 (NOAA-6 through NOAA-14), 18 km on HIRS/3 (NOAA-15 through NOAA-17), to sampled 10 km on HIRS/4 (NOAA-18 and -19, MetOp-A and -B). The HIRS spectral response functions (SRFs) determined pre-launch have been adjusted to achieve better radiance agreement with the high spectral resolution IASI (Infrared Atmospheric Sounding Interferometer) on MetOp-A [
9]. More recently, the HIRS data record has been reprocessed to provide nearly four decades of data from 1980 to 2015 [
10].
Infrared moisture determinations are confined to clear sky measurements; thus, a cloud detection algorithm is necessary. For HIRS, the companion imager, AVHRR, provides the cloud mask that has been developed as part of the Pathfinder Atmospheres—Extended (PATMOS-X). Version 5.3 of the PATMOS-X cloud mask and cloud properties spans from 1979 to the present with daily, global coverage generated with AVHRR [
11,
12]. Cloud detection is accomplished with AVHRR GAC (Global Area Coverage) pixels (1.1 km by 4.4 km spatial resolution at nadir) collocated within a HIRS FOV using the Clouds from AVHRR-Extended (CLAVR-x) algorithm [
13]. GAC data are obtained by sampling the AVHRR full resolution 1.1 km data so that, for a given scan line, the first four pixels out of every five are averaged, and only every third scan line is processed.
The MODIS 36 spectral bands [
14] have sixteen in the infrared ranging from 3.6 to 14.4 µm with SRFs similar to those on HIRS. In the sixth collection and processing of the MODIS data (Collection 6.1, [
15]), the atmospheric profiles of moisture are provided at 5-km spatial resolutions. The MODIS cloud mask at 1-km resolution [
16] is used to determine the cloudiness within 5 × 5 km fields of regard (FORs). When 15% or more of a HIRS FOV or a MODIS FOR is determined to be cloud covered, a moisture retrieval is not attempted (the clear 1-km MODIS radiances within the FOR are averaged for the retrieval).
The HIRS and MODIS moisture records retrieve total column precipitable water vapor (TPW) as well as integrated high (UTPW), mid, and low layer tropospheric precipitable water vapor. This is accomplished with a statistical regression [
17,
18,
19,
20,
21] developed from an atmospheric profile database [
22] that consists of geographically and seasonally distributed radiosonde, ozonesonde, and ECMWF reanalysis data. TPW and UTPW are determined for clear sky radiances (and brightness temperatures, BTs) over land and ocean both day and night. The Aqua/MODIS TPW and UTPW (MYD08C3 C6.1, [
23]) are 1° degree spatial resolution products with one monthly average value. The HIRS TPW and UTPW products are binned into a global map of 0.5° lat-lon boxes, for 4 time periods daily (night before and after midnight and day before and after noon), compiled into monthly amounts (for the operational months of each satellite).
The regression coefficients are generated using the calculated synthetic radiances and the matching atmospheric profile. The regression seeks a “best-fit” atmospheric profile that is computed using least squares methods applied to the actual measurements; integration over the total column yields the TPW water and integration from 400 to 10 hPa is the UTPW. The advantage of this approach is that it does not need measured radiances collocated in time and space with atmospheric profile data, it requires only historical profile observations. However, it involves the radiative transfer calculations and requires an accurate forward model in order to obtain a reliable regression relationship as well as a physically realistic characterization of the surface, including land surface emissivity, skin temperature and surface pressure. Radiative transfer calculations for HIRS are performed with the RTTOV (Radiative Transfer for TOVS, [
24]) and with the CRTM (Community Radiative Transfer Model, [
25]) for MODIS. The spectral response functions of the HIRS channels 1–12 have been shifted for better radiance performance based on Chen et al. [
6]; this required new spectral and transmittance forward model coefficients that were only offered for the RTTOV. Hence the HIRS forward model had to be switched from CRTM to RTTOV. Comparisons between the two forward models are discussed in [
26,
27,
28,
29]. TPW determinations in 500 clear sky cases observed with the infrared measurements of the Spinning Enhanced Visible and InfraRed Imager (SEVIRI) calculated with the two models agreed within 0.1 mm RMS with a bias of 0.2 mm [
29]; these differences are small compared to the HIRS and MODIS TPW accuracies cited below.
The UW High Spectral resolution land surface IR emissivity database [
18,
30] was used for the emissivity estimate over land and the Wu–Smith model [
31,
32] over water. To determine the surface height more accurately, surface pressure was obtained from the NCEP Reanalysis [
33].
Validation of Aqua MODIS TPW has been performed through comparison with microwave water radiometer (MWR) over three years in more than 300 clear sky cases. The standard deviation of the comparisons with the MWR is 3.0 mm, with an overall bias near zero [
15]. For HIRS, a similar validation from more than 4000 clear sky comparisons with the MWR showed a standard deviation of 5.2 mm with a dry bias of 2.4 mm [
34].
The period of 2003–2013 was chosen to include the overlap of Aqua MODIS in afternoon orbit with HIRS on N16, N18 N19. HIRS data was used only during the operational period of the satellties, hence no overlapping occurred. The July 2013 end date was determined by the appearance of excessive noise in the N19 HIRS channels 1–12 (
https://www.ospo.noaa.gov/Operations/POES/NOAA19/hirs.html). After NOAA-19, there is no other afternoon orbit HIRS. Terra/MODIS data quality in this time frame was not considered to be reliable [
35].
Orbit drift in the NOAA satellites causes the equator crossing times (polar orbiting satellites are intended to cross the equator traveling from south to north at the same local solar time each day) to occur later in the day in the HIRS observations and this, in turn, alters moisture determinations during daytime due to changes in diurnal surface heating. To mitigate this somewhat, we limit the HIRS data in this analysis to the operational time periods wherein the drift was confined to be less than one hour. The Aqua MODIS equator crossing time has been maintained at 13:30 Local Time (LT) without noticeable drift, while those for HIRS on NOAA-16, -18, and -19 range from 14:00 to 15:00 LT during their operational lifetimes.
3. Observations of Tropospheric Precipitable Water Vapor
TPW and UTPW derived from HIRS and MODIS are compared for the periods of 2003–2013 and between the 60°S and 60°N latitudes. The polar regions are excluded from our study because the cloud masks are challenging over high latitudes and the moisture amounts are small, hence it is difficult to determine them accurately.
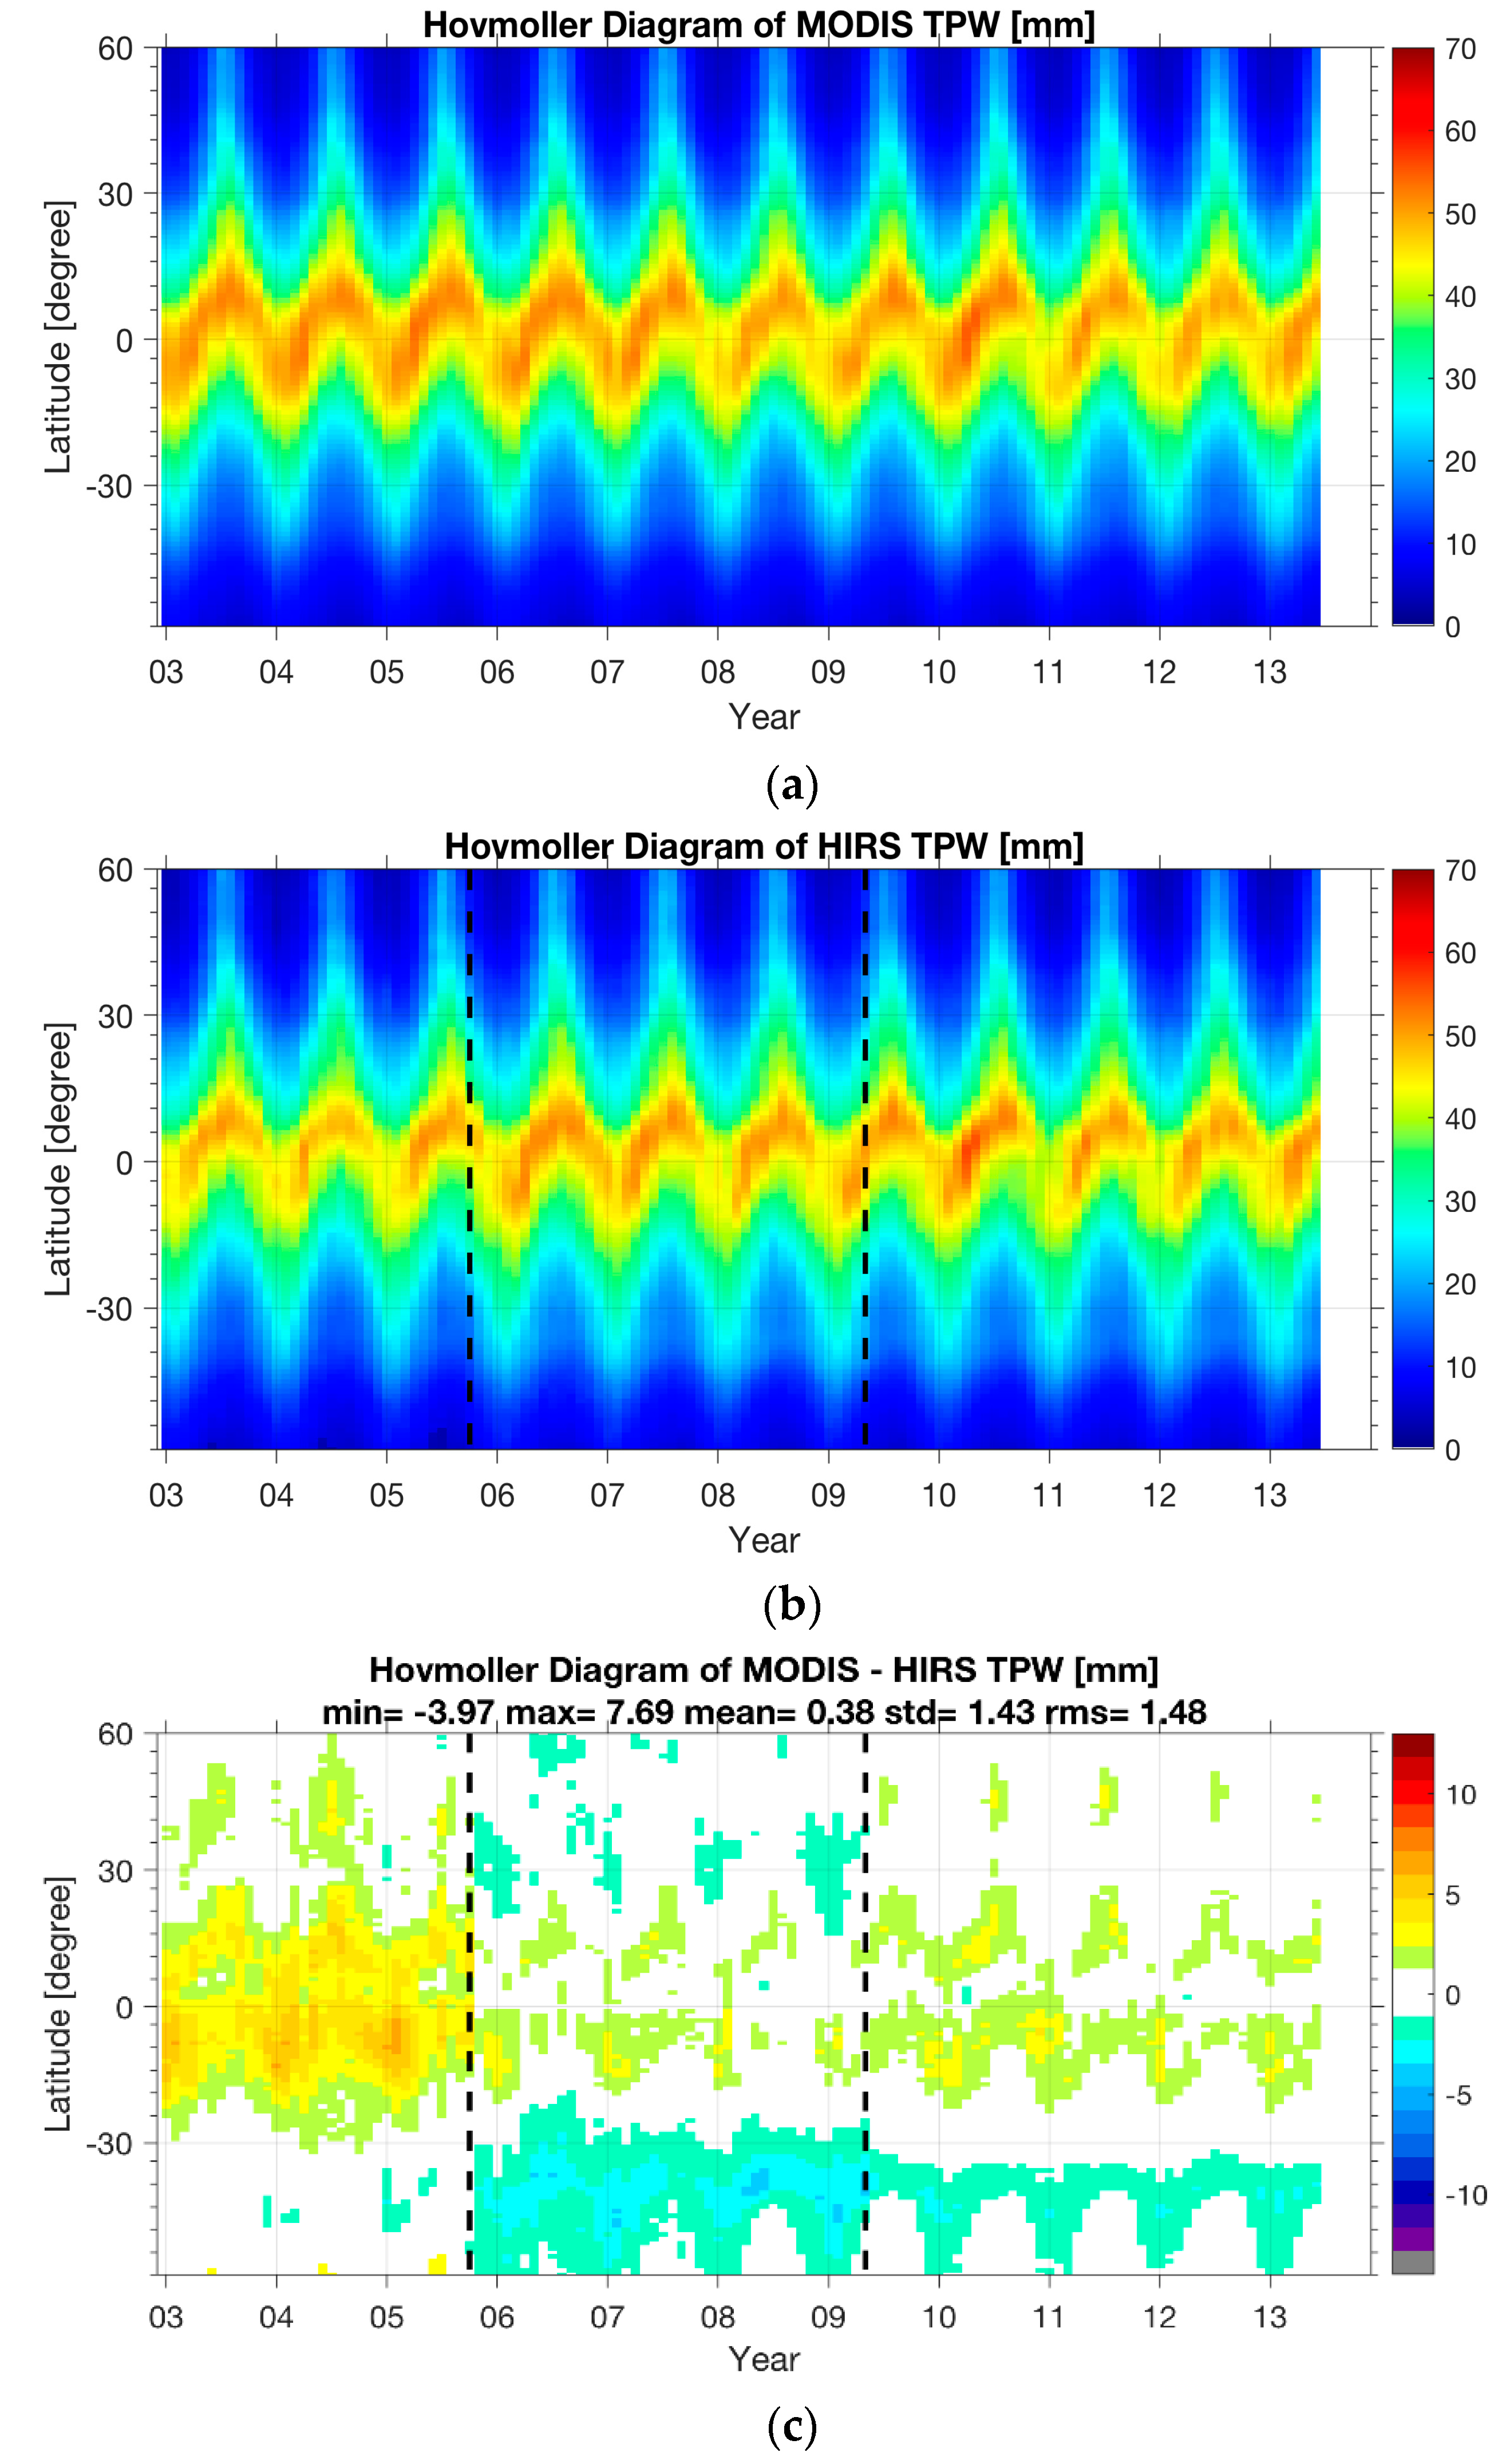
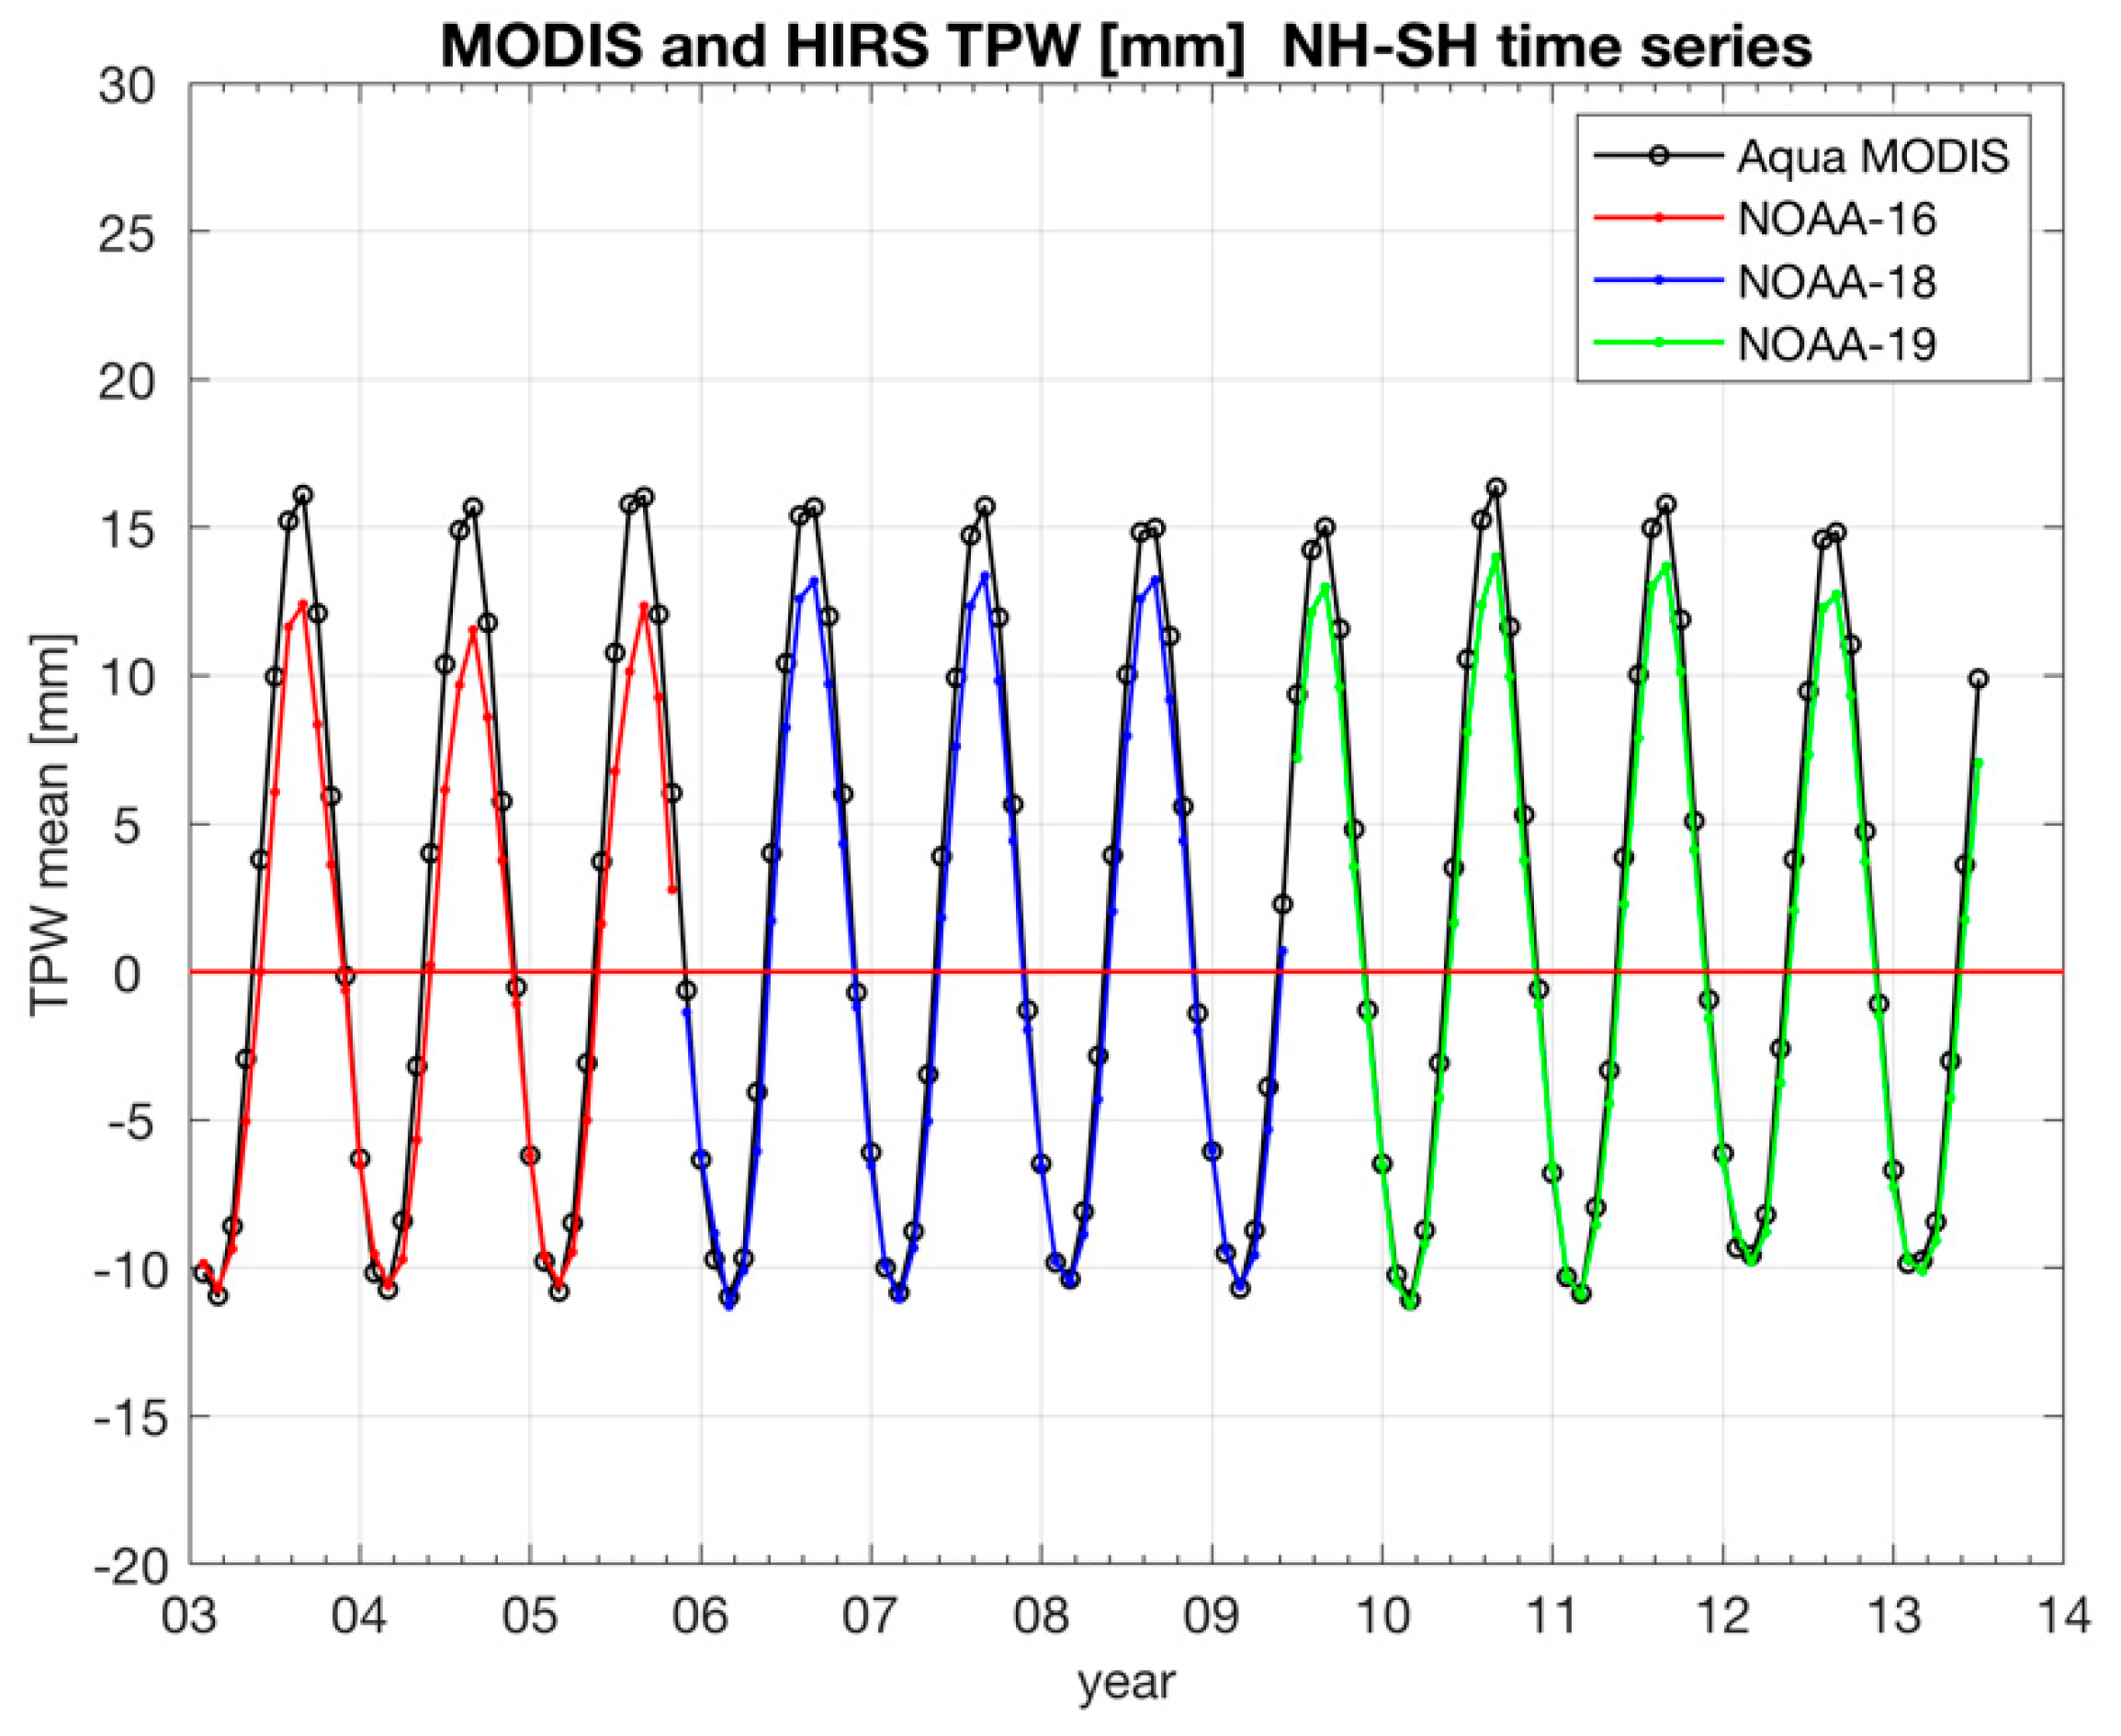
Hovmoller plots in
Figure 1 for aggregated TPW determinations indicate similar seasonal patterns for MODIS (top) and HIRS (bottom). The largest TPW values are found in the tropics, with a seasonal maximum in the northern hemisphere in the mid-year (June–July–August, JJA) that shifts to the southern hemisphere six months later (December–January–February, DJF). Both MODIS and HIRS show a strong seasonal fluctuation, with the mid-year northern hemisphere maximum somewhat stronger than the southern hemisphere maximum six months later. Differences between HIRS and MODIS TPW are found to be as large as 5 mm (roughly 10%); this is mostly occurring for NOAA-16 where the larger HIRS/3 18 km FOV is introducing more of a dry bias (by roughly 2 mm) with fewer clear sky determinations in and around clouds than the NOAA-18 and -19 HIRS/4 10 km FOV, especially in the tropics. Given the validation characteristics of the HIRS and MODIS determinations at the ARM site, differences in the Hovmoller plot of less than 6 mm are within the expected standard deviation.
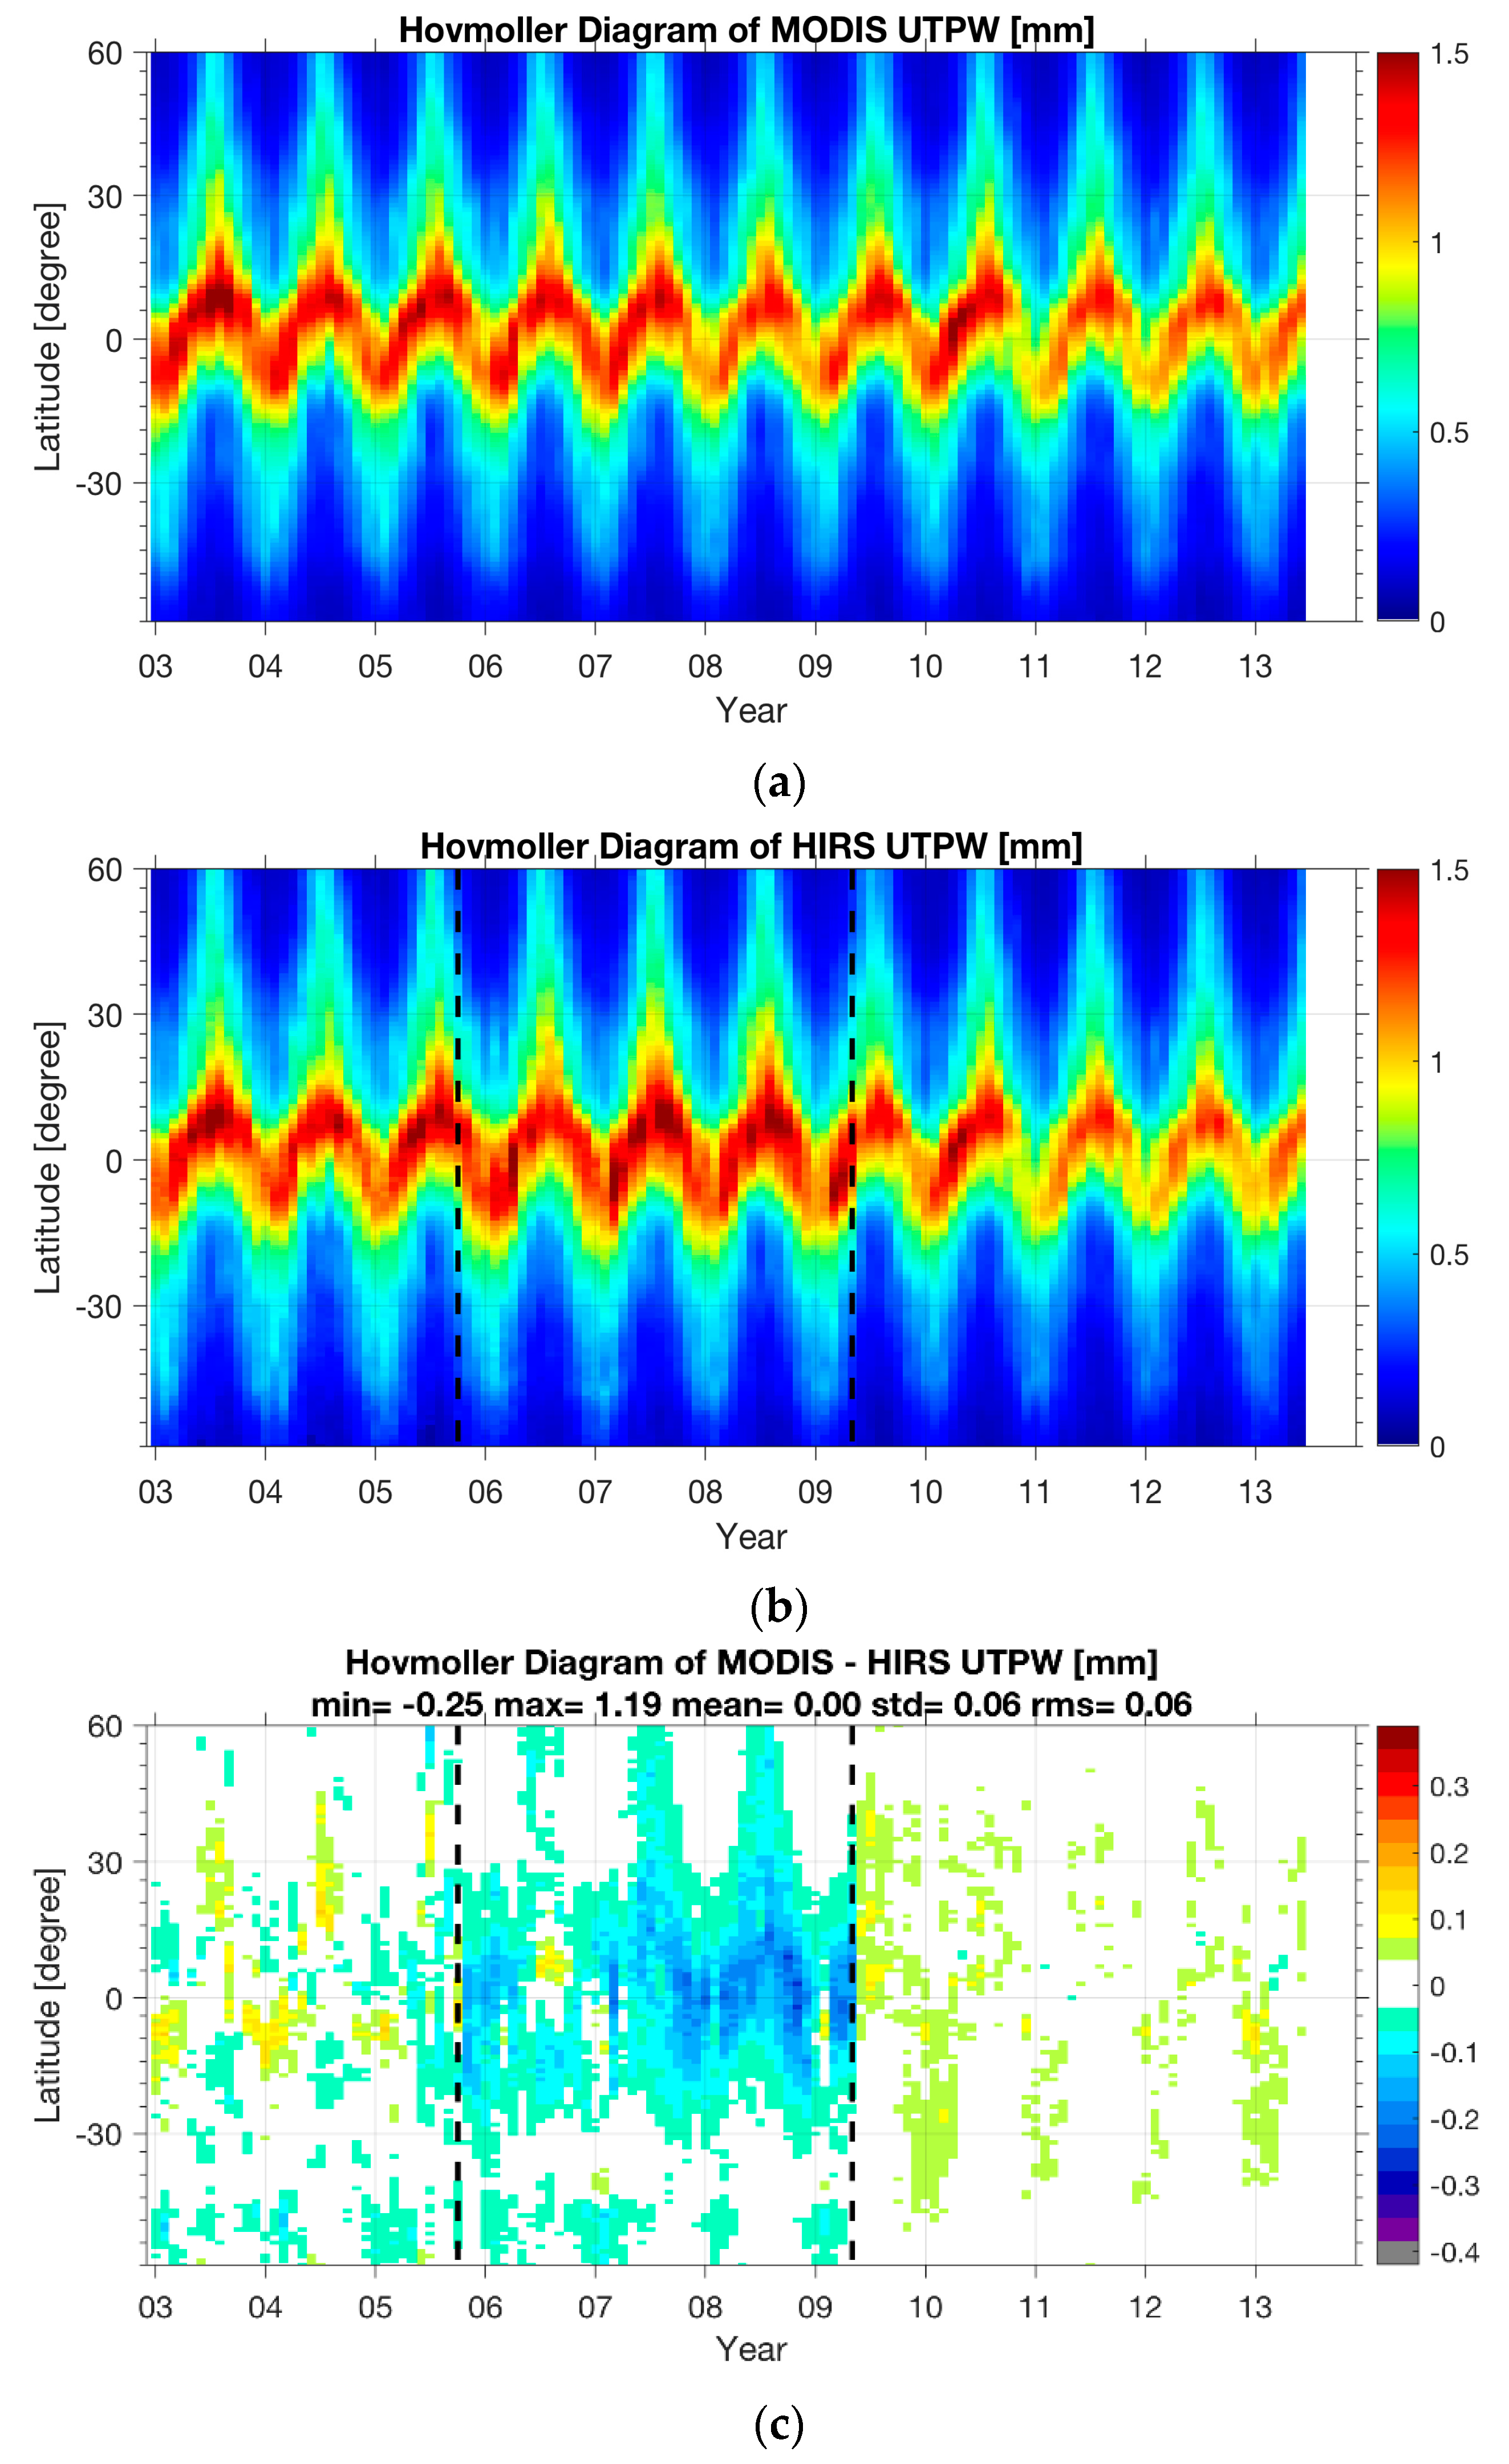
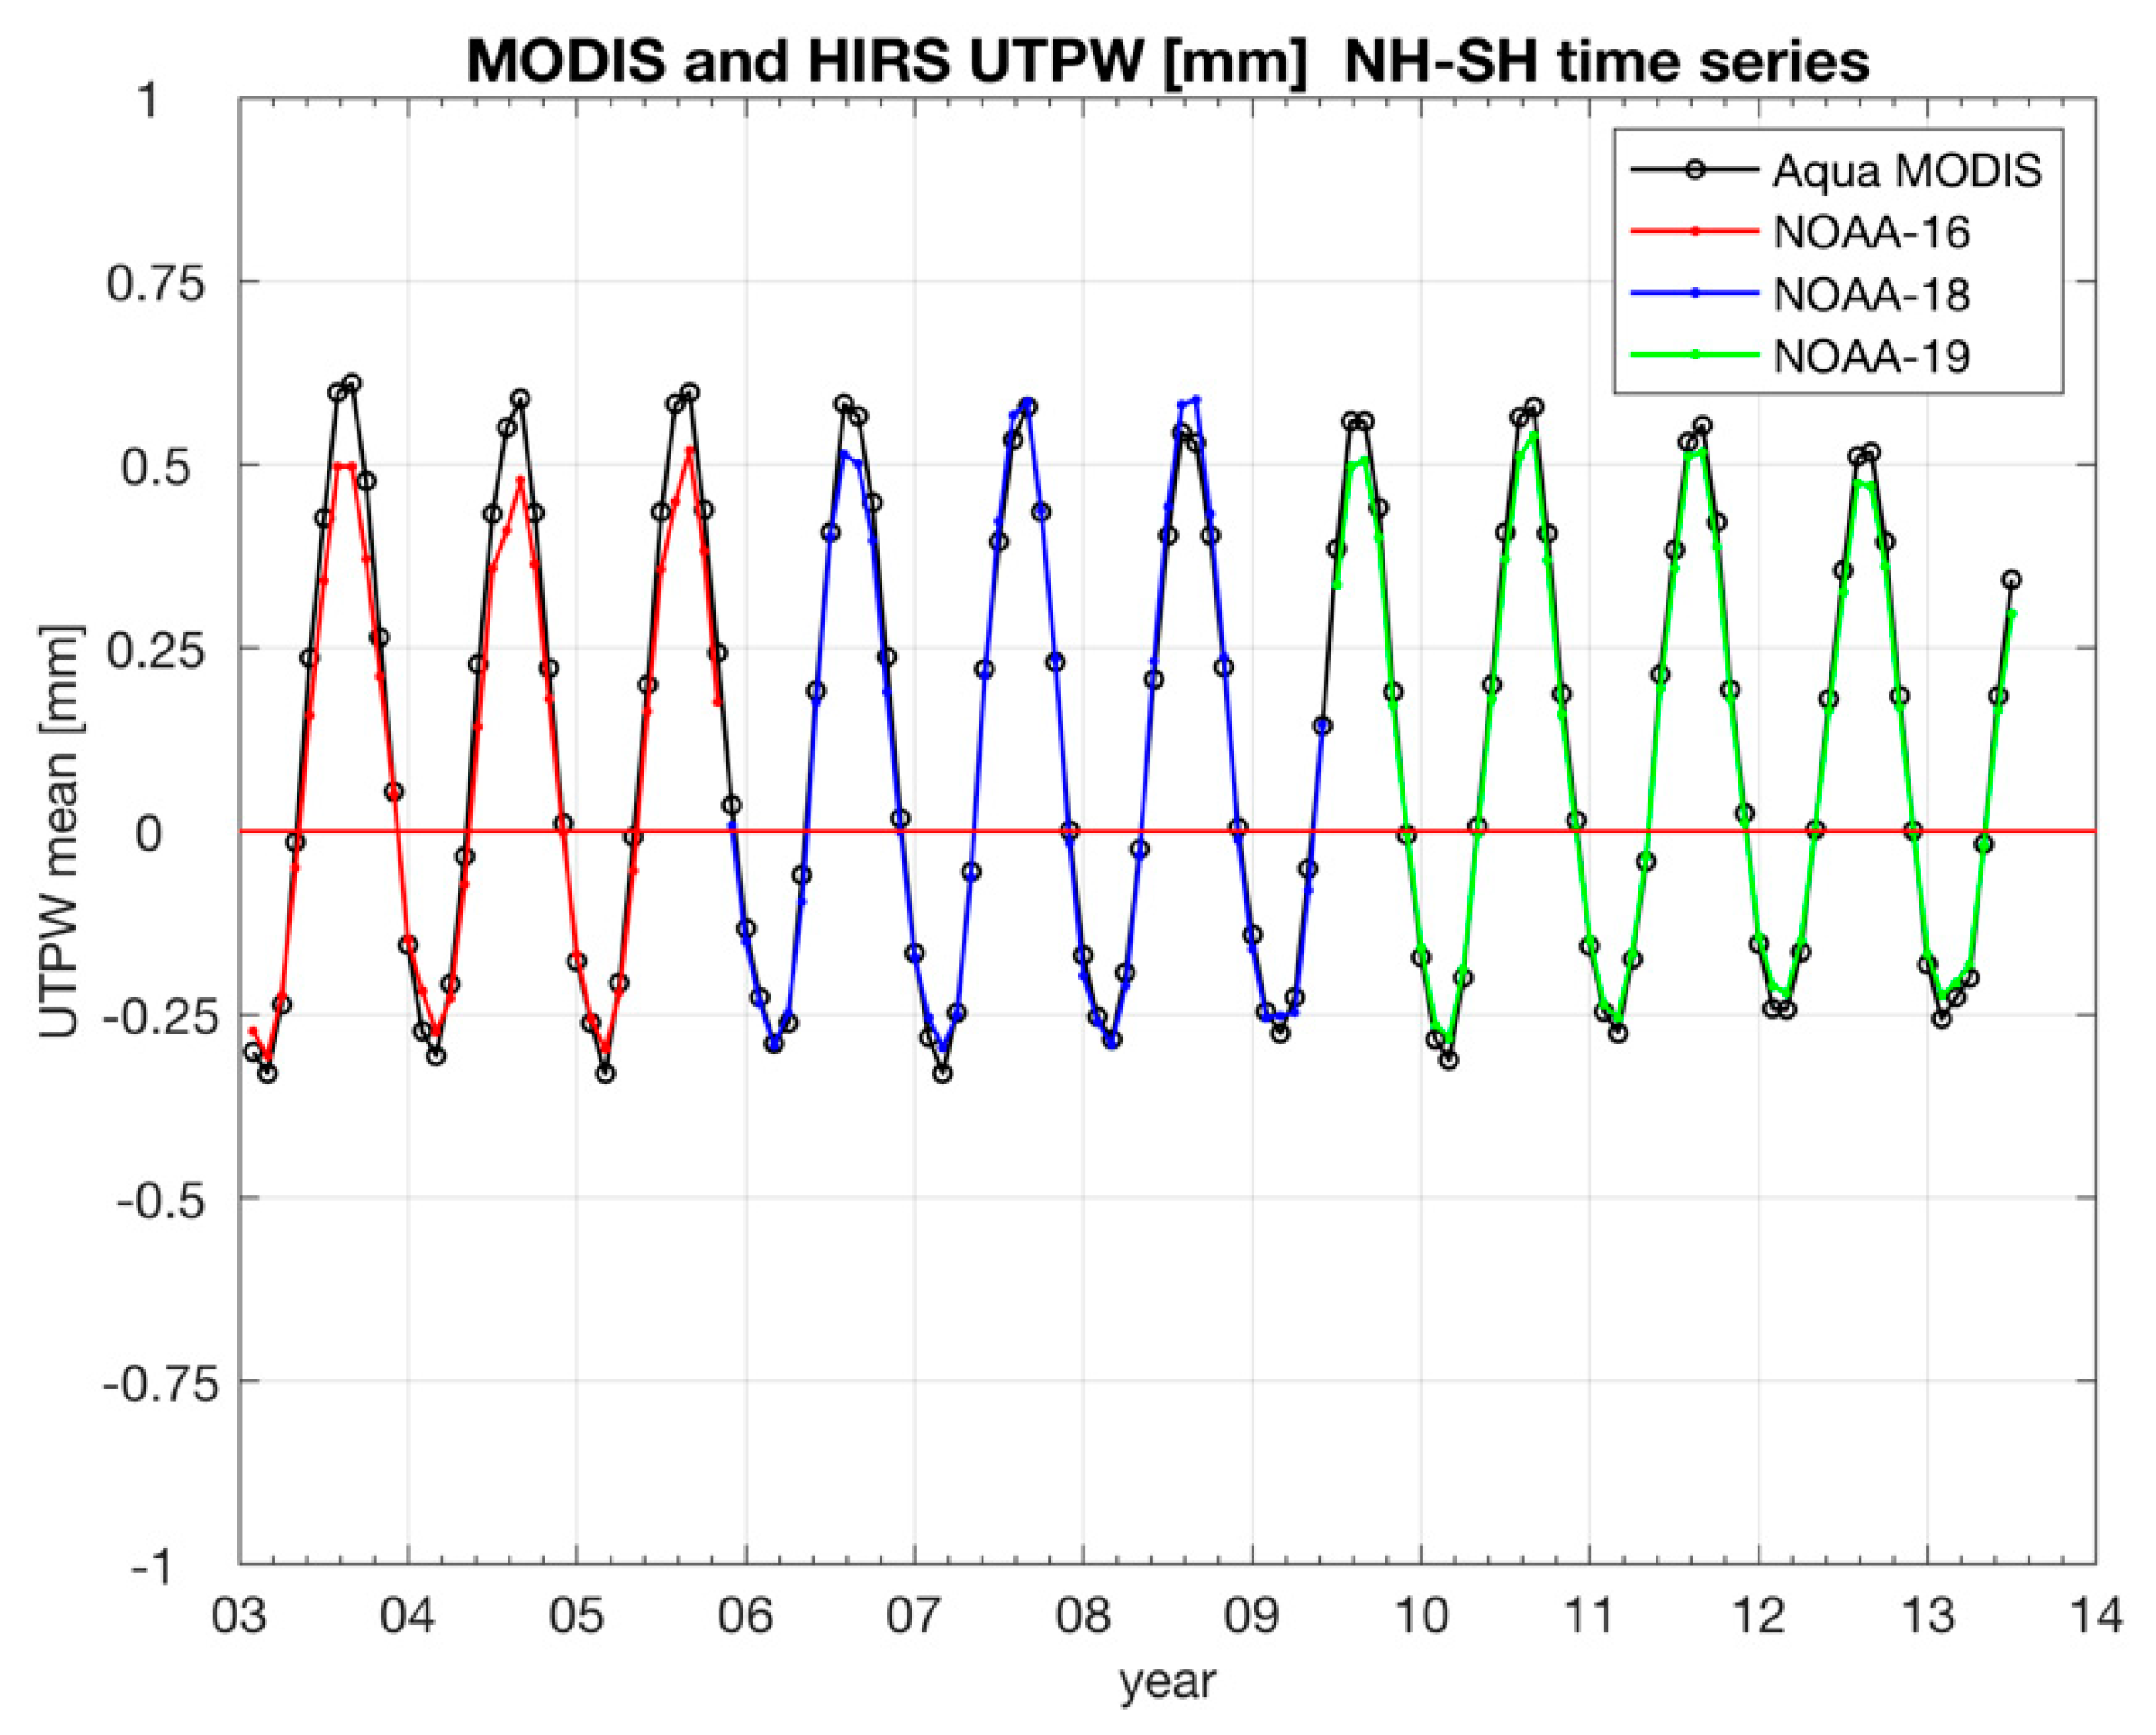
Figure 1 shows that compared with MODIS, NOAA-16 (January 2003–August 2005) is too dry in the tropics, NOAA-18 (September 2006–May 2009) is too moist in the southern mid-latitudes, and NOAA-19 (June 2009–June 2013) agrees the best of the three sensors. Similar results for MODIS and HIRS UTPW are shown in
Figure 2; tropical UTPW shows a strong seasonal movement north in JJA and south in DJF. MODIS UTPW is greater than HIRS for NOAA-16 and -19 by 0.1 mm (roughly 7%) and too dry for NOAA-18 by 0.3 mm (~20%). These Hovmoller plots suggest overall good qualitative agreement in the seasonal changes with disagreements of up to 5 mm in TPW and 20% in UTPW amounts.
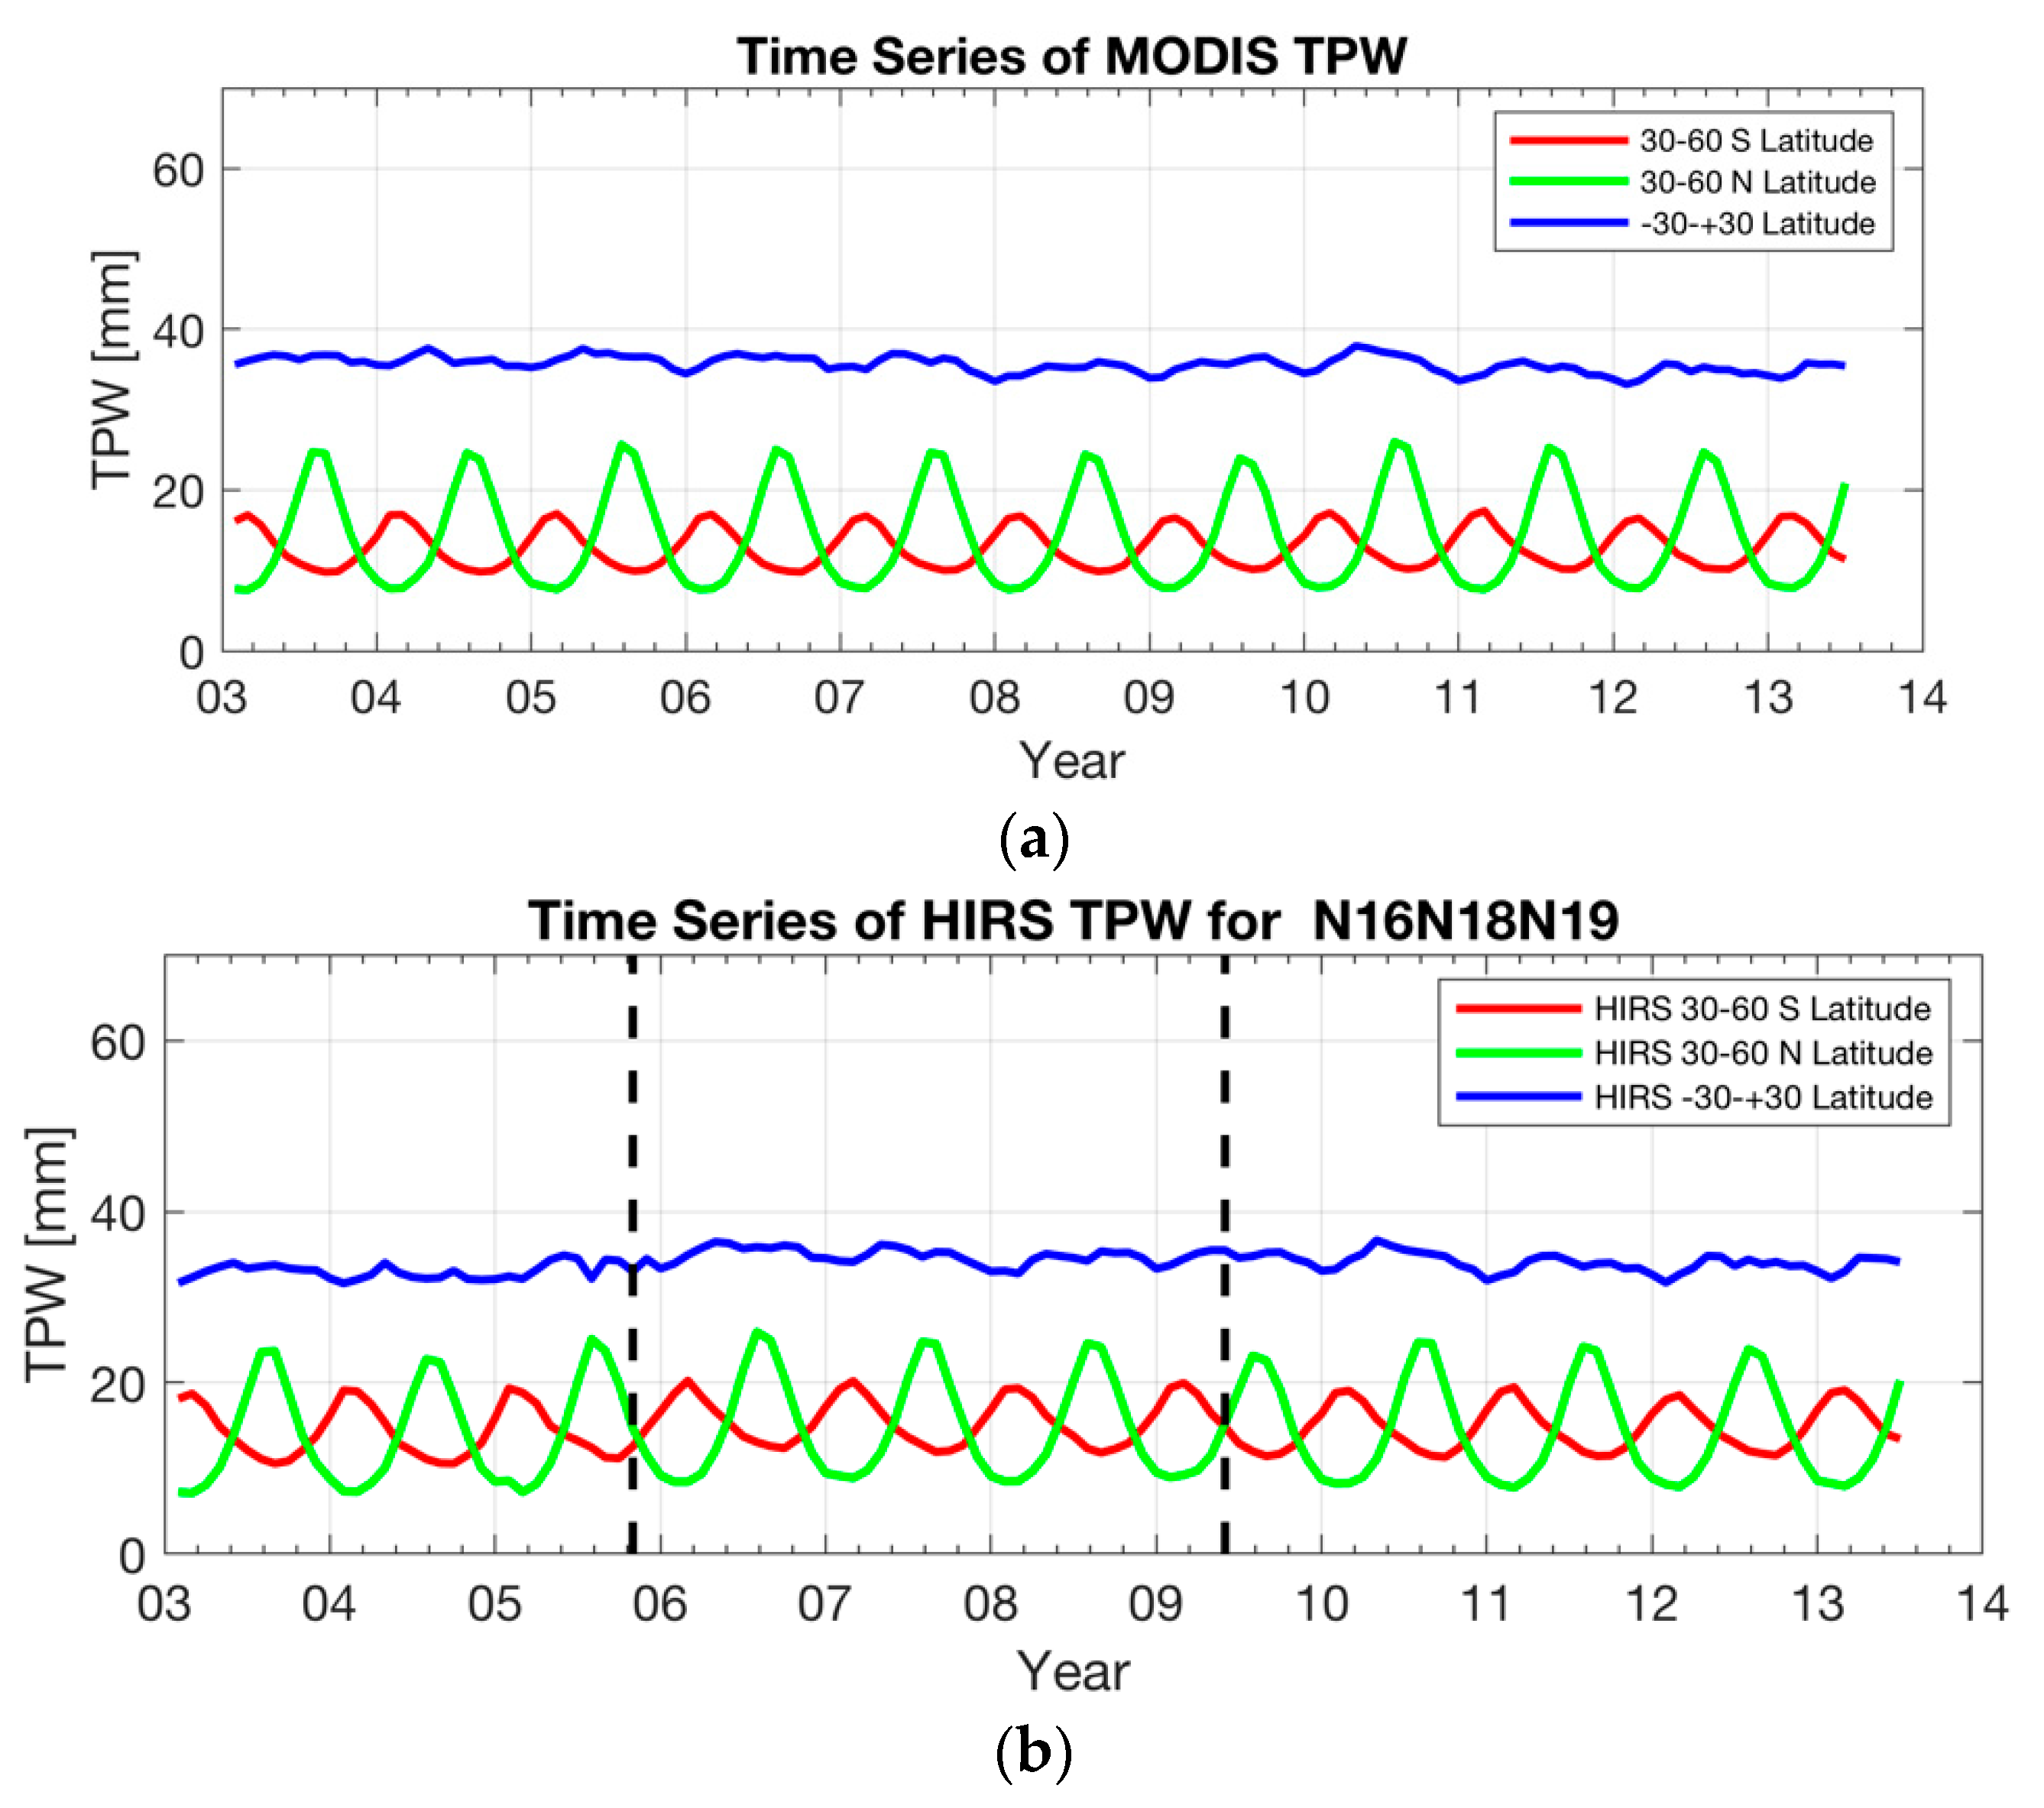
Figure 3 shows the month to month changes in TPW detection for each instrument for three latitude bands (mid latitude north 30° to 60°N, tropics 30°N to 30°S, and mid latitude south 30° to 60°S). Tropical TPW stays relatively constant in time (for MODIS ~36 mm and for HIRS ~34 mm). In both sensors records, northern mid-latitude TPW maxima occur in sync with southern mid-latitude TPW minima; the northern mid-latitudes have a wetter maximum as well as a drier minimum each year (seasonal change of 17 mm) compared to the southern mid-latitudes (seasonal change of 7 mm).
Figure 4 shows the corresponding month to month changes in UTPW detected by MODIS and HIRS; similar features in the UTPW records are evident for both sensors. Tropical UTPW has no discernible seasonal change, northern mid-latitude UTPW seasonally varies (seasonal change of 0.45 mm) out of synchronization with the southern mid-latitude UTPW (0.22 mm).
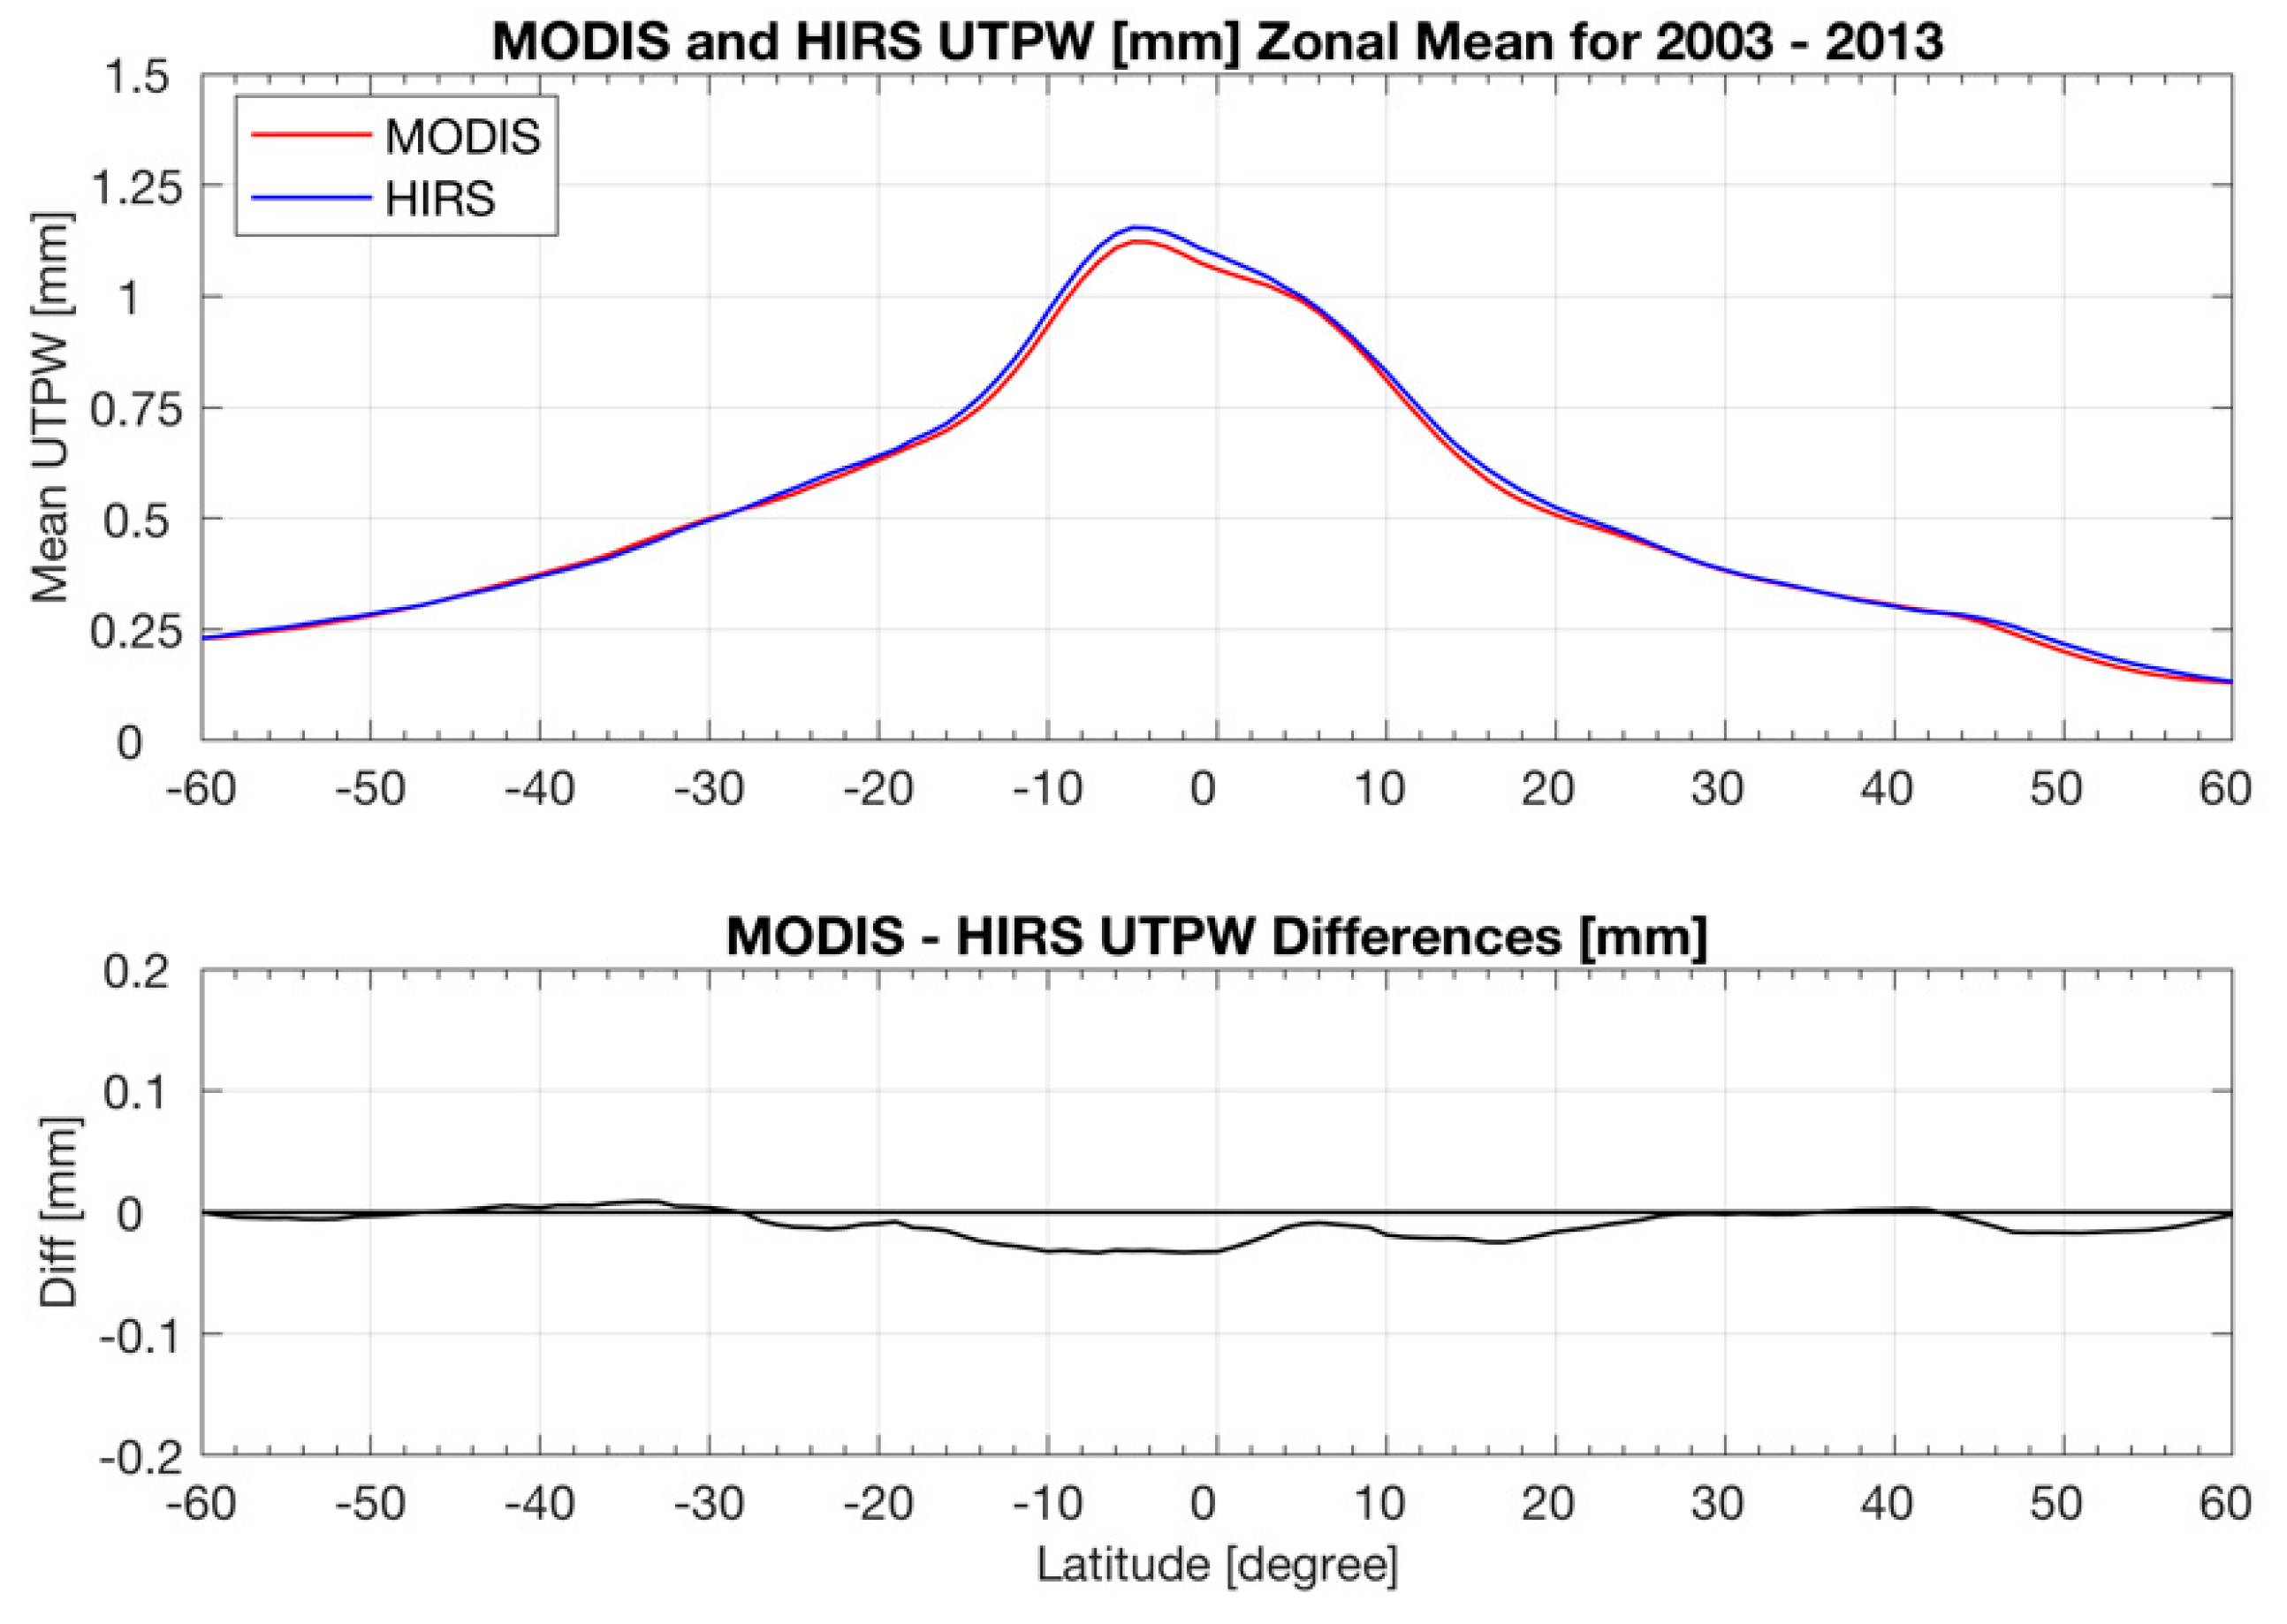
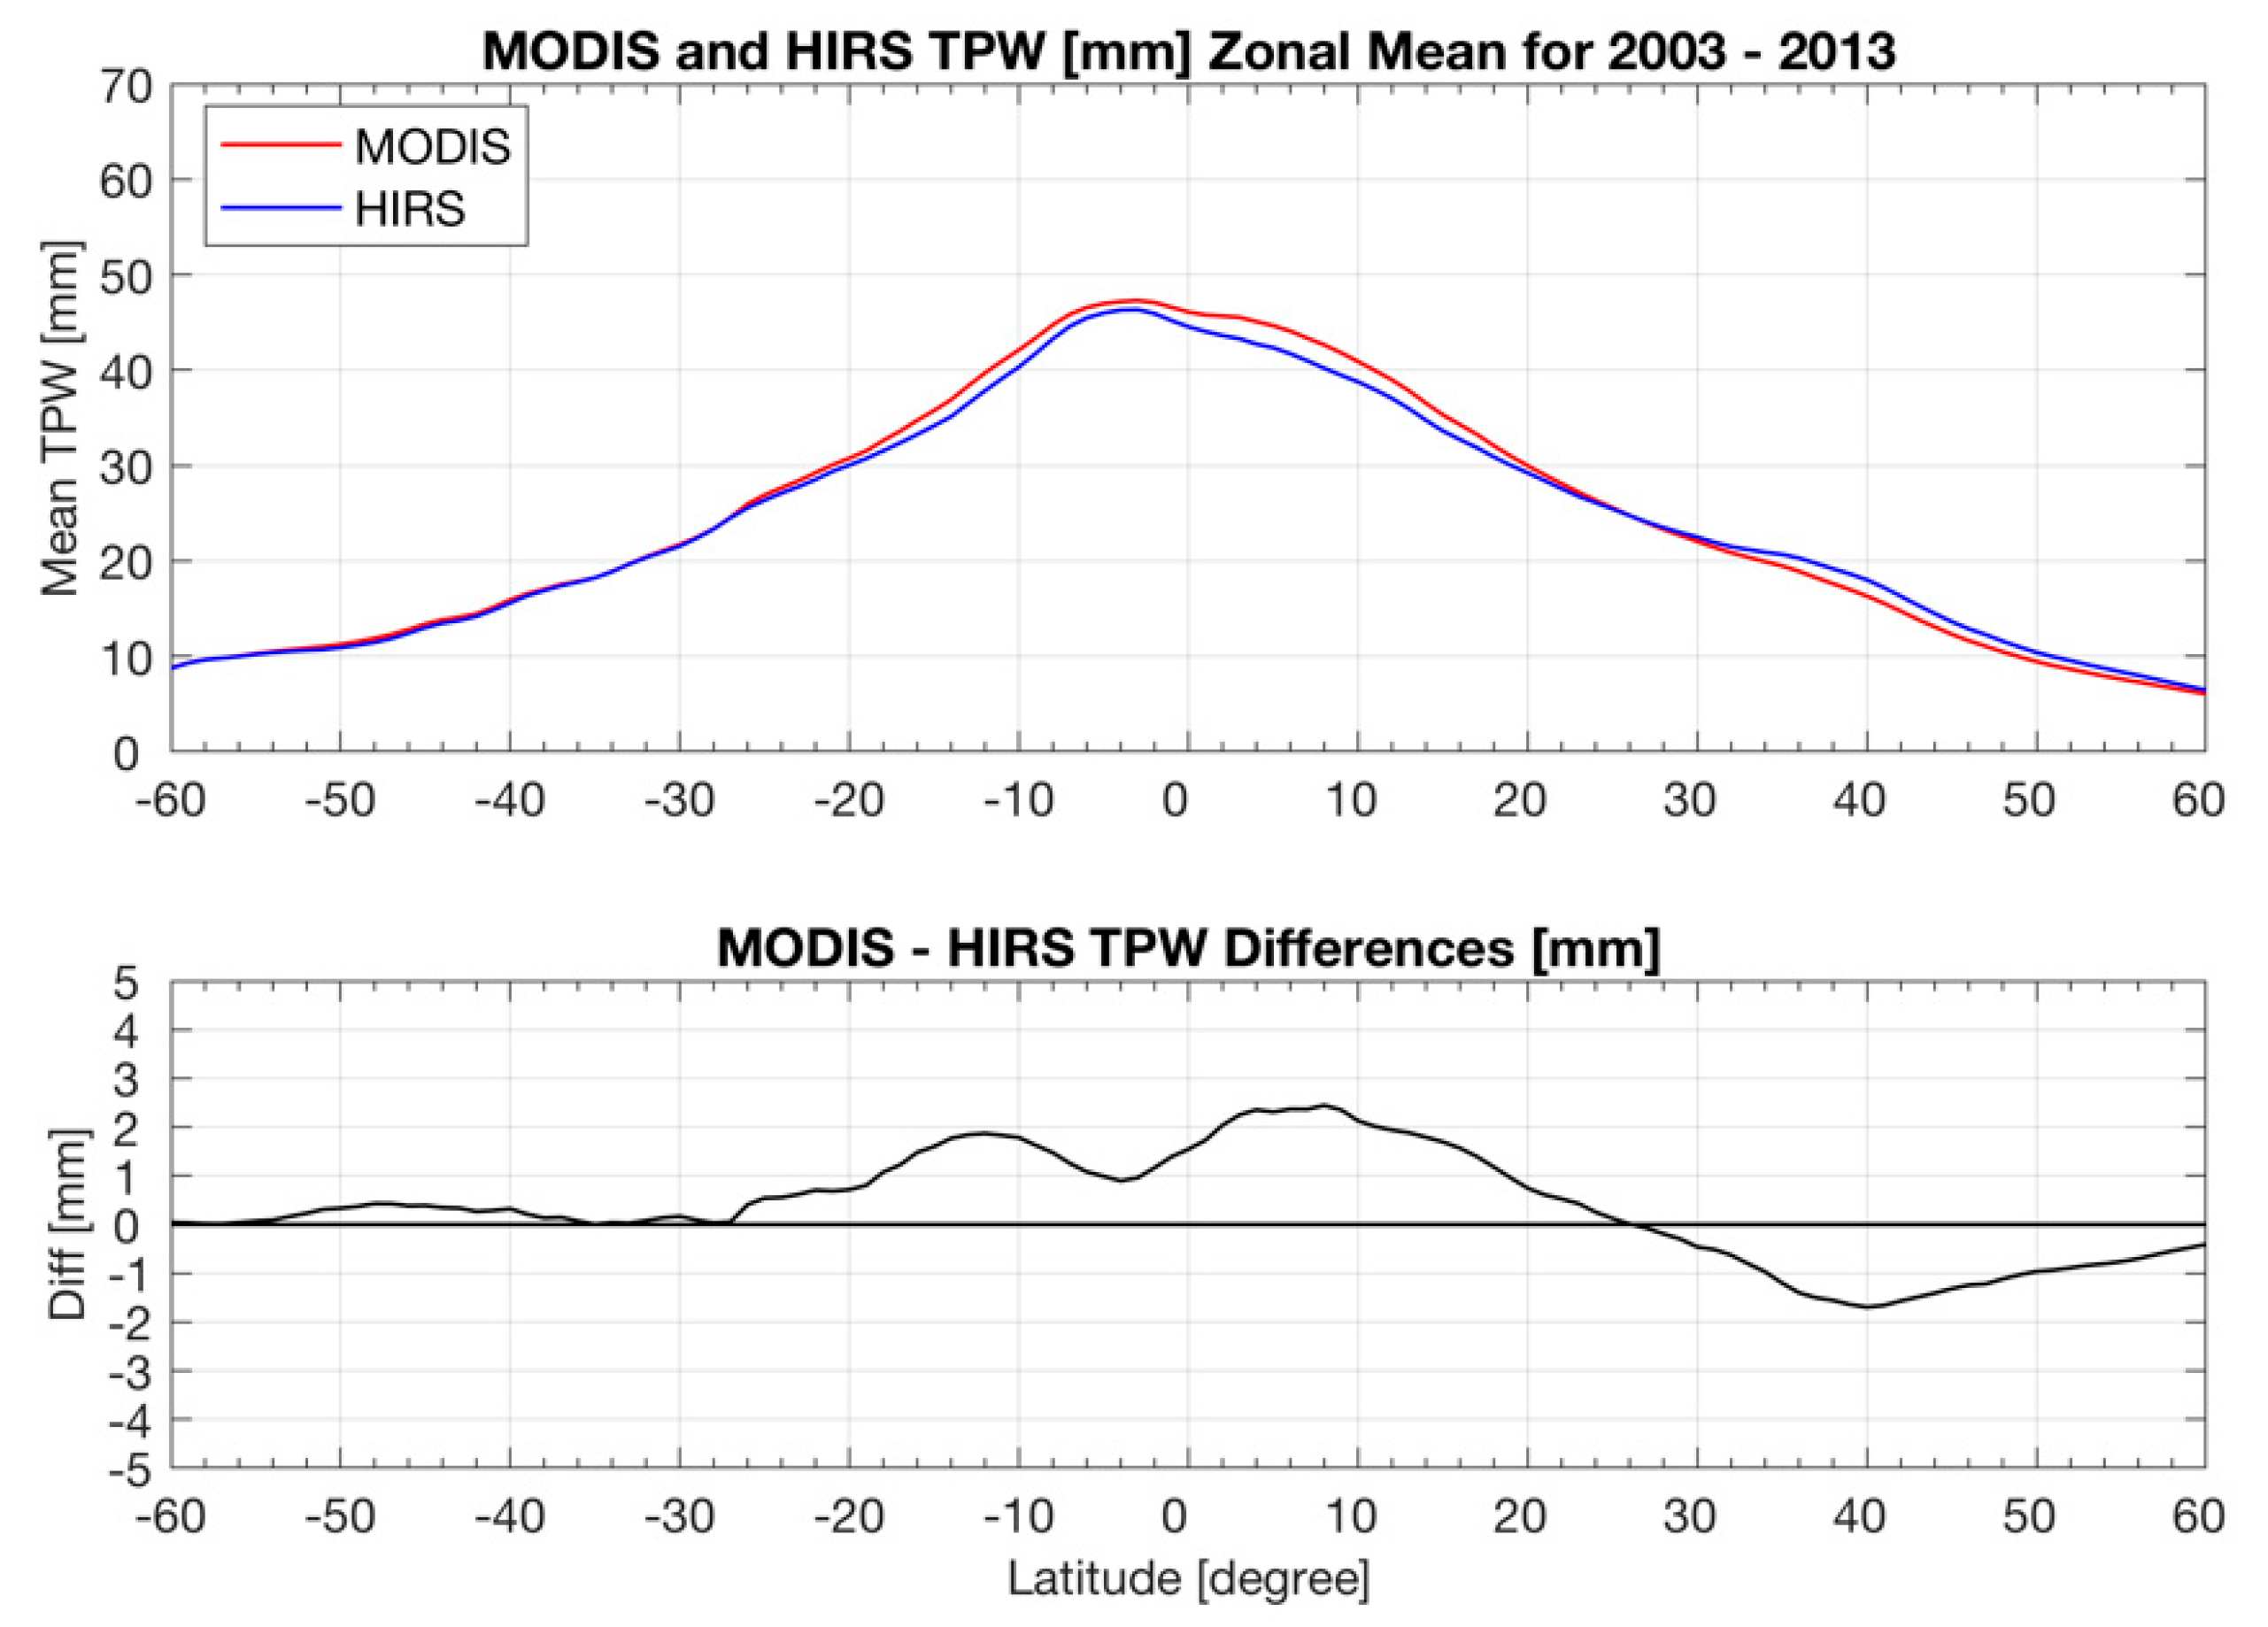
Zonal mean values of MODIS and HIRS, and their differences (MODIS-HIRS) for 1 degree latitude bands for TPW and UTPW, are shown in
Figure 5 and
Figure 6. MODIS and HIRS TPW are within 2 mm for all latitudes; MODIS is wetter than HIRS from 20°S to 20°N but drier from 35° to 55°N (see
Figure 5). Overall agreement is better than 5% for all zones between 60°S and 60°N. UTPW latitude mean values agree within 0.07 mm with MODIS drier in the tropics (
Figure 6).
Mean hemispheric imbalance in the moisture distributions from 2003 through 2013 is shown in
Figure 7 and
Figure 8. Northern hemisphere TPW is greater than that of the southern hemisphere in JJA by 15 mm and, in DJF, is drier by 10 mm. This annual seasonal change is repeated throughout the ten-year record (
Figure 7). Agreement with MODIS is best for NOAA-19, and falls off some for NOAA-18 with a JJA value of 13 mm and more for NOAA-16 with a JJA value of 12 mm.
Figure 8 shows the corresponding values for UTPW. Northern hemisphere UTPW has a JJA excess of 0.6 mm and a deficit of 0.25 mm in DJF; HIRS agreement with MODIS found on NOAA 18 and 19 drops off with NOAA-16 (JJA excess is 0.5 mm). Both MODIS and HIRS agree on the large scale distribution of TPW and UTPW for these ten years.
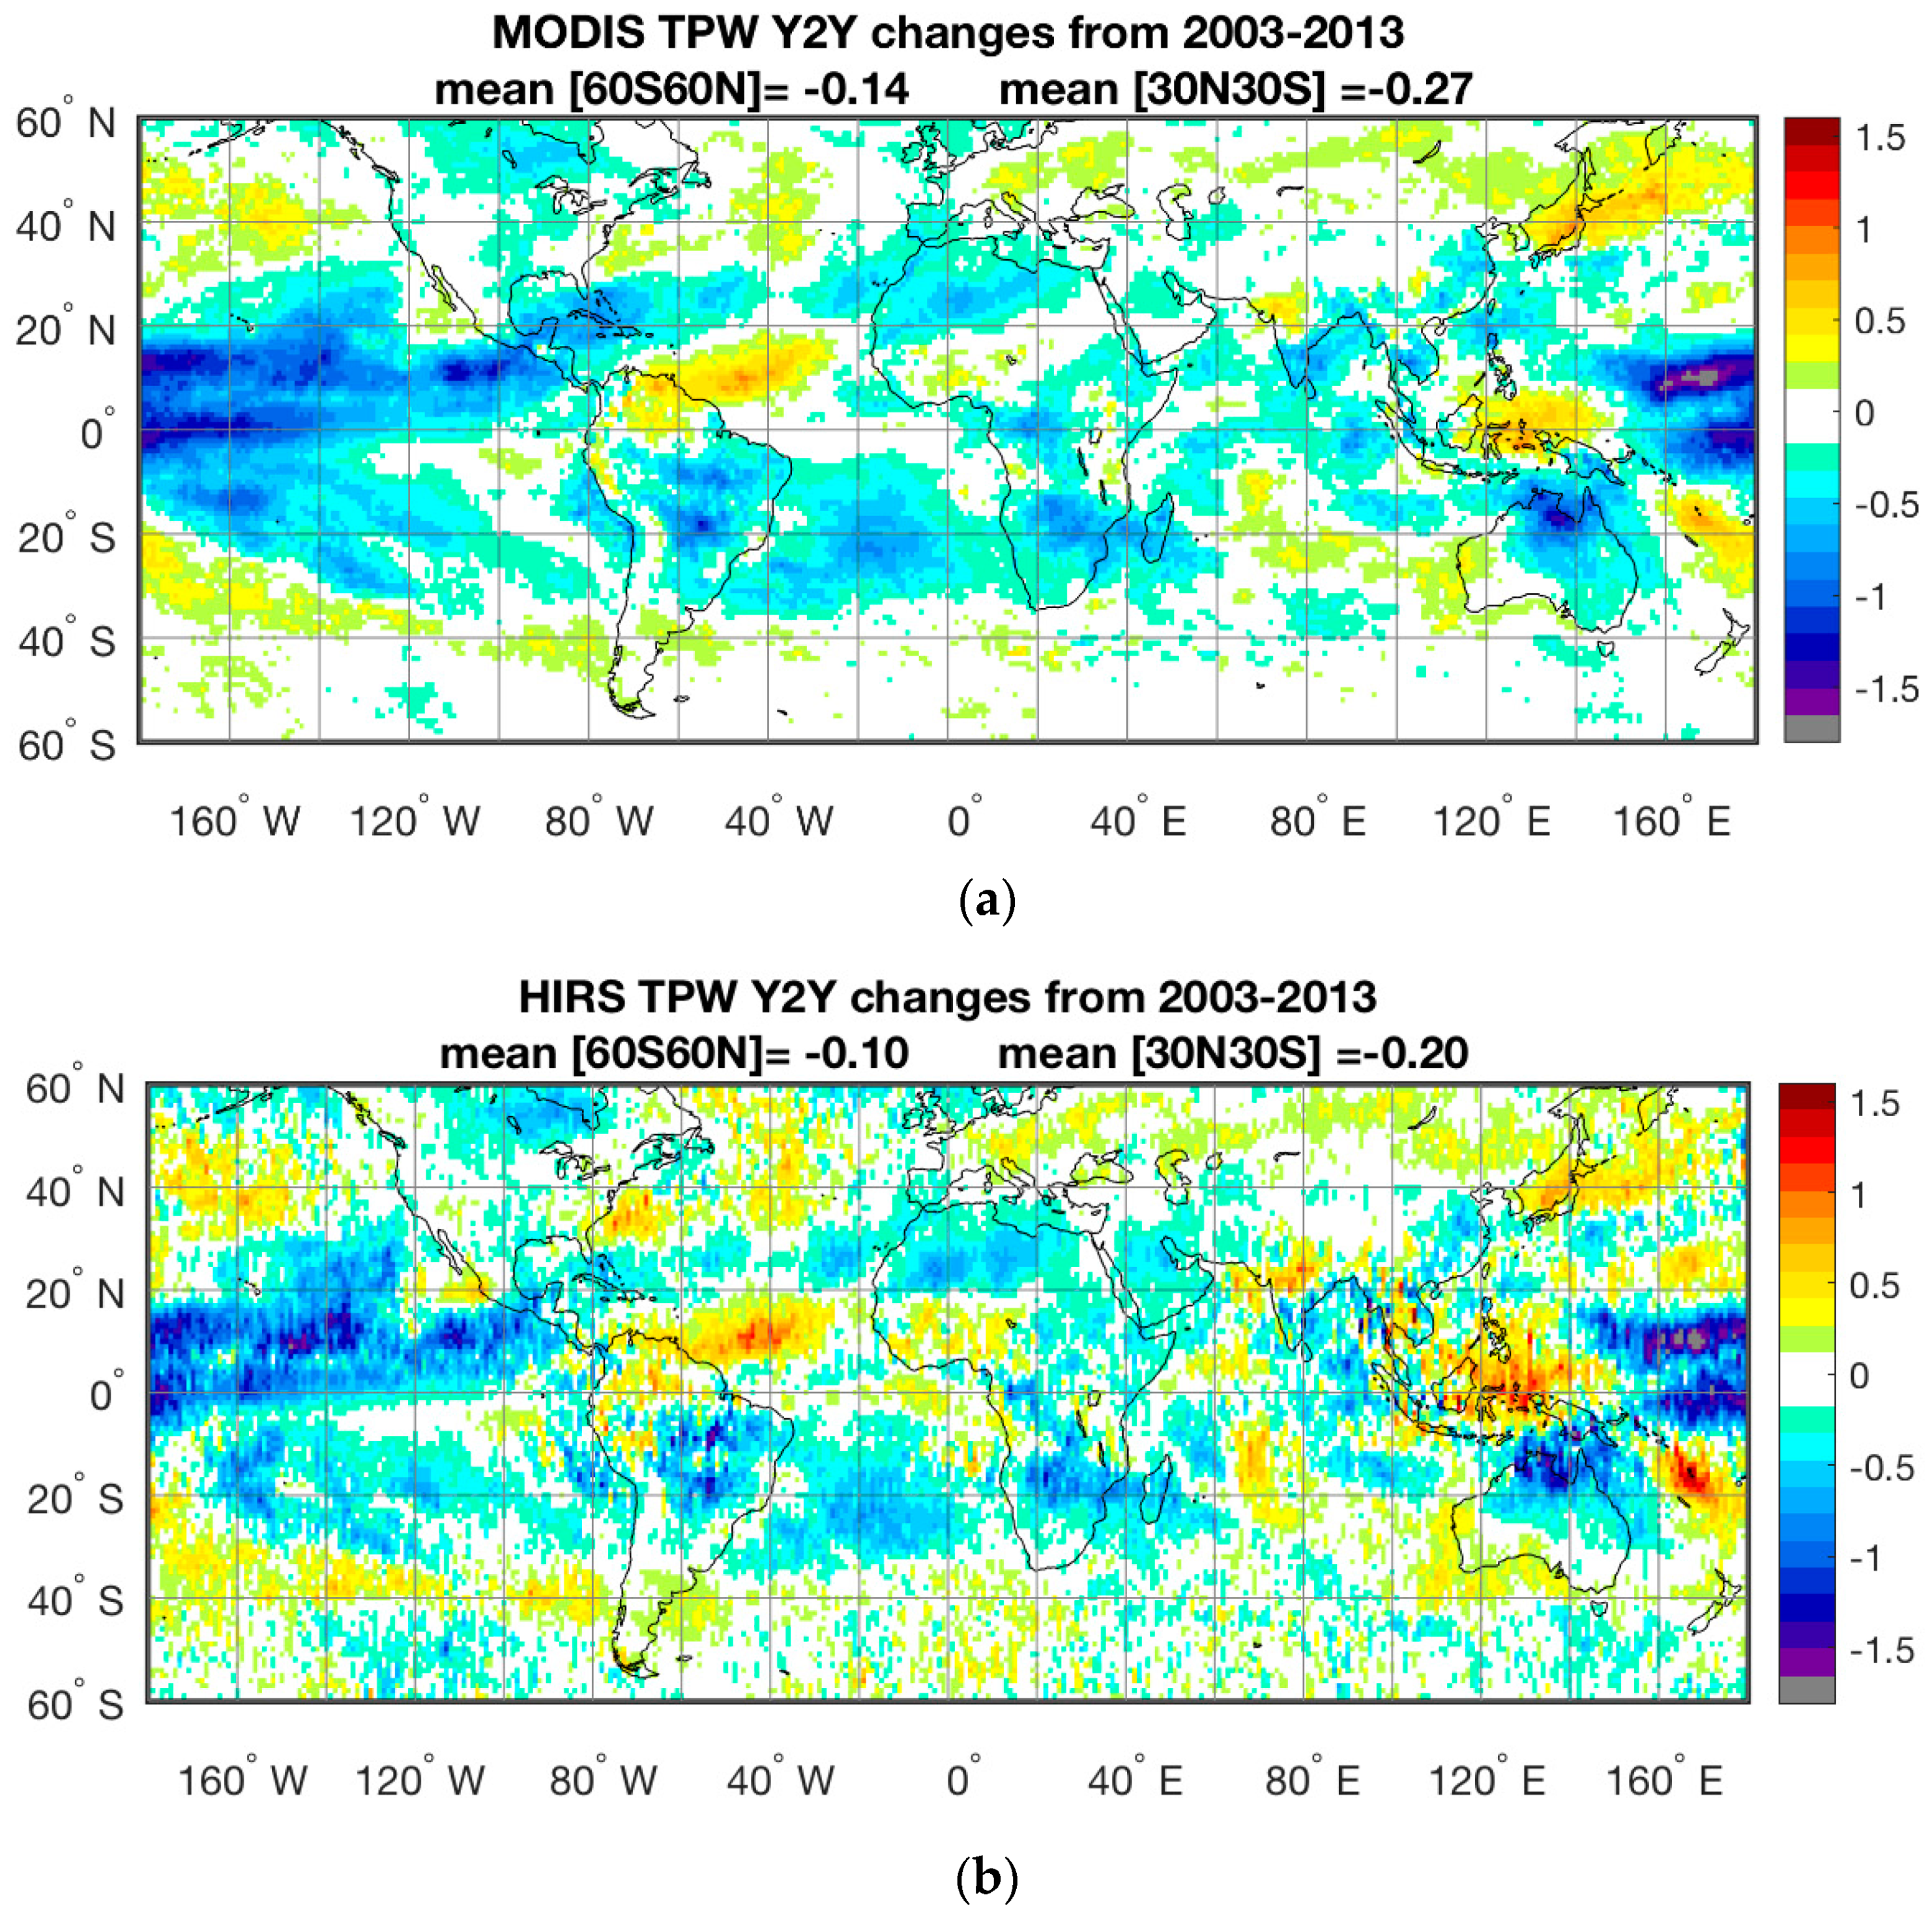
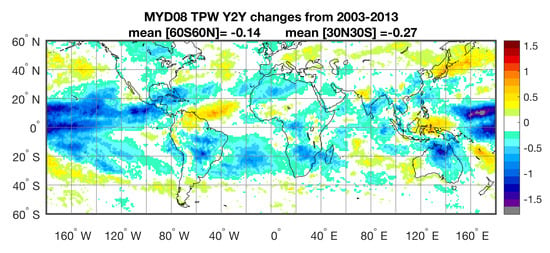
Year-to-year TPW and UTPW changes for the twelve months are averaged to produce maps of mean changes over the time period of the study. Moisture values from each of the twelve months are aggregated separately over the years 2003–2013, and then averages are taken over all months to infer mean changes. Spatial resolution is 1 degree for both instruments. In November 2005, the operational sensor changed when NOAA-16 was replaced by NOAA-18; thus, the one year changes between November 2004 and November 2005, December 2004 and December 2006, through to October 2005 and October 2006, are omitted from the average. Again, in June 2009, NOAA 18 was replaced by NOAA 19, so the one year monthly differences involving June 2009 through May 2010 (e.g., June 2008 and June 2009, July 2008 and July 2009, May 2009 and May 2010) are omitted from the average. The same monthly differences are also eliminated in the MODIS average to keep temporal coverage the same (it is noted that the MODIS year to year trends for this time period were not significantly affected by the exclusion of these months).
Figure 9 and
Figure 10 show the global distribution from 60°N to 60°S of changes in one degree latitude/longitude bins detected by HIRS and MODIS, respectively. TPW decreases as large as 1.0 mm per year are noticeable (
Figure 9) in the equatorial Pacific Ocean with increases of 0.5 mm per year in the Indonesian region; more decrease is apparent in the southern hemisphere than the northern hemisphere. HIRS sees mostly the same pattern, but is noisier because of the larger HIRS FOV and more possible cloud contamination (with the less accurate cloud mask). The average TPW decrease in the Tropics is −0.27 mm for MODIS and −0.20 mm for HIRS. UTPW, follows the lead of TPW, shows a similar geographical distribution of decrease and increase (
Figure 10). The HIRS UTPW year to year changes are again noisier than those from MODIS; both show a mean UTPW decrease of about −0.01 mm. As has been pointed out in the literature, the clear sky constraint imposed on infrared TPW and UTPW determinations is necessarily introducing a dry bias by avoiding the cloudy regions associated with higher humidity [
36].
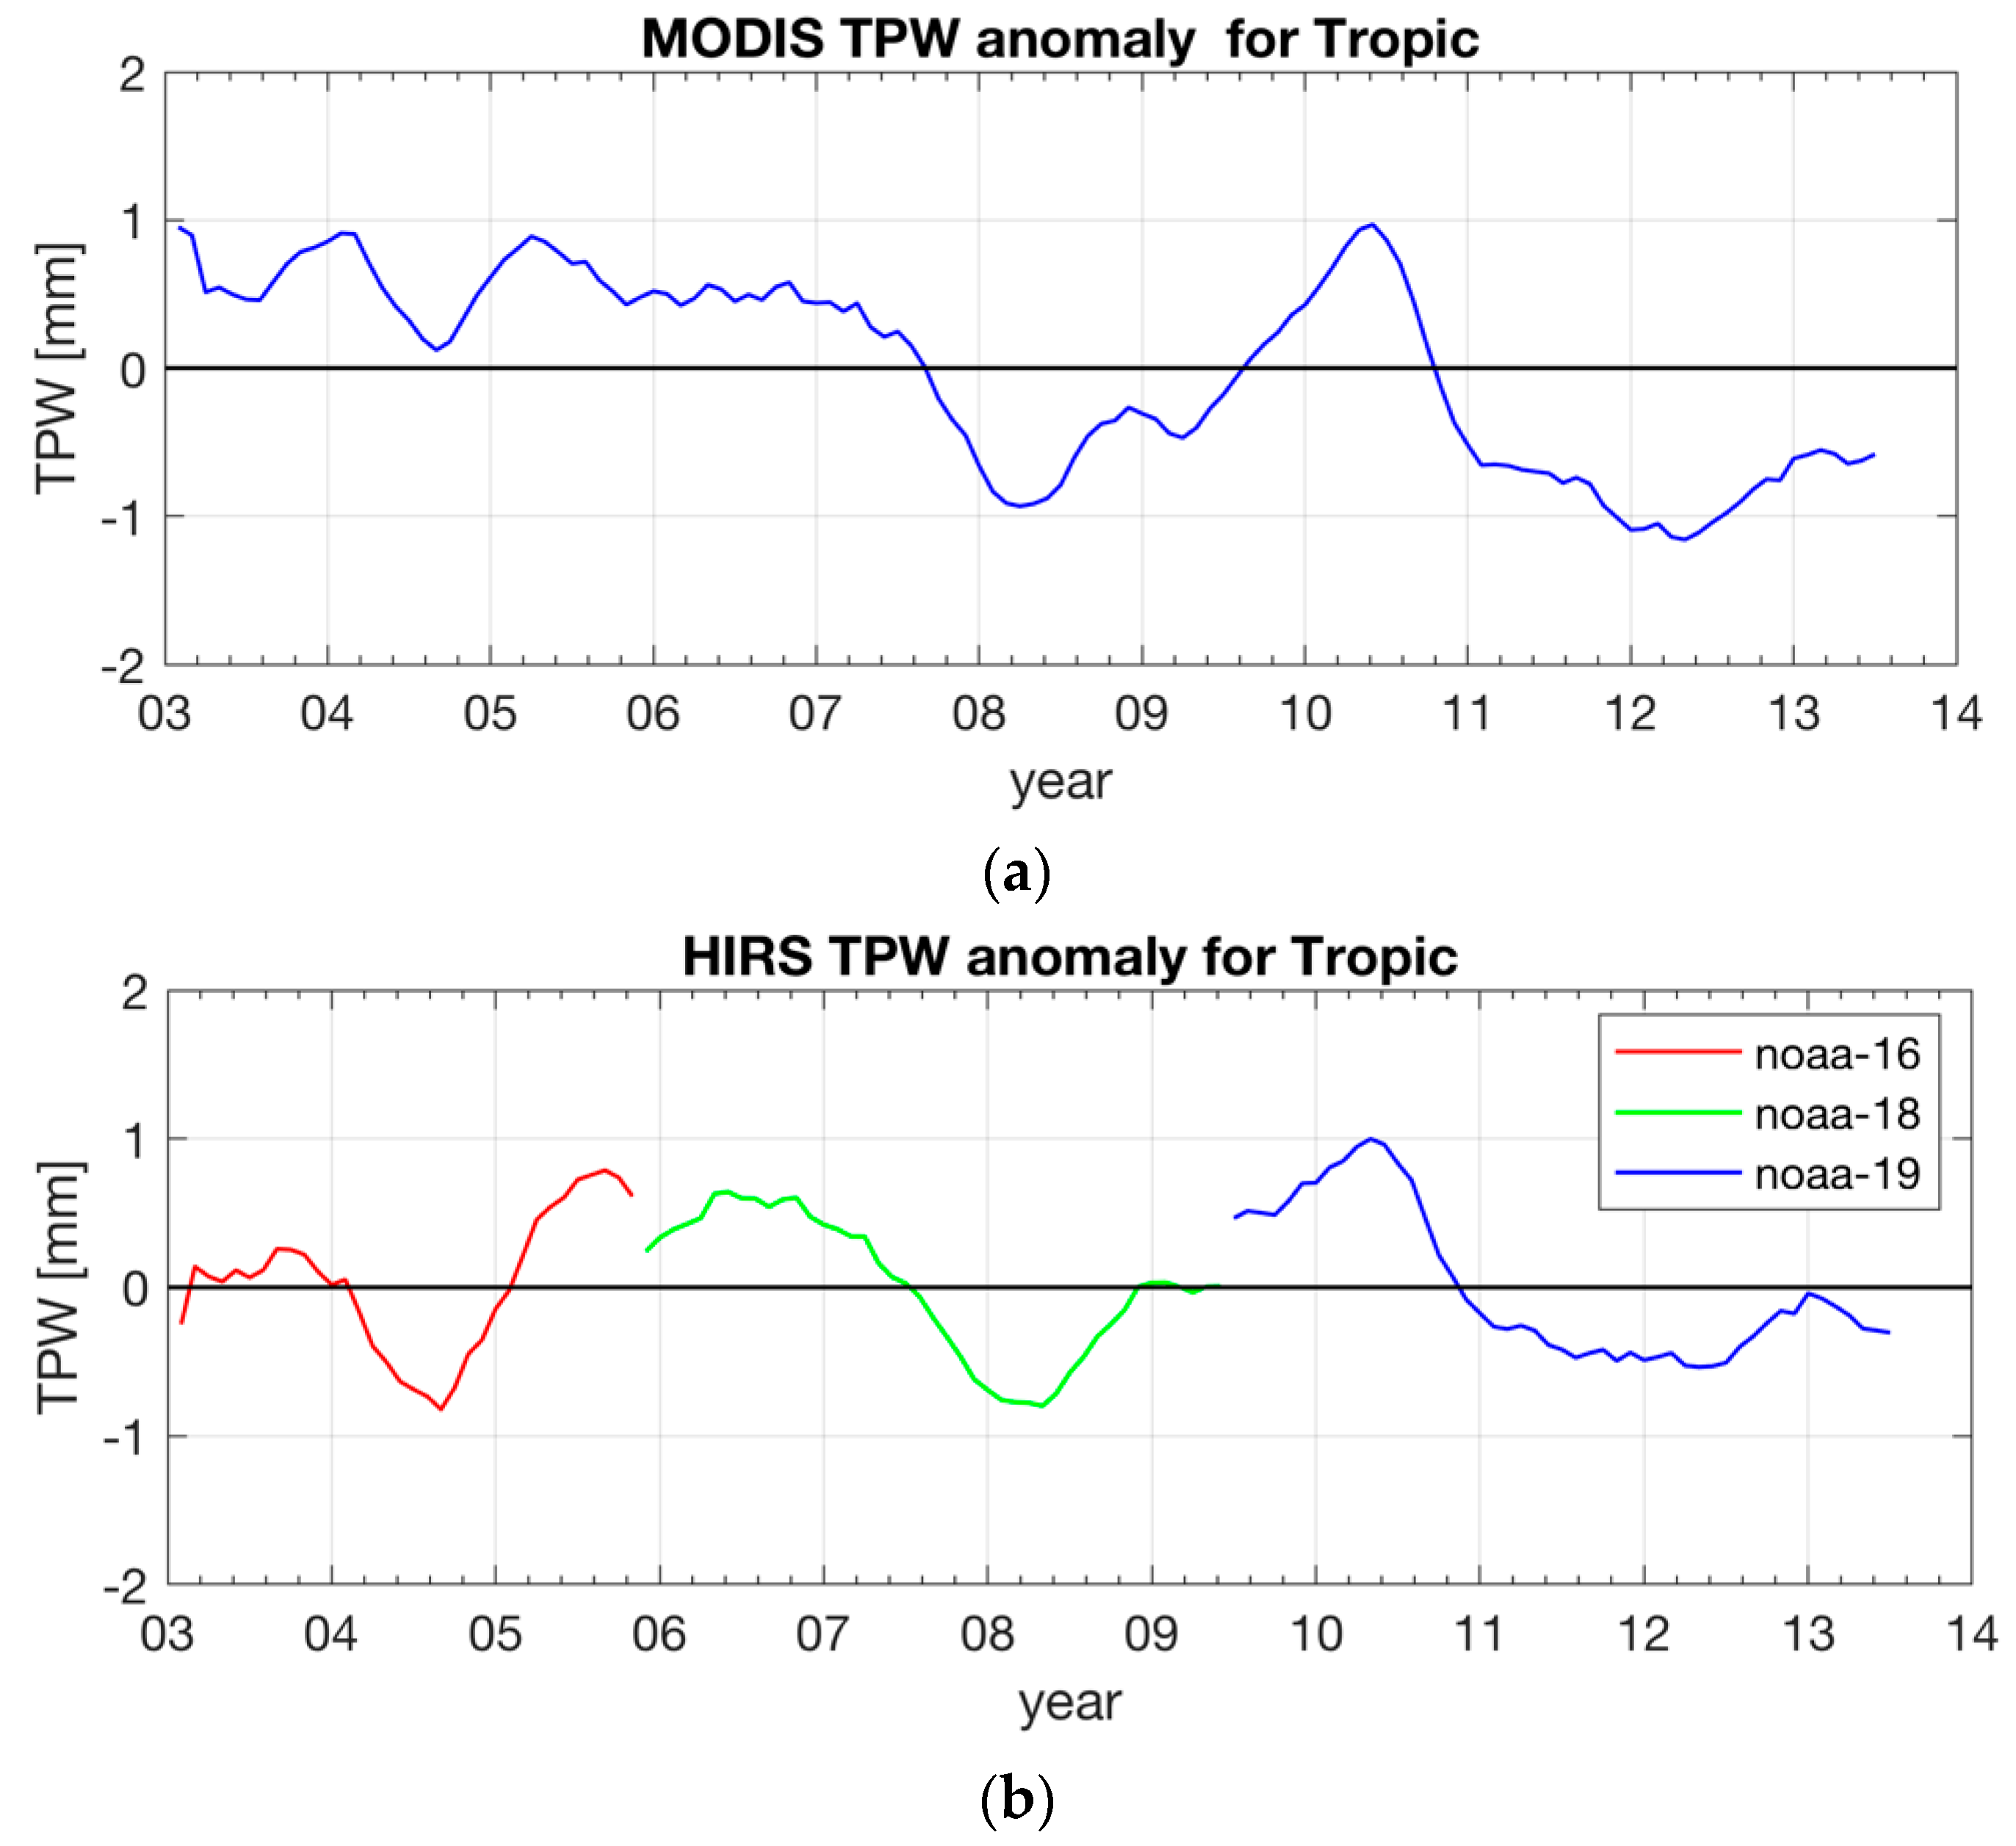
The changes in the tropics (30°S to 30°N) in TPW over time are shown in another way in
Figure 11. The anomaly with respect to the mean value of the TPW for each sensor (MODIS from 2003 through 2013, HIRS on NOAA-16 from 2003 to May 2005, HIRS on NOAA 18 from June 2006 to August 2008, and HIRS on NOAA-19 from September 2009 to June 2013) is plotted as a function of time. This display mitigates sensor to sensor discontinuities and provides a sense of the overall trend in tropical moisture changes. In these ten years, tropical moisture is shown to have decreased, due in part to the strong La Nina years of 2007–08 and 2010–11. Agreement between HIRS and MODIS is best for NOAA-18 and -19, and less so for NOAA-16.
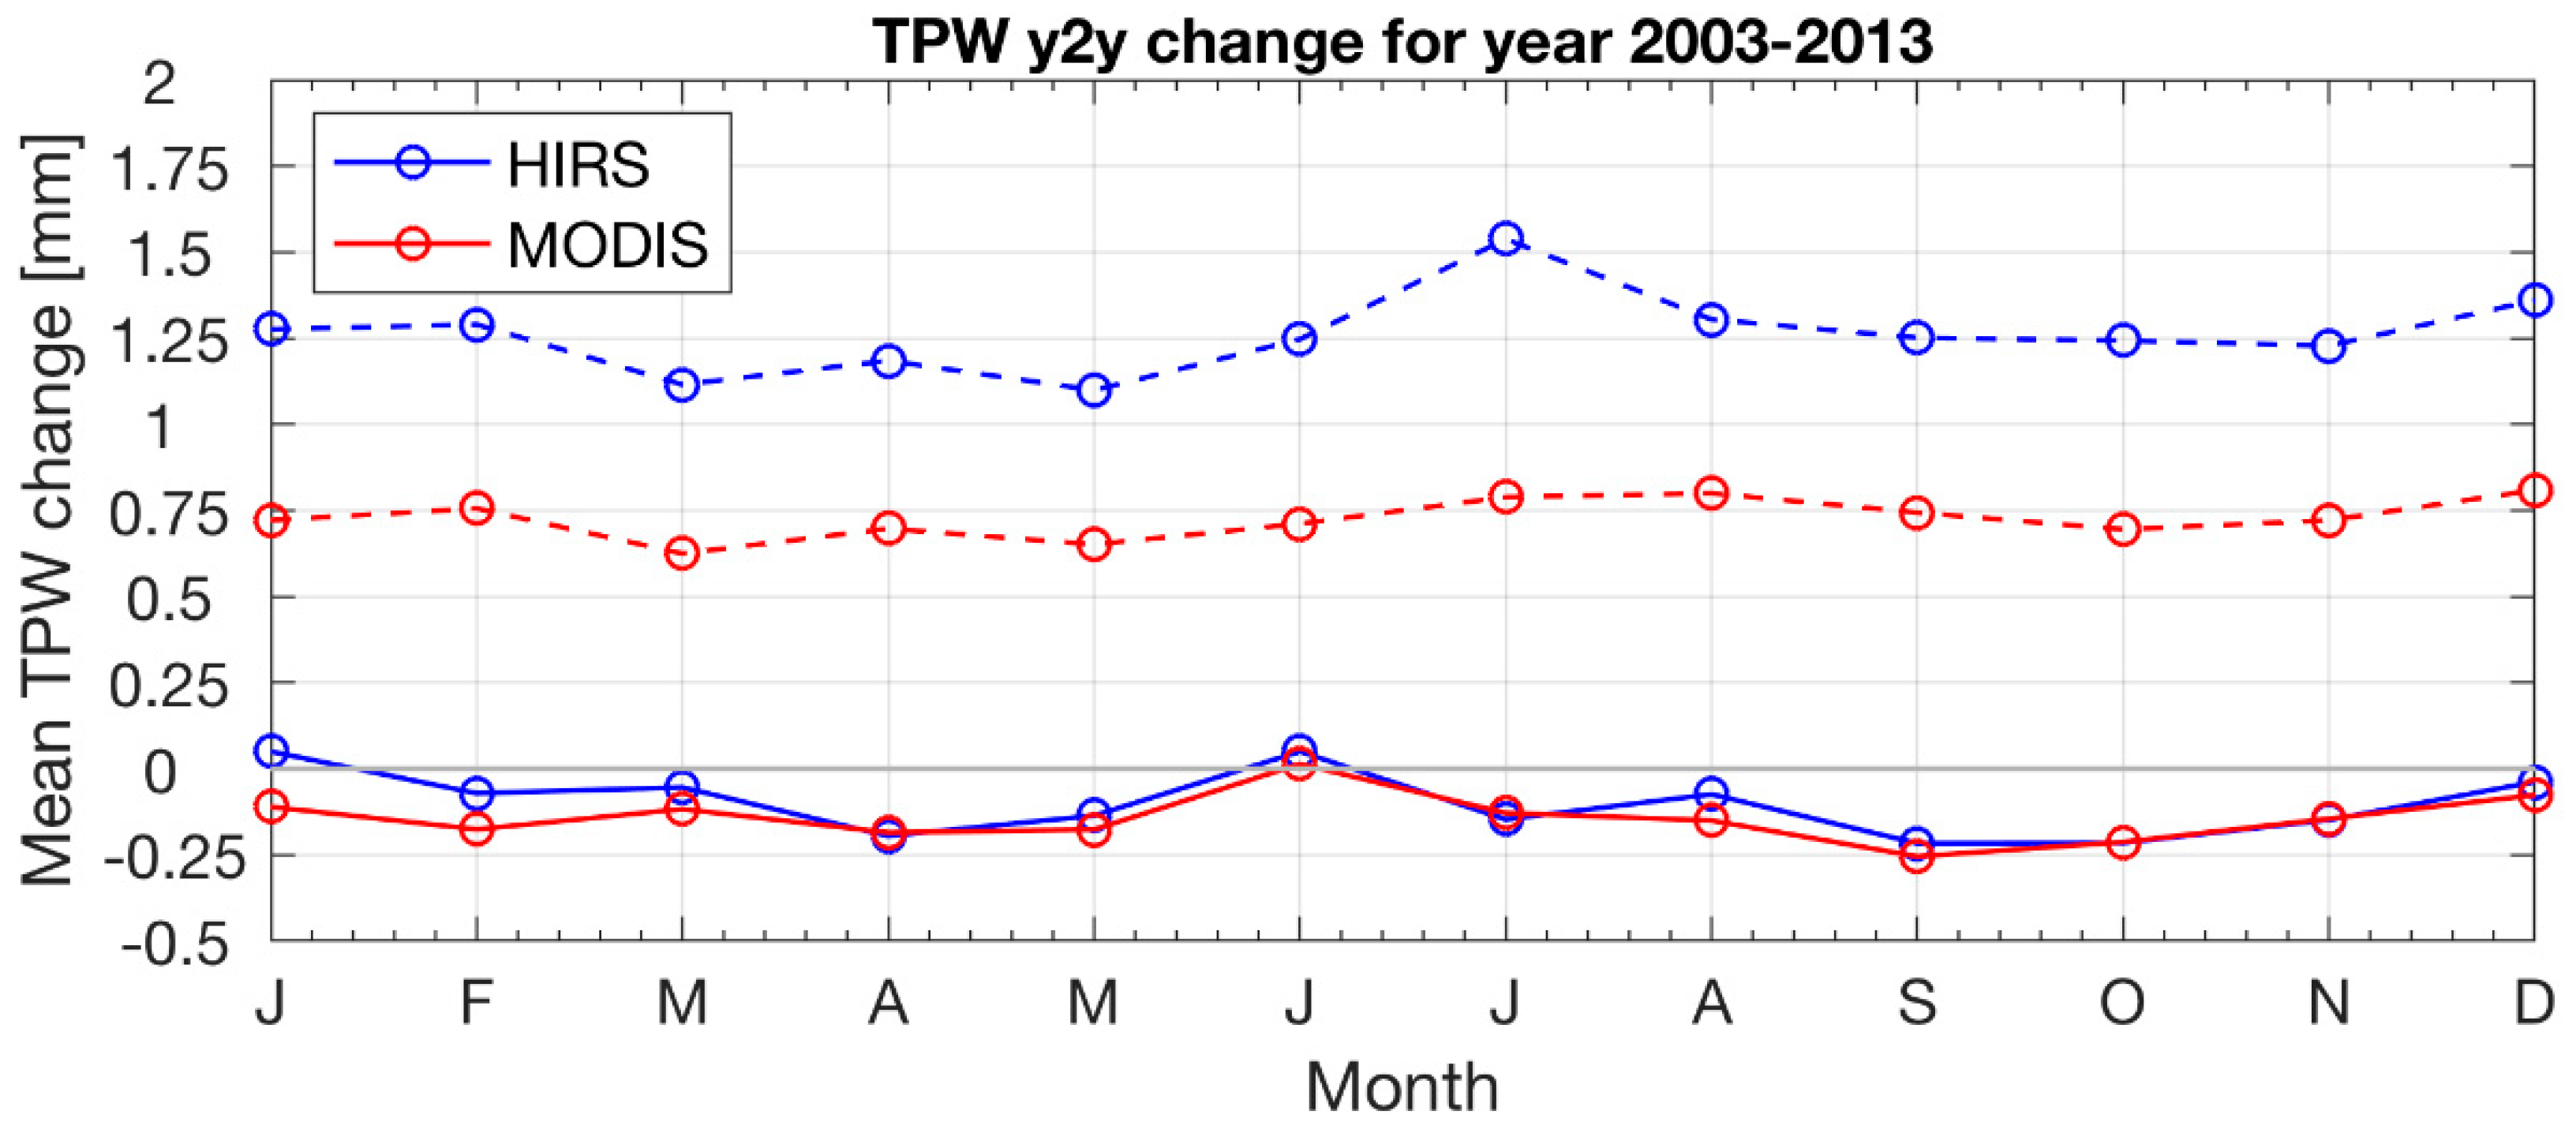
MODIS and HIRS same-sensor year-to-year TPW changes for each month for each one degree grid box from 60°S to 60°N latitudes are averaged (again omitting those months when replacement of the operational sensor affected the one year change determinations) and the mean and standard deviation for each month in the years 2003 to 2013 are shown in
Figure 12. HIRS mean monthly changes are about the same in an absolute sense as those of MODIS; both are about −0.2 mm. HIRS shows a higher standard deviation about those means, 1.3 mm compared to 0.8 mm for MODIS; as noted earlier, this is likely due to the larger FOV sizes accompanied by less accurate screening for clear skies. For both HIRS and MODIS, the variability in the monthly means from year to year is considerable (roughly 6 and 4 times greater than the mean, respectively). Mean values for HIRS and MODIS in
Figure 12 do not indicate any significant trend; they are small, negative, and well within the standard deviation (scatter). There is a modest indication of less change in December and January and again in June. Both data sets show lower standard deviation in March and higher values in July. Overall, while the global patterns through the hemispheres are similar, inferring the mean changes at a given individual location is difficult because the variability in TPW obscures any trend that might be present. However, coherent changes in a region that are greater than the standard deviation of the monthly changes for each instrument (0.8 mm for MODIS and 1.3 mm for HIRS) should be considered significant in
Figure 9.
