Abstract
The displacement of Global Navigation Satellite System (GNSS) station contains the information of surface elastic deformation caused by the variation of land water reserves. This paper selects the long-term coordinate series data of 671 International GNSS Service (IGS) reference stations distributed globally under the framework of World Geodetic System 1984 (WGS84) from 2000 to 2021. Different noise model combinations are used for noise analysis, and the optimal noise model for each station before and after hydrologic loading correction is calculated. The results show that the noise models of global IGS reference stations are diverse, and each component has different optimal noise model characteristics, mainly white noise + flicker noise (WN+FN), generalized Gauss–Markov noise (GGM) and white noise + power law noise (WN+PL). Through specific analysis between the optimal noise model and the time series velocity of the station, it is found that the maximum influence value of the vertical velocity can reach 1.8 mm when hydrological loading is considered. Different complex noise models also have a certain influence on the linear velocity and velocity uncertainty of the station. Among them, the influence of white noise + random walking noise is relatively obvious, and its maximum influence value in the elevation direction can reach over 2 mm/year. When studying the impact of hydrological loading correction on the periodicity of the coordinate series, it is concluded whether the hydrological loading is calculated or not, and the GNSS long-term coordinate series has obvious annual and semi-annual amplitude changes, which are most obvious in the vertical direction, up to 16.48 mm.
1. Introduction
The global IGS base station location time series accumulated in the past 20 years have provided valuable basic data for geodesy and geodynamic research. Many scholars have also launched a lot of research on it, including periodic signal analysis, stochastic model research, spatial filtering method and surface loading model research, etc., in GNSS coordinate time series [1,2,3,4,5,6,7,8,9,10,11,12,13,14,15,16]. Analyzing it can get the precise movement trend of the station, so as to further study the internal driving mechanism of the station movement. It has far-reaching theoretical significance and broad application prospects to explain plate tectonic movement, establish and maintain a dynamic earth reference frame, study post-ice rebound and sea level changes, and invert the changes in ice and snow quality.
The noise of IGS station mainly comes from some random factors. As the stations are located all over the world, the geographical environment is very different and the sources of noise influence are also different. For example, different types of observation piers, missing time series data, time series of different spans, different geographical environments, etc. may generate some noise [17]. Currently, a large number of researchers generally believe that the characteristics of GNSS coordinate series noise model are WN+FN [18,19,20]. However, it turns out that this statement is not entirely true. The noise model characteristics of the reference station are actually more complicated. Langbein [3] estimated the noise model of 236 continuous GPS operation stations in California and southern Nevada in 2008; the results showed that the best noise model of FN or random walk noise (RW) station accounted for 50% to 60%, 25%~30% of the station performance are FN+RW or non-integer spectral exponential powerlaw noise (PL). The remaining stations are expressed as band pass+powerlaw noise (BPPL) and first-order Gauss–Markov+random walk noise (FOGMRW). In 2019, Wang et al. [21] analyzed the coordinate time series of 260 continuous GPS stations in the Crustal Movement Observation Network of China (CMONOC). In the noise evaluation, the influence of periodic signals is considered, and the maximum likelihood estimation method is used to discuss the noise characteristics of the residual time series that remove seasonal signals and the coordinate time series that further remove other periodic signals. It is concluded that FN is the main noise related to time. If it is assumed to be pure white noise, its speed uncertainty will be underestimated by 8-10 times. In 2008, Yuan et al. [22] analyzed the noise characteristics of 12 GPS reference stations in Hong Kong. It was concluded that the noise model after the common mode error (CME) could be removed by the principal component, and spatial filtering can be described by the variable white noise (VW) plus flicker noise. In 2010, Jiang et al. analyzed the coordinate series data of the China Continuously Operating Reference Stations (CORS) network in the past 10 years. The results point out that under the framework of the China Geodetic Coordinate System 2000 (CGCS2000), the noise model of coordinate time series appears as WN, FN and RW after principal component filtering. Additionally, if only white noise is considered, the velocity error will be 2~6 times smaller than when colored noise is considered [23].
The reason why WN+FN is considered to be the noise model representing the optimal random characteristics of the station may be analyzed in two ways: (1) When analyzing the time series, a more complex noise model that sufficiently represents the noise characteristics of the reference station is not used; (2) The time scale of the accumulated coordinate series is not long enough to explain the long-period component of the noise model. With the passage of time, the GNSS reference station coordinate time series continue to grow, and the long-period components of noise (such as RW noise with spectral index=2) will become more prominent, which provides favorable conditions for detecting the existence of low-frequency noise. Therefore, it is meaningful to conduct a more comprehensive noise analysis on GNSS time series and obtain a noise model that can more accurately represent the random characteristics of the reference station.
The GNSS coordinate series contains various ground loading changes related to the elastic deformation of Earth, and is closely related to changes in the atmosphere, seabed pressure, snow, ice, surface water and groundwater [24,25]. Some scholars have deeply analyzed the spatial and temporal distribution characteristics of the vertical displacements of IGS stations caused by the above environmental loadings. Their influence on the nonlinear variation and common mode error (CME) of GPS coordinate time series are estimated. The results show that the average root mean square (RMS) of vertical displacement caused by environmental loadings is 4.0 mm. The impact on one station can reach centimeter level [26]. Collilieux et al. [27] conducted the study based on 748 stations around the world, with many stations concentrated in North America and Europe. They found that when the time series were corrected for loading, the in-phase and out-of-phase coefficients of the annual signal in GPS height coordinates were reduced by 84% and 83 %, respectively. These factors may have a profound influence on the characteristics of the generated noise [28,29]. Among them, the land hydrological loading change is an important factor that causes the periodic vertical deformation of GNSS stations [30,31,32]. The increase of the hydrological loading on the land will cause the ground to sink, causing the vertical position of the GNSS station to move downward. Decreasing the hydrological loading on the land will cause the surface to rebound, causing the vertical position of the GNSS station to move upward.
The main innovation of this article is to use longer GNSS coordinate time series, adopt more types of noise model combinations and more IGS reference stations, and analyze the optimal noise model characteristics of global regional coordinate time series. At the same time, the displacement of the station caused by the hydrological loading is calculated, and the change analysis of the optimal noise model before and after the hydrological loading correction is given. On this basis, the relationship between the optimal noise model and the velocity, velocity uncertainty and amplitude of the stations are established. The organization structure of this article is as follows. The second part contains GNSS, hydrological data and theoretical methods to be analyzed in this article. The third part analyzes the optimal noise model of the selected station, including the comparison of the optimal noise model before and after hydrological loading correction. In the fourth part, the velocity and velocity uncertainty of the stations and the amplitude of the long-term coordinate series are discussed with different noise models before and after the hydrological loading correction. Finally, the fifth part summarizes the main results.
2. Data and Methods
2.1. GNSS Data
The GNSS time series data used in this article are released by the Scripps Orbit and Permanent Array Center (SOPAC), a data analysis center organized by the IGS [33]. This organization not only publishes some raw GNSS time series results, but also publishes its processed (Clean) time series products. In this article, we mainly use the linearized mean GNSS time series (CleanDetrend) after removing the step (coseismic and non-coseismic) and singular values. Seasonal period term is retained. In order to analyze the impact of various noises on it and explain the results of the global optimal noise model after adding hydrological loading.
Before data analysis, this paper needs to filter the long-term coordinate series data of 671 IGS reference stations distributed globally under the framework of WGS84 from 2000 to 2021. The screening criteria are as follows: first, within the 21 years, the length of the GNSS coordinate series shall not be less than 3 years to ensure the integrity of the long time series and the reliability of the data processing results. Then, delete sites with obvious abnormal nonlinear motion, including obvious post-earthquake deformation caused by a major earthquake, local surface deformation or abnormal motion caused by other unknown causes. Through the elimination of the above steps, 671 sites around the world are finally selected for data processing. The time length distribution of the selected GNSS stations in the past 21 years are shown in Figure 1. The longest time series can reach 20.54 years, the shortest time length is 3.47 years, the average time length can reach 13.25 years, and the average data integrity rate can be up to 63.1%. In this article, the average data integrity rate equals average time series length of selected sites divided by the total length of GNSS coordinate time series (21 years).
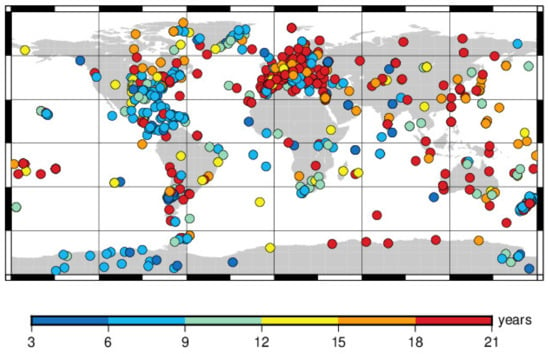
Figure 1.
Distribution of 671 giobal GNSS reference stations and their coordinate time series length in 21 years (2000–2021).
2.2. Hydrological Loading Data
Environmental loadings including hydrological loading, atmospheric loading, non-tidal ocean loading and other environmental factors are closely related to the elastic deformation of the earth, and these factors will also have a significant impact on the noise characteristics generated in the GNSS time series [25,28]. The impact of this loadings are not considered in the GNSS coordinate time series data processing under the WGS84 framework provided by SOPAC. Among them, the change of hydrological loading is an important factor that causes periodic vertical deformation of GNSS stations, as well as an important cause of surface subsidence and rebound. Therefore, it is particularly important to study the influence of hydrological loading on the GNSS coordinates time series [30,31].
At present, many organizations provide hydrological loading products, for example, German Research Centre for Geosciences (GFZ) (http://rz-vm115.gfz-potsdam.de:8080/repository), International Mass Loading Service (IMLS) (http://massloading.net) products released by National Aeronautics and Space Administration (NASA) and School and Observatory of Earth Sciences (EOST) (http://loading.u-strasbg.fr/) loading products from university of Strasbourg. This article first selects the hydrological loading (HYDL) data products provided by GFZ [25,34] and estimate the displacement of global GNSS stations caused by hydrological loading, and subtract the influence of hydrological loading from the GNSS coordinate series. Then, analyze the optimal noise model of the global GNSS coordinate series taking into account the hydrological loading. Finally, based on the optimal noise model combination, we will further discuss its influence on the long-term coordinate series velocity, velocity uncertainty and amplitude of the IGS stations.
The hydrological loading data selected in this paper are based on the center of figure (CF) frame, with a time resolution of 24 h and a spatial resolution of 0.5° × 0.5°. The hydrological loading data model calculated by GFZ is the Land Surface Discharge Model (LSDM) [35]. The physics and parameterization of the LSDM is based on the research of Hagemann and Düumenil (1998). LSDM includes soil moisture, snow cover, shallow groundwater, and surface water stored in rivers and lakes [36].
2.3. Theoretical Method
The GNSS coordinate sequence is represented by two parts: a deterministic model and a stochastic model [37]. The deterministic model is composed of trend, periodic terms (including anniversaries, semi-anniversaries, etc.), offset terms, etc. The stochastic model is the noise that this article will analyze. The GNSS coordinate time series is represented by the following functional model.
In the above formula, is the intercept; is the linear trend in unit per year, where a year is defined as 365.25 days; is the epoch of the GNSS time series; , are the amplitude of periodic signals and is the corresponding frequency; and is the offset and corresponding epoch, respectively; refers to the residual time series, which can be various combinations of noise models. is the Heaviside step function:
In this article, we use the Hector software to analyze the optimal noise model of the long-term coordinate series of the IGS reference station [38]. Hector software can estimate linear trend terms, high-order polynomials, seasonal terms, periodic terms and a variety of noise model combinations in coordinate time series. It uses the Akaike Information Criterion (AIC) and the Bayesian Information Criterion (BIC) information standards to select the optimal noise model [39,40]. Both use the maximum likelihood estimate as a starting point, but in order to avoid overfitting, measures are taken to add parameters. The AIC and BIC information standards are expressed by the following formula.
In the above formula, represents the actual number of observations, and refers to the covariance matrix, which can be decomposed into the following formula.
represents the sum of multiple noise models, and represents the standard deviation, which can be estimated by the residual term in the following formula.
Due to , Where refers to any matrix, refers to the determinant of matrix . Therefore, you can get
The parameter k refers to the sum of a design matrix and the noise model parameters and the variance of the driving white noise. For example, if the white noise + power law noise model is used to estimate the linear trend term, 5 parameters are estimated, including the normal offset, the linear trend term, the power spectrum index, the variance of driving white noise and the difference between power law noise and white noise .
Then,
AIC and BIC are commonly used optimal noise model evaluation indicators in the maximum likelihood estimation analysis of Hector software [41]. From the two calculation formulae, it can be found that the better noise model should have a smaller AIC or BIC value. Since BIC considers the number of parameters to be estimated in the model, it is more suitable for comparing noise models with different numbers of parameters to be estimated. In this article, the optimal noise model is obtained by using BIC evaluation criteria. There are many noise models to choose from in the Hector software, including PL, WN, FN, RW, GGM, first-order autogressive noise (AR1) and a combination model of these noises.
3. Results
3.1. Before Hydrological Loading Correction
As far as the global GNSS single-day solution time series are concerned, if no measures are taken to reduce the spatial correlation of the station, it can be concluded that WN + FN is the most suitable stochastic noise model reflecting global GNSS coordinates [2]. Due to the different environments of each measuring station, the sources of noise may also be different, and their noise characteristics may not be exactly the same. This paper selects six noise models, namely WN, GGM, WN+FN, WN+PL, WN+RW and WN+GGM. According to the evaluation criteria of the optimal noise model in Section 2.3 above, use Hector software to obtain the minimal BIC value corresponding to the N, E, and U directions of 671 sites around the world, then the noise model corresponding to this minimal BIC value is the optimal noise model of the selected site. Finally, statistics are made on the optimal noise models corresponding to 671 sites around the world, and the proportion of the global optimal noise models before the hydrological loading correction is obtained, as shown in Figure 2 below.
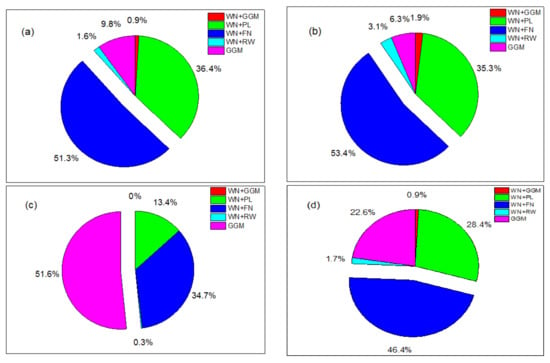
Figure 2.
The optimal noise model distribution in the North (N), East (E), Up (U) directions and total components of global International Global Navigation Satellite System (GNSS) Service (IGS) stations before hydrological loading correction. (a), (b) and (c) respectively show the optimal noise model percentage in the N, E and U directions. The optimal noise model percentage of total components shown in (d).
It can be seen from Figure 2 that the noise characteristics of global IGS reference station components are diversified, mainly represented by WN+FN and GGM models. Especially in the N and E directions, the WN+FN model accounts for 51.3% and 53.4% of the world’s optimal noise models, respectively. In the U direction, the GGM model has the largest proportion of the optimal noise model, which is as high as 51.6%. Next is the WN+PL noise model, and other combined noise models also occupy a certain proportion. The N, E, and U components of most stations exhibit different noise characteristics. As shown in Figure 2d above, the total components refer to the sum of the three directions of N, E, and U. Figure 2d shows the accumulation of the stations in these three directions to obtain the total optimal noise model percentage. For example, WN+FN, which accounts for the largest proportion of the optimal noise model, can reach 46.4%. It defines to the sum of the number of stations where the optimal noise model in the three directions of N, E, and U is WN+FN divided by the total number of stations in three directions (671*3). Therefore, when looking for a physical explanation for the change characteristics of time series, each component needs to be treated differently.
3.2. Hydrological Loading Displacement
This paper uses the hydrological loading products of GFZ to obtain the hydrological loading displacement values of the long-term coordinate time series of 671 IGS stations worldwide from 2000 to 2021. First, we selected three IGS stations at different latitudes, namely ACP1 (longitude 280.0501, latitude 9.3714), ALGO (longitude 281.9286, latitude 45.9558), ALRT (longitude 297.6595, latitude 82.4943). Then, we drew the displacement series diagram of their hydrological loading from 2000 to 2021. As shown in Figure 3, in the horizontal direction, the hydrological loading displacement values of these three stations are all small, and the maximum value is less than 2 mm. Especially for the station of ALRT, the maximum horizontal hydrological loading displacement is only 0.93 mm. However, it can be seen in Figure 3 that the hydrological loading influence value of these three stations is larger in the vertical direction. For the low-latitude station ACP1, the maximum vertical hydrological loading can reach 6.46 mm, and there is a periodic fluctuation in the long-term series. For the mid-latitude site ALGO, the maximum vertical hydrological loading can reach 9.48 mm, and the long-term series shows that its hydrological loading influence value has a downward trend. For the high-latitude site ALRT, the maximum vertical hydrological loading can reach 6.29 mm, but it has an upward trend in the long-term series. Regardless of whether the vertical hydrological loading series of these three stations rises, falls, or changes periodically, it may be related to the surrounding environment, including rainfall, soil moisture, etc.
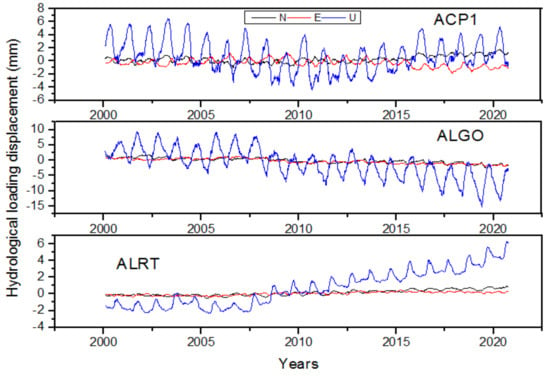
Figure 3.
Distribution diagram of hydrological loading displacement series at the three IGS stations ACP1, ALGO, and ALRT from 2000 to 2021.
Since the time span is as long as 21 years, this article counts the RMS value in the N, E, and U directions of the selected 671 IGS reference stations from 2000 to 2021 due to hydrological loading. Then, the maximum RMS value of the three directions of N, E, and U is represented by a histogram. As shown in Figure 4, the magnitude of the hydrological loading in the N and E directions are relatively small. Among them, the RMS value of more than 90% of the stations are less than 1 mm, the maximum RMS value in the E direction can reach 2.07 mm, and the maximum RMS value in the N direction can reach 2.15 mm. In the vertical direction, the magnitude of the influence of hydrological loading is relatively large, and the RMS value can reach 13.48 mm. Especially in the Amazon River Basin in South America, the Mississippi River Basin in North America, the Congo River Basin in Africa, the Yangtze River Basin in China and the Indochina Peninsula, the magnitude of the hydrological load is relatively large. Therefore, when considering the influence factors of the displacement of the reference frame, the hydrological loading must be considered.
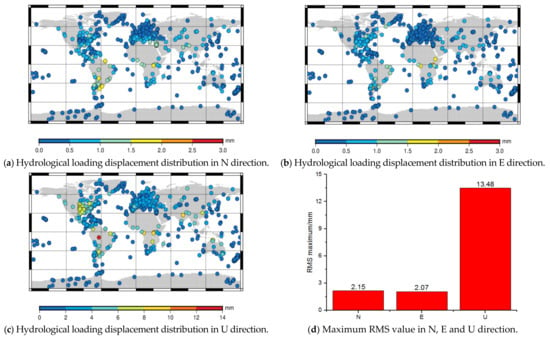
Figure 4.
A statistical diagram of the RMS value of hydrological loading displacement in the N, E, and U directions and their maximum RMS values. (a), (b) and (c) respectively show the RMS value of hydrological loading displacement in the N, E, and U directions and their maximum RMS values are shown in (d).
3.3. After Hydrological Loading Correction
Research shows that environmental loading, including hydrological loading, atmospheric loading and non-tidal ocean loading are the main factors that cause non-linear changes in stations [42]. Among them, the hydrological loading change is an important reason for the periodic vertical changes of GNSS stations. The GNSS time series itself contains the influence of loading. This article deducts it on the basis of it, and then analyzes the influence of hydrological loading on GNSS time series. Therefore, based on the above calculation results, this paper corrects the hydrological loading of these 671 IGS reference stations, re-analyzes the noise of the corrected coordinate time series, and obtains the optimal noise model of the global IGS reference station N, E, U components after deducting the influence of hydrological loading. Figure 5 shows the proportional distribution of the optimal noise model for each station component.
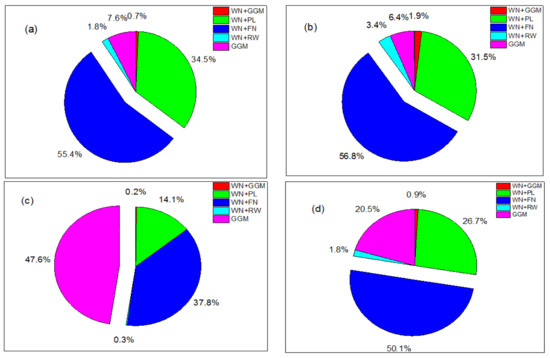
Figure 5.
The optimal noise model distribution in the N, E, U directions and total components of global IGS stations after hydrological loading correction. (a), (b) and (c) respectively show the optimal noise model percentage in the N, E and U directions and the optimal noise model percentage of total components are shown in (d).
From Figure 5a–d, it can be seen that, compared with Figure 2a–d, after calculating the hydrological loading correction, the percentage of the WN+FN model in the N, E, and U directions obviously increases, and the percentage of GGM model somewhat decreases. However, in the N and E directions, the optimal noise model, WN+FN, still accounts for the largest proportion with 55.4% and 56.8%, respectively. Compared with the case without employing hydrological loading correction, the percentage increased by 4.1% and 3.4%, respectively. The second largest proportion is WN+PL. In the U direction, the GGM model still has the largest proportion of the optimal noise model, accounting for 47.6%, followed by the WN+PL model. Regardless of whether the impact of hydrological loading is considered, in the long-term coordinate series analysis of global IGS reference stations, the smaller proportion of the optimal noise model are the combination of WN+GGM and WN+RW models.
4. Discussion
4.1. Velocity and Velocity Uncertainty Analysis
Studies have shown that the estimated values of velocity and velocity uncertainty in GNSS time series will vary with the noise model used [43,44,45]. Therefore, in the velocity error estimation, the influence of different noise models should be considered. According to the above analysis, in the global GNSS long-term coordinate series, WN+FN is the optimal noise model. The results obtained in this article are the same as those obtained by many previous scholars [46,47]. In this article, we used the CleanDetrend data provided by SOPAC, and the trend item information has been deduced from the GNSS time series. We added the optimal noise model combination WN+FN, using Hector software to extract the velocity of the selected 671 IGS long-term coordinate series. The uncertainty of the velocity is also generated immediately, which actually represents the fluctuation of the velocity value. When considering the optimal noise model combination WN+FN, compare the difference of the velocity and its uncertainty relative to SOPAC. That is, when only WN + FN is considered, the velocity and velocity uncertainty difference distribution of each station components are shown in Figure 6 below:
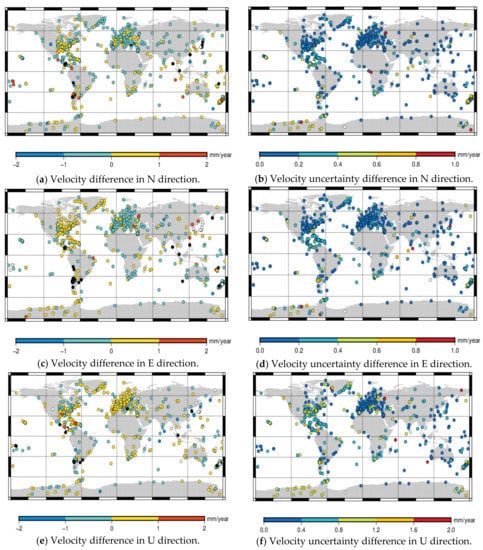
Figure 6.
The difference between the velocity and its uncertainty estimation under the optimal noise model of global IGS stations. (a,c,e) show the difference between the velocity under the optimal noise model of global IGS stations. (b,d,f) show the difference between the velocity uncertainty estimation under the optimal noise model of global IGS stations.
In order to more clearly and intuitively see the specific size of the velocity difference and the velocity uncertainty difference of each direction in each interval, this article lists the percentage of the interval of velocity and velocity uncertainty of each station. As shown in Table 1, in the direction of N, E and U, the absolute value of the velocity difference is more than 85% within 1 mm, and only less than 10% of the stations have the absolute value of the velocity difference between 1 and 2 mm, and some of them are larger than 2 mm. As shown in Figure 6a,c,e, these sites over 2 mm are marked with black and white dots. We can see that most of the black and white dots are near the coastal area. For example, ANTC (longitude 288.4680°, latitude −37.3387°), MIZU (longitude 141.1328°, latitude 39.1352°) stations, etc. The reason for analysis may be related to the imperfect simulation of noise models in these coastal areas. For the velocity uncertainty difference, in the N and E directions, 86% and 87% of the stations velocity uncertainty differences are less than 0.4 mm/year, and the maximum value is less than 1 mm. In the U direction, the influence value is slightly larger than that in the N and E directions. A total of 87% of the stations velocity uncertainty differences are less than 0.8 mm, and the maximum value is less than 2 mm. If you consider the effects of rounding errors, the calculated results can be considered reasonable.

Table 1.
Distribution of station velocity and velocity uncertainty difference.
In order to further study the influence of hydrological loading on GNSS long-time series velocity and its uncertainty, considering only the WN+FN noise, this paper analyzes the differences in the velocities and its uncertainties of the 671 IGS stations before and after the hydrological loading correction, and draws the percentage diagrams in the N, E, and U directions. The result shows that it has basically no effect on the velocity uncertainty, but it will cause varying degrees of velocity changes at the station, especially in the vertical direction. The statistical results are shown in Figure 7. It can be seen that in the N direction, after the hydrological loading correction, the velocity influence value can reach up to 0.9 mm, and 97.4% of the values are between 0 and 0.2 mm. In the E direction, the maximum influence value can reach 0.5 mm, and 89.8% of the influence values are between 0 and 0.1 mm. In the U direction, we can see that the influence value is more obvious relative to the horizontal direction. Its maximum value can reach 1.8 mm, most of the sites are between 0 and 0.4 mm, and the percentage can account for 82.6%. Therefore, when estimating the vertical velocity, the influence of hydrological loading must be considered.

Figure 7.
The percentage diagram of velocity influence value before and after hydrological loading correction.
Compared with the WN+FN model, different complex noise models will also have a certain impact on the station velocity and its uncertainty, as shown in Figure 8 below, the vertical direction is larger and the horizontal direction is smaller. Among them, regarding the influence of velocity, in the directions of N and E, the remaining four noise models are basically the same, and more than 85% of the station velocity differences are within 1 mm in absolute value. However, in the U direction, the ratio of the WN+RW velocity difference between (−1, 1) is significantly smaller than other noise models, accounting for only 68.7%, while in (−2, 1) and (1, 2), the proportion between them is slightly larger. The difference between these four noise models is mainly reflected in the velocity uncertainty. For the velocity uncertainty difference, in the directions of N, E, and U, the GGM noise model accounts for the largest proportion between (0, 0.2), accounted for 76.5%, 79.1%, 64.5%, respectively, followed by WN+GGM, WN+PL noise model combination. Among them, WN+RW has the largest impact level, and the velocity uncertainty difference of more than 85% of the stations are greater than 1 mm/year. Especially in the U direction, the velocity uncertainty difference is greater, and more than 95% of the stations are greater than 2 mm/year. It can be concluded that for the establishment of mm-level high-precision reference frames and plate motion analysis, we need to take into account the differences brought about by different noise models.
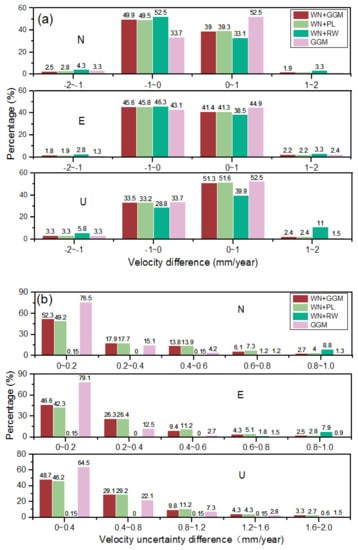
Figure 8.
The distribution of velocity and velocity uncertainty differences under different noise models. (a) shows the distribution of velocity differences under different noise models and (b) shows the distribution of velocity uncertainty differences under different noise models.
4.2. Amplitude Analysis
To study the relationship between the hydrological loading and the amplitude of the selected global IGS reference stations. In this paper, the annual and half-annual amplitudes of the stations considering the influence of hydrological loading under different noise models are estimated. The results under the optimal noise model are shown in Figure 9. It can be seen that no matter whether the hydrological loading is corrected or not, there are significant annual and semi-annual amplitudes at each station. Without considering the influence of hydrological loading, the U direction is the largest, and its maximum annual amplitude can reach 16.48 mm, and 95.7% of the stations have an annual amplitude between 0 and 8 mm. The N and E directions are next. In the N direction, the maximum annual amplitude can reach 9.87 mm, and in the E direction, the maximum annual amplitude can reach 10.07 mm. A total of 92.1% and 91.8% of the station sizes are between 0 and 2 mm. In addition to the influence of the annual amplitude, the half-annual amplitude also has a significant change, which is still more affected in the U direction, and its maximum value can reach 5.11 mm. Compared with the vertical direction, the horizontal half-annual amplitude is smaller. In the N and E directions, 93.4% and 90.6% of the stations are less than 1 mm.
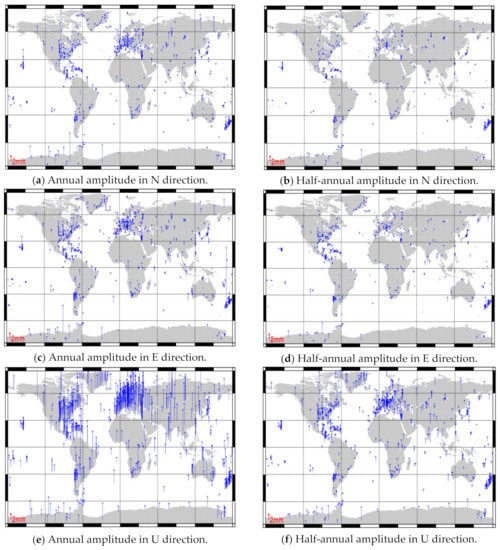
Figure 9.
Distribution of the annual amplitudes before hydrological loading correction are shown (a,c,e). (b,d,f) show the half-annual amplitude before hydrological loading correction. (unit: mm).
After the hydrological loading is corrected, when only the WN+FN noise model is considered, it will have a certain impact on the annual and half-annual amplitude of the stations. Figure 10 plots the annual and half-annual amplitude differences before and after the hydrological loading correction in each direction. It can be seen that after the hydrological loading correction is added, it still has a relatively large impact on the U direction. The maximum annual amplitude difference can reach 8.08 mm, and the annual amplitude difference of most stations are between −3 and 3 mm, which can account for 97.5%. Compared with the annual amplitude, the half-annual amplitude difference is smaller. In the U direction, the maximum value can reach 1.71 mm, and the absolute value of the half-annual amplitude difference of 98.6% of the stations are less than 1 mm. In the horizontal direction, whether it is the annual amplitude or the half-annual amplitude, its influence value is relatively small. In the N direction, the maximum annual amplitude difference is 1.04 mm, and the absolute value of the annual amplitude difference in 99.7% of the stations are within 1 mm. The maximum half-annual amplitude difference is 0.21 mm, and the absolute value of the half-annual amplitude difference in 98.3% of the stations are less than 0.2 mm. In the E direction, the maximum annual amplitude difference is 1.01 mm, and the absolute value of the annual amplitude difference in 99.9% of the stations are within 1 mm. The maximum half-annual amplitude difference is 0.32 mm, and the absolute value of the half-annual amplitude difference in 99.4% of the stations are less than 0.2 mm. From this, it can be concluded that the calculated hydrological loading will indeed cause the annual and semi-annual movements of IGS reference stations in the global region. The impact varies from station to station and is related to the geographical environment around the stations. The annual amplitude is larger than the half-annual amplitude, but it cannot completely reduce the annual and half-annual amplitudes of the GNSS long time coordinate series, especially the half-annual amplitude.
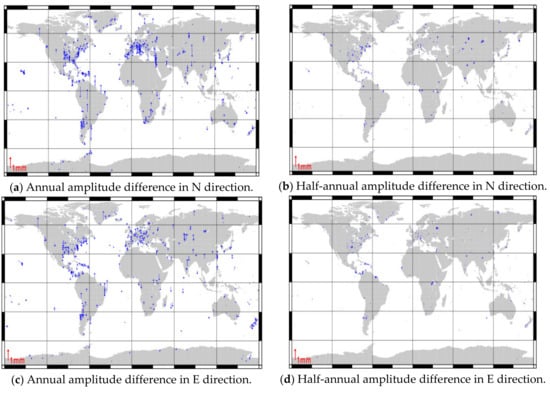
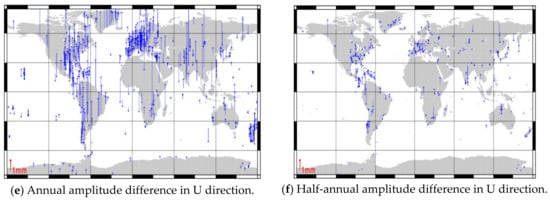
Figure 10.
Statistics of annual and half-annual amplitude differences before and after hydrological loading correction. (a,c,e) show the statistics of annual amplitude differences before and after hydrological loading correction. The half-annual amplitude differences before and after hydrological loading correction are shown in (b,d,f). (unit: mm).
In order to more clearly explain the influence of the hydrological loading correction on the annual and half-annual amplitudes, Table 2 lists the percentages of the annual and half-annual amplitude differences in each interval in the N, E, and U directions in detail.

Table 2.
Annual and half-annual amplitude difference percentage table before and after hydrological loading correction.
Figure 11 shows the statistics of the annual and half-annual amplitude difference before and after the hydrological loading correction in various directions under different noise models. It can be seen, no matter which noise model is selected before and after the hydrological loading correction, that the influence of the annual amplitude and half-annual amplitude is larger in the vertical direction and smaller in the horizontal direction. Therefore, it can be concluded when estimating the influence of the hydrological loading on the annual and semi-annual amplitude difference of the IGS station that the noise models including WN+FN, WN+PL, WN+RW, GGM and other noise models have negligible influence.
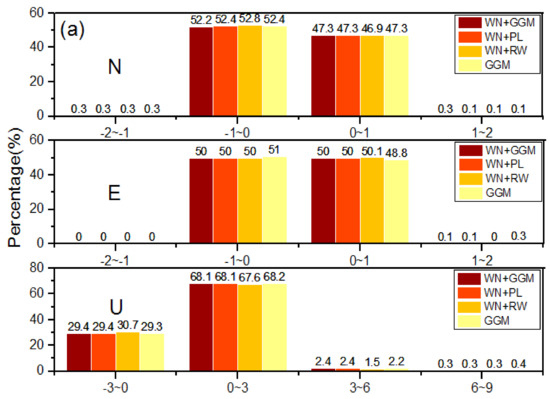
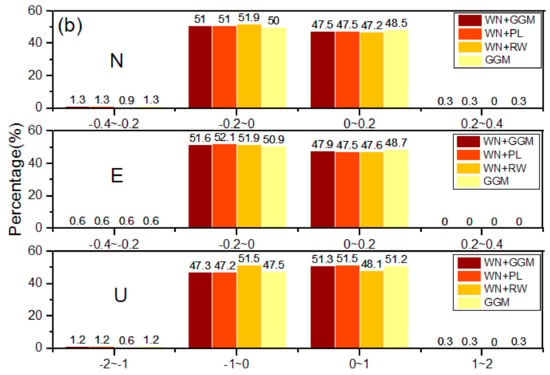
Figure 11.
Statistics of annual and half-annual amplitude difference under different noise models before and after hydrological loading correction. (a) shows the statistics of annual amplitude difference under different noise models before and after hydrological loading correction and (b) shows the half-annual amplitude difference under different noise models before and after hydrological loading correction. (unit: mm).
5. Conclusions
In this paper, we used the GNSS coordinate time series of 671 IGS stations around the world from 2000 to 2021 to analyze the world’s optimal noise model. More importantly, the influence of hydrological loading on the GNSS coordinates time series is discussed, and the following conclusions are obtained:
- Pure white noise cannot represent the optimal noise model for the long-term series of global IGS reference station coordinates. The noise models of global IGS reference station coordinate time series are diverse, and the N, E, and U directions show different optimal noise model characteristics. Before the hydrological loading correction, the optimal noise model for 46.4% of the station components is WN+FN, the optimal noise model for 28.4% of the station components is WN+PL, and the 22.6% components is the GGM noise model. There is also a small number of components represented as WN+GGM and WN+RW model combinations.
- Experiments show that the hydrological loading does cause changes in the noise characteristics of IGS stations. After calculating the hydrological loading correction, the ratio of WN+FN in the optimal noise model increased significantly (50.1%). Among them, the largest proportion of the optimal noise model in the U direction is still the GGM noise model (47.6%), followed by WN+PL.
- When studying the influence of hydrological loading on the velocity of the stations and its uncertainty, it is found that the hydrological loading has little effect on the velocity uncertainty of the IGS long-term coordinate series, but it will affect the velocity of the stations, especially in its vertical direction, its velocity influence value can reach up to 1.8 mm. Therefore, when estimating the vertical velocity, the influence of hydrological loading must be considered.
- Different complex noise models will affect the station velocity and velocity uncertainty. For WN+FN, 85% of the stations velocity influence value are within 1 mm. For velocity uncertainty, its influence in the vertical direction is more obvious, and the maximum value can be close to 2 mm. When analyzing the WN + RW noise model combination, its impact on the GNSS time series velocity uncertainty is quite different from other combined noise models. Therefore, when studying the influence of the world’s optimal noise model on time series, this will be the next step worth pondering.
- The hydrological loading will have a certain impact on the annual and semi-annual amplitudes of global IGS stations, which is mainly reflected in the vertical direction. The magnitude of the impact varies from station to station, mainly related to the environment around the station. The annual amplitude motion caused is greater than the half-annual amplitude motion. After adding hydrological loading correction, it cannot completely reduce the annual and half-annual amplitude movement of the station. The amplitude of some stations not only does not decrease, but shows an increasing trend. When considering the influence of different noise models on the annual and half-annual amplitude difference before and after hydrological loading correction, it is found that the influence value is very small and can be ignored.
However, there are currently many research institutions that have calculated the hydrological loading. In this article, only the hydrological loading products of GFZ are discussed, and other hydrological loading products are not explained. Therefore, in future research, multiple hydrological loading models should be compared and analyzed, and the influence of hydrological loading on the GNSS coordinates time series should be studied at a deeper level.
Author Contributions
Conceptualization, Y.H. and G.N.; methodology, Y.H. and S.W.; software, Y.H.; validation, G.N. and H.L.; formal analysis, H.L.; resources, G.N.; writing—original draft preparation, Y.H.; writing—review and editing, S.W.; visualization, H.L.; supervision, G.N.; funding acquisition, G.N. All authors have read and agreed to the published version of the manuscript.
Funding
This work is supported by the National Natural Science Foundation of China (Grant No. 41074023). National key Research and Development Scheme Strategic International Coopearation in Science and Technology Innovtion Program, and the funding number is No.2018YFE0206500.
Acknowledgments
The 671 long-time coordinate series calculated in this article from 2000 to 2021 were provided by SOPAC (ftp://garner.ucsd.edu/archive/garner/timeseries/measures/ats/). Hydrological loading data were provided by the GFZ agency from Germany (http://rz-vm115.gfz-potsdam.de:8080/ repository). The Hector software (http://segal.ubi.pt/hector/) was used to calculate and analyze GNSS long-term coordinate series. We used GMT software and Origin software to plot the calculation results. We express our heartfelt thanks to these organizations and software providers.
Conflicts of Interest
The authors declare no conflict of interest.
Abbreviations
| AR1 | First-order autogressive noise |
| AIC | Akaike Information Criterion |
| BIC | Bayesian Information Criterion |
| BPPL | band pass+powerlaw noise |
| CMONOC | Crustal Movement Observation Network of China |
| CME | common mode error |
| CORS | Continuously Operating Reference Stations |
| CGCS2000 | China Geodetic Coordinate System 2000 |
| CF | center of figure |
| EOST | School and Observatory of Earth Sciences |
| FN | flicker noise |
| FOGMRW | first order Gauss–Markov+random walk noise |
| GNSS | Global Navigation Satellite System |
| GGM | generalized Gauss–Markov noise |
| GFZ | German Research Centre for Geosciences |
| HYDL | hydrological loading |
| IGS | International GNSS Service |
| IMLS | International Mass Loading Service |
| LSDM | Land Surface Discharge Model |
| NASA | National Aeronautics and Space Administration |
| PL | power-law noise |
| RW | random walk noise |
| SOPAC | Scripps Orbit and Permanent Array Center |
| VW | variable white noise |
| WGS84 | World Geodetic System 1984 |
| WN | white noise |
References
- Blewitt, G.; Lavallée, D.; Clarke, P.; Nurutdinov, K. A new global mode of Earth deformation: Seasonal cycle detected. Science 2001, 294, 2342–2345. [Google Scholar] [CrossRef] [PubMed]
- Williams, S.D.P.; Bock, Y.; Fang, P.; Jamason, P.; Nikolaidis, R.M.; Prawirodirdjo, L.; Miller, M.; Johnson, D.J. Error analysis of continuous GPS position time series. J. Geophys. Res. Solid Earth 2004, 109, B03412. [Google Scholar] [CrossRef]
- Langbein, J. Noise in GPS Displacement Measurements from Southern California and Southern Nevada. J. Geophys. Res. Solid Earth 2008, 113, 1–12. [Google Scholar] [CrossRef]
- Van Dam, T.; Altamimi, Z.; Collilieux, X.; Ray, J. Topographically induced height errors in predicted atmospheric loading effects. J. Geophys. Res. Solid Earth 2010, 115, B07415. [Google Scholar] [CrossRef]
- Tian, Y.; Shen, Z. Extracting the regional common-mode component of GPS station position time series from dense continuous network. J. Geophys. Res. Solid Earth 2016, 121, 1080–1096. [Google Scholar] [CrossRef]
- Gu, Y.; Yuan, L.; Fan, D.; You, W.; Su, Y. Seasonal crustal vertical deformation induced by environmental mass loading in mainland China derived from GPS, GRACE and surface loading models. Adv. Space Res. 2017, 59, 88–102. [Google Scholar] [CrossRef]
- Chanard, K.; Fleitout, L.; Calais, E.; Rebischung, P.; Avouac, J. Toward a global horizontal and vertical elastic load deformation model derived from GRACE and GNSS station position time series. J. Geophys. Res. Solid Earth 2018, 123, 3225–3237. [Google Scholar] [CrossRef]
- Klos, A.; Bos, M.S.; Bogusz, J. Detecting time-varying seasonal signal in gps position time series with different noise levels. GPS Solut. 2018, 22, 21. [Google Scholar] [CrossRef]
- Klos, A.; Olivares, G.; Teferle, F.N.; Hunegnaw, A.; Bogusz, J. On the combined effect of periodic signals and colored noise on velocity uncertainties. GPS Solut. 2018, 22, 1–13. [Google Scholar] [CrossRef]
- Klos, A.; Gruszczynska, M.; Bos, M.S.; Boy, J.-P.; Bogusz, J. Estimates of vertical errors for IGS ITRF2014 stations by applying the improved singular spectrum analysis method and environmental loading models. Pure Appl. Geophys. 2018, 175, 1823–1840. [Google Scholar] [CrossRef]
- Yuan, P.; Li, Z.; Jiang, W.; Ma, Y.; Chen, W.; Sneeuw, N. Influences of environmental loading corrections on the nonlinear variations and velocity uncertainties for the reprocessed global positioning system height time series of the crustal movement observation network of China. Remote Sens. 2018, 10, 958. [Google Scholar] [CrossRef]
- Ming, F.; Yang, Y.; Zeng, A.; Zhao, B. Spatiotemporal filtering for regional GPS network in China using independent component analysis. J. Geod. 2017, 91, 419–440. [Google Scholar] [CrossRef]
- Ma, C.; Li, F.; Zhang, S.-K.; Lei, J.-T.; E, D.-C.; Hao, W.-F.; Zhang, Q.-C. The coordinate time series analysis of continuous GPS stations in the Antarctic Peninsula with consideration of common mode error. Chin. J. Geophys. 2016, 59, 2783–2795. [Google Scholar]
- Wang, M.; Shen, Z.; Dong, D. Effects of non-tectonic crustal deformation on continuous GPS position time series and correction to them. Chin. J. Geophys. 2005, 48, 1045–1052. [Google Scholar] [CrossRef]
- Ray, J.; Altamimi, Z.; Collilieux, X.; Van Dam, T. Anomalous harmonics in the spectra of GPS position estimates. GPS Solut. 2008, 12, 55–64. [Google Scholar] [CrossRef]
- Beavan, R.J. Noise properties of continuous GPS data from concrete pillar geodetic monuments in New Zealand, and comparison with data from deep drilled braced monuments. J. Geophys. Res. Solid Earth 2005, 110, B8. [Google Scholar] [CrossRef]
- Johnson, H.O.; Agnew, D.C. Monument motion and measurements of crustal velocities. Geophys. Res. Lett. 1995, 22, 2905–2908. [Google Scholar] [CrossRef]
- Mao, A.; Harrison, C.G.A.; Dlxon, T.H. Noise in GPS Coordinate Time Series. J. Geophys. Res. Atmos. 1999, 104, 2797–2816. [Google Scholar] [CrossRef]
- Williams, S.D.P. The Effect of Coloured Noise on the Uncertainties of Rates Estimated from Geodetic Time Series. J. Geod. 2003, 76, 483–494. [Google Scholar] [CrossRef]
- He, X.; Bos, M.S.; MontilletiD, J.-P.; Fernandes, R. Investigation of the noise properties at low frequencies in long GNSS time series. J. Geod. 2019, 93, 1271–1282. [Google Scholar] [CrossRef]
- Wang, W.; Qiao, X.; Wang, D.; Chen, Z.; Yu, P.; Lin, M.; Chen, W. Spatiotemporal noise in GPS position time-series from Crustal Movement Observation Network of China. Geophys. J. Int. 2019, 216, 1560–1577. [Google Scholar] [CrossRef]
- Yuan, L.-G.; Ding, X.-L.; Chen, W.; Kwok, S.; Chan, S.-B.; Hung, P.-S.; Chau, K.-T. Characteristics of Daily Position Time Series from Hong Kong GPS Fiducial Network. Chin. J. Geophys. 2008, 51, 1372–1384. [Google Scholar] [CrossRef]
- Jiang, Z.; Zhang, P.; Bi, J.; Liu, L. Velocity Estimation on the Colored Noise Properties of CORS Network in China Based on the CGCS2000 Frame. Acta Geod. Cartogr. Sin. 2010, 39, 355–363. [Google Scholar]
- Farrell, W.E. Deformation of the earth by surface loads. Rev. Geophys. 1972, 10, 761–797. [Google Scholar] [CrossRef]
- Li, C.; Huang, S.; Chen, X.; Van Dam, T.; Fok, H.S.; Zhao, Q.; Wu, W.; Wang, X. Quantitative Evaluation of Environmental Loading Induced Displacement Products for Correcting GNSS Time Series in CMONOC. Remote Sens. 2020, 12, 594. [Google Scholar] [CrossRef]
- Gong, G.; Hua, X.; He, X.; Shu, Y.; Ma, M. Analysis of Regional Characteristics of Environment Load Effect in GPS Coordinate Time Series. J. Geod. Geodyn. 2017, 37, 961–967. [Google Scholar]
- Collilieux, X.; Van Dam, T.; Ray, J.; Coulot, D.; Métivier, L.; Altamimi, Z. Strategies to mitigate aliasing of loading signals while estimating GPS frame parameters. J. Geod. 2012, 86, 1–14. [Google Scholar] [CrossRef]
- Amiri-Simkooei, A.R.; Tiberius, C.C.J.M.; Teunissen, P.J.G. Assessment of noise in GPS coordinate time series: Methodology and results. J. Geophys. Res. Atmos. 2007, 112. [Google Scholar] [CrossRef]
- Bogusz, J.; Klos, A. On the significance of periodic signals in noise analysis of GPS station coordinates time series. GPS Solut. 2016, 20, 655–664. [Google Scholar] [CrossRef]
- Van Dam, T.M.; Wanr, J. Modeling environment loading effects: A review. Phys. Chem. Earth 1998, 23, 1077–1087. [Google Scholar] [CrossRef]
- Liao, H.H.; Zhong, M.; Zhou, X.H. Climate driven annual vertical deformation of the solid earth calculated from GRACE. Chin. J. Geophys. 2010, 53, 321–328. [Google Scholar] [CrossRef]
- Jiang, W.; Xia, C.; Li, Z.; Guo, Q.; Zhang, S. Analysis of environmental loading effects on regional GPS coordinate time series. Acta Geod. Cartogr. Sin. 2014, 43, 1217–1223. [Google Scholar]
- Wu, S.; Nie, G.; Meng, X.; Liu, J.; He, Y.; Xue, C.; Li, H. Comparative Analysis of the Effect of the Loading Series from GFZ and EOST on Long-Term GPS Height Time Series. Remote Sens. 2020, 12, 2822. [Google Scholar] [CrossRef]
- Dill, R.; Dobslaw, H. Numerical simulations of global scale high-resolution hydrological crustal deformations. J. Geophys. Res. Solid Earth 2013, 118, 5008–5017. [Google Scholar] [CrossRef]
- Dill, R. Hydrological model LSDM for operational Earth rotation and gravity field variations. GFZ 2008. [Google Scholar] [CrossRef]
- Hagemann, S.; Dümenil, L. A parametrization of the lateral waterflow for the global scale. Clim. Dyn. 1998, 14, 17–31. [Google Scholar] [CrossRef]
- Bevis, M.; Brown, A. Trajectory models and reference frames for crustal motion geodesy. J. Geod. 2014, 88, 283–311. [Google Scholar] [CrossRef]
- Bos, M.S.; Fernandes, R.M.S.; Williams, S.D.P.; Bastos, L. Fast error analysis of continuous GNSS observations with missing data. J. Geod. 2013, 87, 351–360. [Google Scholar] [CrossRef]
- Akaike, H.T. A new look at the statistical model identification. IEEE Trans. Autom. Control 1974, 19, 716–723. [Google Scholar] [CrossRef]
- Schwarz, G. Estimating the Dimension of a Model. Ann. Stat. 1978, 6, 31–38. [Google Scholar] [CrossRef]
- Bos, M.S.; Fernandes, R.M.S. Hector User Manual Version 1.6. 2016. Available online: http://segal.ubi.pt/hector/manual_1.7.2.pdf (accessed on 22 January 2021).
- Sun, H.P.; Ducarme, B.; Dehant, V. Effect of the Atmospheric Pressure on Surface Displacement. J. Geod. 1995, 70, 131–139. [Google Scholar] [CrossRef]
- Van Dam, T.; Collilieux, X.; Wuite, J.; Altamimi, Z.; Ray, J. Nontidal ocean loading: Amplitudes and potential effects in GPS height time series. J. Geod. 2012, 86, 1043–1057. [Google Scholar] [CrossRef]
- Li, Z.; Yue, J.; Li, W.; Lu, D.; Li, X. A comparison of hydrological deformation using GPS and global hydrological model for the Eurasian plate. Adv. Space Res. 2017, 60, 587–596. [Google Scholar] [CrossRef]
- Wu, S.; Nie, G.; Liu, J.; Xue, C.; Wang, J.; Li, H.; Peng, F. Analysis of deterministic and stochastic models of GPS stations in the crustal movement observation network of China. Adv. Space Res. 2019, 64, 335–351. [Google Scholar] [CrossRef]
- Zhang, J.; Bock, Y.; Johnson, H.; Fang, P.; Williams, S.; Genrich, J.; Wdowinski, S.; Behr, J. Southern Californie Permanent GPS Geodetic Array: Error Analysis of Daily Position Estimates and Site Velocities. J. Geophys. Res. Solid Earth 1997, 102, 18035–18055. [Google Scholar] [CrossRef]
- Huang, L. Noise properties in time series of coordinate component at GPS fiducial stations. J. Geod. Geodyn. 2006, 26, 31–33. [Google Scholar]
Publisher’s Note: MDPI stays neutral with regard to jurisdictional claims in published maps and institutional affiliations. |
© 2021 by the authors. Licensee MDPI, Basel, Switzerland. This article is an open access article distributed under the terms and conditions of the Creative Commons Attribution (CC BY) license (http://creativecommons.org/licenses/by/4.0/).