Abstract
Soil salinization is a global problem, which seriously damages the ecological environment and considerably reduces agricultural productivity, especially in arid regions. Synthetic aperture radar (SAR) has been widely used in remote sensing due to its weather and sunlight independence. Polarimetric SAR has great potential for large-scale mapping and monitoring salt-affected soils. In this study, we investigate the characteristics of saline soil in extremely arid regions using dual-band quadrature-polarimetric (quad-pol) SAR images acquired by GF-3 (C-band) and ALOS-2 (L-band). Firstly, the effectiveness of the modified dielectric mixing model and integral equation model (IEM) in describing saline soil is evaluated. Secondly, the potential relationships between polarimetric parameters and salinity are discussed in both the C- and L-band, respectively, such as co-polarization ratio, scattering entropy H, and scattering angle . Finally, a linear regression model for monitoring salt content is established. The main contributions of this article are as follows: (1) Simulation results suggest that the radar backscattering coefficient is a weak function of salinity at low water content, but our experimental data show that soil salinity significantly contributes to the radar backscattering coefficient, which indicates the modified dielectric mixing model and IEM model is not applicable in extremely arid areas. (2) A negative correlation between the co-polarization ratio and salinity is observed, and the correlation coefficients are 0.64 (C-band) and 0.71 (L-band). Besides, scattering entropy and scattering angle exhibit a positive correlation with salinity in the C-band with correlation coefficients 0.686 and 0.669, respectively, whereas a negative correlation is found in the L-band with correlation coefficients 0.682 and 0.680, respectively. This can be attributed to the different penetration depths and sensitivity to the surface roughness of the electromagnetic waves at two frequencies. (3) A regression model for salinity estimating based on radar backscattering coefficient, co-polarization ratio, and scattering entropy is established, with a determination coefficient () of 0.79 and a root mean square error (RMSE) of 6.56%, allowing us to determine soil salinity from quad-pol SAR images without using backscattering models. Therefore, our results can be a reference for future soil salinity monitoring and inversion.
1. Introduction
Soil salinization is a severe global environmental hazard, especially in developing countries [1,2]. Climate change and unsustainable human agricultural activities, such as unreasonable irrigation and cultivation, are the main causes of saline-alkali soil [3,4,5]. Soil salinization will remarkably reduce agricultural productivity and threaten world food security. It is estimated that by 2050, 50% of arable land will be affected by salinization [6,7]. Therefore, timely and effective monitoring of land salinization has important environmental and economic benefits [8,9,10,11].
Compared with traditional optical remote sensing, the independence of atmospheric conditions and unique penetration depth of different frequencies make microwave remote sensing more advantageous in monitoring salt-affected soils in sandy coastal, desert regions, waterlogged areas, and places with irregular microtopography [1,12]. There is a close relationship between the radar backscattering coefficient and the soil complex dielectric constant. Generally, the real part of the soil dielectric constant is related to the scattering and transmission of electromagnetic waves on the soil surface, while the imaginary part is related to the attenuation in the soil medium [13,14,15]. The volumetric water content is considered to change the soil dielectric constant remarkably. So far, lots of studies have been conducted on the measurement of soil water content with SAR data [16,17,18]. The commonly used dielectric constant models of mixed soil can be found in [19,20,21,22]. Wang and Schmugge proposed an empirical model to describe the dielectric constant of soil water mixtures at L- and C-band [19]. Dobson et al. conducted extensive research on moist soil in the laboratory, modeling soil dielectric constant as a function of soil physical parameters, including soil bulk density, texture, frequency, and temperature [21,22]. However, none of them considered the influence of salinity on soil dielectric constant.
For salt-affected areas, the effect of salinity on soil dielectric constant can be significant. In fact, a few studies have tried to establish the dielectric constant model of saline soil [23,24,25]. Based on the dielectric properties of NaCl solution at different microwave frequencies, Stogryn proposed a dielectric mixing model of saline water, in which the ionic conductivity is a function of water temperature and salinity [23]. To evaluate the dielectric properties of saline soil, some researchers [2,26,27,28,29,30,31], based on the measurements of artificial soil samples, modified the Dobson soil dielectric model using the saline water dielectric model proposed by Stogryn. Shao et al. studied the dielectric properties of soil samples with different concentrations of NaCl solution in the laboratory [27]. They found that the imaginary part of the dielectric constant increases with salinity, while the real part is less affected by salinity, especially at low frequency ( GHz). Besides, using RADARSAT-1 images, they observed a strong positive correlation between the radar backscattering coefficient and the imaginary part of the field soil samples dielectric constant. The higher the volumetric water content, the greater the influence of salinity on the dielectric constant and radar backscattering coefficient [29]. Based on the modified dielectric mixing model and laboratory measurements, Aly et al. proposed a parameter formula to assess the ability of RADARSAT-1 to monitor soil salinity [30]. The modified dielectric mixing model performs well in saline soil with high volumetric water content (⩾ 0.3 cm3 · cm−3), but the effectiveness of the model in arid areas needs to be evaluated [2].
Polarimetric SAR provides rich information of target scattering characteristics and increases the dimension of data analysis compared with traditional single-polarization SAR system [32,33,34]. However, few studies focused on monitoring soil salinization in arid regions based on quadrature-polarimetric (quad-pol) SAR data [35,36,37]. Lasne et al. investigated the characteristics of co-polarization parameters in the salt-affected areas of Death Valley, California, during wet and dry seasons with airborne (AIRSAR) and spaceborne (SIR-C) SAR data. Their results show that the co-polarization ratio in wet season is smaller than that in dry season, while the co-polarization phase difference varies in the opposite direction [35]. Based on the ALOS-1 quad-pol SAR data, a high correlation between the volume scattering component obtained by Cloude decomposition and the soil salinity is observed in Lop Nur area [36].
The purpose of this study is to monitor soil salinity in extremely arid regions using dual-band quad-pol SAR data. Firstly, the complex dielectric constant and salinity of the soil samples are measured in the laboratory. Besides, the validity of the modified dielectric mixing model for characterizing soil salinity in extremely arid areas is evaluated. Furthermore, the relationships between radar backscattering coefficient, co-polarization ratio, scattering entropy, and scattering angle with salinity are analyzed using Gaofen-3 (GF-3) and Advanced Land Observing Satellite-2 (ALOS-2) quad-pol SAR data, and their differences in the C- and L-band are discussed, respectively. Finally, a multiple linear regression model is established to determine soil salinity from quad-pol SAR data.
2. Materials and Methods
2.1. Study Area
The research was conducted in Golmud, central and western Qinghai Province, with latitude from 36°49′N to 37°14′N and longitude from 95°03′E to 95°30′E, as shown in Figure 1. Golmud is located in the hinterland of the Qinghai-Tibet Plateau, the central and southern part of the Qaidam Basin, with an average elevation of 2780 m. This region has a continental plateau climate with scarce rainfall and dry weather. The annual average rainfall is only 44.2 mm, but the evaporation is as high as 3000 mm. Due to the special geographical location of Golmud, the land here is rich in mineral salts and is severely affected by salinization. Soil sampling is carried out at 110 km north of Golmud, where Yardang landform formed by wind erosion is distributed in the north and Qarhan Salt Lake in the southwest. The soil sand content in the sampling area is high, and the texture is mainly sandy loam without vegetation coverage.
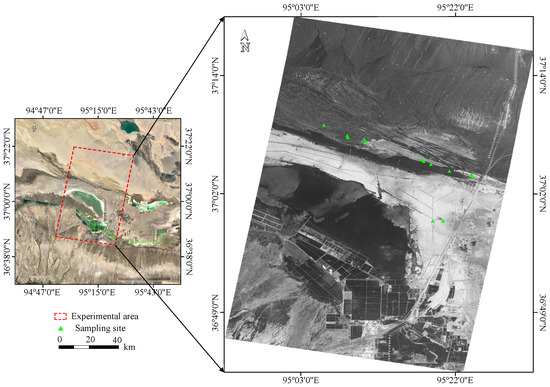
Figure 1.
Study area and sampling locations. The image on the left is extracted from Google Earth, and the right is the ALOS-2 SAR image in HH polarization acquired on 24 August 2020. The triangles represent the locations of the sampling sites.
2.2. Field Sampling and Laboratory Measurements
Field soil sampling and ground measurement campaigns were carried out on 21 August and 22 August 2020, to coordinate with the time of the SAR satellite passing through the study area. We selected 13 regions with different surface roughness, and the position distribution is shown in the green triangle in Figure 1. Multiple surface and subsurface (10 cm) soil samples were collected from each sampling site, and the corresponding GPS coordinate was recorded. A total of 70 soil samples were sealed in aluminum sample boxes to maintain their natural state and carried to the laboratory for further measurement. The surface roughness was measured using a pin profilometer in different directions at each sampling site (Figure 2). The root mean square (RMS) surface height of all sampling sites ranged from 0.00243 m to 0.0349 m, and the correlation length ranged from 0.0375 m to 0.1425 m.
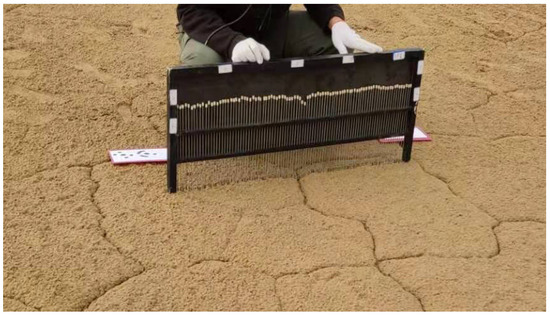
Figure 2.
Surface roughness measurement using a pin profilometer.
The complex dielectric constant of 70 soil samples in the C- and L-band was measured with a vector network analyzer in the laboratory to validate the simulation results of the modified dielectric mixing model. The volumetric water content of soil samples was measured by the oven-dry method. Due to the arid climatic conditions, the volumetric water content of all soil samples measured is less than 0.05 cm3 · cm−3. The soluble salt content of soil samples was determined by the mass method according to the Chinese standard LY/T 1251-1999. Firstly, the soil water leachate was prepared at a soil-water ratio of 1:5, and a quantitative amount of leachate was accurately extracted and evaporated to dryness. After removing the organic matter, it was dried in an oven at 105 °C and weighed to calculate the soluble salt content (g/kg). Then the average measurement values of 13 sampling sites were obtained.
2.3. SAR Data and Pre-Processing
In order to study the potential of using polarimetric SAR data to monitor salt-affected soils in extremely arid areas, we obtained the GF-3 and ALOS-2 quad-pol single look complex (SLC) images. GF-3 is a C-band multi-polarization SAR imaging satellite developed by China, which is widely used in many industries and business departments, such as marine, disaster mitigation, water conservancy and meteorology [38,39]. The GF-3 SAR data utilized in this experiment were collected on 21 August 2020, in descending orbit and 26 August 2020, in ascending orbit. Both operated in quad-pol stripe mode, including HH, HV, VH, VV polarization, and passed through the sampling region at the same incident angle of 29°. ALOS-2 is an earth observation satellite launched by Japan on 24 May 2014. It is equipped with a Phased Array L-band Synthetic Aperture Radar (PALSAR-2) sensor, which is extensively applied in topographic mapping, disaster monitoring and resource exploration [40,41]. The ALOS-2 SAR data were acquired on 24 August 2020, on a descending orbit in quad-pol strip mode with an incident angle of 36°. Table 1 provides more information about the GF-3 and ALOS-2 SAR data.

Table 1.
Main parameters of the GF-3 and ALOS-2 SAR data.
SAR data need to be pre-processed to accurately characterize the microwave scattering of ground targets [42,43]. Firstly, radiometric correction is performed to the GF-3 and ALOS-2 SLC imagery, and the image gray value is converted into backscattering coefficient value. Following, a 3 × 3 mean filter is selected to suppress image speckle noise and enhance target information. Then SAR images are geocoded based on a digital elevation model (DEM). After processing, we get the radar backscattering coefficient () in dB corresponding to the ground sampling location.
2.4. Modified Soil Dielectric Mixing Model
Unaffected soil is usually considered to be a mixture of four components: soil, free water, bound water, and air [30]. Based on extensive research in the laboratory, Dobson et al. proposed a semi-empirical model to describe the complex dielectric constant of soil mixture [21,22], as follows:
where is the bulk density of soil in g/cm3, is the volumetric water content, is the density of soil particles, is the shape factor, is the dielectric constant of soil particles, is an empirical function related to the soil texture, and are the real and imaginary parts of the dielectric constant of free water.
However, the Dobson dielectric model does not consider the influence of salinity on the soil and thus is not applicable for salt-affected soils. In order to accurately describe the dielectric properties of saline soil, some researchers replaced the dielectric constant of free water with the corresponding parameter in the saline water model proposed by Stogryn. According to Stogryn’s formula [23], the real and imaginary parts of the dielectric constant of saline water can be calculated with:
where and are relaxation time and conductivity of saline water, respectively. The specific forms of other parameters can be found in [23].
With the modified soil dielectric mixing model, the effect of water and salt on soil complex dielectric constant can be analyzed simultaneously.
2.5. Radar Backscattering Model
It is known that the radar backscattering coefficient is sensitive to natural surface parameters, such as surface roughness, vegetation, and soil moisture. Many microwave scattering models have been proposed to describe the relationship between the backscattering coefficient and soil dielectric constant. Commonly used microwave scattering models include small disturbance model (SPM) [13], physical optics model (POM) [13], integral equation model (IEM) [44] and the empirical model of Dubois et al. (DM) [45]. Considering natural surface conditions, the application range of these scattering models is different. The validity range of these models is shown in Table 2.
Table 2.
Validity range of commonly used microwave scattering models.
Using the modified soil dielectric mixing model mentioned above as the input parameter of the microwave scattering model, the effect of salinity on the radar backscattering coefficient can be assessed. Considering the SAR configuration parameters and the actual range of surface roughness, we selected IEM model to describe the scattering characteristics of ground targets. The single-scattering term of IEM model is given by [44]
where k is the wave number, s is the RMS height of the surface, is the incident angle, and is the n-order Fourier transform of the surface autocorrelation function. The exponential autocorrelation function is assumed, which performs better than Gaussian autocorrelation function for natural surfaces [30,44].
2.6. Co-Polarization Ratio
Compared with the single-polarization SAR system, quad-pol SAR data provides more powerful information for the retrieval of land surface parameters. The co-polarization ratio has been shown to be effective in assessing the complex dielectric constant of soil [16,35]. The influence of surface roughness on the co-polarization ratio cannot be ignored, especially on the non-smooth surface. The co-polarization ratio is defined as the ratio of the co-polarization normalized radar cross section (NRCS):
2.7. Polarimetric Scattering Parameters:
The parameters are obtained by the eigenvalue decomposition of the coherence matrix, which are widely used in target classification [46]. The scattering entropy H describes the degree of statistical disorder of different scattering types as a whole. The higher the entropy value, the more random the scattering mechanism. The scattering angle is directly related to the average physical scattering mechanism of the target. Lower value of indicates that single-bounce scattering may be the main scattering mechanism, while a medium or higher value is related to double-bounce scattering or volume scattering.
The analytical framework for this paper is shown in Figure 3 and the detailed analysis is presented in the next section.
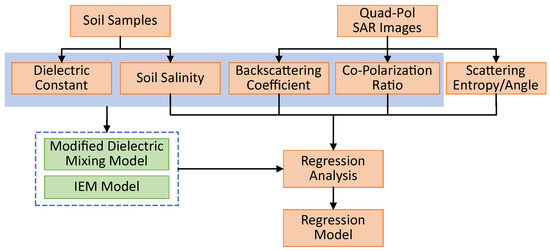
Figure 3.
The analytical framework for this paper.
3. Results
3.1. Relationship between Soil Salinity and Dielectric Constant
Figure 4 shows the simulation results of the real and imaginary parts of the dielectric constant with salinity under distinct water contents in the C- and L-band using the modified soil dielectric mixing model. Considering the soil texture of the sampling area is mainly sandy loam, the soil bulk density is set at 1.7 g/cm3, and the temperature is 25 °C. The different curves represent different volumetric water content, which rises from 5% to 50% in steps of 5%, and the arrow indicates the increasing direction. As we can see, both the real and imaginary parts of the dielectric constant are affected by volumetric water content and salinity. For a fixed salinity, the higher the water content, the greater the real and imaginary parts of the dielectric constant. Besides, as salinity increases, the real part of the dielectric constant decreases, while the imaginary part increases. The higher the water content, the larger the effect of salinity on dielectric constant. Moreover, the dielectric constant in the L-band is more sensitive to soil salinity than that in the C-band. To summarize, water content is the main factor affecting the real part of the dielectric constant, while the imaginary part of the dielectric constant is mainly affected by salinity.
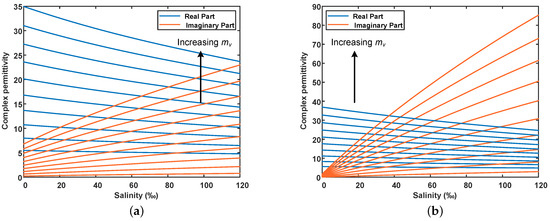
Figure 4.
Effect of salinity on soil complex dielectric constant derived from the modified dielectric mixing model. The blue line represents the real part of the dielectric constant, and the red line represents the imaginary part of the dielectric constant. The arrow points to the direction of the increase in volumetric water content, from 5% to 50% in steps of 5%. (a) C-band (5.4 GHz), (b) L-band (1.24 GHz).
Figure 5 shows the measurement results of the complex dielectric constant and salinity of the soil samples. Figure 5a,b are the real and imaginary parts of the dielectric constant in the C-band, respectively, and Figure 5c,d are the L-band. It can be seen that there is no apparent correlation between the real part of the dielectric constant and the salinity. In other words, salinity has little effect on the real part of the dielectric constant in extremely arid areas. However, there is a clear positive correlation between the imaginary part and salinity, which can be observed at both the C- and L-band. The correlation coefficient is 0.78 in the C-band and 0.70 in the L-band. Besides, the imaginary part of the dielectric constant changes from 0.27 to 2.23 in the C-band, while the variation in the L-band ranges from 0.29 to 3.65. This indicates that the imaginary part of the dielectric constant in the L-band is more sensitive to salinity changes, which is consistent with the simulation results.
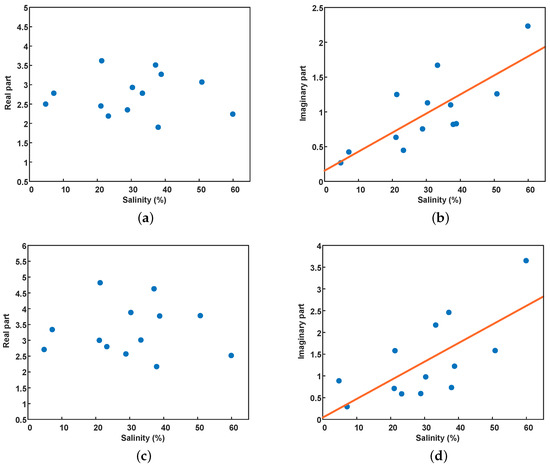
Figure 5.
Complex dielectric constants and salinity of soil samples taken from Golmud. (a,b) C-band, (c,d) L-band.
3.2. Relationship between Soil Salinity and Backscattering Coefficient
Figure 6 shows the simulation results of the radar backscattering coefficient with salinity using the modified dielectric mixing model and IEM model, according to the GF-3 and ALOS-2 SAR configuration parameters. The RMS height and surface correlation length are set at 0.005 m and 0.08 m, respectively. As we can see, the radar backscattering coefficient increases slightly with increasing salinity at low water content. Besides, for a fixed salinity, the radar backscattering coefficient is gradually saturated as water content increases. This may be because the salt cannot be fully dissolved when the water content is low. As the water content increases, the free ion concentration increases, leading to a higher dielectric constant. However, when the dielectric constant is high enough, the Fresnel reflection coefficient changes slowly, and then the radar backscatter coefficient tends to saturate. Additionally, the radar backscattering coefficient in the L-band is more sensitive to the change of salinity than in the C-band. This can be attributed to the fact that the effect of salinity on the dielectric constant is greater in the L-band than in the C-band, as shown in Figure 4.
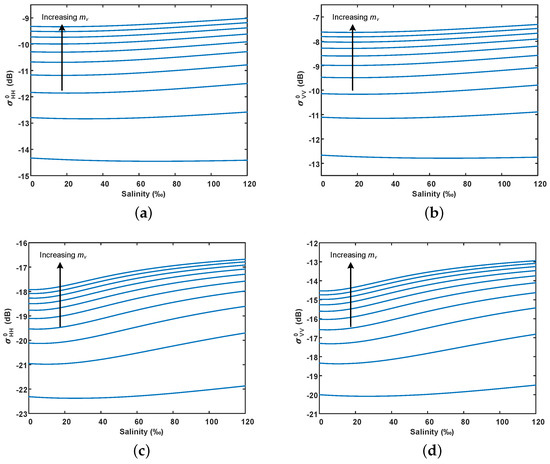
Figure 6.
Simulation of salinity effect on radar backscattering coefficient under different volumetric water content using the modified dielectric mixing model and IEM model. (a,b) C-band (5.4 GHz), and the incident angle is 29°; (c,d) L-band (1.24 GHz), and the incident angle is 36°. The arrow points to the direction of the increase in volumetric water content, from 5% to 50% in steps of 5%.
To assess the effectiveness of the modified dielectric mixing model and IEM model in describing the relationship between radar backscattering coefficient and salinity in extremely arid regions, we extracted the radar backscattering coefficient corresponding to the sampling position from GF-3 and ALOS-2 quad-pol SAR images. Figure 7 shows the relationship between the radar backscattering coefficient and salinity in the sampling area. Figure 7a,b are from GF-3, and Figure 7c,d are from ALOS-2. There is a clear positive correlation between the radar backscattering coefficient and salinity in both the C- and L-band, which suggests that the salt-affected soils will have noticeable features in SAR images. Furthermore, the correlation coefficients in HH and VV polarization with salinity were 0.53 and 0.59 in the C-band, 0.54 and 0.73 in the L-band, respectively, indicating that VV polarization may be more suitable for salinity inversion than HH polarization.
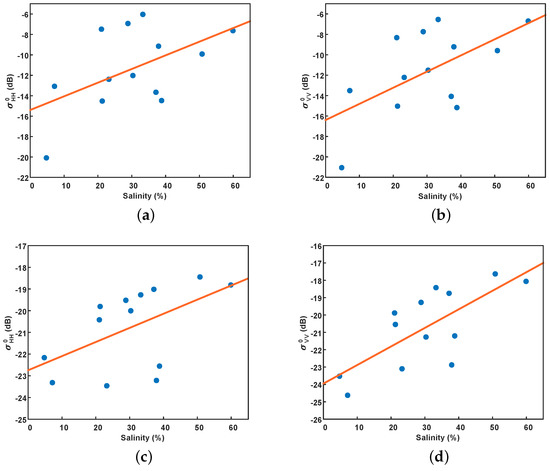
Figure 7.
The relationship between the radar backscattering coefficient ( and ) and the salinity of soil samples. (a,b) GF-3, (c,d) ALOS-2.
It is noted that the variation range and sensitivity of the radar backscattering coefficient with salinity in the experimental area are much larger than the simulation results at low water content (5% volumetric water content). This indicates that the variation of radar backscattering coefficient with salinity in extremely arid areas cannot be sufficiently described using the modified dielectric mixing model and IEM model. In the following sections, we will focus on the relationships between soil salinity and polarimetric parameters (i.e., co-polarization ratio, scattering entropy H, and scattering angle ).
3.3. Relationship between Soil Salinity and Co-Polarization Ratio
Figure 8 shows the simulation results of the relationship between the co-polarization ratio, surface roughness and salinity in both the C- and L-band using the modified dielectric mixing model and IEM model. The RMS height and surface correlation length cover the measured values in the field sampling area, and the soil volumetric water content is set at 5%. It can be seen that the co-polarization ratio decreases slightly with increasing salinity for a fixed surface roughness. This is consistent with the observation in [35] that the co-polarization ratio decreases with the increase of the imaginary part of the dielectric constant, since there is a high positive correlation between the imaginary part of the dielectric constant and salinity.
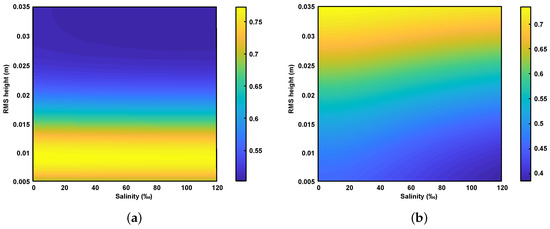
Figure 8.
The relationship of the co-polarization ratio with surface roughness and salinity obtained from the simulation of modified dielectric mixing model and IEM model. (a) C-band (5.4 GHz), (b) L-band (1.24 GHz). The RMS height and surface correlation length cover the range of field measurements, and the soil volumetric water content is set at 5%.
It is worth noting that the variation of co-polarization ratio with roughness shows a difference at two frequencies. To explain this difference, we simulate the co-polarization ratio as a function of surface roughness using the IEM model. The results show that as the surface roughness increases, the co-polarization ratio first increases and then decreases (Figure 9). The same trend is observed at both frequencies, but the position of the inflection point of the curve is different. The inflection point maybe because the single scattering IEM model is not applicable for the current roughness. The sensitivity of electromagnetic waves with different frequencies to surface roughness is inconsistent, so the position of the inflection point of the curve is different.
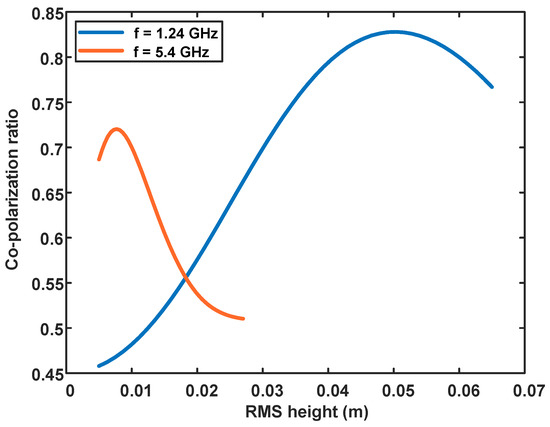
Figure 9.
Simulation of the co-polarization ratio as a function of surface roughness using the IEM model. The red curve is for C-band and the blue is for L-band. Simulation parameters are determined according to GF-3 and ALOS-2, respectively. The dielectric constant is set at 5 + 2i.
Then, we analyzed the relationship between co-polarization ratio, surface roughness and salinity in the experimental area. Figure 10 shows the variation of co-polarization ratio with RMS height and salinity. The horizontal axis represents the sampling points in ascending order of salinity. The left vertical axis represents the co-polarization ratio, and the vertical axis on the right represents the RMS height of the sampling points. As it can be seen, the co-polarization ratio decreases with the increase of salinity in both the C- and L-band, which is also consistent with the simulation results. The negative correlation coefficient of ALOS-2 data is 0.71, which is higher than 0.64 of GF-3. Moreover, the RMS height increased slightly with salinity.
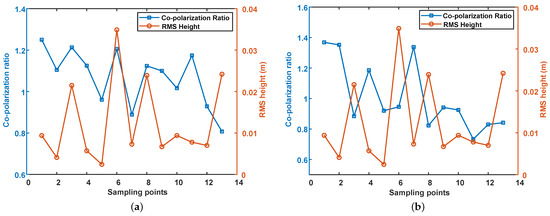
Figure 10.
The relationship between co-polarization ratio, RMS height and salinity. The horizontal axis is the sampling points arranged in ascending order of salinity, the left vertical axis represents the co-polarization ratio, marked with the blue square, and the right vertical axis represents the RMS height of the sampling points, represented by the red circle. (a) GF-3, (b) ALOS-2.
3.4. Relationship between Soil Salinity and Parameters
In this experiment, we find that the value of the sampling sites has a high correlation with salinity, and they show a significant difference between the C- and L-band. Figure 11 shows the results of the polarimetric decomposition for the sampling region, and Figure 12 shows the value of the sampling sites extracted from the GF-3 and ALOS-2 SAR images. It can be seen that there is a strong positive correlation between value and salinity in the C-band, and the correlation coefficients are 0.686 and 0.669, respectively. However, they show a high negative correlation in the L-band, and the corresponding correlation coefficients are 0.682 and 0.680, respectively. For low soil salinity content, the values of H and are small in the C-band (H is about 0.22, is about 13°), but they are high in the L-band (H is about 0.6, is about 35°).
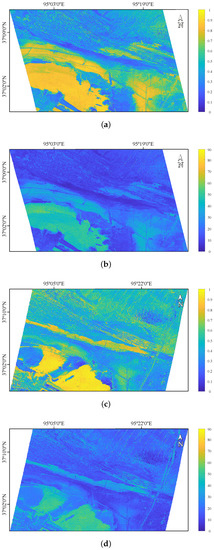
Figure 11.
The polarimetric scattering entropy H and scattering angle of the sampling area. (a) H of GF-3, (b) of GF-3, (c) H of ALOS-2, (d) of ALOS-2.
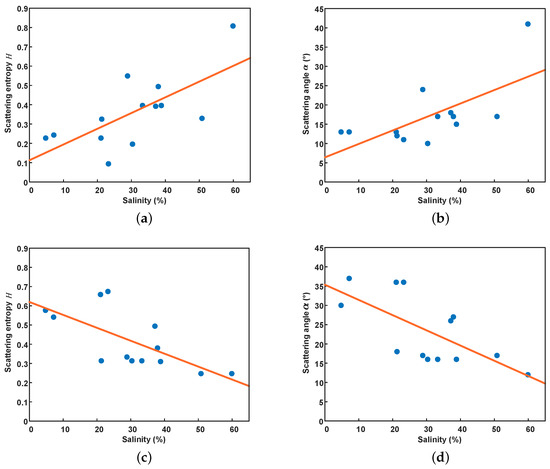
Figure 12.
The relationship between value and soil salinity. (a,b) GF-3, (c,d) ALOS-2.
According to the Rayleigh criterion [13], a surface can be regarded as relatively smooth if the wavelength and the RMS height satisfy: . Given the actual range of RMS height in this experiment, the surface of the sampling area can be assumed to be relatively smooth in the L-band, while the influence of surface roughness cannot be ignored in the C-band. Due to the low water content in the sampling area, the electromagnetic waves in the L-band can penetrate below the ground surface at low soil salinity content, which will increase random scattering components. Thus, large H and values are observed in Figure 12c,d when the soil salinity content is low. However, the penetration depth in the C-band is much weaker than that in the L-band [13]. In this case, it can be considered that the surface scattering component is dominant at low soil salinity content, so H and show small values in Figure 12a,b.
Additionally, H and values show a downward trend with increasing soil salinity in the L-band, while the opposite trend is observed in the C-band. This may be because the increase of salinity will enhance the attenuation of electromagnetic waves, resulting in a reduction of random scattering component in the L-band, and thus a decrease in the values of H and . As the increase of soil salinity, the content of crystalline salts on the surface of salt-affected soils increase, which will increase surface roughness [47]. Since the electromagnetic waves in the C-band are sensitive to the change of surface roughness, the increased roughness will lead to an increase in random surface scattering components, resulting in rising H and values.
3.5. Regression Analysis
According to the above analysis, it is clear that the radar backscattering coefficient, co-polarization ratio and exhibit a high correlation with soil salinity. Soil complex dielectric constants are more sensitive to salinity in the L-band. Besides, electromagnetic waves in the L-band can adapt to a wide range of natural ground conditions without being affected by surface roughness compared with electromagnetic waves in the C-band. Therefore, L-band is more suitable for large-scale saline soil monitoring and salinity inversion in extremely arid areas.
Here we establish a multiple linear regression model to retrieve soil salinity using L-band quad-pol SAR data. Given that both simulation results and SAR data indicate the radar backscattering coefficient in VV polarization is more sensitive to salinity, and that there is a high correlation between and of the sampling points, we choose as the regression variable. For the same reason, the scattering entropy H is chosen as the regression variable rather than the scattering angle . Besides, considering that the co-polarization ratio exhibits a high correlation with salinity in both the C- and L-band, the co-polarization ratio is also selected as the regression variable. After inspection, there is no apparent correlation between the radar backscattering coefficient, co-polarization ratio and scattering entropy. The regression model is as follows:
Figure 13 shows the performance of the proposed regression model. It can be seen that the regression model can well describe the measured salinity of the sampling points, with a determination coefficient (R2) of 0.79 and the root mean square error (RMSE) of 6.56%. This allows us to quantify the salinity of salt-affected soils in extremely arid areas from quad-pol SAR data without using backscattering models, which is important for monitoring the spatial distribution and extent of soil salinization over large regions.
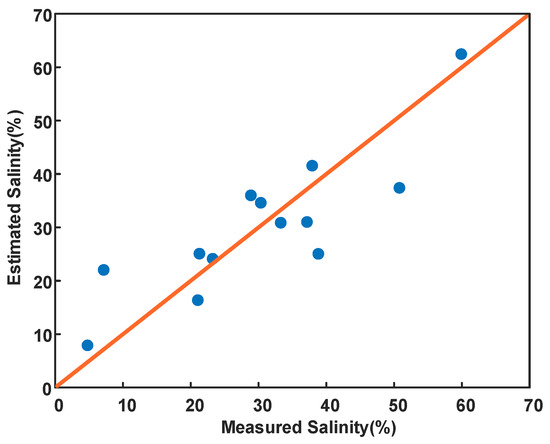
Figure 13.
The relationship between the estimated value of the proposed regression model and the measured value of soil salinity.
4. Discussion
This paper aims to analyze the characteristics of salt-affected soils in extremely arid areas using GF-3 and ALOS-2 quad-pol SAR data and field soil sampling data. In August 2020, a joint satellite-ground experiment was conducted in Golmud, Qinghai Province, and the complex dielectric constant, volumetric water content and salinity of soil samples collected on-site were measured in the laboratory. The measurements show that salinity has a significant effect on the imaginary part of the dielectric constant, while the real part is almost unaffected, especially in the L-band, which is consistent with the observations on artificially prepared soil samples in previous studies [2,27]. Besides, there is a strong positive correlation between the radar backscattering coefficient and salinity (Figure 9), and the correlation coefficient in VV polarization is larger than that in HH polarization. This indicates that VV polarization may be more suitable for salinity inversion [29]. Furthermore, saline soils have significant characteristics in SAR images, but the modified dielectric mixing model and IEM model are insufficient to describe the sensitivity and variation range of the radar backscattering coefficient to soil salinity in extremely arid areas. This may be because the dielectric mixing model [22] and saline water model [23] are developed at high water content, and are not be applicable for saline soils in arid regions.
Compared with the traditional single-polarization SAR, quad-pol SAR can provide rich polarimetric information, offering new perspectives and methods to interpret the scattering mechanism of ground targets. In this experiment, both simulation and SAR data have shown a negative correlation between the co-polarization ratio and soil salinity. Lasne et al. [35] found that the co-polarization ratio of salt-affected areas in dry season was higher than that in wet season, and the imaginary part of the dielectric constant of soil samples in dry season was lower than that in wet season. This is consistent with our observations because there is a strong positive correlation between the imaginary part of the dielectric constant and soil salinity (Figure 5). No apparent correlation between the co-polarization ratio and surface roughness is found in our results. Additionally, Figure 10 shows a slight increase in RMS height with increasing salinity, which may be due to the generation of salt crystallization at high salinity levels. The same phenomenon was found in [47] when studying the annual variation of surface roughness with salinity in saline areas.
In this experiment area, we noticed that the variation of value with salinity exhibits a large difference in the C- and L-band, which can be attributed to the different penetration depths and sensitivity to the surface roughness of electromagnetic waves at different frequencies. Cloude and Pottier proposed an unsupervised classification method based on the two-dimensional plane [46]. This plane is divided into nine zones, and each represents different random scattering mechanisms. The value of is small at low soil salinity in the C-band, and it is in the low entropy surface scatter zone in two dimensional plane, which mainly includes geometric optical and physical optical surface scattering and Bragg surface scattering. However, the value of is higher for small soil salinity in the L-band, and it is located in the zone of medium entropy surface scatter in two dimensional plane, which is dominated by random surface scattering. With the increase of salinity, the value in the C-band enters from the low entropy surface scatter zone into the medium entropy surface scatter zone, while the opposite is true for the L-band. This is because the surface roughness increases slightly with increasing soil salinity, and the electromagnetic waves in the C-band are highly sensitive to the change of surface roughness, leading to an increase in the random scattering components. Therefore, L-band is more suitable for monitoring soil salinity as it can be unaffected by surface roughness in a wide range of ground conditions.
Based on a series of relationships and limited data, we propose a multiple linear regression model to determine soil salinity from ALOS-2 quad-pol SAR images. Radar backscattering coefficients , co-polarization ratio and scattering entropy H are selected as regression variables, and the correlation coefficients between them are all less than 0.2. Generally, the regression model needs to be tested on an independent data set, but we finally did not perform the validation due to the limited L-band quad-pol SAR data and soil sampling data. Although the regression model shows good performance in this specific arid environment, the applicability of this model in other regions needs further investigation and evaluation.
5. Conclusions
In this paper, the characteristics of saline soil in extremely arid areas are studied using dual-band quad-pol SAR data. Firstly, the complex dielectric constant and salinity of soil samples are measured in the laboratory. The measurements indicate that the imaginary part of the dielectric constant increases with salinity, while the real part is hardly affected by salinity. Besides, SAR data suggest that there is a high correlation between radar backscattering coefficient and soil salinity, and that VV polarization is more sensitive to salinity than HH polarization. Salt-affected soils in extremely arid areas have clear features in SAR images, but the modified dielectric mixing model and IEM model cannot sufficiently describe the variation range and sensitivity of the radar backscattering coefficient with salinity. Additionally, polarimetric parameters such as co-polarization ratio, scattering entropy and scattering angle can be utilized to assess soil salinity, especially in the L-band. The co-polarization ratio shows a negative correlation with salinity, and the correlation coefficient of ALOS-2 data is 0.71, which is higher than 0.64 of GF-3. In this experiment area, scattering entropy H and scattering angle show a strong correlation with salinity, and their values exhibit a large difference in the C- and L-band. Finally, a linear regression model for monitoring soil salinity using quad-pol SAR data is established, with a determination coefficient () of 0.79. In conclusion, the proposed model has been proven to be effective in determining soil salinity in Qinghai, China, and the model may be useful for studying other salt-affected areas in the world.
Author Contributions
Conceptualization, Y.G. and W.H.; methodology, Y.G.; software, Y.G.; validation, X.L. and W.H.; formal analysis, Y.G.; investigation, Y.G., Y.H. and W.H.; writing—original draft preparation, Y.G.; writing—review and editing, W.H., X.L. and H.Z.; supervision, R.W.; project administration, R.W. and H.Z.; funding acquisition, R.W. and H.Z. All authors have read and agreed to the published version of the manuscript.
Funding
This research was funded by the National Key Research and Development Program of China (No. 2017YFB0502700).
Acknowledgments
Special thanks to Lei Huang from the Institute of Remote Sensing and Digital Earth of the Chinese Academy of Sciences and Feng Wang from Fudan University for their assistance during the field sampling campaign.
Conflicts of Interest
The authors declare no conflict of interest.
References
- Metternicht, G.; Zinck, J. Remote sensing of soil salinity: Potentials and constraints. Remote Sens. Environ. 2003, 85, 1–20. [Google Scholar] [CrossRef]
- Wu, Y.; Wang, W.; Zhao, S.; Liu, S. Dielectric properties of saline soils and an improved dielectric model in the C-band. IEEE Trans. Geosci. Remote Sens. 2014, 53, 440–452. [Google Scholar]
- Allbed, A.; Kumar, L. Soil salinity mapping and monitoring in arid and semi-arid regions using remote sensing technology: A review. Adv. Remote Sens. 2013, 2, 373–385. [Google Scholar] [CrossRef]
- Daliakopoulos, I.; Tsanis, I.; Koutroulis, A.; Kourgialas, N.; Varouchakis, A.; Karatzas, G.; Ritsema, C. The threat of soil salinity: A European scale review. Sci. Total. Environ. 2016, 573, 727–739. [Google Scholar] [CrossRef] [PubMed]
- Shaoli, W.; Xiugui, W.; Brown, L.C.; Xingye, Q. Current status and prospects of agricultural drainage in China. Irrig. Drainage J. Int. Comm. Irrig. Drain. 2007, 56, S47–S58. [Google Scholar] [CrossRef]
- Butcher, K.; Wick, A.F.; DeSutter, T.; Chatterjee, A.; Harmon, J. Soil salinity: A threat to global food security. Agron. J. 2016, 108, 2189–2200. [Google Scholar] [CrossRef]
- Rasel, H.; Hasan, M.; Ahmed, B.; Miah, M. Investigation of soil and water salinity, its effect on crop production and adaptation strategy. Int. J. Water Resour. Environ. Eng. 2013, 5, 475–481. [Google Scholar]
- Nurmemet, I.; Ghulam, A.; Tiyip, T.; Elkadiri, R.; Ding, J.L.; Maimaitiyiming, M.; Abliz, A.; Sawut, M.; Zhang, F.; Abliz, A.; et al. Monitoring soil salinization in Keriya River Basin, Northwestern China using passive reflective and active microwave remote sensing data. Remote Sens. 2015, 7, 8803–8829. [Google Scholar] [CrossRef]
- Scudiero, E.; Skaggs, T.H.; Corwin, D.L. Regional-scale soil salinity assessment using Landsat ETM+ canopy reflectance. Remote Sens. Environ. 2015, 169, 335–343. [Google Scholar] [CrossRef]
- Periasamy, S.; Ravi, K.P. A novel approach to quantify soil salinity by simulating the dielectric loss of SAR in three-dimensional density space. Remote Sens. Environ. 2020, 251, 112059. [Google Scholar] [CrossRef]
- Nurmemet, I.; Sagan, V.; Ding, J.L.; Halik, Ü.; Abliz, A.; Yakup, Z. A WFS-SVM Model for Soil Salinity Mapping in Keriya Oasis, Northwestern China Using Polarimetric Decomposition and Fully PolSAR Data. Remote Sens. 2018, 10, 598. [Google Scholar] [CrossRef]
- Moreira, A.; Prats-Iraola, P.; Younis, M.; Krieger, G.; Hajnsek, I.; Papathanassiou, K.P. A tutorial on synthetic aperture radar. IEEE Geosci. Remote Sens. Mag. 2013, 1, 6–43. [Google Scholar] [CrossRef]
- Ulaby, F.T.; Moore, R.K.; Fung, A.K. Microwave Remote Sensing: Active and Passive, Volume 2—Radar Remote Sensing and Surface Scattering and Emission Theory; Addison-Wesley: Boston, MA, USA, 1982. [Google Scholar]
- Oh, Y.; Sarabandi, K.; Ulaby, F.T. An empirical model and an inversion technique for radar scattering from bare soil surfaces. IEEE Trans. Geosci. Remote Sens. 1992, 30, 370–381. [Google Scholar] [CrossRef]
- Fung, A.K.; Li, Z.; Chen, K.S. Backscattering from a randomly rough dielectric surface. IEEE Trans. Geosci. Remote Sens. 1992, 30, 356–369. [Google Scholar] [CrossRef]
- Shi, J.; Wang, J.; Hsu, A.Y.; O’Neill, P.E.; Engman, E.T. Estimation of bare surface soil moisture and surface roughness parameter using L-band SAR image data. IEEE Trans. Geosci. Remote Sens. 1997, 35, 1254–1266. [Google Scholar]
- Kornelsen, K.C.; Coulibaly, P. Advances in soil moisture retrieval from synthetic aperture radar and hydrological applications. J. Hydrol. 2013, 476, 460–489. [Google Scholar] [CrossRef]
- El Hajj, M.; Baghdadi, N.; Zribi, M.; Bazzi, H. Synergic use of Sentinel-1 and Sentinel-2 images for operational soil moisture mapping at high spatial resolution over agricultural areas. Remote Sens. 2017, 9, 1292. [Google Scholar] [CrossRef]
- Wang, J.R.; Schmugge, T.J. An empirical model for the complex dielectric permittivity of soils as a function of water content. IEEE Trans. Geosci. Remote Sens. 1980, 4, 288–295. [Google Scholar] [CrossRef]
- Hallikainen, M.T.; Ulaby, F.T.; Dobson, M.C.; El-Rayes, M.A.; Wu, L.K. Microwave dielectric behavior of wet soil-Part I: Empirical models and experimental observations. IEEE Trans. Geosci. Remote Sens. 1985, GE-23, 25–34. [Google Scholar] [CrossRef]
- Dobson, M.C.; Ulaby, F.T.; Hallikainen, M.T.; El-Rayes, M.A. Microwave dielectric behavior of wet soil-Part II: Dielectric mixing models. IEEE Trans. Geosci. Remote Sens. 1985, GE-23, 35–46. [Google Scholar] [CrossRef]
- Peplinski, N.R.; Ulaby, F.T.; Dobson, M.C. Dielectric properties of soils in the 0.3–1.3-GHz range. IEEE Trans. Geosci. Remote Sens. 1995, 33, 803–807. [Google Scholar] [CrossRef]
- Stogryn, A. Equations for calculating the dielectric constant of saline water (correspondence). IEEE Trans. Microw. Theory Tech. 1971, 19, 733–736. [Google Scholar] [CrossRef]
- Klein, L.; Swift, C. An improved model for the dielectric constant of sea water at microwave frequencies. IEEE Trans. Antennas Propag. 1977, 25, 104–111. [Google Scholar] [CrossRef]
- Sreenivas, K.; VENKATARATNAM, L.; Rao, P.N. Dielectric properties of salt-affected soils. Int. J. Remote Sens. 1995, 16, 641–649. [Google Scholar] [CrossRef]
- Bell, D.; Menges, C.; Ahmad, W.; Van Zyl, J. The application of dielectric retrieval algorithms for mapping soil salinity in a tropical coastal environment using airborne polarimetric SAR. Remote Sens. Environ. 2001, 75, 375–384. [Google Scholar] [CrossRef]
- Shao, Y.; Hu, Q.; Guo, H.; Lu, Y.; Dong, Q.; Han, C. Effect of dielectric properties of moist salinized soils on backscattering coefficients extracted from RADARSAT image. IEEE Trans. Geosci. Remote Sens. 2003, 41, 1879–1888. [Google Scholar] [CrossRef]
- Tashpolat, N.; Ding, J.; Yu, D. Dielectric properties of saline soil based on a modified Dobson dielectric model. J. Arid. Land 2015, 7, 696–705. [Google Scholar] [CrossRef][Green Version]
- Lasne, Y.; Paillou, P.; Freeman, A.; Farr, T.; McDonald, K.C.; Ruffie, G.; Malezieux, J.M.; Chapman, B.; Demontoux, F. Effect of salinity on the dielectric properties of geological materials: Implication for soil moisture detection by means of radar remote sensing. IEEE Trans. Geosci. Remote Sens. 2008, 46, 1674–1688. [Google Scholar] [CrossRef]
- Aly, Z.; Bonn, F.J.; Magagi, R. Analysis of the backscattering coefficient of salt-affected soils using modeling and RADARSAT-1 SAR data. IEEE Trans. Geosci. Remote Sens. 2007, 45, 332–341. [Google Scholar] [CrossRef]
- Li, Y.y.; Zhao, K.; Ren, J.H.; Ding, Y.l.; Wu, L.l. Analysis of the dielectric constant of saline-alkali soils and the effect on radar backscattering coefficient: A case study of soda alkaline saline soils in Western Jilin Province using RADARSAT-2 data. Sci. World J. 2014, 2014, 563015. [Google Scholar] [CrossRef]
- Hong, S.H.; Kim, H.O.; Wdowinski, S.; Feliciano, E. Evaluation of polarimetric SAR decomposition for classifying wetland vegetation types. Remote Sens. 2015, 7, 8563–8585. [Google Scholar] [CrossRef]
- Chen, S.W.; Li, Y.Z.; Wang, X.S.; Xiao, S.P.; Sato, M. Modeling and interpretation of scattering mechanisms in polarimetric synthetic aperture radar: Advances and perspectives. IEEE Signal Process. Mag. 2014, 31, 79–89. [Google Scholar] [CrossRef]
- Plank, S.; Twele, A.; Martinis, S. Landslide mapping in vegetated areas using change detection based on optical and polarimetric SAR data. Remote Sens. 2016, 8, 307. [Google Scholar] [CrossRef]
- Lasne, Y.; Paillou, P.; Freeman, A.; Farr, T.; McDonald, K.; Ruffié, G.; Malezieux, J.M.; Chapman, B. Study of hypersaline deposits and analysis of their signature in airborne and spaceborne SAR data: Example of Death Valley, California. IEEE Trans. Geosci. Remote Sens. 2009, 47, 2581–2598. [Google Scholar] [CrossRef]
- Shao, Y.; Gong, H.; Gao, Z.; Liu, L.; Li, L.; Zhang, T. SAR data for subsurface saline lacustrine deposits detection and primary interpretation on the evolution of the vanished Lop Nur Lake. Can. J. Remote Sens. 2012, 38, 267–280. [Google Scholar] [CrossRef]
- Li, Y.; Zhao, K.; Zheng, X.; Ren, J.; Ding, Y.; Wu, L. Identification of saline-alkali soil based on target decomposition of full-polarization radar data. J. Appl. Remote Sens. 2014, 8, 083511. [Google Scholar] [CrossRef]
- Yin, J.; Yang, J.; Zhang, Q. Assessment of GF-3 polarimetric SAR data for physical scattering mechanism analysis and terrain classification. Sensors 2017, 17, 2785. [Google Scholar] [CrossRef]
- Sun, J.; Yu, W.; Deng, Y. The SAR payload design and performance for the GF-3 mission. Sensors 2017, 17, 2419. [Google Scholar] [CrossRef]
- Rosenqvist, A.; Shimada, M.; Suzuki, S.; Ohgushi, F.; Tadono, T.; Watanabe, M.; Tsuzuku, K.; Watanabe, T.; Kamijo, S.; Aoki, E. Operational performance of the ALOS global systematic acquisition strategy and observation plans for ALOS-2 PALSAR-2. Remote Sens. Environ. 2014, 155, 3–12. [Google Scholar] [CrossRef]
- Vafaei, S.; Soosani, J.; Adeli, K.; Fadaei, H.; Naghavi, H.; Pham, T.D.; Tien Bui, D. Improving accuracy estimation of Forest Aboveground Biomass based on incorporation of ALOS-2 PALSAR-2 and Sentinel-2A imagery and machine learning: A case study of the Hyrcanian forest area (Iran). Remote Sens. 2018, 10, 172. [Google Scholar] [CrossRef]
- Lee, J.S.; Pottier, E. Polarimetric Radar Imaging: From Basics to Applications; CRC Press: New York, NY, USA, 2009. [Google Scholar]
- Mladenova, I.E.; Jackson, T.J.; Bindlish, R.; Hensley, S. Incidence angle normalization of radar backscatter data. IEEE Trans. Geosci. Remote Sens. 2012, 51, 1791–1804. [Google Scholar] [CrossRef]
- Fung, A.K. Microwave Scattering and Emission Models and Their Applications; Artech House: Boston, MA, USA, 1994. [Google Scholar]
- Dubois, P.C.; Van Zyl, J.; Engman, T. Measuring soil moisture with imaging radars. IEEE Trans. Geosci. Remote Sens. 1995, 33, 915–926. [Google Scholar] [CrossRef]
- Cloude, S.R.; Pottier, E. An entropy based classification scheme for land applications of polarimetric SAR. IEEE Trans. Geosci. Remote Sens. 1997, 35, 68–78. [Google Scholar] [CrossRef]
- Wadge, G.; Archer, D.J. Evaporation of groundwater from arid playas measured by C-band SAR. IEEE Trans. Geosci. Remote Sens. 2003, 41, 1641–1650. [Google Scholar] [CrossRef]


Publisher’s Note: MDPI stays neutral with regard to jurisdictional claims in published maps and institutional affiliations. |
© 2021 by the authors. Licensee MDPI, Basel, Switzerland. This article is an open access article distributed under the terms and conditions of the Creative Commons Attribution (CC BY) license (http://creativecommons.org/licenses/by/4.0/).