Abstract
Landslides are a worldwide occurring hazard that can produce economic impact and even fatalities. The collection and monitoring of data regarding active landslides are important for predicting future landslides in that region, and is critical to minimize the losses caused. In the expanding metropolitan area of Cluj-Napoca, Romania, drastic changes of land use and increasement of construction zones represent a current evolution issue. The urban sprawl phenomenon imposed the expansion of the city limits and outside the old built-up area, and due to the hilly terrain and geomorphology, natural hazards such as landslides and erosion processes are susceptible to appearance or reactivation. The study incorporates interdisciplinary research composed of evaluation of a landslide susceptible hotspot located in an area of interest to the municipality by means of geodetic and topographic precise measurements, combined with the use of unmanned aerial vehicles (UAV) monitoring of surface movement and GIS spatial analysis. The data obtained in a span of over two years reveal that the investigated slope is subjected to a shallow active landslide of a few centimeters per year, and based on the 64 individual placed landmarks the highest displacement value was 67 mm. Through geomatic tools the exchange rate of the slope surface was evaluated with comprehensive volume calculations, such as displacement, erosion, and accumulation that illustrate a volume of material displaced of 107.2 m3 and the accumulated one of 55.7 m3. The results provide valuable insight into the complex landslide and erosion dynamics that are crucial when predicting future movements and prevention measures.
Keywords:
topography; GNSS; total station; fly survey; GIS spatial analysis; geomatics; surface erosion 1. Introduction
In the constant expanding and increasingly populated Cluj-Napoca metropolitan area (Transylvania, Romania), the evolution imposed by the changes of land use and increasement of construction zones represents a current issue [1,2,3]. With a general move toward urbanization, land is becoming an increasingly difficult resource to obtain and the construction market is a desideratum. The unprecedented urban sprawl phenomenon imposed the expansion of the city limits and the transformation of adjacent villages from Cluj-Napoca into unprepared suburbs [4,5]. Given the hilly terrain and geomorphology, natural hazards such as landslides and erosion processes are susceptible to appearance or reactivation. Although most of this area is stabilized, pressure on the slopes by overburdening with construction and transport infrastructure, combined with anthropogenic intervention in the territory can induce changes in slopes stability, trigger landslides, and have drastic repercussions to the population and environment [6]. These issues call for an imperative and interdisciplinary research regarding the acquisition of valuable data from the field, to aid land monitoring in risk-induced hotspots and susceptible hazardous areas. The study incorporates detailed and accurate collected measurements using geodesy and land survey principles, modern UAV technology for 3D modelling and monitoring of surface movement, combined with the smart integration of GIS spatial analysis [7,8].
Landslides are a worldwide phenomenon that accounts for 9% of the world’s disasters [9]. They are defined as the movement of soil, debris, and rocks under the influence of gravity, and it is most common in hilly and mountainous areas [10,11]. Landslides can have dramatic economic impact and sometimes tragically result in fatalities, as they cause damage to infrastructure, built area, and agricultural land [12,13]. There are multiple factors that can make an area prone to landslide, often classified as predisposing and triggering factors. Predisposing ones generate suitable conditions for landslides (slope, altitude, aspect, geology, land use etc.), and triggering factors initiate the landslides [14,15,16,17,18]. The triggering factors can occur naturally, such as intensive or prolonged rainfall, seismic and volcanic activities, snow melting etc., or human factors such as excavation, deforestation, land clearing (removal of vegetation), hillslope cutting, construction, traffic vibration etc. The collection of data about active landslides is important for predicting future landslides in that region, and is critical to minimizing the losses caused [19,20,21].
Landslide monitoring requires continued assessment of the terrain, evaluating rate of displacement and surface topography changes. Precise measurements of vertical and horizontal displacements improve the understanding of landslide mechanisms that are responsible for landslide dynamics and are useful for predicting future movements [16,17]. There are numerous instrumentations and technologies used in landslide monitoring, such as: total stations, GNSS systems, terrestrial laser scanners, airborne or UAV LiDAR, synthetic aperture radar (SAR) interferometry technology, and many more geomatics applications [22,23,24,25,26]. Each one of the instrumentations and techniques have certain advantages or disadvantages, that range from cost, to survey coverage, time efficiency, precision, and learning curve. Although time-consuming and having sparse spatial coverage, terrestrial solutions such as GNSS systems and total stations have pinpoint accuracy and can yield precise observations regarding possible displacements and surface movements [27,28,29,30,31,32,33]. When combined with placed markers or landmarks, the obtained results can provide insight into complex mechanism produced inside a certain area, such as values on all movement axis with a millimetric precision. In spite of the increasing use of new technologies, total stations remain a fundamental instrument for different monitoring projects, including land and constructions. Accurate angle and distance measurements are vital when surveying surfaces and measuring the displacements of selected points in order to evaluate morphological evolutions [27].
A popular new method, that emerged in the past decade, for landslides monitoring is to utilize unmanned aerial vehicles (UAVs) in order to collect high-resolution imagery for use in complex photogrammetry and geomatics techniques [34,35]. UAVs, commonly called drones, provide indispensable help, efficiency in terms of speed and precision, as well as cost savings especially in inaccessible or difficult to navigate locations. UAVs are rising among many industries and have become very popular in numerous interdisciplinary researches, but for survey engineering they represent a quantum leap [36,37]. Several studies have demonstrated the usefulness and reliability of structure from motion (SfM) software and their implementation in landslide monitoring. SfM is an image-processing technique based on computation that allows the reconstruction of a photographed surface. Combined with the presence of ground control points (GCPs) of known coordinates on the ground, the obtained georeferenced deliverables allow the monitoring of surface features and understanding of landslide mechanisms [38]. Three-dimensional (3D) modelling of landslides, such as the creation of digital elevation models (DEMs) and digital surface models (DSMs), allow for different volume calculations, such as displacement, erosion, accumulation etc. These calculated features are related to the amount of landslide movement, which can provide valuable understandings of the mechanisms responsible for landslide dynamics and are crucial when predicting future movements [22,39].
The present research stem from a larger scientific objective, that included the creation of a landslide susceptibility map using the bivariate statistical analysis (BSA) method based on twelve analyzed factors that can influence the landslide processes, with the desideratum of obtaining hotspots of high risk and of great importance to the municipality and society, in order to evaluate and further monitor the areas by means of direct measurements and remote sensing. The current case study is one of the chosen hotspots, that represents a multiannual monitoring of an important urbanized area, by means of geodetic and topographic measurements with instrumentations such as GNSS systems and total stations for the best obtainable precision. The ground survey is also accompanied and elevated by a flight survey with UAVs and geomatics techniques, in order to evaluate the entire study area as opposed to the survey points (markers or landmarks). By combining the two methods, the obtained results are comprehensive and provide a better understanding of the complex movements and displacements present in the monitored landslide.
2. Materials and Methods
2.1. Study Area
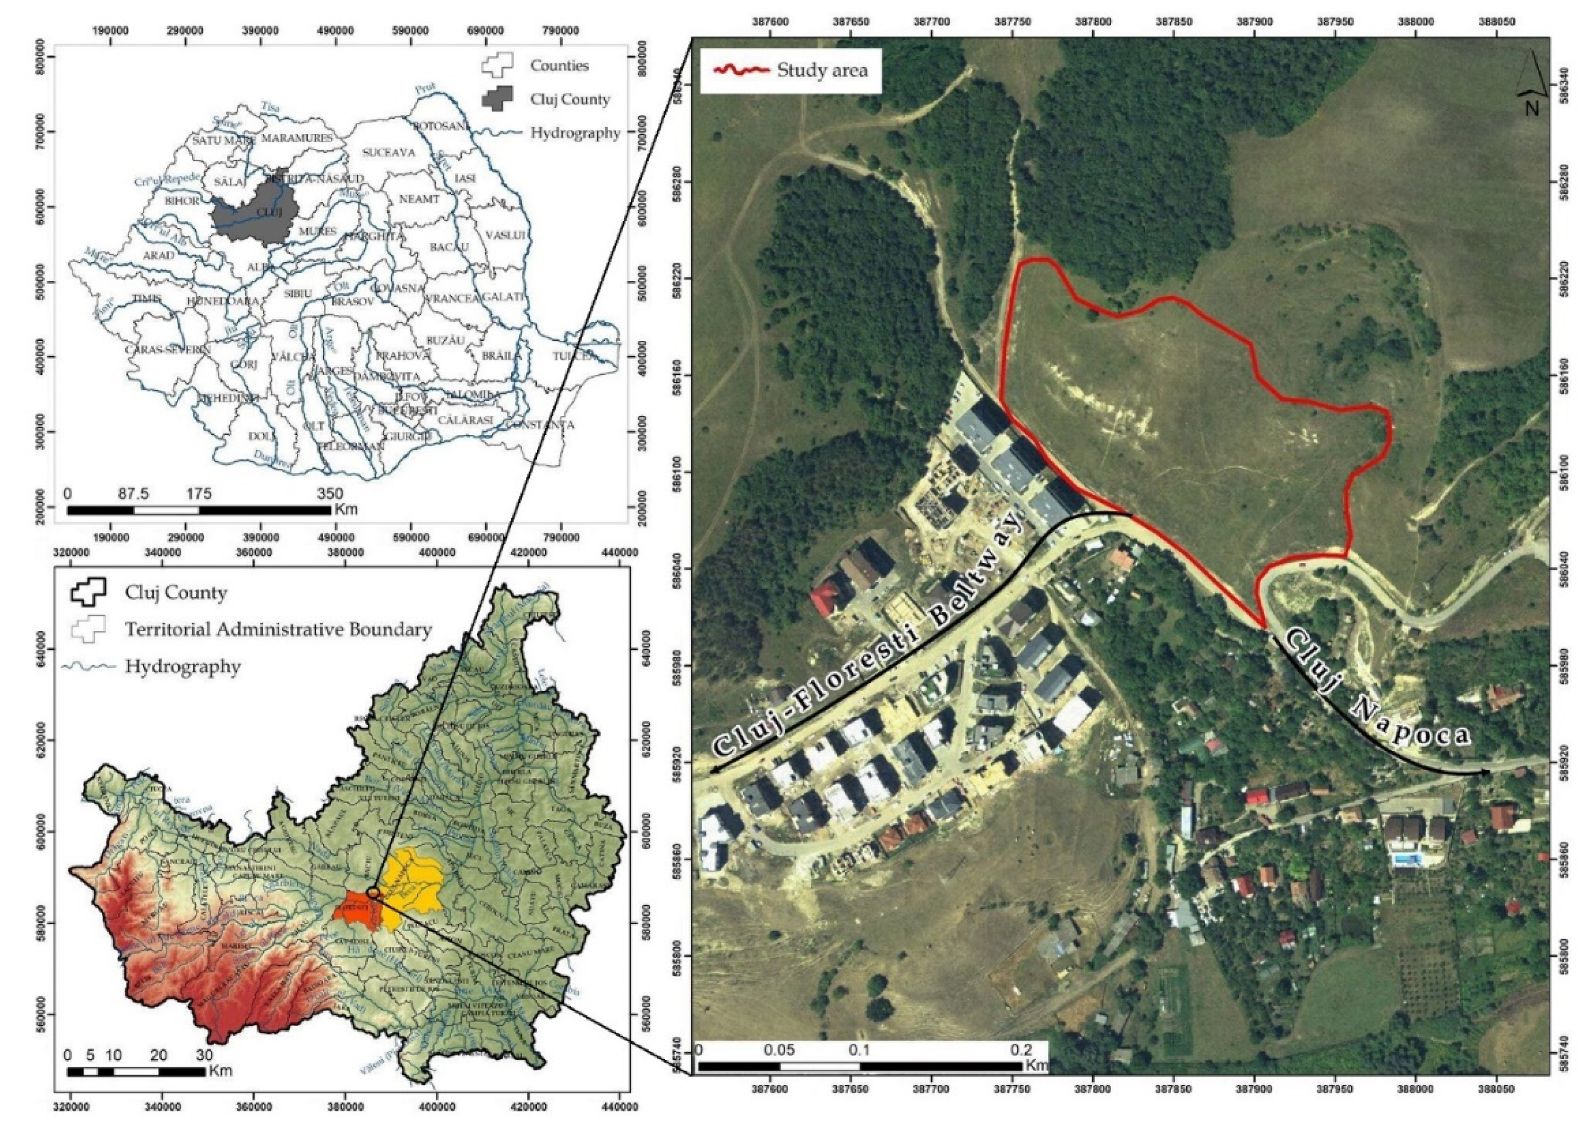
In the center of the historical province of Transylvania, Romania, is the county of Cluj, within which there is a hilly region, known as “Dealurile Clujului” (Cluj Hills). Because the hilly areas and their slopes are exposed to specific hazards, represented by landslides, research in this field is justified and of current importance. As a geographical location, Cluj County is located in the central-western part of Romania and has an area of 6674 km2 (area representing 2.8% of the country). The county has a relief that can be considered plateau, hills, and mountain, the mountainous area being approximately a quarter and being located in the southwest of the county (Figure 1).
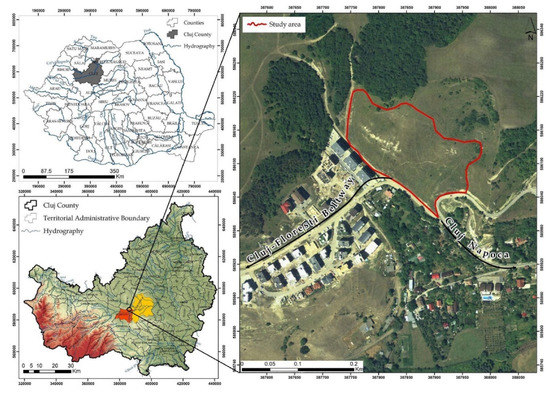
Figure 1.
The geographic location of the study area.
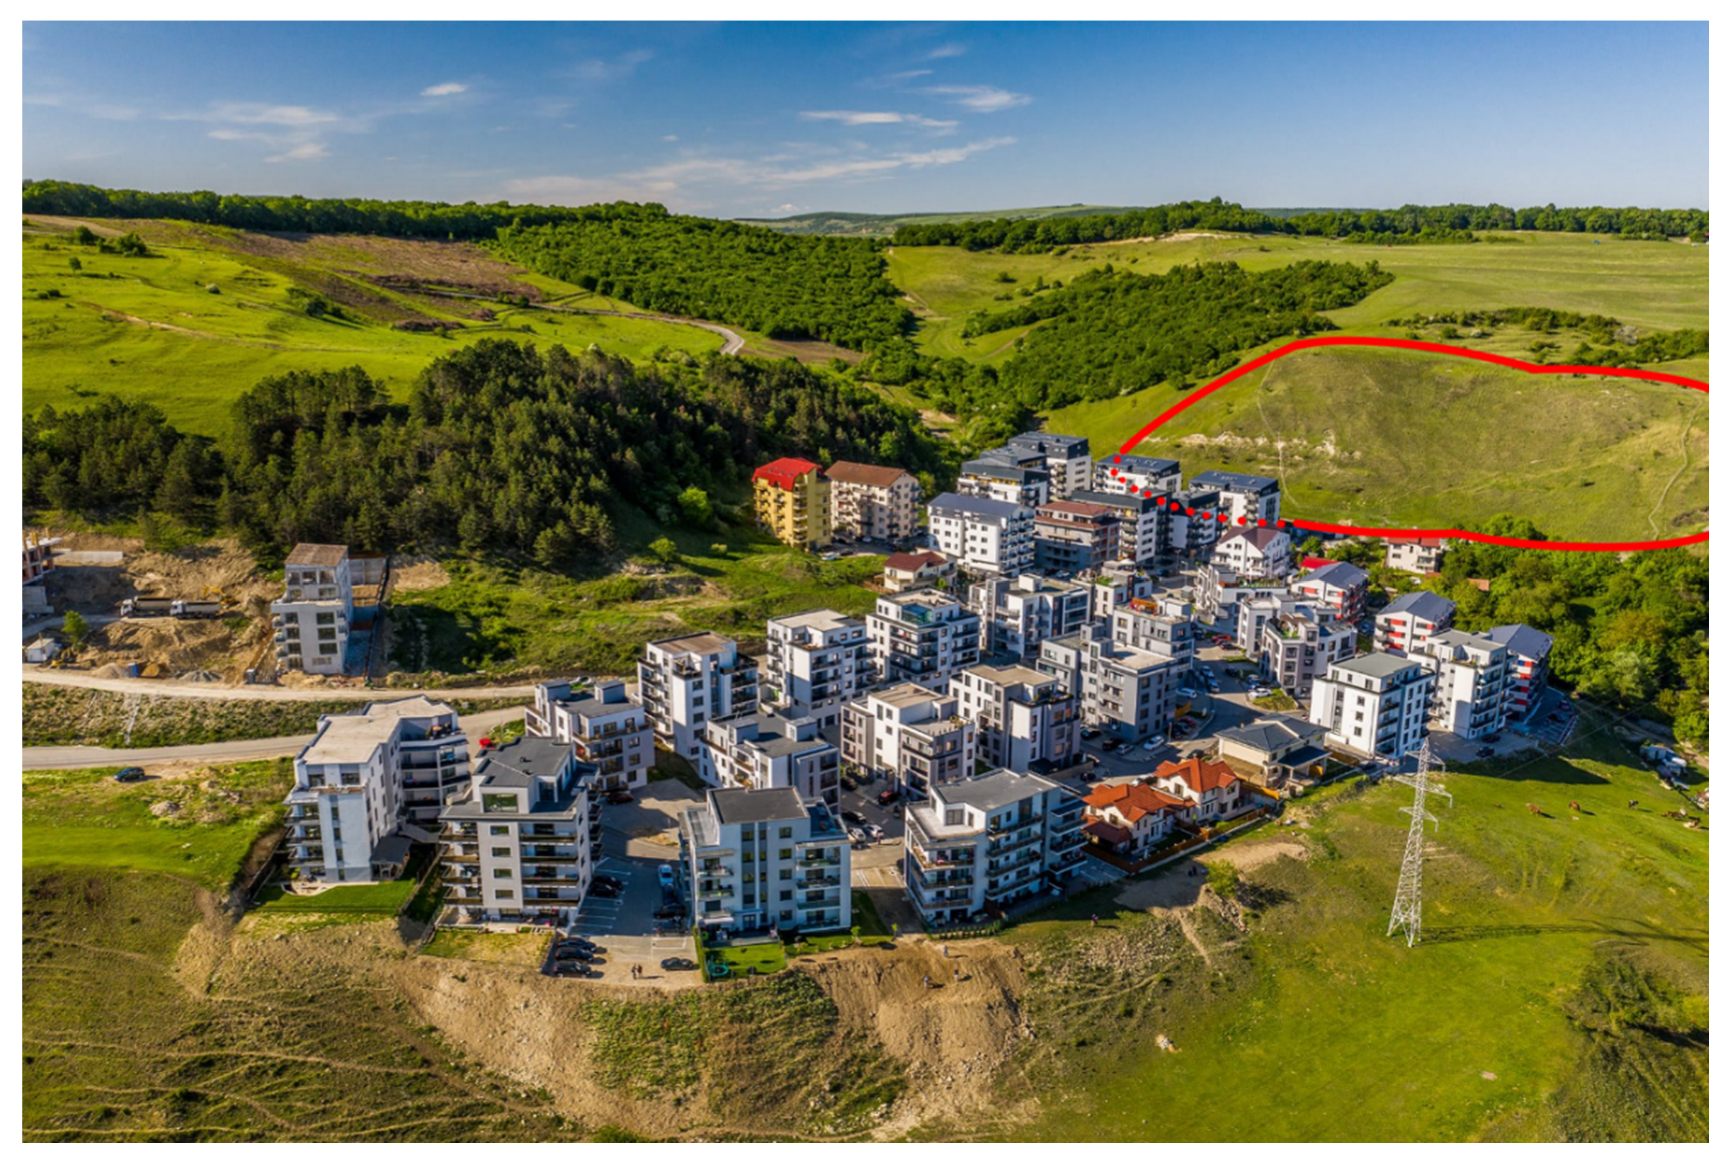
The present case study took place in the form of a complex and multiannual research, conducted at the border junction of the territorial administrative unit (TAU) between the city of Cluj-Napoca and Floresti village, at the end of Grigorescu neighborhood that continues with the current northern beltway, which connects Cluj-Napoca and Floresti (Figure 2). If only five years ago, this road was unpaved, used for agricultural purposes for the parcels in the area, mostly meadows and pastures, now the situation has changed radically, the area is experiencing a significant development in recent years [2,5]. With the major expansion of Cluj-Napoca municipality and the metropolitan area, many adjacent areas developed rapidly, the price of land exploded, and the pace of construction works increased rapidly [4]. The area under study, located at the entrance of Floresti TAU, is known as Donath West or even Donath Park, after the name of the first real estate complex located in this area. From a real estate point of view, investors, builders, and real estate agents promote this area as part of Grigorescu neighborhood of Cluj-Napoca, to capitalize on the fact that this neighborhood is one of the best ranked and sought-after in the city. The appreciation enjoyed by the Grigorescu neighborhood is due to its relatively small size, the preponderance of single-family buildings, which implicitly gives a low population density and a significantly lower traffic than in other areas. To these is added the location on the Someș Corridor, an area with promenades, with green spaces, parks and beaches on the bank of the Someș River. However, the emerged small western Donath neighborhood belongs to Floresti administration, the largest village in Romania, with a population of over 60,000 inhabitants. Because it is located at a distance of less than 10 km from Cluj-Napoca, Floresti has developed at a great pace in the past decade, due to the facilitation of obtaining building permits, cheaper land than in the city, and ease of built area expansion due to the predominantly flat character of the territory [40,41]. As the price of the apartments is at least 40% lower compared to the prices in Cluj-Napoca, and the property taxes are lower, because of the fact that it is a rural environment, Floresti has attracted a large number of new inhabitants and constructions, but this unprecedented and rapid expansion transformed it in patches of chaotic suburb with lacking infrastructure and services.
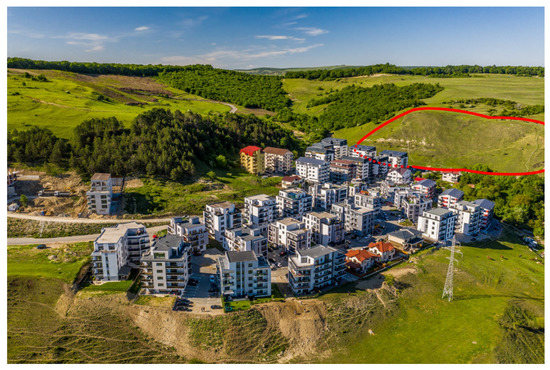
Figure 2.
Aerial photo of the emerged residential complex and monitored study area.
The area chosen for the study has recently become important not only because of the newly emerged neighborhood, but also because of the transformation of the old agricultural road into the northern beltway that connects Cluj-Napoca to Floresti. Thus, in addition to the increased number of residents of this small neighborhood, the area is transited daily by thousands of cars, especially during peak hours, in the morning in the direction of Cluj-Napoca, respectively in the afternoon and in the evening in the opposite direction.
2.2. Methodological Approach and Geological Background
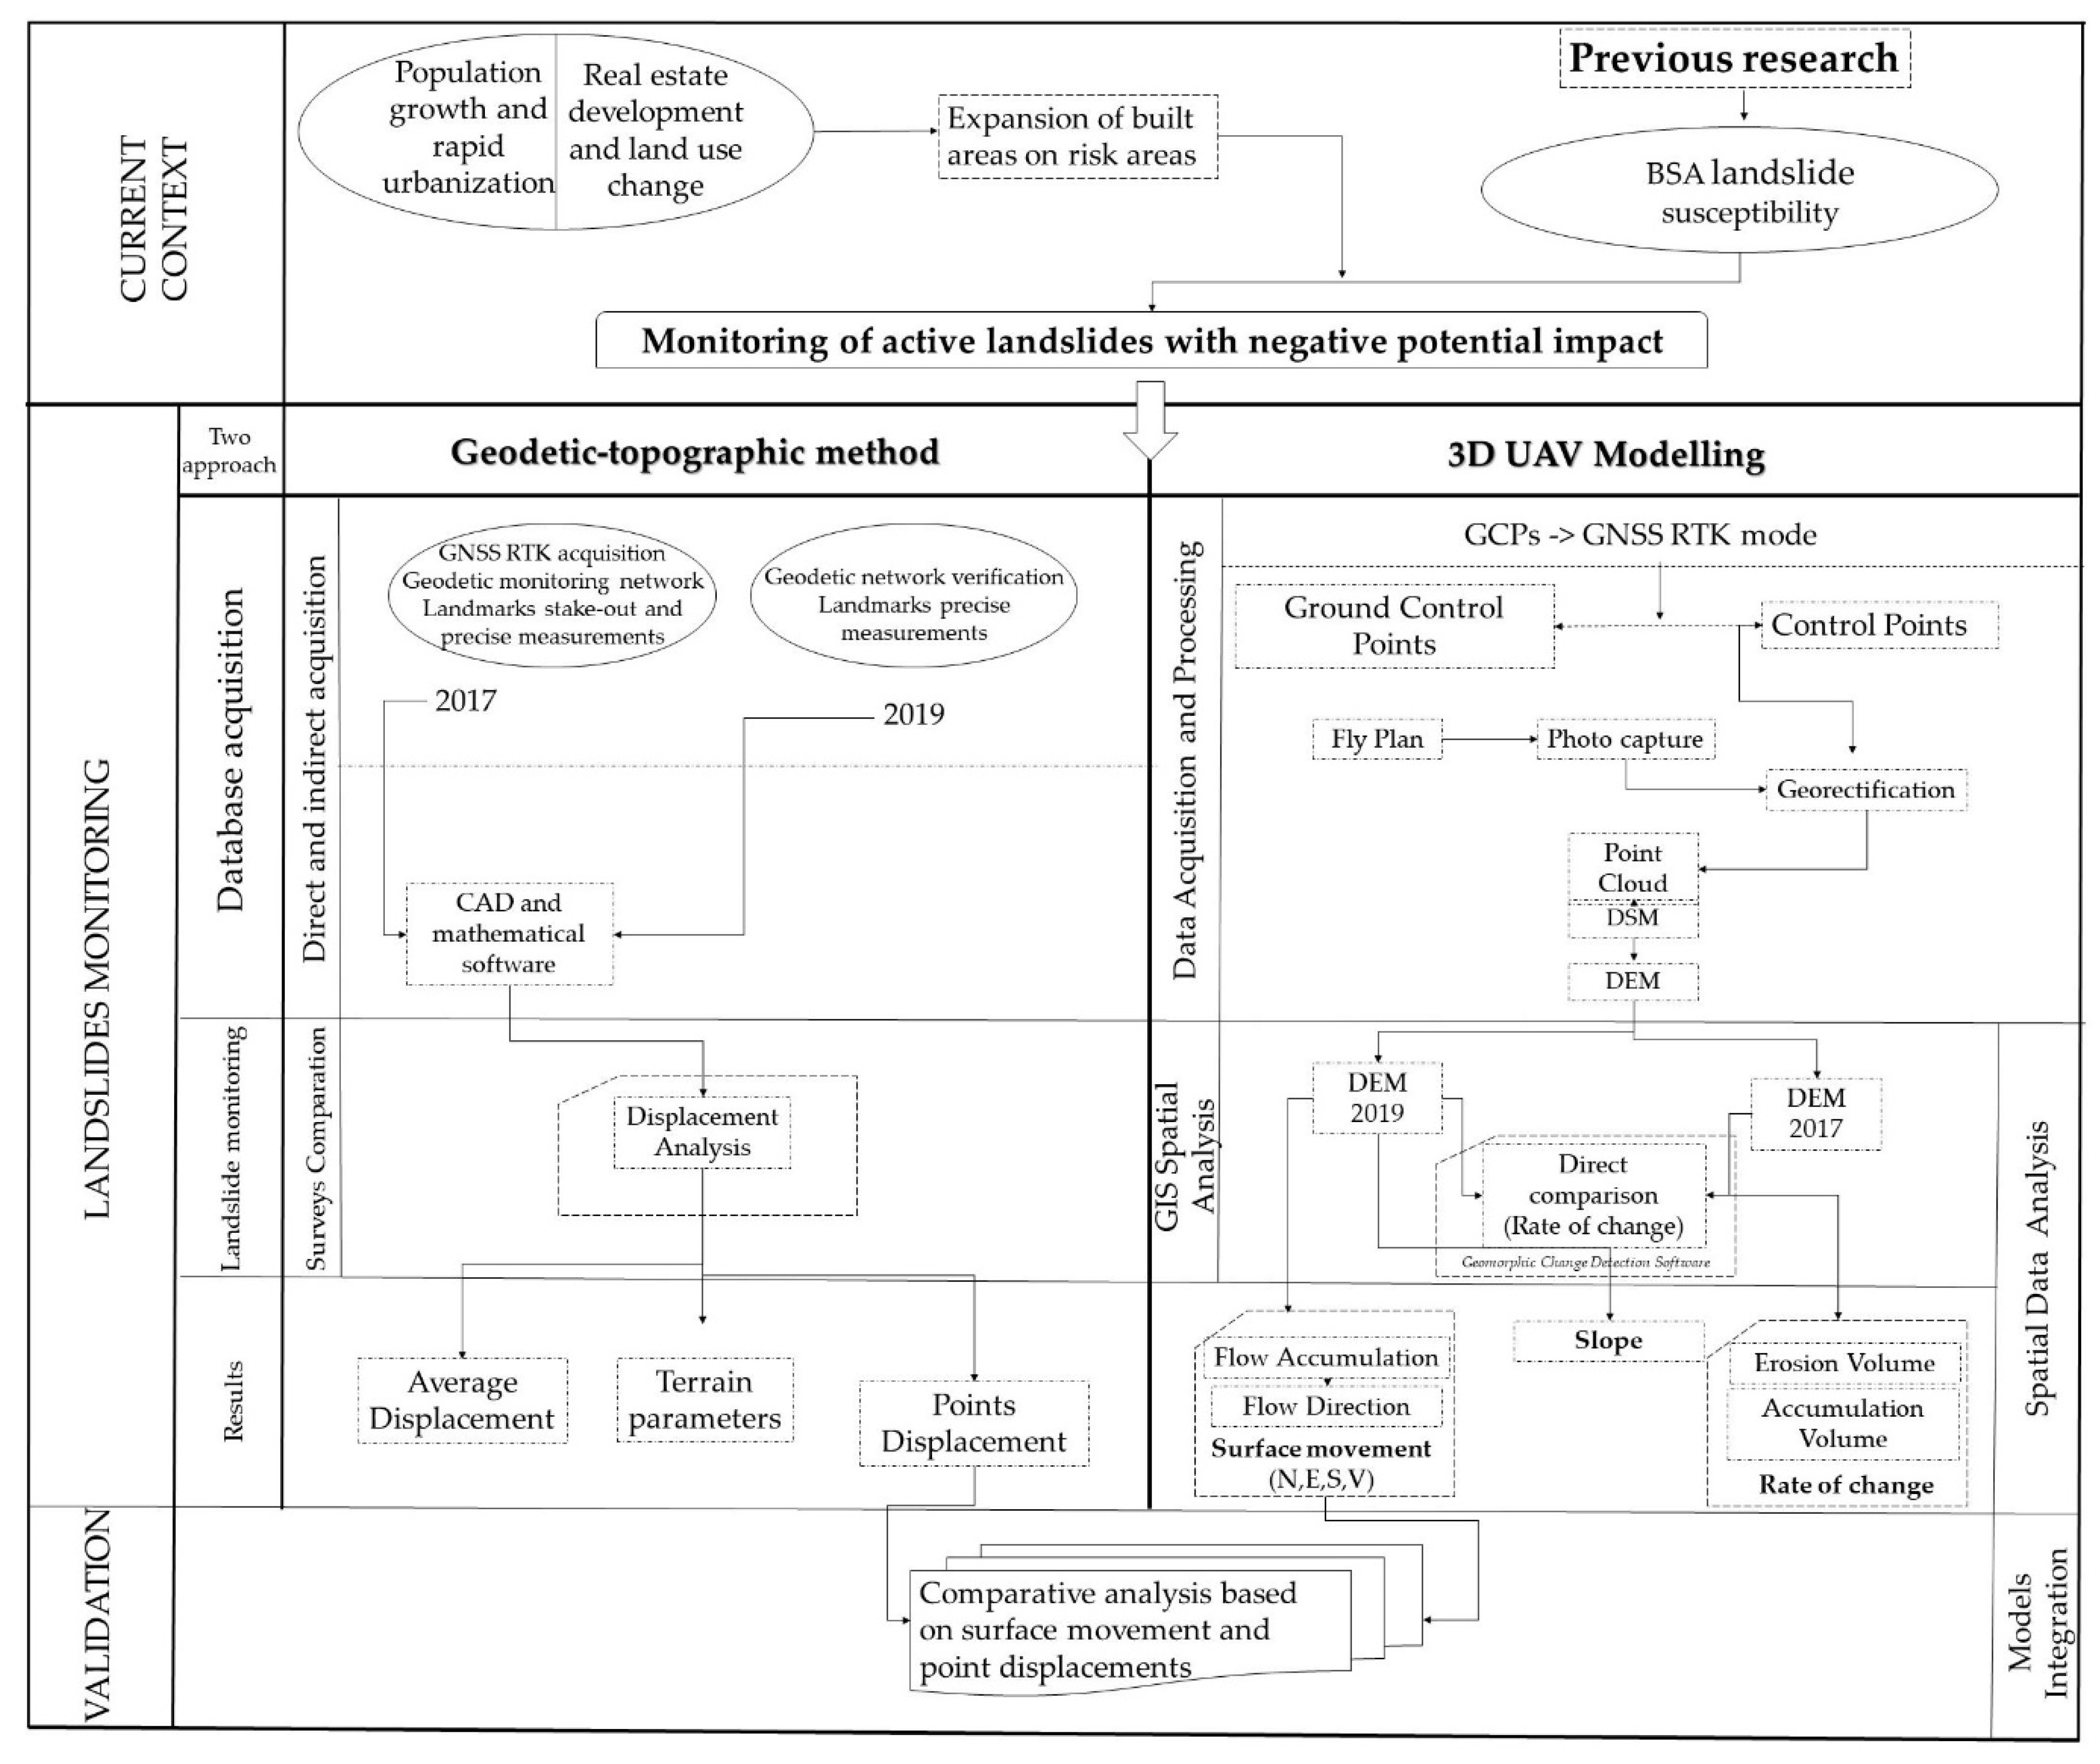
Monitoring the selected slope is a complex and long process requiring the follow-up of distinct and adapted methodological steps for each survey stage. The landslide monitored in the present study induces risk in the territory, first on the residential complex developed as a result of the extension of the residential areas in the suburbs of Cluj-Napoca, and second on the related infrastructures. Considering the potential risk impact as well as the high probability of occurrence due to previous spatial landslide analysis, it was decided to establish the development of the monitoring process based on a complex methodology. The framework is interconnected with the two main methods of analysis, first the geodetic-topographic method that focuses on the displacement evaluation of the points marked on the ground using precise measurements and made in different time periods, 2017 and 2019. Second, the UAV method which focuses on the analysis of changes in the configuration of the terrain based on geomatic techniques using the photos and GCPs obtained as a result of the flight missions from 2017 and 2019, in order to obtain comprehensive results with a higher degree of accuracy and precision.
The whole approach of this research (Figure 3) is structured based on three main stages of database acquisition, landslide monitoring, and presentation of results. Depending on the requirements of the two methods of investigation (methods developed in the form of sub-models of spatial analysis) the acquisition of spatial databases was made, which is the foundation for the development of models, directly based on geodetic measurements and indirectly using UAV techniques for obtaining digital elevation models with a high spatial resolution and sufficient accuracy. The effective landslide-monitoring stage is outlined, on the one hand, in the form of a digital comparison of geodetic measurements performed in different years to highlight the axial displacements of the surveyed markers/landmarks, and on the other hand in the form of a model of spatial analysis to identify the spatial/territorial changes in the topography of the analyzed slope based on the comparative analysis of the digital elevation models obtained for characteristic years.
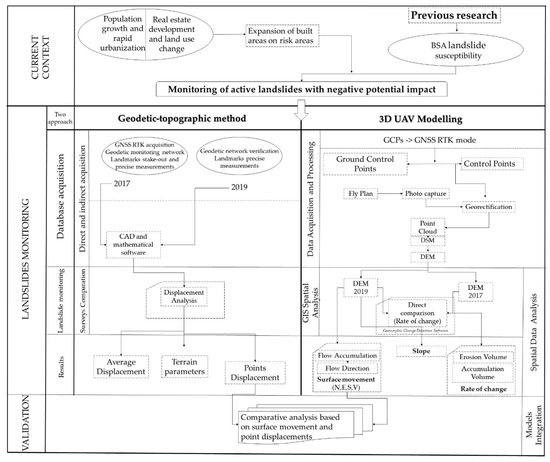
Figure 3.
Methodological flowchart.
The obtained results highlight the dynamics of the landslide process, direction of movement, speed of development, as well as critical hotspots, spatially identifiable, in terms of displacement, erosion, and material accumulation. An important step in this research is the validation of the final results. The validation step is based on the procedure of direct comparison of the results obtained based on the spatial analysis implemented in the second method with the results obtained as a result of the implementation of the first method (geodetical and topographic validated results). This way of validation is very useful and at the same time necessary to highlight the need for the simultaneous implementation of both methods to obtain complete and correct results in terms of dynamics and spatial, temporal, landslide development [8,38]. Based on the integrated analysis of the results, warnings can be issued regarding the probable impact of the landslide analyzed and suggestions regarding the future implementations of appropriate technical measures to reduce the dynamics of the analyzed process as well as suggestions regarding the arrangement of the adjacent land in order for the risk exposure of developed or developing infrastructures to be reduced.
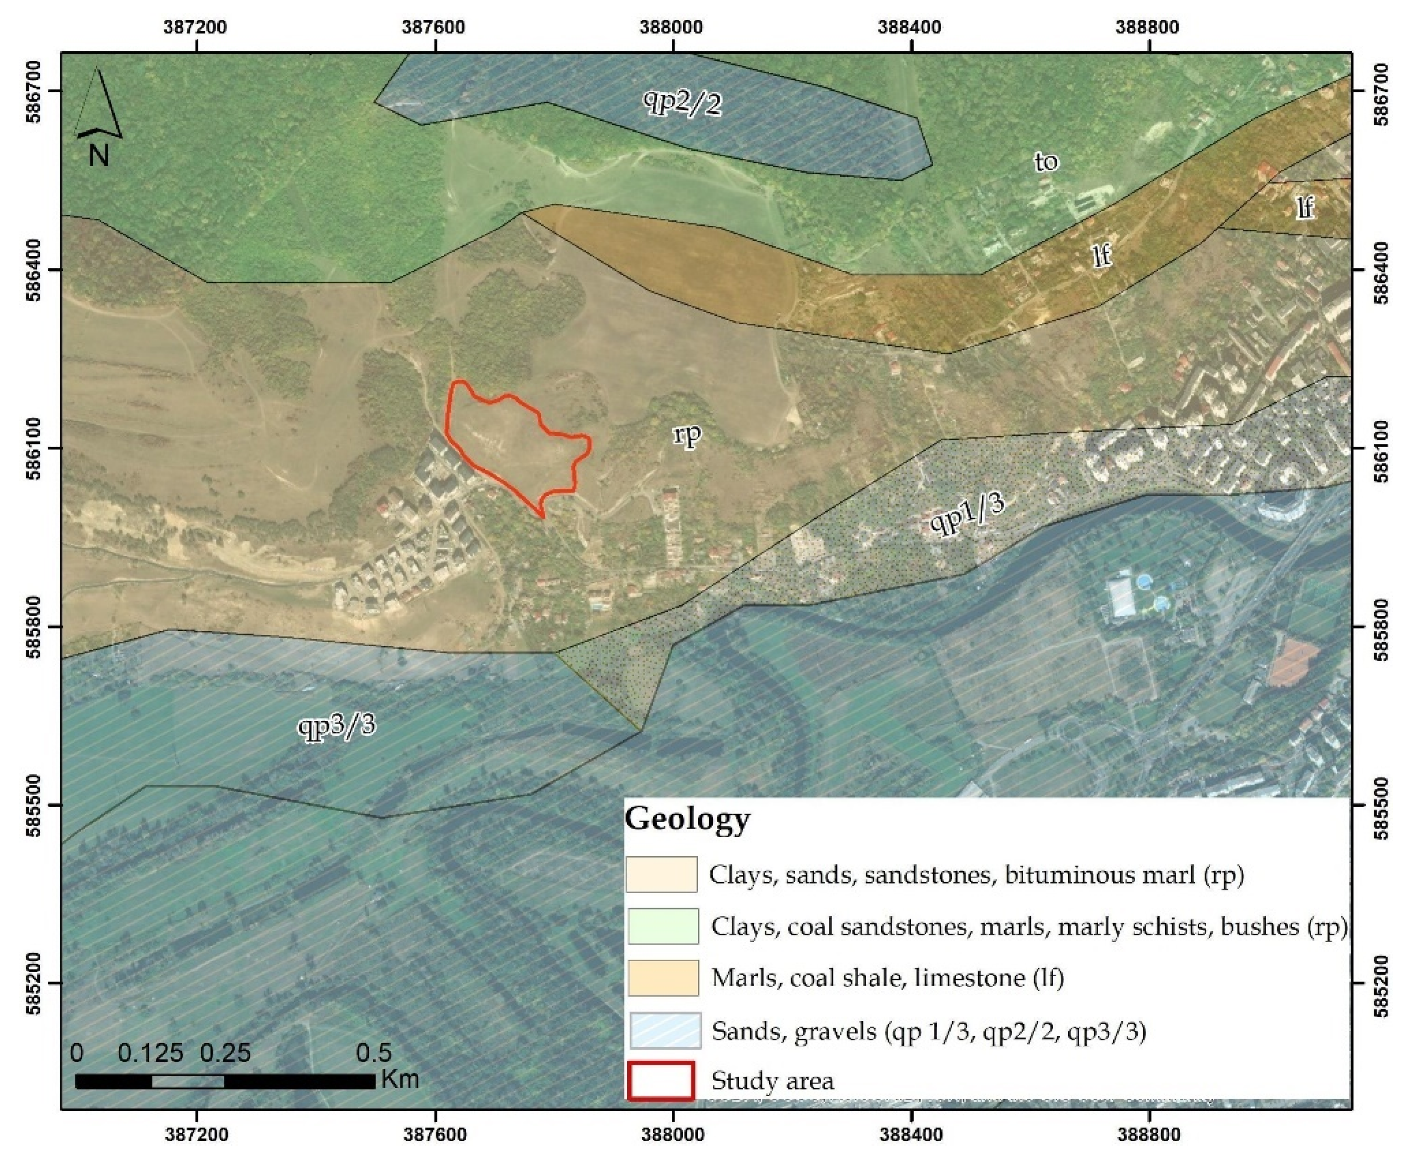
The friable geological substratum represented by the sedimentary rocks from the Transylvanian Depression that were deposited in a marine and lacustrine regime has a high structural diversity. It can be observed that in the peri urban area of Cluj-Napoca predominates the quaternary formations (Figure 4) formed by the fluvial sediments from the area of Somesul Mic riverbed and by the terraced sectors created by pleistocene gelisolifluction movements.
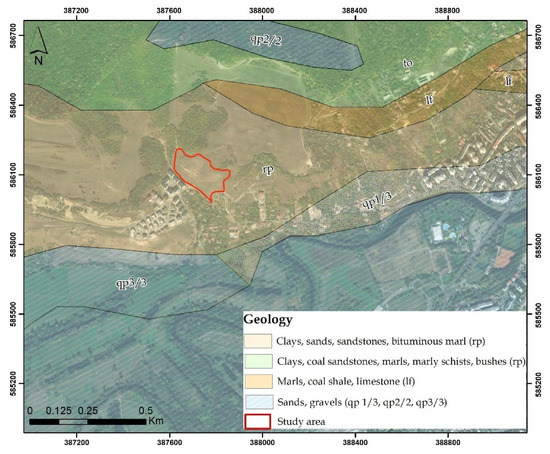
Figure 4.
Study area geology based on the Geological Map of Romania, 1:200,000.
Thus, the geological structure and lithology conditions the occurrence of mass displacement processes, favoring their occurrence when the rest of the causative and triggering factors are met. The analysis of slope instability phenomena induced by the geological factor involves the use of geological engineering methods and geo-spatial methods to measure the susceptibility to landslides of an area. The current methodology in this study is part of two categories of noninvasive methods to determine the spatial-temporal dynamics of the slopes.
The study area is in the category of the geological class of clays, marl-calcareous (rp) Oligocene (Rupelian), (based on the Geological Map of Romania, 1:200,000) category at which the highest frequency of active landslides was identified at the level Cluj County, representing 28.75% of the active landslides [42]. As no geological profiles and laboratory analyses have been performed so far at the level of the study area, in order to avoid the generalization of rock stability parameters, a geospatial analysis was performed based on bivariate statistical analysis that highlighted the geological classes with the highest density of landslides in order to identify the hotspots in the peri-urban area. At the level of these hotspots, the applicability of UAV technology and detailed geodetic-topographic measurements was tested to monitor and evaluate the areas with the greatest instability.
2.3. BSA
The current case study and multiannual monitoring of a shallow landslide was chosen after careful consideration based on a previous research [6,43]. The identification of susceptibility of the investigated area to landslides by means of bivariate statistical analysis method allowed the comparison of the landslide inventory map with maps of landslide influence parameters and the ranking of the corresponding classes according to their role in landslide formation [44]. The original model of the analyzed territory, located in the eastern sector of the Transylvanian Depression, in Cluj County, on an area of 1041 km2, including Cluj Hills.
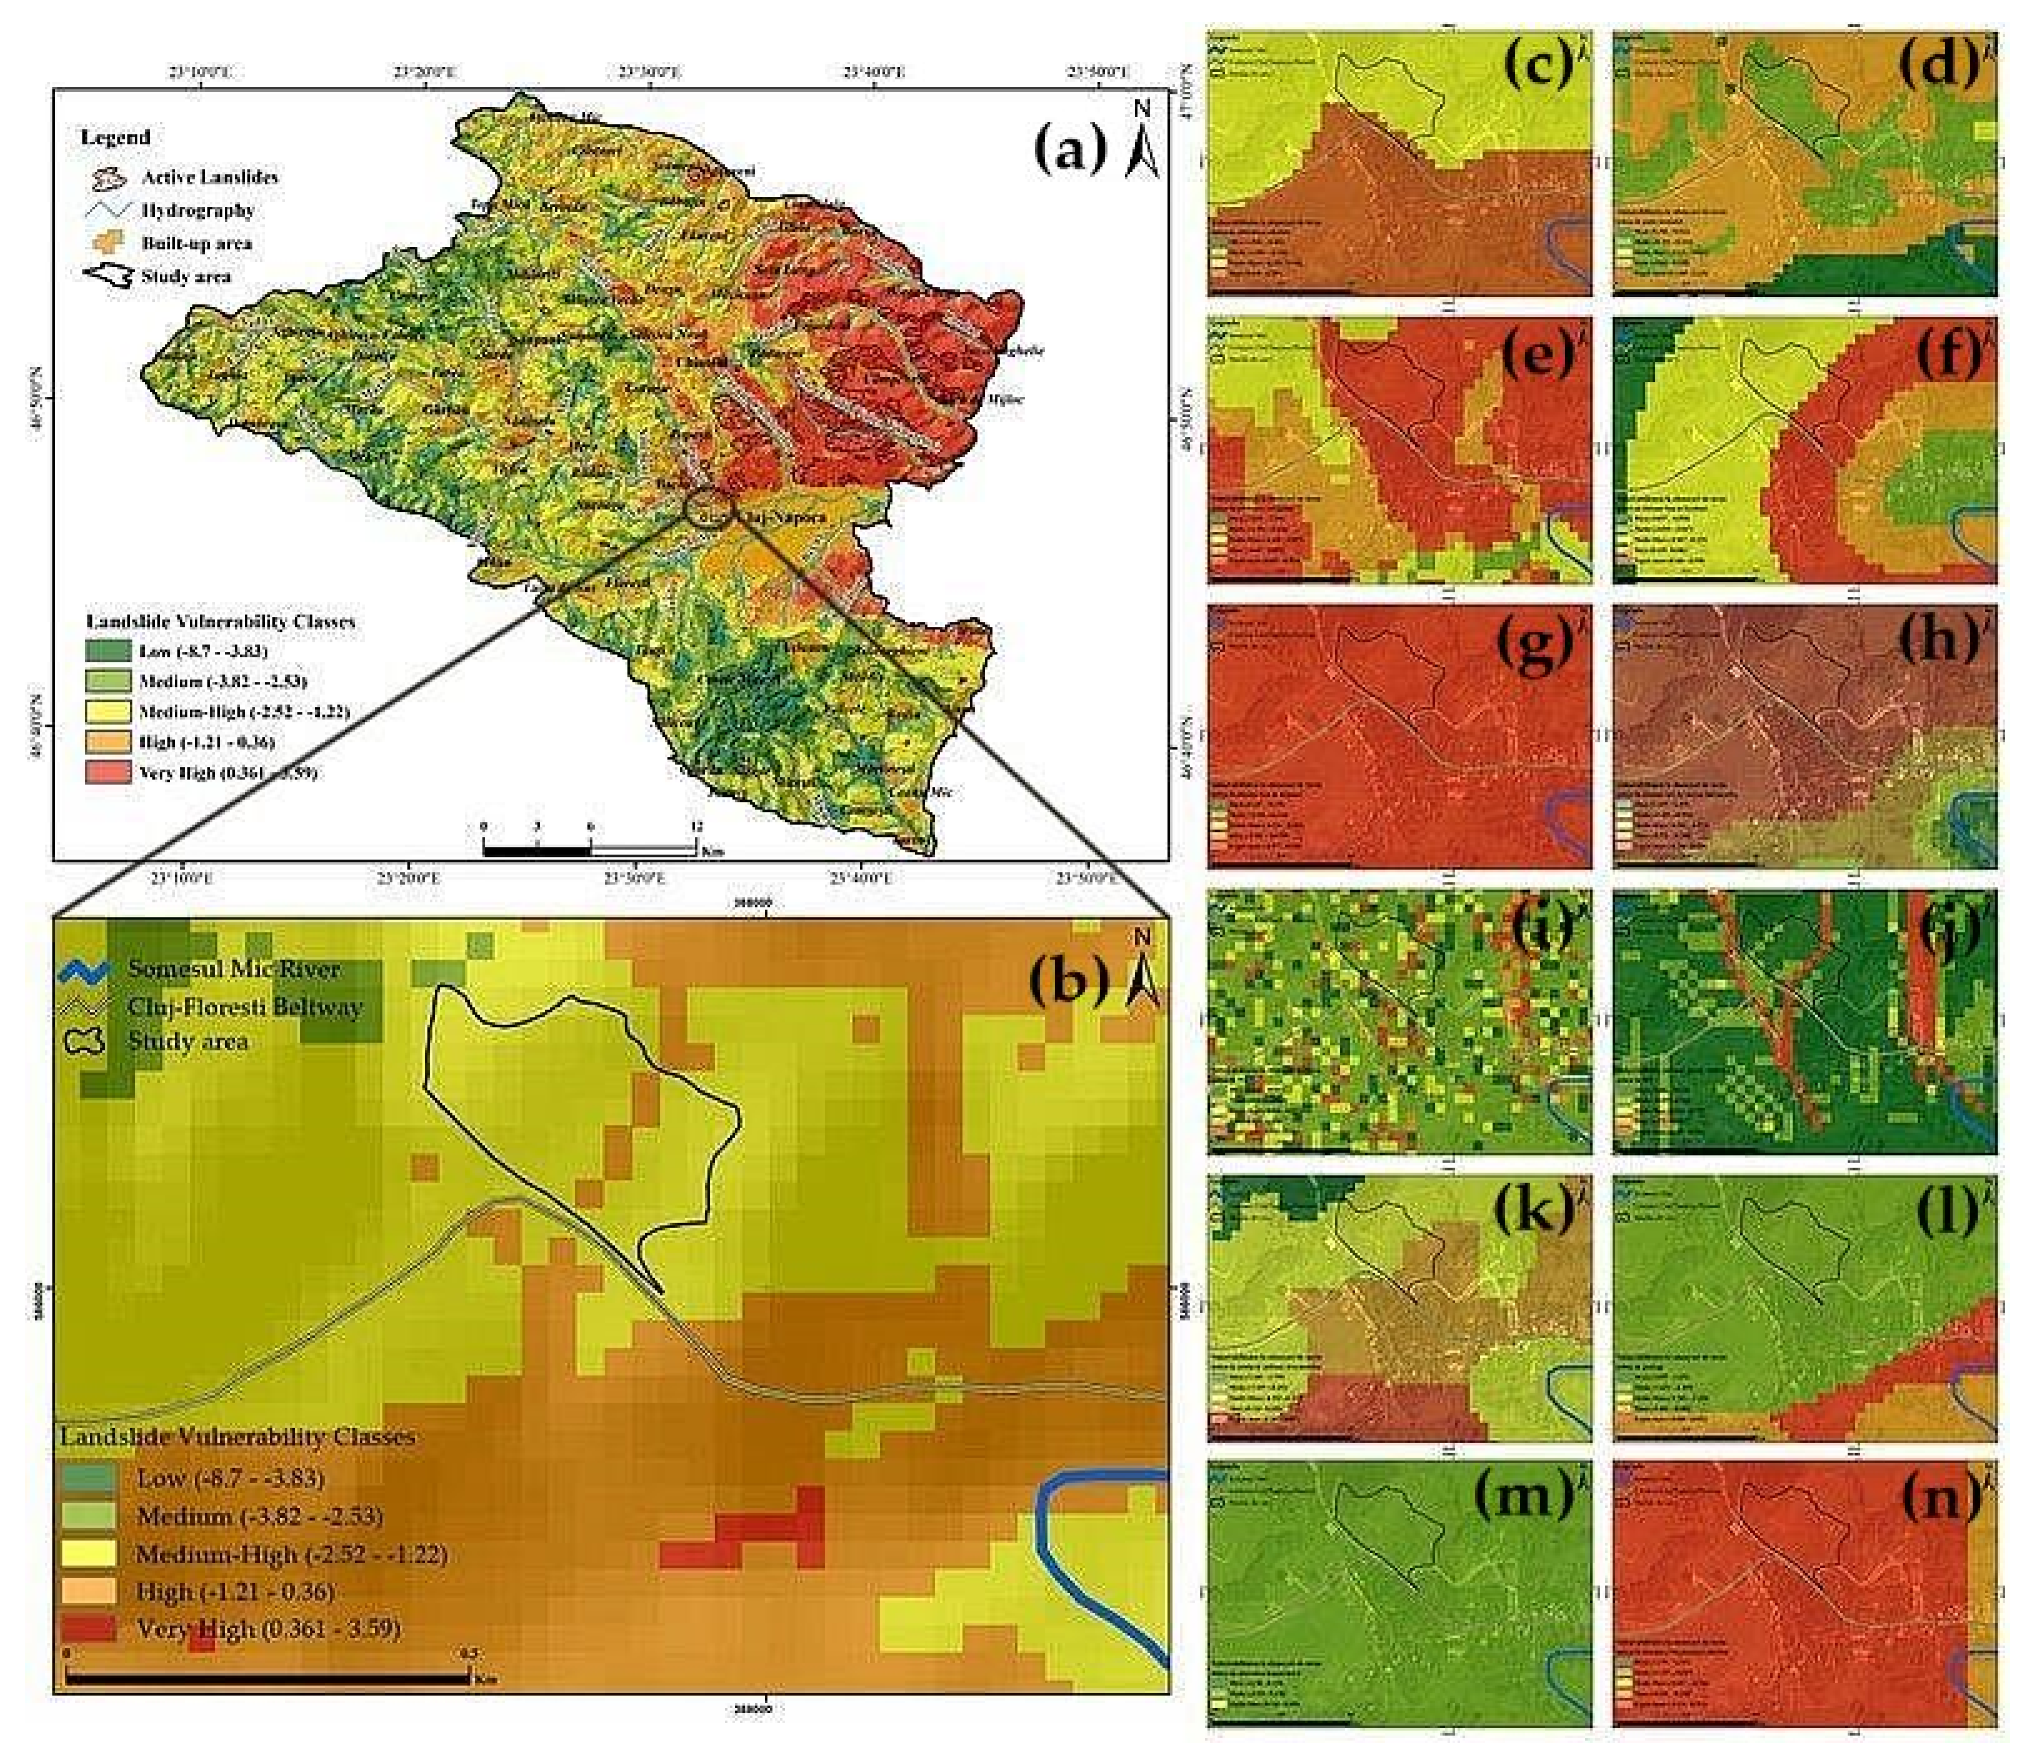
The model ensured the development of landslide vulnerability maps according to the analyzed factors that can influence the processes of mass movement on the slope: altitudes, slopes, fragmentation density, depth of fragmentation, slope orientation, WI (wetness index), and SPI (stream power index), land-use, geology, the distance to the hydrographic network, to human settlements and to the roads [45,46,47]. Thus, specific maps were created for each factor involved in possible landslides or in their triggering, respectively their favoring, on five classes of vulnerability: low, medium, medium-high, high, very high. The individual analysis of the factors taken into account to finalize the landslide vulnerability model based on the implementation of the BSA equation, provided relevant and useful information on the different and differentiated influence on susceptibility classes suggestively illustrated by the maps created for each factor (Figure 5).
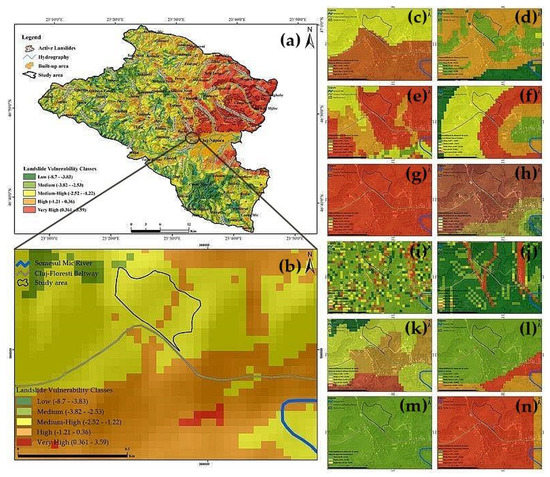
Figure 5.
Susceptibility to landslides map of the previous research (a) and of the study area (b); the twelve analyzed factors that can influence the processes of mass movement on the slope: altitude (c), slope (d), aspect (e), distance to settlements (f), roads (g), hydrography (h), wetness index (i), stream power index (j), land-use (k), geology (l), depth of fragmentation (m), and fragmentation density (n).
The results obtained by applying the spatial analysis equation based on the ArcGIS geoinformation software and creating the raster database with the spatial representation of the cumulative susceptibility for the entire analyzed territory were extremely conclusive. This is because the Natural Breaks (Jenks) classification method with the spatial identification of five susceptibility classes faithfully highlighted the characteristics of the analyzed territory, compared to the other classification methods available in geoinformation software [48,49].
For all identified hotspots, as well as for the rest of the territory included in the high and very high susceptibility class (with a major impact on the human component), it is recommended to carry out land improvement and stabilization works to reduce the risks to which they are exposed [50,51,52,53]. In this regard, concrete measures and actions are required, on the basis of which these areas should no longer belong to the very high risk categories.
The final result of the modeling highlighted some “hotspots” (critical areas on the map) of major importance, including for the city of Cluj-Napoca. An example of this is the present case study located at the border junction of the territorial administrative unit between Cluj-Napoca and Floresti. This superimposed surface near the newly emerged neighborhood is part of the Cluj Hills, and is classified in the category of medium-high and high susceptibility, with induced risk on territorial housing and services, but also on networks of communication and local infrastructure.
Although there were many other indicated hotspots on the previously developed vulnerability map with very-high probability class, this area chosen for geodetic and UAV monitoring is of special importance because of previously mentioned reasons, such as number of buildings with residents and the transited traffic of the beltway.
2.4. Established Geodetic Network
In order to monitor landslides, depending on the area studied, the existing geodetic points in the area, the measurement methods used and the accuracy required, classical measurement technologies as well as modern technologies or a combination thereof can be used. The geodetic-topographic methods used to monitor the movements of land require the design of a geodetic network and the materialization of landmarks for repeated surveys consisting of directional alignments with the direction of the landslide.
In the case of small areas, a local geodetic network is created, from which the coordinates of the tracked landmarks are determined, by repeated measurements, in order to determine the parameters of the displacement process on the slopes.
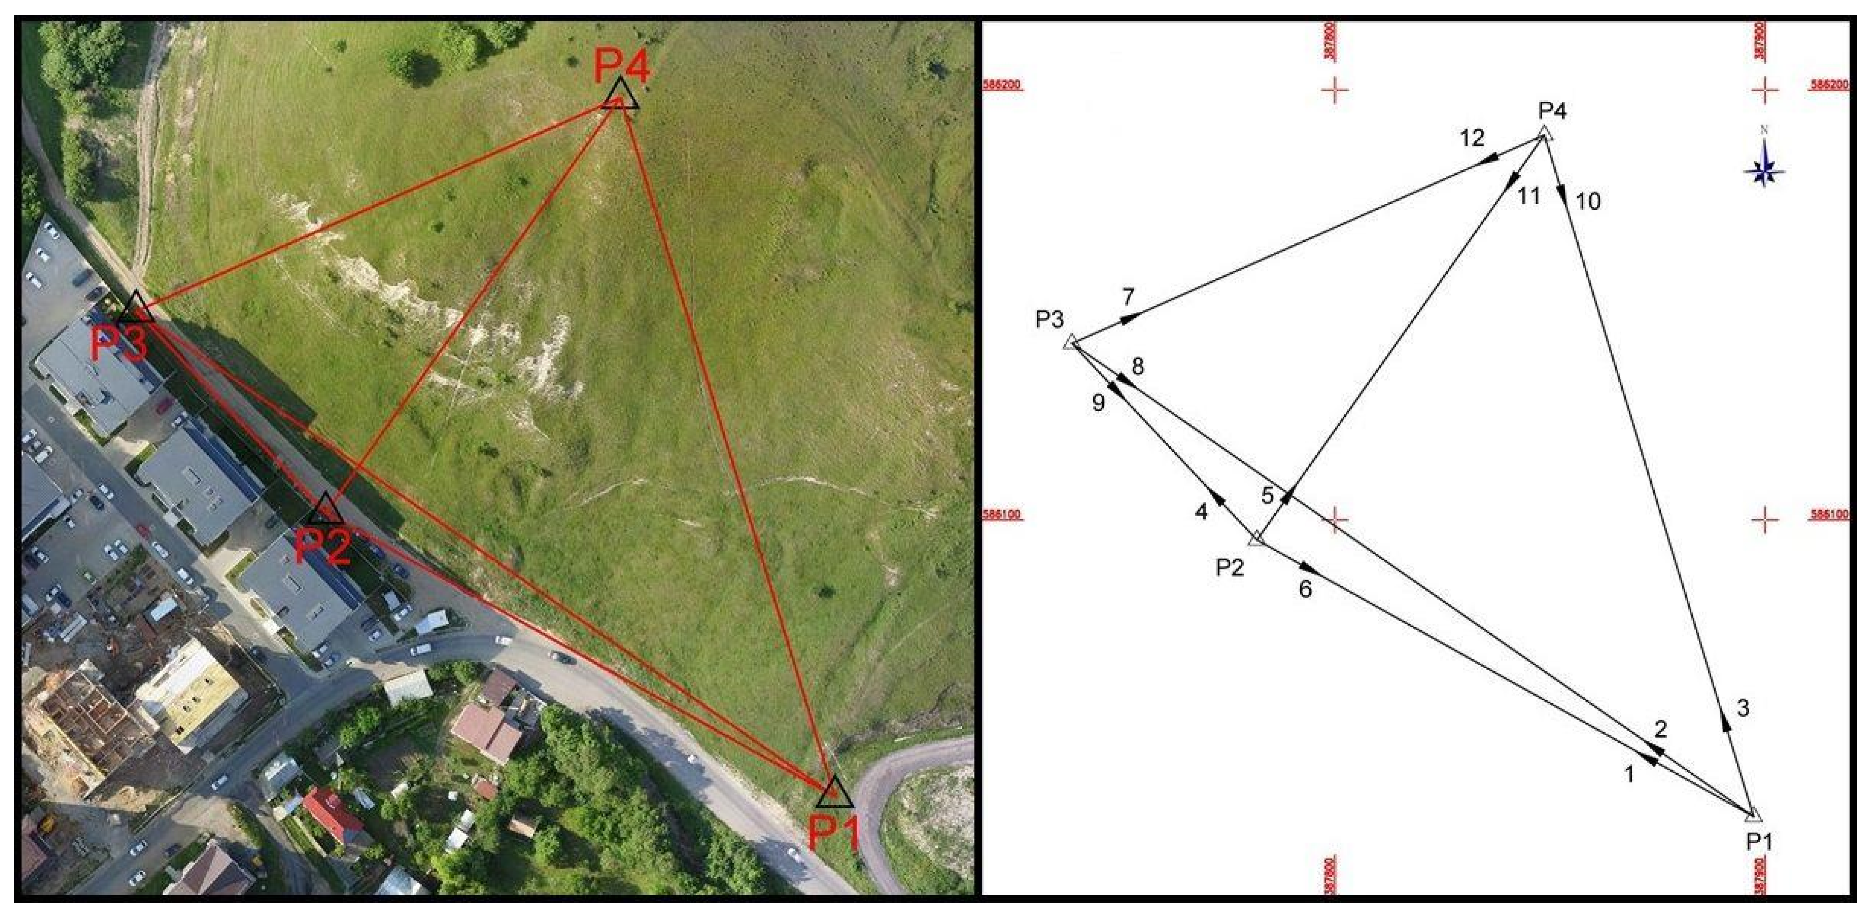
The geodetic support network, related to the case study, consisted of points P1, P2, P3, P4, materialized by anchorable geodetic markers, determined by GNSS satellite positioning technology, ROMPOS RTK. The precise determination of the coordinates of the observation points was taken into account, because a wrong determination of them may influence the final information on possible surface movements in the studied area (Figure 6). It was opted for the GNSS technology for the creation of the geodetic monitoring network, because of the efficiency, the lower cost price, and the short time to perform the measurements. In the case of classical methods of determining new geodetic points, by means of resection or traverse networks, the current great deficiency is the lack of reliable control points or geodetic points, almost completely destroyed in the past decades.
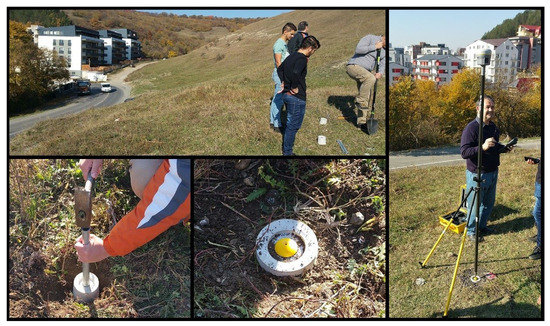
Figure 6.
Established local geodetic network.
The planimetric and altimetric determination of the points was performed by the method of control points, using Trimble R10 receiver and the TSC3 control unit. The measurement and recording method used was configured for 180 determinations, with a one-second recording rate and an overall centimeter horizontal accuracy. The ROMPOS–RTK method requires dual frequency receivers, direct Internet access from the field, via GSM/GPRS.
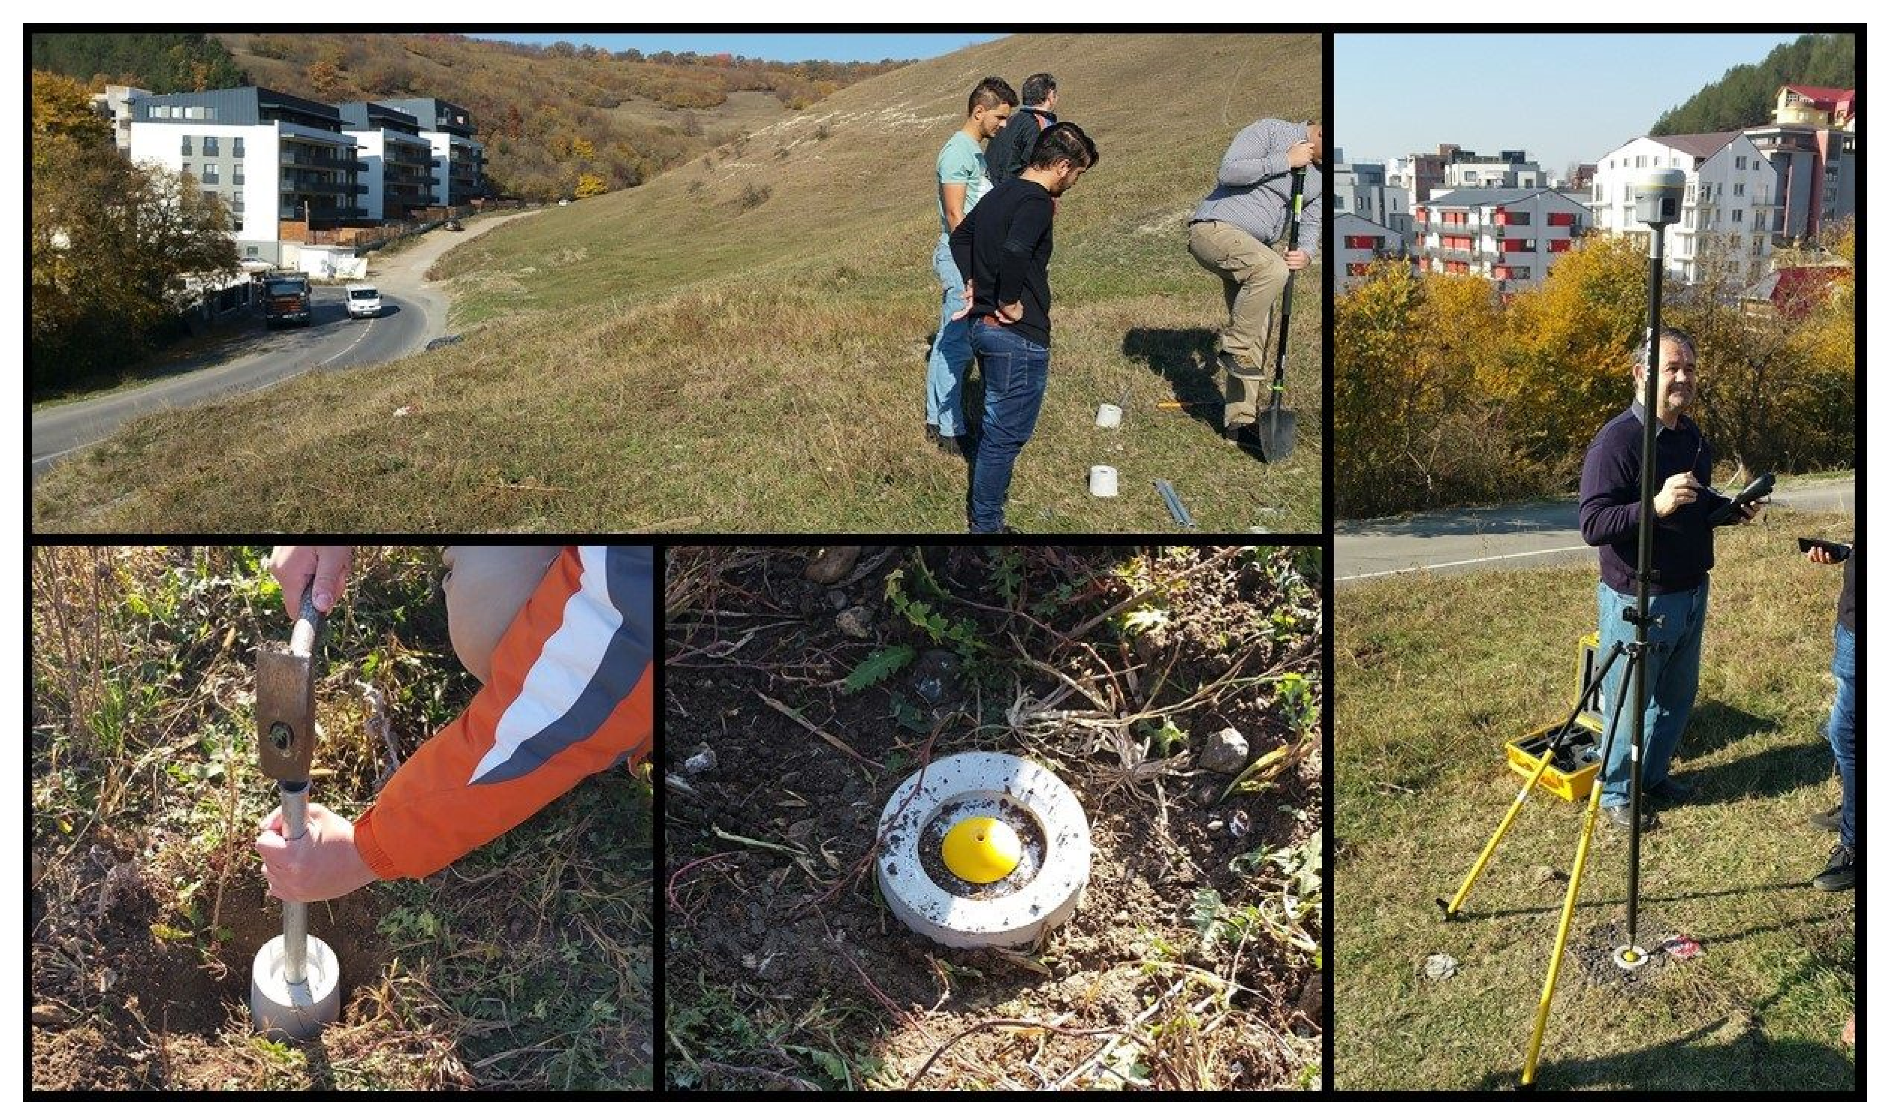
The Trimble R10 GNSS system was mounted on a pole on each of the four anchorable geodetic markers to determine the coordinates of the points in the locally created geodetic network. The points of the geodetic support network have the role of providing accurate measurements and determine the directions of movement of the monitored elements. As the observation points can change their position because of landslides and subsidence, accidental hitting of the geodetic marks, etc., the aim was to locate them in areas as well stabilized as possible, outside the monitored objective, so as to provide good visibility between station points, as well as their mutual targeting. In addition, the existence of at least one station point from which observations could be made to all the measured landmarks in the studied area was taken into account, for a better and more precise determination of them. In this case, points P2 and P4 provided the necessary visibility to the monitored directional and transverse profiles. As point P4 was located at the top of the hill offered the best visibility over the studied area, but being above the movement mass stored on the slope, the probability of its displacement was very high. Thus, point P2 located at the base of the slope, but at a sufficiently distance from it, close to a building with collective housing, respectively a relatively stabilized area, was used as the base station for all measurements. For additional protection of the geodetic marks, they were well anchored in the ground, but also buried to their top, so as not to attract the attention of passers-by and to reduce possible disappearances or destruction (Figure 7).
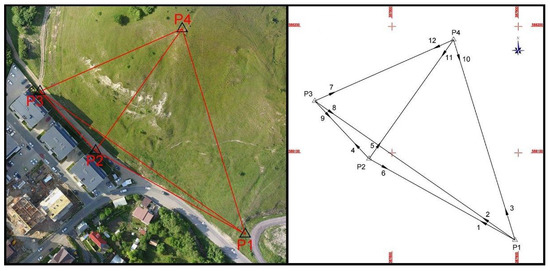
Figure 7.
The four geodetic control points for slope measurement and monitoring.
The ROMPOS system is an ANCPI (National Cadastral and Land Registration Agency) project that ensures precise positioning in the European ETRS89 reference system and coordinates, based on a national network of permanent GNSS stations. The values of the coordinates resulting from the GNSS measurements, were based on the readings from the permanent station Cluj (RTCM 0022) and processed with Trimble Access program, and displayed as WGS84 and in the 1970 stereographic projection plan, the Romanian projection system (Table 1).

Table 1.
Obtained control point coordinates.
For the verification of the geodetic network obtained with the GNSS RTK method, with a large number of determinations (180), their resulted average and the achieved sub centimeter level accuracy, the unconstrained model method was chosen. This implies the existence of starting elements, namely the coordinates of two points or the coordinate of a point and the orientation toward another. It was considered that two of the four points in the established geodetic network are fixed (P1 and P2), without coordinate variations, and their corrections are “0,” and the other two points (P3 and P4) are provisional coordinates, at which they were to be calculated corrections to obtain the most likely coordinates values. Based on these considerations, the system of correction equations was developed. To reduce the number of unknowns and the number of equations in the case of two old points, Schreiber’s equivalence rules were applied. The system turns into a normal system of equations, which is solved by the method of successive reductions, the Gauss-Doolittle method, presented in Appendix A.
The corrections of the provisional coordinates were calculated both by the Gaussian method and by matrix calculation, and the values of the corrections are identical, respectively for the control point P3 dX was 0.008 m and dY-0.008 m, and for the point P4 dX was 0.011 m and dY 0.009 m. The basic values were obtained by the GNSS RTK method for the four control points of the geodetic network. As the values of the coordinate corrections obtained based on the measurements are millimetric, it was considered that the accuracy of the instrumental observations satisfies the accuracy of determining the coordinates of the network points.
2.5. Land Survey Data Aquisition
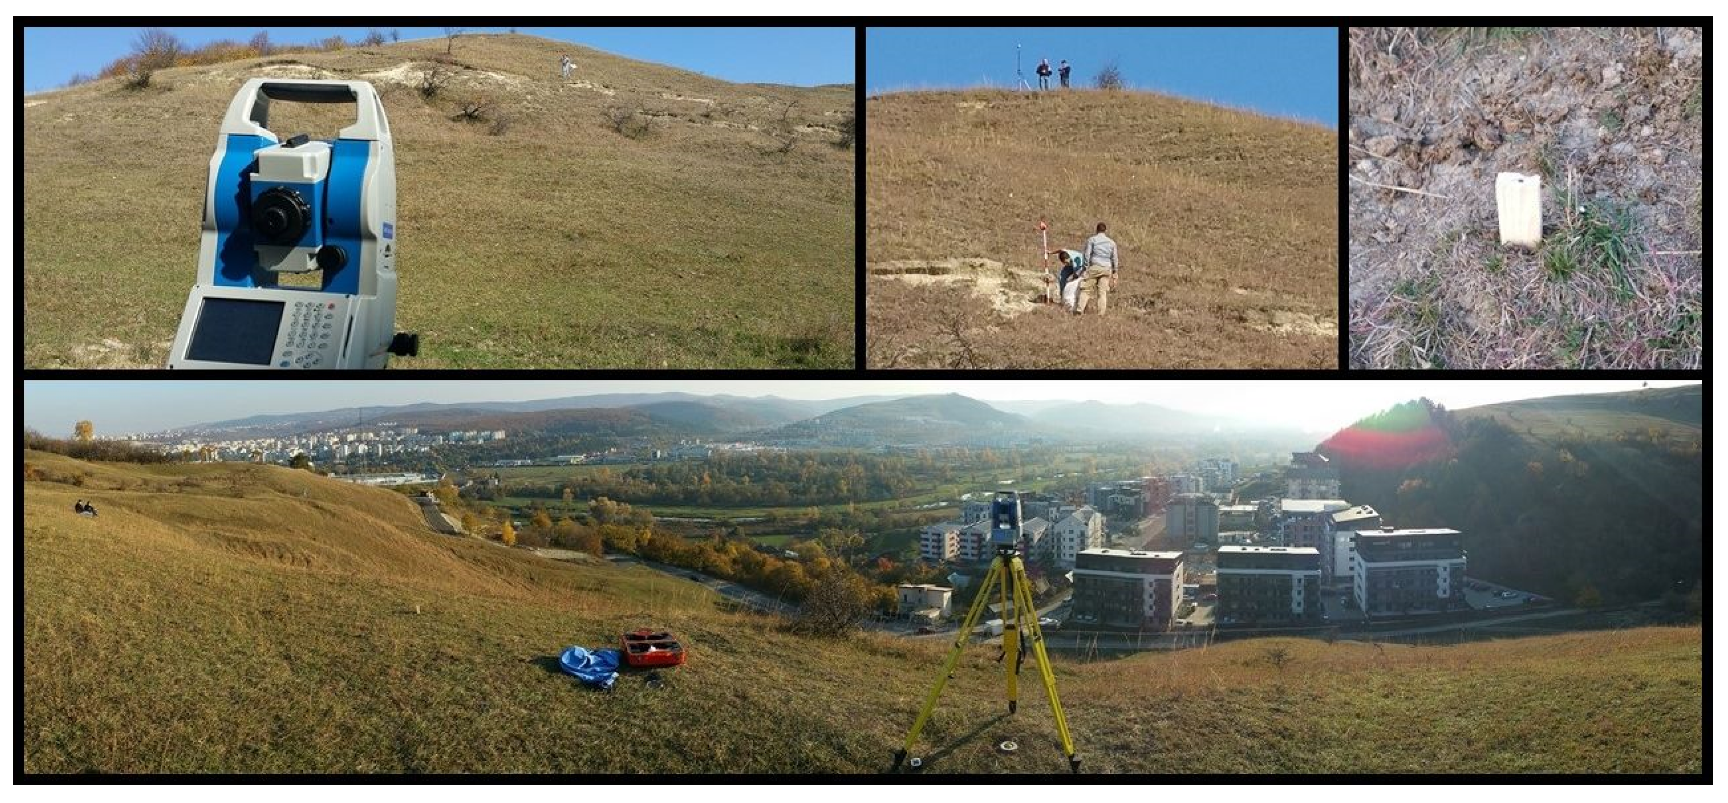
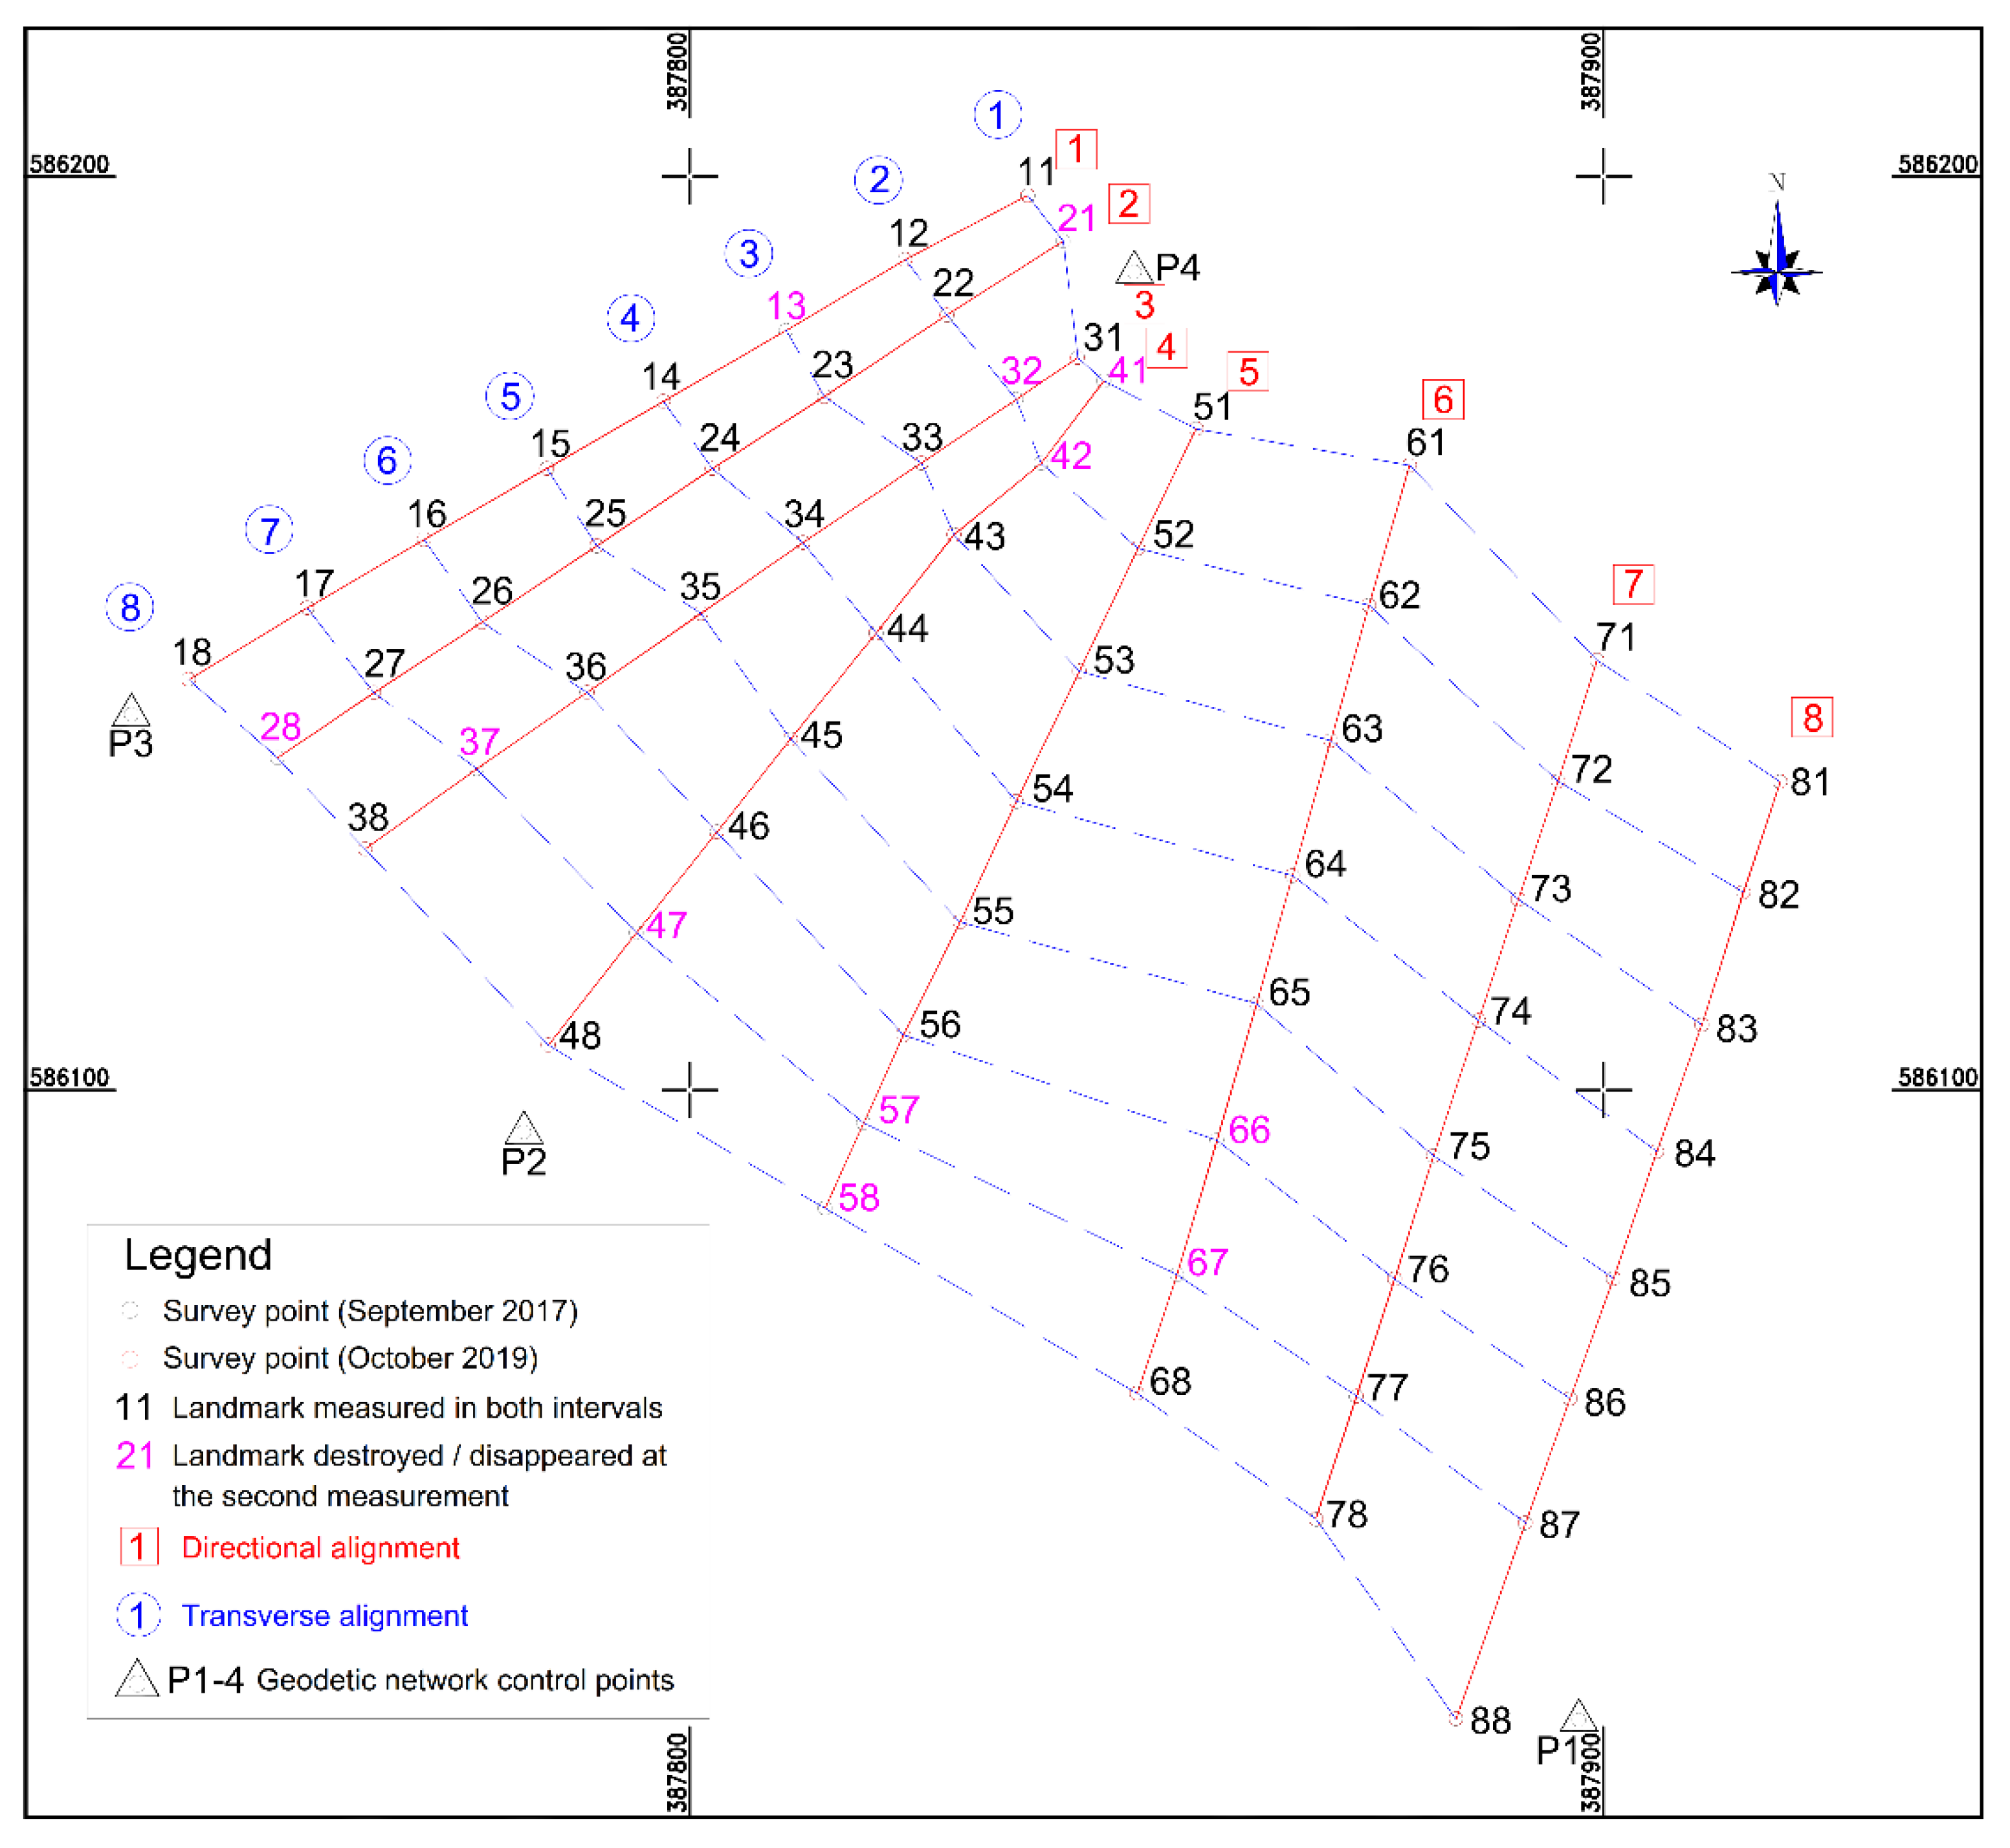
In the established geodetic monitoring network, observations were made using the Stonex R2Wplus total station, at an interval of 2 years, respectively the basic measurement (measurement zero), on September 2017 and then the measurements from the second stage on October 2019. In the case of the studied area, for the materialization in the field of the landmarks that represented the monitoring parameters for the sliding process on the slopes, eight directional alignments were staked-out on the direction of the slope, with eight points each. The choice for positioning of these alignments was made according to the relief of the land and the ownership boundary limit of the terrain for which the agreement to locate these landmarks was obtained. The alignments were staked-out and then measured with the Stonex R2Wplus total station, which has a very good measurement accuracy of angles of 2” and distances of ±2 mm + 2 ppm. The materialized landmarks were wooden stakes with universal cross head screws. A good fixing of them in the field was ensured, and throughout the cross head screw a good fixation and precise positioning of the reflector in the measurement stages was ensured (Figure 8).
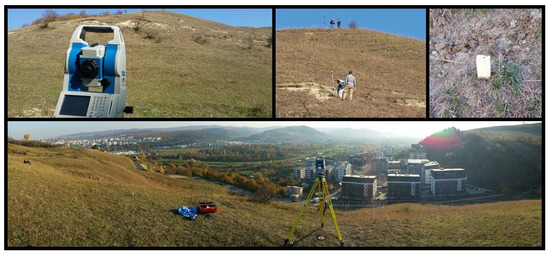
Figure 8.
Land survey stages.
After the materialization of the landmarks in the field, followed the stage of planimetric and altimetric measurements of their positioning, using the total station. The application of the topographic method of indirect measurements consisted in determining the coordinates of the landmarks (X, Y, Z), which were used to determine the possible displacements and deformations of the terrain, by comparisons and differences with measurements made in the second stage and the application of analytical relationships. The landmarks were numbered according to the alignment, for a better designation; each mark received a two-digit index, the first digit being the number of the alignment (1 to 8) and the second the position of the landmark within that alignment, 1 to 8, from top to bottom. Thus, the coordinates of the eight directional alignments were obtained, numbered from 11, 12, …, 88 (Figure 9).
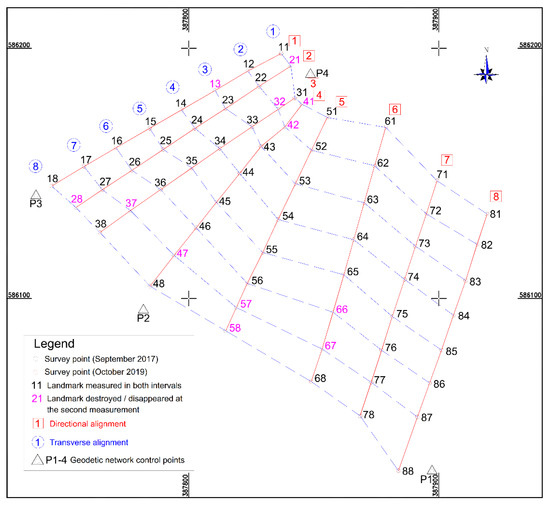
Figure 9.
Surveyed landmarks and landslide directional alignments.
The scientific approach has taken into account the fact that periodic observations are a very effective means of analyzing landslides. Therefore, the measurements performed in two distinct stages over time, aimed to record any displacements and deformations of the slope due to landslides. The model is useful because based on displacements and deformations, the evolution of the sliding process can be established, and the information is used in the elaboration of the sliding forecast.
The second stage of the measurements in the investigated area took place in October 2019, so that the time period from the initial measurement to the second was slightly longer than two years (25 months). As changes occurred in the field during the two years, the first operations in the second stage were to identify and stake-out the geodetic marks and monitored landmarks, but also to evaluate the number of missing or destroyed landmarks. Of the total 64 landmarks located in the researched area, during the two years between the first and last measurement, 12 disappeared or were destroyed. In the second stage of monitoring, the observations with the total station were repeated under the same conditions, in order to highlight the possible movements of the terrain, based on the comparison of the position of the landmarks between the first and the second survey.
2.6. UAV Implementation and Flight Metrics
Slope monitoring was performed by two methods: by geodetic-topographic measurements with GNSS instruments and total stations, and by digital processing of 3D models and DEMs obtained by UAV scans. The techniques used for UAV monitoring consisted of digital photogrammetry combined with mathematical processing of software and hardware in order to derive 3D information. The slope monitoring was obtained using aerial images acquired with a medium-cost semi-professional UAV system. The drone used was a DJI Phantom 4 Pro equipped with a 4K camera, manufactured by Da-Jiang Innovations Science and Technology Co. The drone is equipped with an active stabilizing camera cradle head in order to compensate for the UAV vibrations and the wind-induced tilt, and the 4K camera ensures sharp images [37,38]. The same model of UAV is very popular in numerous interdisciplinary researches as well as commercial or civil use. The popularity is due to overall affordable cost of the system, relative medium learning curve, very good compatibility with different mission planners and processing software, as well as the overall good accuracy of deliverables (3D models, DEMs, orthophotos) if used under optimal conditions and parameters [34,35].
Medium-cost UAVs and structure from motion (SfM) software is a popular method of obtaining impressive outputs with positive metric results, such as centimeter-level accuracy. Throughout complex and precise parameters, processing power, and software, based on projective geometry it converts the data extracted from the images into three-dimensional metric coordinates and colors. Given the present case study, difficult terrain conditions of the monitored slope associated with precise land surveying, this paper assesses the traditional monitoring of established techniques and instrumentation with the use of UAV that ensures accuracy and viability as an affordable and efficient method that accompanies traditional surveys for more comprehensive results [54,55,56,57,58,59].
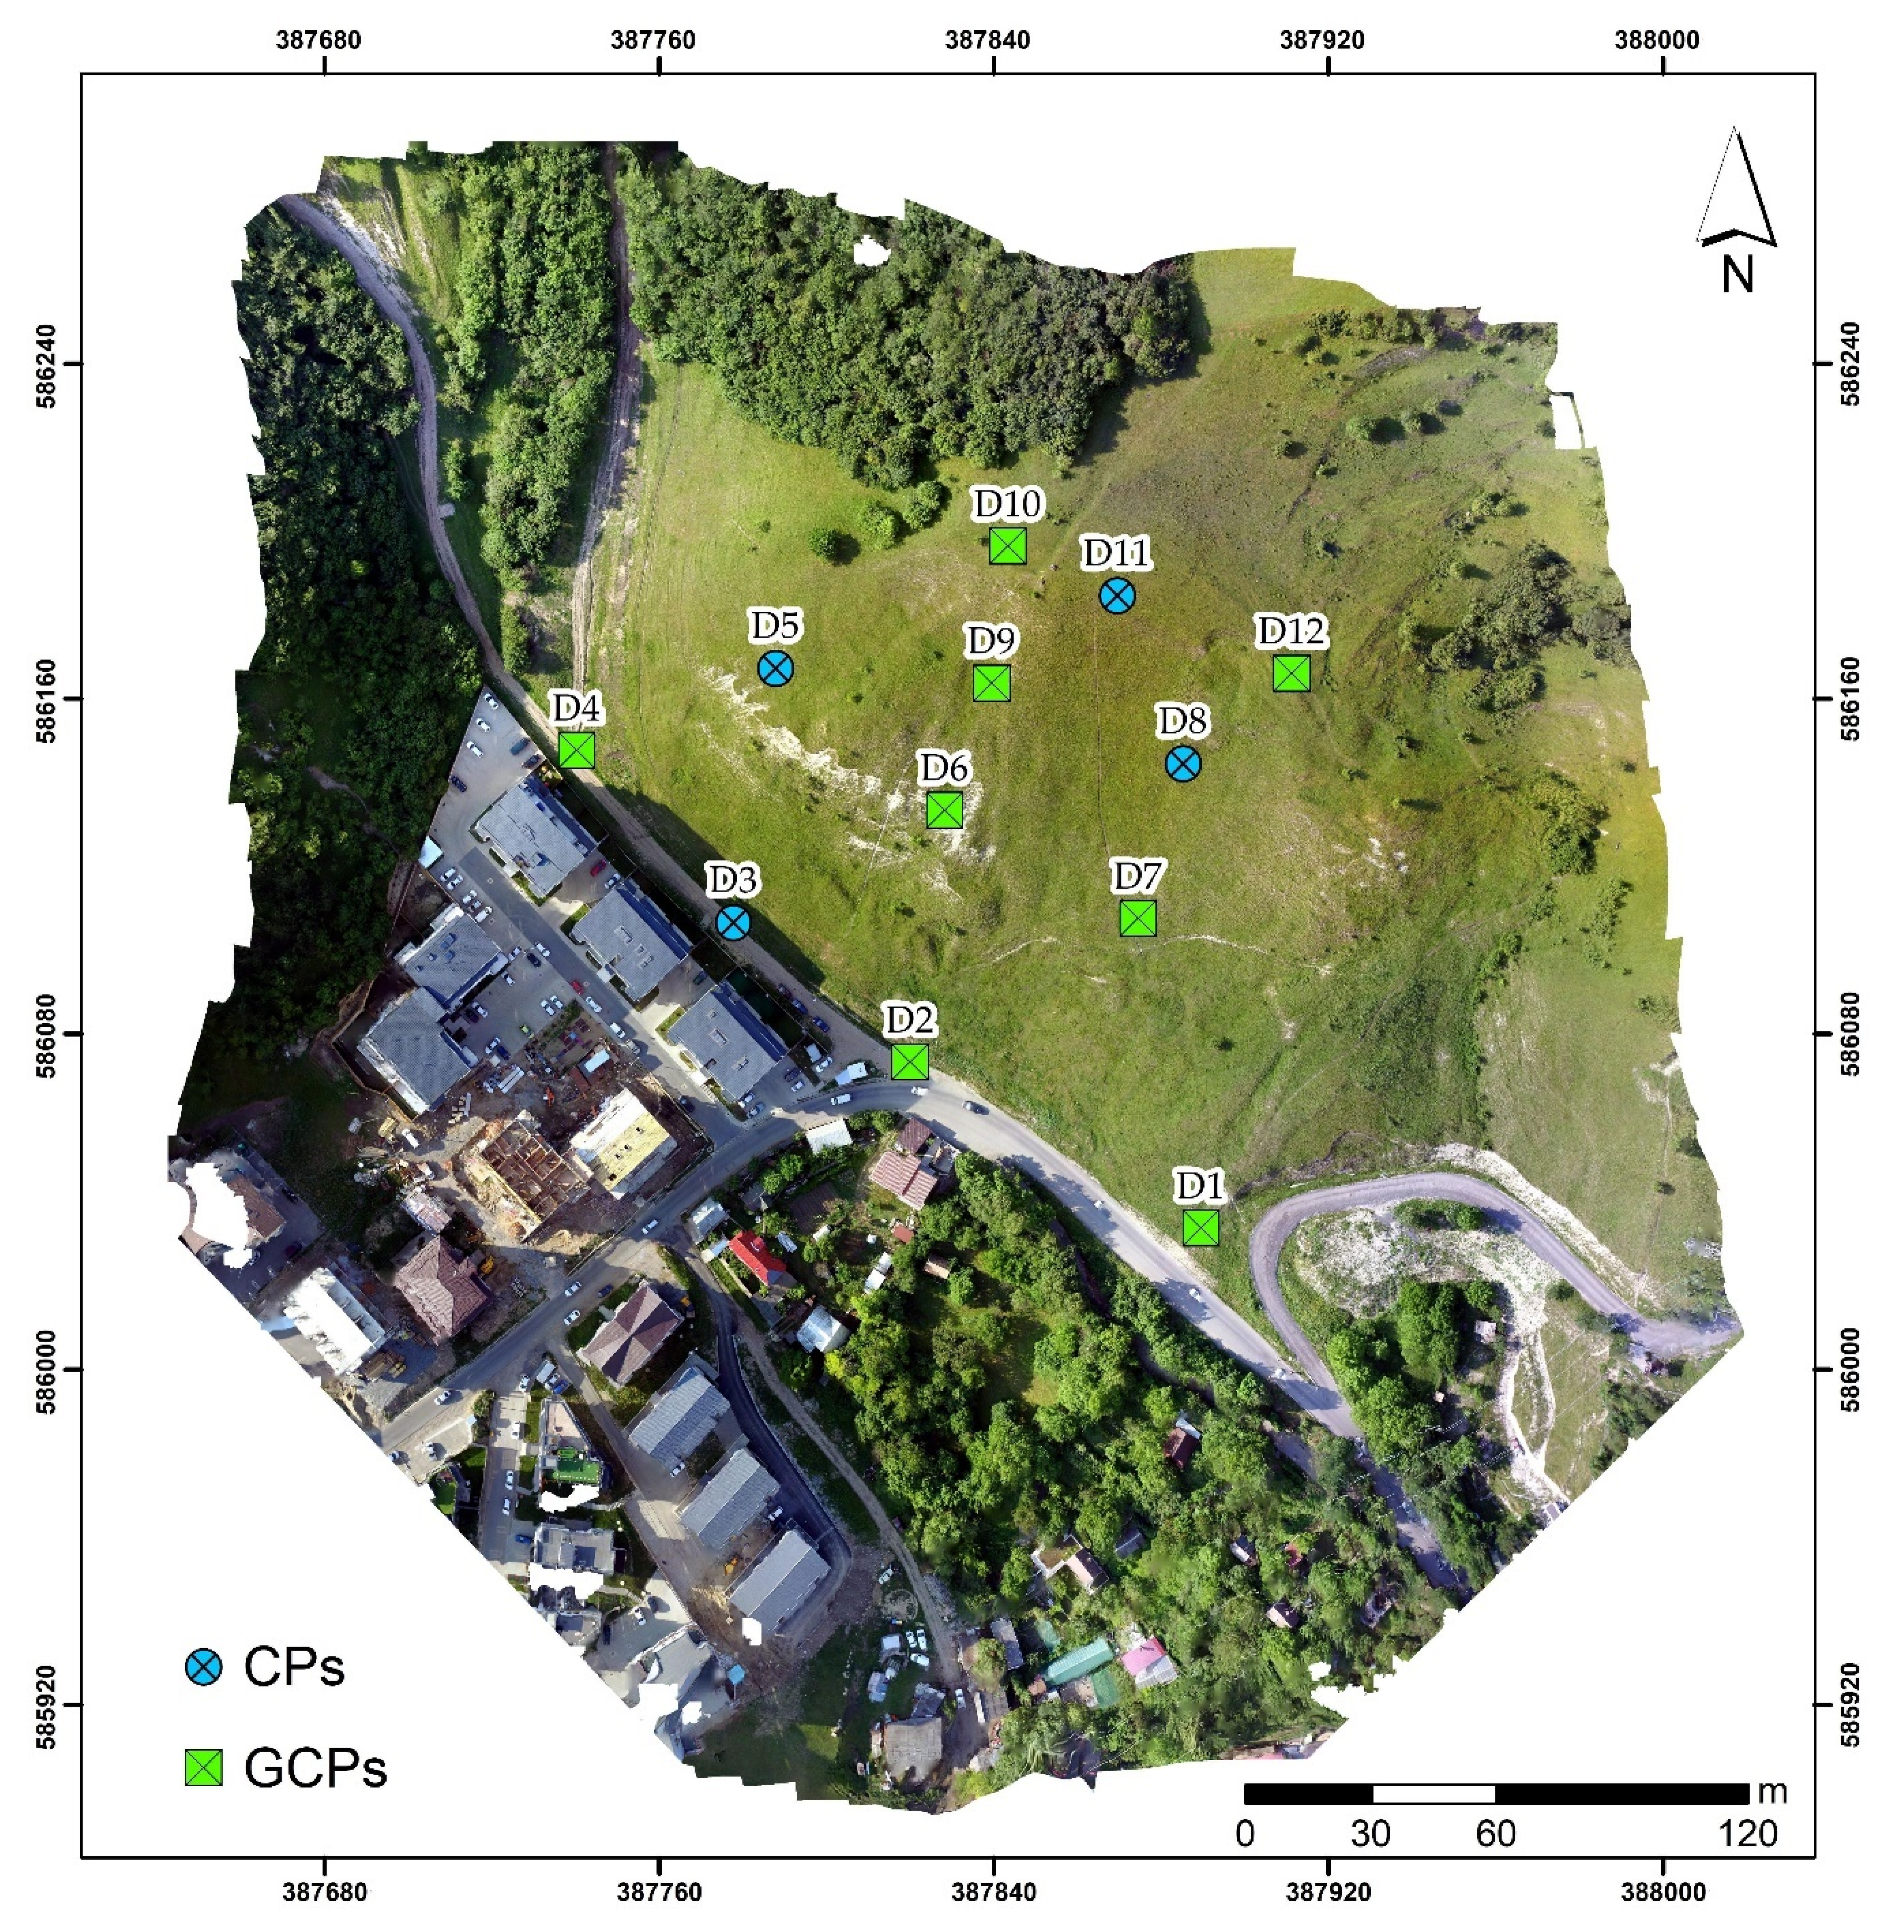
The UAV method combined with ground control points ensures a good accuracy, thus planimetric and altimetric positioning of GCPs were obtained with a Stonex S8plus GNSS in Real Time Kinematics (RTK) mode (Figure 10). This topographic and geodetic instrument measures the coordinates of the center of the GCPs with a horizontal precision of 0.014 m to 0.030 m and vertical precision of 0.020 m to 0.040 m at each point. The flight mission used was a specialized open-source application in order to obtain the desired flight parameters, as follows: mapping flight speed of 3 m/s, fly height ground level 40 m, image forward overlap 85%, image side overlap 85% and image overlap >9. A total of twelve GCPs distributed over the study area were used as ground reference during the georeferencing process. Additionally, GCPs must be spread across the terrain and slope area of the flight zone and is essential to cover both high and low elevations [60,61]. To evaluate the accuracy and precision of the final position in the created geometric model, the coordinates of the GCPs were referenced in the orthophoto images using Agisoft Metashape software. The deviations were calculated based on the cartesian directions northing, easting, and elevation. From the twelve total GCPs used, eight of them with the best distribution were used as GCPs in the georeferencing process, and the remaining four were used as check points (CPs). The results highlight that the calculated RMSE values were 0.021 m in the horizontal direction and 0.027 m in the vertical direction, which are acceptable results for georeferencing and sufficient for the majority of engineering projects. Also, the obtained ground resolution was ~1.08 cm/px. In order to establish the orthophoto and DEM, all suitable images were processed using Agisoft Metashape, in a customary workflow that includes image alignment, manual georeferencing, optimization procedure, sparse and dense point cloud generation, orthomosaic and DEM generation (Figure 11).

Figure 10.
Ground control points (GCPs) and CPs GNSS RTK measurement and unmanned aerial vehicles (UAV) mission preparations.
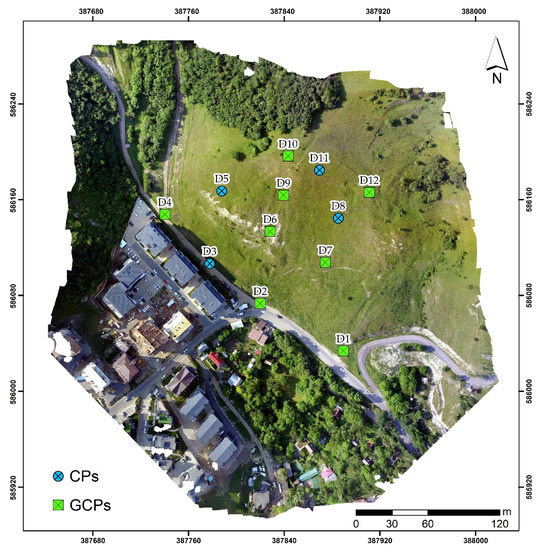
Figure 11.
Obtained orthophoto with GCPs and CPs positioning.
The presented UAV application was first implemented in 2017, concomitant with the traditional field survey, and was repeated with the 2019 stage of monitoring. In order to obtain accurate and analogous 3D models and DEMs between the two flight missions, the parameters used in the 2017 flight survey were reproduced in the 2019 mission, that includes: same mission planner and settings, same instrumentation and data processing, similar emplacement of GCPs, etc. The desideratum was to obtain eventual slope displacements caused by landslides by means of GIS spatial analysis using the two DEMs obtained over a period of two years.
3. Results
The results of the multiannual landslide monitoring research near the newly emerged residential neighborhood, west of Cluj-Napoca, have been extremely scientifically consistent. Both the topographic-geodetic measurements and the 3D UAV modeling confirmed the fact that the analyzed slope recorded surface movement by means of a shallow landslide. It represents a risk-generating factor induced on the local infrastructure and also on the near-by constructions over a longer period of time, if some measures of land improvements and slope stabilization are not considered and proposed. In the second stage of measurements, besides the observations on the positioned landmarks on the slope, the geodetic monitoring network was verified again using principles and techniques previously presented. Thus, by considering the control points P1 and P2 as fixed points, the displacement of P3 that is situated in a stabilized area was negligibly low, with dX −0.011 m and dY 0.010 m; the displacement of P4 that is situated at the top of the hill was predictably higher, with dX −0.053 m and dY −0.045 m.
Hills and slopes are often affected by landslides due to the simultaneous or prolonged action of several factors. Many landslides are slow and regular, and their triggering is generally favored by the presence of excess water in the soil and surface, the slope of the terrain and gravity. Regular field observations provide a very effective means of monitoring and assessing landslides. These observations aim to measure displacements and deformations following landslides, thus helping to establish the evolution and the elaboration of the displacement forecast. The scientific investigations carried out in the research, presented in the first part of the paper, highlighted the importance and usefulness of the analyzes regarding the risks of landslides.
3.1. Results and Discussions Following the Geodetic-Topographic Measurements
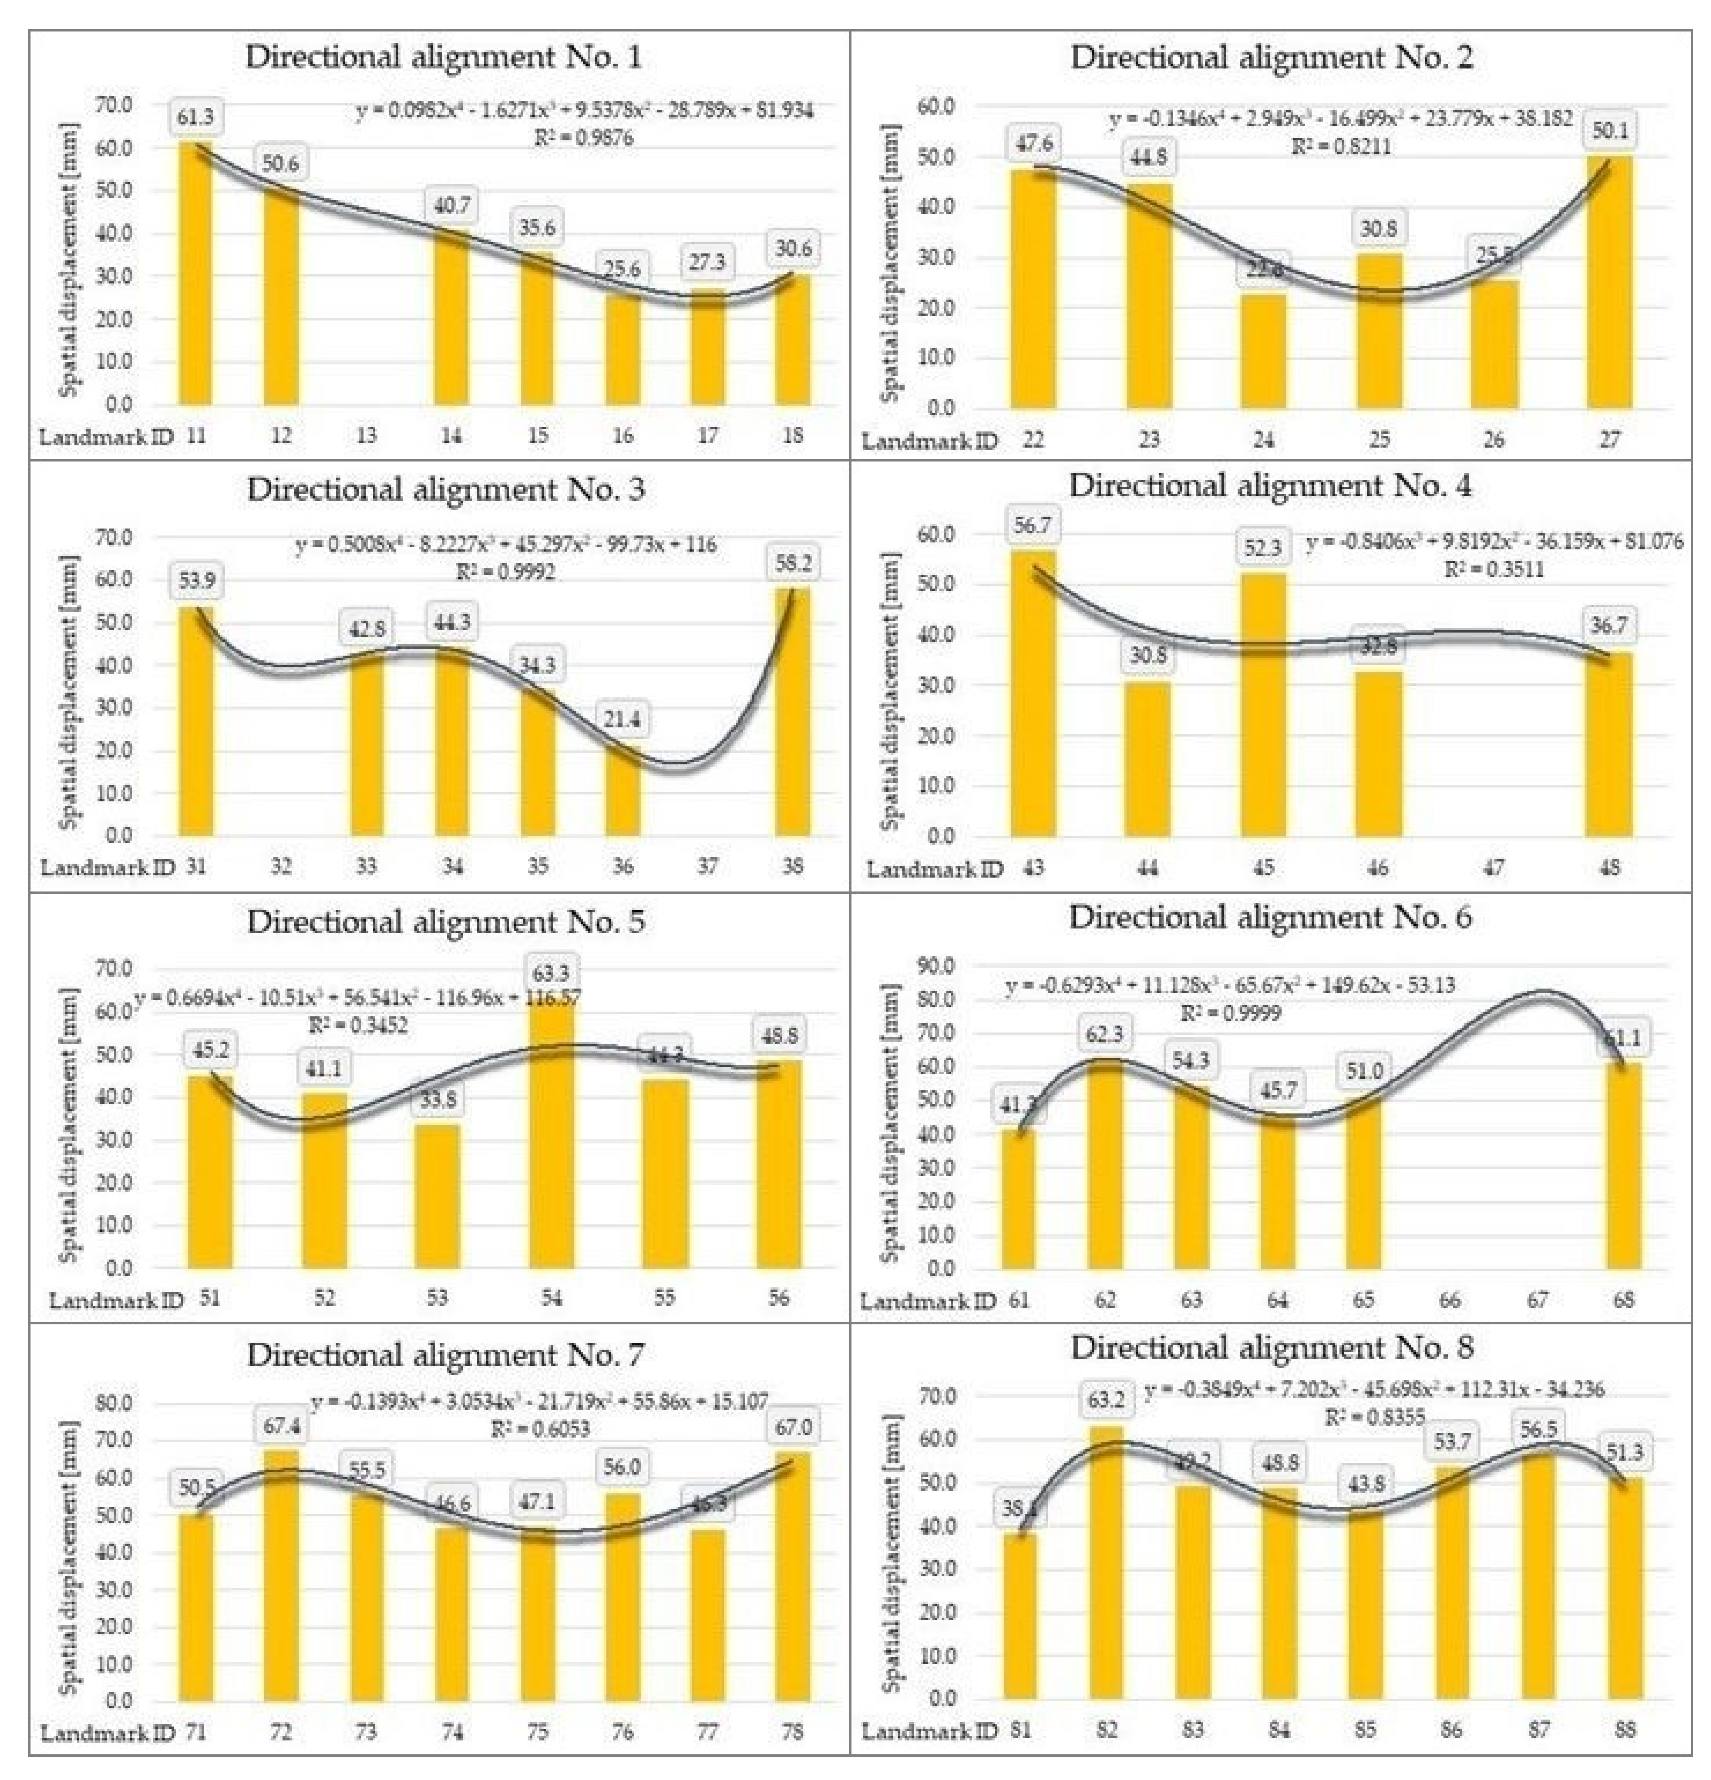
The data obtained from the observations of the two stages, respectively September 2017 and October 2019, located at an interval of just over two years (25 months), were processed and the results were represented graphically, through diagrams, to facilitate understanding the geomorphological phenomena that occurred on the analyzed area. The results obtained are presented for each directional alignment, with the values of landmark displacements calculated as linear displacement, obtained as a distance composed of dX, dY, dZ and expressed in millimeters (Figure 12). The alignments are shown in Figure 9.
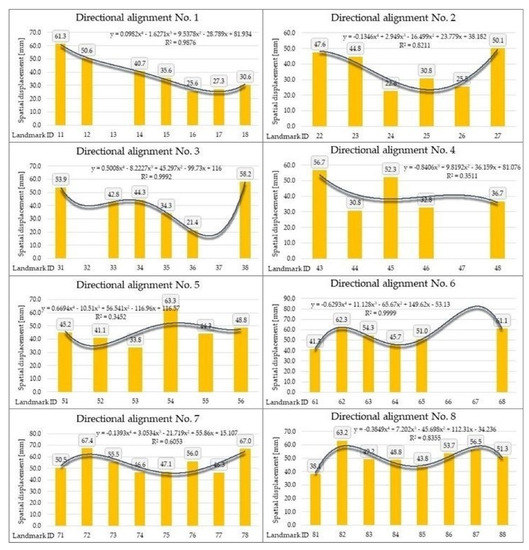
Figure 12.
Linear displacements of each surveyed landmark on the eight directional alignments.
The linear displacements on the directional alignments have the maximum values in the upper part of the slope, after which these values decrease toward the lower part, where they register a slight increase, due to the tendency of accumulation of the sliding mass. This fact was also found by visual observations on the ground, as at the bottom of the slope the landmarks had a discordant shape with the slope of the land, the stakes being oriented toward the hill, because of the accumulation of displaced land.
The value of the coefficient of determination calculated for the linear displacements of the points (landmarks) on the directional alignments means a good fit of the regression line with the data recorded by field measurements. With the proportion of the dependent variable, predictable from the independent variable, of almost 85%, the linear displacements on the directional alignments are influenced by the position of the landmarks. In case of alignments with disappeared or destroyed landmarks, this value is lower.
Following the analysis of the results regarding the eight alignments, it can be observed that the investigated slope is subjected to a shallow active landslide of a few centimeters per year. The displacement of the order of a few centimeters to 10 cm of the landmarks, corresponds to the phenomenon of surface landslide, most likely shallow, with a tendency to creep.
3.2. Results and Discussions Following the 3D UAV Modelling
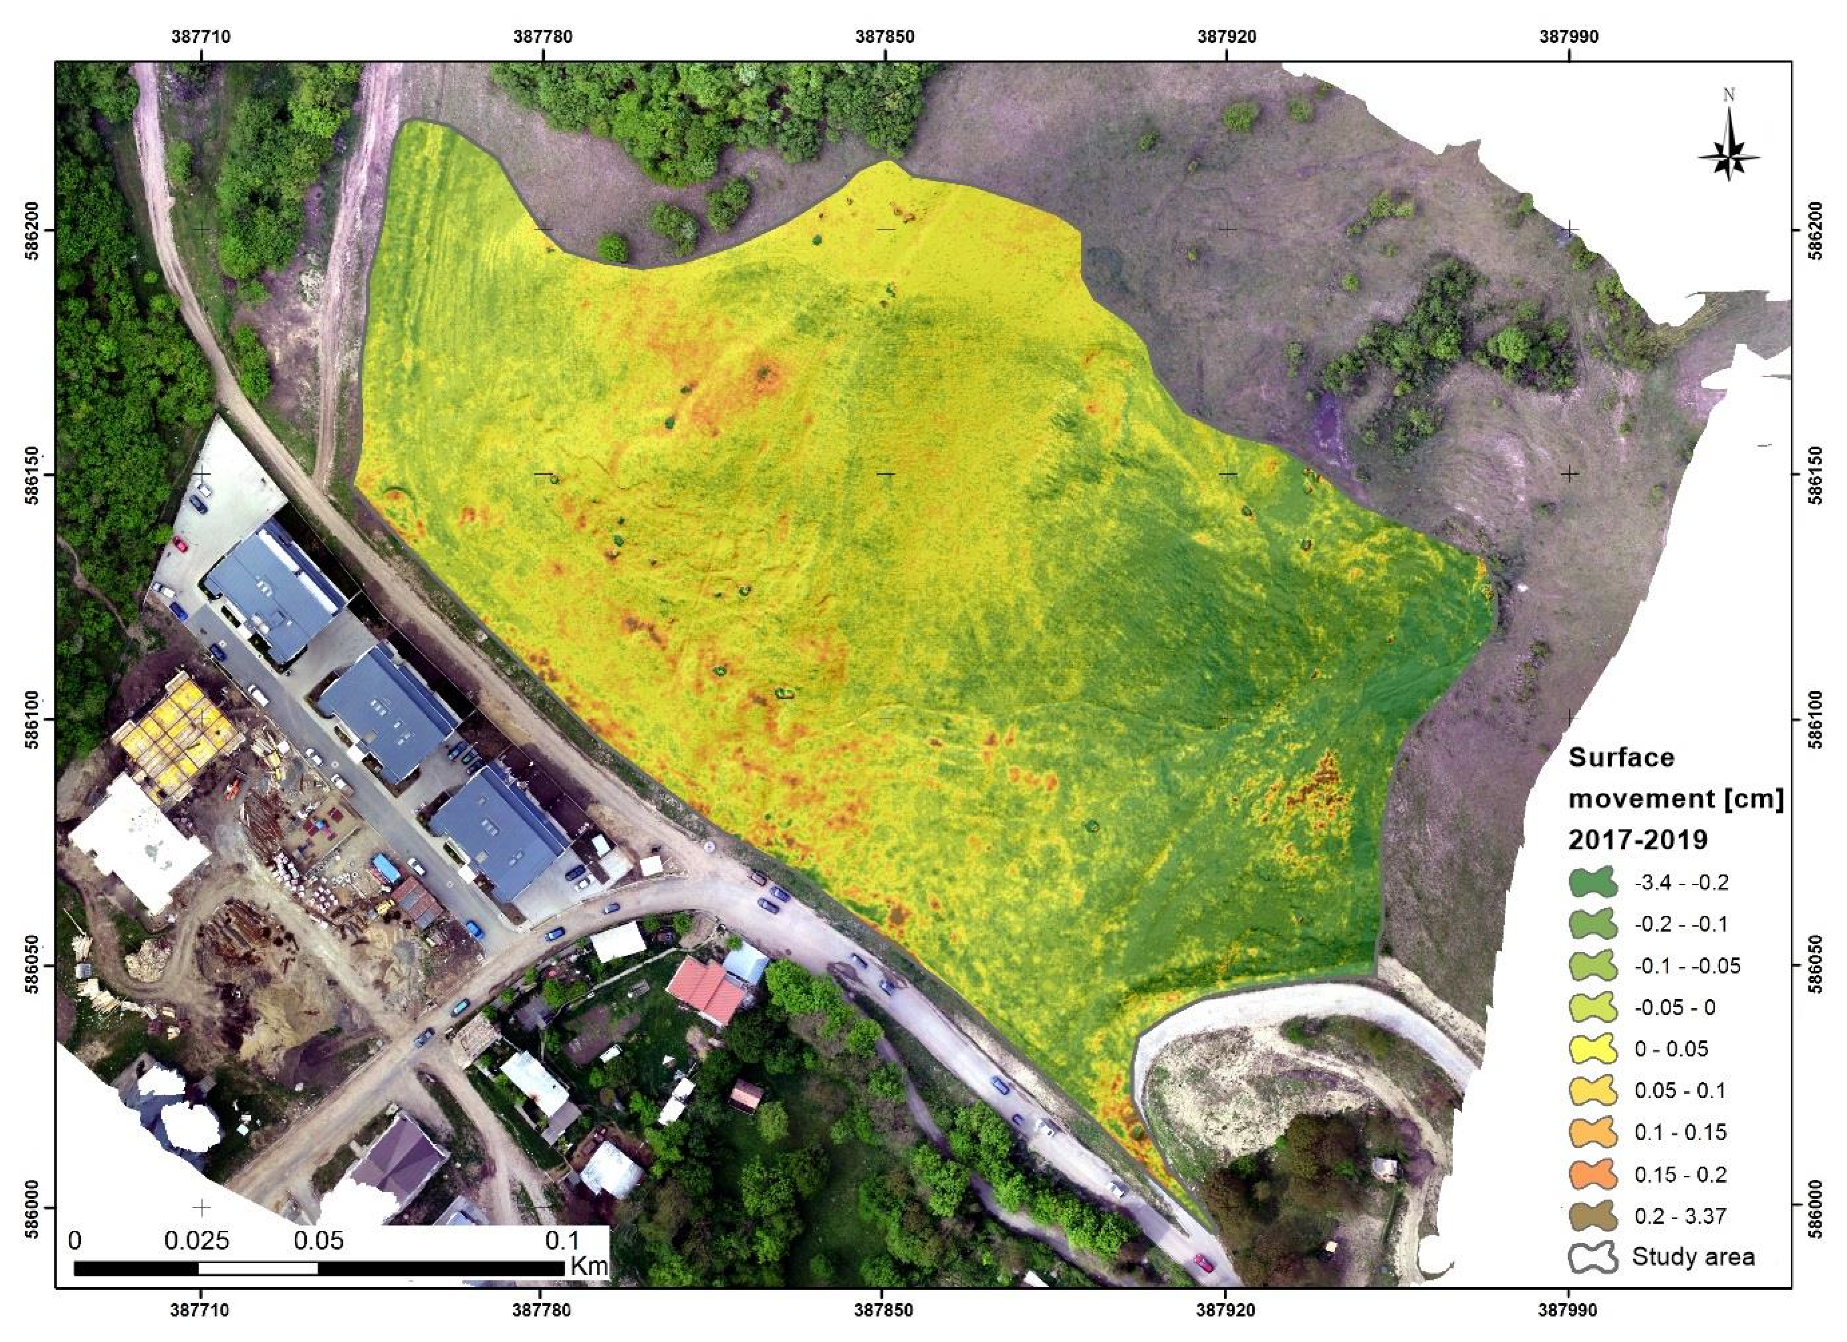
The evaluation of the exchange rate of the slope surface was analyzed based on the identification of surfaces with positive and negative deformations, as a result of the analysis of raster databases. These represented the digital surface models (DSMs), obtained as a result of UAV flights in the two mission surveys from 2017 and 2019. The software used to identify territorial changes is Geomorphic Change Detection (part of ArcMap 10.8 extensions).
The analysis of the obtained result, based on the operation of DSM geomorphic change detection from the two flights, showed a slight instability of the territory, identifying at the same time areas with low to moderate instability in the central-east and central-west part characterized mainly by shallow landslides and erosion, and more pronounced in the west, central, and south part where there was both instability in terms of erosion and accumulation of displaced material (Figure 13).
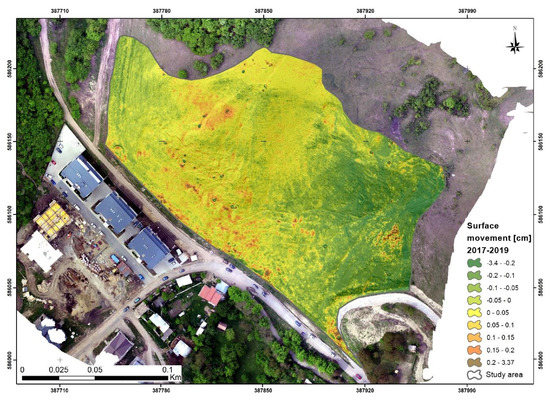
Figure 13.
Rate of surface movement between 2017 and 2019.
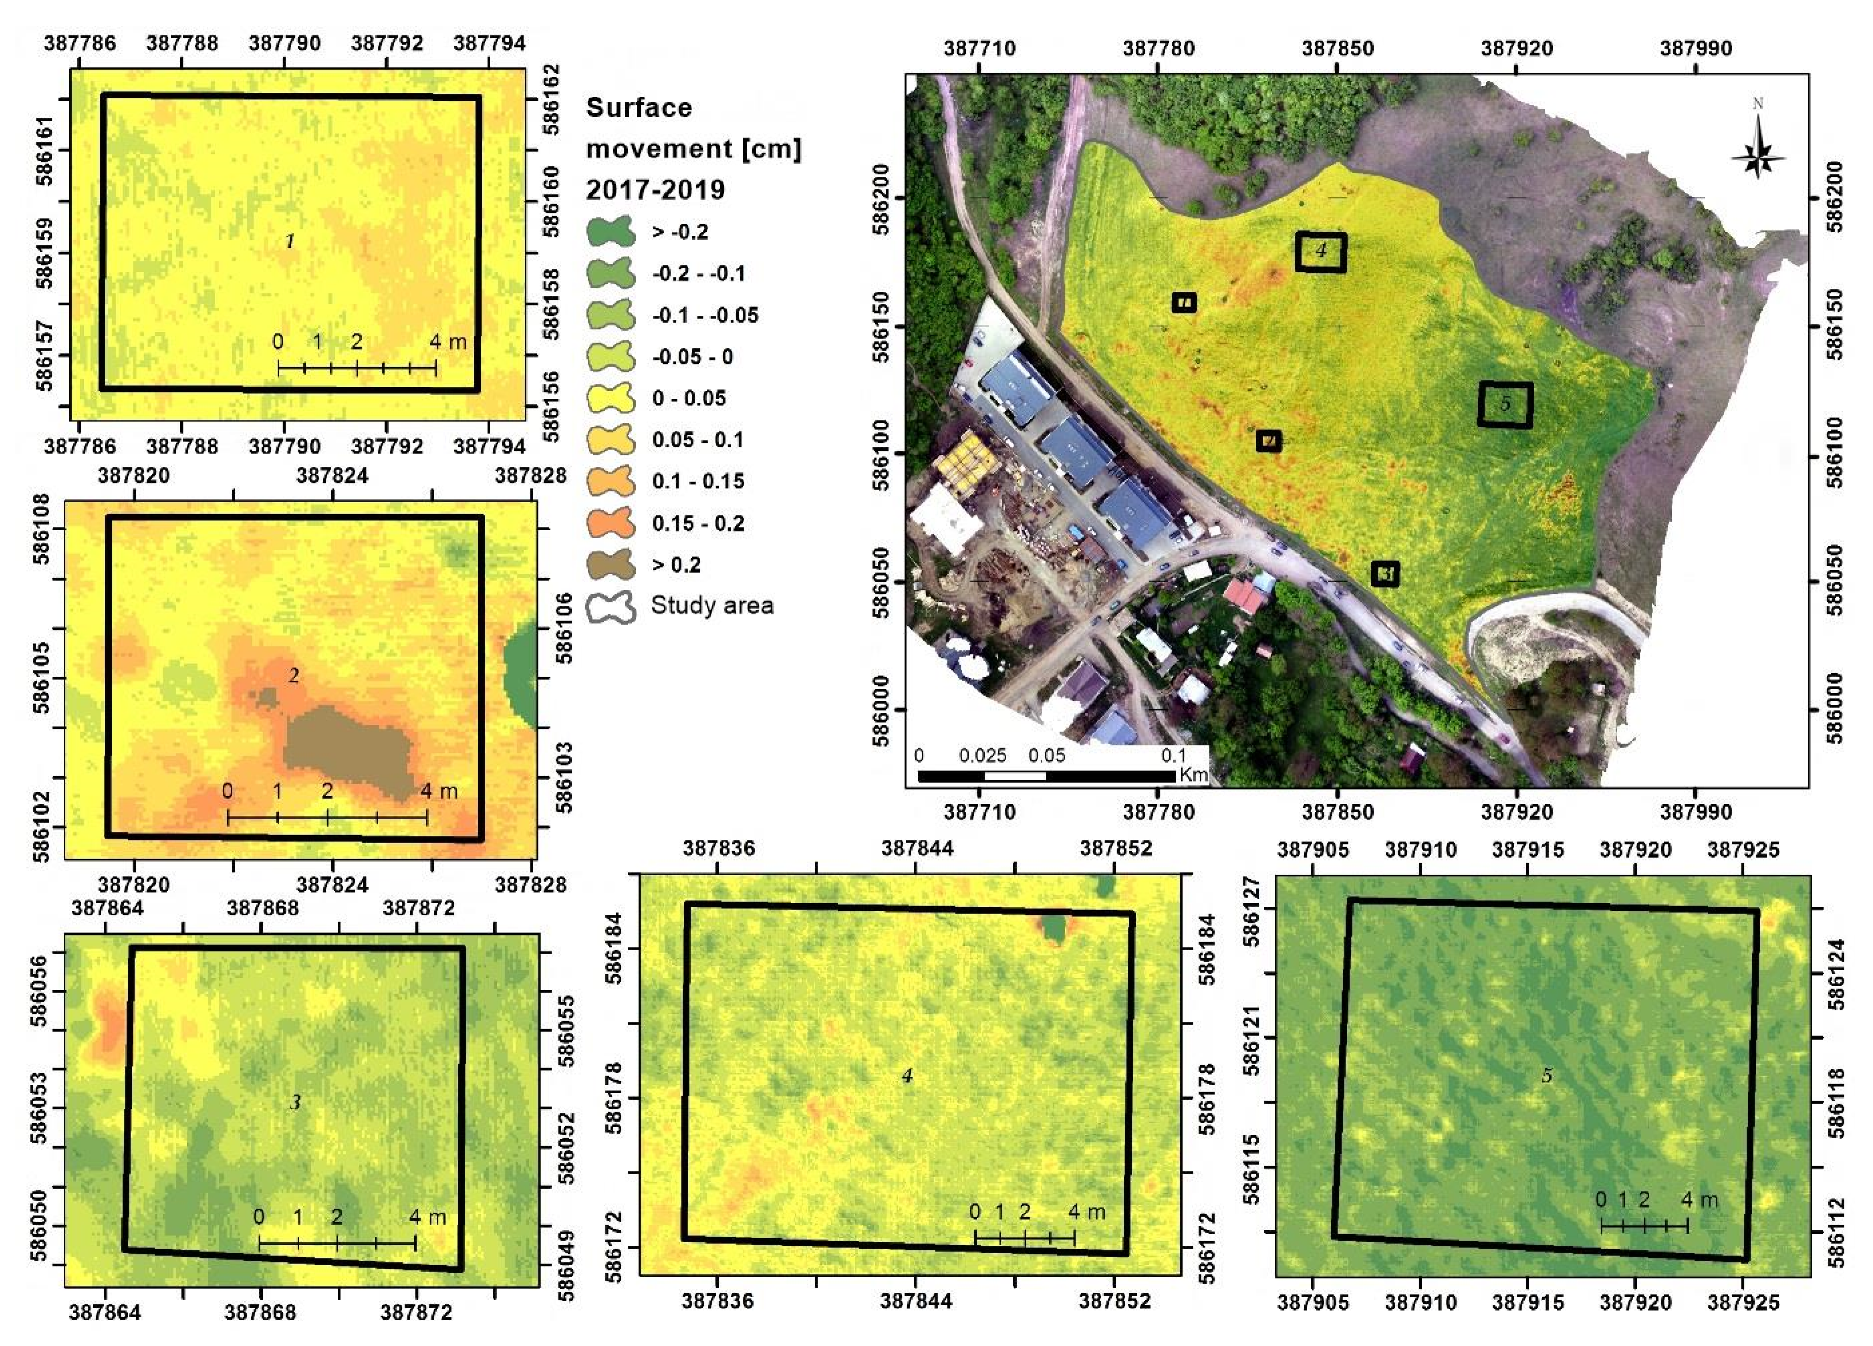
In order to highlight the dynamic character of the landslide, the analysis was performed in two main directions, as follows: (a) Analysis of the entire studied area, as vertically identified changes in the surface, which highlighted the existence of landslides and accumulation areas; and (b) the large-scale analysis of five plots (samples) of the territory, identified from measurements made on the surveyed landmarks, as representative areas in terms of the particularity of shallow landslides in the area (Figure 14).
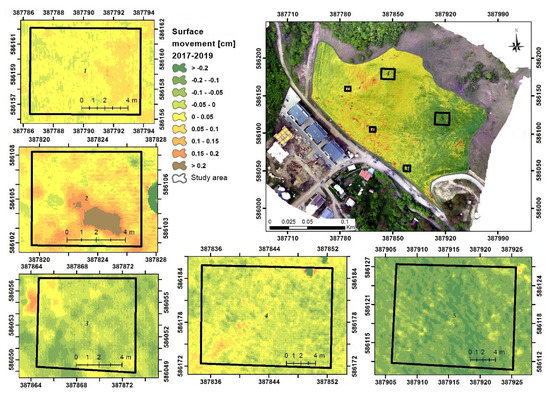
Figure 14.
Rate of surface movement with the five plots highlighted.
Regarding the analysis of the quantitative values of the surface changes identified as altitudinal variation of the terrain, the accentuated surface erosion is highlighted. The values regarding the volume of the material displaced on the investigated surface is of 107.2 m3 and the accumulated one of 55.7 m3. The dynamic character of the analyzed landslide is very well highlighted by comparing the accumulated volumes, calculated based on the areas identified as areas of erosion and accumulation. After comparing them, it is noticeable that the displaced volume is higher (by approx. 50%) than the accumulated volume, which illustrates the terrain displacement, and not only the surface erosion. The difference between the displaced volume and the accumulated volume is represented by the material detached by surface erosion and transported as suspended material through natural drainage channels, which in some places are shaped to be streams and gutters present on the slope. The transported solid material is stored in the gutter at the base of the landslide, observing very well the influence of the road embankment which acts as a stabilizing factor at the base of the hill.
Regarding the analysis of the exchange rate throughout the plots, there is a strong correlation between the result based on the GIS spatial analysis with UAV obtained databases, and the measurements performed directly in the field. Thus, it was analyzed the five plot cases identified spatially as the areas in the immediate vicinity of the field landmarks with the largest displacement on the X, Y, and Z axes. The analysis of the five plots highlights the instability by the amount of eroded and accumulated material in the immediate vicinity of monitored landmarks. In the case of plot number 1, there is increased erosion in the upper part and accumulation in the immediate vicinity. This process is also observed in plots 2 and 4, correlating with the field measurements of adjacent surveyed landmarks.
In the case of plots 3 and 5, there is very relevant erosion in the immediate vicinity of the monitored landmarks and the accumulation of eroded material at a greater distance from these points, which indicates a strongly accentuated dynamics, which can be correlated with the runoff direction of the slope. It also conforms to the direction of movement of the surveyed landmark points.
The analysis of the cause and the direction of movement was performed having as a basis of interpretation two defining factors regarding the evolution of the process: the slope and the direction of flow of the terrain. Both factors were analyzed independently, and a visible correlation was identified, with respect to the entire study area and in particular for each of the five previously chosen plots.
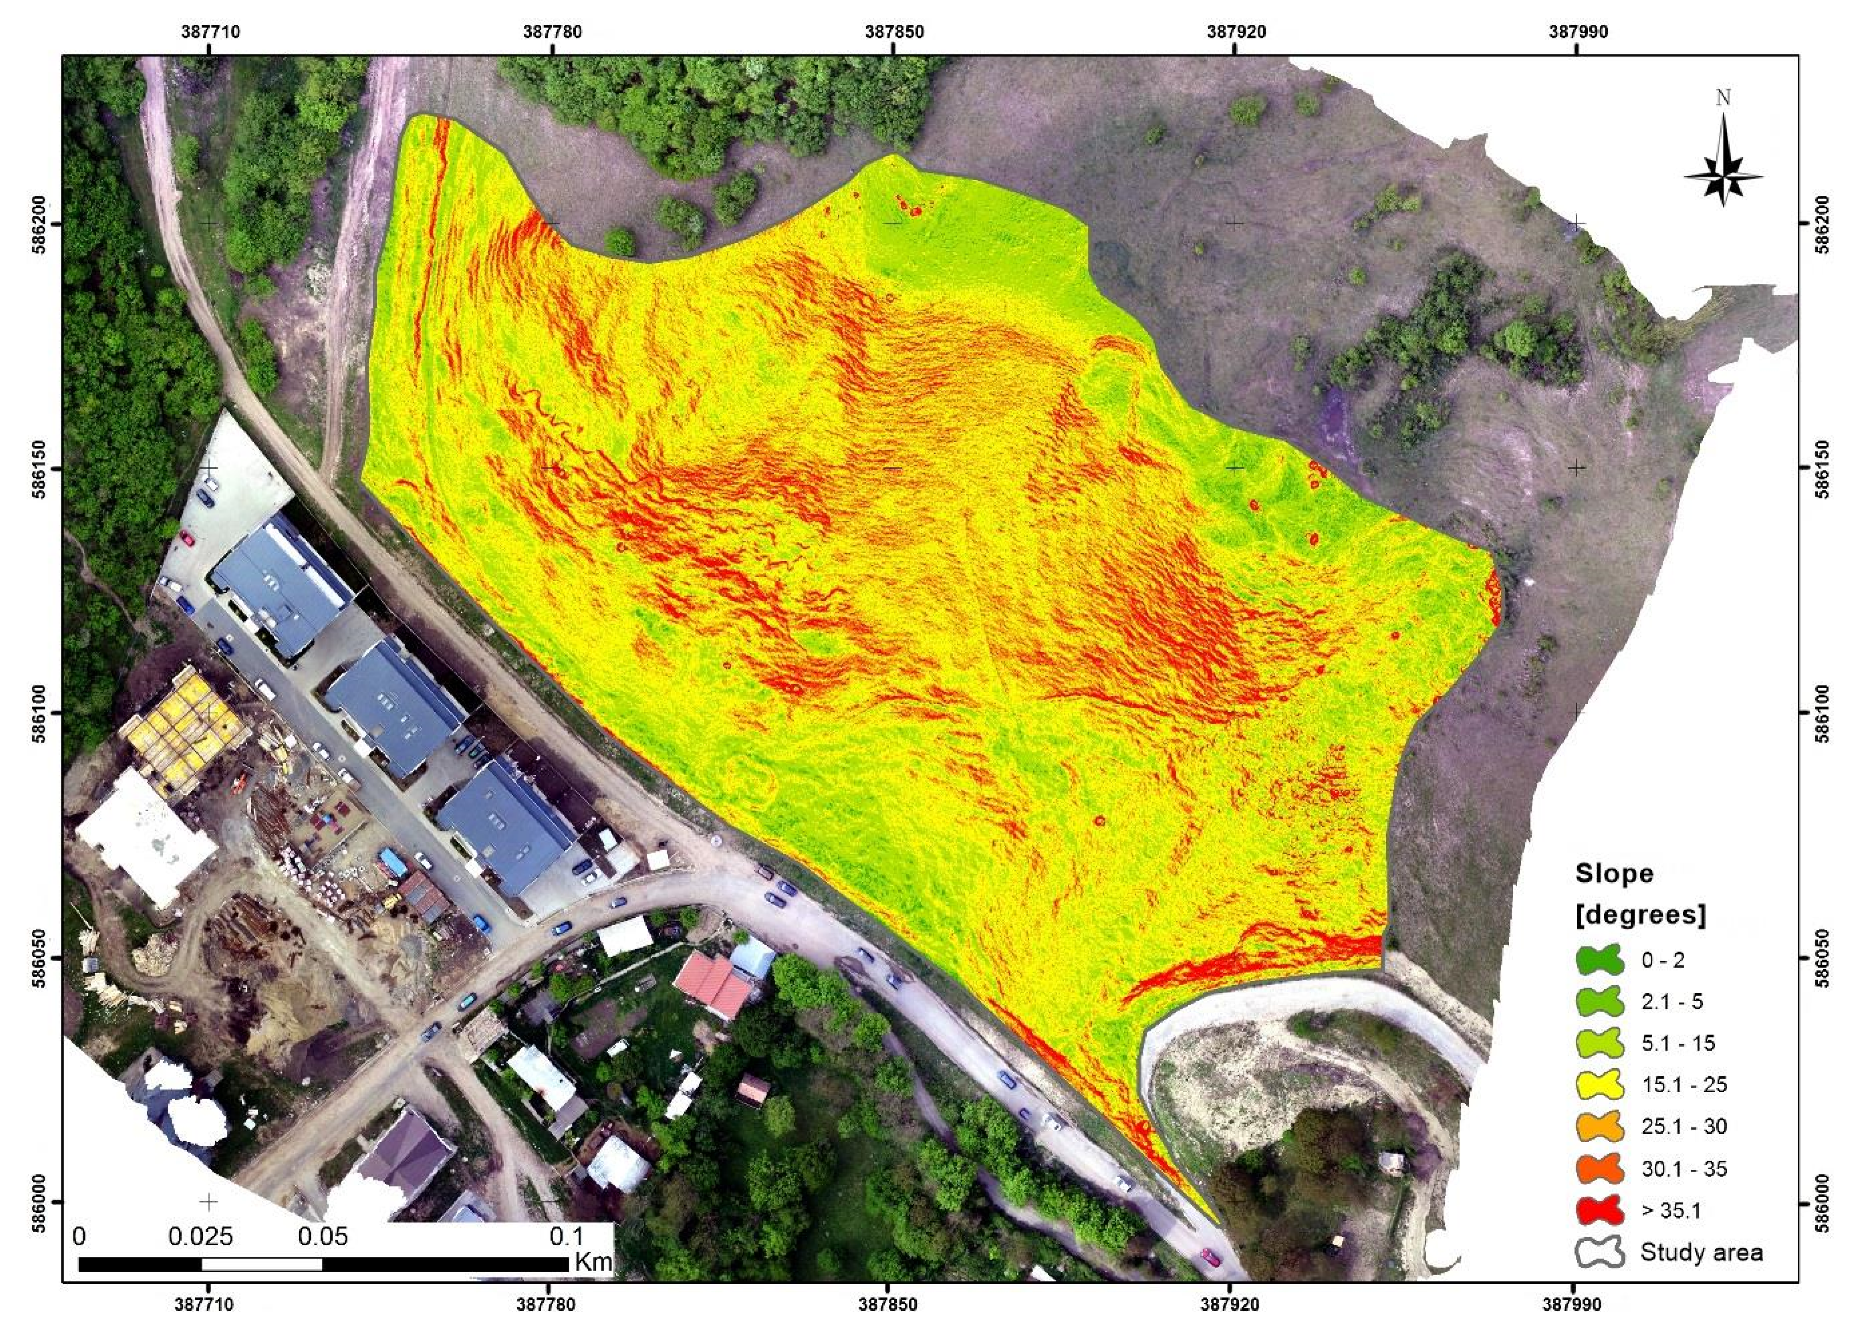
Because the slope is an important trigger factor of the landslide process, it was chosen as the basis of analysis to identify the direction of movement, depending on the general direction of the slope and with its value expressed in degrees. The percentage analysis performed for the entire study area, highlights very well the accentuated rugged character of the territory, the interval 15.1°–25.0° with a territorial area of 11,219.75 m2 representing approximately 42% of the total analyzed territory. The rugged character of the analyzed area is highlighted by the relatively large territorial extension of the slope intervals between 25.1°–30.0° and 30°–35.0°, which occupies a significant territorial extension, representing over 30% of the analyzed territory. The surfaces characterized by low slope, with high stability, between 0° and 15.0° have a small territorial extension at the level of the analyzed territory, of 23%. Areas with a very steep slope, over 35.0° were identified on a very small area of the total analyzed area, of 1374.75 m2, respectively approx. 5% of the total analyzed territory (Figure 15).
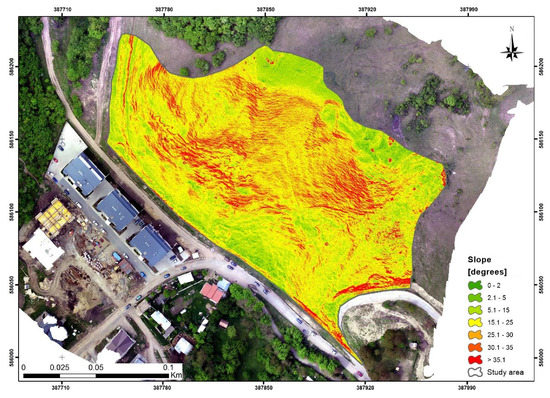
Figure 15.
Slope of the study area.
The general analysis of the surfaces with different degrees of land inclination highlights the predisposition of the analyzed land for the landslide process, considering the fact that most of the territory falls into the categories of high and very high slope, susceptible to landslides.
Very large slope categories, higher than 30.0°, are identified spatially in the central southern part of the analyzed landslide, where secondary, superficial landslides, in the form of creeps, develop on the main landslide body. These form small depressions behind them, which allow the accumulation of water from precipitation and its infiltration into the main sliding body, thus favoring the dynamics of the sliding process and also constituting as a secondary triggering factor.
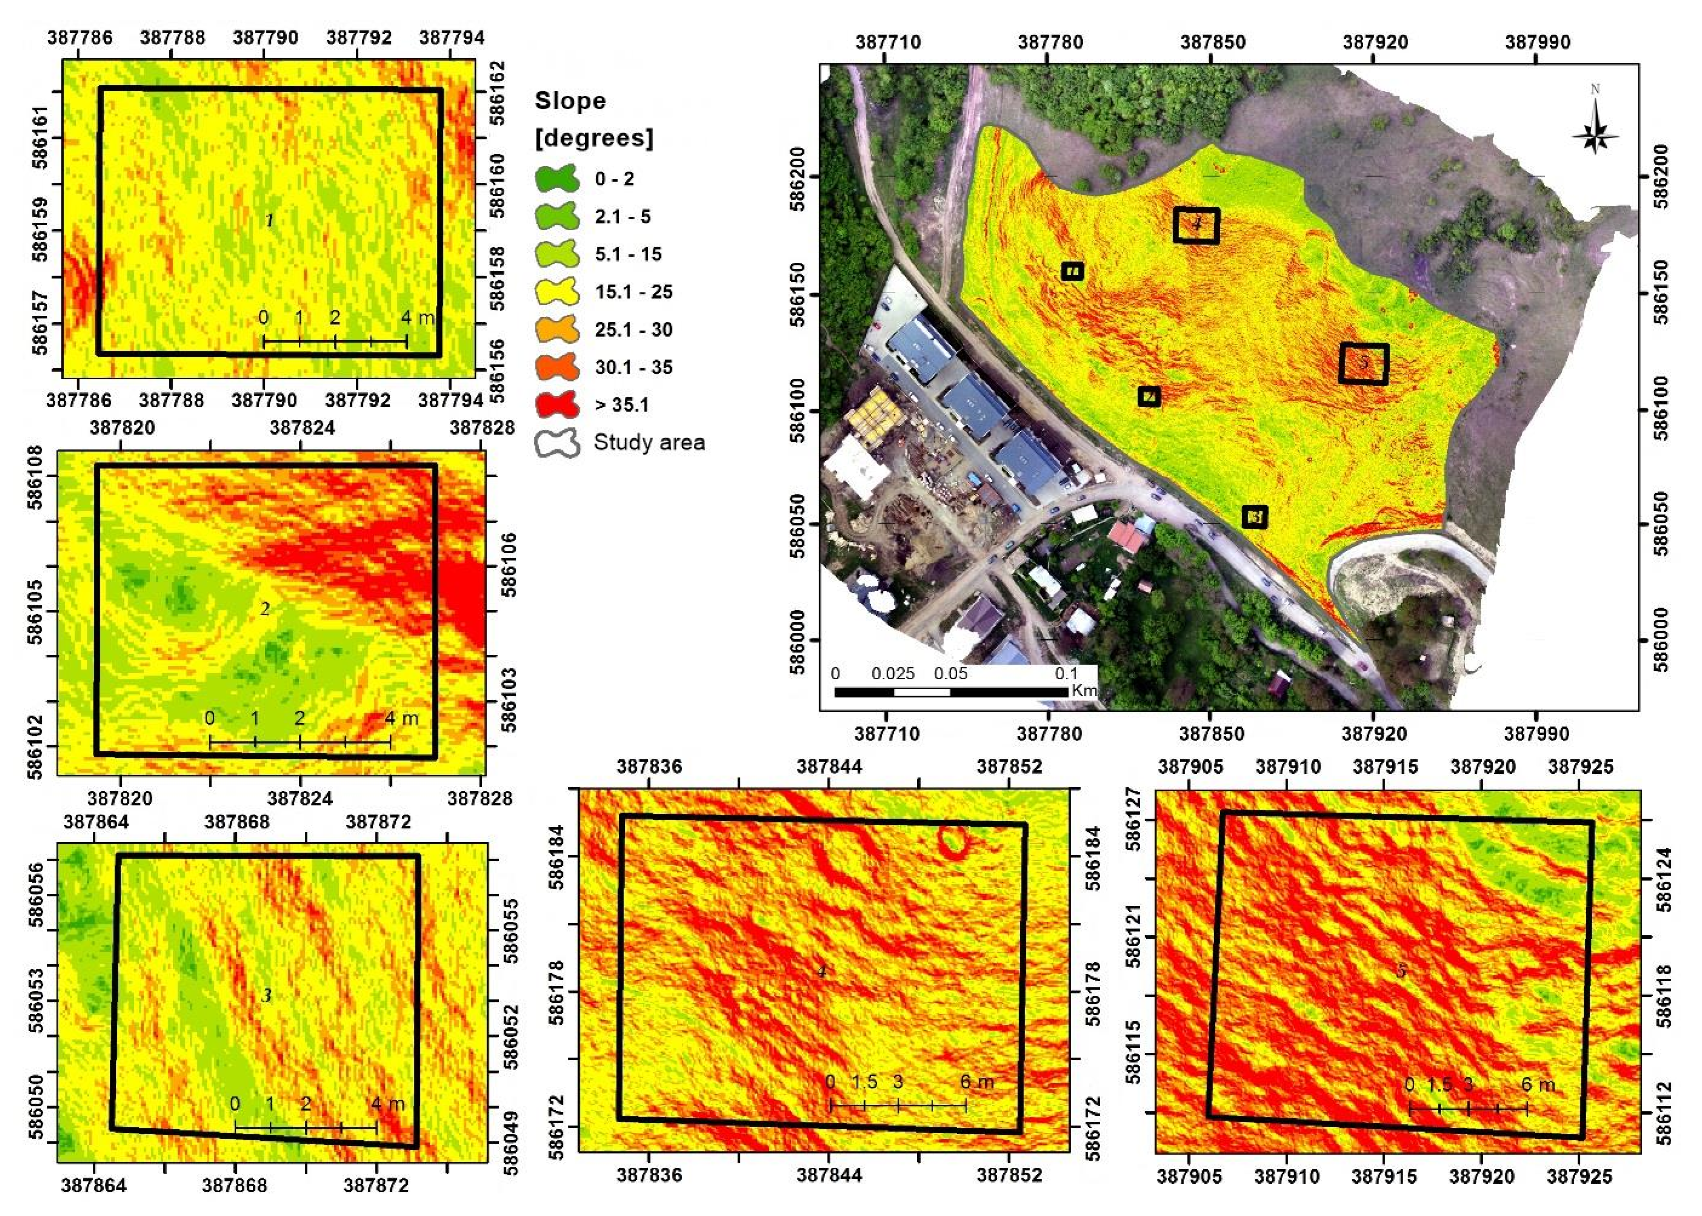
The analysis performed at the level of plots, highlights displacements conditioned by the inclination of the terrain in all five plots, noting in the cases of plots 4 and 5 (upper part of the hill) slopes in the large and very large range (25°–35.0°). For both plot number 1 and plot number 5, the slope directly influences the movement, also identified by the measurements from the two field surveys (2017 and 2019). For the other plots located on the plane of the slope, their movement is highlighted and corelated by the direction of the water flow on the slope (Figure 16).
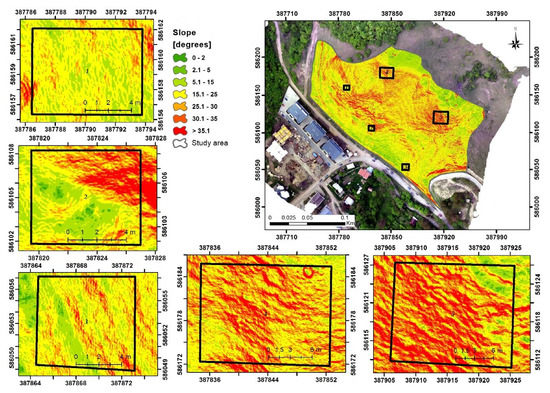
Figure 16.
Slope of the study area with the five plots highlighted.
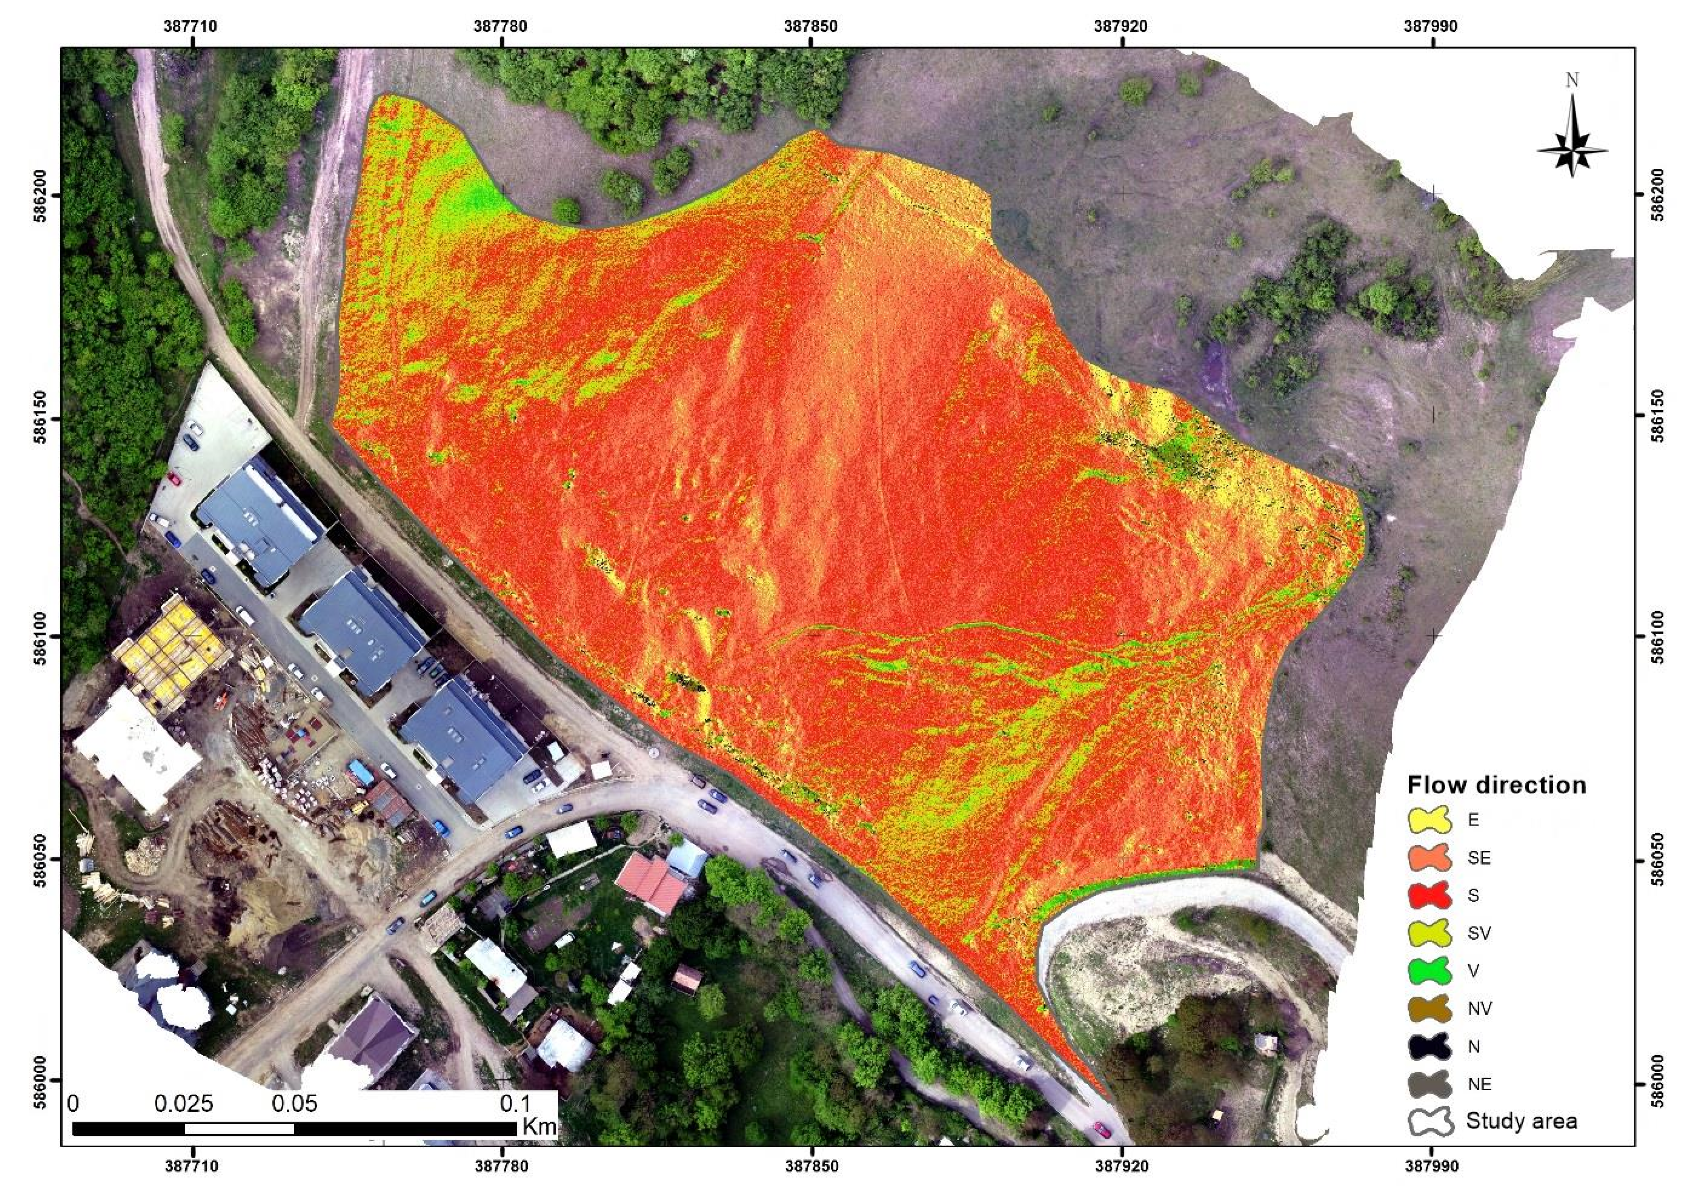
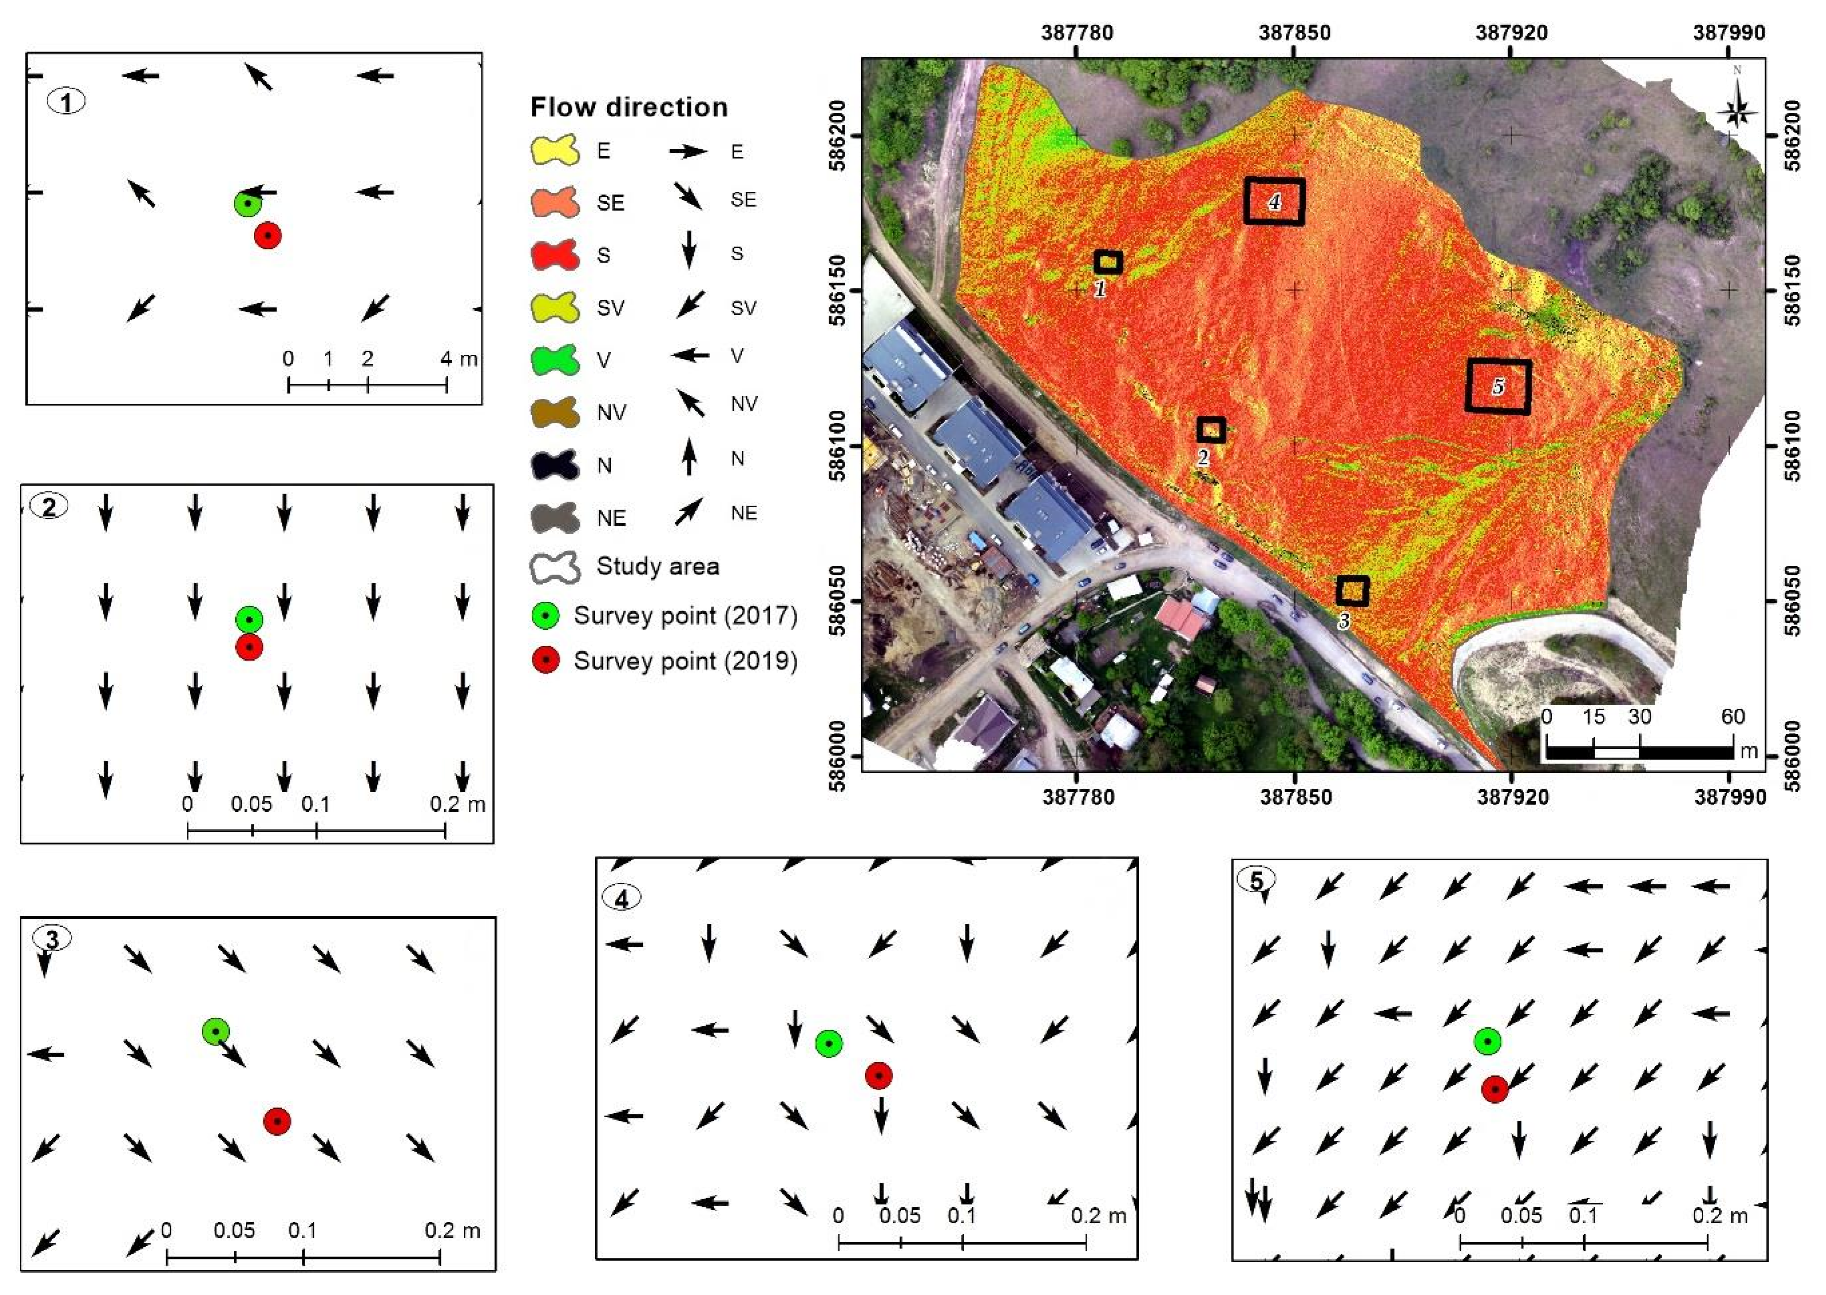
The direction of water flow on the terrain is an important factor for the analyzed process, which must be taken into account especially when analyzing the general direction of displacement. As in the case of the slope, the analysis of the direction of water flow was analyzed in relation to the entire study area and based on the five plots previously identified (Figure 17).
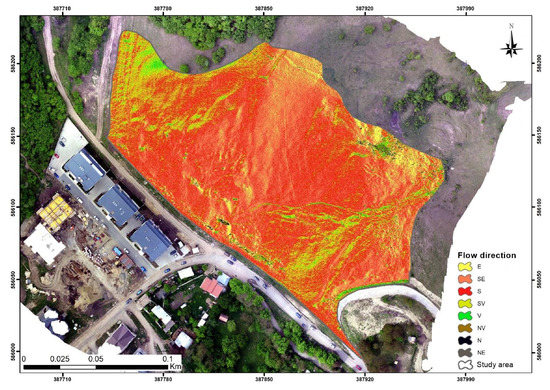
Figure 17.
Flow direction of the study area.
Regarding the areas identified with certain directions of water flow, the predominant general direction can be observed as oriented toward S-E and S, with a proportion of approximately 72% of the total analyzed area. The direction of the runoff on the body of the landslide is identified and correlated with the surfaces of medium slopes, which represent the ruptures of the high slope, behaving from a functional point of view similar to the gutters because of the deepening of streams formed during heavy rains due to the lack of vegetation on the monitored land (Figure 18).

Figure 18.
Flow direction of the study area with the five plots highlighted as well as field measured points/landmarks from the two surveys.
The comparative analysis based on the five plots highlights that the direction of displacement of the field surveyed landmarks is in accordance with the direction of water flow on the slope. Thus, we obtain a good correlation between the slope, the direction of water flow, and the displacement of the surveyed landmarks. The probability of future terrain movement remains mainly on the S-E or S direction.
The information obtained through the use of UAV implementation and the spatial analysis carried out contributed to the understanding of the complex processes that manifest in the studied area, exhaustively completing the data and information obtained through field observations, measurements, GIS risk maps, and data interpretations.
The results as a whole highlight the fact that the analyzed hill slope is in a relative dynamic stability, identifying a displacement mainly in the NW-SE direction, accompanied by soil erosion processes. These processes can be the triggering factors of violent landslides in the future, if the studied area continues to be influenced by anthropogenic factors and no measures on land improvement or slope stabilization are taken.
4. Discussion
As an overall perspective of the triggering factors in this study, the slope of the land can be included, with a slope of over 30°, relatively poor vegetation, as well as other factors, of which anthropogenic intervention has obviously become more pronounced [8,38]. The growing real estate interest in the area and the development of the new neighborhood, the beltway that has been heavily circulated in recent years, the continuous vibrations due to traffic, the heavy equipment used in the local development of buildings, etc., are the main elements of anthropogenic intervention with unfavorable consequences on land stability [43,62,63,64,65]. To these can be added factors related to the exploitation of the land from an agricultural point of view, the grazing of the sheep contributing to the drastic restriction of the shrubby and even grassy vegetation that increase the risk of soil erosion [63,66].
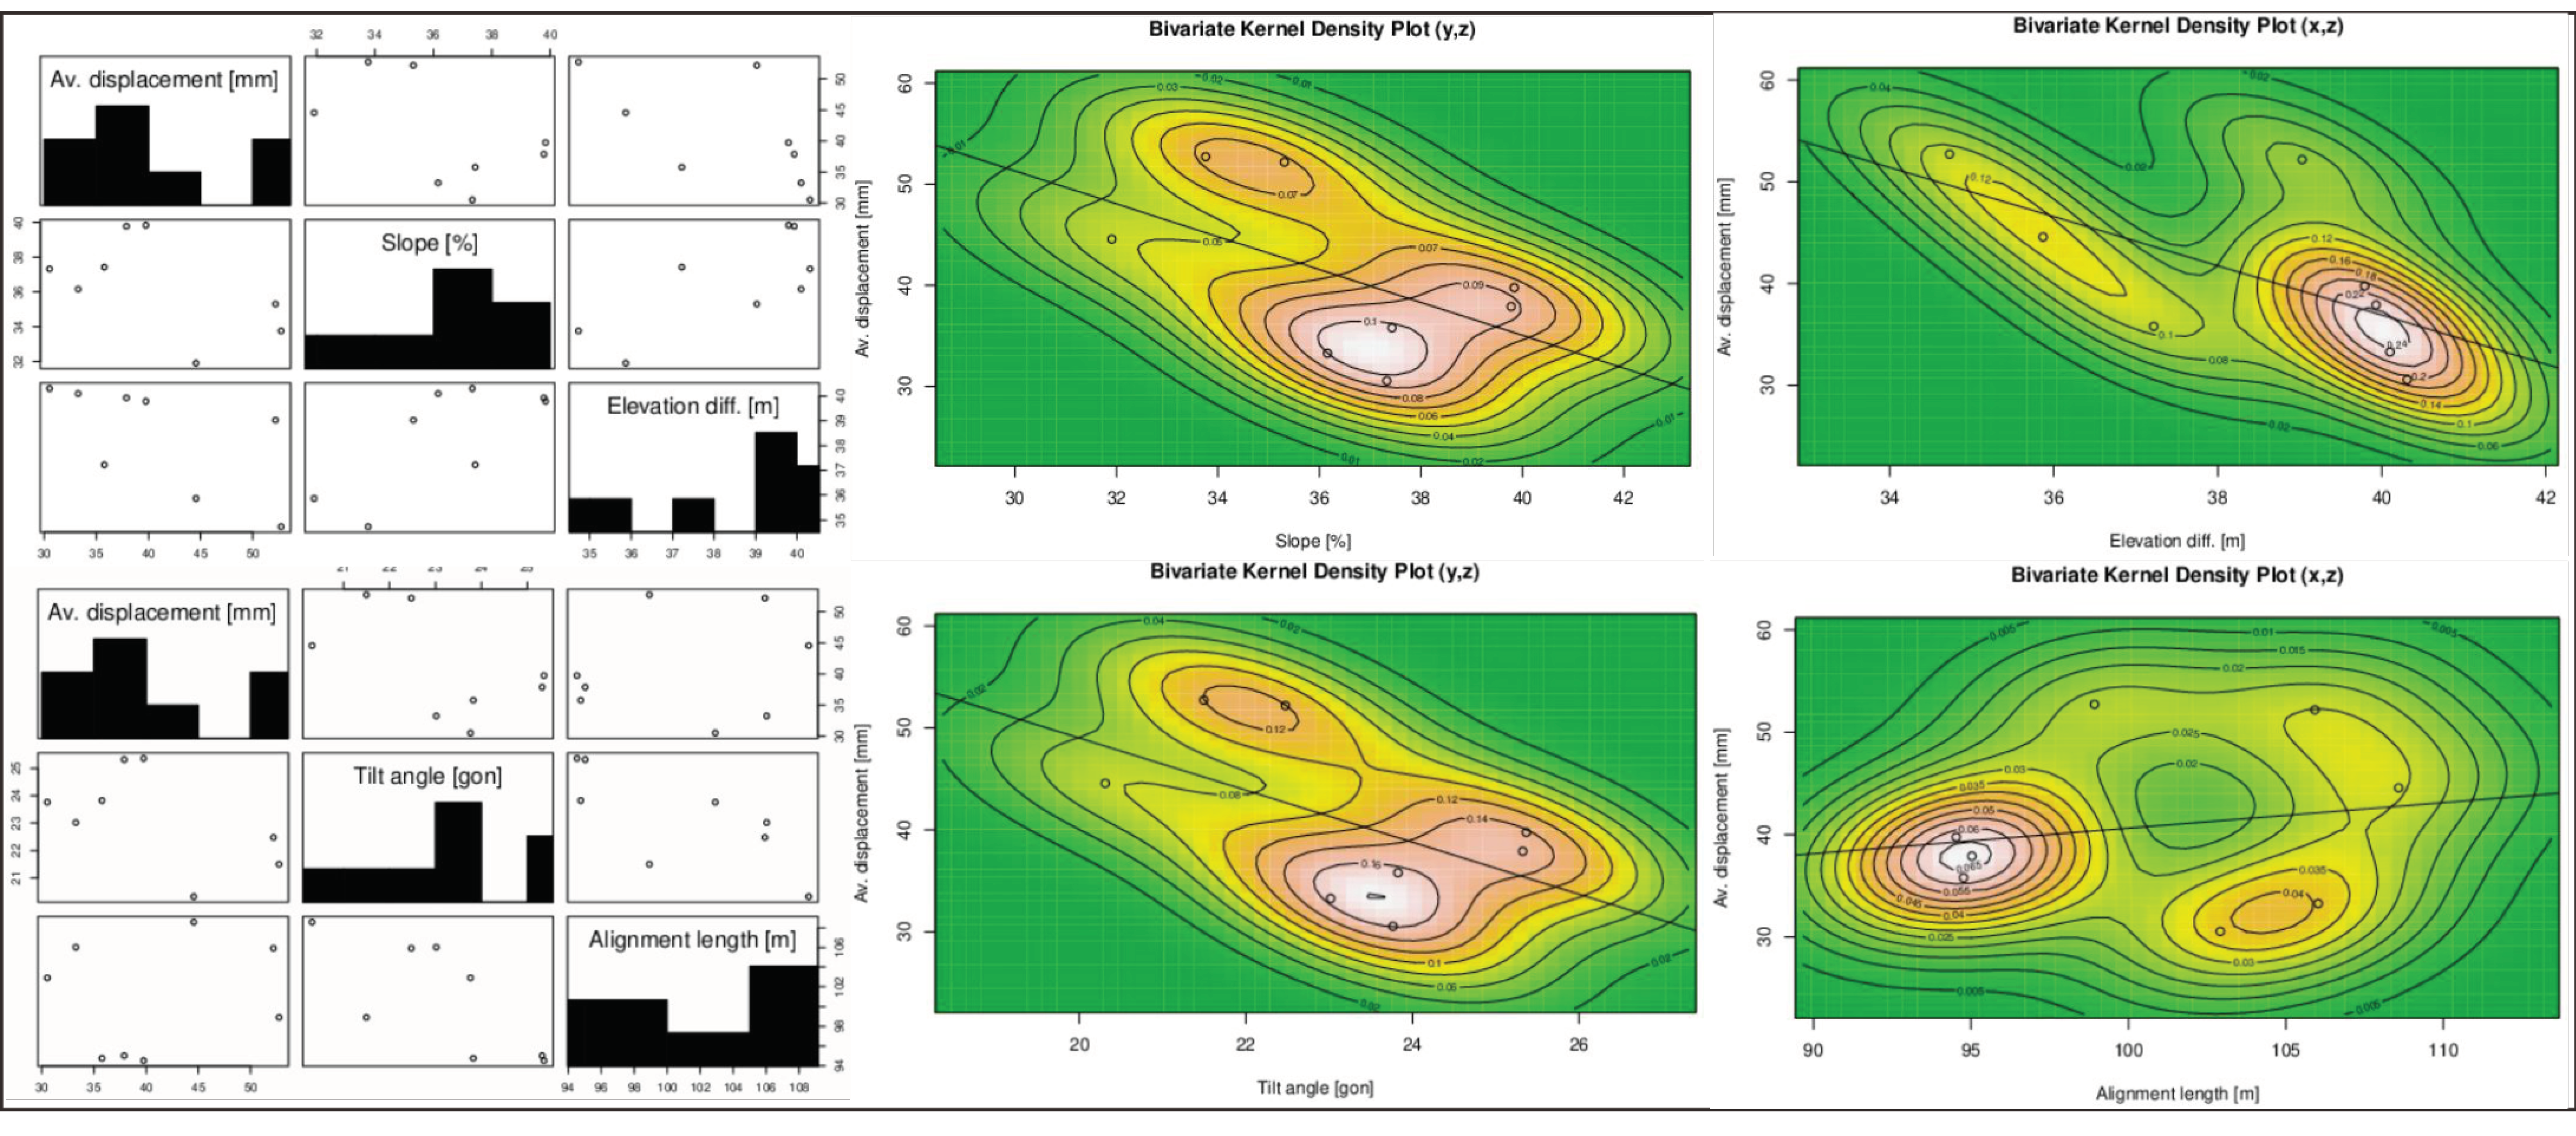
The data in table allow the analysis of the parameter values on each alignment, respectively the elevation difference, alignment length, tilt angle, the slope expressed in percentage, and the average displacement. Although directional alignments 4 and 5 have the steepest slope and should intuitively present the highest displacement values, the actual data differ from the expected (Table 2). In histograms and bivariate density plots (Wessa, 2020) [67] presented in Figure 19, it can be observed that between average displacement and the analyzed parameters (the slope, elevation difference and tilt angle) there is an inverse relation. Bivariate Kernel density plots suggestively illustrates not only the decreasing line of the relationship between the surface displacement and the parameters, but also where the concentration and dispersion of the points are placed.

Table 2.
Alignment parameters.
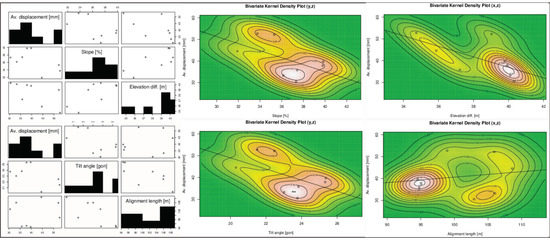
Figure 19.
Bivariate Kernel density plots illustrating low correlation between the average displacement and the alignment parameters.
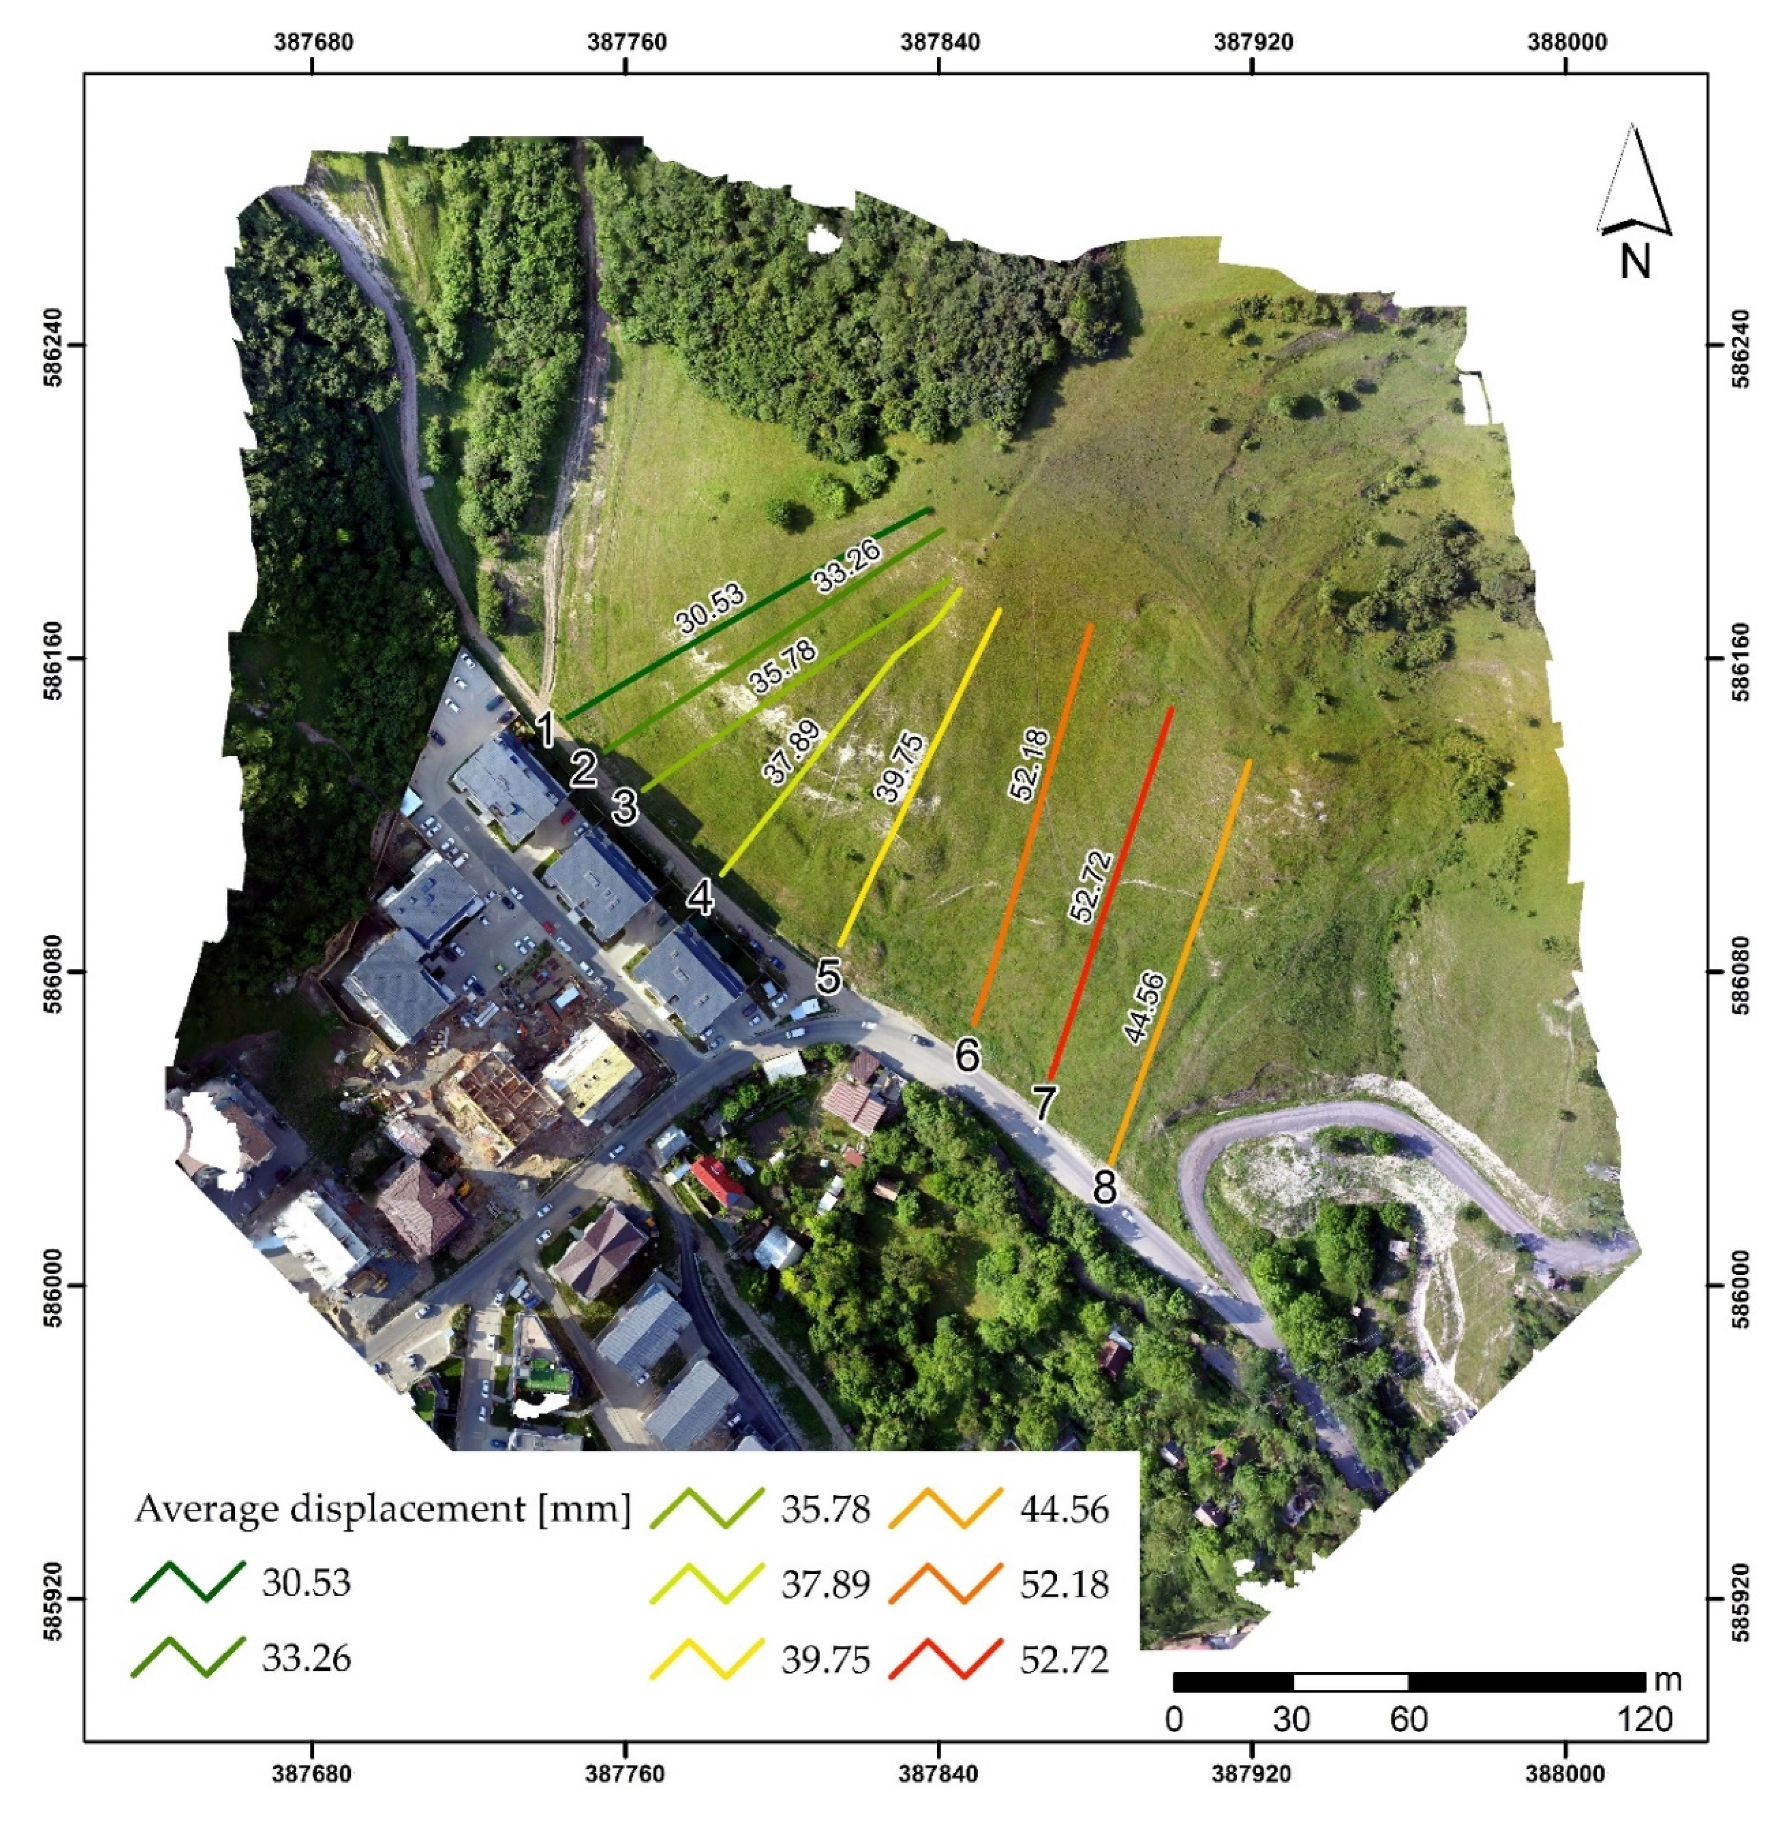
Higher values of these parameters can be found on alignments 6 and 7, because most of the time the main triggering factor contributing to the slope displacement is the accumulation of water on the surface and underground (Figure 20). On a hilly terrain, such as the monitored slope, the presence of water from heavy or long-lasting rainfall proves to be the main causative factor, with shallow landslides and erosion being produced as the soil layer is thin and the slope relatively high.
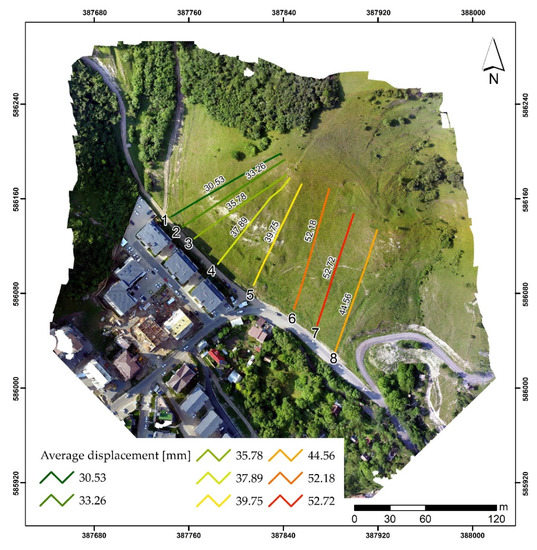
Figure 20.
Surveyed alignments with average displacement highlighted.
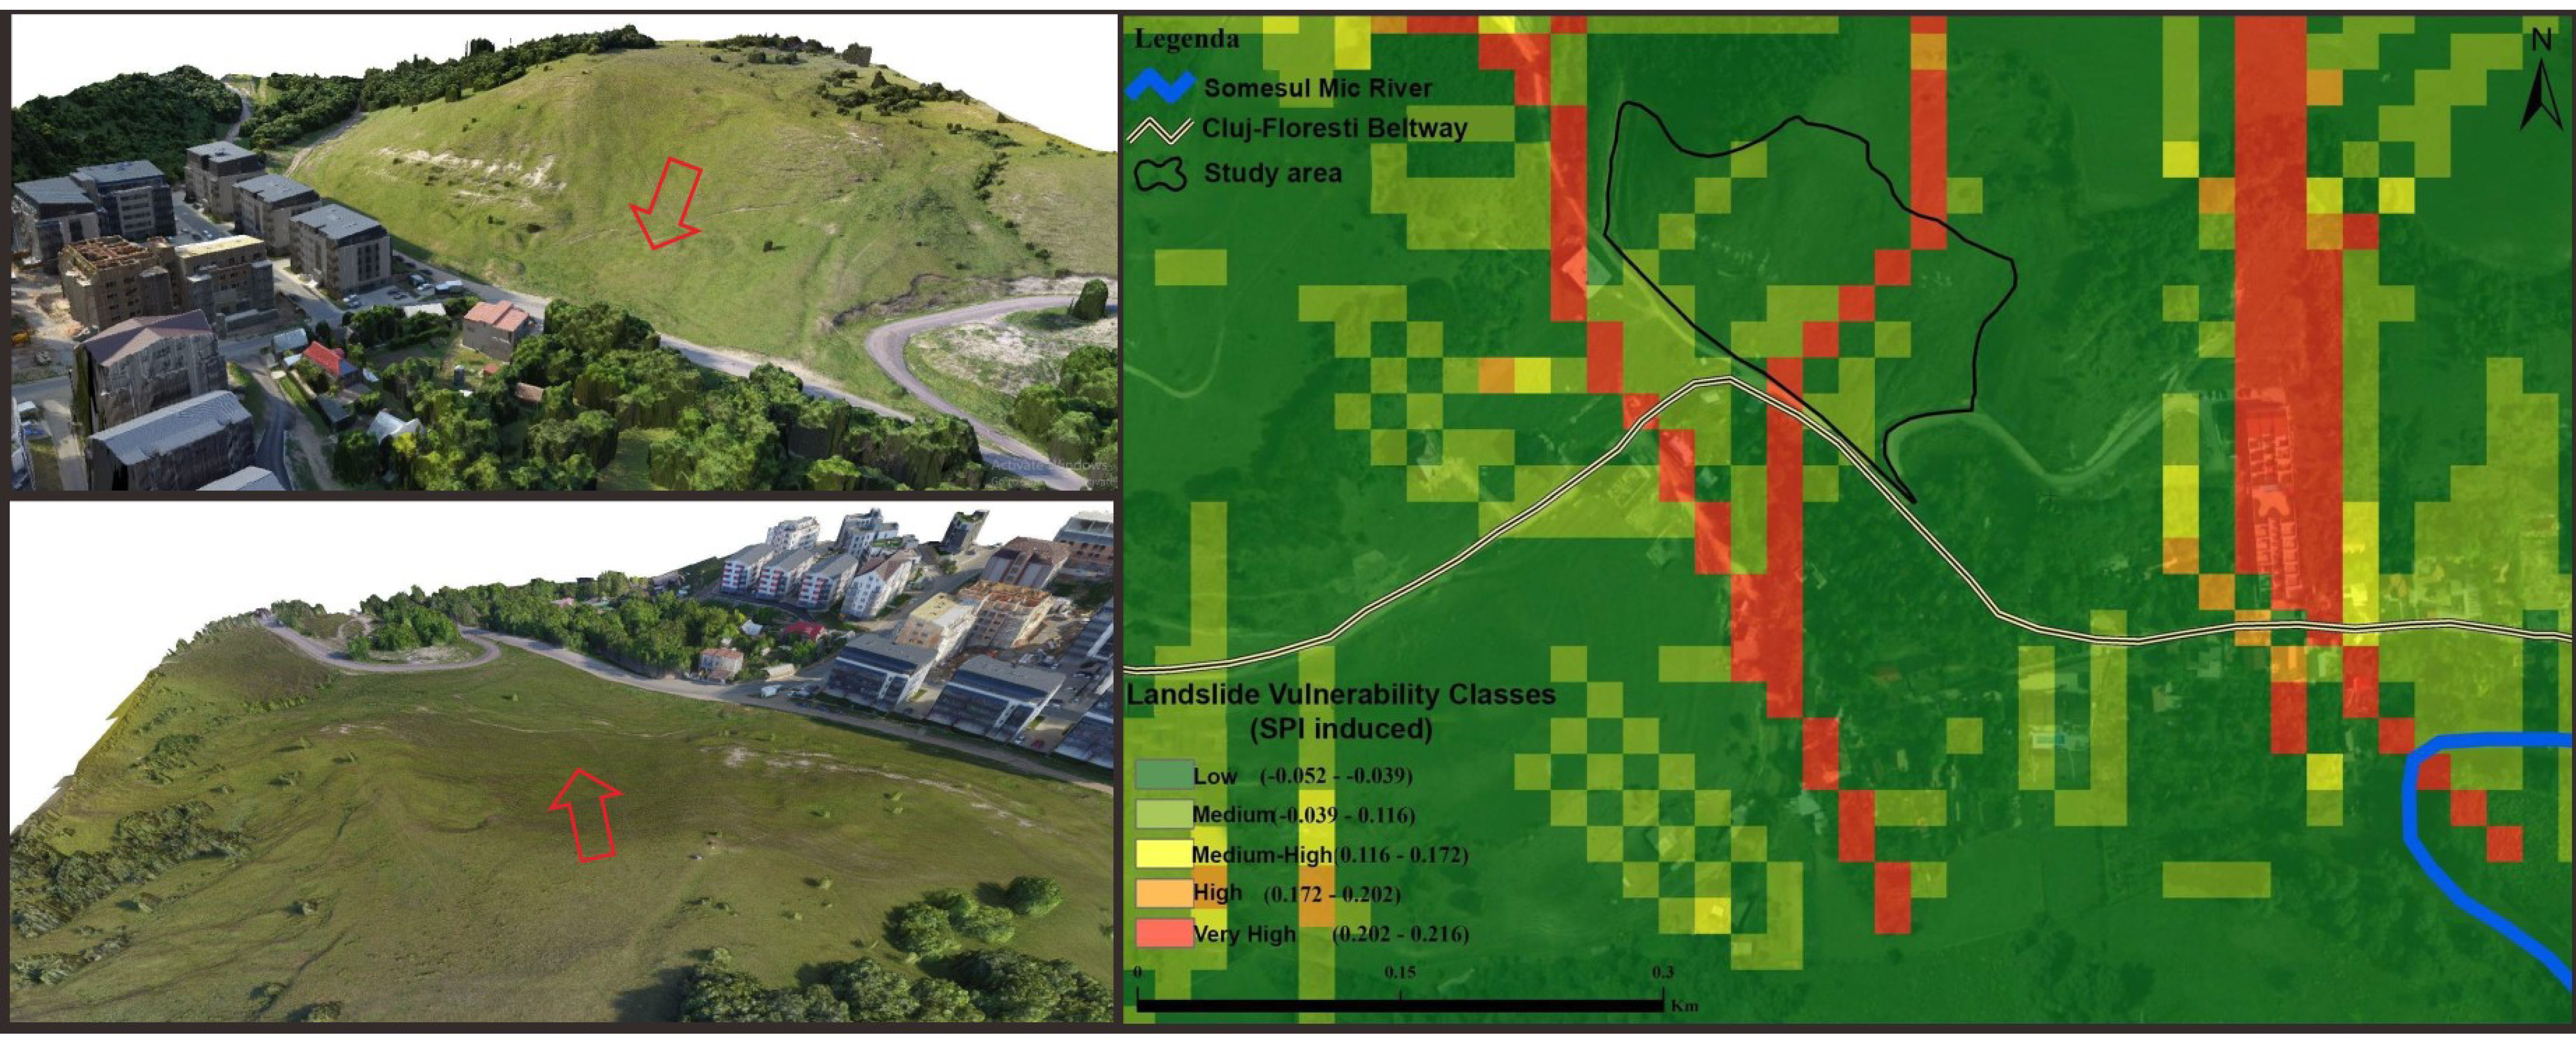
Based on the generated 3D model of the monitored slope, but also through field investigations, a special character of the relief was found, namely the presence of a thalweg in the southeast, in the area of the surveyed directional alignments 6 and 7. The thalweg is also called a water concentration line and is the lowest part of a valley, dry in this case. Returning to the GIS analysis of landslide vulnerability using the BSA method, according to the stream power index factor, the risk class is high to very high in that exact area (Figure 21). Because of the particularity highlighted, in addition to the landslide, there is a strong erosion of the land on the surface in question.
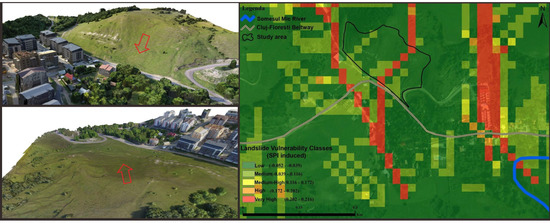
Figure 21.
3D model of the slope with the highest displacement and erosion zone highlighted (left); stream power index factor from the bivariate statistical analysis (BSA) susceptibility map (right).
Erosion is a natural, continuous process and consists in the movement of the soil, mainly under the action of water. The studied slope suffers from a surface water erosion, defined as the process of detachment and transport of soil particles by the action of water [68,69,70]. The material drains on the slope under the action of the erosive agent (water), resulting from rains, melting snow, and groundwater. In this case, the erosion process is amplified by anthropogenic interventions, a phenomenon also called accelerated or anthropogenic erosion. The process identified in the experiment is the most common form of erosion and depends on several factors: precipitation, soil characteristics, slope, land use category, and the condition of the vegetation. The presence of water has a double effect, as it facilitates the reduction of shear strength and also increases the unit weight of the soil [38,62].
The results obtained and the exhaustive analyses of the complex processes that contribute to the mechanisms that can favor or trigger the sliding movements on the slope in the researched area, also allow the elaboration of some protection measures. These must take into account the overall situation of the area and the new risks posed by profound changes with human intervention. In this regard, the detailed information obtained is useful in designing plans for technical measures in the area such as water collection wells, drains, retaining walls, etc., as well as biological measures, such as land use changes, cultivation of species with potential for soil improvement, and increased resistance of the land to displacement and erosion.
5. Conclusions
The results obtained from the landslide monitoring research near west of Cluj-Napoca, have a special practical importance determined by the substantial changes suffered by the study area in the recent years and the socio-economic aspects, with the emergence of the new residential neighborhood and the heavily circulated beltway, Floresti—Cluj-Napoca.
The established geodetic network allowed a thorough analysis of the mass movement processes that took place on the slope, the obtained results, interpretation, and discussion provided exhaustive information of scientific and practical interest valid for the investigated area. The results obtained indicated that the monitored slope is subject to a slow surface landslide, of a few centimeters per year. The UAV 3D modeling of the investigated slope, highlighted a special character of the relief, represented by a thalweg located in the southeastern part of the investigated area, where the GIS analysis of landslides vulnerability using the BSA method, especially in accordance with the stream power index factor, indicated a high to very high risk class. On the surface in question, in addition to displacements, there was a strong presence of erosion of the land. The UAV flights, even if they do not have the millimetric precision obtained by the geodetic-topographic measurements, accompany very well in a complex monitoring of the terrain, and allowed the evaluation of the exchange rate of the terrain configuration and the identification of surfaces with positive and negative deformations.
Given the obtained results and the confirmation of an active shallow landslide present in the investigated area, future investigations can be projected. It is a desideratum to continue the periodical monitoring of the slope using the geodetic control network established and the presented methods and techniques, as well as further expansion of the instrumentation. Thus, in future LiDAR-equipped UAV systems will be deployed, as well as InSAR-monitoring techniques. In order to establish stabilization and risk mitigation works, interdisciplinary investigations such as geotechnical studies and laboratory tests need to be carried out.
The results obtained from the multi-annual monitoring of the slope are of great interest because the socio-economic factors confirmed the efficiency and importance of the developed model of susceptibility to landslides using the BSA method. Thus, similar hotspots identified in risk maps and which are of particular importance to the municipality must be monitored continuously for good understanding, predicting, and combating natural hazards, before they cause significant losses.
Author Contributions
All authors have contributed equally to the work. All authors have read and agreed to the published version of the manuscript.
Funding
This research received no external funding.
Institutional Review Board Statement
Not applicable.
Informed Consent Statement
Not applicable.
Data Availability Statement
Not applicable.
Acknowledgments
The first author (P.S.) is thankful to Mircea Ortelecan for all the help and support during the PhD research. Also, special thanks to the students that accompanied and helped during the surveys: Iuliu Ivanciuc, Gheorghe Bida, Horatiu Hasnas, Ionut Manea, Ruxandra Sion.
Conflicts of Interest
The authors declare no conflict of interest.
Appendix A
The functional mathematical model for processing indirect measurements in the micro triangulation network is presented as:
When writing the system of correction equations, the known points P1 and P2 and the new points P3 and P4 were considered. At the minimum condition, the system transforms into a normal system of equations, which is solved by the method of successive reductions, the Gauss–Doolittle method. The system is in the form of:
References
- Corpade, C.; Man, T.; Petrea, D.; Corpade, A.-M.; Moldovan, C. Changes in landscape structure induced by transportation projects in Cluj-Napoca periurban area using GIS. Carpathian J. Earth Environ. Sci. 2014, 9, 177–184. [Google Scholar]
- Dolean, B.-E.; Bilașco, Ș.; Petrea, D.; Moldovan, C.; Vescan, I.; Roșca, S.; Fodorean, I. Evaluation of the Built-Up Area Dynamics in the First Ring of Cluj-Napoca Metropolitan Area, Romania by Semi-Automatic GIS Analysis of Landsat Satellite Images. Appl. Sci. 2020, 10, 7722. [Google Scholar] [CrossRef]
- Cebotari, S.; Cristea, M.; Moldovan, C.; Zubașcu, F. Renewable Energy’s Impact on Rural Development in Northwestern Romania. Energy Sustain. Dev. 2017, 37, 110–123. [Google Scholar] [CrossRef]
- Sestraş, P.; Sălăgean, T.; Bilașco, S.; Bondrea, M.V.; Naș, S.; Fountas, S.; Cîmpeanu, S.M. Prospect of a GIS based digitization and 3D model for a better management and land use in a specific micro-areal for crop trees. Environ. Eng. Manag. J. 2019, 18, 1269–1277. [Google Scholar] [CrossRef]
- Kil, J.; Kowalczyk, C.; Moldovan, C. Comparison of changes in urbanized area in Poland and Romania. Transylv. Rev. 2018, 17, 56–72. [Google Scholar]
- Sestras, P.; Bilasco, S.; Roşca, S.; Naș, S.; Bondrea, M.; Gâlgău, R.; Vereş, I.; Salagean, T.; Spalevic, V.; Cimpeanu, S. Landslides Susceptibility Assessment Based on GIS Statistical Bivariate Analysis in the Hills Surrounding a Metropolitan Area. Sustainability 2019, 11, 1362. [Google Scholar] [CrossRef]
- Bilaşco, Ş.; Roşca, S.; Fodorean, I.; Vescan, I.; Filip, S.; Petrea, D. Quantitative evaluation of the risk induced by dominant geomorphological processes on different land uses, based on GIS spatial analysis models. Front. Earth Sci. 2018, 12, 311–324. [Google Scholar]
- Roşca, S.; Bilaşco, Ş.; Petrea, D.; Fodorean, I.; Vescan, I.; Filip, S. Application of landslide hazard scenarios at annual scale in the Niraj River basin (Transylvania Depression, Romania). Nat. Hazards 2015, 77, 1573–1592. [Google Scholar]
- Galli, M.; Ardizzone, F.; Cardinali, M.; Guzzetti, F.; Reichenbach, P. Comparing landslide inventory maps. Geomorphology 2008, 94, 268–289. [Google Scholar] [CrossRef]
- Cruden, D.M.; Varnes, D.J. Landslides: Investigation and mitigation. Chapter 3-Landslide types and processes. Transp. Res. Board Spec. Rep. 1996, 247, 36–75. [Google Scholar]
- Roy, J.; Saha, S. Landslide susceptibility mapping using knowledge driven statistical models in Darjeeling District, West Bengal, India. Geoenviron. Disasters 2019, 6, 11. [Google Scholar] [CrossRef]
- Corominas, J.; van Westen, C.; Frattini, P.; Cascini, L.; Malet, J.-P.; Fotopoulou, S.; Catani, F.; Van Den Eeckhaut, M.; Mavrouli, O.; Agliardi, F.; et al. Recommendations for the quantitative analysis of landslide risk. Bull. Eng. Geol. Environ. 2014, 73, 209–263. [Google Scholar] [CrossRef]
- Fell, R.; Corominas, J.; Bonnard, C.; Cascini, L.; Leroi, E.; Savage, W.Z. Guidelines for landslide susceptibility, hazard and risk zoning for land use planning. Eng. Geol. 2008, 102, 85–98. [Google Scholar] [CrossRef]
- Ahmed, B. Landslide Susceptibility Modelling Applying User-Defined Weighting and Data-Driven Statistical Techniques in Cox’s Bazar Municipality, Bangladesh. Nat. Hazards 2015, 79, 1707–1737. [Google Scholar] [CrossRef]
- Carabella, C.; Miccadei, E.; Paglia, G.; Sciarra, N. Post-Wildfire Landslide Hazard Assessment: The Case of the 2017 Montagna Del Morrone Fire (Central Apennines, Italy). Geosciences 2019, 9, 175. [Google Scholar] [CrossRef]
- Akca, D. Photogrammetric monitoring of an artificially generated shallow landslide. Photogramm. Rec. 2013, 28, 178–195. [Google Scholar] [CrossRef]
- Dewitte, O.; Jasselette, J.C.; Cornet, Y.; Van Den Eeckhaut, M.; Collignon, A.; Poesen, J.; Demoulin, A. Tracking landslide displacements by multi-temporal DTMs: A combined aerial stereophotogrammetric and LIDAR approach in western Belgium. Eng. Geol. 2008, 99, 11–22. [Google Scholar] [CrossRef]
- Guzzetti, F.; Mondini, A.C.; Cardinali, M.; Fiorucci, F.; Santangelo, M.; Chang, K.T. Landslide inventory maps: New tools for an old problem. Earth Sci. Rev. 2012, 112, 42–66. [Google Scholar] [CrossRef]
- Althuwaynee, O.F.; Pradhan, B.; Lee, S. A novel integrated model for assessing landslide susceptibility mapping using CHAID and AHP pair-wise comparison. Int. J. Remote Sens. 2016, 37, 1190–1209. [Google Scholar] [CrossRef]
- Ayalew, L.; Yamagishi, H. The application of GIS-based logistic regression for landslide susceptibility mapping in the Kakuda-Yahiko Mountains, Central Japan. Geomorphology 2005, 65, 15–31. [Google Scholar] [CrossRef]
- Dikshit, A.; Sarkar, R.; Pradhan, B.; Acharya, S.; Alamri, A.M. Spatial Landslide Risk Assessment at Phuentsholing, Bhutan. Geosciences 2020, 10, 131. [Google Scholar] [CrossRef]
- Martha, T.R.; Kerle, N.; Jetten, V.; van Westen, C.J.; Kumar, K.V. Landslide volumetric analysis using cartosat-1-derived dems. IEEE Geosci. Remote Sens. Lett. 2010, 7, 582–586. [Google Scholar] [CrossRef]
- Westoby, M.J.; Brasington, J.; Glasser, N.F.; Hambrey, M.J.; Reynolds, J.M. “Structure-from-motion” photogrammetry: A low-cost, effective tool for geoscience applications. Geomorphology 2012, 179, 300–314. [Google Scholar] [CrossRef]
- Cigna, F.; Bianchini, S.; Casagli, N. How to assess landslide activity and intensity with persistent scatterer interferometry (PSI): The PSI-based matrix approach. Landslides 2012, 10, 267–283. [Google Scholar] [CrossRef]
- Lu, P.; Catani, F.; Tofani, V.; Casagli, N. Quantitative hazard and risk assessment for slow-moving landslides from persistent Scatterer interferometry. Landslides 2014, 11, 685–696. [Google Scholar] [CrossRef]
- Peduto, D.; Oricchio, L.; Nicodemo, G.; Crosetto, M.; Ripoll, J.; Buxó, P.; Janeras, M. Investigating the kinematic features of an unstable urban slope and the effects on the exposed facilities by merging conventional and GBSAR monitoring data: Case of Barberà de la Conca (Catalonia, Spain). Landslides 2020. [Google Scholar] [CrossRef]
- Artese, S.; Perrelli, M. Monitoring a Landslide with High Accuracy by Total Station: A DTM-Based Model to Correct for the Atmospheric Effects. Geosciences 2018, 8, 46. [Google Scholar] [CrossRef]
- Kasperski, J.; Delacourt, C.; Allemand, P.; Potherat, P.; Jaud, M.; Varrel, E. Application of a Terrestrial Laser Scanner (TLS) to the Study of the Séchilienne Landslide (Isère, France). Remote Sens. 2010, 2, 2785–2802. [Google Scholar] [CrossRef]
- Afeni, T.B.; Cawood, F.T. Slope Monitoring using Total Station: What are the Challenges and How Should These be Mitigated? S. Afr. J. Geomat. 2013, 2, 41–53. [Google Scholar]
- Lichun, S.; Wang, X.; Zhao, D.; Qu, J. Application of 3D laser scanner for monitoring of landslide hazards. Int. Arch. Photogramm. Remote Sens. 2008, 37, 277–281. [Google Scholar]
- Stiros, S.C.; Vichas, C.; Skourtis, C. Landslide Monitoring Based on Geodetically Derived Distance Changes. J. Surv. Eng. 2004, 130, 156–162. [Google Scholar] [CrossRef]
- Tsaia, Z.; Youa, G.J.Y.; Leea, H.Y.; Chiub, Y.J. Use of a total station to monitor post-failure sediment yields in landslide sites of the Shihmen reservoir watershed. Geomorphology 2012, 139–140, 438–451. [Google Scholar] [CrossRef]
- Simeoni, L.; Ferro, E.; Tombolato, S. Reliability of Field Measurements of Displacements in Two Cases of Viaduct-Extremely Slow Landslide Interactions. Eng. Geol. Soc. Territ. 2015, 2, 125–128. [Google Scholar]
- Turner, D.; Lucieer, A.; De Jong, S.M. Time Series Analysis of Landslide Dynamics Using an Unmanned Aerial Vehicle (UAV). Remote Sens. 2015, 7, 1736–1757. [Google Scholar] [CrossRef]
- Al-Rawabdeh, A.; Moussa, A.; Foroutan, M.; El-Sheimy, N.; Habib, A. Time Series UAV Image-Based Point Clouds for Landslide Progression Evaluation Applications. Sensors 2017, 17, 2378. [Google Scholar] [CrossRef] [PubMed]
- Devoto, S.; Macovaz, V.; Mantovani, M.; Soldati, M.; Furlani, S. Advantages of Using UAV Digital Photogrammetry in the Study of Slow-Moving Coastal Landslides. Remote Sens. 2020, 12, 3566. [Google Scholar] [CrossRef]
- Sestras, P.; Roșca, S.; Bilașco, Ș.; Naș, S.; Buru, S.M.; Kovacs, L.; Spalević, V.; Sestras, A.F. Feasibility Assessments Using Unmanned Aerial Vehicle Technology in Heritage Buildings: Rehabilitation-Restoration, Spatial Analysis and Tourism Potential Analysis. Sensors 2020, 20, 2054. [Google Scholar] [CrossRef]
- Bilasco, S.; Roşca, S.; Petrea, D.; Vescan, I.; Fodorean, I.; Filip, S. 3D Reconstruction of Landslides for the Acquisition of Digital Databases and Monitoring Spatiotemporal Dynamics of Landslides Based on GIS Spatial Analysis and UAV Techniques. In Spatial Modeling in GIS and R for Earth and Environmental Sciences; Pourghasemi, H.R., Gokceoglu, C., Eds.; Elsevier: Amsterdam, The Netherlands, 2019; pp. 451–465. [Google Scholar]
- Ghorbanzadeh, O.; Didehban, K.; Rasouli, H.; Kamran, K.V.; Feizizadeh, B.; Blaschke, T. An Application of Sentinel-1, Sentinel-2, and GNSS Data for Landslide Susceptibility Mapping. ISPRS Int. J. Geo Inf. 2020, 9, 561. [Google Scholar] [CrossRef]
- Matei, I.; Pacurar, I.; Rosca, S.; Bilasco, S.; Sestras, P.; Rusu, T.; Jude, E.T.; Tăut, F.D. Land Use Favourability Assessment Based on Soil Characteristics and Anthropic Pollution. Case Study Somesul Mic Valley Corridor, Romania. Agronomy 2020, 10, 1245. [Google Scholar] [CrossRef]
- Bilaşco, S.; Govor, C.; Roşca, S.; Vescan, I.; Filip, S.; Fodorean, I. GIS model for identifying urban areas vulnerable to noise pollution: Case study. Front. Earth Sci. 2016, 11, 214–228. [Google Scholar] [CrossRef]
- Petrea, D.; Bilasco, S.; Rosca, S.; Vescan, I.; Fodorean, I. The determination of the landslide occurrence probability by GIS spatial analysis of the land morphometric characteristics (Case Study: The Transylvanian Plateau). Carpathian J. Earth Environ. Sci. 2014, 9, 91–102. [Google Scholar]
- Sestras, P.; Bondrea, M.; Cetean, H.; Sălăgean, T.; Bilaşco, Ş.; Naș, S.; Spalevic, V.; Fountas, S.; Cîmpeanu, S. Ameliorative, ecological and landscape roles of Făget Forest, Cluj-Napoca, Romania, and possibilities of avoiding risks based on GIS landslide susceptibility map. Not. Bot. Horti Agrobo. 2018, 46, 292–300. [Google Scholar] [CrossRef]
- Bălteanu, D.; Micu, M.; Jurchescu, M.; Malet, J.-P.; Sima, M.; Kucsicsa, G.; Dumitrică, C.; Petrea, D.; Mărgărint, M.C.; Bilaşco, S.T.; et al. National-scale landslide susceptibility map of Romania in a European methodological framework. Geomorphology 2020, 371, 107432. [Google Scholar] [CrossRef]
- Irimuș, I.-A.; Roșca, S.; Rus, M.-I.; Marian, F.L.; Bilașco, S. Landslide susceptibility assessment in Almas Basin by means of the frequency rate and GIS techniques. Geogr. Technol. 2017, 12, 97–109. [Google Scholar] [CrossRef]
- Jaedicke, C.; Van Den Eeckhaut, M.; Nadim, F.; Hervás, J.; Kalsnes, B.; Vangelsten, B.V.; Smith, J.T.; Tofani, V.; Ciurean, R.; Winter, M.G. Identification of landslide hazard and risk ‘hotspots’ in Europe. Bull. Eng. Geol. Environ. 2014, 73, 325–339. [Google Scholar] [CrossRef]
- Jebur, M.N.; Pradhan, B.; Shafri, H.Z.M.; Yusoff, Z.M.; Tehrany, M.S. An integrated user-friendly ArcMAP tool for bivariate statistical modelling in geoscience applications. Geosci. Model Dev. 2015, 8, 881–891. [Google Scholar] [CrossRef]
- Borrelli, L.; Ciurleo, M.; Gullà, G. Shallow Landslide Susceptibility Assessment in Granitic Rocks Using Gis-Based Statistical Methods: The Contribution of the Weathering Grade Map. Landslides 2018, 15, 1127–1142. [Google Scholar] [CrossRef]
- Ciurleo, M.; Cascini, L.; Calvello, M. A comparison of statistical and deterministic methods for shallow landslide susceptibility zoning in clayey soils. Eng. Geol. 2017, 223, 71–81. [Google Scholar] [CrossRef]
- Bilaşco, Ş.; Roşca, S.; Păcurar, I.; Moldovan, N.; Boţ, A.; Negrușier, C.; Sestras, P.; Bondrea, M.; Naș, S. Identification of Land Suitability for Agricultural Use by Applying Morphometric and Risk Parameters Based on GIS Spatial Analysis. Not. Bot. Horti Agrobo. 2016, 44, 302–312. [Google Scholar] [CrossRef]
- Chalkias, C.; Ferentinou, M.; Polykretis, C. GIS Supported Landslide Susceptibility Modeling at Regional Scale: An Expert-Based Fuzzy Weighting Method. ISPRS Int. J. Geo Inf. 2014, 3, 523–539. [Google Scholar] [CrossRef]
- Vakhshoori, V.; Zare, M. Is the ROC curve a reliable tool to compare the validity of landslide susceptibility maps? Geomat. Nat. Hazards Risk 2018, 9, 249–266. [Google Scholar] [CrossRef]
- Kerekes, A.-H.; Poszet, S.L.; Gál, A. Landslide susceptibility assessment using the maximum entropy model in a sector of the Cluj-Napoca Municipality, Romania. Rev. Geomorf. 2018, 20, 130–146. [Google Scholar] [CrossRef]
- Akturk, E.; Altunel, A.O. Accuracy assesment of a low-cost UAV derived digital elevation model (DEM) in a highly broken and vegetated terrain. Measurement 2019, 136, 382–386. [Google Scholar] [CrossRef]
- Gong, C.; Lei, S.; Bian, Z.; Liu, Y.; Zhang, Z.; Cheng, W. Analysis of the development of an erosion gully in an open-cast coal mine dump during a winter freeze-thaw cycle by using low-cost UAVs. Remote Sens. 2019, 11, 1356. [Google Scholar] [CrossRef]
- Han, X.; Thomasson, J.A.; Xiang, Y.; Gharakhani, H.; Yadav, P.K.; Rooney, W.L. Multifunctional Ground Control Points with a Wireless Network for Communication with a UAV. Sensors 2019, 19, 2852. [Google Scholar] [CrossRef]
- Lendzioch, T.; Langhammer, J.; Jenicek, M. Estimating Snow Depth and Leaf Area Index Based on UAV Digital Photogrammetry. Sensors 2019, 19, 1027. [Google Scholar] [CrossRef]
- Okeson, T.J.; Barrett, B.J.; Arce, S.; Vernon, C.A.; Franke, K.W.; Hedengren, J.D. Achieving Tiered Model Quality in 3D Structure from Motion Models Using a Multi-Scale View-Planning Algorithm for Automated Targeted Inspection. Sensors 2019, 19, 2703. [Google Scholar] [CrossRef]
- Cignetti, M.; Godone, D.; Wrzesniak, A.; Giordan, D. Structure from Motion Multisource Application for Landslide Characterization and Monitoring: The Champlas du Col Case Study, Sestriere, North-Western Italy. Sensors 2019, 19, 2364. [Google Scholar] [CrossRef]
- Oniga, V.-E.; Pfeifer, N.; Loghin, A.-M. 3D Calibration Test-Field for Digital Cameras Mounted on Unmanned Aerial Systems (UAS). Remote Sens. 2018, 10, 2017. [Google Scholar] [CrossRef]
- Oniga, V.-E.; Breaban, A.-I.; Pfeifer, N.; Chirila, C. Determining the Suitable Number of Ground Control Points for UAS Images Georeferencing by Varying Number and Spatial Distribution. Remote Sens. 2020, 12, 876. [Google Scholar] [CrossRef]
- Spalevic, V.; Barovic, G.; Vujacic, D.; Curovic, M.; Behzadfar, M.; Djurovic, N.; Dudic, B.; Billi, P. The Impact of Land Use Changes on Soil Erosion in the River Basin of Miocki Potok, Montenegro. Water 2020, 12, 2973. [Google Scholar] [CrossRef]
- Chalise, D.; Kumar, L.; Spalevic, V.; Skataric, G. Estimation of Sediment Yield and Maximum Outflow Using the IntErO Model in the Sarada River Basin of Nepal. Water 2019, 11, 952. [Google Scholar] [CrossRef]
- Hazbavi, Z.; Sadeghi, S.H.; Gholamalifard, M. Dynamic analysis of soil erosion-based watershed health. Geogr. Environ. Sustain. 2019, 12, 43–59. [Google Scholar] [CrossRef]
- Nikolic, G.; Spalevic, V.; Curovic, M.; Khaledi Darvishan, A.; Skataric, G.; Pajic, M.; Kavian, A.; Tanaskovik, V. Variability of Soil Erosion Intensity Due to Vegetation Cover Changes: Case Study of Orahovacka Rijeka, Montenegro. Not. Bot. Horti Agrobot. Cluj Napoca 2018, 47, 237–248. [Google Scholar] [CrossRef]
- Gocić, M.; Dragićević, S.; Radivojević, A.; Martić Bursać, N.; Stričević, L.; Đorđević, M. Changes in Soil Erosion Intensity Caused by Land Use and Demographic Changes in the Jablanica River Basin, Serbia. Agriculture 2020, 10, 345. [Google Scholar] [CrossRef]
- Wessa, P. Free Statistics Software, Office for Research Development and Education. Version (v1.2.1). 2020. Available online: https://www.wessa.net/ (accessed on 4 January 2021).
- Tosic, R.; Dragicevic, S.; Zlatic, M.; Todosijevic, M.; Kostadinov, S. The impact of socio-demographic changes on land use and soil erosion (case study: Ukrina River catchment). Geogr. Rev. 2012, 46, 69–78. [Google Scholar]
- Čurović, Ž.; Čurović, M.; Spalević, V.; Janic, M.; Sestras, P.; Popović, S.G. Identification and Evaluation of Landscape as a Precondition for Planning Revitalization and Development of Mediterranean Rural Settlements—Case Study: Mrkovi Village, Bay of Kotor, Montenegro. Sustainability 2019, 11, 2039. [Google Scholar] [CrossRef]
- Spalevic, V.; Barovic, G.; Fikfak, A.; Kosanovic, S.; Djurovic, M.; Popovic, S. Sediment yield and Land use changes in the Northern Montenegrin Watersheds: Case study of Seocki Potok of the Polimlje Region. J. Environ. Prot. Ecol. 2016, 17, 990–1002. [Google Scholar]
Publisher’s Note: MDPI stays neutral with regard to jurisdictional claims in published maps and institutional affiliations. |
© 2021 by the authors. Licensee MDPI, Basel, Switzerland. This article is an open access article distributed under the terms and conditions of the Creative Commons Attribution (CC BY) license (http://creativecommons.org/licenses/by/4.0/).

