Abstract
We developed an extension of a previously proposed classification scheme that is based upon Freeman–Durden and Cloude–Pottier decompositions of polarimetric Synthetic Aperture Radar (SAR) data, along with a Double-Bounce Eigenvalue Relative Difference (DERD) parameter, and a Random Forest (RF) classifier. The extension was done, firstly, by using dual-copolarization SAR data acquired at shorter wavelengths (C- and X-band, in addition to the previously used L-band) and, secondly, by adding indicators derived from the (polarimetric) Kennaugh elements. The performance of the newly developed classification scheme, herein abbreviated as FCDK-RF, was tested using SAR data of exposed intertidal flats. We demonstrate that the FCDK-RF scheme is capable of distinguishing between different sediment types, namely mud and sand, at high spatial accuracies. Moreover, the classification scheme shows good potential in the detection of bivalve beds on the exposed flats. Our results show that the developed FCDK-RF scheme can be applied for the mapping of sediments and habitats in the Wadden Sea on the German North Sea coast using multi-frequency and multi-polarization SAR from ALOS-2 (L-band), Radarsat-2 (C-band) and TerraSAR-X (X-band).
Keywords:
intertidal flats; SAR; sediments; bivalve beds; polarization; classification; decomposition; Kennaugh elements 1. Introduction
Located at the interface of land and sea, intertidal flats are one of the most productive and dynamic ecosystems in the world [1]. The world’s largest coherent intertidal area, the Wadden Sea, stretches over more than 500 km along the North Sea coast of the Netherlands, Germany, and Denmark [2,3]. The system of barrier islands, sand flats, seagrass meadows, intertidal channels, and salt marshes forms the transition between the mainland and the open North Sea [4]. Being a UNESCO World Heritage since 2011, the Wadden Sea forms a large natural ecosystem with a high level of biodiversity. Since it is increasingly exposed to anthropogenic threats such as (over-) fishing, high nutrient loads, oil and gas production, and tourism, its continuous monitoring is mandatory according to national and international directives [5,6]. However, most areas are difficult to access, hence in-situ observations are sparse, which makes remote sensing techniques important and powerful tools for the mapping of key parameters in such regions [7,8]. The strong dependence on sunlight and weather conditions always limits the usage of optical remote sensing sensors. Here, Synthetic Aperture Radar (SAR) data can provide additional information, at a high spatial resolution, on surface structures and their distribution, thereby complementing the information gained from optical data [4,9,10].
Polarimetric SAR (PolSAR) data have already been used to estimate roughness parameters of exposed intertidal flats [11,12,13]. Geng et al. [14] demonstrated that different targets on intertidal flats can be identified using polarimetric decomposition methods applied to C- and X-band SAR data. Chen et al. [15] and Banks et al. [16] individually used L- and C-band PolSAR data to discriminate sediments on intertidal flats. Choe et al. [17] and Cheng et al. [18], respectively, used L- and C-band pol-SAR data to detect bivalve beds. However, common PolSAR classification schemes always depend on the availability of quad-polarization (qual-pol) SAR data, and comprehensive PolSAR features from intertidal flats are rare. Therefore, the analysis of multi-polarization PolSAR features at multiple SAR wavelengths and from intertidal areas are subject to ongoing research.
Along these lines, Wang et al. [9] proposed an FCD-RF classification scheme for the discrimination of mud and sand flats, which is based on Freeman–Durden and Cloude–Pottier decompositions, Double-Bounce Eigenvalue Relative Difference (DERD) parameter and Random-Forest (RF) classifiers, and tested its effectiveness using ALOS-2 L-band PolSAR imagery. Later on, Wang et al. [19] proposed a new method for the derivation of indicators for bivalve beds on intertidal flats and demonstrated its effectiveness at multiple radar wavelengths. Their indicators were based on a decomposition of the Kennaugh matrix, whose elements were used to gain information on the total intensity at both co-polarizations and on the relative strength of even- and odd-bounce backscattering. These indicators were further used to study the influence of imaging geometry and environmental conditions on the radar return, and thereby, to gain further insight into the radar backscattering from exposed intertidal flats [5].
In this paper, we combine the expertise gained in previous studies [9,19] to develop feature sets used for the classification of sediments and habitats on intertidal flats, and we evaluate their performance at three different radar bands using PolSAR data from ALOS-2 (L-band), Radarsat-2 (C-band) and TerraSAR-X (X-band). The aim of the present research study was to apply the existing FCD-RF classification scheme to SAR data acquired at shorter radar wavelengths (C-band and X-band), to expand it by including parameters derived from Kennaugh matrices, thereby demonstrating the effectiveness of the new FCDK-RF classification scheme, and eventually to demonstrate its applicability for a coastal environment different from that on the Chinese coast, i.e., for the German Wadden Sea.
The area of interest is introduced in Section 2, and the SAR data basis and the developed FCDK-RF scheme are described in Section 3. Results of multi-frequency and multi-polarization analyses are presented in Section 4, separating the influence of radar wavelengths and feature combinations, and they are discussed in Section 5. Finally, Section 6 provides the conclusions.
2. Study Area
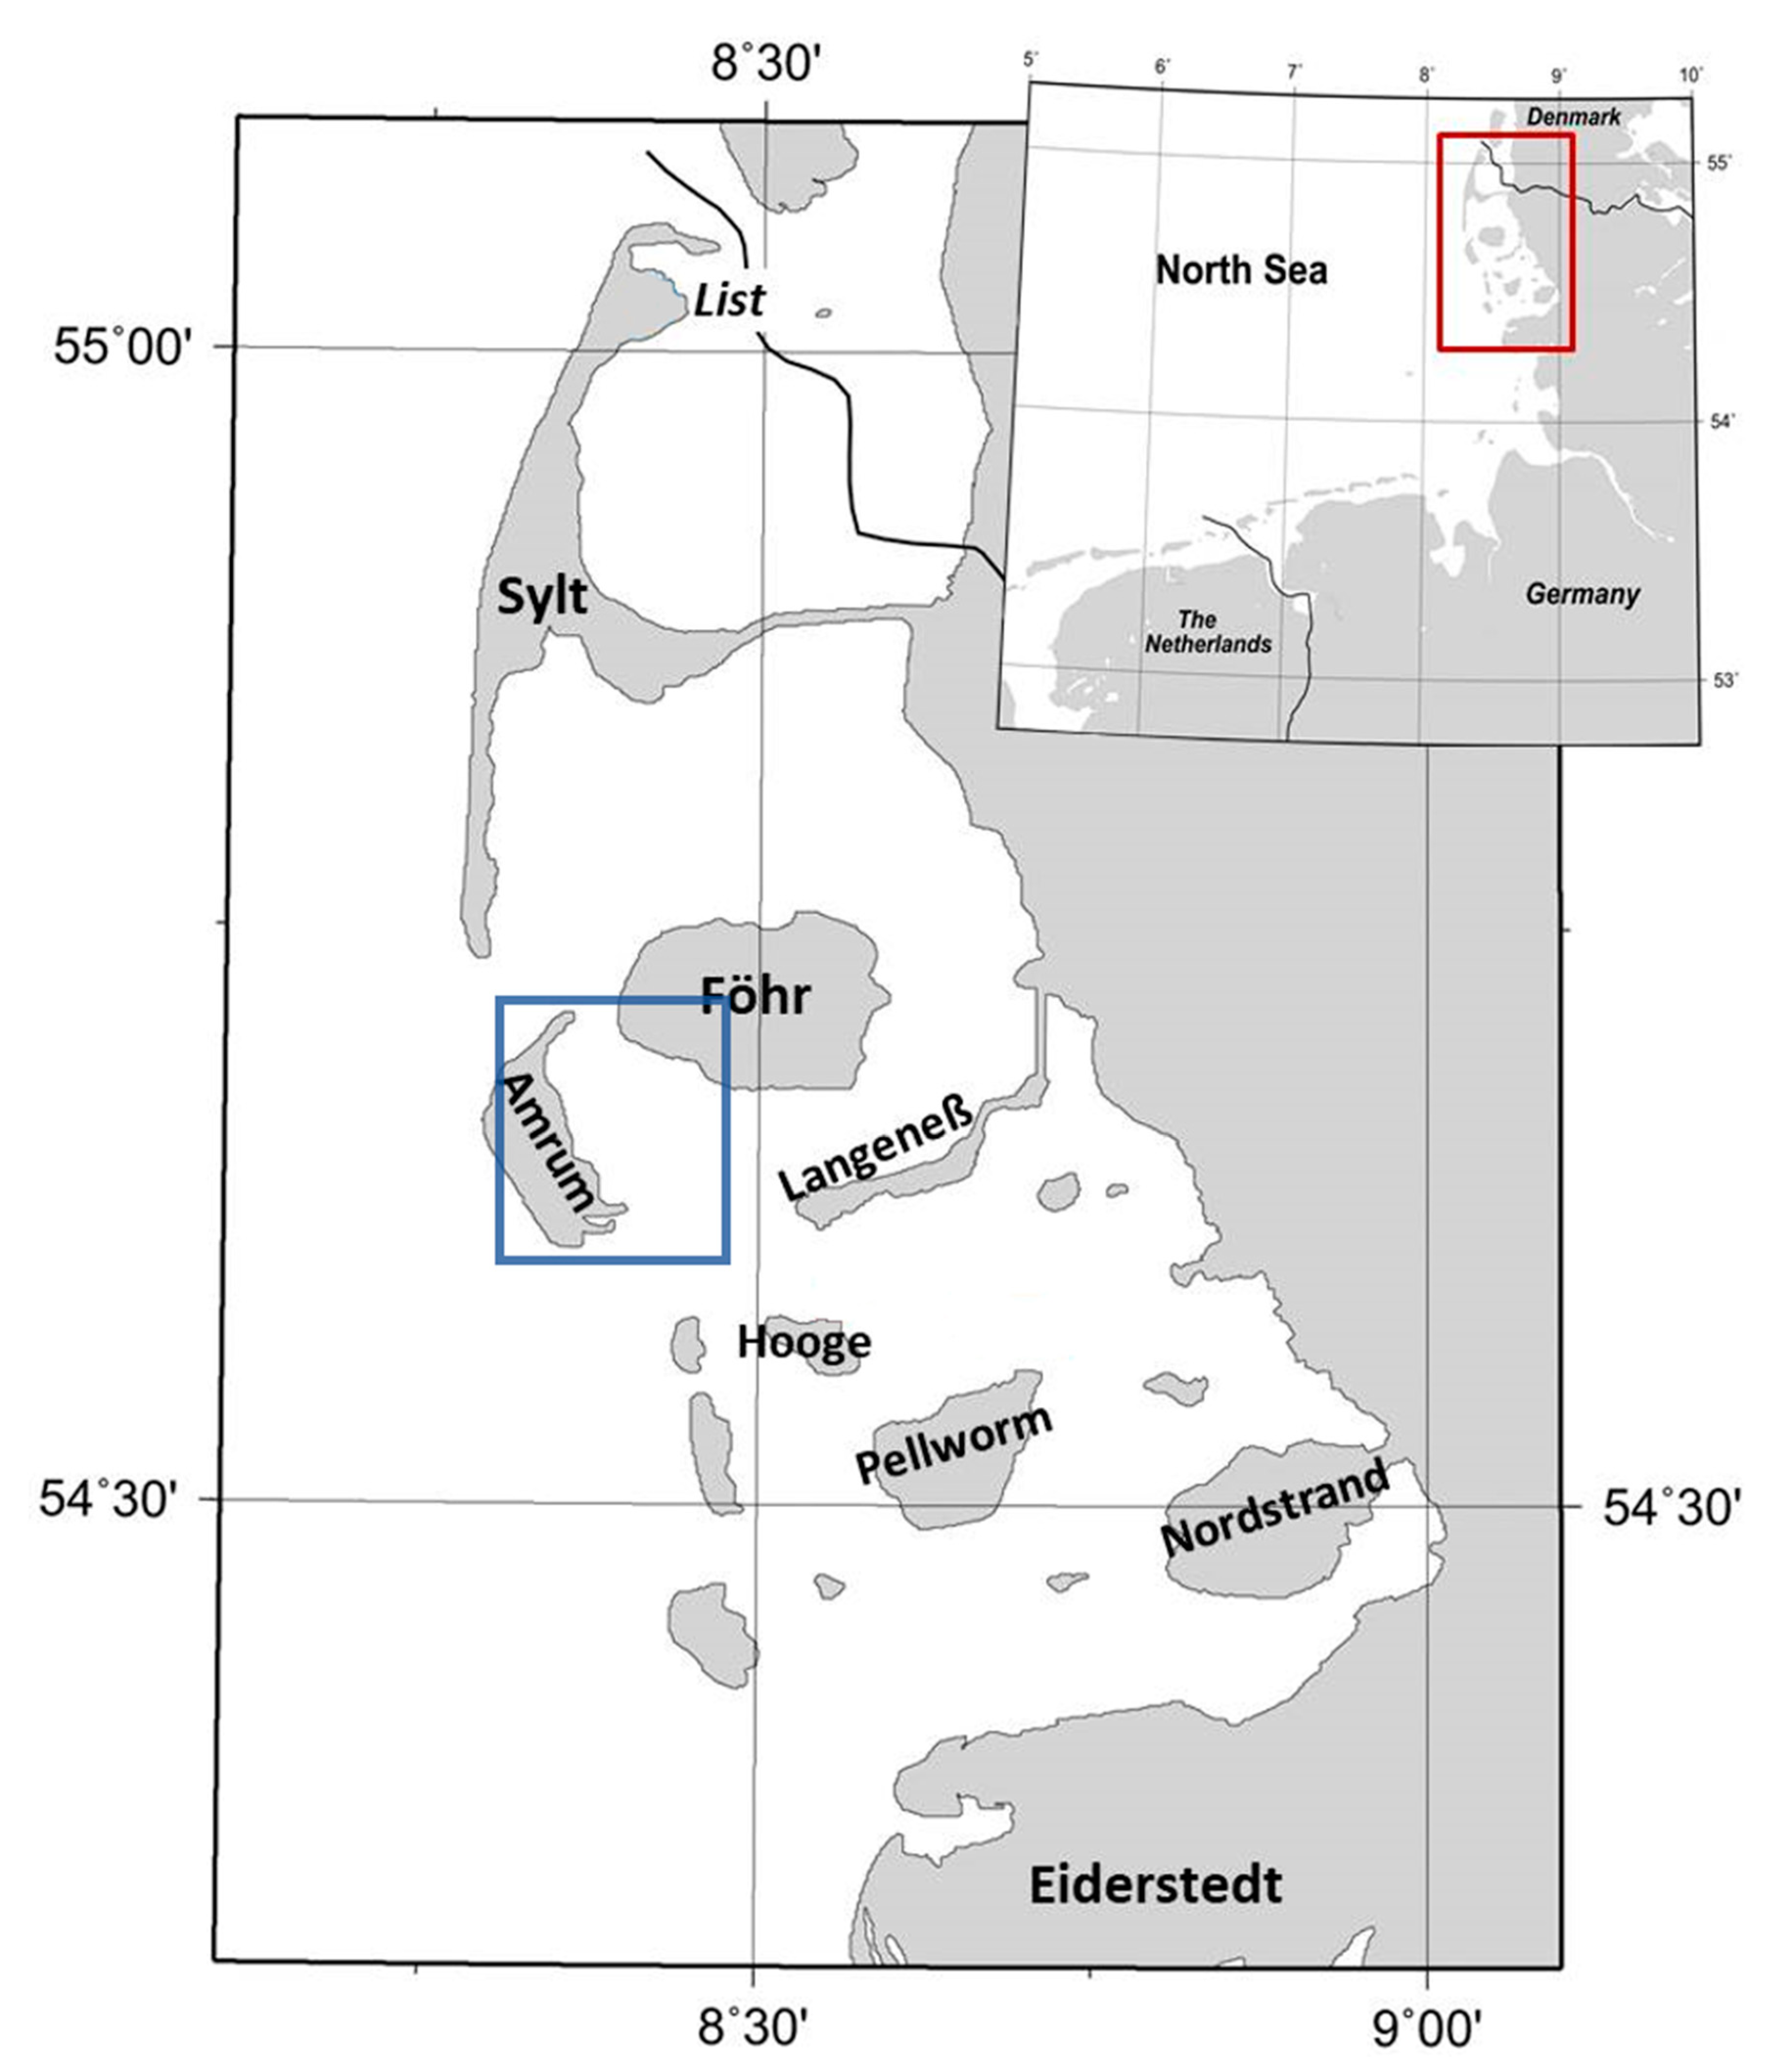
The study area (Figure 1) lies on the German North Sea coast, between the islands of Amrum and Föhr. It represents an area of a typical mixture of muddy and sandy sediments, bivalve beds (mainly Pacific oysters, but also blue mussels), and seagrass meadows [3,7,10,19]. Muddy sediments are mainly found along the coast, because of the calm local hydrologic conditions. In contrast, sandy and mixed (sandy and muddy) sediments dominate the open flats of the Wadden Sea [5]. The frequent monitoring of sediments and bivalve beds is conducted both during field campaigns and using optical imagery [20].
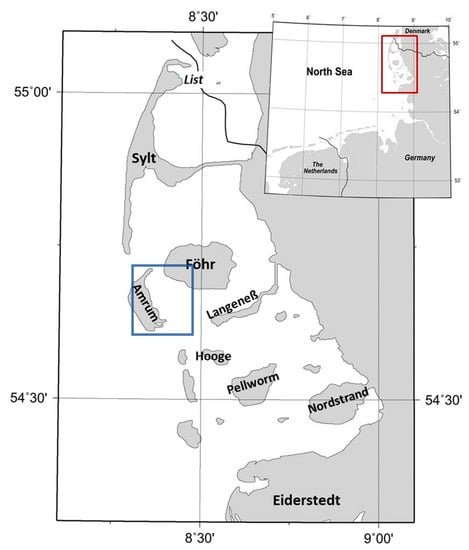
Figure 1.
Area of interest (blue rectangle in the large map) on the German North Sea coast, east of the island of Amrum, and southwest of the island of Föhr.
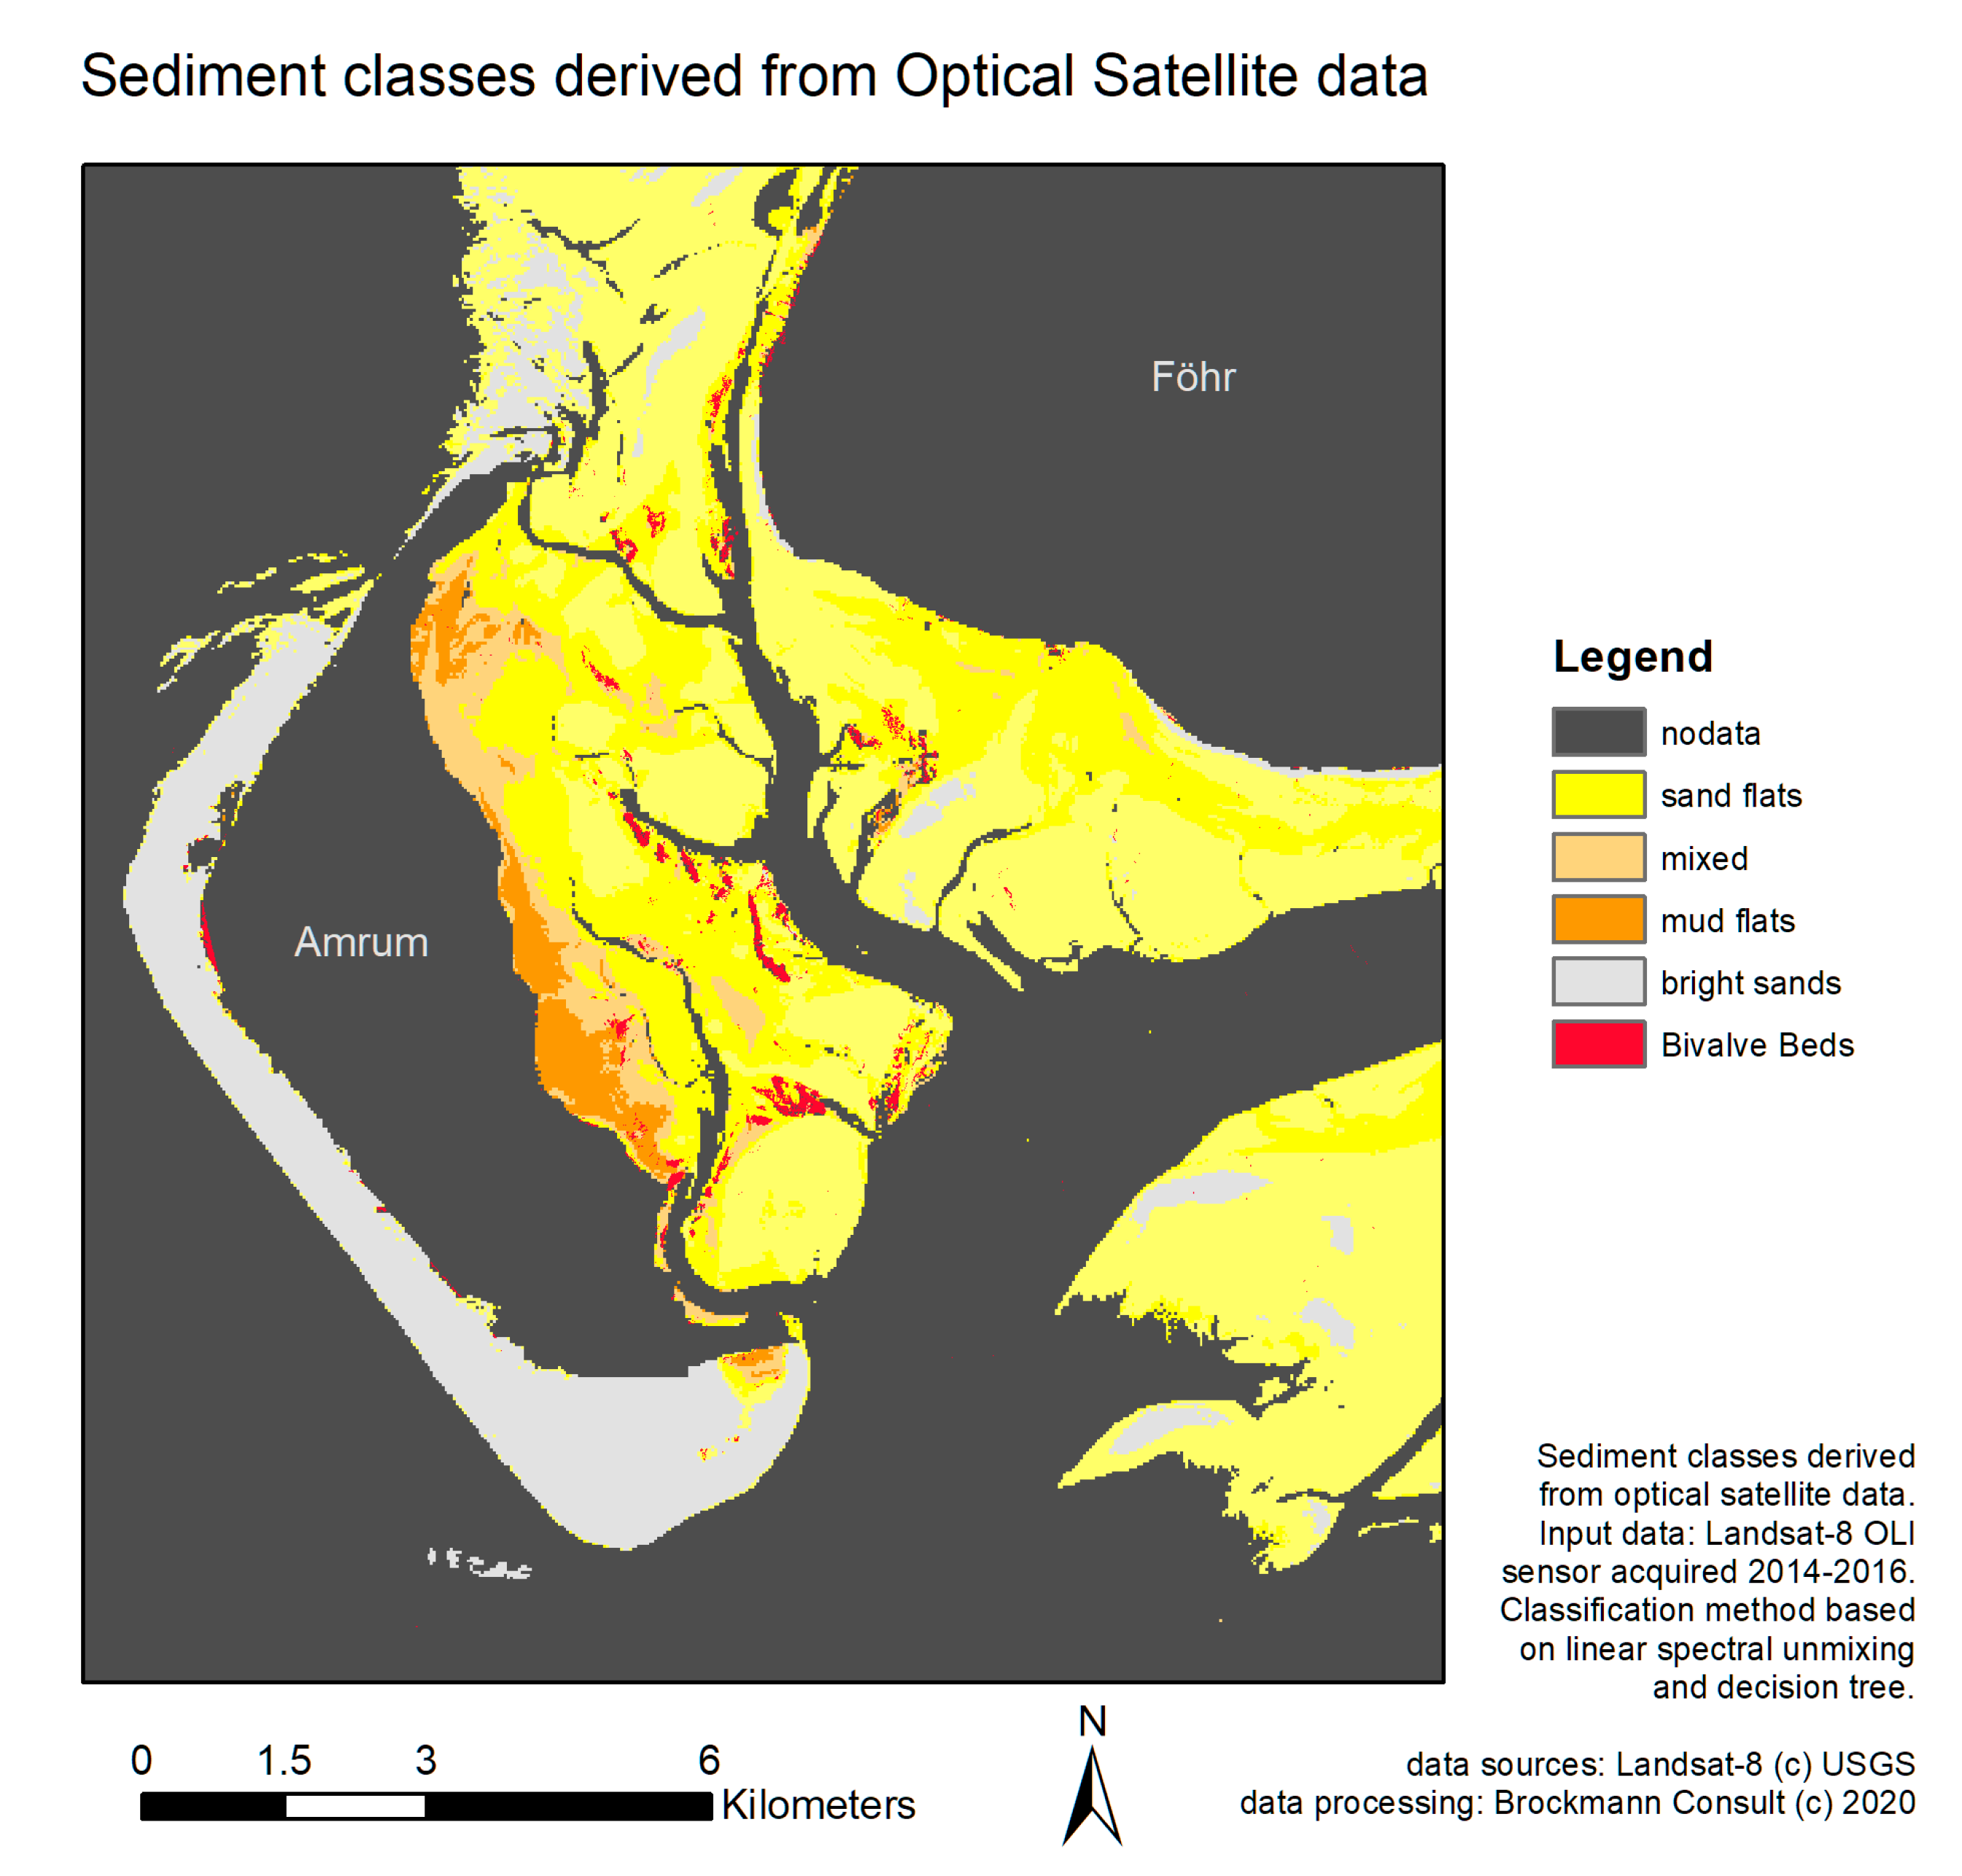
Figure 2 shows the classification of surface sediments and bivalve beds in the study area for the years 2014–2016, as derived from Landsat-8 OLI data (© Brockmann Consult 2020). It can be seen that mostly sandy sediments are found in the study area, although muddy and mixed sediments are also encountered at various places. Marked in red are the locations of bivalve beds. These classification results were used as reference data in the present study. Herein, we regard mixed sediments as mud flats for better comparison.
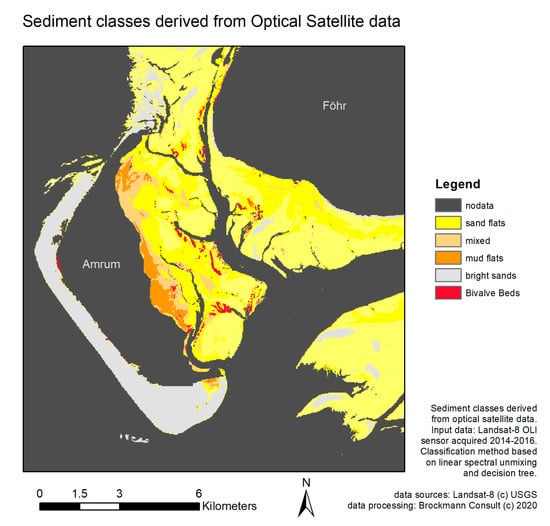
Figure 2.
Classification of surface sediments and bivalve beds in the study area on the German North Sea coast, based on optical/IR data (Landsat-8 OLI acquired 2014–2016; © Brockmann Consult 2020). Islands and open water are masked out (“no data”).
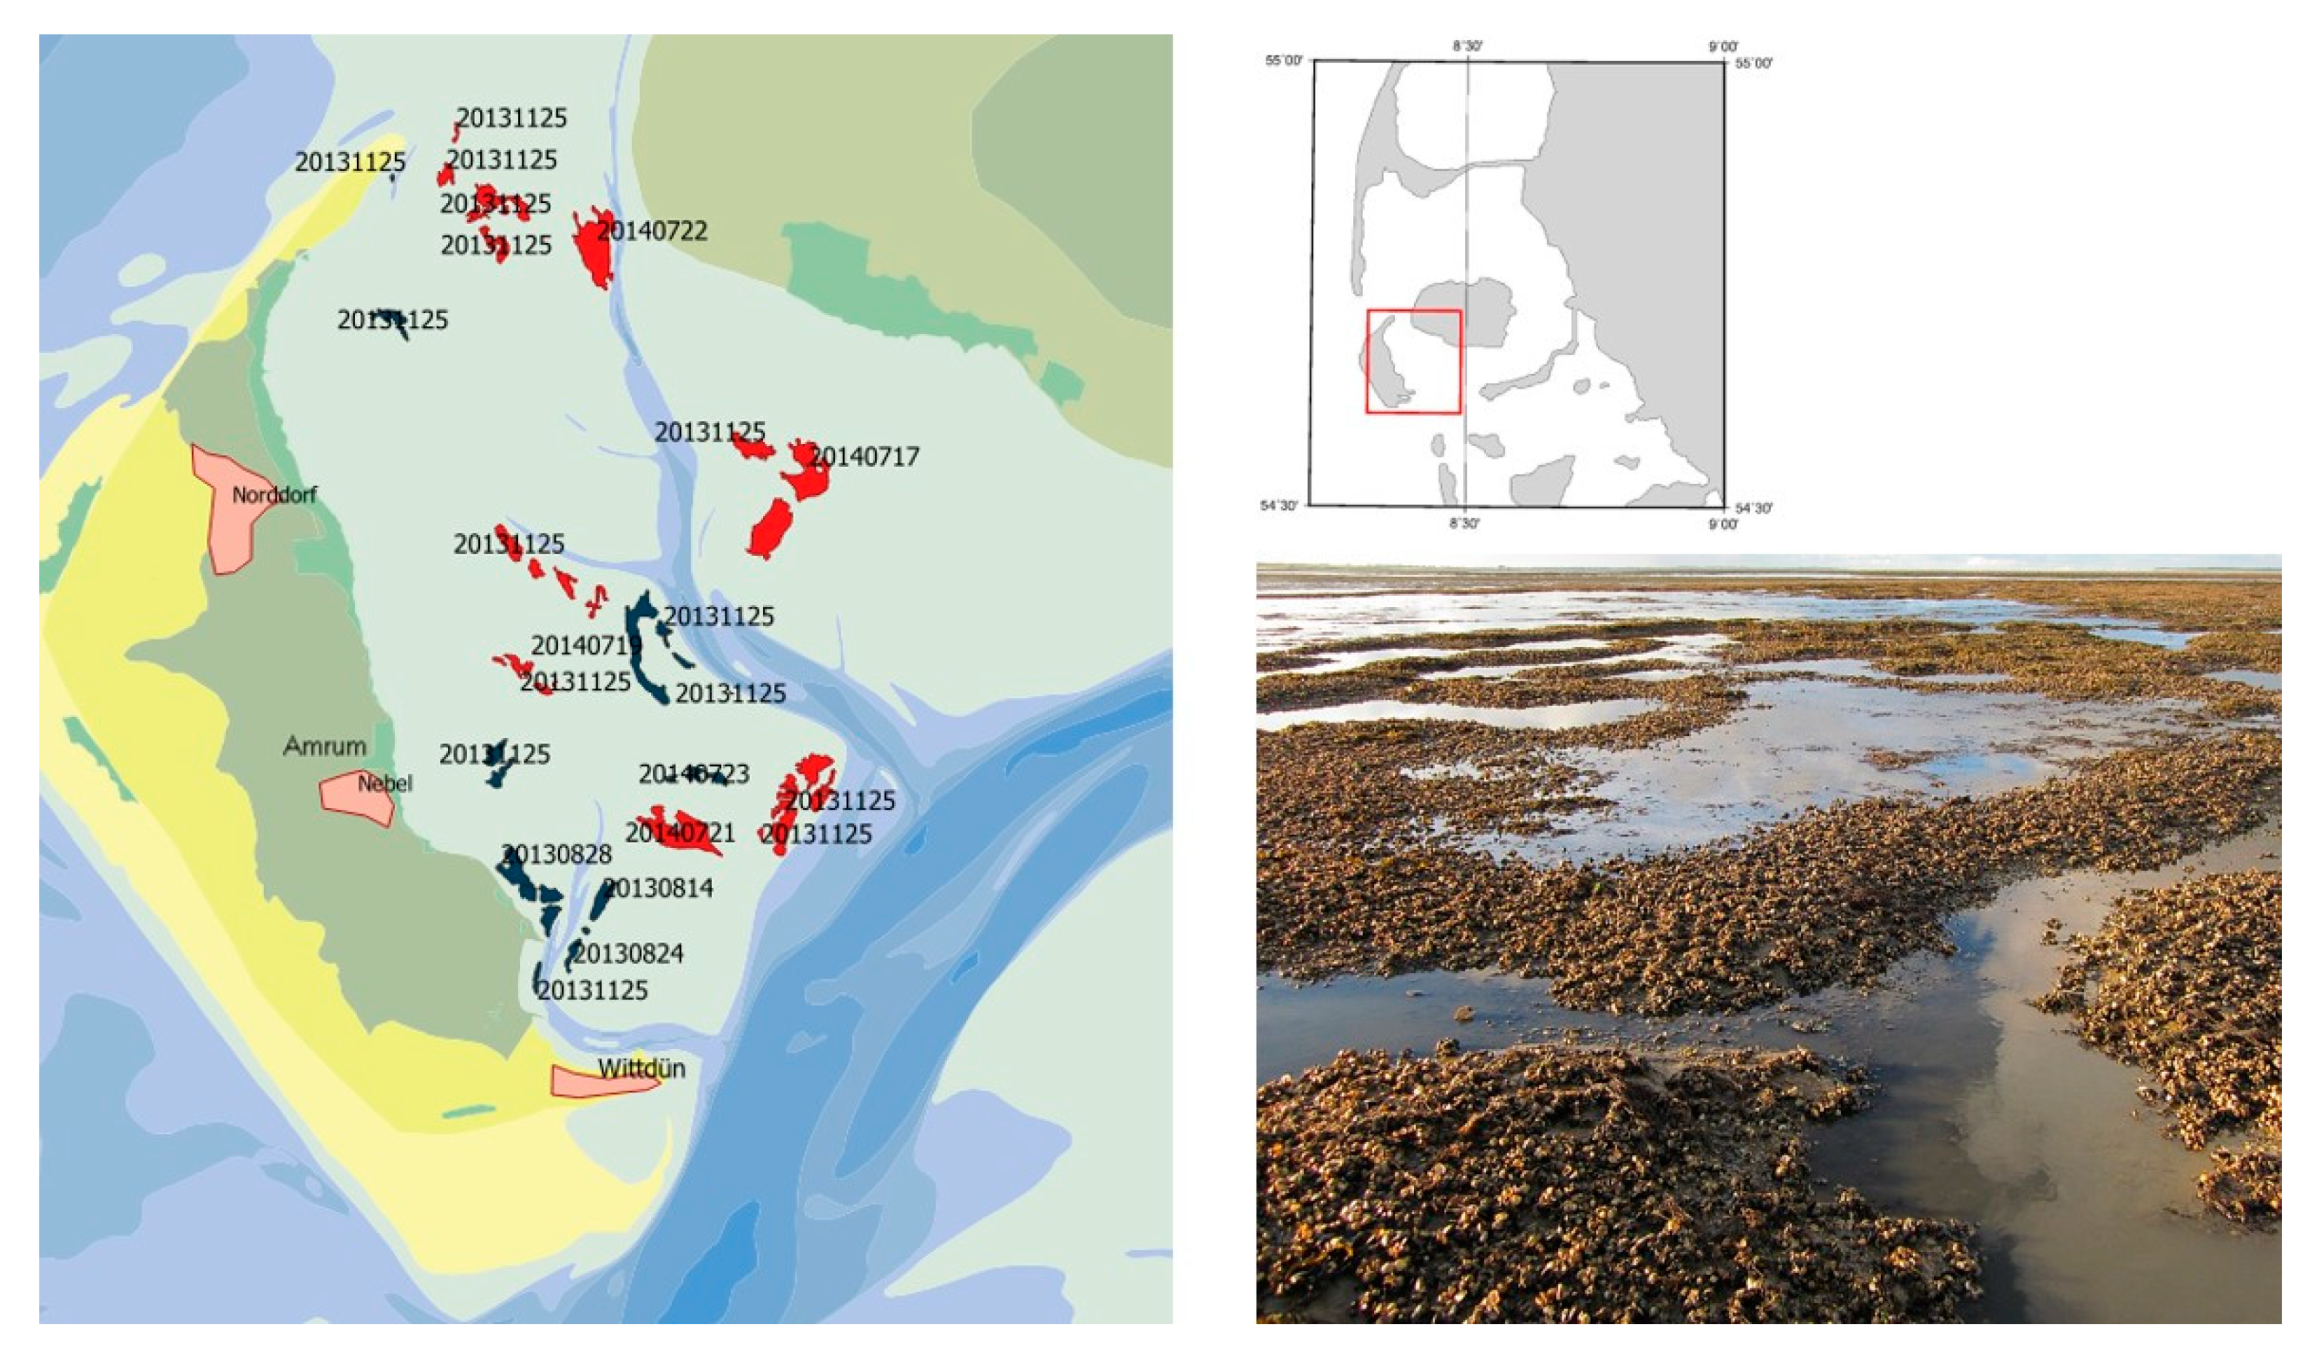
In addition to the above classification, we used in-situ data gained during annual monitoring campaigns and provided by the local National Park Administration. If a crude assessment based on aerial photography shows changes in the distribution of bivalve beds, or if specific beds have not been monitored in-situ for long, they become part of the field monitoring program. During this survey, the bed position was recorded by means of differential GPS, and samples were taken to record accompanying fauna and flora [21,22]. The left panel of Figure 3 shows a map with labelled patches marking bivalve beds encountered during in-situ campaigns in 2013 and 2014. Blue and red patches denote beds of blue mussels and oysters, respectively. Hereinafter, we regard these in-situ data as references for bivalve beds in general, i.e., independent of the bivalve species. We note that the bivalve beds were found not to change considerably in size or location by the time, when the SAR data were acquired.
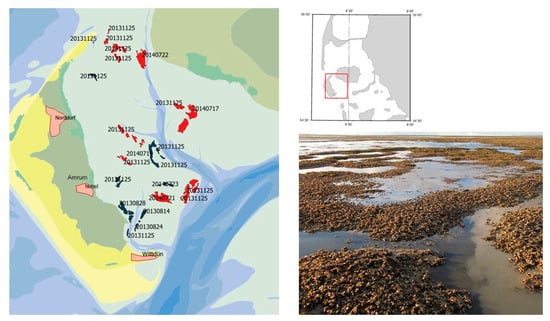
Figure 3.
(Left): results from field campaigns carried out in 2013 and 2014. The labelled patches denote bivalve beds of blue mussels (blue) and oysters (red); (upper right): map showing the map location as red rectangle; (lower right): photograph (J. Kohlus) of bivalve beds showing the typical patchy distribution of elevated bivalves, water puddles, and sediments.
3. Materials and Methods
3.1. SAR Data
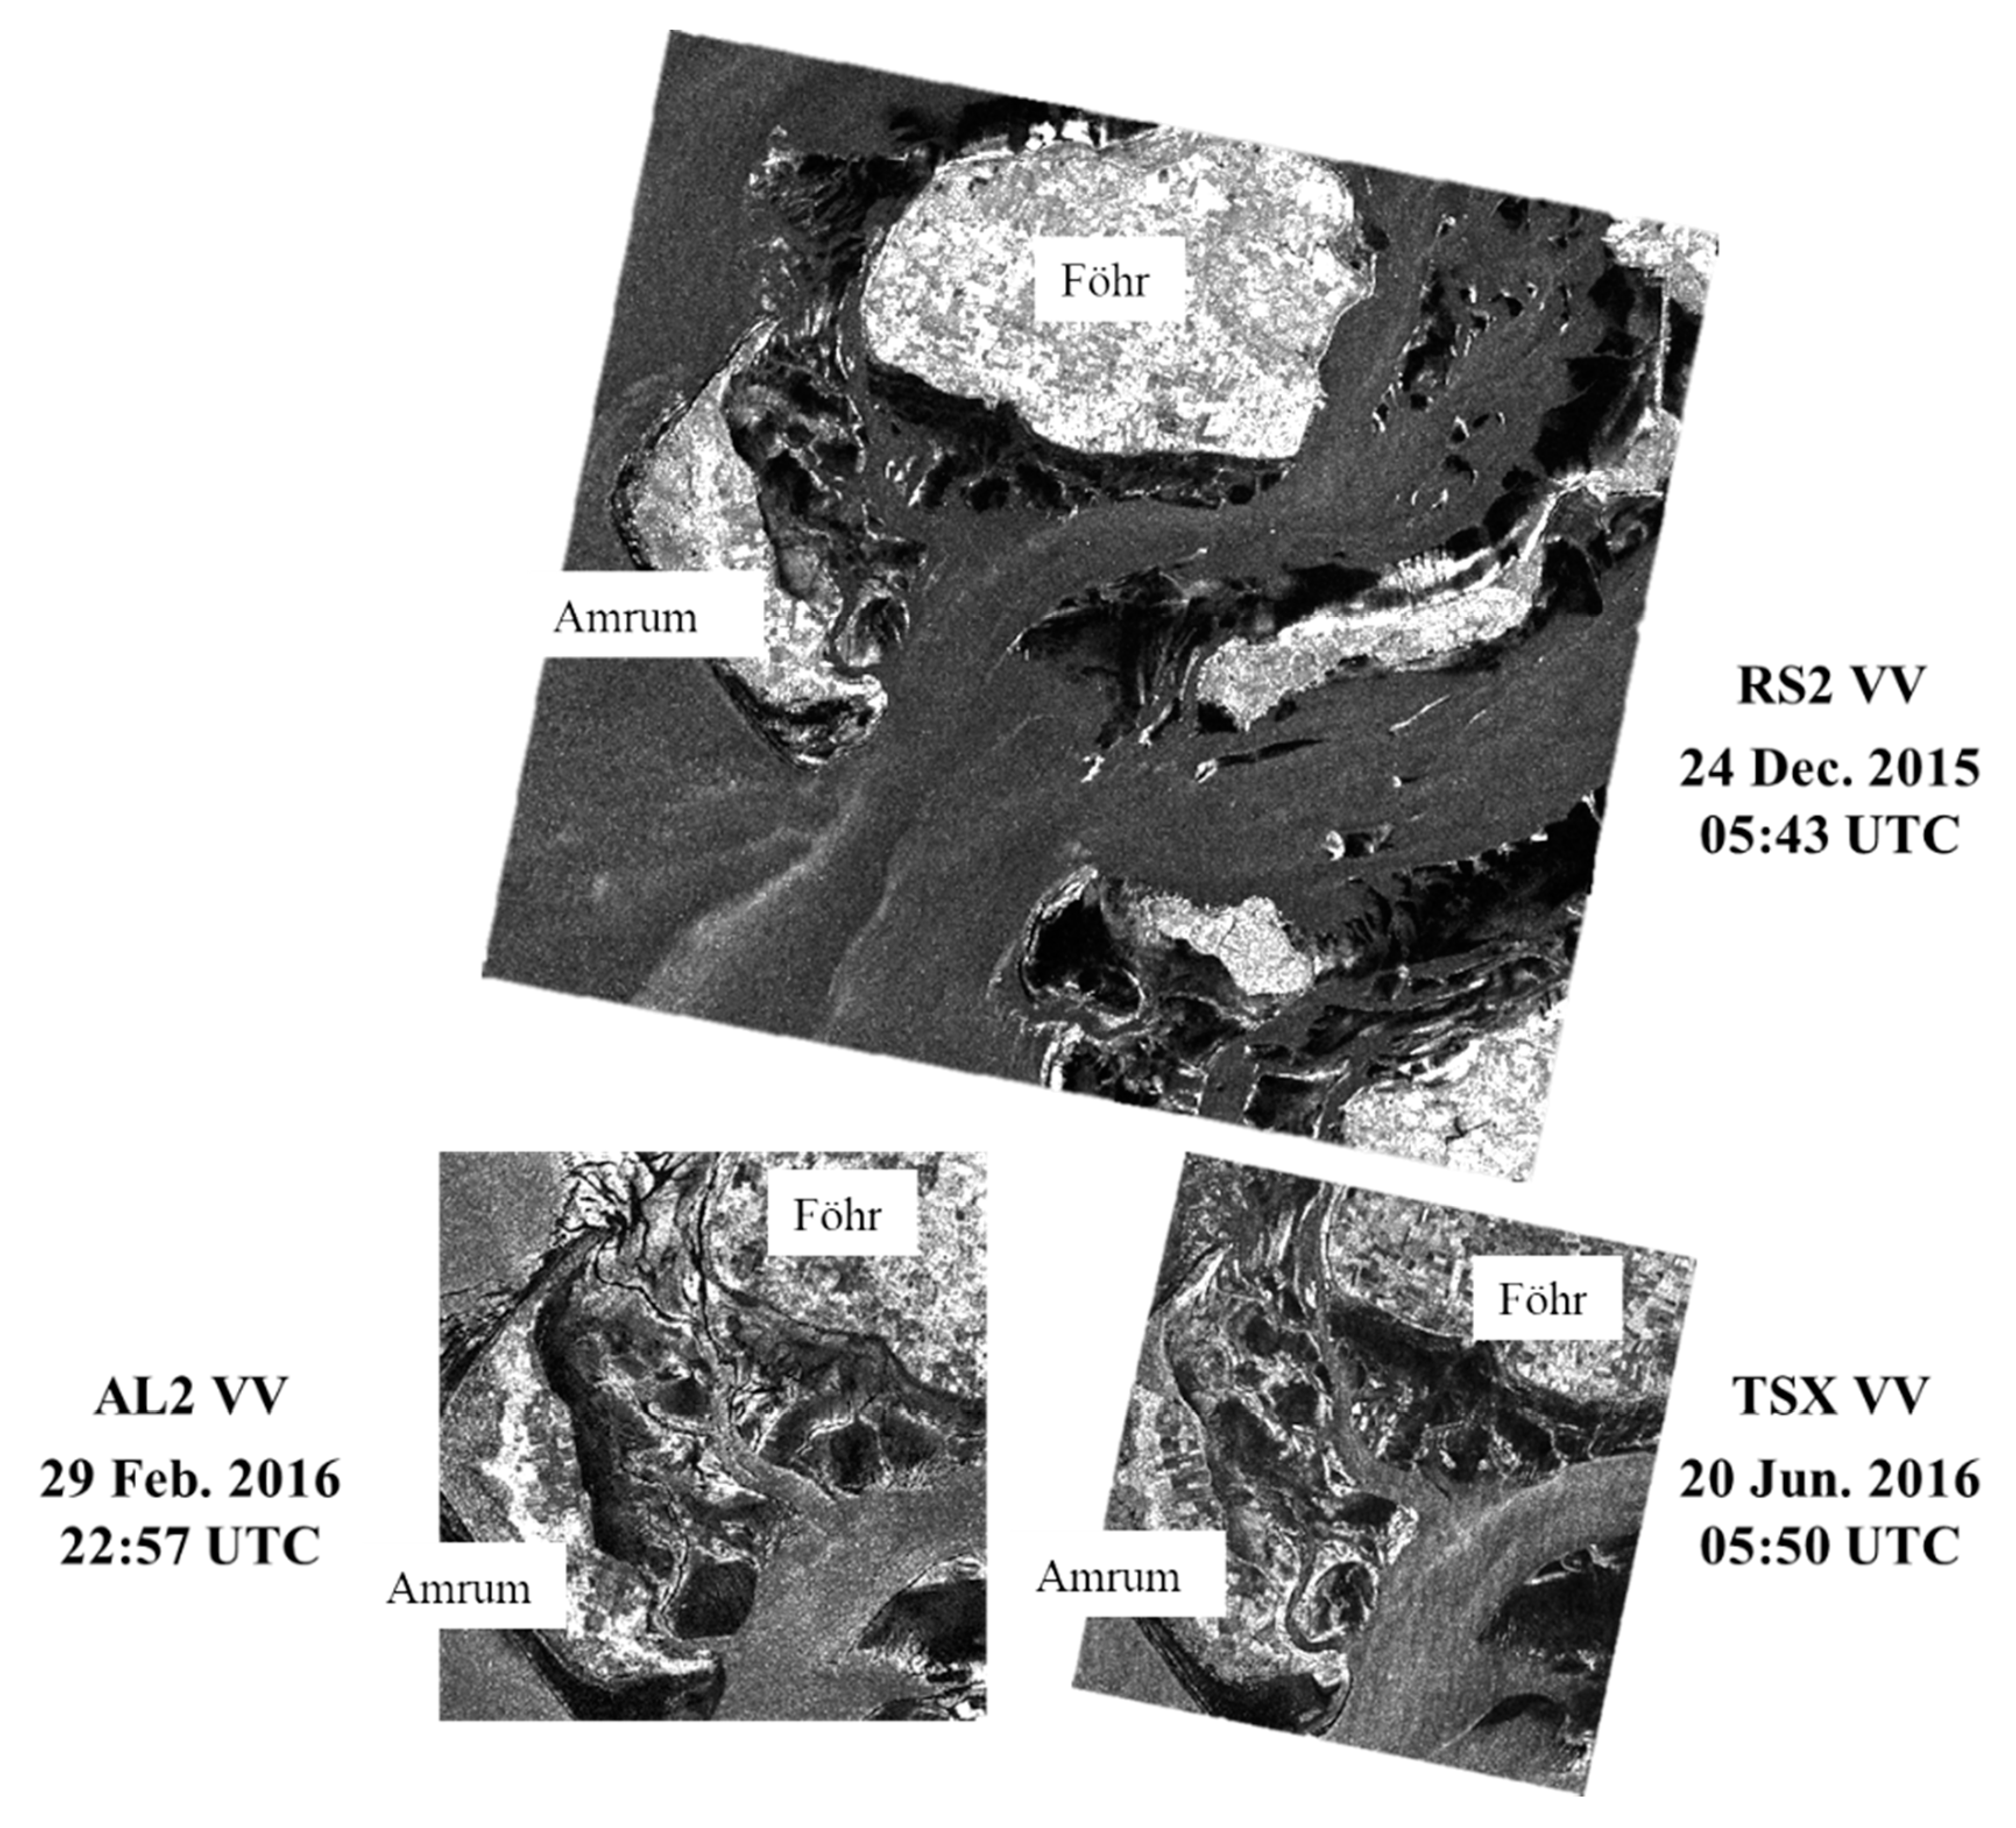
We used three sets of single-look complex (SLC) SAR data of the test site “Amrum” acquired around low tide by ALOS-2 (hereinafter abbreviated as AL2), Radarsat-2 (RS2), and TerraSAR-X (TSX). The VV-polarization SAR images acquired on 29 February 2016, 24 December 2015 and 20 June 2016, respectively, are shown in Figure 4. Here, we focus on a small 18.2 km × 18.2 km area of interest within the “Amrum” site, which was analyzed in greater detail, see the blue rectangle in Figure 1.
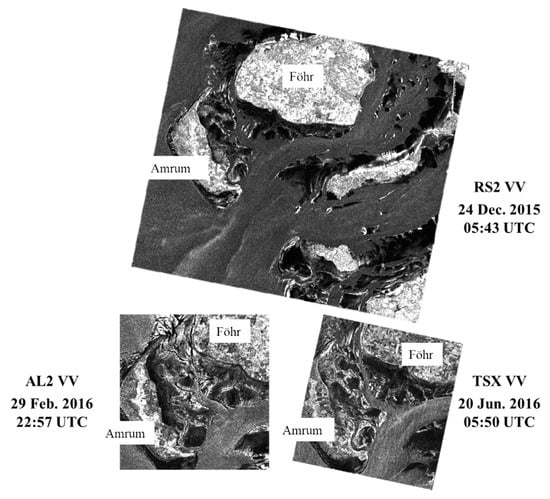
Figure 4.
VV-polarization Synthetic Aperture Radar (SAR) imagery of the study area, acquired by Radarsat-2 (RS2; top; 29.6 km × 31.7 km), ALOS-2 (AL2; bottom left; 18.2 km × 18.2 km), and TerraSAR-X (TSX; bottom right; 18 km × 16 km). All SAR images were acquired shortly after low tide. RS2: © MacDonald, Dettwiler and Associates Ltd. 2015—All Rights Reserved; AL2: © JAXA 2016; TSX: © DLR 2016.
Figure 4 demonstrates that the inner parts of exposed flats (primarily off Amrum) often appear on SAR images as dark patches, which may be due to remnant water, which effectively flattens the surface, or to flat sandy sediments (off Föhr). The tidal creeks and channels, and their narrow branches in particular, are marked by bright patches along their rims, which are due to elevated, hence rougher, sandy sediments. Several extended bivalve beds are located within the study area, showing up as bright patches in the SAR imagery. The bivalves (blue mussels and oysters) stick out of the sediments, increasing the surface roughness locally, thereby increasing the radar backscattering.
Table 1 shows the acquisition information of the SAR data, including the acquisition dates and times, the sensors and frequencies, polarizations, incidence angles, and water levels measured by the tide gauge “Wittdün” at the southern tip of Amrum. The SAR images’ pixel sizes range from 1 m × 1 m to 5 m × 5 m. The AL2 image was acquired in Strip-Map Ultra-Fine mode (quad-pol), the RS2 image in Fine Quad-Pol mode (quad-pol), and the TSX image in High-Resolution Spotlight mode (dual-co-pol: HH and VV). All SAR images were acquired within 30 min off low tide and at comparable incidence angles (between 30° and 40°). Note that the SAR signatures at C- and X-band radar are similar, which is in agreement with earlier findings by Gade et al. [5,13].

Table 1.
SAR acquisition dates and times, sensors and radar bands, acquisition modes, and environmental conditions during image acquisitions. Water levels are geopotential heights measured at pile “Wittdün”. Polarizations: dual-co-pol HH + VV (D), quad-pol HH + HV + VH + VV (Q).
3.2. FCDK-RF Classification Scheme
In the previously proposed FCD-RF classification scheme [9], quad-pol L-band SAR data were used to obtain the feature set, which included Freeman–Durden (F) and Cloude–Pottier (C) polarimetric decomposition components as well as a Double Bounce Eigenvalue Relative Difference (D) parameter. The classification was then carried out using Random Forest (RF) classifiers to distinguish sediment types, especially mud and sand. High accuracies were obtained using L-band SAR data; however, the effectiveness of that classification scheme using SAR data acquired at shorter wavelengths (C- and X-band) needed further tests. In this paper, we address this issue and further extend the FCD feature set by including Kennaugh elements (K), resulting in an overall classification scheme abbreviated as FCDK-RF.
3.2.1. FCD Feature Set
The FCD feature set consists of the Freeman–Durden decomposition components, Cloude–Pottier decomposition components, and DERD parameter [9]. This method performed very well on natural surfaces because its model matching is based on physical radar scattering models rather than on a mathematical derivation only. The three components of the Freeman–Durden decomposition are orthogonal and trace-normalized, and they describe surface scattering (represented by the ODD parameter), double-bounce scattering (DBL) and volume scattering (VOL). The Cloude–Pottier decomposition focuses on a physical partition in the scattering process, and is necessary for interpreting all random scattering mechanisms. The three components of that decomposition are entropy (represented by H), mean alpha angle (α), and anisotropy (AN). Finally, the DERD parameter has proven to be useful when describing geophysical parameters of natural media, and its potential for interpreting the slight scattering disparities between sediments has been assessed and applied [9].
3.2.2. Developed FCDK Feature Set
Apart from the prevailing sandy and muddy sediments, bivalve beds are encountered at many places on the German North Sea coast and hence, a reliable classification scheme needs to account for such habitats too. Recently, Kennaugh elements [23,24,25] were suggested as parameters that can accurately describe differences in the radar backscattering from different intertidal flat surfaces and that can be used to derive indicators for bivalve beds [5]. In order to improve our classification scheme, therefore, we added to its feature set indicators derived from the Kennaugh matrix [19]. In dual-co-pol (HH and VV) SAR data, four elements can be obtained from the Kennaugh matrix, namely K0, K3, K4, and K7 [5]. Among them, K0 reflects the total backscatter intensity, K3 is the difference between even- and odd-bounce scattering, K4 is the relation between horizontal and vertical dipoles, and K7 is the phase difference between odd- and even-bounce scattering [24].
The third normalized Kennaugh element, k3, showed good performance in the detection of bivalve beds. Applying a moving 11 pixel × 11 pixel window, we calculated for every window the difference D3 of the mean and standard deviation of the third normalized Kennaugh element, D3 = µ3 − σ3, and the respective product P4 of the absolute mean and standard deviation of the normalized fourth Kennaugh element, P4 = |µ4| × σ4. Both D3 and P4 have proven useful indicators for bivalve beds [19]. Therefore, the FCDK feature set includes parameters indicating odd-bounce, double-bounce and volume scattering (ODD, DBL and VOL, respectively) from the Freeman–Durden decomposition, entropy H, angle α and anisotropy AN from the Cloude–Pottier decomposition, and the parameters D3 and P4 derived from the Kennaugh framework, together with the DERD parameter.
TSX data were available only as dual-co-pol SAR data (Table 1); therefore, we simplified the SAR feature expressions setting the cross-polarization (cross-pol; HV and VH) channels as zero, thereby deriving simplified Freeman–Durden and Cloude–Pottier decomposition components. For simplicity, we set the contribution of volume scattering, hence the VOL component, of the Freeman–Durden decomposition [26] as zero. Moreover, in the Cloude–Pottier decomposition [27], we disregarded the cross-pol channels and got two eigenvalues of the 2 × 2 coherency matrix only. For DERD [28], our simplified scheme assumes no multiple scattering from rough surfaces, and it normalizes the eigenvalues by the scattering angle instead of the volume scattering.
3.2.3. FCDK-RF Classification Scheme
The RF classifier is an ensemble of unpruned decision trees constructed from bootstrap samples derived from training data, and it is relatively robust with respect to outliers and noise without over-fitting [29]. In this research, the predefined number of classification trees was set to 500, and the output of the classifier was determined by a majority vote among the decision trees. Finally, we combined the FCDK feature set with the RF classifier, resulting in the new FCDK-RF classification scheme. Note that no post-classification filtering or exclusion of particular training or validation areas was applied. Here, we took four classes into consideration, i.e., sandy sediments, mixed sediments, open water, and bivalve beds. For the accuracy assessment, we regard in-situ data (Figure 3) as references for bivalve beds, and sediment classification results (Figure 2) for sand sediments and mixed sediments. In total, 8000 validation samples were used for accuracy calculation in a confusion matrix.
4. Results
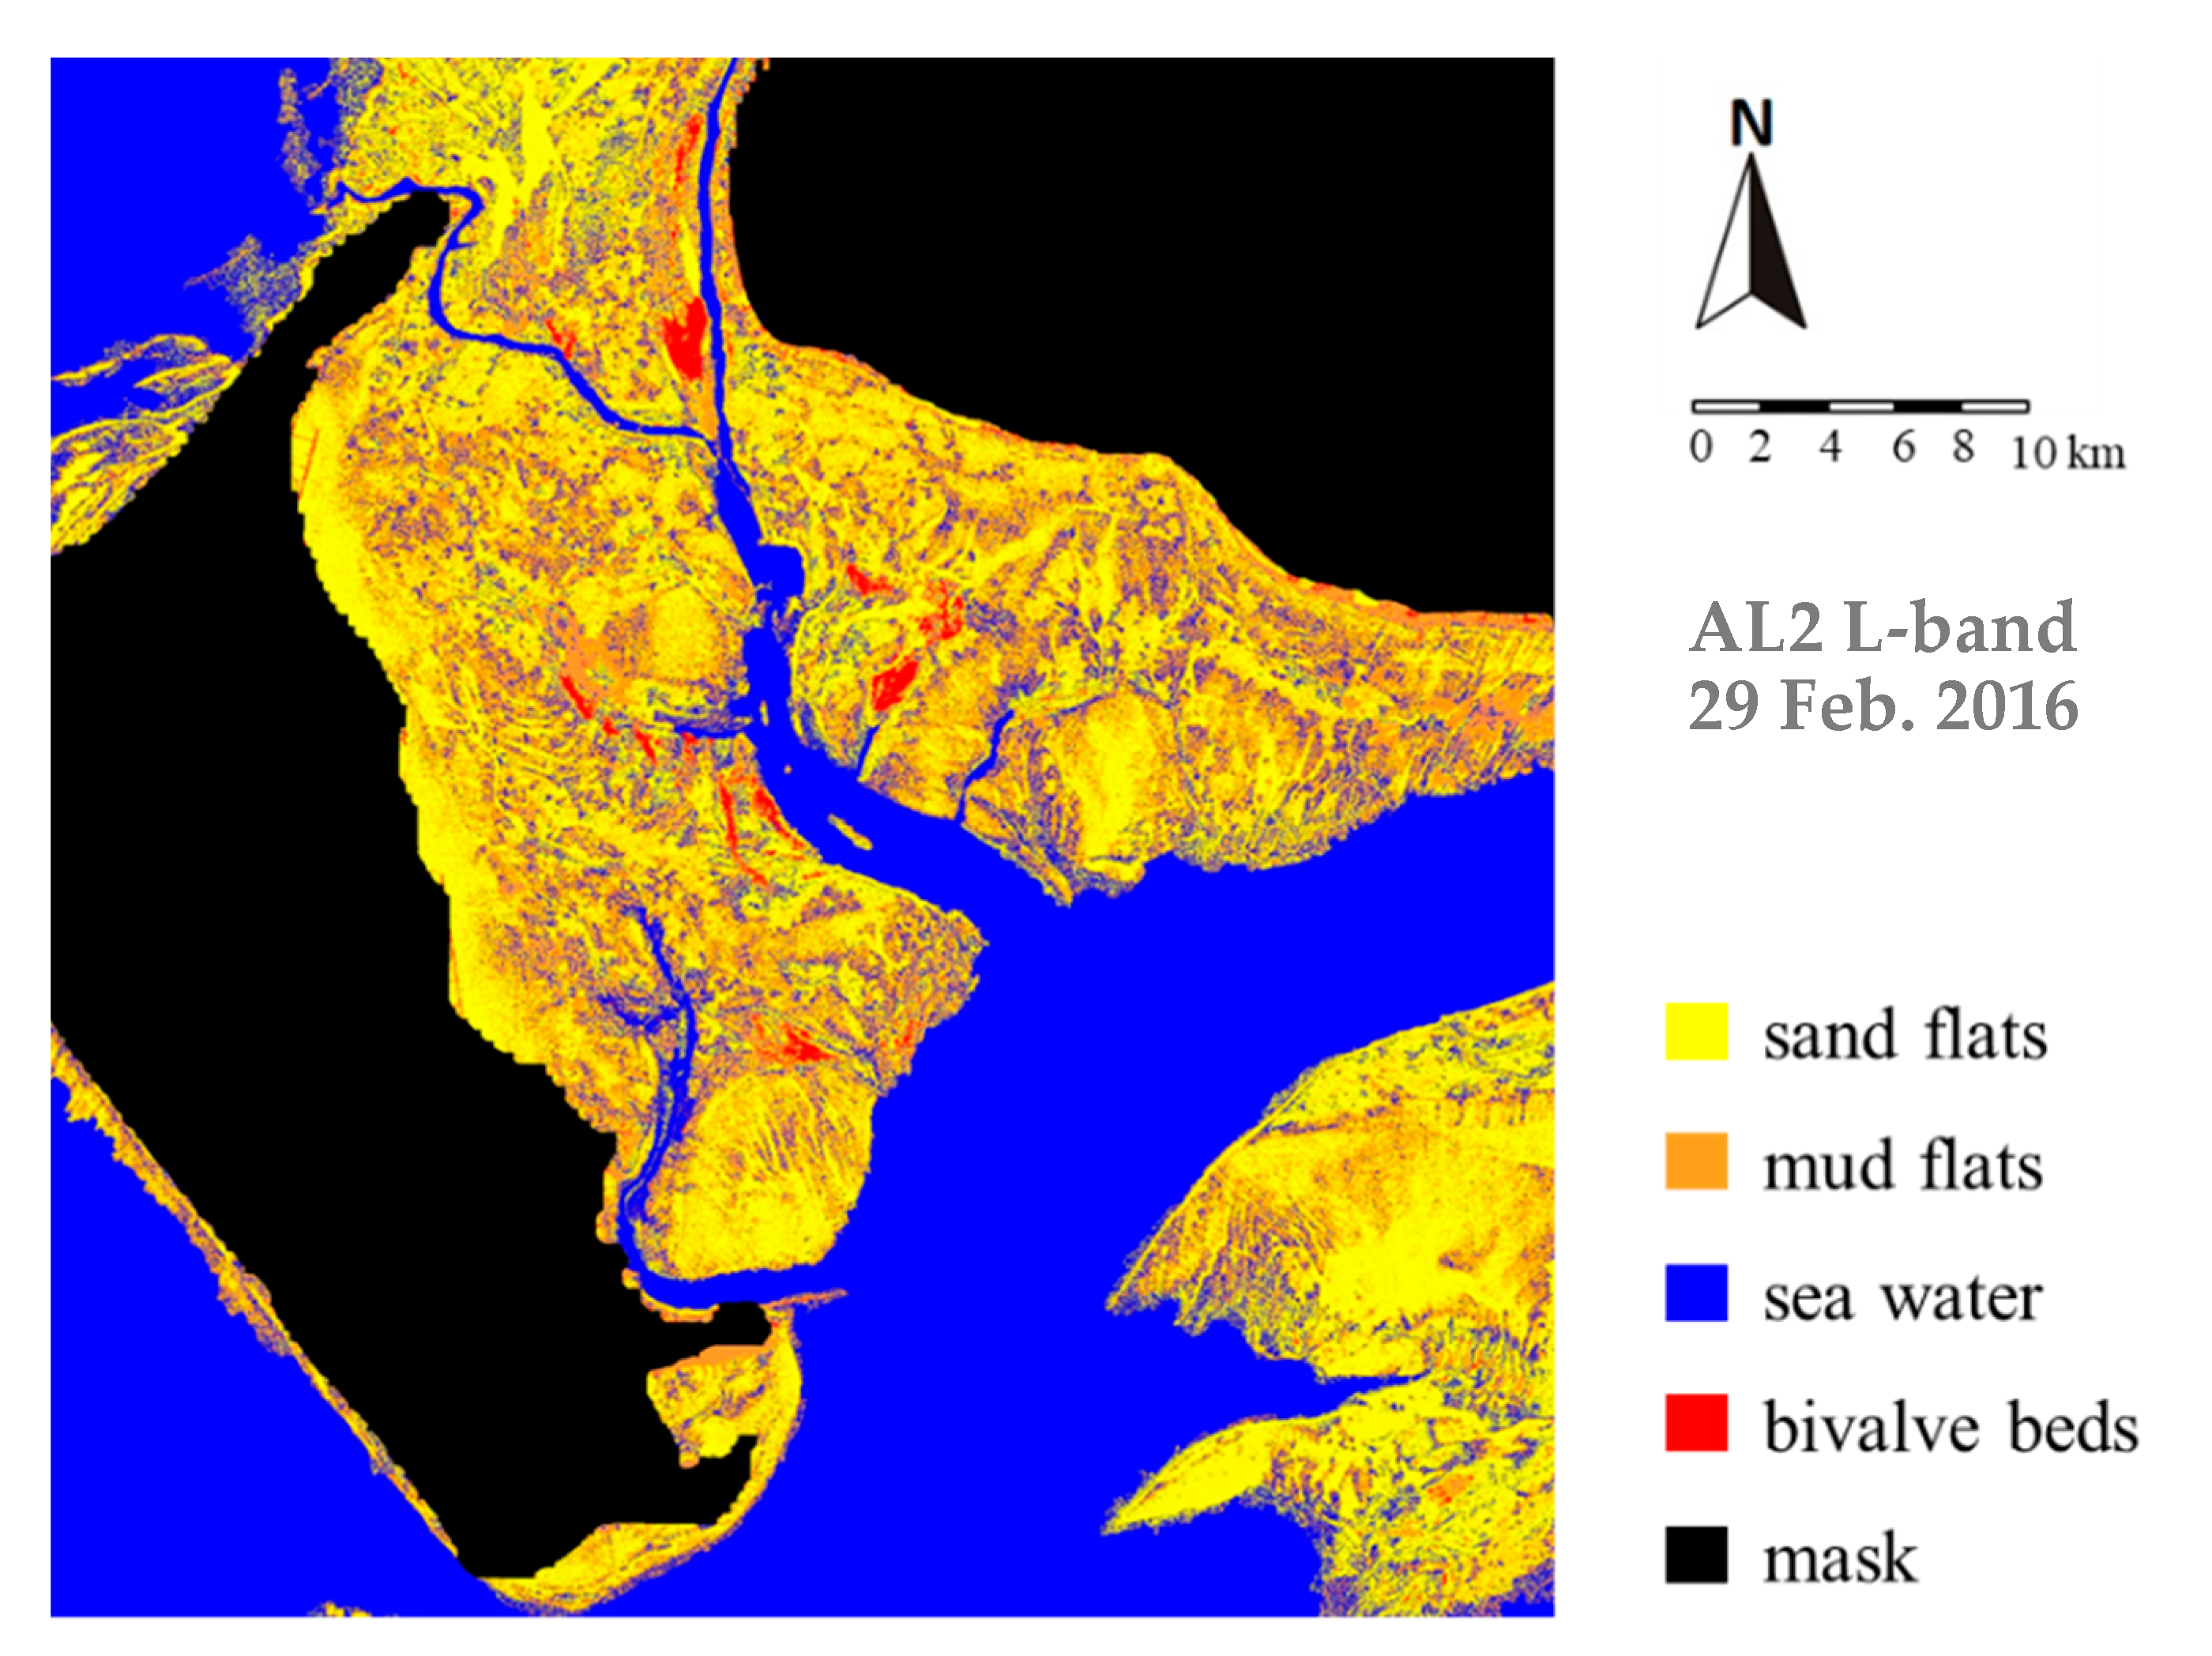
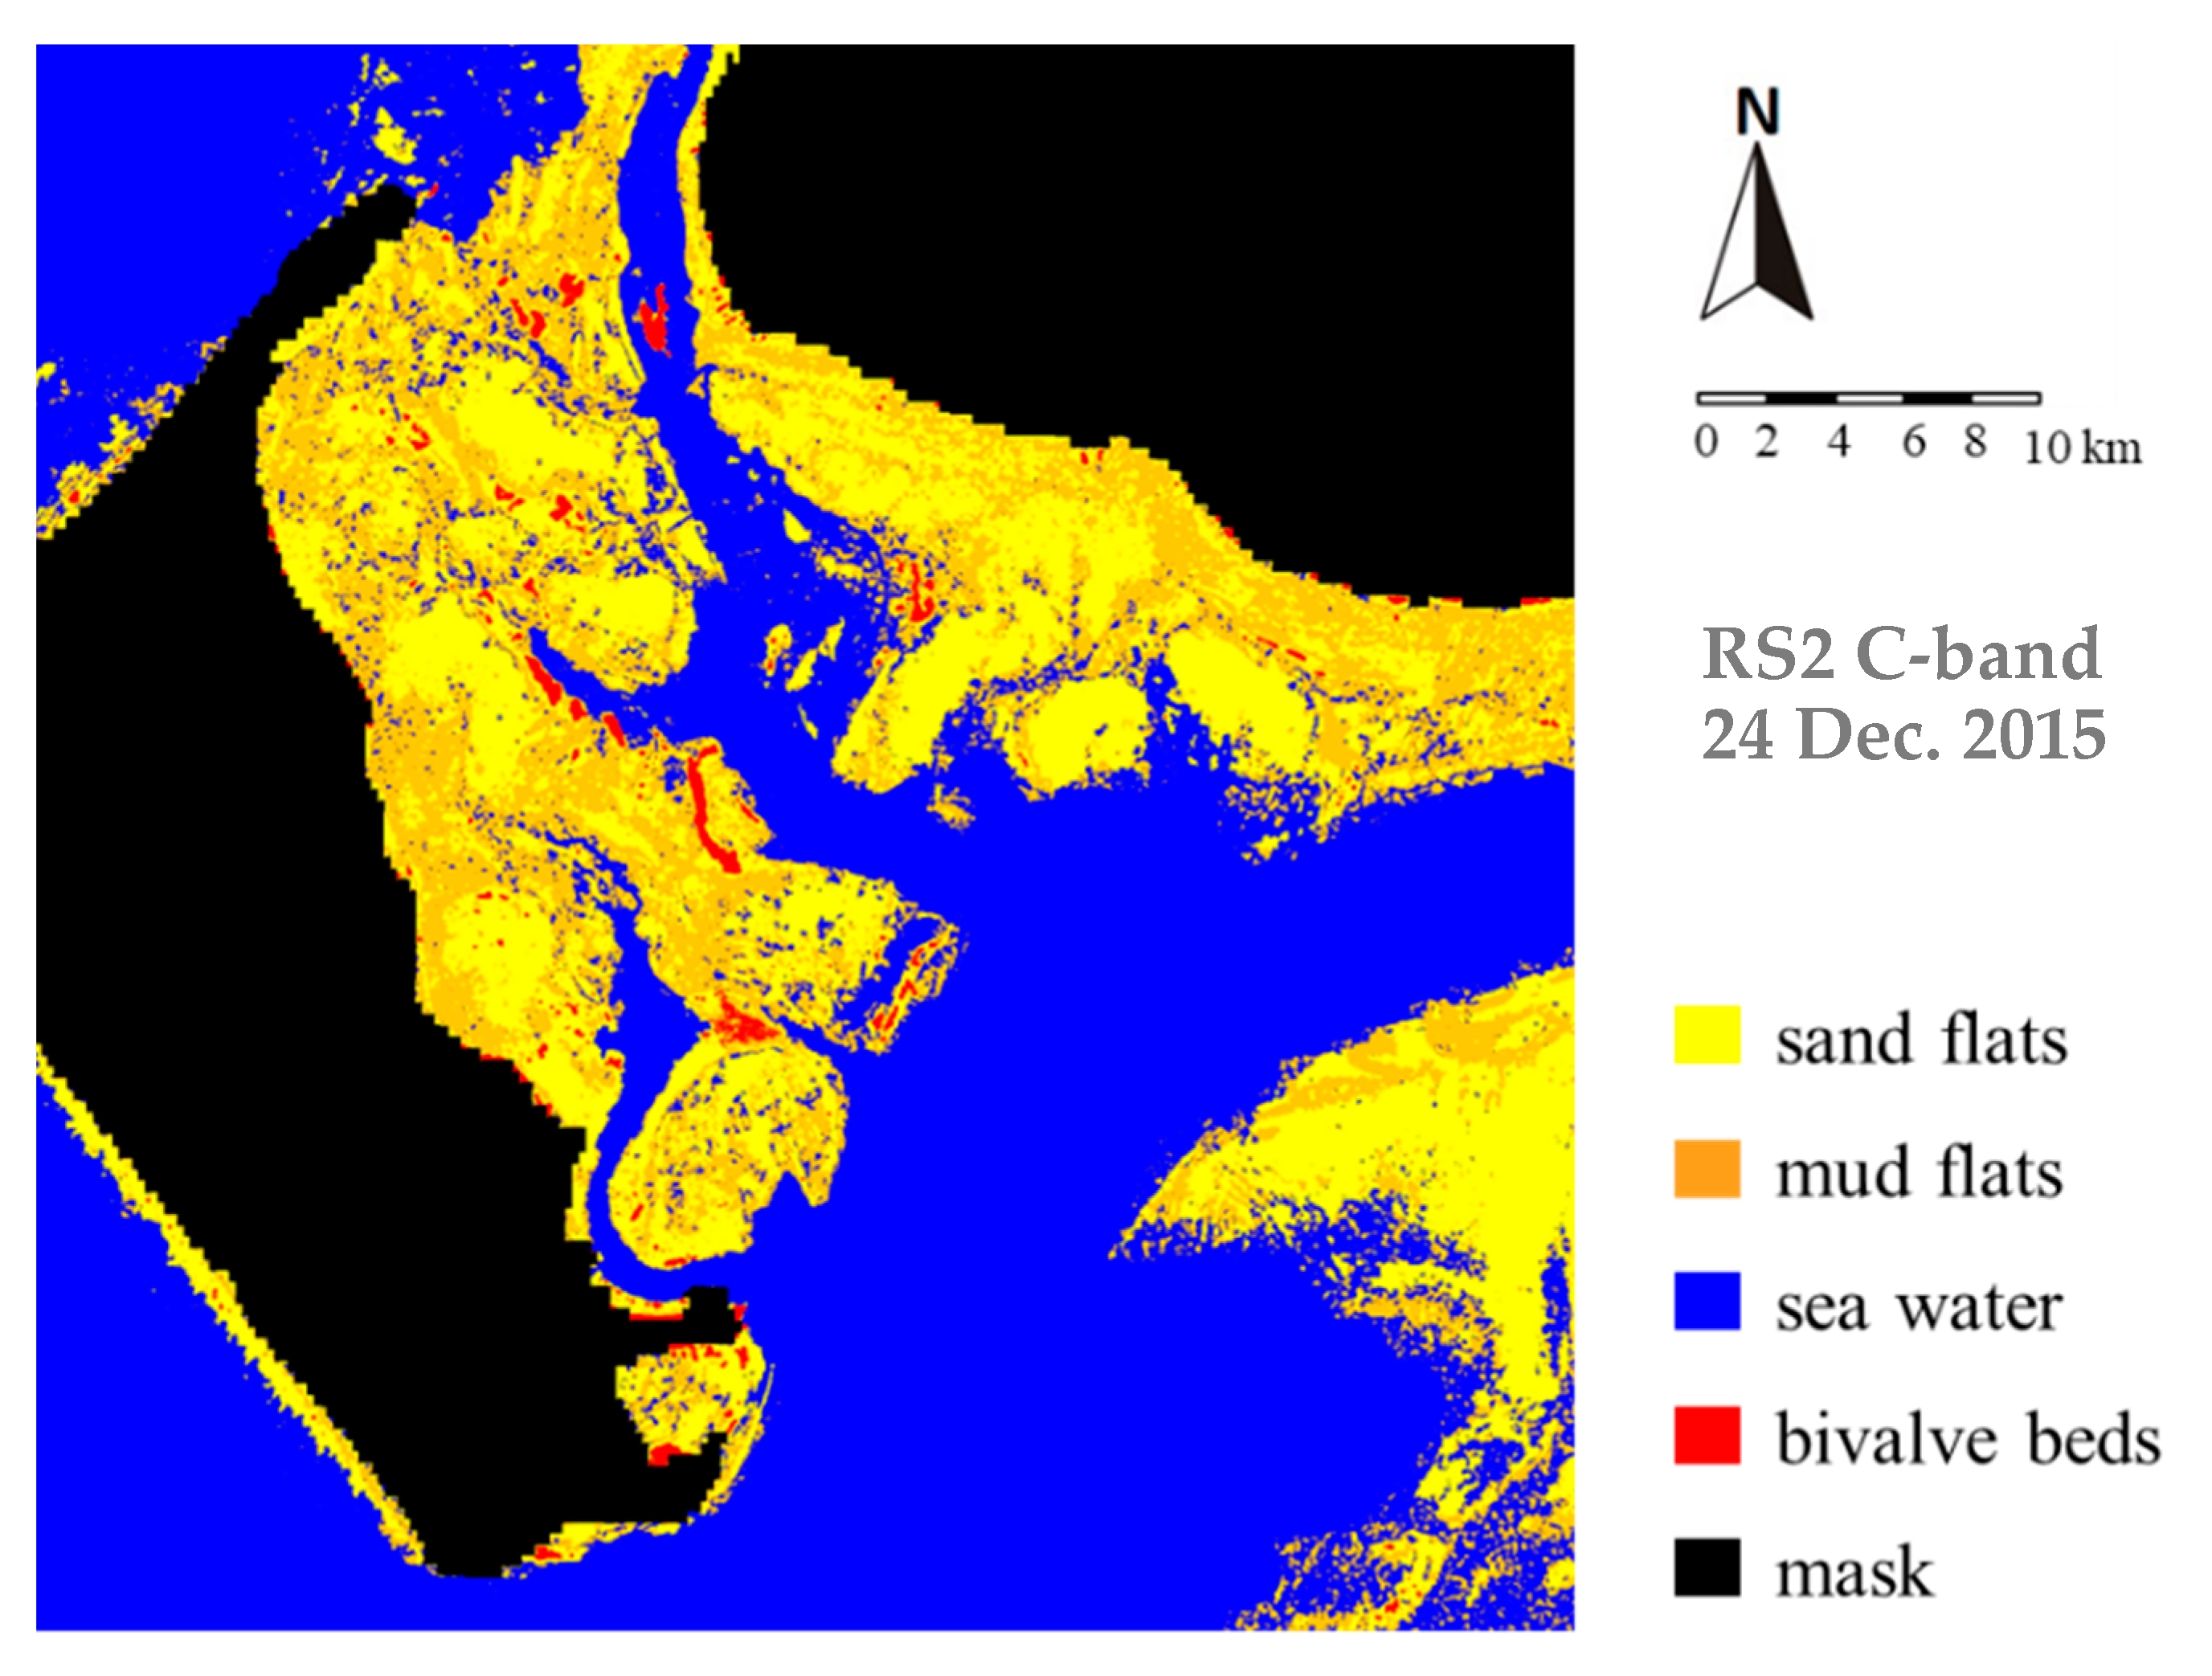
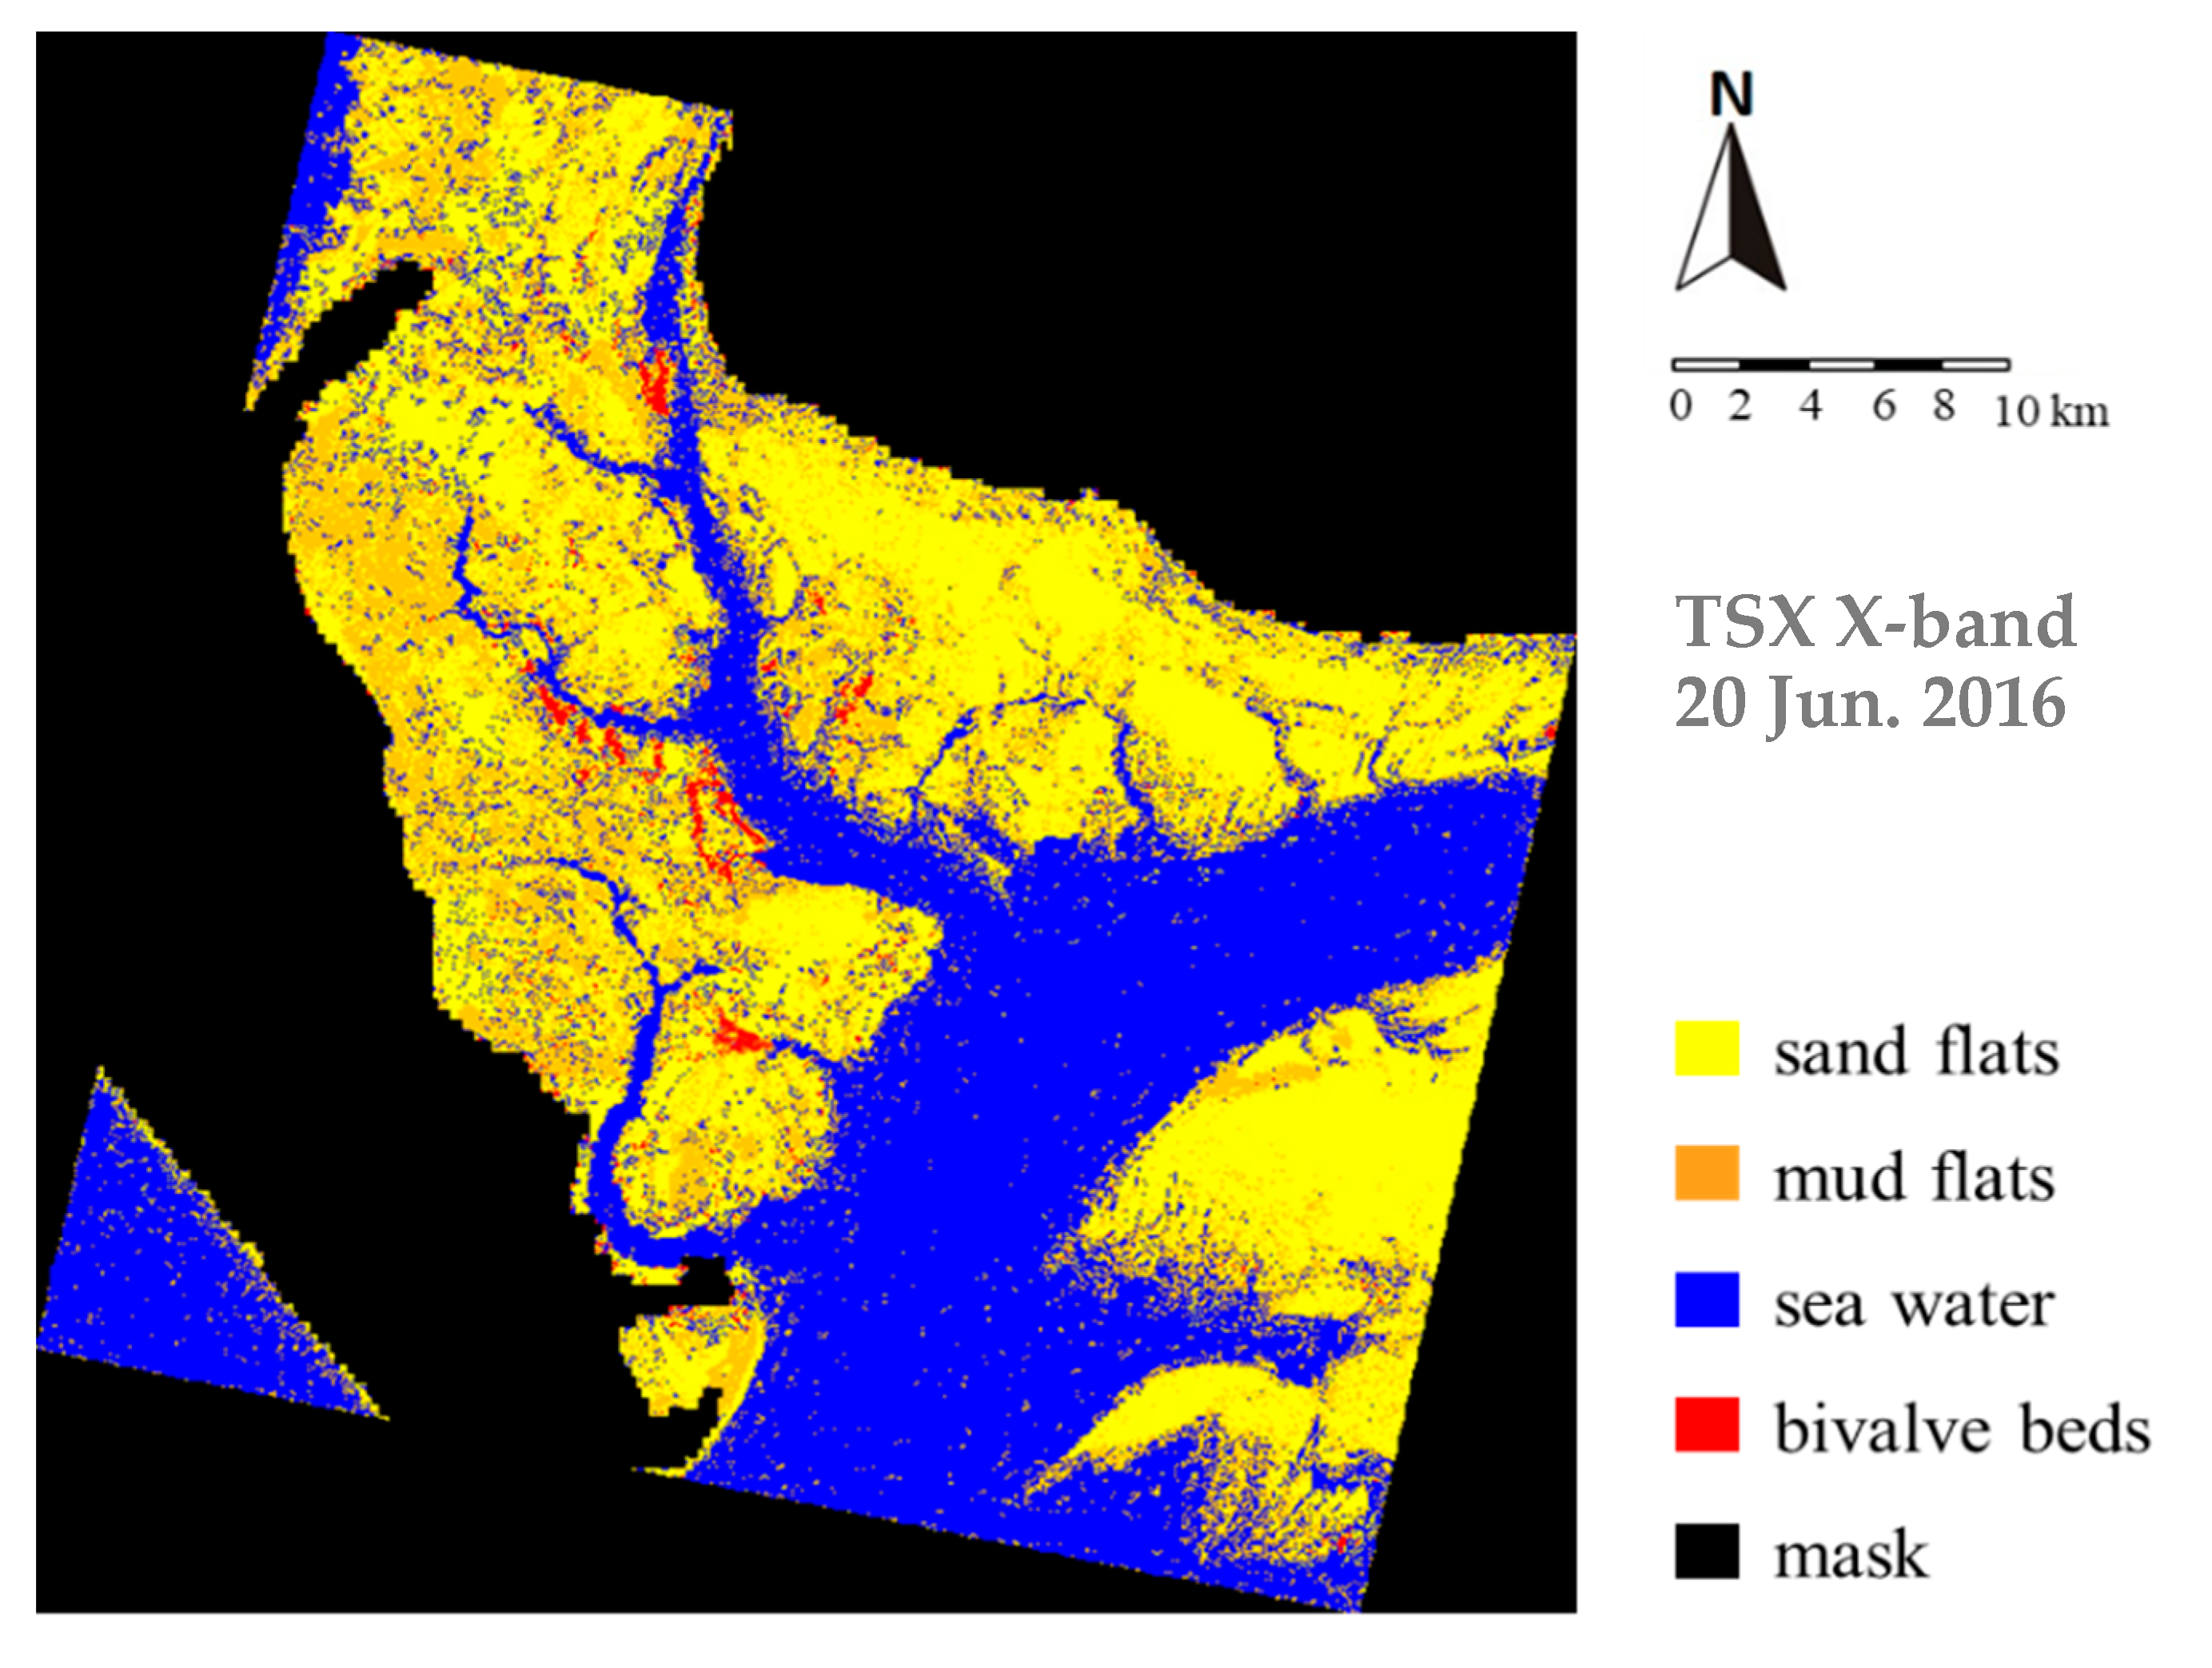
We used AL2 (L-band), RS2 (C-band), and TSX (X-band) PolSAR data of the test site “Amrum”, which were calibrated, speckle-filtered, and co-registered. The classification results based on AL2 L-band quad-pol SAR data, RS2 C-band quad-pol SAR data and TSX dual-co-pol SAR data are shown in Figure 5, Figure 6 and Figure 7, respectively.
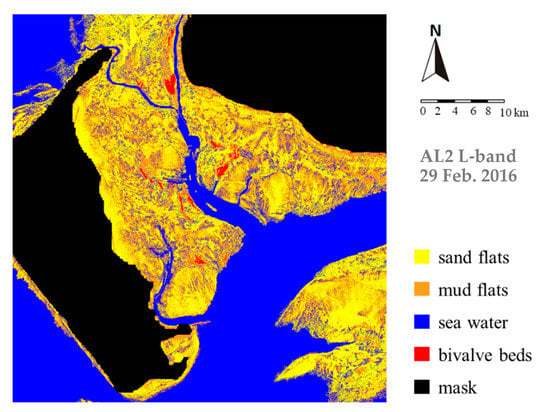
Figure 5.
FCDK-RF classification results based on AL2 L-band quad-pol SAR data acquired on 29 February 2016 at 23:10 UTC, 47 min before the low tide.
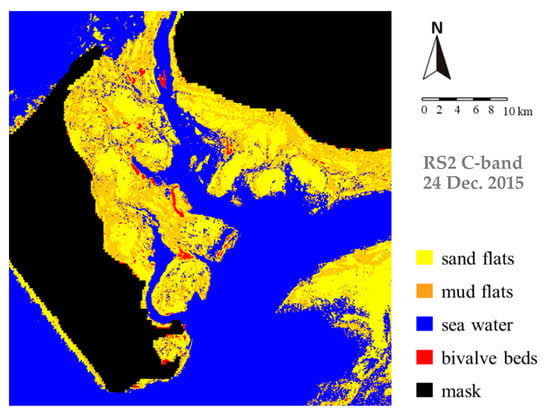
Figure 6.
Same as Figure 5, but for RS2 C-band quad-pol SAR data acquired on 24 December 2015 at 05:43 UTC, 18 min after the low tide.
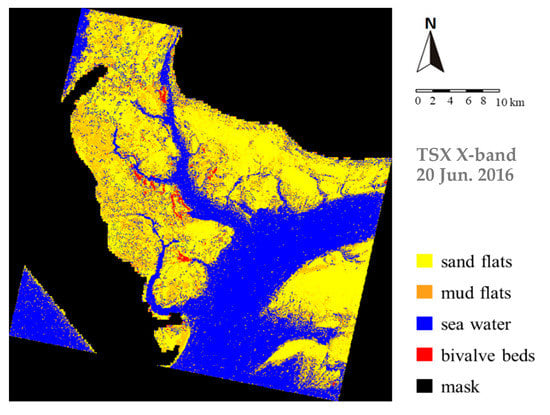
Figure 7.
Same as Figure 5, but for TSX X-band dual-co-pol SAR data acquired on 20 June 2016 at 05:50 UTC, 32 min before the low tide.
The classification results show sandy surface sediments in yellow, mixed (muddy) sediments in light brown, bivalve beds in red, and open water in blue. A comparison with the reference classification (Figure 2) shows good agreements of all results irrespective of the radar band: the spatial distributions of the different sediment types, of bivalve beds, and of the open water coincide well with the validation data. It is obvious that the FCDK feature set is capable of discriminating sand and mud flats, and of identifying bivalve beds. Combined with the RF classifier the FCDK-RF scheme performs well in resolving fine structures on the exposed flats and in reducing the contamination by noise.
We note some differences between our classification results, primarily the different spatial extents of the exposed flats, which we attribute to different environmental conditions (water level and wind speed) at the SAR acquisition times. The water level at the time of the RS2 acquisition was much higher (see Table 1), hence larger parts of the exposed flats stayed submerged. Wind does not have a significant direct influence on the radar backscattering from exposed sediments [5]; however, high southerly or westerly winds may drive more water into the area at flood tide, or may prevent it from running off at ebb tide. This results in higher water levels, hence in wider tidal channels and creeks and in more remnant water on the exposed flats. The latter may be the reason why open sand flats were often misclassified as muddy sediments, when the classification was based on the RS2 data (Figure 6). Additionally, note that Figure 7 shows more noise in areas classified as sea water and on the open flats. We hypothesize that this is due to the finer resolution of the TSX data (1 m × 1 m), causing a slightly higher confusion of sediments and water. However, we also note that the extent of bivalve beds corresponds to that derived from the AL2 and RS2 data.
An accuracy assessment was performed by generating an error matrix that includes individual accuracies for the classifications based on the different radar bands. As validation datasets served the existing classification based on optical data (Figure 2) and the location and spatial extent of bivalve beds recorded in-situ (Figure 3). In total, 8000 validation samples were taken (2000 samples for each class). We conducted assessment for the classification results derived from L-, C-, and X-band SAR data, respectively, and calculated their accuracies using confusion matrix. Table 2 shows as a confusion matrix the Producer’s Accuracy (PA; share of correctly classified surface types), the User’s Accuracy (UA; share of correct classifications) for each surface type and radar sensor, as well as the respective Overall Accuracy (OA) for each sensor, the latter being 86.2% (AL2 L-band), 88.7% (RS2 C-band), and 85.9% (TSX X-band).

Table 2.
Accuracy assessments for the classification results derived from AL2 L-band, RS2 C-band and TSX X-band SAR data. PA: Producer’s Accuracy; UA: User’s Accuracy; OA: Overall Accuracy.
Sandy and mixed sediments show User’s Accuracies of 85.6% and 87.2%, respectively, for the AL2 data, and of 86.2% and 86.7%, respectively, for the RS2 data. Very high User’s Accuracies exceeding 90% were achieved for bivalve beds for all sensors, i.e., irrespective of the radar wavelength, while the respective Producer’s Accuracies decrease slightly with increasing radar wavelength. We attribute this to the roughness scale of the bivalves, which is on the order of a decimeter and which makes the surface of bivalve beds much rougher for X-band microwaves (wavelength 3 cm) than for L-band microwaves (25 cm). That is, the use of shorter radar wavelengths is advantageous over longer radar wavelengths in distinguishing between bare (mixed and sandy) sediments and bivalve beds on exposed intertidal flats. Accuracies for open water strongly depend on the water level, which in turn depends on the very acquisition time, relative to low water, and on the local weather conditions (wind speed and direction, see Table 1).
Table 2 also demonstrates that the lack of cross-pol channels in the TSX (X-band) data results in lower User’s Accuracies for sandy (79.8%) and mixed (80.9%) surfaces. Since we set the cross-pol scatter contribution to zero, thereby losing the VOL component of the FD decomposition, we only obtained the second-order coherency matrix from the CP decomposition. Obviously, slight depolarization on the surface of bare sediments can lead to an erroneous classification, such as sea water, or to a misclassification of the sandy and mixed sediments. However, we also note that the Overall Accuracy for the dual-copol X-band SAR data is almost as high as that for the other sensors (85.9% compared to 86.2% and 88.7%), which shows evidence that bare sediments and habitats are classified at satisfying accuracies, even without post-classification filtering and the exclusion of particular training/validation areas.
5. Discussion
The FCDK-RF classification scheme presented here has proven to be applicable to multi-frequency PolSAR data and shows good potential for the classification of bare sediments and bivalve beds on exposed intertidal flats. Moreover, the additional inclusion of parameters derived from Kennaugh elements can compensate for the loss of information on scattering mechanisms, when only dual-co-pol SAR data are used. Our results also show that the classification scheme previously developed for the use of SAR data on the Chinese coast, in the expanded form presented here, can also be applied to PolSAR data of other intertidal areas worldwide.
In fact, quad-pol SAR data are better suited the discrimination of sediments, as could be expected [9], which is due to the complete FD and CP decomposition and the finer DERD parameter. As shown in Figure 7, dual-co-pol (HH and VV) channels help in discriminating between mud and sand flats, but Table 2 also indicates that additional cross-pol channels improve the classification accuracies. For the monitoring of dynamic intertidal areas, however, dual-co-pol SAR data plays an important role, because of their higher temporal and areal coverage and their higher spatial resolution compared to quad-pol SAR data.
Van Beijma et al. [30] combined dual-frequency (S- and X-band) SAR and optical data for a classification of coastal saltmarsh habitats. They found that the inclusion of SAR data combined with an RF classifier increases the classification accuracy considerably, which corresponds with our results. Moreover, they demonstrated the great potential of FD and CP decompositions to provide more information about backscatter processes [30], which we also found for our FCDK-RF classifier. In addition, we demonstrated that duad-pol SAR data are also suitable for polarimetric analyses of sediments on intertidal flats.
It has to be emphasized that sea-grass meadows were not taken into consideration here, since only the TSX data were acquired during the vegetation period (Table 1). Shimada et al. [31] derived forest/non-forest map based on ALOS PALSAR datasets, using which we checked our study site labelled as water body. The influence of imaging geometry and environmental conditions (wind speed, water level, and vegetation period) on the radar return from sea-grass and bare sediments has already been demonstrated [5]. Further research will include coastal vegetation into the classification scheme.
6. Conclusions
We have introduced the FCDK-RF classification scheme for sediments and habitats on intertidal flats in the German Wadden Sea. The FCDK feature set consists of the Freeman–Durden (F) and Cloude–Pottier (C) decomposition components, the Double-Bounce Eigenvalue Relative Difference (D) parameter, and the new D3 and P4 parameters extracted from elements of the Kennaugh matrix (K). Using fully polarimetric SAR (PolSAR) data acquired at different radar bands (L-band, C-band and X-band), we conducted the classification with a Random Forest (RF) classifier. A comparison with reference data obtained from optical data and field campaigns revealed that the FCDK feature set has good potential of identifying sandy and mixed sediments on intertidal flats, even when they merge into or mix with each other, and of detecting bivalve beds.
We also presented a simplified FCDK-RF scheme for the use of dual-co-pol SAR data. Although the accuracies of the discrimination of mixed and sandy flat surfaces is lower than that gained from the use of quad-pol data, the Overall Accuracy still exceeds 85%. Therefore, we conclude that also dual-co-pol (HH and VV) SAR data can be used in the presented FCDK-RF classification scheme. Moreover, we have shown that the FCDK-RF classification scheme can be applied to SAR data acquired at various radar wavelengths (X-, C-, and L-band).
Author Contributions
W.W. and M.G. conceived and designed the data analyses; W.W. mainly performed the analyses and interpretation of the results, and wrote the first draft of this paper; M.G. provided the satellite data and participated in the analyses and interpretation. K.S. provided the reference classification based on optical data, J.K. provided the in-situ data from their field campaigns. X.Z. and K.F. aided in revising the manuscript. The sequence of authors reflects their level of contribution. All authors have read and agreed to the published version of the manuscript.
Funding
This research was funded by the European Space Agency under contract ITT 9219 Coastal Erosion (Space for Shore), and by the China National Funds for Distinguished Young scientists under grant number 61725105. The APC was funded by the Outstanding Youth Science Foundation under grant number 2017-JCJQ-ZQ-017”.
Institutional Review Board Statement
Not applicable.
Informed Consent Statement
Not applicable.
Data Availability Statement
Not applicable.
Acknowledgments
The authors are grateful to Maria Blümel of the Landesbetrieb für Küstenschutz, Nationalpark und Meeresschutz Schleswig-Holstein (LKN), who provided the tide gauge data, and to Dana King and Felix Lippert, who helped in the download and pre-processing of SAR data. ALOS-2 data were provided by JAXA under contract RA6 3200, and Radarsat-2 and TerraSAR-X data by CSA and DLR, respectively, under contract 5077/OCE0994. The work presented herein was performed in the frame of the joint Sino-European DRAGON 5 Cooperation under ID.57192, Remote Sensing of Changing Coastal Marine Environments (ReSCCoME). Parts of it were supported by the China National Funds for Distinguished Young scientists (grant number 61725105) or received funding from the European Space Agency under contract ITT 9219 Coastal Erosion (Space for Shore).
Conflicts of Interest
The authors declare no conflict of interest.
References
- Nieuwhof, S.; Herman, P.; Dankers, N.; Troost, K.; van der Wal, D. Remote sensing of epibenthic shellfish using Synthetic Aperture Radar satellite imagery. Remote Sens. 2015, 7, 3710–3734. [Google Scholar] [CrossRef]
- Gade, M. A polarimetric radar view at exposed intertidal flats. In Proceedings of the IEEE International Geoscience and Remote Sensing Symposium, Beijing, China, 10–15 July 2016. [Google Scholar]
- Gade, M.; Melchionna, S.; Stelzer, K.; Kohlus, J. Multi-frequency SAR data help improving the monitoring of intertidal flats on the German North Sea coast. Estuar. Coast. Shelf Sci. 2014, 140, 32–42. [Google Scholar] [CrossRef]
- Adolph, W.; Farke, H.; Lehner, S.; Ehlers, M. Remote sensing intertidal flats with TerraSAR-X. A SAR perspective of the structural elements of a tidal basin for monitoring the Wadden Sea. Remote Sens. 2018, 10, 1085. [Google Scholar] [CrossRef]
- Gade, M.; Wang, W.; Kemme, L. On the imaging of exposed intertidal flats by single- and dual-co-polarization Synthetic Aperture Radar. Remote Sens. Environ. 2018, 205, 315–328. [Google Scholar] [CrossRef]
- Müller, G.; Stelzer, K.; Smollich, S.; Gade, M.; Adolph, W.; Melchionna, S.; Kemme, L.; Geißler, J.; Millat, G.; Reimers, H.C. Remotely sensing the German Wadden Sea—A new approach to address national and international environmental legislation. Environ. Monit. Assess. 2016, 188, 595. [Google Scholar] [CrossRef] [PubMed]
- Gade, M.; Melchionna, S. Joint use of multiple Synthetic Aperture Radar imagery for the detection of bivalve beds and morphological changes on intertidal flats. Estuar. Coast. Shelf Sci. 2016, 171, 1–10. [Google Scholar] [CrossRef]
- Gade, M.; Melchionna, S.; Kemme, L. Analyses of multi-year Synthetic Aperture Radar imagery of dry-fallen intertidal flats. In Proceedings of the 36th International Symposium of Remote Sensing and Environment, Berlin, Germany, 11–15 May 2015. [Google Scholar]
- Wang, W.; Yang, X.; Li, X.; Chen, K.; Liu, G.; Li, Z.; Gade, M. A fully polarimetric SAR imagery classification scheme for mud and sand flats in intertidal zones. IEEE Trans. Geosci. Remote Sens. 2017, 55, 1734–1742. [Google Scholar] [CrossRef]
- Zhang, K.; Dong, X.; Liu, Z.; Gao, W.; Hu, Z.; Wu, G. Mapping tidal flats with Landsat 8 images and google earth engine: A case study of the China’s eastern coastal zone circa 2015. Remote Sens. 2019, 11, 924. [Google Scholar] [CrossRef]
- Park, S.E.; Moon, W.M.; Kim, D.J. Estimation of surface roughness parameter in intertidal mudflat using airborne polarimetric SAR data. IEEE Trans. Geosci. Remote Sens. 2009, 47, 1022–1031. [Google Scholar] [CrossRef]
- Omari, K.; Chenier, R.; Touzi, R.; Sagram, M. Investigation of C-band SAR polarimetry for mapping a high-tidal coastal environment in northern Canada. Remote Sens. 2020, 12, 1941. [Google Scholar] [CrossRef]
- Gade, M.; Alpers, W.; Melsheimer, C.; Tanck, G. Classification of sediments on exposed tidal flats in the German Bight using multi-frequency radar data. Remote Sens. Environ. 2008, 112, 1603–1613. [Google Scholar] [CrossRef]
- Geng, X.; Li, X.; Velotto, D.; Chen, K. Study of the polarimetric characteristics of mud flats in an intertidal zone using C-and X-band spaceborne SAR data. Remote Sens. Environ. 2016, 176, 56–68. [Google Scholar] [CrossRef]
- Chen, Y.; He, X.; Wang, J. Classification of coastal wetlands in eastern China using polarimetric SAR data. Arab. J. Geosci. 2015, 8, 1–9. [Google Scholar] [CrossRef]
- Banks, S.N.; King, D.J.; Merzouki, A.; Duffe, J. Assessing Radarsat-2 for mapping shoreline cleanup and assessment technique (SCAT) classes in the Canadian Arctic. Can. J. Remote Sens. 2014, 40, 243–267. [Google Scholar] [CrossRef]
- Choe, B.H.; Kim, D.J.; Hwang, J.H.; Oh, Y.; Moon, W.M. Detection of oyster habitat in tidal flats using multi-frequency polarimetric SAR data. Estuar. Coast. Shelf Sci. 2012, 97, 28–37. [Google Scholar] [CrossRef]
- Cheng, T.Y.; Yamaguchi, Y.; Chen, K.; Lee, J.S. Sandbank and oyster farm monitoring with multi-temporal polarimetric SAR data using four-component scattering power decomposition. IEICE Trans. Commun. 2013, 96, 2573–2579. [Google Scholar] [CrossRef]
- Wang, W.; Gade, M.; Yang, X. Detection of bivalve beds on exposed intertidal flats using polarimetric SAR indicators. Remote Sens. 2017, 9, 1047. [Google Scholar] [CrossRef]
- Regniers, O.; Bombrun, L.; Ilea, I.; Lafon, V.; Germain, C. Classification of oyster habitats by combining wavelet-based texture features and polarimetric SAR descriptors. In Proceedings of the IEEE International Geoscience and Remote Sensing Symposium, Milan, Italy, 12–17 November 2015. [Google Scholar]
- Nehls, G.; Büttger, H. Miesmuschelmonitoring 1998–2005 im Nationalpark Schleswig-Holstenisches Wattenmeer. Ein Projekt im Rahmen des Trilateral Monitoring and Assessment Program (TMAP); Internal Report; National Park Authority of the Schleswig-Holstein Wadden Sea: Tönning, Germany, 2006. [Google Scholar]
- Büttger, H.; Nehls, G.; Stoddard, P. The history of intertidal blue mussel beds in the North Frisian Wadden Sea in the 20th century: Can we define reference conditions for conservation targets by analysing aerial photographs? J. Sea Res. 2014, 87, 91–102. [Google Scholar] [CrossRef]
- Schmitt, A.; Brisco, B. Wetland monitoring using the curvelet-based change detection method on polarimetric SAR imagery. Water 2013, 5, 1036–1051. [Google Scholar] [CrossRef]
- Schmitt, A.; Wendleder, A.; Hinz, S. The Kennaugh element framework for multi-scale, multi-polarized, multi-temporal and multi-frequency SAR image preparation. ISPRS J. Photogramm. Remote Sens. 2015, 102, 122–139. [Google Scholar] [CrossRef]
- Schmitt, A.; Wendleder, A.; Murnaghan, K.; Brisco, B.; Poncos, V. Multi-sensor wetland mapping over the Peace Athabasca Delta. In Proceedings of the European Conference on Synthetic Aperture Radar, Hamburg, Germany, 6–9 June 2016. [Google Scholar]
- Freeman, A.; Durden, S.L. A three-component scattering model for polarimetric SAR data. IEEE Trans. Geosci. Remote Sens. 1998, 36, 963–973. [Google Scholar] [CrossRef]
- Cloude, S.R.; Pottier, E. A review of target decomposition theorems in radar polarimetry. IEEE Trans. Geosci. Remote Sens. 1996, 34, 498–518. [Google Scholar] [CrossRef]
- Allain, S.; Ferro-Famil, L.; Pottier, E. Two novel surface model based inversion algorithms using multi-frequency PolSAR data. In Proceedings of the IEEE Geoscience and Remote Sensing, Anchorage, AK, USA, 20–24 September 2004. [Google Scholar]
- Biau, G. Analysis of a random forests model. J. Mach. Learn. Res. 2012, 13, 1063–1095. [Google Scholar]
- Van Beijma, S.; Comber, A.; Lamb, A. Random forest classification of salt marsh vegetation habitats using quad-polarimetric airborne SAR, elevation and optical RS data. Remote Sens. Environ. 2014, 149, 118–129. [Google Scholar] [CrossRef]
- Shimada, M.; Itoh, T.; Motooka, T.; Watanabe, M.; Lucas, R. New global forest/non-forest maps from ALOS PALSAR data (2007–2010). Remote Sens. Environ. 2014, 155, 13–31. [Google Scholar] [CrossRef]
Publisher’s Note: MDPI stays neutral with regard to jurisdictional claims in published maps and institutional affiliations. |
© 2021 by the authors. Licensee MDPI, Basel, Switzerland. This article is an open access article distributed under the terms and conditions of the Creative Commons Attribution (CC BY) license (http://creativecommons.org/licenses/by/4.0/).

