Abstract
Burn severity is a key component of fire regimes and is critical for quantifying fires’ impacts on key ecological processes. The spatial and temporal distribution characteristics of forest burn severity are closely related to its environmental drivers prior to the fire occurrence. The temperate coniferous forest of northern China is an important part of China’s forest resources and has suffered frequent forest fires in recent years. However, the understanding of environmental drivers controlling burn severity in this fire-prone region is still limited. To fill the gap, spatial pattern metrics including pre-fire fuel variables (tree canopy cover (TCC), normalized difference vegetation index (NDVI), and live fuel moisture content (LFMC)), topographic variables (elevation, slope, and topographic radiation aspect index (TRASP)), and weather variables (relative humidity, maximum air temperature, cumulative precipitation, and maximum wind speed) were correlated with a remote sensing-derived burn severity index, the composite burn index (CBI). A random forest (RF) machine learning algorithm was applied to reveal the relative importance of the environmental drivers mentioned above to burn severity for a fire. The model achieved CBI prediction accuracy with a correlation coefficient (R) equal to 0.76, root mean square error (RMSE) equal to 0.16, and fitting line slope equal to 0.64. The results showed that burn severity was mostly influenced by flammable live fuels and LFMC. The elevation was the most important topographic driver, and meteorological variables had no obvious effect on burn severity. Our findings suggest that in addition to conducting strategic fuel reduction management activities, planning the landscapes with fire-resistant plants with higher LFMC when possible (e.g., “Green firebreaks”) is also indispensable for lowering the burn severity caused by wildfires in the temperate coniferous forests of northern China.
1. Introduction
Wildfire is one of the primary natural disturbances for forest ecosystem succession and stands composition, as well as the exchange of carbon, water, and energy between the land and atmosphere [1,2,3,4]. Wildfires generally exhibit high inter- and intra-fire heterogeneity and burn with varying degrees of severity depending on the fuel load, moisture content, topography, and climate conditions [5,6,7,8].
There are generally three concepts on how to describe the severity of forest fires and their impact on the environment: fire intensity, fire severity, and burn severity. Fire intensity describes the rate of energy release by the physical process of the combustion of biomass [9]. Fire severity is a more comprehensive concept than fire intensity, which is mainly used to describe how fire intensity affects ecosystems [10]. The assessment of fire severity is mainly based on the loss of aboveground or underground biomass caused by fire, the consumption of the tree crown, and changes to soil characteristics. Burn severity has been defined as the changes from the pre-fire to post-fire environment which is restricted to the vegetation and soil [11], and is often used interchangeably with fire severity. Remotely sensed data can directly obtain the characteristics of vegetation and soil. Exploring the relationship between different environmental drivers and burn severity is fundamental for developing forest management strategies [12,13,14,15].
The relationship between burn severity and its environmental drivers is not uniforml; it is caused by the complex interaction among physical, weather, and vegetation variables [16,17,18]. Some studies concluded that topographic variables are relatively more important for high burn severity than vegetation and meteorological variables since topographic variables influence the fire behavior, fuel moisture, water balances, vegetation distribution, and productivity [16,19,20,21,22,23]. The influence of topography is mainly manifested in elevation, slope, and aspect. A sunny surface has stronger light, higher temperature, and higher evapotranspiration, so the vegetation is relatively more flammable and drier, which leads to faster fire spread. In contrast, the humidity of a shady surface is higher than that of a sunny surface, and the moisture content of vegetation is higher than that of the sunny aspect, so it is not conducive to fire spread [20,21]. In addition, the water loss in steep areas is faster than that in flat areas, and the water content of vegetation is, therefore, generally lower in steep areas. Moreover, steep slopes also facilitate fire spread because of the greater radiant convective heating of upslope fuels related to the angle of flames and the direction of convective currents [19]. However, some studies concluded that the fuel variables are the most important factor, while the topographic factor is less important [4,6,16,24,25,26]. Wildland fuels are defined as all flammable vegetation materials that can be burnt, including living and dead fuel [27]. All vegetation can be considered as fuel, and the most important factor controlling flammability and consumption is their moisture content [27,28,29,30]. Therefore, fuel has a strong effect on fire behavior [29,30,31,32,33,34]. Meteorological factors (temperature, humidity, precipitation, wind speed, wind direction, etc.) are important factors affecting the burn severity as reported in previous literature [17,18,19,24], since these factors will affect the degree of dryness and wetness of fuels in the forest ecosystem, and further affect the flammability. Meteorological factors have both direct and indirect effects on wildfires, which determine how and when fires burn and play an important role in the behavior of a wildfire [27]. Generally, there is a positive correlation between air temperature and forest fire. The higher the temperature is, the higher the possibility of fire and severe fire is. There is a negative correlation between humidity and forest fire. More precipitation generally results in a higher water content of the vegetation and reduces the possibility of fire occurrence. Wind plays a dual role in the occurrence of fire, as the wind speed will contribute to the burning of flammable fuels and the spread of fire, whereas when the wind speed is too high, it may buffer the effects of fire through mechanisms such as disrupting fuel continuity [35]. Furthermore, the ways in which meteorological factors affect burn severity may vary among different fires, even in a single fire [36].
Previous studies analyzing the relationships between burn severity and its environmental drivers generally focused on fire-prone regions such as the Mediterranean pine forest ecosystems [16,17,37,38], Australian eucalyptus forests [39,40,41,42,43], Canadian boreal forests [4,44,45] and western US mixed conifer forests [6,18,24,46]. Nevertheless, the understanding of environmental drivers controlling burn severity in the temperate coniferous forest of northern China is still limited. The temperate coniferous forest is an important part of China’s forest resources, which is mainly distributed in the plains, hills, or low mountainous areas of the warm temperate zone in China. The characteristic species of temperate coniferous forest are in the genera Pinus and Platycladus, and the main vegetation communities are Pinus tabulaeformis, Pinus densiflora, and Platycladus orientalis forests [47]. The warm temperate zone is cold and dry in winter (December to February), which leads to the continuous accumulation of fuels in the temperate coniferous forest ecosystem. With the rise of temperature in spring (March to May), the fuel moisture content decreases, and the risk of fire increases. Therefore, most temperate coniferous forest fires of northern China occur in spring [48]. The factors causing temperate coniferous forest fires can be divided into environmental factors and human factors. Environmental factors include vegetation, topographic, and meteorological variables, which are the basic drivers for forest fires; human factors mainly include fire source and forest management strategy, which are the inducing factors of forest fires. With the increasing awareness of fire prevention, the number of fires caused by human factors has decreased. However, because the forest management strategy is still primitive, forest fires are still one of the greatest threats to forest resources in these regions. Understanding burn severity responses to environmental drivers in the temperate coniferous forest ecosystem is critical for designing and implementing forest management strategies [49].
In this study, we aimed to identify the environmental factors driving burn severity in the temperate coniferous forest of northern China using a random forest (RF) algorithm. Specifically, our objectives were (i) to determine the most important environmental driver for the burn severity of northern China temperate coniferous forest fires; (ii) to analyze the key environmental driver of burn severity under different flammability scenarios; and (iii) to provide decision-making suggestions and references for reducing burn severity and future forest management.
2. Materials and Methods
2.1. Study Area
The study area is located in Qinyuan county in the warm temperate zone of northern China, extending from 111°58′30″ to 112°32′30″E, and from 36°20′20″ to 37°00′42″N (Figure 1). The climate of the study area is cold and dry in winter, and hot and rainy in summer. The study area belongs to the warm temperate continental monsoon climate, which is the marginal area affected by the southeast monsoons and southwest monsoons in China. Therefore, the water sources in the study area mainly include the southeast and southwest channels. In winter, the water source is mainly affected by the northeast monsoons and northwest monsoons from the mainland of Asia. The air is dry and the water vapor content is low, so it is difficult to form precipitation. When the rainy season starts, the delay or weakening of either of the two water channels will cause drought in the study area. In general, drought may occur in the study area about every 2–3 years, from March to October [50]. The annual average rainfall is 656.7 mm, the annual average relative humidity is 65%, and the annual average temperature is 8.7 °C. Generally, the maximum precipitation and minimum precipitation are recorded from July to September and November to March, respectively. The study area is mountainous with intense relief with altitudes ranging from 1020 to 1639 m. The overstory vegetation community of the study area is dominated by Pinus tabuliformis, the middle vegetation layer is dominated by low Quercus acutissima and Rosa xanthine, and the grass over the soil surface is dominated by Gramineous weeds (e.g., Poa annua and Digitaria sanguinalis). Pinus tabuliformis is a unique tree species of China. Its tree height can reach more than 25 m, the diameter at breast height can reach more than 1 m, and the bark is a grayish brown or reddish brown, which generally cracks into irregular and thick scaly pieces. Pinus tabuliformis is flammable and is mostly in pure stands. Continuous dryness and low precipitation in winter reduce the moisture content of vegetation in the study area, resulting in triggering the self-protection mechanism of Pinus tabuliformis. These mechanisms are in place to reduce water evaporation by secreting pine oil. In this case, once encountering a fire source, deflagration will occur, which is difficult to extinguish. Under these conditions, a fire was triggered by the aging of power lines in Qinyuan country on 29 March 2019, and the fire burned approximately 167.88 km2.
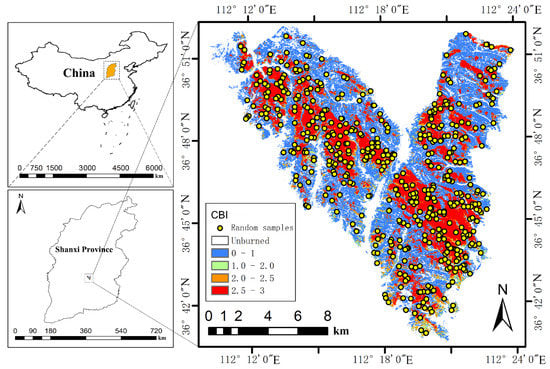
Figure 1.
Location of the study area and the burn severity sample plots used in this study. The right map is the spatial distribution map of burn severity, represented by CBI retrieved from remote sensing data and radiative transfer model inversion [52]. The CBI was stratified into 4 categories from 0 to 3, and 500 random samples with CBI greater than 1 were selected to analyze the relationship between burn severity and environmental drivers.
2.2. Burn Severity Data and Random Sample Selection
The composite burn index (CBI) is a common ground-based severity index that is obtained by averaging the scores assigned to several variables of five vertical strata (soil background, understory, two midstories, and overstory) [51]. This index has continuous values ranging from 0 (unburned) to 3 (completely burned). According to the burning status of soil and different vegetation strata, the burn severity can be divided into four categories: low (CBI < 1), moderate (1 ≤ CBI < 2), moderate to high (2 ≤ CBI < 2.5), and high (2.5 ≤ CBI). For low burn severity level, only the lower grassland is affected, and the middle and upper vegetation is almost unburned. For moderate burn severity level, there is a total consumption of the organic matter on the soil, and the middle vegetation has scorched leaves. For moderate to high burn severity level, there is a total consumption of the organic matter on the soil and middle vegetation, and the overstory has scorched leaves. For high burn severity level, most of the overstory is scorched and the substratum can be charcoal or ash depending on the burn efficiency [11,51]. The CBI data (Figure 1) used in this study were obtained based on the algorithm proposed by Yin et al. in 2020 [52], which was estimated by introducing tree canopy cover (TCC) into a coupled radiative transfer model. Through the field measured CBI and landscape photos, we verified the quantitative (R2 = 0.92, RMSE = 0.2) and qualitative CBI estimation accuracy, which demonstrated good performance [52].
In post-fire management, the location and characteristics of high-level burn severity are generally of greater interest than areas of low burn severity [53]. Areas with CBI lower than 1 will quickly recover to the pre-fire status after the rainy season. Consequently, we randomly selected 500 samples in areas greater than 1 on the spatial distribution map of CBI to analyze the relationship of burn severity and environmental drivers (Figure 1). The selected CBI samples are divided into three categories [38]: moderate (1–2), moderate to high (2–2.5), and high (>2.5). The frequency distribution histogram of the selected samples is shown in Figure 2.
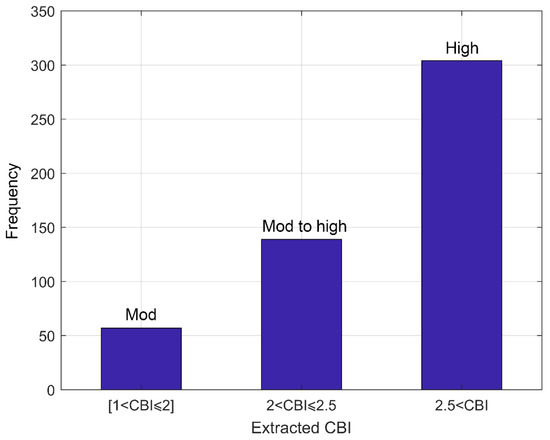
Figure 2.
Frequency of the selected sample plots. The observed CBI from the spatial distribution map is divided into moderate, moderate to high, and high levels. The high burn severity level prevails in the study area.
2.3. Environmental Variables
The environmental drivers of burn severity mainly include fuel, topographic, and meteorological variables. In this study, we pre-selected these three types of environmental drivers, including 12 specific indicators (Table 1).

Table 1.
The pre-selected environmental drivers to predict CBI. The type and abbreviation of the variables, data source, and range of the variables are all counted in the table.
2.3.1. Pre-Fire Fuel Variables
Fuel variables mainly include TCC, normalized difference vegetation index (NDVI), live fuel moisture content (LFMC), leaf area index (LAI), and normalized difference water index (NDWI). TCC has been proven to have a strong correlation with aboveground biomass [54,55], so it is used as a proxy of the amount of flammable live fuels. NDVI is sensitive to vegetation chlorophyll content and has been widely used to quantify the net primary production of vegetation [56,57,58,59]. LFMC is commonly defined as the amount of water per dry mass of fuel [60], which is one of the primary variables affecting the ignition and spread of wildfire [33]. Although LFMC has been widely used in forest fire risk early warning [29,33,61,62], there are few studies that analyze the relationship between LFMC and burn severity. LAI was selected because it is one of the important variables to characterize vegetation canopy structure [63,64]. NDWI is an index related to vegetation water content [65].
The TCC data used in this study were extracted from the Landsat Vegetation Continuous Fields (VCF) TCC product [66]. The Landsat VCF TCC product contains estimates of the TCC in each 30 m pixel covered by woody vegetation greater than 5 m in height [66]. The product is derived from all seven bands of the Landsat 5 Thematic Mapper (TM) and/or Landsat 7 Enhanced Thematic Mapper Plus (ETM+) by rescaling the 250 m moderate-resolution imaging spectroradiometer (MODIS) VCF TCC layer. The dataset was last updated in 2015; therefore, the TCC layer of 2015 was used to describe the TCC level before the fire in this study. The forests in the study area are natural forests with little human intervention. Moreover, by comparing the field photos, it was found that the Landsat VCF product was consistent with the actual TCC in the study area. The CBI estimation results in our previous study [49] also showed that the spectral confusion error was mitigated by considering the variation of 2015 Landsat VCF TCC in the process of model simulation and inversion. Therefore, the TCC layer in 2015 can be used to represent the situation before the fire.
The NDVI, NDWI, LFMC, and LAI were extracted from the Sentinel-2A MSI satellite data (20 m spatial resolution) acquired on 12 March 2019. This is the image closest to the time of fire ignition and with the least cloud coverage. The Sentinel-2A MSI data used in this study were downloaded from the Copernicus Open Access Hub (https://scihub.copernicus.eu/, last accessed on 18 October 2021). Before computing the vegetation indices, Sentinel-2A MSI data were converted from top-of-atmosphere (TOA) reflectance to bottom-of-atmosphere (BOA) reflectance using the official atmospheric correction model, Sen2Cor (version 2.3.1) [67,68,69,70].
NDVI is a normalized ratio of the near-infrared (NIR) and the red bands (Equation (1)). The ρNIR and ρRED represent the reflectance of the NIR and red bands, respectively.
NDWI is a normalized ratio of the near-infrared (NIR) and the Shortwave infrared (SWIR) bands (Equation (2)). The ρNIR and ρSWIR represent the reflectance of the NIR and SWIR bands, respectively.
LFMC and LAI of the study area were estimated by radiative transfer model retrieval, following the method of Yebra et al. [33] adapted to Sentinel-2. The PROGeoSail model was firstly “forward” applied to simulate reflectance and transmittance at the leaf and canopy levels to generate the look-up table. In the backward inversion process, the spectral angle mapper (SAM) classification algorithm was used as the merit function to simultaneously estimate LFMC and LAI. All except the blue band, and the normalized difference infrared index (NDII) index [71], were used as input vectors to calculate the spectral angle. The blue band was discarded because LFMC and LAI have no effect in blue wavelengths [72]. The NDII was also included as one of the input vectors to calculate the spectral angle. The NDII was calculated as the normalized difference between the short-wave infrared (band 11) and near-infrared (band 8a) bands of the Sentinel 2A MSI data. In order to ensure consistent spatial resolution, all data were resampled to 20 m.
2.3.2. Topographic Variables
Topographic variables including elevation, slope, and the topographic radiation aspect index (TRASP) [73] were derived from the Advanced Spaceborne Thermal Emission and Reflection Radiometer (ASTER) Global Digital Elevation Model (GDEM) version 2 (V2). The ASTER GDEM V2 data were downloaded from the website of the United States Geological Survey (https://earthexplorer.usgs.gov/, last accessed on 18 October 2021) with a 1 arc-second (approximately 30 m at the equator) grid and projected to the 1984 World Geodetic System (WGS84). TRASP is between 0 and 1, which indicates the amount of solar radiation received, with 1 representing 30° south by west and 0 representing 30° north by east (Equation (3)). The asp represents the aspect and varies from 0 to 360°.
2.3.3. Meteorological Variables
Meteorological variables include the cumulative precipitation in the three months prior to the fire and the relative humidity, maximum air temperature, and maximum wind speed on the day of the fire [4,6,16]. The meteorological data were downloaded from the website of the Resource and Environment Science and Data Center, Institute of Geographical Sciences and Resources, Chinese Academy of Sciences (https://www.resdc.cn/data.aspx?DATAID=230, last accessed on 18 October 2021). In this study, all meteorological stations within a radius of 100 km from the central point of the burn area were considered, with a total of 28 meteorological stations. The meteorological data of the study area were obtained from the 28 meteorological stations by the Kriging spatial interpolation method [74].
2.4. Statistical Analysis
2.4.1. Correlation Analysis among Input Variables
Considering the multicollinearity and spatial autocorrelation between input variables, the Person’s correlation test was conducted with |r| > 0.8 as the threshold to remove highly correlated variables. The correlation coefficients between the pair of variables NDVI–LAI and NDVI–NDWI were 0.84 and 0.95, respectively, and the correlation coefficient between LAI–NDWI was 0.82. NDVI was showed to be strongly correlated with LAI and NDWI; consequently, it was kept for further analysis while LAI and NDWI were discarded. This way, the final input matrix was reduced to 10 variables (Figure 3).
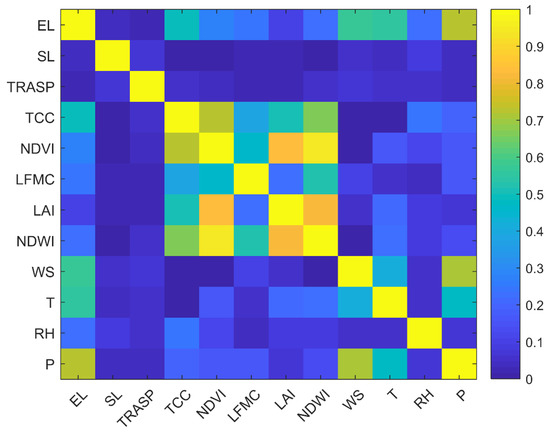
Figure 3.
Correlation analysis among 12 input fuels (TCC, LFMC, LAI, NDWI), topographic (elevation (EL), slope (SL), TRASP), and meteorologic (wind speed (WS), air temperature (T), relative humidity (RH), precipitation (P)) variables. Different colors represent the Person’s correlation coefficient.
2.4.2. Random Forest Algorithm
The RF algorithm was used to analyze the relationship between forest fire burn severity and its environmental drivers. RF is a machine learning algorithm that combines ensemble learning theory with the stochastic subspace method [75,76,77]. RF is a classifier with multiple decision trees, and the output category is determined by the mode (the most common classification) of the categories output by individual trees [78]. RF uses ensemble learning to fit multiple classifications and regression trees and combines these techniques to improve the prediction performance. Compared with the common overfitting phenomenon in a single classification and regression tree model, the RF algorithm training model variance is small, which can effectively improve the generalization ability of the model [79]. The RF algorithm has several advantages. Firstly, the operation of the RF algorithm can be highly parallelized by combining data-parallel and task-parallel optimization, which can greatly improve the operation efficiency while ensuring the accuracy of operation [23]. Secondly, because the nodes of the decision tree can be selected randomly to divide the features, the model can still be trained efficiently when the sample feature dimension is very high [76]. Thirdly, the importance of each feature relative to the output can be calculated after the model training, which makes it very suitable for analyzing the relationship between burn severity and environmental driving factors [78]. Fourthly, in the training process, the model can detect the interaction between the features [76]. Fifthly, as long as there are enough trees, the RF classifier will not overfit. However, with the increase of the number of decision trees, the time of training the random forest model will increase, resulting in the decrease of the running speed [80]. In general, the training speed of the RF model is fast, and the prediction process is relatively slow. Sixthly, RF can be used for classification and regression tasks, so it has been widely used in the field of ecological research [80,81,82].
2.4.3. Importance Analysis of Driving Factors
Since each tree is grown from a bagged sample set, it is grown with two-thirds of the data to train the RF model, called in-bag samples, and the remaining one-third of the data is left out and these samples are called out-of-bag (OOB) samples, which are used to estimate the prediction error. In the process of model calibration, the RF algorithm calculates the importance of each input feature by comparing the increase of OOB error when randomly arranging variables while keeping all other variables unchanged [22,36,83]. The OOB importance of each variable is determined by the average of the precision differences obtained from the modified OOB subset and the original OOB subset. RF needs to define two parameters: the number of trees and the number of input variables [78]. The number of input variables was 10 (EL, SL, TRASP, TCC, NDVI, LFMC, WS, T, RH, and P). In order to obtain a stable algorithm in which predictions do not change much when the training data are modified, we set the number of trees to 1000, we ran the model 100 times, and took the average variable importance value as the final result. The correlation coefficient (R), root mean square error (RMSE), and fitted line slope between the observed and estimated CBI were used for accuracy valuation.
We further explored the relative importance of the environmental drivers under different flammability scenarios. The TCC was used as a proxy of flammable live fuels of the forest in our study area and used to split the modeling database into areas with limited and relatively sufficient flammable live fuels. The threshold of 40% was used because TCC higher than 40% is usually considered to be a high tree coverage level [84]. Previous studies have shown that when the LFMC of forest is lower than 150%, the probability of fire ignition increases, and when LFMC is lower than 120%, it is more prone to severe burn [31,85]. Consequently, the statistical analysis were conducted using (i) all environmental drivers as input to predict the CBI and calculate the importance of each driver; (ii) fuel, topographic, and meteorological variables separately to analyze the importance of each type of environmental driver on CBI prediction; (iii) different flammability scenarios (TCC ≤ 40% and TCC > 40%) to analyze the key environmental driver of burn severity; and (iv) the distribution percentage of three burn severity levels under low LFMC (LFMC < 120%) and different TCC ranges (TCC ≤ 40% and TCC > 40%).
3. Results
3.1. Model Performance and Predictor Variables Importance: All Environmental Variables
When all environmental factors were input into the training of the RF model (Figure 4), the R, RMSE, and slope between the predicted CBI and the observed CBI were 0.76, 0.16, and 0.64, respectively. The three most important predictors were NDVI, TCC, and LFMC, which are all fuel-related variables (Figure 5). Among the topographic factors, elevation was the most important predictor of burn severity, whereas slope and TRASP had smaller effects. This is also consistent with the landscape photos taken in the field (Figure 6), where the forest on the top of the mountain was burned at a higher severity than the forest on lower elevations. Among the meteorological variables, relative humidity was relatively important, but on the whole, meteorological variables did not have a clear driving effect on the burn severity in this fire when compared to the fuel and topographic drivers.

Figure 4.
RF model performance to predict CBI when all the environmental drivers were considered. The three subplots represent the accuracy of the models for (a) training, (b) validation, and (c) overall datasets.
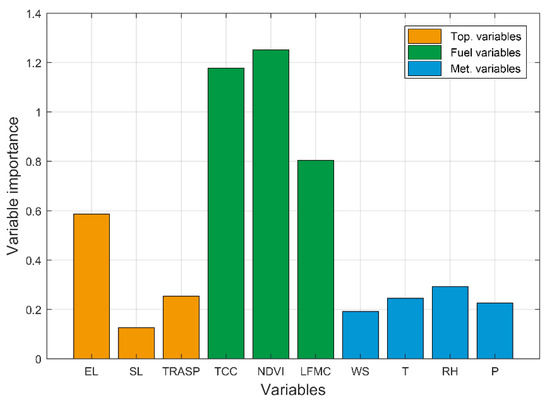
Figure 5.
Importance of the environmental drivers on the final RF model to predict CBI. The environmental drivers were classified into topographic, fuel, and meteorological categories.
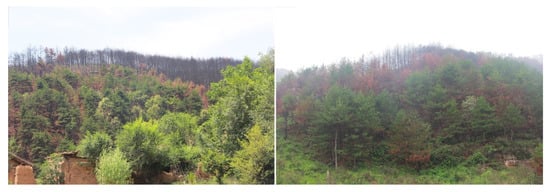
Figure 6.
Two field photos demonstrate that the forest on the top of the mountain burned at a higher severity.
Subsequently, the three types of environmental drivers were separately used as input variables to predict CBI. When only fuel variables were used as inputs (Table 2), the resulting R, RMSE, and slope between the observed CBI and the estimated CBI were 0.7, 0.18, and 0.59, respectively. The worst results (R = 0.62, RMSE = 0.23, and slope = 0.3) were obtained when only topographic variables were input into the RF model. Finally, the model performance further degraded when only meteorological variables were input (R = 0.58, RMSE = 0.25, and slope = 0.27). When only remote sensing data-based (fuel and topographic) variables were used as input, the prediction accuracy (R = 0.72, RMSE = 0.18, and slope = 0.61) of CBI was second only to the all-variables prediction model.

Table 2.
Comparison of validation accuracy when fuel, topographic, and meteorological variables are input as the RF model, respectively. RS data-based variables represent the fuel and topographic variables together, which are calculated based on remote sensing data.
3.2. Model Performance and Predictor Variables Importance: Different Flammability Scenarios
When the RF model was calibrated with data from areas where the tree canopy is sparse (TCC less than or equal to 40%; 181 samples in total), the R, RMSE, and slope between the observed CBI and the estimated CBI were 0.75, 0.19, and 0.61, respectively (Figure 7). TCC became the most important fuel-related driver while the order of variable importance of the topographic and meteorological drivers did not change in comparison with the RF model using all data (Figure 8).

Figure 7.
RF model performance to predict CBI when only data corresponding to locations with TCC less than or equal to 40% were considered (181 samples in total). The three subplots represent (a) training, (b) validation, and (c) overall accuracy.
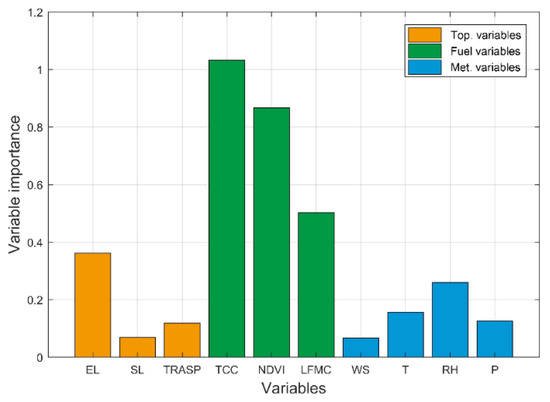
Figure 8.
Importance of the environmental drivers when only data corresponding to locations with TCC less than or equal to 40% were considered.
When the RF model was calibrated with data from areas where the tree canopy was dense (TCC greater than 40%; 319 samples in total), the R, RMSE, and slope between the observed CBI and the estimated CBI were 0.57, 0.13, and 0.28, respectively (Figure 9). The importance of TCC was sharply reduced compared with that of the scenario of TCC less than or equal to 40% (Figure 10). The first two most important factors were NDVI and LFMC, which were related to vegetation greenness and moisture content, respectively. The results also indicated that when TCC is greater than 40%, the fire severity is higher (as shown by CBI > 2.5 in Figure 11).

Figure 9.
RF model performance to predict CBI when only data corresponding to locations with TCC greater than 40% were considered (319 samples in total). The three subplots represent (a) training, (b) validation, and (c) overall accuracy.
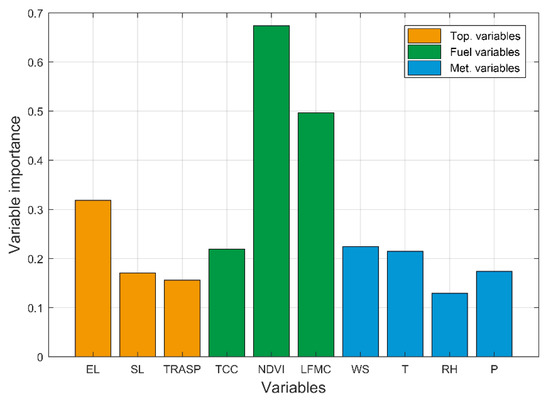
Figure 10.
Importance of the environmental drivers when only data corresponding to locations with TCC greater than 40% were considered.
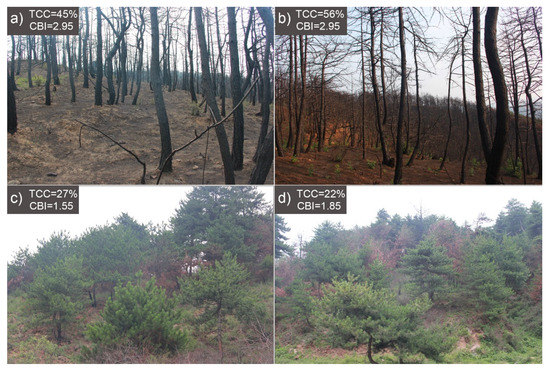
Figure 11.
Example of four field sites to illustrate that higher TCC (a,b) in the forest was accompanied by severe burns and lower TCC (c,d) in the forest was accompanied by lower burn severity.
The results also showed that the LFMC values of 99% of the samples were lower than 150%, and 80% of the samples were lower than 120% (Figure 12a). Among the 400 samples with LFMC lower than 120%, there were 150 samples with TCC ≤ 40% (Figure 12b) and 250 samples with TCC > 40% (Figure 12c). Among the 150 samples with LFMC lower than 120% and TCC ≤ 40%, the distribution of moderate, moderate to high, and high burn severity level was relatively uniform, at 30%, 48%, and 22%, respectively. Among the 250 samples with LFMC lower than 120% and TCC > 40%, the distribution of moderate, moderate to high, and high burn severity level was extreme, at 2%, 18%, and 80%, respectively.
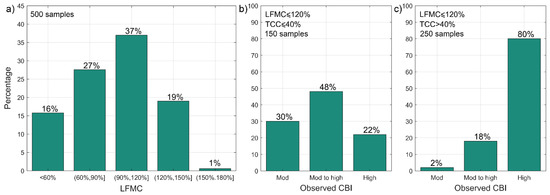
Figure 12.
Percentage distribution of (a) LFMC and the percentage distribution (b) when LFMC ≤ 120% and TCC ≤ 40% and (c) when LFMC ≤ 120% and TCC > 40% in three burn severity levels. There are 400 samples with LFMC value lower than 120%, of which 150 samples had TCC ≤ 40% and 250 samples had TCC > 40%.
4. Discussion
4.1. Environmental Drivers of Burn Severity
The focus of this study was to assess the relative importance of three sets of variables (pre-fire fuel, topographic, and meteorological variables) in controlling spatial patterns of burn severity expressed as CBI and as observed through satellite imagery. In the single scenario simulation, all environmental factors were input into the training model. Among the 10 input variables, the 3 most important variables were all fuel-related variables, which indicated that in the Qinyuan fire, the total amount of flammable live fuels and its moisture content were the most critical factors determining burn severity. Since October 2018, Qinyuan county has been suffering from continuous drought, which leads to the decline of vegetation moisture content and the associated higher probability of fuels to be ignited and burn at a higher intensity given an ignition source. This is also one of the reasons why LFMC is the third most important environmental driver of burn severity. Previous studies have shown that when the LFMC of the forest is lower than 150%, the probability of fire ignition increases, and when LFMC is lower than 120%, it is more prone to severe burn [31,85]. In this study, the LFMC of 99% of the samples was lower than 150%, indicating that the study area has been in a high-risk state of fire ignition. The LFMC of 80% of the samples was lower than 120%, indicating that most areas would be accompanied by severe burn, which was consistent with the distribution characteristics of randomly extracted CBI. More than 60% of the 500 samples were within a high burn severity level. When LFMC was lower than 120% and TCC ≤ 40%, it indicated that the plant leaves were under water stress, and the flammable fuels were insufficient. In this case, TCC was the main driver of burn severity, so the distribution of moderate, moderate to high, and high burn severity levels was relatively uniform (Figure 12b). When LFMC was lower than 120% and TCC > 40%, it indicated that the vegetation leaves were under water stress and there were sufficient flammable fuels, which were more prone to severe burn. This was the reason 80% of the samples were prone to the high burn severity level (Figure 12c) under this criterion. Generally, the lower the LFMC, the greater the risk of forest fire [30,86]. If there are sufficient flammable fuels at the time of ignition, the probability of the fire burning at a high severity is greater. However, when there are few flammable fuels, even a low LFMC will not result in a severe burn, that is, LFMC and flammable fuels control the combustion intensity together. The studies in Mediterranean pine forests confirmed that that burn severity was mostly influenced by pre-fire vegetation greenness, represented by NDWI and NDVI [16]. Similar to LFMC, NDVI and NDWI can also reflect whether the vegetation is under water stress. Among all topographic variables, elevation is the most important. The forest fire was ignited at noon, so anabatic wind was formed due to the temperature and pressure difference between the top of the mountain and the valley, which was very advantageous to the fire spreading to the mountain top with a relatively high elevation. As a result, forest burning on the top of the mountain results in more severe burns. This was also observed in the field sites inspected for this study (Figure 6).
When TCC was less than or equal to 40%, the flammable live fuels were insufficient to drive a high severity burn, so TCC became the most important factor driving the burn severity. However, when TCC was greater than 40%, the pine stands were burned via crown fire if there was a continuity of canopy dryness. Consequently, the burn severity was mainly driven by LFMC, and the importance of TCC decreased sharply. The results also indicated that whether the flammable live fuels were sufficient for severe burn or not, the importance of NDVI remained high. This is because NDVI is an index that integrates vegetation load and moisture content simultaneously.
Accurate prediction of the spatial distribution of potential burn severity will provide important information for managers and scientists who are tasked with managing fuel and wildland fires. Remote sensing data have been widely used in the study of burn severity estimation because of its high temporal and spatial resolution. However, predicting burn severity maps may be more useful to enable forest managers to predict key areas where high burn severity may occur, giving priority to fuel treatment strategies in these areas [87,88]. In this study, when only remote sensing data (fuel and topographic variables) were used as input variables, the model achieved a good prediction accuracy (R = 0.72, RMSE = 0.18, slope = 0.61). The results of this study also confirmed that the forest fire burn severity can be predicted by satellite remote sensing data with high spatiotemporal resolution.
Meteorological data did not show an obvious driving effect on the burn severity in this study, but meteorological data interacted with other environmental factors. Therefore, we further analyzed the daily precipitation, relative humidity, and average air temperature data from October 2018 to March 2019 and October 2017 to March 2018 (Figure 13). The meteorological data were extracted from the Qinyuan meteorological station (longitude: 112.35°E, latitude: 36.52°N,) which is the nearest (18 km) station to the edge of the fire. The data show that there was almost no precipitation in six months (October 2018 to March 2019) before the fire (day 180 in Figure 13). However, from October 2017 to March 2018, there was significantly more precipitation. The relative humidity closely tracked precipitation, showing lower values in March 2019 than in March 2018. Before the fire, the average air temperature continued to rise for three months and the relative humidity gradually decreased for ~40 days, creating good weather conditions for the fire ignition. Although the meteorological data had no obvious driving effect on the burn severity, they created conditions for fire ignition. Therefore, the possible reason why the meteorological data did not show an obvious driving effect on the burn severity is that meteorological conditions are expected to indirectly impact burn severity by influencing fuel moisture conditions and fuel accumulation [17,89].
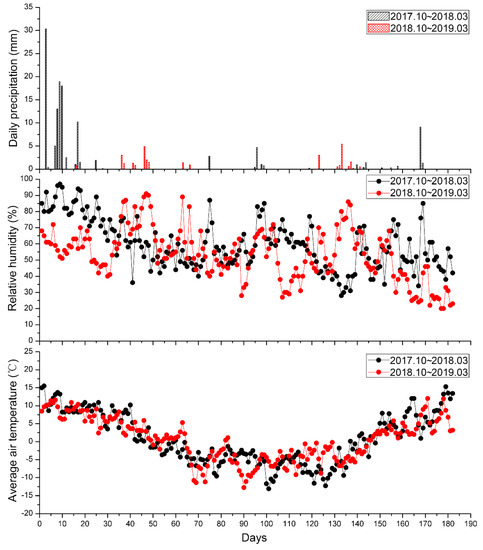
Figure 13.
The distribution of daily precipitation, relative humidity, and average air temperature data during the period from October to March beginning in 2017 and 2018.
4.2. Pre-Fire Forest Management Suggestions
The results of this study indicated that dense live fuel accumulations and LFMC are important factors influencing burn severity. This is consistent with the local forest management policy. In recent years, in order to better protect the forest and prevent potential ignitions and deforestation, the forestry management department of Qinyuan county has implemented the policy of “Closing Hillsides”. This policy supports the conservation and sustainable management of forest via afforestation and restrictive human access by closing many roads to the mountain. Due to the lack of human interference, the local pine forest is growing very well, accumulating a large amount of flammable fuels. Therefore, pre-fire forest management strategies should seek to reduce burn severity levels by reducing the accumulation of fuels and increasing the moisture content of vegetation. Forest thinning and prescribed fire were the two most commonly used methods to reduce fuel accumulation [90,91]. However, there is still no unified conclusion regarding how to use these two methods to reduce burn severity, whether they are used separately or combined [90,92]. By analyzing the meteorological data, we also found that under the arid climate background, areas with higher flammable fuels are more prone to severe fire. Therefore, we suggest that in addition to conducting fuel reduction activities, the forestry management department also needs to plan the landscapes (e.g., “Green firebreaks”) with fire-resistant plants with higher LFMC. This is indispensable to reducing wildfire spread and burn severity. The effectiveness of these forest management suggestions needs to be further verified.
5. Conclusions
Better understanding of the relationship between environmental drivers and burn severity is of importance to forest managers and has been studied in several fire-prone regions around the world. However, the mechanism of environmental drivers controlling burn severity in the temperate coniferous forest of northern China is still limited. In this study, 500 samples were selected from the CBI spatial distribution map to analyze the relationship between burn severity and environmental drivers based on an RF machine learning algorithm. A total of 10 spatial variables related to fuel, topographic, and meteorological drivers were used as input to predict CBI. The findings of this study indicate that (i) the most important environmental driving factor for the burn severity (CBI) in the temperate coniferous forest of northern China are the fuel condition-related variables. More specifically, the burn severity is mainly determined by the amount of flammable live fuels (expressed as TCC) and the LFMC. Although the meteorological data played a less determining role, fire weather conditions (low RH and precipitation, high temperature) create conditions for fire ignition. (ii) When the flammable live fuels are insufficient to drive a high severity burn, TCC is the most important factor driving the burn severity, while when TCC is greater than 40%, the burn severity is mainly driven by LFMC. (iii) In the pre-fire forestry management, the department should conduct strategic fuel reduction management activities and plan the landscapes with vegetation made up of plants with higher LFMC when possible (e.g., “Green firebreaks”) to lower the burn severity caused by potential wildfires in the temperate coniferous forests of northern China. Future work will focus on understanding how fuel types, forest heterogeneity, and stand age may influence burn severity in temperate coniferous forests in northern China.
Author Contributions
C.Y. and M.X. conceived of and designed the experiments; C.Y. performed the experiments and analyzed the data; C.Y. and M.X. wrote the first version of the manuscript; M.Y. refined the manuscript and contributed to the final version of the manuscript; X.L. edited the manuscript. All authors have read and agreed to the published version of the manuscript.
Funding
This research was funded by Sichuan Science and Technology Program (grant No. 2020YFG0048), the Scientific Research Starting Foundation from Yangtze Delta Region Institute (Huzhou), University of Electronic Science and Technology of China (grant No. U03210022), and the Fundamental Research Funds for the Central Universities (grant No. ZYGX2019J070).
Conflicts of Interest
The authors declare no conflict of interest.
References
- Bonan, G.B. Forests and climate change: Forcings, feedbacks, and the climate benefits of forests. Science 2008, 320, 1444–1449. [Google Scholar] [CrossRef] [PubMed] [Green Version]
- Trumbore, S.; Brando, P.; Hartmann, H. Forest health and global change. Science 2015, 349, 814–818. [Google Scholar] [CrossRef] [Green Version]
- Liu, Z.; Ballantyne, A.P.; Cooper, L.A. Biophysical feedback of global forest fires on surface temperature. Nat. Commun. 2019, 10, 214. [Google Scholar] [CrossRef] [Green Version]
- Whitman, E.; Parisien, M.A.; Thompson, D.K.; Hall, R.J.; Skakun, R.S.; Flannigan, M.D. Variability and drivers of burn severity in the northwestern Canadian boreal forest. Ecosphere 2018, 9, e02128. [Google Scholar] [CrossRef] [Green Version]
- Lentile, L.B.; Morgan, P.; Hudak, A.T.; Bobbitt, M.J.; Lewis, S.A.; Smith, A.M.S.; Robichaud, P.R. Post-Fire Burn Severity and Vegetation Response Following Eight Large Wildfires across the Western United States. Fire Ecol. 2007, 3, 91–108. [Google Scholar] [CrossRef]
- Parks, S.; Holsinger, L.; Panunto, M.; Jolly, W.M.; Dobrowski, S.; Dillon, G. High-severity fire: Evaluating its key drivers and mapping its probability across western US forests. Environ. Res. Lett. 2018, 13, 04437. [Google Scholar] [CrossRef]
- Cansler, C.A.; McKenzi, D. Climate, fire size, and biophysical setting control fire severity and spatial pattern in the northern Cascade Range, USA. Ecol. Appl. 2014, 24, 1037–1056. [Google Scholar] [CrossRef]
- Harvey, B.J.; Donato, D.C.; Turner, M.G. Drivers and trends in landscape patterns of stand-replacing fire in forests of the US Northern Rocky Mountains (1984–2010). Landsc. Ecol. 2016, 31, 2367–2383. [Google Scholar] [CrossRef]
- Rothermel, R.C. A Mathematical Model for Predicting Fire Spread in Wildland Fuels; Intermountain Forest and Range Experiment Station, Forest Service, US Department of Agriculture: Washington, DC, USA, 1972; Volume 115. [Google Scholar]
- Ryan, K.C.; Noste, N.V. Evaluating Prescribed Fires; Lotan, J.E., Kilgore, B.M., Fischer, W.C., Eds.; Utah State University: Logan, UT, USA, 1985; pp. 15–18. [Google Scholar]
- Chuvieco, E.; Riaño, D.; Danson, F.; Martin, P. Use of a radiative transfer model to simulate the postfire spectral response to burn severity. J. Geophys. Res. Biogeosci. 2006, 111, G4. [Google Scholar] [CrossRef] [Green Version]
- Estes, B.L.; Knapp, E.E.; Skinner, C.N.; Miller, J.D.; Preisler, H.K. Factors influencing fire severity under moderate burning conditions in the Klamath Mountains, northern California, USA. Ecosphere 2017, 8, e01794. [Google Scholar] [CrossRef] [Green Version]
- Savage, M.; Mast, J.N. How resilient are southwestern ponderosa pine forests after crown fires? Can. J. For. Res. 2005, 35, 967–977. [Google Scholar] [CrossRef] [Green Version]
- Moody, J.A.; Shakesby, R.A.; Robichaud, P.R.; Cannon, S.H.; Martin, D.A. Current research issues related to post-wildfire runoff and erosion processes. Earth-Sci. Rev. 2013, 122, 10–37. [Google Scholar] [CrossRef]
- Calkin, D.E.; Cohen, J.D.; Finney, M.A.; Thompson, M.P. How risk management can prevent future wildfire disasters in the wildland-urban interface. Proc. Natl. Acad. Sci. USA 2014, 111, 746–751. [Google Scholar] [CrossRef] [PubMed] [Green Version]
- García-Llamas, P.; Suárez-Seoane, S.; Taboada, A.; Fernández-Manso, A.; Quintano, C.; Fernández-García, V.; Fernández-Guisuraga, J.M.; Marcos, E.; Calvo, L. Environmental drivers of fire severity in extreme fire events that affect Mediterranean pine forest ecosystems. For. Ecol. Manag. 2019, 433, 24–32. [Google Scholar] [CrossRef]
- Lecina-Diaz, J.; Alvarez, A.; Retana, J. Extreme Fire Severity Patterns in Topographic, Convective and Wind-Driven Historical Wildfires of Mediterranean Pine Forests. PLoS ONE 2014, 9, e85127. [Google Scholar] [CrossRef] [Green Version]
- Birch, D.S.; Morgan, P.; Kolden, C.A.; Abatzoglou, J.; Dillon, G.K.; Hudak, A.T.; Smith, A. Vegetation, topography and daily weather influenced burn severity in central Idaho and western Montana forests. Ecosphere 2015, 6, art17. [Google Scholar] [CrossRef]
- Dillon, G.K.; Holden, Z.A.; Morgan, P.; Crimmins, M.A.; Heyerdahl, E.K.; Luce, C.H. Both topography and climate affected forest and woodland burn severity in two regions of the western US, 1984 to 2006. Ecosphere 2011, 2, 1–33. [Google Scholar] [CrossRef]
- Fang, L.; Yang, J.; White, M.; Liu, Z. Predicting potential fire severity using vegetation, topography and surface moisture availability in a Eurasian Boreal Forest Landscape. Forests 2018, 9, 130. [Google Scholar] [CrossRef] [Green Version]
- Harris, L.; Taylor, A.H. Previous burns and topography limit and reinforce fire severity in a large wildfire. Ecosphere 2017, 8, e02019. [Google Scholar] [CrossRef]
- Kane, V.R.; Lutz, J.; Cansler, C.A.; Povak, N.; Churchill, D.J.; Smith, D.F.; Kane, J.T.; North, M.P. Water balance and topography predict fire and forest structure patterns. For. Ecol. Manag. 2015, 338, 1–13. [Google Scholar] [CrossRef]
- Holden, Z.A.; Morgan, P.; Evans, J.S. A predictive model of burn severity based on 20-year satellite-inferred burn severity data in a large southwestern US wilderness area. For. Ecol. Manag. 2009, 258, 2399–2406. [Google Scholar] [CrossRef]
- Keyser, A.; Westerling, A.L. Climate drives inter-annual variability in probability of high severity fire occurrence in the western United States. Environ. Res. Lett. 2017, 12, 065003. [Google Scholar] [CrossRef]
- Amato, V.J.; Lightfoot, D.; Stropki, C.; Pease, M. Relationships between tree stand density and burn severity as measured by the Composite Burn Index following a ponderosa pine forest wildfire in the American Southwest. For. Ecol. Manag. 2013, 302, 71–84. [Google Scholar] [CrossRef]
- Sean, P.; Solomon, D.; Matthew, P. What Drives Low-Severity Fire in the Southwestern USA? Forests 2018, 9, 165. [Google Scholar]
- Barkley, Y.C. After the Burn: Assessing and Managing Your Forestland after a Wildfire; Idaho Forest, Wildlife, and Range Experiment Station, University of Idaho: Moscow, ID, USA, 2002. [Google Scholar]
- Yebra, M.; Chuvieco, E.; Riaño, D. Estimation of live fuel moisture content from MODIS images for fire risk assessment. Agric. For. Meteorol. 2008, 148, 523–536. [Google Scholar] [CrossRef]
- Yebra, M.; Scortechini, G.; Badi, A.; Beget, M.E.; Boer, M.M.; Bradstock, R.; Chuvieco, E.; Danson, F.M.; Dennison, P.; De Dios, V.R.; et al. Globe-LFMC, a global plant water status database for vegetation ecophysiology and wildfire applications. Sci. Data 2019, 6, 155. [Google Scholar] [CrossRef] [PubMed] [Green Version]
- Quan, X.; He, B.; Yebra, M.; Yin, C.; Liao, Z.; Li, X. Retrieval of forest fuel moisture content using a coupled radiative transfer model. Environ. Model. Softw. 2017, 95, 290–302. [Google Scholar] [CrossRef]
- Luo, K.; Quan, X.; He, B.; Yebra, M. Effects of Live Fuel Moisture Content on Wildfire Occurrence in Fire-Prone Regions over Southwest China. Forests 2019, 10, 887. [Google Scholar] [CrossRef] [Green Version]
- Wang, L.; Quan, X.; He, B.; Yebra, M.; Xing, M.; Liu, X. Assessment of the Dual Polarimetric Sentinel-1A Data for Forest Fuel Moisture Content Estimation. Remote Sens. 2019, 11, 1568. [Google Scholar] [CrossRef] [Green Version]
- Yebra, M.; Quan, X.; Riaño, D.; Larraondo, P.R.; Van Dijk, A.; Cary, G.J. A fuel moisture content and flammability monitoring methodology for continental Australia based on optical remote sensing. Remote Sens. Environ. 2018, 212, 260–272. [Google Scholar] [CrossRef]
- Quan, X.; Li, Y.; He, B.; Cary, G.J.; Lai, G. Application of Landsat ETM+ and OLI Data for Foliage Fuel Load Monitoring Using Radiative Transfer Model and Machine Learning Method. IEEE J. Sel. Top. Appl. Earth Obs. Remote Sens. 2021, 14, 5100–5110. [Google Scholar] [CrossRef]
- Cannon, J.B.; Henderson, S.K.; Bailey, M.H.; Peterson, C.J. Interactions between wind and fire disturbance in forests: Competing amplifying and buffering effects. For. Ecol. Manag. 2019, 436, 117–128. [Google Scholar] [CrossRef]
- Kane, V.R.; Cansler, C.A.; Povak, N.; Kane, J.T.; McGaughey, R.J.; Lutz, J.; Churchill, D.J.; North, M.P. Mixed severity fire effects within the Rim fire: Relative importance of local climate, fire weather, topography, and forest structure. For. Ecol. Manag. 2015, 358, 62–79. [Google Scholar] [CrossRef] [Green Version]
- Broncano, M.J.; Retana, J. Topography and forest composition affecting the variability in fire severity and post-fire regeneration occurring after a large fire in the Mediterranean basin. Int. J. Wildland Fire 2004, 13, 209–216. [Google Scholar] [CrossRef]
- Mitsopoulos, I.; Chrysafi, I.; Bountis, D.; Mallinis, G. Assessment of factors driving high fire severity potential and classification in a Mediterranean pine ecosystem. J. Environ. Manag. 2019, 235, 266–275. [Google Scholar] [CrossRef] [PubMed]
- Lindenmayer, D.; Taylor, C.; Blanchard, W. Empirical analyses of the factors influencing fire severity in southeastern Australia. Ecosphere 2021, 12, e03721. [Google Scholar] [CrossRef]
- Bradstock, R.A.; Hammill, K.A.; Collins, L.; Price, O. Effects of weather, fuel and terrain on fire severity in topographically diverse landscapes of south-eastern Australia. Landsc. Ecol. 2010, 25, 607–619. [Google Scholar] [CrossRef]
- Storey, M.; Price, O.; Tasker, E. The role of weather, past fire and topography in crown fire occurrence in eastern Australia. Int. J. Wildland Fire 2016, 25, 1048–1060. [Google Scholar] [CrossRef]
- Ndalila, M.N.; Williamson, G.J.; Bowman, D.M.J.S. Geographic patterns of fire severity following an extreme eucalyptus forest fire in Southern Australia: 2013 Forcett-Dunalley Fire. Fire 2018, 1, 40. [Google Scholar] [CrossRef] [Green Version]
- Levin, N.; Yebra, M.; Phinn, S. Unveiling the Factors Responsible for Australia’s Black Summer Fires of 2019/2020. Fire 2021, 4, 58. [Google Scholar] [CrossRef]
- Perrault-Hébert, M.; Boucher, Y.; Fournier, R.; Girard, F.; Auger, I.; Thiffault, N.; Grenon, F. Ecological drivers of post-fire regeneration in a recently managed boreal forest landscape of eastern Canada. For. Ecol. Manag. 2017, 399, 74–81. [Google Scholar] [CrossRef]
- Whitman, E.; Parisien, M.-A.; Thompson, D.K.; Flannigan, M.D. Topoedaphic and forest controls on post-fire vegetation assemblies are modified by fire history and burn severity in the Northwestern Canadian boreal forest. Forest 2018, 9, 151. [Google Scholar] [CrossRef] [Green Version]
- Harris, L.; Taylor, A.H. Topography, Fuels, and Fire Exclusion Drive Fire Severity of the Rim Fire in an Old-Growth Mixed-Conifer Forest, Yosemite National Park, USA. Ecosystems 2015, 18, 1192–1208. [Google Scholar] [CrossRef]
- Zhang, B.; Yao, Y.; Zhao, C.; Wang, J.; Yu, F. Conifers in Mountains of China. In Conifers; IntechOpen: London, UK, 2018. [Google Scholar]
- Di, L.; Zhang, A.; Zhang, Y.; Sun, R. Analysis on annual variation characteristics and disaster causes of forest fires in Shanxi Province. For. Fire Prev. 2007, 2, 19–22. [Google Scholar]
- Stephens, S.L.; McIver, J.D.; Boerner, R.E.J.; Fettig, C.J.; Fontaine, J.; Hartsough, B.R.; Kennedy, P.; Schwilk, D.W. The Effects of Forest Fuel-Reduction Treatments in the United States. Bioscience 2012, 62, 549–560. [Google Scholar] [CrossRef] [Green Version]
- Qian, L.; Zheng, Y.; Guo, M. Shanxi Climate; China Meteorol Press: Beijing, China, 1991; pp. 161–162. [Google Scholar]
- Key, C.; Benson, N. Landscape assessment: Ground measure of severity, the Composite Burn Index. In FIREMON: Fire Effects Monitoring and Inventory System; Lutes, D.C., Ed.; USDA Forest Service, Rocky Mountain Research Station: Fort Collins, CO, USA, 2006; pp. LA8–LA15. [Google Scholar]
- Yin, C.; He, B.; Quan, X.; Yebra, M.; Lai, G. Remote Sensing of Burn Severity Using Coupled Radiative Transfer Model: A Case Study on Chinese Qinyuan Pine Fires. Remote Sens. 2020, 12, 3590. [Google Scholar] [CrossRef]
- Yin, C.; He, B.; Yebra, M.; Quan, X.; Edwards, A.C.; Liu, X.; Liao, Z. Improving burn severity retrieval by integrating tree canopy cover into radiative transfer model simulation. Remote Sens. Environ. 2020, 236, 111454. [Google Scholar] [CrossRef]
- Minh, D.H.T.; Ndikumana, E.; Vieilledent, G.; McKey, D.; Baghdadi, N. Potential value of combining ALOS PALSAR and Landsat-derived tree cover data for forest biomass retrieval in Madagascar. Remote Sens. Environ. 2018, 213, 206–214. [Google Scholar] [CrossRef]
- Liao, Z.; Van Dijk, A.I.; He, B.; Larraondo, P.R.; Scarth, P.F. Woody vegetation cover, height and biomass at 25-m resolution across Australia derived from multiple site, airborne and satellite observations. Int. J. Appl. Earth Obs. Geoinf. 2020, 93, 102209. [Google Scholar] [CrossRef]
- Liu, Z. Effects of climate and fire on short-term vegetation recovery in the boreal larch forests of Northeastern China. Sci. Rep. 2016, 6, 37572. [Google Scholar] [CrossRef] [PubMed] [Green Version]
- Carlson, T.N.; Ripley, D.A. On the relation between NDVI, fractional vegetation cover, and leaf area index. Remote Sens. Environ. 1997, 62, 241–252. [Google Scholar] [CrossRef]
- Wang, Q.; Adiku, S.; Tenhunen, J.; Granier, A. On the relationship of NDVI with leaf area index in a deciduous forest site. Remote Sens. Environ. 2005, 94, 244–255. [Google Scholar] [CrossRef]
- Carlson, T.N.; Gillies, R.R.; Perry, E.M. A method to make use of thermal infrared temperature and NDVI measurements to infer surface soil water content and fractional vegetation cover. Remote Sens. Rev. 1994, 9, 161–173. [Google Scholar] [CrossRef]
- Yebra, M.; Chuvieco, E. Generation of a Species-Specific Look-Up Table for Fuel Moisture Content Assessment. IEEE J. Sel. Top. Appl. Earth Obs. Remote Sens. 2009, 2, 21–26. [Google Scholar] [CrossRef]
- Quan, X.; Yebra, M.; Riaño, D.; He, B.; Lai, G.; Liu, X. Global fuel moisture content mapping from MODIS. Int. J. Appl. Earth Obs. Geoinf. 2021, 101, 102354. [Google Scholar] [CrossRef]
- Quan, X.; Xie, Q.; He, B.; Luo, K.; Liu, X. Integrating remotely sensed fuel variables into wildfire danger assessment for China. Int. J. Wildland Fire 2021, 30, 822. [Google Scholar] [CrossRef]
- Fang, H.; Liang, S. A hybrid inversion method for mapping leaf area index from MODIS data: Experiments and application to broadleaf and needleleaf canopies. Remote Sens. Environ. 2005, 94, 405–424. [Google Scholar] [CrossRef]
- Gong, P.; Pu, R.; Biging, G.; Larrieu, M. Estimation of forest leaf area index using vegetation indices derived from hyperion hyperspectral data. IEEE Trans. Geosci. Remote Sens. 2003, 41, 1355–1362. [Google Scholar] [CrossRef] [Green Version]
- Gao, B.-C. NDWI—A normalized difference water index for remote sensing of vegetation liquid water from space. Remote Sens. Environ. 1996, 58, 257–266. [Google Scholar] [CrossRef]
- Sexton, J.O.; Song, X.-P.; Feng, M.; Noojipady, P.; Anand, A.; Huang, C.; Kim, D.-H.; Collins, K.M.; Channan, S.; DiMiceli, C. Global, 30-m resolution continuous fields of tree cover: Landsat-based rescaling of MODIS vegetation continuous fields with lidar-based estimates of error. Int. J. Digit. Earth 2013, 6, 427–448. [Google Scholar] [CrossRef] [Green Version]
- Mayer, B.; Kylling, A. The libRadtran software package for radiative transfer calculations-description and examples of use. Atmos. Chem. Phys. 2005, 5, 1855–1877. [Google Scholar] [CrossRef] [Green Version]
- Main-Knorn, M.; Pflug, B.; Louis, J.; Debaecker, V.; Müller-Wilm, U.; Gascon, F. Sen2Cor for Sentinel-2. In Proceedings of the Image and Signal Processing for Remote Sensing XXIII, Warsaw, Poland, 4 October 2017; p. 3. [Google Scholar]
- Gascon, F.; Bouzinac, C.; Thépaut, O.; Jung, M.; Francesconi, B.; Louis, J.; Lonjou, V.; Lafrance, B.; Massera, S.; Gaudel-Vacaresse, A. Copernicus Sentinel-2A calibration and products validation status. Remote Sens. 2017, 9, 584. [Google Scholar] [CrossRef] [Green Version]
- Louis, J.; Debaecker, V.; Pflug, B.; Main-Knorn, M.; Bieniarz, J.; Mueller-Wilm, U.; Cadau, E.; Gascon, F. Sentinel-2 Sen2Cor: L2A Processor for Users. In Proceedings of the Living Planet Symposium, Prague, Czech Republic, 9–13 May 2016; pp. 1–8. [Google Scholar]
- Hardisky, M.; Klemas, V.; Smart, M. The influence of soil salinity, growth form, and leaf moisture on the spectral radiance of. Spartina Alterniflora. Photogramm. Eng. Remote Sens. 1983, 49, 77–83. [Google Scholar]
- Bowyer, P.; Danson, F. Sensitivity of spectral reflectance to variation in live fuel moisture content at leaf and canopy level. Remote Sens. Environ. 2004, 92, 297–308. [Google Scholar] [CrossRef]
- Roberts, D.W.; Cooper, S.V. Concepts and techniques of vegetation mapping. In Land Classifications Based on Vegetation: Applications for Resource Management; USDA, Forest Service, Intermountain Research Station: Ogden, UT, USA, 1989; pp. 90–96. [Google Scholar]
- Aalto, J.; Pirinen, P.; Heikkinen, J.; Venäläinen, A. Spatial interpolation of monthly climate data for Finland: Comparing the performance of kriging and generalized additive models. Theor. Appl. Clim. 2013, 112, 99–111. [Google Scholar] [CrossRef]
- Pal, M. Random forest classifier for remote sensing classification. Int. J. Remote Sens. 2005, 26, 217–222. [Google Scholar] [CrossRef]
- Belgiu, M.; Drăguţ, L. Random forest in remote sensing: A review of applications and future directions. ISPRS J. Photogramm. Remote Sens. 2016, 114, 24–31. [Google Scholar] [CrossRef]
- Grömping, U. Variable importance assessment in regression: Linear regression versus random forest. Am. Stat. 2009, 63, 308–319. [Google Scholar] [CrossRef]
- Rodriguez-Galiano, V.; Chica-Olmo, M.; Abarca-Hernandez, F.; Atkinson, P.M.; Jeganathan, C. Random Forest classification of Mediterranean land cover using multi-seasonal imagery and multi-seasonal texture. Remote Sens. Environ. 2012, 121, 93–107. [Google Scholar] [CrossRef]
- Sonobe, R.; Tani, H.; Wang, X.; Kobayashi, N.; Shimamura, H. Random forest classification of crop type using multi-temporal TerraSAR-X dual-polarimetric data. Remote Sens. Lett. 2014, 5, 157–164. [Google Scholar] [CrossRef] [Green Version]
- Prasad, A.M.; Iverson, L.R.; Liaw, A. Newer classification and regression tree techniques: Bagging and random forests for ecological prediction. Ecosystems 2006, 9, 181–199. [Google Scholar] [CrossRef]
- Iverson, L.R.; Prasad, A.M.; Matthews, S.N.; Peters, M. Estimating potential habitat for 134 eastern US tree species under six climate scenarios. For. Ecol. Manag. 2008, 254, 390–406. [Google Scholar] [CrossRef]
- Peterson, S.H.; Franklin, J.; Roberts, D.A.; van Wagtendonk, J.W. Mapping fuels in Yosemite National Park. Can. J. For. Res. 2013, 43, 7–17. [Google Scholar] [CrossRef]
- Breiman, L. Random forests. Mach. Learn. 2001, 45, 5–32. [Google Scholar] [CrossRef] [Green Version]
- Ziter, C.D.; Pedersen, E.J.; Kucharik, C.J.; Turner, M.G. Scale-dependent interactions between tree canopy cover and impervious surfaces reduce daytime urban heat during summer. Proc. Natl. Acad. Sci. USA 2019, 116, 7575–7580. [Google Scholar] [CrossRef] [PubMed] [Green Version]
- Nolan, R.H.; Boer, M.M.; Resco de Dios, V.; Caccamo, G.; Bradstock, R.A. Large-scale, dynamic transformations in fuel moisture drive wildfire activity across southeastern Australia. Geophys. Res. Lett. 2016, 43, 4229–4238. [Google Scholar] [CrossRef] [Green Version]
- Yebra, M.; Dennison, P.E.; Chuvieco, E.; Riano, D.; Zylstra, P.; Hunt, E.R., Jr.; Danson, F.M.; Qi, Y.; Jurdao, S. A global review of remote sensing of live fuel moisture content for fire danger assessment: Moving towards operational products. Remote Sens. Environ. 2013, 136, 455–468. [Google Scholar] [CrossRef]
- Keane, R.E.; Drury, S.A.; Karau, E.C.; Hessburg, P.F.; Reynolds, K.M. A method for mapping fire hazard and risk across multiple scales and its application in fire management. Ecol. Model. 2010, 221, 2–18. [Google Scholar] [CrossRef]
- Stephens, S.L.; Moghaddas, J.J.; Edminster, C.; Fiedler, C.E.; Haase, S.; Harrington, M.; Keeley, J.E.; Knapp, E.E.; McIver, J.D.; Metlen, K. Fire treatment effects on vegetation structure, fuels, and potential fire severity in western US forests. Ecol. Appl. 2009, 19, 305–320. [Google Scholar] [CrossRef] [Green Version]
- van Mantgem, P.J.; Nesmith, J.C.; Keifer, M.; Knapp, E.E.; Flint, A.; Flint, L. Climatic stress increases forest fire severity across the western United States. Ecol. Lett. 2013, 16, 1151–1156. [Google Scholar] [CrossRef]
- Johnston, J.D.; Olszewski, J.H.; Miller, B.A.; Schmidt, M.R.; Vernon, M.J.; Ellsworth, L.M. Mechanical thinning without prescribed fire moderates wildfire behavior in an Eastern Oregon, USA ponderosa pine forest. For. Ecol. Manag. 2021, 501, 119674. [Google Scholar] [CrossRef]
- Agee, J.K.; Lolley, M.R. Thinning and prescribed fire effects on fuels and potential fire behavior in an eastern Cascades forest, Washington, USA. Fire Ecol. 2006, 2, 3–19. [Google Scholar] [CrossRef]
- Raymond, C.L.; Peterson, D.L. Fuel treatments alter the effects of wildfire in a mixed-evergreen forest, Oregon, USA. Can. J. For. Res. 2005, 35, 2981–2995. [Google Scholar] [CrossRef]
Publisher’s Note: MDPI stays neutral with regard to jurisdictional claims in published maps and institutional affiliations. |
© 2021 by the authors. Licensee MDPI, Basel, Switzerland. This article is an open access article distributed under the terms and conditions of the Creative Commons Attribution (CC BY) license (https://creativecommons.org/licenses/by/4.0/).