1. Introduction
The nighttime lights of the world have emerged as the most reliable and globally consistent dataset for various scientific studies and applications. Some examples of the use of nighttime light images in scientific studies include mapping urban areas [
1,
2], human ecological footprint [
3], measuring socio-economic indices [
4,
5,
6,
7,
8], population [
9], human health and biological impacts [
10], effects of a pandemic such as COVID-19 [
11,
12], studying impacts of war and natural disasters [
13,
14], boat detection and illegal fishing activities [
15,
16], and detection of fires, flares, and other infrared (IR) emitters [
17].
The original global low light imaging nighttime data series, spanning from 1992–2013, were collected by the U.S. Air Force Defense Meteorological Satellite Program (DMSP), Operational Linescan System (OLS). Since the OLS collected global nightly data, it was possible to filter out sunlit, moonlit, and cloudy data, visually ‘linescreen’ to exclude lights due to aurora and abrupt gain changes and make consistent products extending from 65 south to 75 north [
18]. This series ended in 2013 due to orbital degradation of the DMSP F18 satellite, which shifted to a dawn-dusk overpass and collected insufficient nighttime data to create a global nighttime lights product for 2014.
Since then, the focus shifted to low light imaging data collected by the NASA-NOAA Visible Infrared Imaging Radiometer Suite (VIIRS) Day/Night Band (DNB) [
19]. Compared to VIIRS DNB, DMSP OLS data have several shortcomings, including coarse spatial resolution, six-bit quantization, limited dynamic range resulting in saturation on urban cores, and lack of in-flight calibration. The improvements in data quality from DMSP OLS to VIIRS DNB include a 45 times smaller pixel footprint, l4 bit quantization, wider dynamic range, no saturation on bright sources, and in-flight calibration [
20].
The original global nighttime lights time series from DMSP was produced using OLS data from six individual satellites (
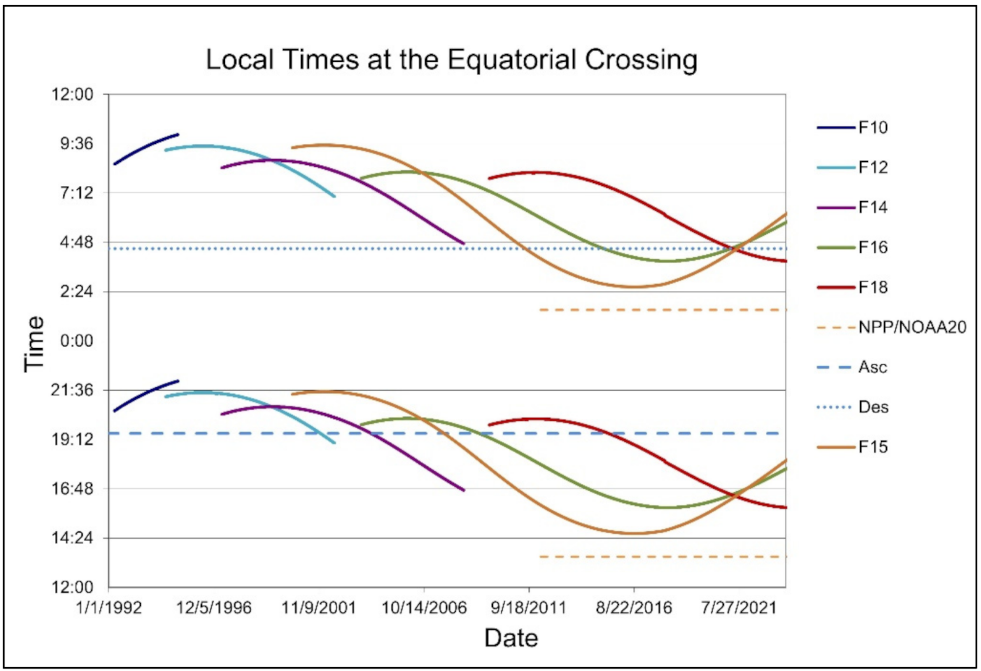
Figure 1). With the passage of time, each satellite gradually shifted from a day/night orbit to a dawn/dusk orbit, which is to an earlier overpass time. The OLS sensors collected sufficient nighttime data worldwide as long as the overpass occurred later than 19:30, and global annual nighttime lights products could be generated. Recently, after adding additional years to the DMSP equatorial crossing time chart, the National Oceanic and Atmospheric Administration (NOAA) discovered that both the F15 and F16 satellites had continued to shift and had started collecting pre-dawn nighttime data from 2012 to the present. The interesting thing that has happened because of the shift in the orbit of the DMSP satellites is that recent data are closer in time to the overpass time of VIIRS, which is 1:30 am. Based on this information, the Earth Observation Group (EOG) at Payne Institute for Public Policy, Colorado School of Mines, decided to utilize their several years’ expertise to extend the processing of DMSP nighttime light series using pre-dawn data. The algorithms that were developed to generate the annual global DMSP nighttime light products [
18] have been maintained, with a few changes. The first change is that instead of a professional analyst going through each orbit and selecting the lines to exclude lights due to aurora and solar glare, a Neural Network was trained based on lines selected for 3650 half orbits of 2018 [
21,
22]. The cloud-masking procedure has also been updated since the last publication [
18] and will be discussed in the ‘methods’ section. Besides these changes, the software used for processing the historical series of DMSP were used in reprocessing the years 2013–2019.
Although the DMSP nighttime series extends from 1992 to 2013, and the VIIRS from 2012 onwards, because of the major differences between the DMSP and VIIRS satellite sensors [
20], cross-calibration and long-term scientific studies using nighttime lights have been difficult. To overcome this problem, Nechaev et al. [
23] developed a method of producing an analog of the DMSP annual nightlight image from the corresponding VIIRS product using the U-net Convolutional Neural Network (CNN) and deep residual learning strategy [
24]. Therefore, by downgrading the VIIRS nighttime lights for the years 2012 and beyond and cross-calibrating them with the DMSP F15 and F16 satellites of the corresponding years, it is possible to study the diurnal variations of the city lights. In this paper, intercalibrated DMSP F182013, F152013, and Downgraded VIIRS Nighttime Light (DVNL), with overpass times of approximately 7:30 p.m., 4:30 a.m., and 1:30 a.m., respectively, were examined to understand the diurnal pattern of nighttime lights.
In the first half of the ‘methods’ section, we will discuss the steps for creating the annual Stable Lights products for the DMSP series beyond 2013. For this paper, we will cite examples from F152018. As stated before, the steps for creating the annual Stable Lights have remained more or less consistent with the previous series [
18]. In the second half, we will touch upon the process of intercalibrating the F15 and F18 DMSP images to the downgraded VIIRS nighttime image and examine the diurnal pattern of nighttime light for 2013 corresponding to different satellite overpass times.
2. Materials and Methods
The polar orbiting Defense Meteorological Satellite Program’s Operational Linescan System (DMSP-OLS) sensors have been flown by the US Air Force, Department of Defense (DoD) since the mid-1970s. The DMSP data have been archived at NOAA’s National Centers for Environmental Information (NCEI) since 1992. Nighttime Lights processing was established by the Earth Observation Group at NOAA/NCEI in 1994, and transitioned to the Payne Institute for Public Policy, Colorado School of Mines in 2020.
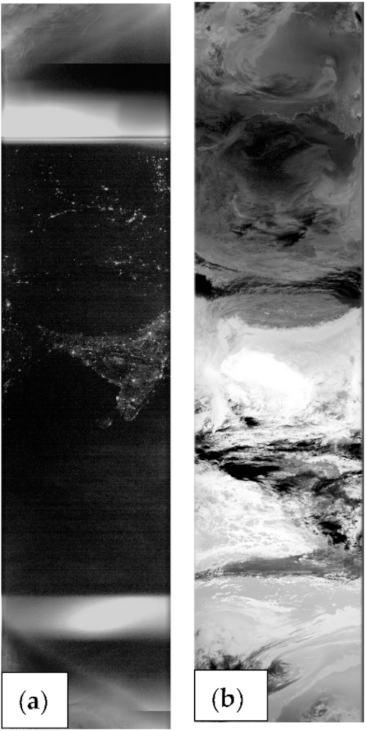
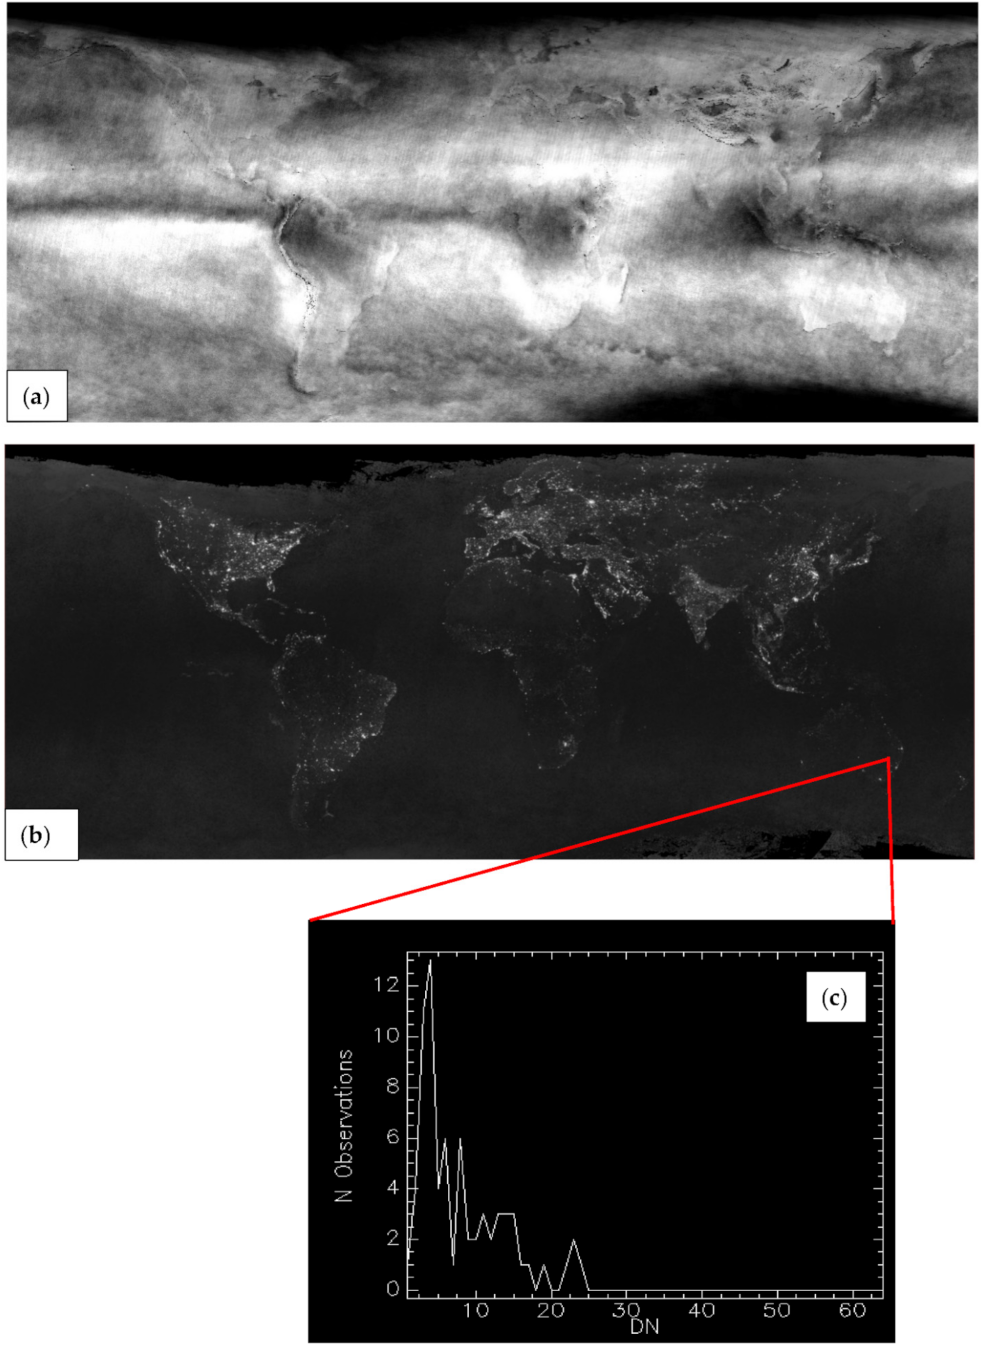
The OLS data are available on a global scale at a spatial resolution of 2.7 km and are made up of two spectral bands, a visible band (0.4–1.1 µm) and a thermal band (10.5–12.6 µm) (
Figure 2).
The OLS was designed to detect moonlit clouds and a photomultiplier tube (PMT) is used to intensify the visible band signal. However, because of this intensification, lights from cities, fires, fishing boats, gas flares, and so on are also detected. Some of these lights’ sources are transient, for example, fires and fishing boats, while the city lights are more permanent. The annual ‘Stable’ Lights composites are made by isolating the transient sources from the more permanent sources by examining the distributions of the visible bands, which go into the composite products. Although the OLS is unique in its ability to collect low-light imaging data, it has some flaws, such as coarse spatial resolution, a 6-bit quantization, and a limited dynamic range resulting in saturation of city centers. In the following sections, we discuss the steps in creating the DMSP-OLS Stable Lights composite for the year 2018 from 3651 orbits of the F152018 satellite.
2.1. Steps in Creating the OLS Stable Lights Composite
2.1.1. OLS Flag Images
There are several steps of pre-processing involved to ensure the inclusion of only high-quality cloud-free nighttime data in the Stable Lights product. This is done by creating companion flag images for the OLS orbits. The flag images are used to place the OLS pixels into classes. The flag images are 16-bit, and they are processed bit-wise. Thus, each OLS pixel can simultaneously be in more than one class by turning specific bits on. The flag categories used in the Stable Lights processing are DAYTIME, NIGHTTIME MARGINAL, ZERO LUNAR ILLUMINANCE, CLOUDS PRESENT, and NO DATA.
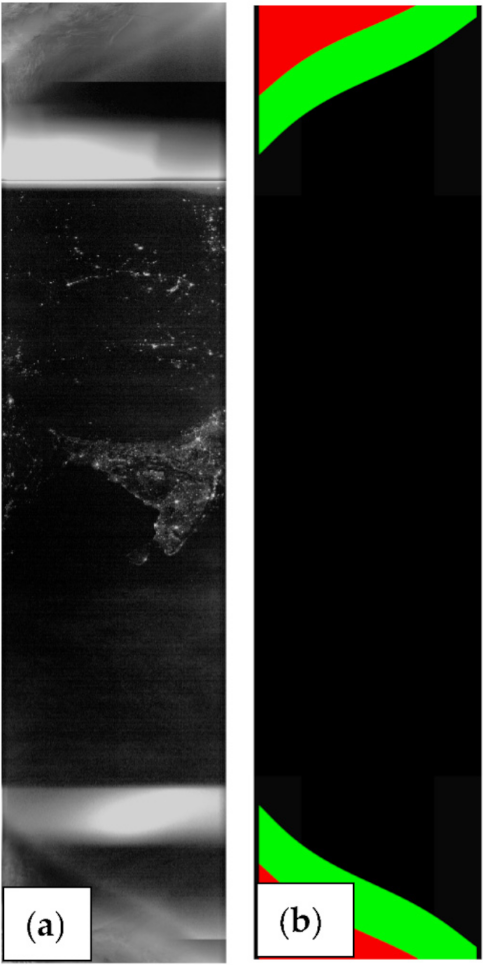
Solar elevation angles help to determine the DAYTIME and NIGHTTIME MARGINAL flags. The DAYTIME flag bit is set for solar elevation angles greater than −6, and the NIGHTTIME MARGINAL flag is set for solar elevation angles between −15 and −6 (
Figure 3). The NIGHTTIME MARGINAL flag bit covers the transition zone from nighttime to daytime, and the data in this terminator zone is of reduced quality in comparison to the darker nighttime data.
The ZERO LUNAR ILLUMINANCE flag is set using lunar illuminance values computed by means of an algorithm acquired from the US Naval Observatory [
25]. The algorithm estimates the lunar illuminance present at the Earth’s surface as a function of the lunar phase, azimuth, and elevation, which in turn are computed from the latitude and longitude of each OLS pixel and the time at the nadir pixel of each scan line. When the returned lunar illuminance is less than 0.0005 lux, the ZERO LUNAR ILLUMINANCE flag is set. Sometimes, there may be scanlines within an OLS nighttime suborbit with no real data but are present as placeholders. The NO DATA flag is set for these regions.
2.1.2. Orbital Screening for Aurora, Solar Glare, and Abrupt Gain Changes
This step in orbital processing includes one of the most significant changes from the way it was done before. The suborbits with ZERO LUNAR ILLUMINANCE flag bit goes into the processing of the Stable Lights product. However, these suborbits may have aurora, solar glare, and abrupt gain changes. The abrupt gain changes, seen in the OLS orbits through F15, were caused by the thresholds, which were altered incrementally to keep up with the changing maximum gain of the OLS. The maximum gain of the OLS was shifted to prevent saturation when the orbit shifted from night to day. Although the gain thresholds were adjusted weekly, they were not recorded as part of the data stream. Previously, an analyst had to go through each suborbit and visually screen for abrupt gain changes (through F15 satellite) and the presence of aurora and solar glare, selecting a start and end scanline of data to include in the Stable Lights product. It took several hours for an analyst to go through all the suborbits of a month and accomplish this task. However, in processing the extension series, Neural Network (NN) was used to segment the orbit and find the limits and remove parts of the DMSP orbit lit with aurora and solar glare.
The segmentation type is a bounding box. The near-pole parts of the orbit inside the bounding box detected by NN are believed to contain aurora and glare, and thus they are not used in further nighttime lights compositing. To build the NN, Detectron2 Artificial Intelligence (AI) library by Facebook Research, which provides state-of-the-art detection and segmentation algorithms for image analysis, was used [
21]. In particular, Detectron COCO Instance Segmentation Baselines with Mask based on the Regions with CNN features (R-CNN) algorithm was employed [
22] with the following settings for the network weights, learning rate, and maximum number of iterations (Equation (1)):
The NN was trained with 3650 nighttime half-orbits observed in F15 2018, where 3568 of these images were used for training and 82 for validation. The size of the images, which varied slightly in height, were 1465 (East-West) × ~6750 (North-South) pixels. Each of the images was at first hand-labeled by a professional analyst to mark the two scanlines limiting the outmost northern and southern boundaries of aurora and solar glare. After this initial task by the analyst, 4 h of training at the Google Colab platform made it possible for the network to recognize aurora and segment the orbits with 99% accuracy.
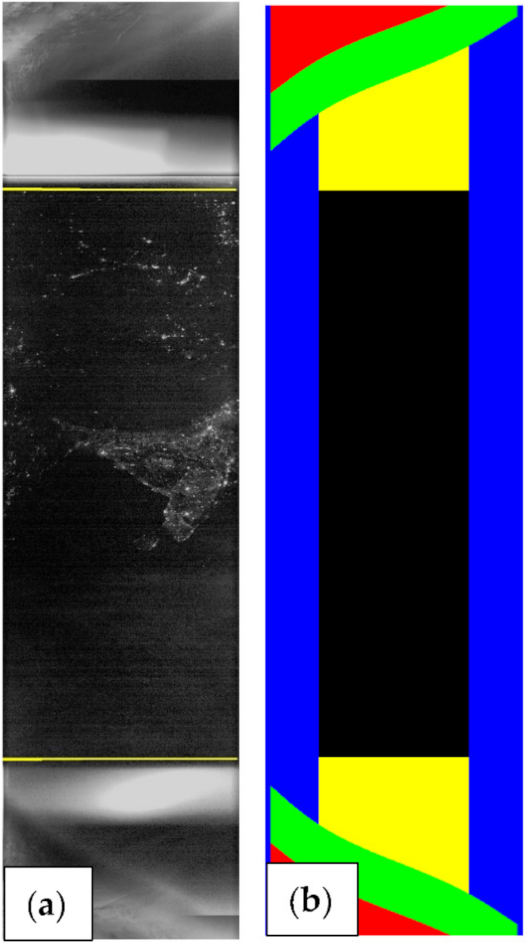
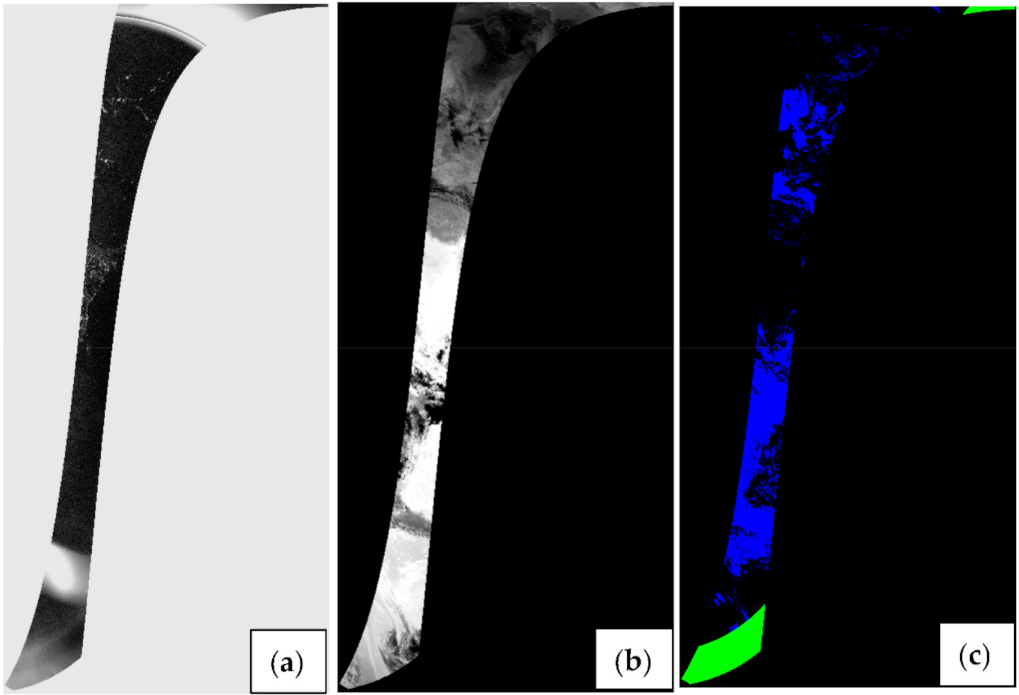
Figure 4 shows the lines selected by the NN algorithm.
2.1.3. Cloud Masks
Screening the OLS data for clouds and excluding cloudy data from the Stable Lights processing is critical for generating a quality product. Clouds alter the appearance of the nighttime visible band data. Heavy cloud cover will completely obscure the signal, while thinner clouds can alter the signal by making the lights appear dimmer and more spread out. There is no readily available cloud-mask product for the OLS visible band, so an algorithm was developed to create a cloud-mask by comparing the OLS thermal band to modeled surface temperatures. Thermal band data significantly colder than the modeled surface temperatures are labeled as clouds. The cloud-mask algorithm used for this Stable Lights extension series builds upon previous work detailed in Baugh et al. [
18].
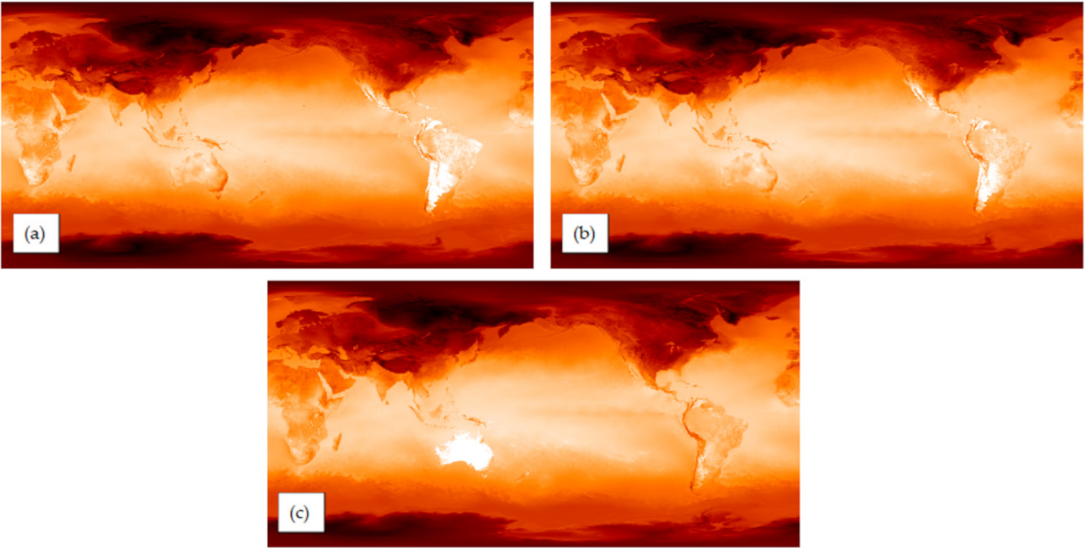
The modeled surface temperature grids used are part of the National Center for Environmental Prediction (NCEP) Global Forecast System (GFS) model runs [
26]. Operationally, the NCEP-GFS model generates global surface temperature grids every 6 h, with forecasts at 3 h intervals spanning multiple days into the future. The global grids are currently generated at spatial resolutions of 1, 0.5, and 0.25 degree. The 0.5 degree spatial resolution model runs were used for this Stable Lights extension series.
The cloud-mask algorithm first identifies all NCEP-GFS surface temperature files with model run (or 3-h forecast) times that are adjacent in time to the OLS orbit, or within the time of the OLS orbit. As the nighttime side of an OLS orbit is generally ~50 min in length, there are always two adjacent surface temperature grids and there can sometimes be an additional surface temperature grid whose time falls within the OLS orbital segment. For the example orbit, F15201801162050, the start time is 16 January 2018 20:50:49 and the end time is 47 min later at 21:38:00. The surrounding NCEP-GFS model runs are at 16 January 2018 18:00 and 17 January 2018 00:00. In addition, there is a third file, the 3 h forecast for the 16 January 2018 18:00 model run corresponding to 16 January 2018 21:00, that falls in the middle of the time range of our example orbit. These grids are shown in
Figure 5.
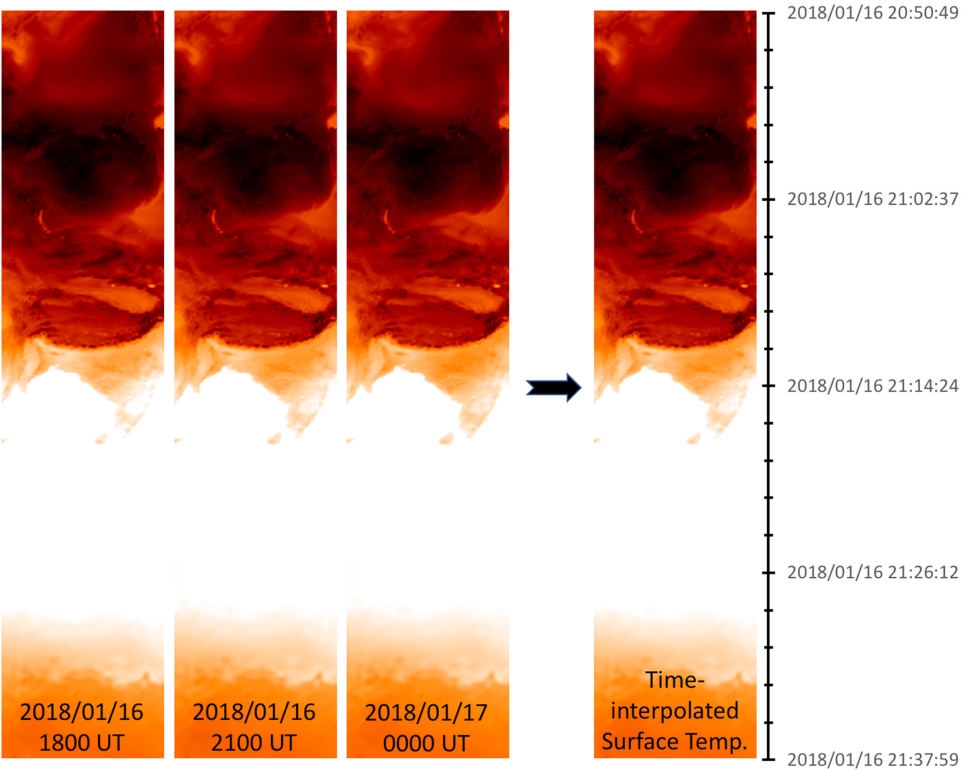
After identifying the appropriate surface temperature files, the global 0.5 degree grids are spatially mapped into the OLS swath. This is done using the center latitudes and longitudes of each OLS pixel and resampling the 0.5 degree surface temperature grids into the OLS swath using the bilinear resampling technique. This yields surface temperatures that spatially match the OLS thermal band. The resulting three surface temperature images for the example orbit F15201801162050 are shown on the left-hand side of
Figure 6.
Once the global surface temperature grids have been remapped onto the OLS swath, the final step is to do a temporal interpolation to more closely approximate the surface temperature at the time of the OLS orbit. This is done, for each OLS scanline, by taking the time-adjacent surface temperature grids and using linear interpolation to obtain a new surface temperature estimate at the time of the scanline. The resulting surface temperature image, time-interpolated to match the OLS scanline times, is shown on the right-hand side of
Figure 6.
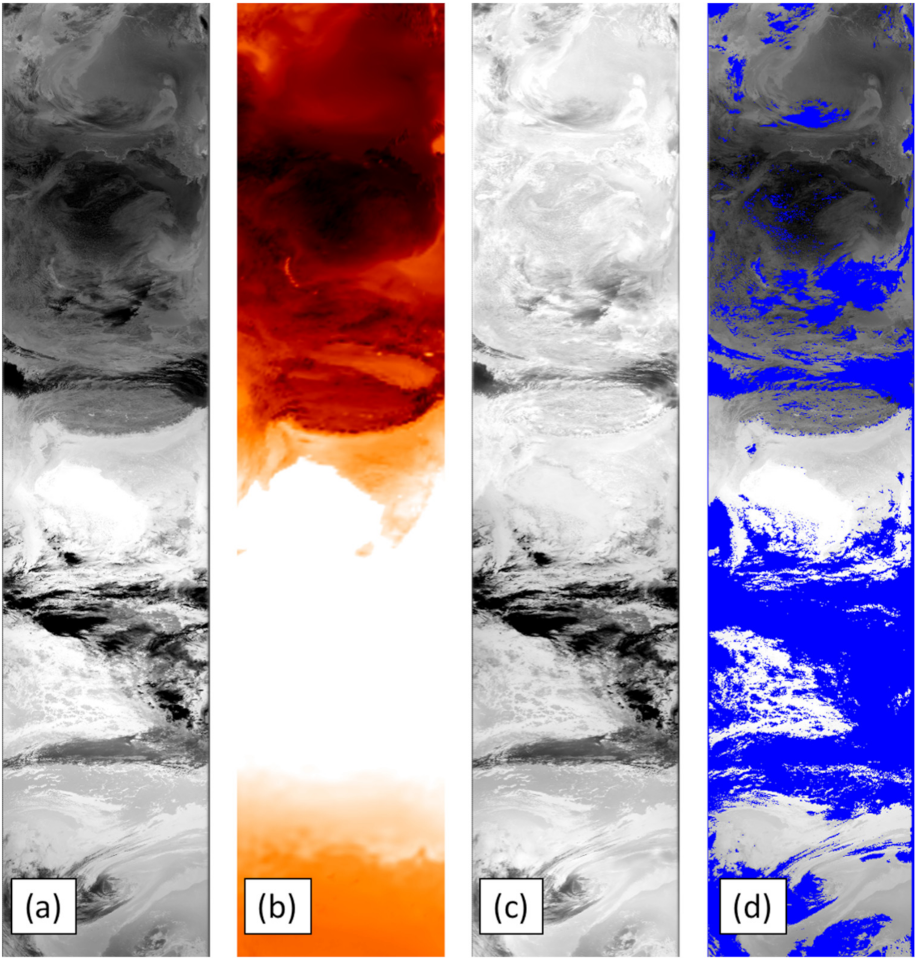
The final step in the cloud-masking process is to create a difference image of the time-interpolated surface temperature grid subtracted from the OLS thermal band. A cloud threshold value of −10 was empirically determined. Difference values less than the cloud threshold are considered clouds and are added to the companion flag by setting the CLOUDS PRESENT bit to 1. Graphical representations of the process and the resulting cloud mask for our example orbit F15201801162050 are shown in
Figure 7.
2.1.4. Reprojection
The OLS visible and thermal bands, and their companion flag bands, are reprojected into 30 arc-second grids. Before reprojection is done, the suborbits are restricted to latitude 65S and 75N. A further restraint that is enacted is the exclusion of the outer edges of the OLS swath, shown in blue in
Figure 4b, and these are areas with scan angles greater than 40.91 degrees. The edges are discarded because at the edge of swath, the OLS visible band shows an escalation of background noise, and the geolocation accuracy is reduced.
The reprojection software was designed to geolocate and reproject OLS data. The geolocation algorithm allocates latitudes and longitudes to each OLS pixel based on the scan angle, nadir latitude and longitude, satellite altitude, height and azimuth, and a digital elevation model of the Earth’s surface. Then, the reprojection software, using the nearest neighbor sampling technique, resamples the input OLS data and companion flag bands into output 30 arc-second grids. Examples of the output grids are shown in
Figure 8.
2.1.5. Making the Composite
To create the best quality visible band data composite, data are included only if the flag bits are set as:
DAYTIME: OFF
NIGHTTIME MARGINAL: OFF
ZERO LUNAR ILLUMINANCE: ON
CLOUDS PRESENT: OFF
NO DATA: OFF
The Stable Lights compositing process takes in all input visible and the accompanying flag grids and creates a suite of output files. The output files created include an average visible band image, an image of the number of cloud-free observations used, and histograms of input visible band data for each grid cell. The histograms help in the outlier removal process discussed in the next section (
Figure 9).
2.1.6. Outlier Removal
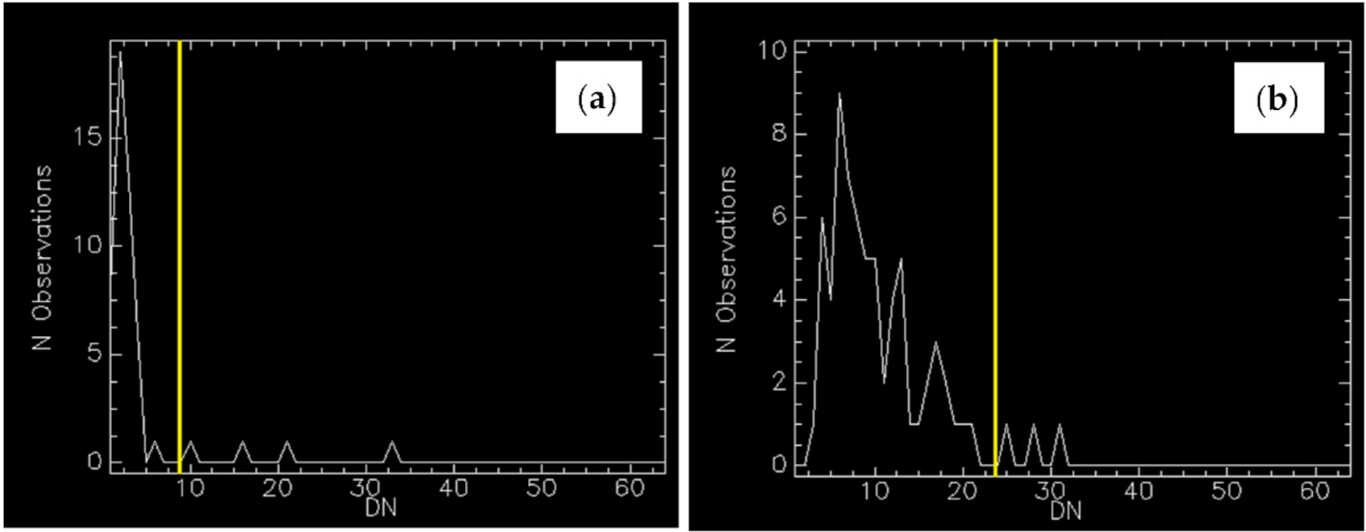
The average visible band composite does not differentiate between the transient lights from fires, fishing boats, and the more permanent sources of lights. Thus, to create a Stable Lights product that does not have the transient light sources, the composite histograms are examined for bright outliers.
The outlier removal algorithm is an iterative process performed on the composite histograms indicating the distribution of the input visible band data for each grid cell. The algorithm works by iteratively computing the standard deviation of observations. The largest visible band observation is removed, and the standard deviation is computed for the remaining observations. Then, the new standard deviation is compared to that of the previous iteration. This iterative process continues till the standard deviations converge, which is defined as a difference of less than 0.2. If more than 50% of the observations are removed, no convergence is stated. Generally, the histograms for grid cells with fires have a few high DN observations, but mostly low visible band DNs spread throughout the DN range of 0–63. On the other hand, grid cells with small towns have the bulk of their observations in the lower visible band DNs, but the spread of the values is higher than a no-light grid cell (
Figure 10).
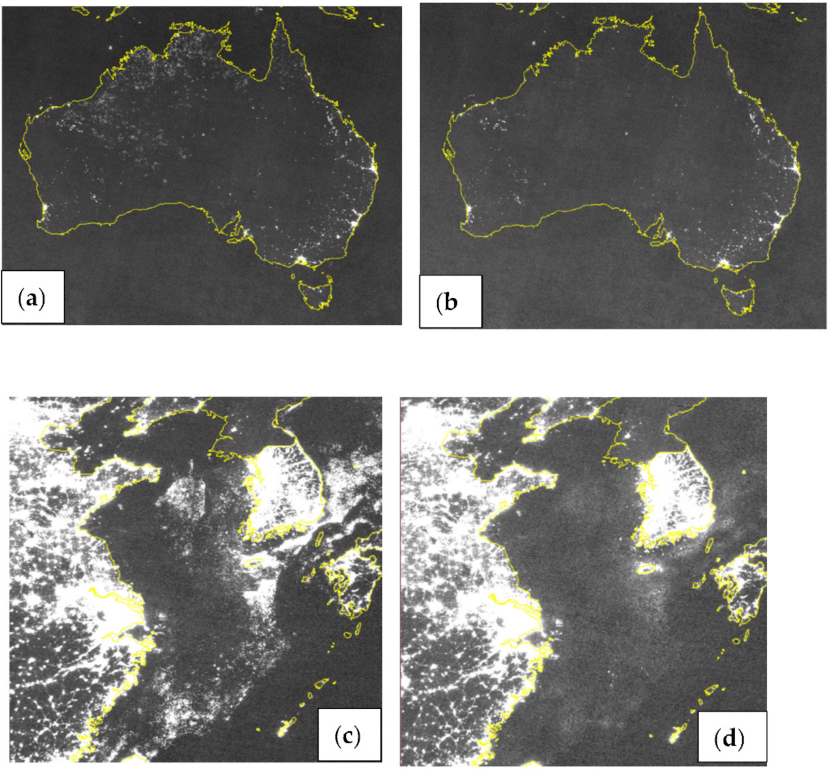
The output of this step is a new outlier-removed average visible band composite, which is created by using the observations remaining after the standard deviation convergence, or by taking into account all the observations when there is no convergence (
Figure 11).
2.1.7. Background Removal
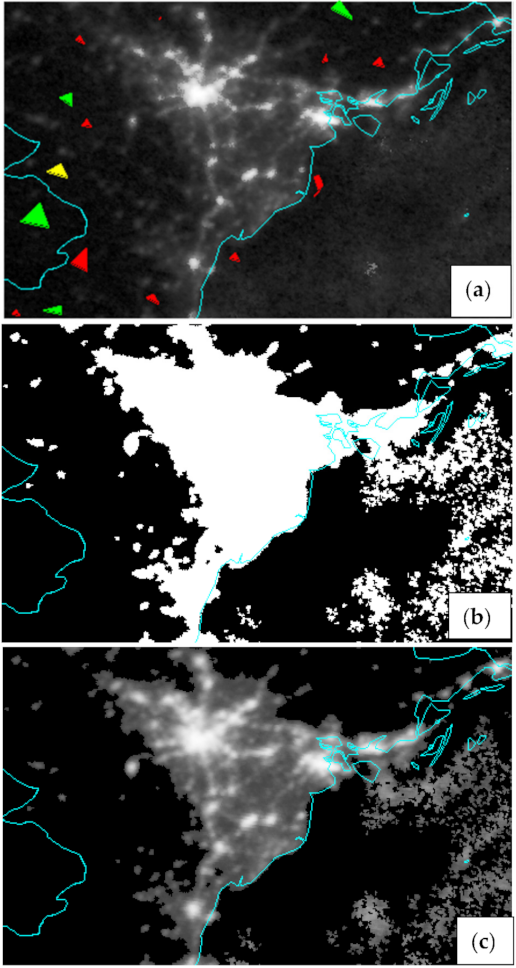
The last step in creating the Stable Lights product is to isolate areas in the outlier-removed composite, which have lights from those background areas where lights are absent. In the outlier-removed average composite, the background values change significantly from region to region. Thus, local background threshold values need to be computed. To gather samples of the background values, an analyst placed markers over areas in the outlier-removed composite, which visually appeared light-free. The outlier-removed composite was then processed in kernel-sized steps of 25 × 25 pixels. For each kernel, each of the 256, 400 × 400-pixel tiles covering this kernel were inspected. Areas in the kernel with values more than the maximum light-free values from the tile were tallied as “greater than background”. Areas that were tallied as “greater than background” at least 40% of the time were used to create the Stable Lights mask. The Stable Lights mask was then applied to the average visible band composite to create the final Stable Light composite product (
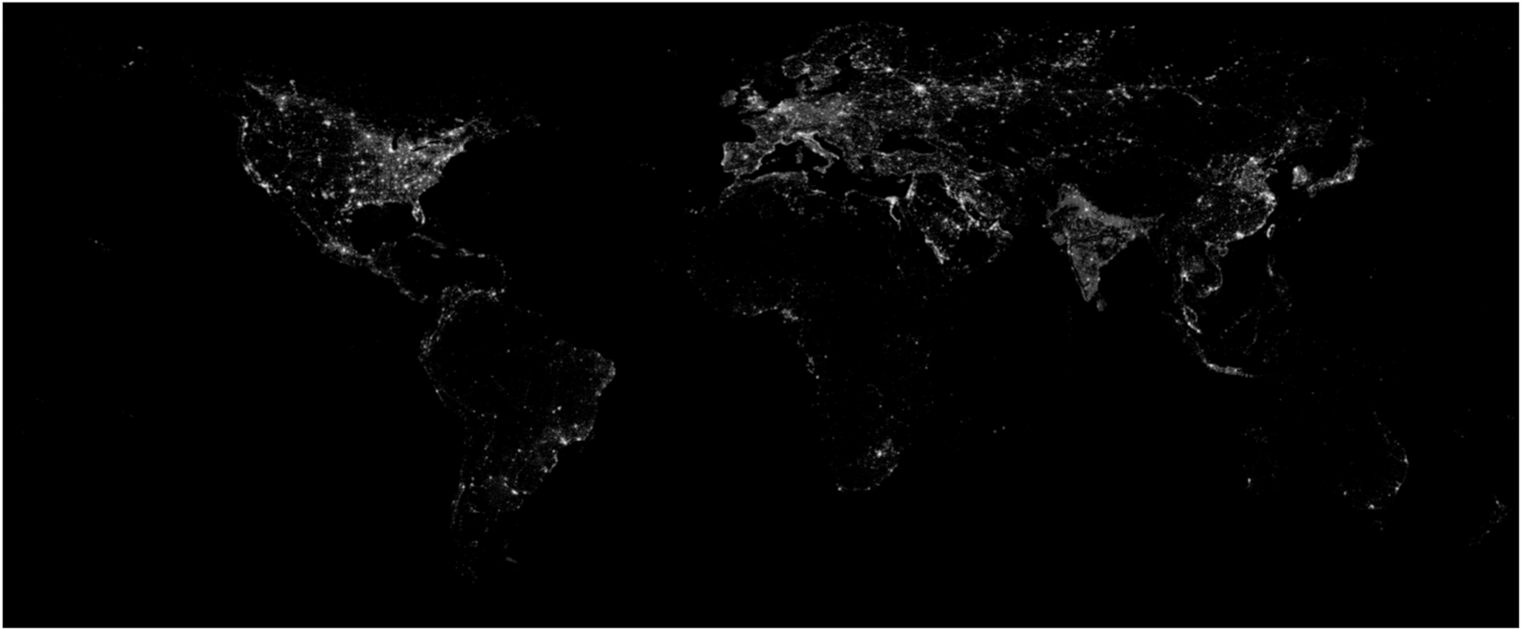
Figure 12).
2.1.8. Geographic Alignment
The DMSP-OLS nighttime light composites from satellite F18 appear to be shifted southwest of the ground location. For the previous DMSP satellite years, the LandScan population grid [
27] was used for ground-truthing as it correlates well with the DMSP global composites and has a global extent. A cross-correlation technique was developed to create a best-fit translation between the Stable Lights product and the LandScan population grid, and then the linear translation was applied to the Stable Lights product.
For the geographic alignment of the extension series, instead of the LandScan population grid, the resampled VIIRS DNB composite of 2016 was used. The geolocation algorithm for the VIIRS Day/Night Band (DNB) has far more precise control of its surface footprint [
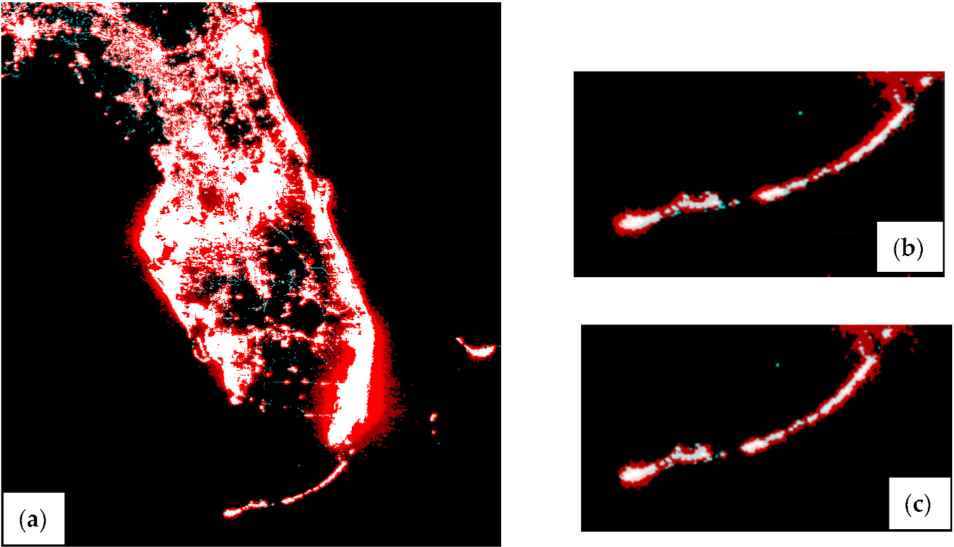
28], and thus it was used to align the DMSP extension series to the resampled VIIRS DNB grid of 2016 using the same cross-correlation and best-fit translation technique. The resampling of the VIIRS DNB grid from 15 arc-seconds to 30 arc-seconds was necessary so that both the DMSP and VIIRS grid were in the same resolution of 30 arc-seconds (
Figure 13).
2.2. Intercalibrating the 2013 Nighttime Images to Study Diurnal Patterns
For 2013, the EOG generated three global nighttime lights datasets with varying overpass times. The first one is the F182013 DMSP nighttime image from early evening with the satellite overpass time at around 7:30 p.m. The second one is the resampled VIIRS 2013 (VNL V2 2013 resampled from 15 arc seconds to 30 arc seconds with physical units in nW cm−2 sr−1) downgraded to DMSP digital numbers (DVNL) based on Neural Network analysis trained on VNL V2 2016 and DMSP F152016. The third variety of global nighttime lights of 2013 is the F152013 with an overpass time at pre-dawn, approximately at 4:30 a.m.
The existence of these three global nighttime images of 2013 at different overpass times provided us with the opportunity to examine the diurnal patterns of electric lighting. However, to remove the sensor effects from the diurnal analysis it was necessary to use one product as a reference and match the other two to the reference image. As stated earlier, the DMSP visible band does not have any in-flight calibration. On the contrary, the VIIRS Day/Night Band (DNB) has in-flight calibration, which is updated every month. Thus, to explore the diurnal patterns in electric lighting, the outlier-removed DMSP F152013 and F182013 were matched to the downgraded VNL V2 from 2013 (DVNL), which was used as a reference grid. The outlier-removed versions of DMSP F152013 and F182013 were used so that no background noise values would interfere with the intercalibration process.
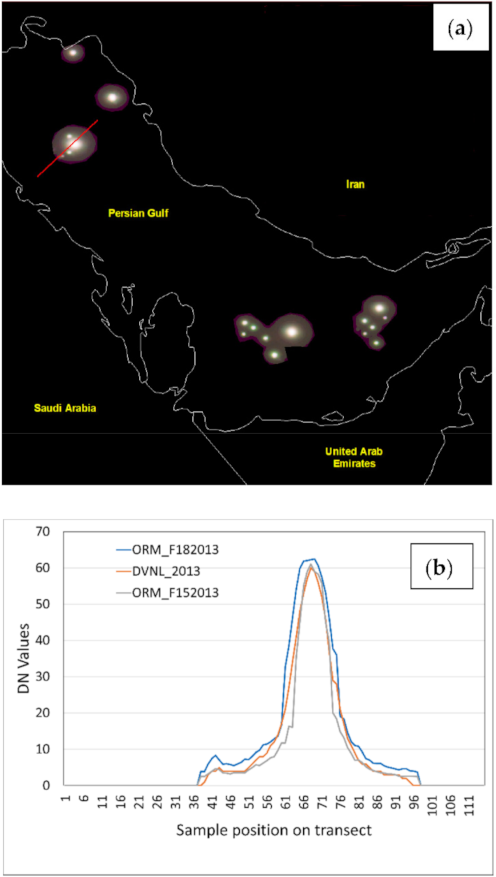
In order to develop an intercalibration, it was necessary to collect brightness data from a set of features that have no diurnal pattern. Through a thorough examination of several features, the flares in the Persian Gulf were determined to be the best candidates. The flares in the Persian Gulf are offshore and isolated from electric lighting sources. The flares form as large circular off-shore features with halos of lights created by the atmospherically scattered light. The outer edges of the halos correspond to the sensor’s detection limits and are quite similar for all three data sets. The DMSP products have patches in the center, which are saturated. The transect across one of the Persian gulf flares shows that the DN levels match closely even without intercalibration. This also reinforces that these flares are good candidates for developing the intercalibration (
Figure 14).
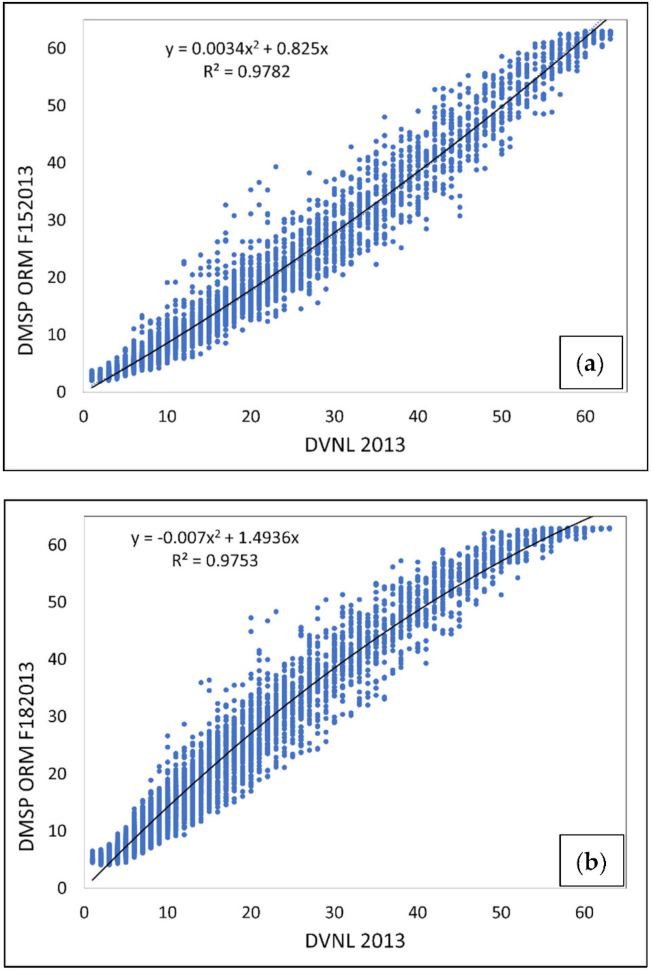
The intercalibrations were developed through second-order polynomial fits with DNVL 2013 on the X axis and outlier-removed DMSP F152013 on the Y axis, and then in the other equation taking DVNL on the X axis and outlier-removed DMSP F182013 on the Y axis. The intercepts were taken as zero based on the assumption that adjusted F182013 and F152013 would be zero when DVNL is zero (
Figure 15, Equation (2)). The derived coefficients were applied to the DMSP F152013 and F182013 images, respectively, to obtain the intercalibrated images:
4. Discussion and Conclusions
This study was based on the methods that were developed by Baugh et al. [
18] to create the Stable Lights images from 1992–2013. These data are available for download from
https://eogdata.mines.edu/products/dmsp/#v4_dmsp_download (accessed on 3 December 2021). In creating the extension series of DMSP, that is 2013–2019, one major modification was done, that is, instead of a professional analyst going through each orbit and selecting the upper and lower scan lines to exclude aurora and solar glare, Neural Network was trained to select those lines. This reduced the processing time considerably. The second change is that the cloud masking procedure was updated.
The CNN procedure developed by Nechaev et al. [
23] to produce analogs of DMSP nighttime images from the corresponding VIIRS images of the same year allow researchers to conduct various socio-economic studies through the entire time period of 1992–2019. This is indeed invaluable to the scientific community. As the development of the CNN procedure is the content of another paper that is in review, here we focused on the development of the intercalibration process, and the use of the intercalibrated images to study diurnal patterns of the lights.
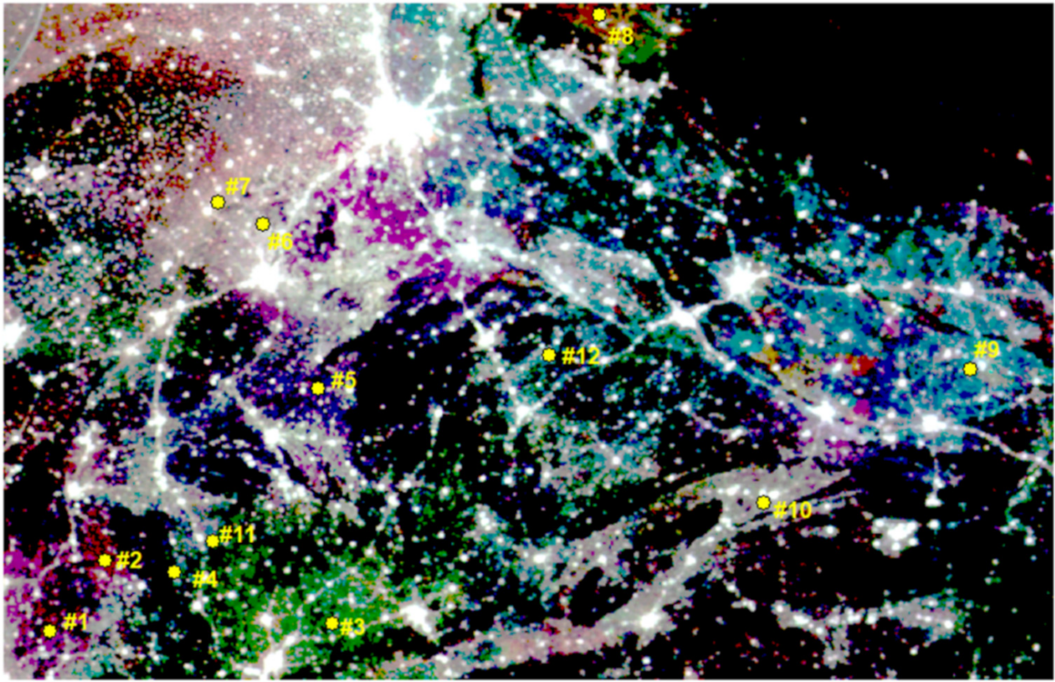
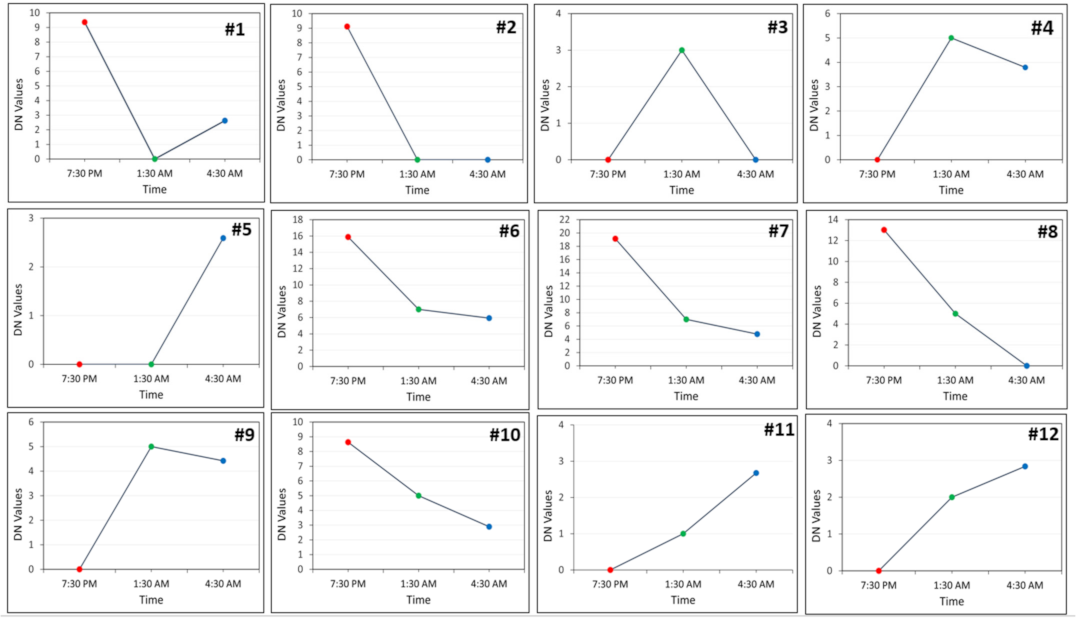
The orbital shift of the DMSP F15 and F16 satellites has made it possible to collect data for the pre-dawn time since 2012. The existence of global nighttime images for three time periods for 2013: 7:30 p.m. (DMSP F182013), 1:30 a.m. (DVNL 2013), and 4:30 a.m. (DMSP F152013), has made it possible to study the diurnal pattern of nighttime lights. For intercalibration, the flares in the Persian Gulf were selected because of the consistency in their DN values in the DMSP F152013, DVNL 2013, and DMSP F152013 images. Second-order polynomial fits were established, and coefficients were derived. The derived coefficients were used to calibrate the F152013 and F182013 images to match the DVNL 2013 image. The 12 profiles obtained from the points on the different hues of the RGB image of northern India, made from the three different overpass times of the DMSP and VIIRS satellites, is a pioneering approach for studying the diurnal patterns of nighttime lights.
We plan to extend the intercalibration between DMSP and VIIRS for 2014 through 2019, and to extend the study of diurnal patterns of lighting to other parts of the world. The EOG will continue to process the monthly and annual grids of DMSP nighttime images as long as usable data are collected and made available. The long time series of Stable Lights products and their intercalibrated versions will be immensely useful for researchers in the study of nighttime lights through the years, and also will aid in the various socio-economic studies that are conducted using nighttime lights. The diurnal patterns of lighting will enable an understanding of the lighting behavior of people residing in different parts of the world.
