Article

Distribution Modeling and Factor Correlation Analysis of Landslides in the Large Fault Zone of the Western Qinling Mountains: A Machine Learning Algorithm

1
MOE Key Laboratory of Western China’s Environment Systems, College of Earth and Environment Science, Lanzhou University, Lanzhou 730000, China
2
Technology & Innovation Centre for Environmental Geology and Geohazards Prevention, Lanzhou 730000, China
3
School of Earth Sciences, Lanzhou University, Lanzhou 730000, China
4
Institute of Public Safety Research, Department of Engineering Physics, Tsinghua University, Beijing 100084, China
5
Geological Environment Monitoring Institute of Gansu Province, Lanzhou 730050, China
*
Author to whom correspondence should be addressed.
Remote Sens. 2021, 13(24), 4990; https://doi.org/10.3390/rs13244990
Submission received: 7 November 2021 / Revised: 1 December 2021 / Accepted: 6 December 2021 / Published: 8 December 2021

Abstract

:
The area comprising the Langma-Baiya fault zone (LBFZ) and the Bailongjiang fault zone (BFZ) in the Western Qinling Mountains in China is characterized by intensive, frequent, multi-type landslide disasters. The spatial distribution of landslides is affected by factors, such as geological structure, landforms, climate and human activities, and the distribution of landslides in turn affects the geomorphology, ecological environment and human activities. Here, we present the results of a detailed landslide inventory of the area, which recorded a total of 2765 landslides. The landslides are divided into three categories according to relative age, area, and type of movement. Sixteen factors related to geological structure, geomorphology, materials composition and human activities were selected and four machine learning algorithms were used to model the spatial distribution of landslides. The aim was to quantitatively evaluate the relationship between the spatial distribution of landslides and the contributing factors. Based on a comparison of model accuracy and the Receiver Operating Characteristic (ROC) curve, RandomForest (RF) (accuracy of 92%, area under the ROC of 0.97) and GradientBoosting (GB) (accuracy of 96%, area under the ROC curve of 0.97) were selected to predict the spatial distribution of unclassified landslides and classified landslides, respectively. The evaluation results reveal the following. The vegetation coverage index (NDVI) (correlation of 0.2, and the same below) and distance to road (DTR) (0.13) had the highest correlations with the distribution of unclassified landslides. NDVI (0.18) and the annual precipitation index (API) (0.14) had the highest correlations with the distribution of landslides of different ages. API (0.16), average slope (AS) (0.14) and NDVI (0.1) had the highest correlations with the landslide distribution on different scales. API (0.28) had the highest correlation with the landslide distribution based on different types of landslide movement.

Graphical Abstract

1. Introduction

In the orogenic belt on the eastern margin of the Qinghai-Tibet Plateau, which experiences strong tectonic uplift and intensive surface erosion, landslides are the main surface and mass wasting process [1,2,3,4]. Landslides are the second most significant geological disaster in the area after earthquakes. With the rapid urbanization of the region in recent decades, the population density has increased rapidly and the infrastructure has gradually improved. However, frequent and intensive landslide disasters are causing increasing damage to human life and property [5,6]. In recent years, extreme disasters, such as the bursting of barrier lakes formed by landslides and the burial of villages by large landslides, have occurred frequently [7,8,9,10,11]. The landforms in the area are complex and there is a lack of detailed landslide inventory data in previous studies. Moreover, we lack a comprehensive understanding of the correlation between the spatial distribution of landslides and the various contributing factors.
The orogenic belt and the plateau margin, characterized by intense crustal collision and uplift, have the densest distribution of surface landslides [12,13]. The formation mechanism, spatial distribution, and factors influencing landslides in these areas have long been of concern to geomorphologists [14,15,16,17,18]. With the intensifying environmental impacts of human activities and the increasing frequency of extreme climatic events, determining the factors affecting the formation and distribution of landslides is becoming increasingly difficult [19,20]. At the same time, landslides have a profound impact on the geomorphology, ecological environment and human activities in the region [21,22]. Previous studies of landslides mainly used statistical relationships to address the relationship between structure, geomorphology, human activities and the spatial distribution of regional landslides. For example, Břežný et al. [23] conducted a statistical study of the slope direction, altitude, slope angle, local topography, and the relationship between topographic/bedding-plane intersection angle (TOBIA) and landslide distribution, with the aim of determining whether geomorphology or geology was the dominant control on landslide distribution. Pánek et al. [24] conducted a statistical analysis of the nuclear density distribution of deep-seated gravitational slope deformations (DSGSD), rock slides and flow-type landslides, and of the relationship between landslide type and altitude, local variability, slope and aspect. Malamud et al. [25] studied the spatial distribution of landslides in different regions by analyzing the relationship between landslide area and frequency. However, the main weakness of statistical analysis lies in its qualitative evaluation of the relationship between landslide distribution and different factors, and the strength of the relationship between landslide distribution and the contributing factors cannot be determined. Hence, there is a need to develop a quantitative approach to this problem, which can be combined with statistical analysis in order to provide a deeper understanding of the relationship between landslide distribution and the contributing factors. A landslide is a surface process with diverse movement processes and complex controlling and influencing factors. Different types of landslides often have different causal and control factors. In previous studies, the spatial distribution of landslide types was often evaluated based on generalized landslide types, and the susceptibility and correlation analysis of different landslide types are rarely carried out. In this paper, machine learning is used to evaluate the correlation between different types of landslides and the controlling factors. Machine learning has become an important method for extracting information and instructions from an increasing number of factors [26,27,28,29,30,31]. In this study, machine learning algorithm modeling technology was used to quantitatively evaluate the relationship between the spatial distributions of different landslide types and the contributing factors.
Located in the Bailongjiang Basin at the junction of the Western Qinling Mountains (WQM) and the eastern edge of the Qinghai-Tibet Plateau, two parallel large fault zones (the Langma-Baiya fault zone (LBFZ) and the Bailongjiang fault zone (BFZ)) are characterized by strong tectonic activity and severe topographic relief (WQM, LBFZ, BFZ are on Figure 1). This is one of the regions with the highest density of large landslides and the most serious landslide disasters in China [32,33]. In the mountainous areas of Western China, with frequent landslides, a dense population and scarce land resources, it is a challenging task for decision makers to comprehensively understand the spatial distribution characteristics, influencing factors and human-environment relationship of landslides, and to carry out science-based land management aimed to minimize the threat of geological disasters. In recent years, the availability of high-resolution images has enabled considerable progress to be made in compiling landslide inventories for many high-altitude areas with complex geomorphic conditions [34,35,36,37]. This has greatly improved our understanding of the mechanisms of landslide formation, the spatial distribution and the factors influencing landslides in remote mountainous areas. In this study, we used high-resolution remote sensing images to interpret landslides and to provide a comprehensive inventory of landslides in the fault zone, which was combined with field verification. On this basis, by collinearity analysis, 16 evaluation factors closely related to the formation, control and feedback effects of landslides, such as regional landforms, geological structure and human activities, were selected. Four widely-used models were selected using a machine learning algorithm to model the spatial distribution of unclassified landslides [38,39,40,41,42,43], and three landslide datasets were classified according to the landslide’s relative age, area, and type of movement. The aims of the present paper are (i) to select an optimal machine learning algorithm using the AUC curve and standard deviation, supported by a compilation of landslides, to quantitatively evaluate the relationship between causal factors and different landslide types; (ii) to determine the influence of different factors on the formation and distribution of landslides and the feedback effect of landslides on human activities; and (iii) to provide an effective reference for decision-makers in disaster prevention planning and land management.

2. Study Area

2.1. Geology and Geomorphology

The banded region comprising the LBFZ and BFZ is located in the transition zone between the western edge of the WQM and the eastern edge of the Qinghai Tibet-Plateau (Figure 1). The geodynamic processes of intensive orogenic uplift and the associated erosion in the region have produced a complex geological structure and mountain-canyon landforms. The Western Qinling Mountains–Songpan tectonic node located in the study area is regarded as an enormous tectonic node on a crustal scale. The combined action of the three tectonic systems of the Alps–Himalaya, Pacific Ocean, and circum-Siberia resulted in the completion of the major amalgamation of China [44]. The LBFZ is developed on the northern edge and is a left-lateral thrust strike slip fault zone which currently maintains a vertical thrust rate of 0.49 ± 0.08 to 1.15 ± 0.28 mm/a, and a sinistral strike slip rate of 0.51 ± 0.13 mm/a [45,46]. The BFZ is located in the southern margin of the study area and is also a left-lateral thrust strike slip fault zone. Current monitoring results show that the current thrust rate of the fault zone is 0.38 ± 0.12 mm/a and the strike slip rate is 1.37 ± 0.1 mm/a [46]. A grayish black fault gouge formed by strong tectonic compression is widely distributed along the fault zone (Figure 2a,b) [47,48]. Field observations and studies of several typical landslides in recent years show that the water sensitivity characteristics and microparticle accumulation of fault gouge control the formation and development of the sliding surface, and the geometric characteristics of the fault zone are important factors controlling the shape and process of evolution of landslides [33]. Hence, they are the dominant controls on the geomorphic evolution of the region. The geological structure undoubtedly plays an essential role in landslide development in the study area. The distribution of stratigraphic units in the region is closely related to the main linear structures. The nappe on the northern and southern sides is mainly composed of hard marine limestone of Carboniferous to Triassic age, with a large stratum thickness and strong lithological integrity. In the valley basin, sandwiched by the nappe, weak metamorphic phyllite and a slate interlayer formed by the multi-stage structures of the Indosinian period are distributed; they have a weak lithology and hence are the main material component of slope erosion.
Figure 2. The black fault gouge distributed along the fault zone composing the sliding surface or landslide mass. (a) Jiangdingya landslide, (b) Yahuokou landslide.
Remotesensing 13 04990 g002
The geomorphology of the study area is the result of the combined influence of orogenic-scale tectonic processes, the local structural characteristics of the thrust–strike–slip fault zone, and retrogressive erosion by the Bailong River. The altitudinal range of the area is 991–4761 m a.s.l. In general, the regional landforms are characterized by high mountains on the north and south sides and by river valleys. The nappes on the north and south sides form a NW-SE striated alpine area. Altitude in the region gradually decreases from northeast to southwest. The Diebu area to the northeast is characterized by high-altitude mountain landforms, narrow river valleys, and large differences in geomorphology on both sides of the Bailong River, of which the mountains on the north side are dominant (Figure 1). The landforms gradually change toward the southeast and develop the characteristics of a narrow alpine area with river valley landforms. The landforms on the both sides of the river are basically symmetrical, and river valleys have become one of the most important landforms in this section. Intensive tectonic uplift during the Cenozoic has caused the Bailong River to develop a widely distributed base terrace in this section, and our investigations have revealed that the Bailong River has formed seven terraces in this section. The unique geomorphic landscape of the area is produced by the combined action of the weak rock mass in the fault zone and by fluvial erosion. Giant landslides parallel to the strike of the fault zone and river are widely distributed along the fault zone. Constrained by the geometry of the fault zone and fluvial erosion, the landslides distributed along the fault zone are characterized by high and steep scarps which have developed in the process of long-term geomorphic evolution. The geomorphology extending in the southeast direction is characterized by a wide valley and planation surface.
In terms of climate type, the Bailong River Basin belongs to the transition between subtropical and tropical climates in the Northern Hemisphere. The climate is controlled by the monsoon system. The annual average temperature exceeds 14 °C, and the annual average rainfall is 450–800 mm. The rainfall has a pronounced seasonality, being concentrated in June to October, and is characterized by heavy rainfall and rainstorms. Rainfall events are the main external factors inducing regional landslides. The vegetation coverage in the basin is unevenly distributed, and gradually decreases from north to south. Due to the large topographic height difference, there is a pronounced vertical climatic zonation. The land use types in the basin comprise 10 categories, including dry land, grassland and irrigated farmland, etc. The impact of human activities on the regional ecological environment is very significant. Poorly-located settlements, vegetation damage and adverse land use have caused serious soil and water loss in recent decades. From 1952 to 1990, the entire basin area decreased by 126,500 ha, potentially increasing the frequency of geological disasters [49].

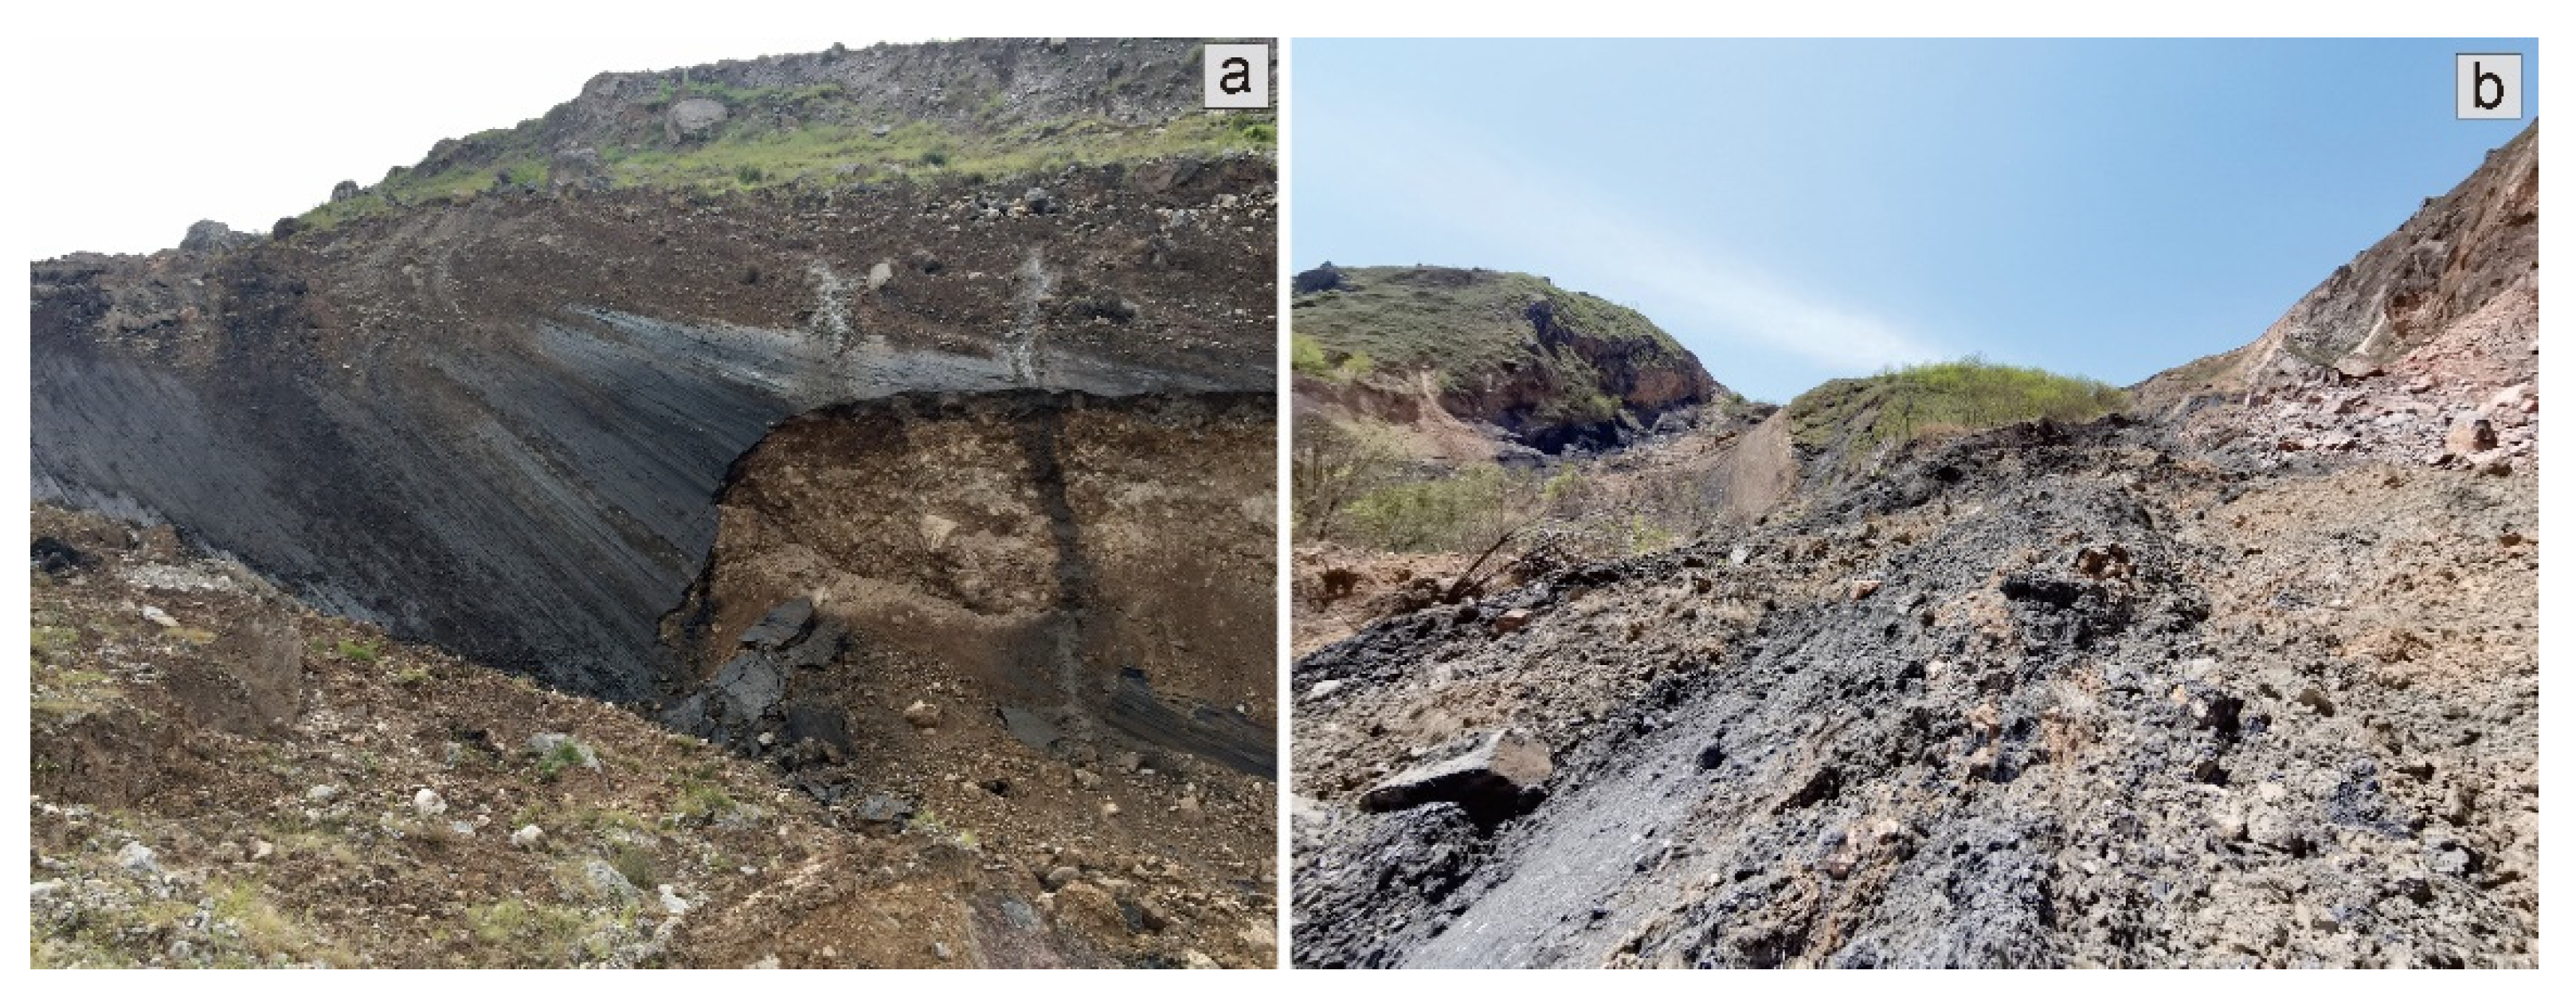
2.2. Overview of Landslide Disasters
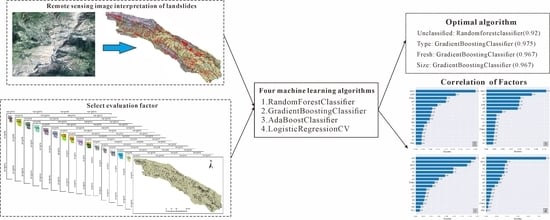
Landslides induced by rainfalls and human activities occur every year in the study area. The dense population, infrastructure, and cultivated land in the valley area and in the hills of the fault zone are faced with a sudden geological disaster at any time. With the growing awareness of geological disaster prevention and control in China, the region is now the national focus of geological disaster research. The scale, age, type and spatial distribution of landslides in the study area are extremely complex. There are huge ancient landslides with areas of several square kilometers (Figure 3a,b), and landslides that are hundreds of years old, together with many recent landslides. The landslides are concentrated in fault zones and on both banks of the river valley. Our research group has participated in several rescue and relief responses to several large landslides in recent years. For example, on 12 July 2018, the Jiangdingya large accumulation landslide in Nanyu Township, Zhouqu County (Figure 3d), was reactivated, with a volume of 5 × 10⁶ m3, the landslide blocked most of the Bailong River channel, forming a weir plug backwater and raising the level of the Bailong River by 8 m within a short time, inundating bridges, roads, hydropower stations, and most of the residential buildings in Nanyu township (Figure 3e) [9]. The Yahuokou landslide in Zhouqu County on 19 July 2019 is a typical old landslide in the fault zone (Figure 3c); the last episode of violent landslide activity blocked the Min River in 1989, forming a barrier lake. It is a long strip landslide formed along the groove of the fault zone, with a length of 2 km and an average width of less than 100 m. After the landslide, the village highway and the factory buildings on the lower edge of the slope were destroyed [10]. On 16 August 2020, a continuous rainstorm in the Bailong River Basin induced a large number of shallow landslides, resulting in serious economic losses. On 18 January 2021, the Lijie landslide, in Beishan, Lijie Town, Zhouqu County, was reactivated (Figure 3f). The landslide had a volume of ~4.1 × 10⁶ m3 and directly threatened the lives of thousands of people in the town. The available space in the Bailong River Basin is extremely limited, and the topography of high mountains and valleys forces many of the inhabitants to focus their residential living, agriculture and infrastructure construction on the gentle slope formed by the accumulation of old landslides, especially on the large accumulation areas formed by large landslides in the fault zone during their long process of evolution, which has become the location of major cities and towns. In addition, human impacts on the ecological environment, together with engineering construction, are increasingly important factors inducing landslides. Unsuitable forms of land use are one of the main reasons for the intensification of the effects of landslide disasters.
Figure 3. Typical landslides and disaster effects in the study area. (a) Xieliupo landslide; (b) Suoertou landslide; (c) Yahuokou landslide; (d) Jiangdingya landslide; (e) barrier lake formed by the Jiangdingya landslide; (f) Lijie landslide.
Remotesensing 13 04990 g003

3. Data and Methods

3.1. Landslide Inventory

The existing landslide inventory data in the study area are relatively limited, including the location of landslide concentrations and an inventory map of selected large landslides [50,51,52]. We have collated existing landslide data for recent landslides, and with this as a foundation we used the 1-m resolution optical image data provided by Google Earth for interpretation, and then produced a landslide map of the study area which was verified in the field. Landslide interpretation is based on the common landslide characteristics of arcuate scarps with adjacent hummocky topography, tension cracks, grabens, undrained depressions, bulges and lobes. According to the type of landslide inventory, a landslide map provides a list of geomorphic and historical landslides in the area [53]. In this study, three types of landslides were classified according to the type of movement, degree of preservation, and spatial scale. According to the landslide classification proposed by Varnes [54] and Hungr et al. [55], we classified the landslides based on the type of movement. Additionally, according to the geomorphic characteristics interpreted from remote sensing images, the degree of preservation of landslide mass, visual characteristics, and the degree of human activity, the landslides were categorized as ancient, old, and recent landslides. It should be noted that due to the large number of landslides in the study area, the absolute age of landslides cannot be obtained by dating method. Therefore, the age obtained according to the characteristics of landform, image and human activities is divided into relative ages. According to area, the landslides were categorized as follows: giant (>1.0 km2), large (1–0.1 km2) and small and medium-sized (<0.1 km2). The integrity and quality of the landslide inventory data directly affect the results of any correlation analysis. For quality evaluation, we selected a representative area for on-site verification (Figure 1). The selected area was a 10 km × 36 km rectangle with the densest landslide distribution in the Zhouqu section, and 418 landslides were recorded. In the process of field verification, except for 71 cases that could not be verified due to traffic restrictions, 336 landslides were verified to exist on site and 11 were not interpreted.

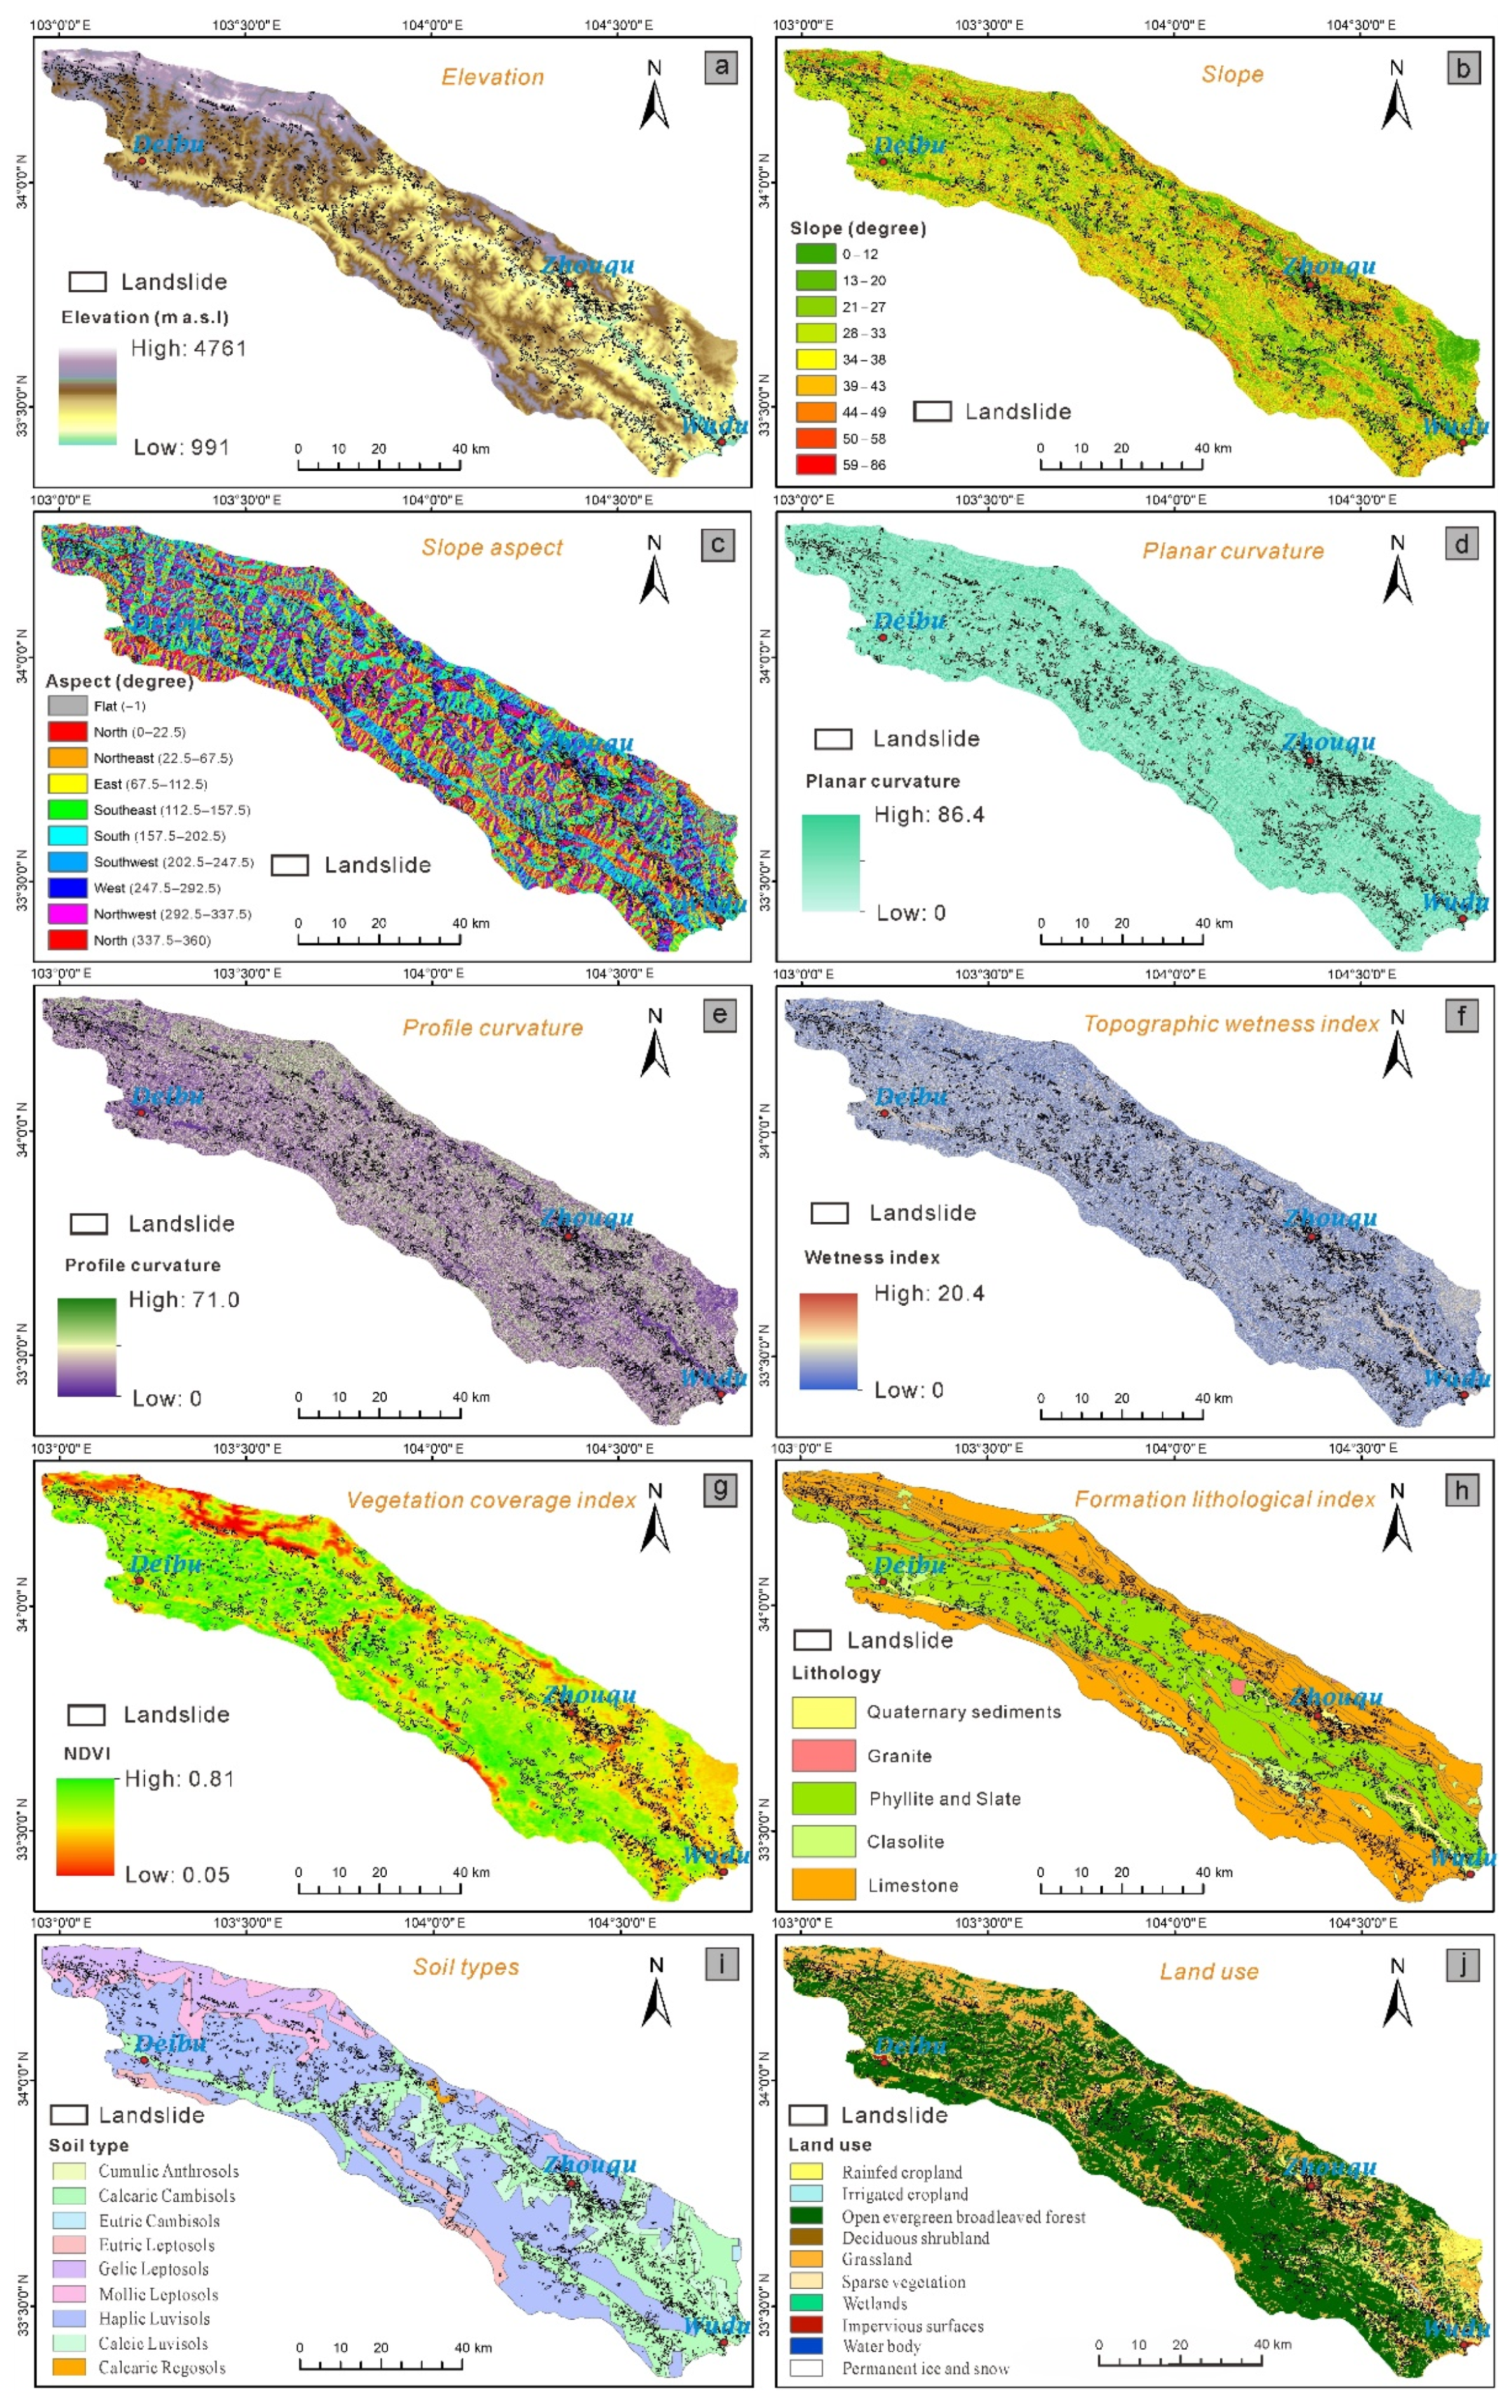
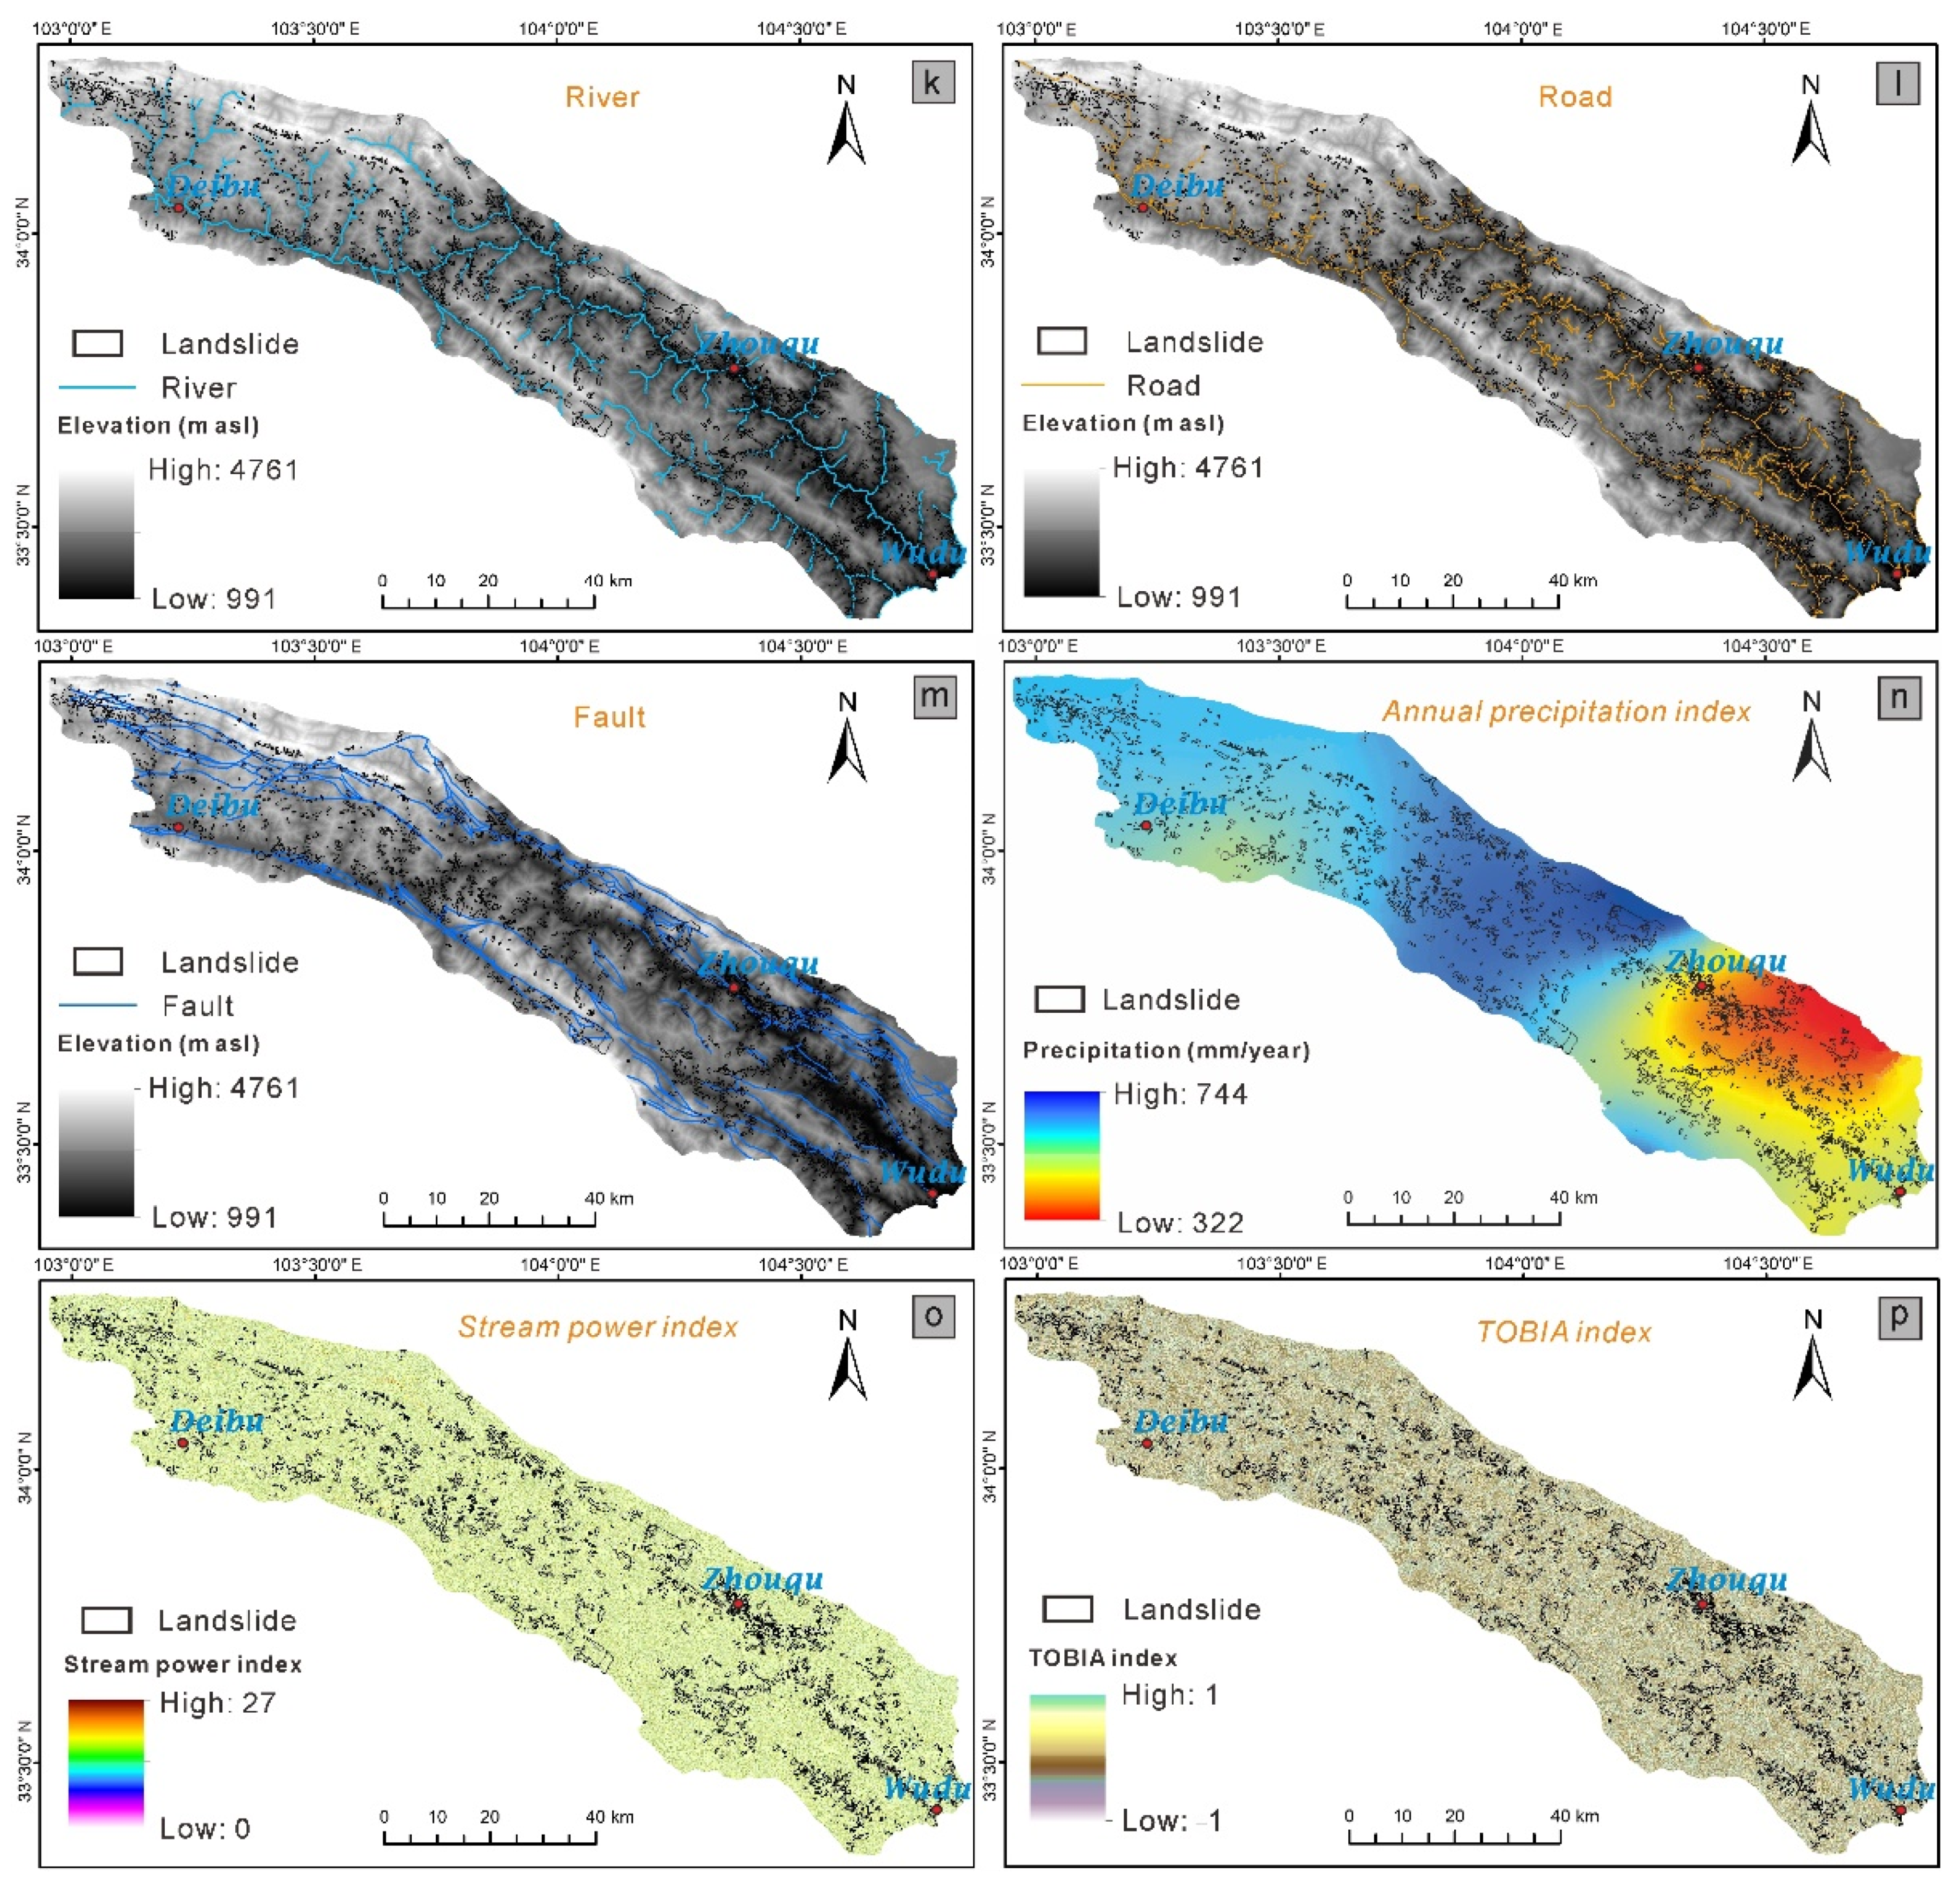
3.2. Predictor Variables

The Western Qinling fault zone has experienced strong orogenic uplift and compression in the geological past, forming a widely distributed fault fracture zone and triggering fluvial incision, forming a complex topographic landscape. Extreme rainfall events are the main external factors inducing landslides. In recent years, intensive human activities have had a profound impact on the formation and development of landslides in the study area. Therefore, we selected 18 factors related to geology, landforms, rainfall and human activities to analyze their correlation with the spatial distribution of landslides (Table 1 and Figure 4). The extraction of geomorphic factors is based on the spatial resolution of the DEM data (12.5 m × 12.5 m); geological factors are derived from the 1:100,000 geological map of China; and soil data is from the Nanjing Soil Institute and land use is from the GLC-FCS30-2020 global 30 m fine surface cover products. The 18 factors are described below.
Elevation (EL): alpine-canyon areas have significant zonation characteristics with decreasing altitudinal range, and the main factor responsible is climate. There are large differences in rainfall, thickness of the accumulated weathered material, and plant communities according to altitude. The higher the altitude, the less the rainfall, the smaller the depth of the accumulated clastic materials, and the greater the degree of bedrock exposure [56].
Average Slope (AS): in a slope environment with the same material composition and hydrological conditions, the slope angle directly determines the slope stability. A landslide is more likely to occur in a slope unit whose angle is close to the critical value [57].
Slope aspect (SA): systematic research has shown that the microclimate varies according to slope aspect, which affects the weathering rate, nature of the soil layer, vegetation type, and evapotranspiration processes [58]. Qi et al. [31] studied a group of landslides induced by heavy rainfall in the Tianshui area in 2013 and found that slope aspect was the primary factor affecting the development of shallow landslides.
Local relief (LR): statistical analysis of many regions has revealed significant differences in the quantity of landslides with topography. Generally, the greater the topographic relief, the larger the number of landslides, which may be related to differences in potential energy and the conditions of the slope materials. The extraction radius of local topographic relief data used in this study is 1 km.
Surface roughness (SR): refers to the roughness of the surface, which is related to the erosion rate of the surface [59].
Planar curvature (PLC): is defined as the rate of change of slope or slope direction in a specific direction [60]. Planar curvature refers to the curvature of contour lines formed by the intersection of a horizontal plane and the surface, with positive values representing a convex slope curvature and negative values a concave slope curvature. The impact of PLC on slope erosion processes is via the convergence or divergence of water flow, and PLC also affects the rainfall infiltration rate. Profile curvature (PRC) is the curvature of the vertical plane parallel to the slope direction and is a measure of the rate of change of slope. It directly controls the flow velocity and slope erosion.
Topographical wetness index (TWI): differences in surface morphology will lead to differences in the transport, convergence and infiltration of surface water and groundwater. The TWI is widely used to describe the impact of topography on the location and the magnitude of the runoff saturation source area. The following formula has been proposed to calculate TWI under the assumption of steady-state conditions and mean soil properties [61]:
TWI = l n ( A S / t a n β )  
where the specific catchment area (m2 m−1), A S , is a measure of the surface of shallow subsurface runoff at a given point on the landscape, and is integrating the effects of the upslope contributing area and catchment convergence and divergence on runoff; and β is the slope.
Vegetation coverage index (NDVI): the influence of vegetation on slope stability is closely related to the depth of the slope failure surface. The network formed by plant roots plays an important role in maintaining soil stability and inhibiting shallow landslides. The NDVI used in this study is calculated from the 8-m resolution multispectral image obtained by China’s Gaofen-1 satellite. It is calculated as:
NDVI = ( I R R ) / ( I R + R )  
where the I R -value is the infrared portion of the electromagnetic spectrum, and the R -value is the red portion of the electromagnetic spectrum.
Formation lithological index (FLI): internal and external differences, such as mineral composition and the mechanical fatigue of the rock mass, may result in substantial differences in the strength of different rock mass types, which may affect the spatial distribution of landslides. According to lithologic characteristics, rock mass strength is divided into five levels: very hard, hard, alternating soft and hard, soft, and very soft. The corresponding rock mass types are granite, limestone, phyllite or slate interlayers, clastic rocks, and Quaternary sediments.
Soil type (ST): the particle grade, clay content and permeability of different soil types determine the degree of soil cohesion and the internal friction angle, thus affecting the spatial distribution of landslides.
Land use (LU): according to existing spatial statistical principles the development of landslides in different types of land use shows a clustering effect, because different land use types directly affect surface hydrological processes, such as evapotranspiration and rainfall infiltration.
Distance to river (DR): rivers in orogenic belts are the main agent of material erosion and its removal. Fluvial erosion includes vertical erosion and lateral erosion. Irrespective of which erosional process determines whether the slope is close to the river, it is likely to be eroded to form a through failure surface. Therefore, in statistical analysis, rivers are often regarded as one of the most important factors affecting landslide distribution.
Distance to road (DTR): in recent years, there has been increased infrastructure development in the western mountainous areas and surfaced roads have been constructed that are accessible for almost all of the inhabitants. The associated excavation work may alter the local stress environment of the slope and affect the slope stability. Hence, we downloaded the Google Earth image for 2020 and interpreted all of the roads that are now distributed within the study area.
Distance to fault (DF): densely distributed faults, joints, cleavage and other structural planes formed by strong tectonic activity can damage the integrity of the rock mass [62], and the degree of damage generally decreases with the distance from structural lineations. The formation of a failure surface or composite failure surface in a slope is generally developed along the structural foliation or along a densely distributed plane structure, which will reduce the strength of the rock mass, potentially producing a failure surface [63,64].
Annual prediction index (API): rainfall is one of the most important factors inducing landslides. The rainfall data used in this study is the average annual rainfall from 2000 to 2010.
Figure 4. Maps of the model evaluation factors. (a) Elevation. (b) Slope angle. (c) Slope aspect. (d) Planar curvature. (e) Profile curvature. (f) Topographic wetness index. (g) NDVI. (h) Formation lithological index. (i) Soil type. (j) Land use. (k) River. (l) Road. (m) Fault. (n) Annual precipitation index. (o) Stream power index. (p) Topographic/bedding-plane intersection angle (TOBIA).
Remotesensing 13 04990 g004aRemotesensing 13 04990 g004b
Stream power index (SPI): is a measure of the erosive power of flow, assuming that the flow is proportional to a specific ponding area. It is one of the main factors controlling the slope erosion process [61], and is expressed as:
SPI = A S t a n β  
where AS is the specific watershed area (m2 m−1) representing a measure of surface of shallow subsurface runoff at a given point on the landscape and β is the slope (degrees).
Topographic/bedding-plane intersection angle (TOBIA): this is the spatial distribution field that produces a geometric alignment between the direction of the terrain and a geological layer. Previously, there was limited evaluation of landslide susceptibility. However, an increasing number of studies have found that the TOBIA index significantly affects the spatial distribution of landslides in an orogenic belt. Therefore, in this study we attempted to consider TOBIA as a factor related to structure. The stratum occurrence data used are from the 1:100,000 geological map, and the index is expressed by the following formula:
TOBIA = c o s θ c o s S + s i n θ s i n S c o s ( α A )  
where θ is the embedded dip (0–90°), S is the topographical slope (0–90°), and the α index values range from +1 to −1. High values indicate a conformity between the slope, slope aspect, dip, and dip aspect; and low values indicate unaligned orientations [65].

3.3. Parameter Preprocessing and Resampling

Many parameters are often included in this type of study and several may be strongly correlated. Such strongly correlated parameters introduce a degree of redundancy and also affect the stability of the model. In order to overcome the multicollinearity problem, we preprocessed the selected parameters. Specifically, we calculated a heat map of the parameter correlation matrix (Figure 5), which is based on Seaborn Python visual calculation (https://seaborn.pydata.org/generated/seaborn.heatmap.html#seaborn.heatmap, accessed on 10 November 2020). According to the matrix heat map, we removed the parameters with a correlation coefficient > 0.7, as proposed by Dormann et al. [66]. As a result, LR and SR were excluded and the remaining 16 parameters were selected for spatial modeling.
The ratio of non-landslides (NLS) to landslides (LS) of the grid samples in the study area is about 5:1, which results in machine learning paying more attention to the classification of NLS. In order to maintain a balance of the number of samples, SMOTE (synthetic mineral oversampling technology) was used to increase the number of LS samples. After resampling, the sample ratio of LS and NLS was 1:1, which achieved a balance.

3.4. Model Algorithm

We selected four machine learning algorithms: Random Forest (RF), GradientBoosting classifier (GB), AdaBoost classifier (Ada), and Logistic Regression CV (LRCV). The four models were used with typical configurations for most applications. The first three models are integration models. In many recent studies, an integrated model combining multiple algorithms has shown great potential for the susceptibility evaluation of landslide disasters and has strong regional adaptability [29]. In this paper we selected three integrated models that had performed well in the past for evaluation. As a widely-used traditional model algorithm, logistic regression can be compared with an integrated model.
The concept of the ensemble method is to combine multiple classifiers (or to combine the various parameters of an algorithm) to improve the effect of each classifier. Classifiers can be divided into two categories: average method and boosting method. RF uses many classification trees (a “forest”) to stabilize model prediction. These trees are suitable for resampling randomly selected observations with bootstrap resampling. Each decision of the tree is based on randomly selected predictors, and the prediction of category allocation is determined by the majority vote of all trees. The proportion of trees predicting a landslide in the set can be used as an indicator of landslide susceptibility [27]. Schapipe et al. [67] refined the boosting algorithm and obtained the AdaBoost classification algorithm; using the concept of iteration in the process of using the sample training set, they selected the key classification features, increased the weight of the samples incorrectly classified in the previous round, reduced the weight of the correctly classified samples, repeated the process many times, and by this method gradually trained each weak classifier. The weighted majority voting method is used to adjust the weight of each weak classifier. Finally, the weak classifier with the lowest weight coefficient is selected to construct a strong classifier. The AdaBoost algorithm has high adaptability and flexibility. Boosting is an ML technique that can be used for regression and classification problems. It produces a weak prediction model (such as a decision tree) at each step, and weights it into a total model. If weak model prediction at each step generates a unanimous gradient direction of loss function, then it is termed Gradient Boosting [68].
LRCV is a classical classification method in statistical learning. Estimating the probability of an event by logistic regression is a fitting method for classifying records based on the values of conditional variables. It is somewhat similar to linear regression, but uses category target variables instead of a data range. The advantage of logistic regression is the ease of calculation, and when dealing with classification problems the fitting process is very simple and rapid, but there is usually the problem of insufficient fitting.

3.5. Fitting, Optimization and Evaluation of Models

We selected the training data in the cross-validation dataset to train the selected initial model, and then sorted the models according to the average accuracy score (Acc) of the test data in the cross-validation dataset. Acc represents the correct allocation rate of all samples participating in the modeling. The parameter grid method and network search cross validation method are used to fit the model, and the AUC (area under the curve of ROC) scoring method is used to find the best super parameters. The model is cross-verified 10 times according to the optimal super parameters, and the model reordered according to the average accuracy score of the test data. Evaluation uses the average accuracy of the validation dataset, the area under the ROC curve and the standard deviation (Std) to evaluate model performance.

4. Results

4.1. Landslide Inventory and Classification

A total of 2765 landslides within the fault zone (with an area of 5924 km2) were recorded (Figure 1). Visually, the landslides in the area show a significant degree of spatial clustering. The spatial aggregation density and disaster effect of large landslides and giant landslides in the study area are rare in China. The cumulative area affected by all landslides in the entire area is 548.7 km2, accounting for 9.2% of the total study area. There are 80 giant landslides with an area of more than 1 km2, 1111 large landslides with areas from 1 km2 to 0.1 km2, accounting for 40% of total landslides, and medium and small landslides account for 57% of the total (Figure 6a). According to the surface morphological characteristics (preservation degree of landslide scarp, development degree of gully of landslide mass, preservation degree of landslide accumulation mass, etc.), vegetation coverage, indicators of human activity (farmland reclamation and housing construction), and chronological information, the landslides were divided into three age categories: ancient landslides, old landslides, and recent landslides, accounting for 47.5%, 24.2% and 28.3% of total landslides, respectively (Figure 6b). According to the landslide classification method of Varnes [53] and Hungr et al. [54], landslide types include fall, slide, flow, topple and complex landslide, accounting for 16.8%, 69.3%, 11.9%, 1% and 1% of total landslides, respectively (Figure 6c). Many large landslides have undergone repeated dormancy and reactivation in their process of evolution. For example, the Xieliupo landslide has caused eight barrier lake-blocking events since 1900 [69]. Generally, the development of a landslide is controlled by long-timescale factors, such as tectonic uplift or climate change. Based on the surface deformation and frequency of landslide events in recent years, the area remains in an active period of landslide development, and future extreme rainfall events are very likely to cause unpredictable casualties and property losses.

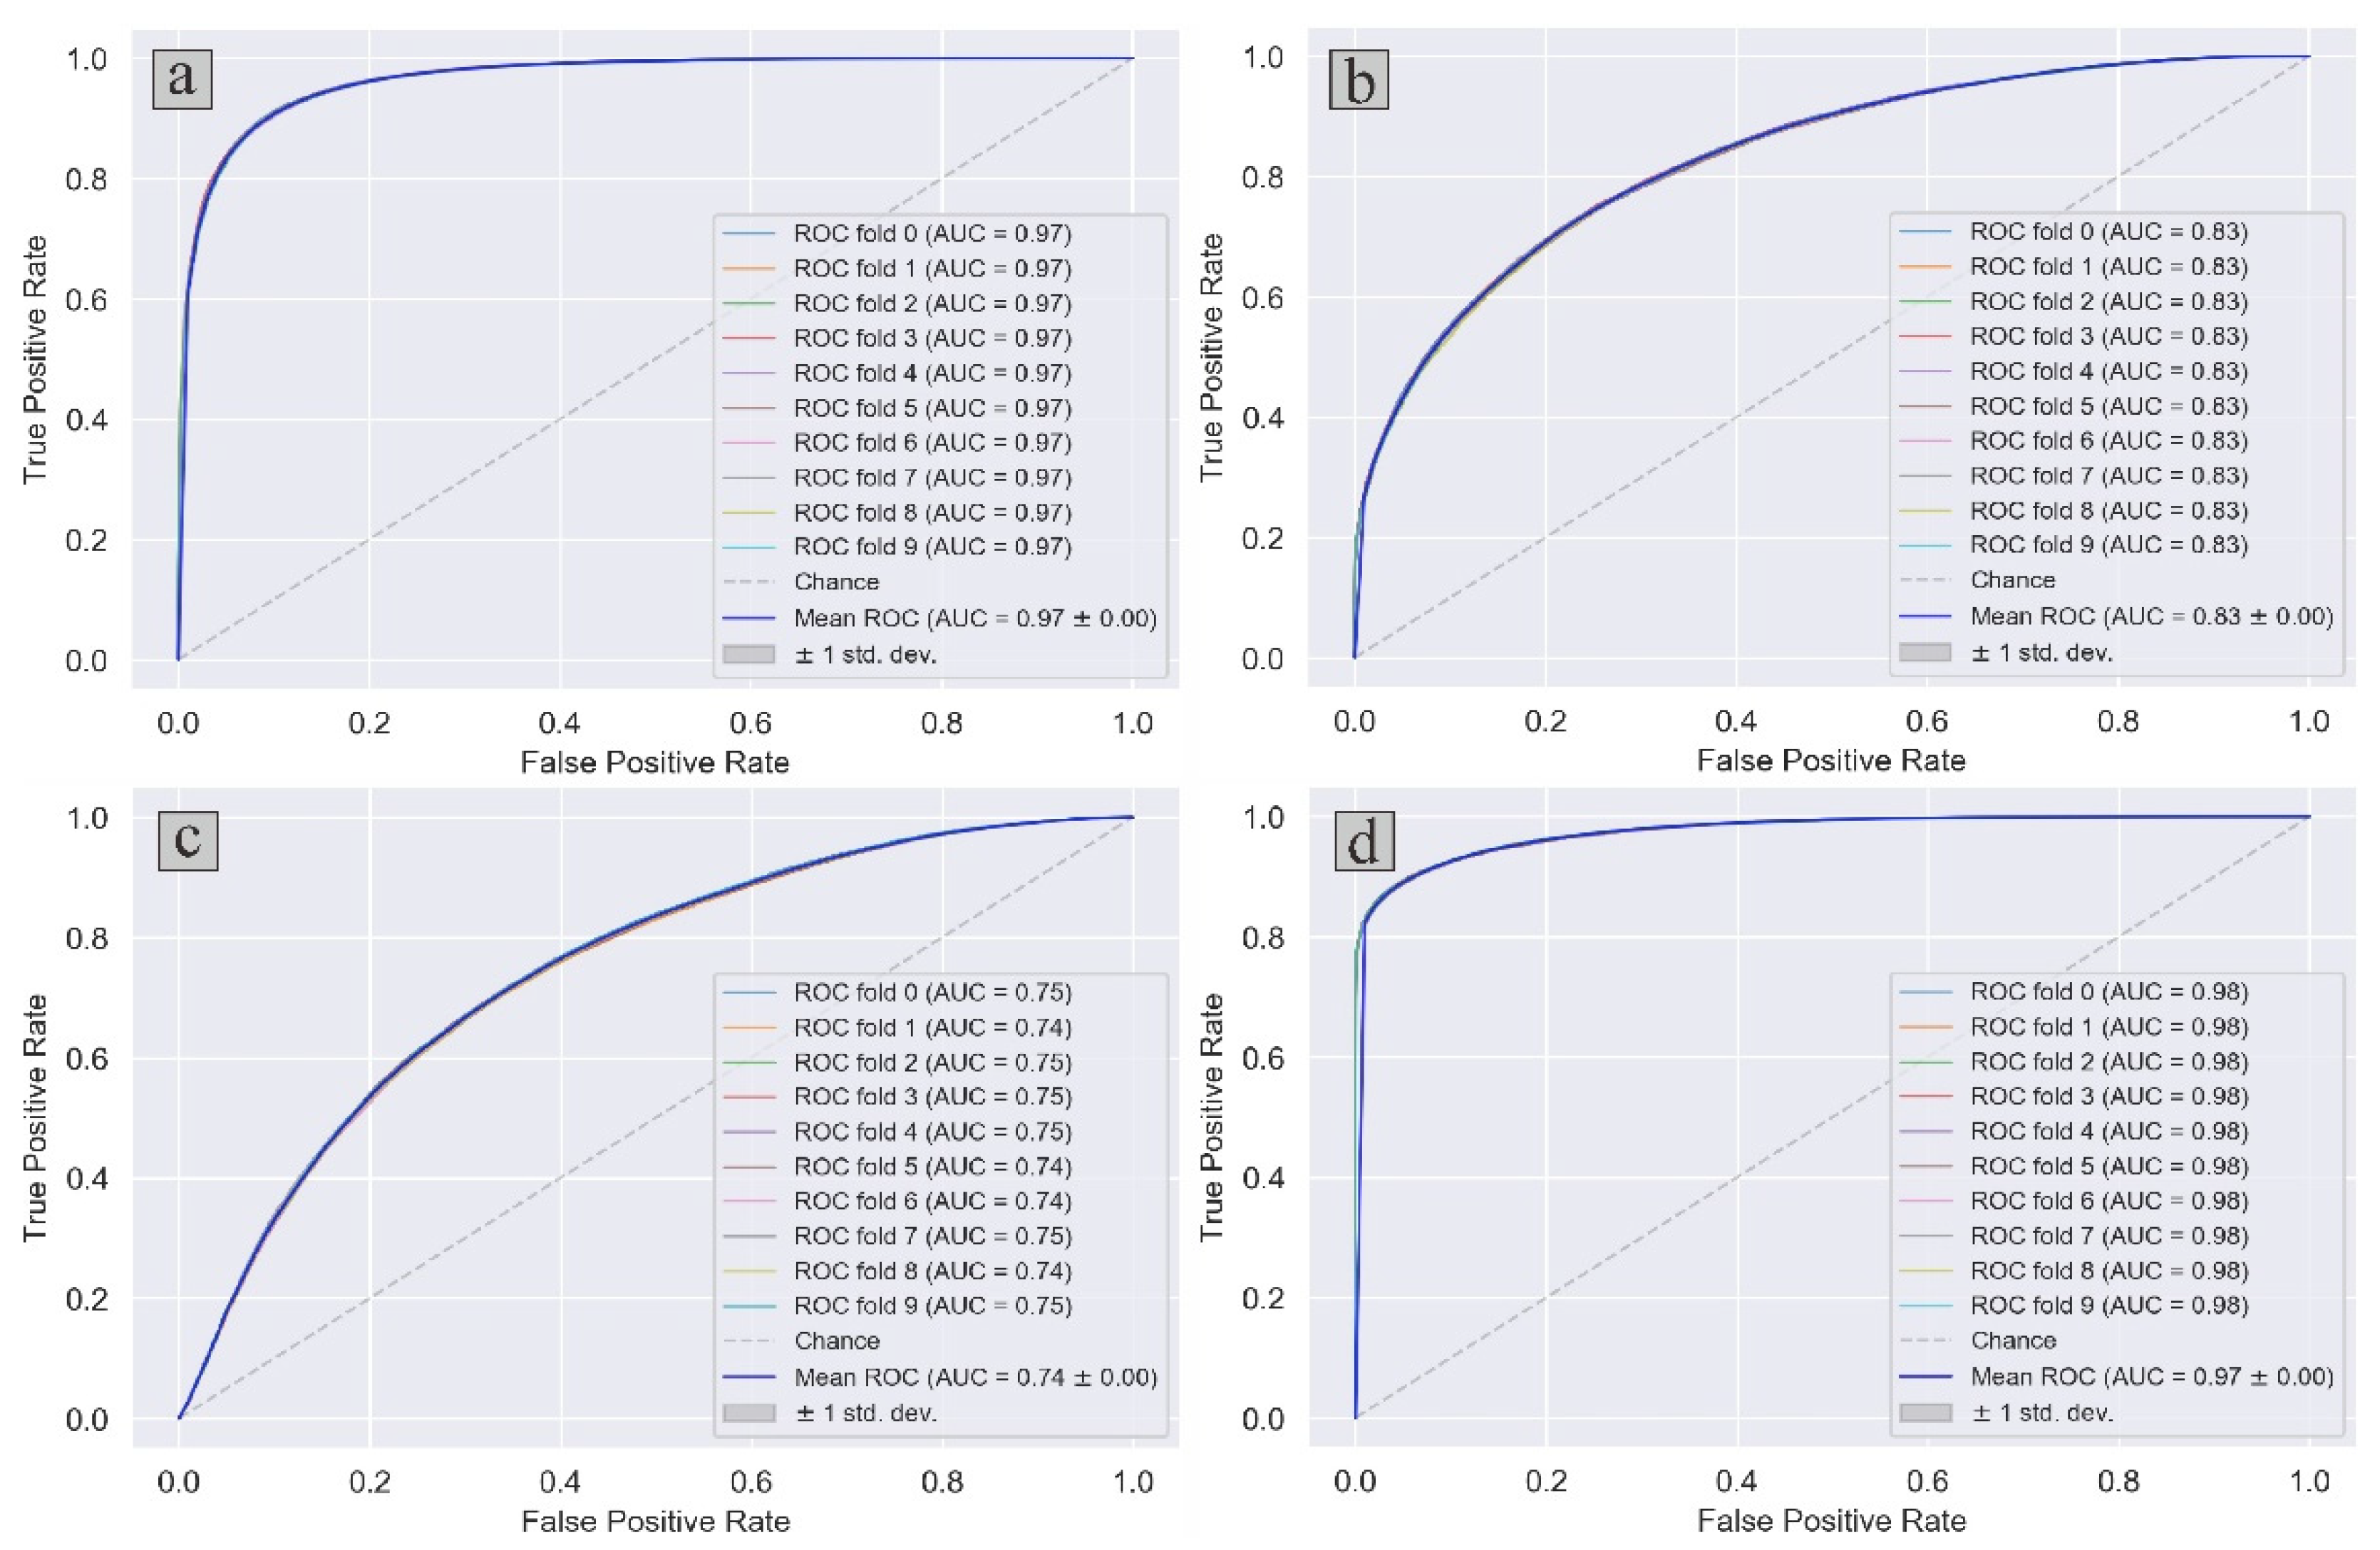
4.2. Model Evaluation and Predicting the Spatial Distribution of Landslides

The unclassified landslide inventory dataset and the classified landslide dataset were evaluated using a spatial distribution model. Preliminary model operation results were obtained using model training (70% of training samples) and verification (30% of verification samples) of the cross validation set. The performance ranking of the unclassified landslide dataset model evaluation using the Acc1 of the validation set showed that the RF model performed the best, with the prediction accuracy for the test dataset reaching 90.3%, followed by GB (77.2%), Ada (72%) and LRCV (68%) (Table 2). We chose to use a parameter grid and grid search cross validation (https://scikit-learn.org/stable/modules/generated/sklearn.model_Selection.Gridsearchcv.HTML (accessed on 10 November 2020)) to optimize the super parameters. The average accuracy (Acc2) of the optimization results of the model after searching for best parameters is listed in Table 1. It can be seen that the accuracy of the four models has been improved, with the RF model still performing the best, with an accuracy of 92%, the average AUC of the 10-times cross validation was 0.97 (Figure 7a), and GB showed the largest improvement, with the optimized accuracy reaching 90.5%; however, the performance improvement after LRCV optimization was very small.
Through the model training and verification of ten cross validation sets, a preliminary spatial distribution model evaluation of landslide inventory datasets, classified by landslide type, relative age and scale, was performed, and the prediction accuracies (Acc1) of the obtained initial model were used to sort them (Table 3). The prediction results of the three classification-based models show that the RF prediction accuracy was the highest, reaching 96.4%, 94.9% and 94.8%, respectively. Ada and LRCV performed poorly, with a prediction accuracy of only ~50%. By optimizing the super parameters, the model was re-evaluated with the best parameters searched and the average accuracy (Acc2) is listed in Table 3. The most significant finding is that the performance of GB after optimization exceeded that of RF. In the three types of evaluation, the average accuracy exceeded 96%, becoming the optimal prediction model. The average AUC of 10-times cross validation was 0.83, 0.74, and 0.97, respectively (Figure 7b–d). The Ada and LRCV models did not perform well in this evaluation. The GB model was selected as the final model for evaluation of the spatial distribution of the three classified landslide datasets.

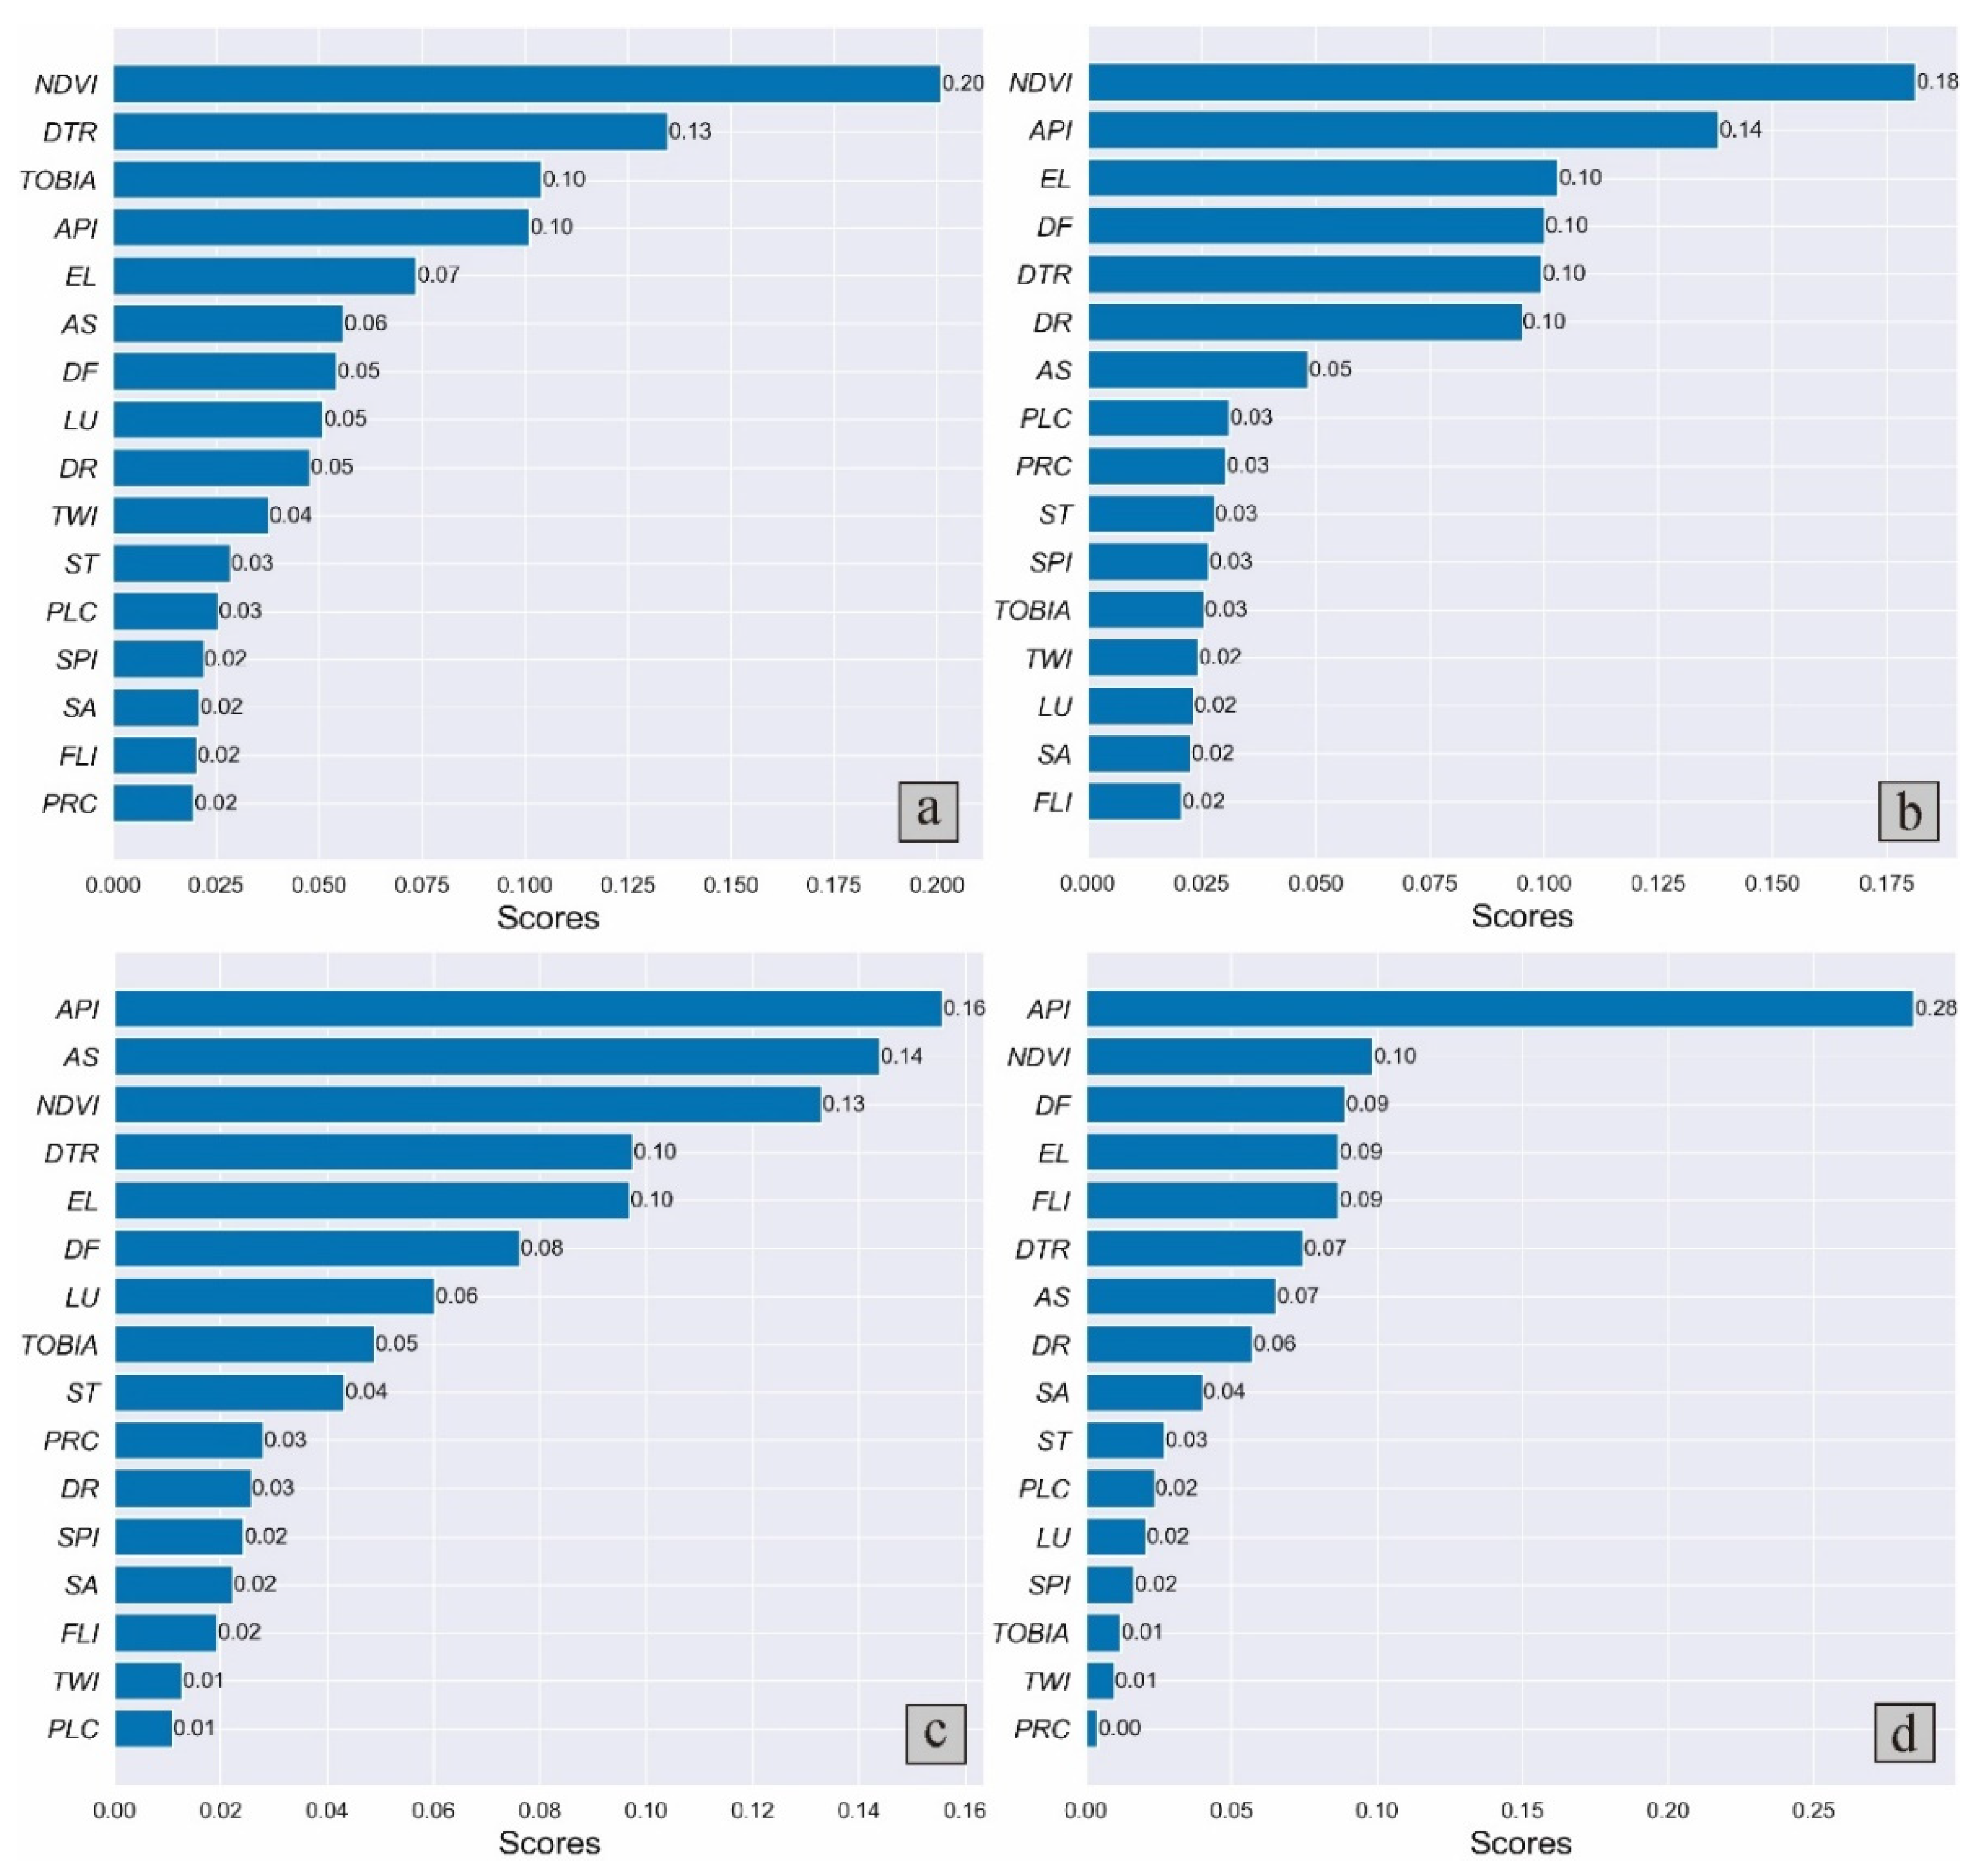
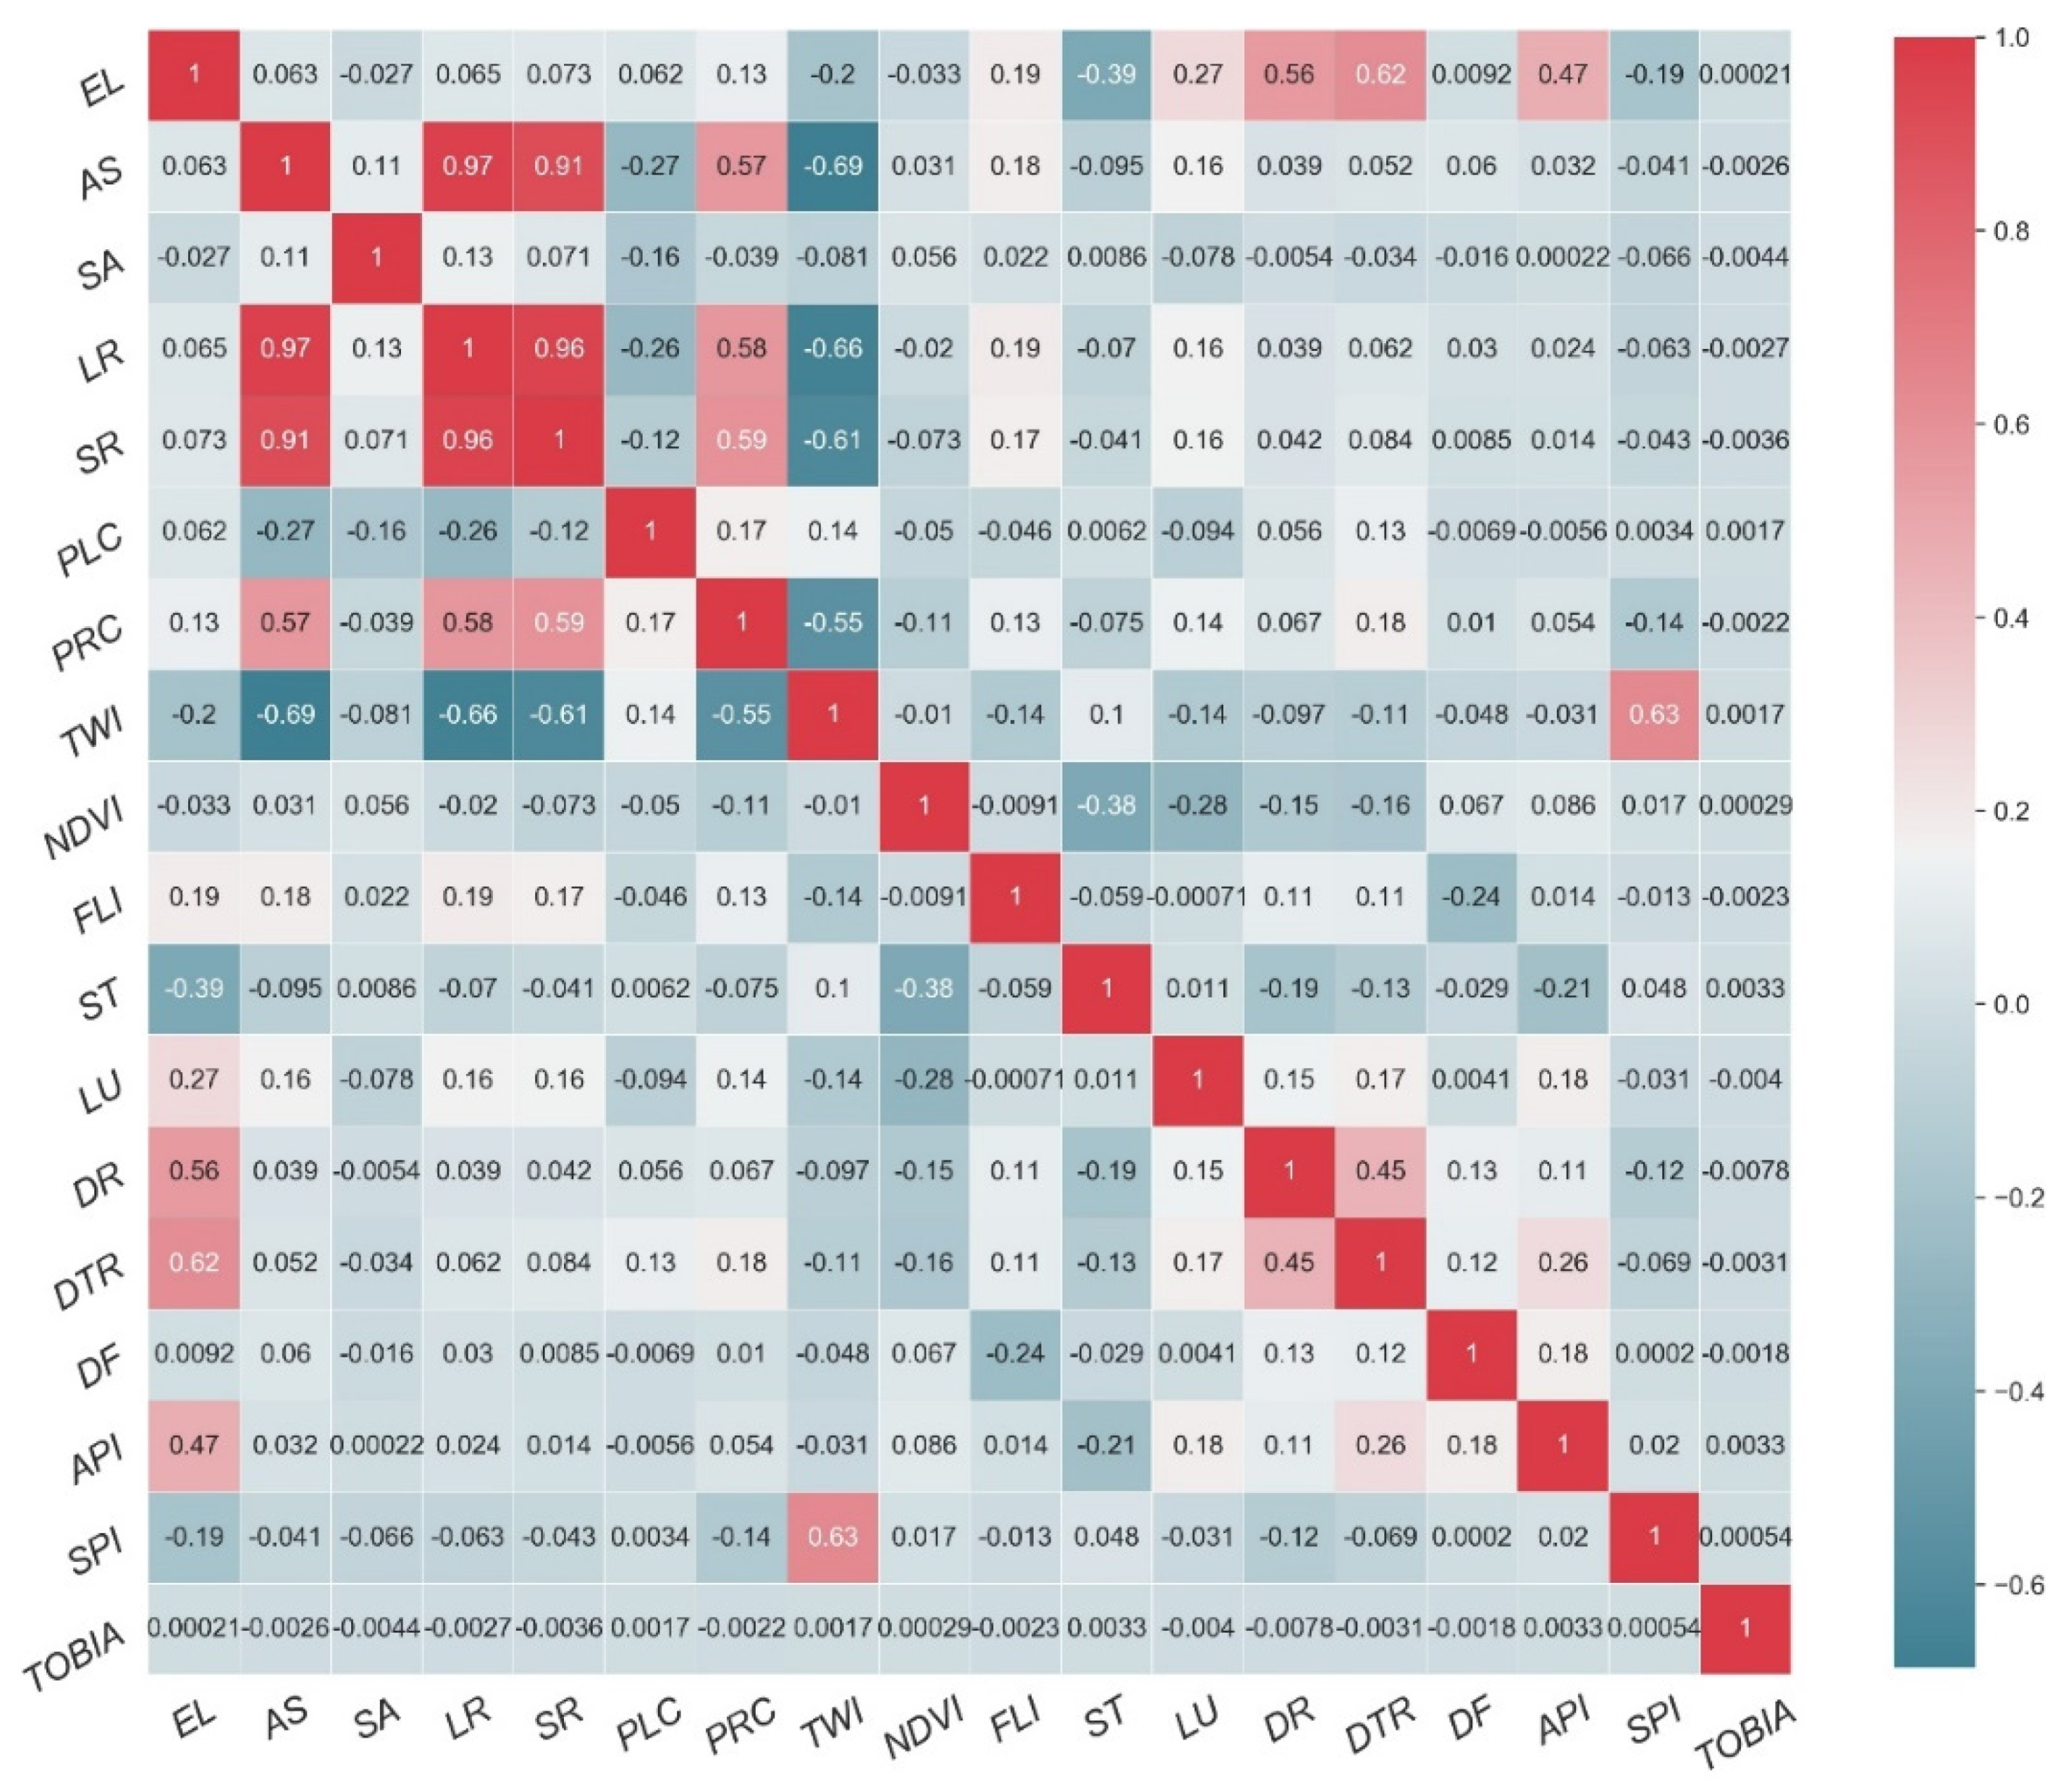
4.3. Correlation Analysis of Factors

Machine learning is helpful for quantitatively evaluating the potential relationship between landslide spatial distribution and various influencing factors through the interpretability of the model [70,71]. Correlation and statistical analysis between the landslide distribution and the influencing factors were conducted on the four datasets, including the unclassified landslides and landslide classification based on relative age, area, and type of movement.
The correlation results show that in the overall landslide distribution prediction without classification, NDVI had the closest relationship with the spatial distribution of landslides, with the correlation index reaching 0.2 (Figure 8a). Reference to the boxplots shows that the vegetation coverage in non-landslide areas is higher, and landslides are mainly distributed in areas with vegetation coverage of less than 50% (Figure 9). Previous studies have shown that plant roots can significantly increase slope stability and reduce the probability of a landslide; hence, ecological treatment may be the main method of landslide control in the study area [72,73,74]. The relationship between roads and landslide distribution is second only to NDVI, with the correlation index of 0.13. This correlation is affected by two factors: one is the effect of engineering activities on landslides; and the other is that the available space in the region is very limited, and many villages and engineering construction works are, by necessity, built and conducted on large landslides. The distribution of ancient landslides and old landslides in the study area shows that landslides have profoundly affected economic activity. Geological structure and average annual rainfall also have an important impact on the landslide distribution in the study area with the correlation index of TOBIA and API reaching 0.1. The structure controls the formation mechanism of landslides, and rainfall is the main factor inducing landslides. There is a low correlation between geomorphic factors and material conditions (soil type and lithology) and the overall distribution of landslides. Altitude and slope are the two most important geomorphic factors affecting landslide distribution, with correlation indexes of 0.07 and 0.06, respectively.
In the relative chronological classification of ancient landslides, old landslides and fresh landslides, NDVI is still the most closely related to the distribution of landslides in different years, with the correlation index reaching 0.18 (Figure 8b). Fresh landslides have a lower vegetation coverage (Figure 10a). The formation of a landslide will damage the surface vegetation and reduce the vegetation coverage, and low vegetation coverage is also conducive to the development of landslides. The correlation between API and landslide distribution is second only to NDVI. The rainfall in areas of ancient landslides and old landslides is higher than in the area of fresh landslides. The occupancy rates of large landslides in the first two age categories are 70% and 32%, respectively, while that of large landslides in recent landslide areas is only 7% (Figure 11). Landslide area is generally positively correlated with depth. Therefore, the formation of ancient and old landslides requires a higher rainfall threshold. The correlations between EL, DF, DTR and DR and landslide distribution are consistent, in all cases being 0.1. It is worth noting that, compared with ancient and old landslides, the distance between new landslides and roads is greater (Figure 10a), which also indirectly shows that the correlation between landslides and roads is mainly because landslides affect road construction.
Figure 8. Correlation of the parameters. (a) Unclassified database. (b) Classification by relative age. (c) Classification by size. (d) Classification by type of movement.
Remotesensing 13 04990 g008
Figure 9. Box plots of the correlation factors for the unclassified landslide database. NLS non-landslides, LS landslide.
Remotesensing 13 04990 g009
Figure 10. Box plots of correlation factors for the three classification datasets. (a) Classification by relative age. NLS non-landslides, A ancient landslide, O old landslide, R recent landslide. (b) Classification by size. NLS non-landslides, G giant landslide, L large landslide, M-S mid-small landslide. (c) Classification by type of movement. NLS non-landslides, C complex landslide, Fa fall, Fl flow, S slide.
Remotesensing 13 04990 g010
Figure 11. (a) relationship between landslide area and age, (b) relationship between landslide age and landslide area, (c) relationship between landslide type and landslide age, (d) relationship between landslide type and landslide area.
Remotesensing 13 04990 g011
Different from the foregoing two landslide distributions, API has the closest relationship with the distribution of different landslide scales, with the correlation index reaching 0.16. The sliding surface of large-area landslides is deeper and therefore the critical rainfall threshold is higher. The statistics also show that the landslide area is positively correlated with rainfall (Figure 10b). The correlation between AS and the landslide area is second, but the relationship between the landslide area and slope is negative. If the critical slopes of all landslides are assumed to be the same, large landslides can reduce the slope more effectively. The correlation index between NDVI and the landslide area reaches 0.13, mainly because most of the large landslides are old and ancient and hence there is sufficient time for the vegetation coverage to be restored. Most of the small landslides are new landslides, and insufficient time has elapsed for the vegetation coverage to be restored.
Interestingly, the correlation between the average annual rainfall and the spatial distribution of landslide types is the highest, reaching 0.28, far higher than for the other factors (Figure 8d). The spatial variation of annual average rainfall in the study area shows a gradient of medium-high to low values from northwest to southeast (Figure 4n), which is spatially consistent with the uplift strike slip and compression strike slip structural framework of the LBFZ. The area of medium rainfall in the high-altitude mountainous northwestern region mainly has ancient slides and rockfalls formed by thrust fault extrusion, while the strong tectonic activity in the central region has resulted in widely-distributed fine-grained fault gouge. Under high rainfall, the geometric characteristics of the fault zone and the distribution of fault gouge together influence the development of earthflows and complex giant landslides in the region. In the low-altitude parts of the study area, lower rainfall intensity can induce shallow debris slides in the area where phyllite is developed. The correlation between vegetation coverage and the distribution of different landslide types is the second highest, and the distance to fault and the altitude also have high correlations with the distribution of landslide types. Different from the distribution of previous landslide types, rock mass strength has a very important influence on the distribution of landslide types (Figure 8d). The hard rock mass in the study area is mainly nappe in the high mountain area on both sides. Tectonic compression leads to the development of a large number of rockfalls in the front of the nappe, while the fine-grained fault gouge formed in the fault zone contributes to the formation of earthflows. Slides are the main landslide types in the area of weak phyllite distributed in the river valley.

5. Discussion

There are many large-scale ancient and old landslides in the landslide inventory results for the West Qinling fault zone (Figure 11a). Combined with chronological data, it can be determined that the historical landslides in the area were formed during the Holocene, or on an even longer time scale [48,75]. In the spatial distribution of the four types of landslide data, there is a very high spatial correlation between the distribution of landslides and vegetation coverage, average annual rainfall, and roads. The close relationship between vegetation coverage and landslides has three main aspects. First, the plant root system can increase the slope stability and preventing the development of landslides, so there are relatively few landslides in areas with a high vegetation coverage. Second, from 1952 to 1990, the ecological environment of the Bailong River Basin was seriously damaged, with the area of forest decreasing by 126,500 ha, and accounting for ~7% of the basin area [49]. This land use practice has greatly promoted the development of shallow landslides. The spatial distribution and types of recent landslides indicate that small landslides that developed in areas of low vegetation coverage accounted for the vast majority (Figure 1 and Figure 11b). Third, in areas with a high vegetation coverage, remote sensing image interpretation is very difficult. The correlation between landslide distribution and vegetation coverage is important for polices for preventing and controlling future landslides. Based on the findings of this paper, ecological restoration, ecological prevention and control technology should be used as an important means of preventing landslide disasters and to alleviate the conflicts between regional socioeconomic development human and the maintenance of the ecological environment.
Distance from the road is the only factor related to human activities selected in this paper. The proximity to the landslide distribution to roads is greater than expected. Although engineering works do affect landslide development, their impact is often overestimated. The analysis results show that the correlation between landslides and roads is related to the impact of landslides on engineering activities. The close relationship between ancient and old landslides and roads shows that the surface processes dominated by landslides have a profound impact on economic activity in the area. Landslides provide space for human settlement in high mountain areas. However, there have been many cases of the reactivation of old landslides in recent years [9,10]; rational land use planning is essential and siting industrial production on large landslides should be avoided as far as possible.
There is a relatively low correlation between structural and geomorphic factors and the spatial distribution of landslides; nevertheless, the influence of structure and geomorphology on the formation and distribution of landslides is undeniable, and strong tectonic uplift and compression are undoubtedly important in the formation of landslides [33]. The structure of the Western Qinling fault zone is extremely complex, characterized by rapid uplift and complex anticlines and synclines formed by compression. The strong uplift may cause the mountain slopes to reach the threshold angle needed to trigger landslides. Unfortunately, the weak fault gouge formed in the fault zone is difficult to identify on the surface, and therefore the influence of structure on the spatial distribution of landslides is likely to be underestimated. Among geomorphic factors, slope and altitude have a significant impact on landslide distribution. This is because landslides generally occur in areas with a large slope, low altitude and thick weathering and collapse accumulation layers. Many studies have shown that large landslides are the main mechanism for limiting mountain uplift [3,56], and this relationship is helpful for understanding the role of large landslides in the geomorphic evolution of the study area. The age and area of landslides decrease with decreasing altitude (Figure 10a,b). On the one hand, this phenomenon is related to the impact of fluvial erosion on the distribution of landslides, and on the other hand the impact of human activities on new landslides is mainly concentrated on both sides of low-altitude river valleys. Among recent landslides, the proportion of fall and flow is relatively high (Figure 11c), and the fall with the highest proportion is mainly small landslides (Figure 11d), which shows that the probability of large landslides driven by tectonic uplift is decreasing, while small landslides under the action of human engineering activities, ecological damage and earthquakes begin to prevail in this area.

6. Conclusions

Landslides in WQM have a complex genetic mechanism and spatial distribution. The factors affecting landslide distribution have not been well explained for a long time. Correlation analysis of the relationship between landslide distribution and potential influencing factors is helpful for understanding their spatial distribution and impacts on geomorphology and human activities. We have produced a detailed inventory of geomorphic and historical landslides in the LBFZ and BFZ. The landslide data are divided into three categories according to freshness, area, and type of movement. The spatial distribution of various landslides was modeled by machine learning, and the relationship between landslide distribution and influencing factors was evaluated. The main conclusions are as follows.
(1) In the machine learning modeling, the performances of different models were very different. The RF and GB models performed well in the modeling of the spatial distribution of landslides in this complex tectonic and geomorphic environment.
(2) NDVI was the factor most closely related to the spatial distribution of unclassified landslides. Ecological damage is an important reason for the frequent occurrence of new landslides, and therefore ecological restoration should be considered as the main means for landslide prevention and control. The relationship between the distribution of roads and landslides is second only to NDVI. The relationship is dominated by the impact of landslide activity on engineering construction.
(3) There is a low correlation between structure, landform and the spatial distribution of landslides. Considering the complexity of the structure in the study area and time scale of geomorphic evolution, simple factors are unable to fully reflect the influence of structure and landform. Therefore, the correlation between structure, landforms and the spatial distribution of landslides is likely to be underestimated in our analysis.
(4) Several defects still exist in factor correlation evaluation through machine learning modeling. Correlation analysis cannot completely determine the relationship between active control and the passive influence of factors and the spatial distribution of landslides. Therefore, further research is needed on the genetic mechanisms of regional landslides.

Author Contributions

T.Q. and Y.Z. (Yan Zhao) designed this study, performed the main analysis, and wrote the paper. X.M., W.S. and F.Q. were mainly involved in supervision and discussion. G.C., Y.Z. (Yi Zhang), D.Y. and F.G. contributed to the revising of the manuscript. All authors have read and agreed to the published version of the manuscript.

Funding

This work was funded by National Key R&D Program of China (Grant No. 2018YFC1504704), Science and Technology Major Project of Gansu Province (Grant No. 19ZD2FA002), Program for International S&T Cooperation Projects of Gansu Province (No. 2018-0204-GJC-0043), Fundamental Research Funds for the Central Universities (lzujbky-2018-46).

Institutional Review Board Statement

Not applicable.

Informed Consent Statement

Not applicable.

Data Availability Statement

Not applicable.

Acknowledgments

The Digital Elevation Model data provided by the Japan Aerospace Exploration Agency (JAXA). Soil data supported by Chinese Soil Science Database. The authors would like to acknowledge Jan Bloemendal for his comments which has improved this paper and for English language corrections. In addition, the authors would like to thank the editor and two anonymous reviewers for their valuable and insightful comments to improve the paper.

Conflicts of Interest

The authors declare no conflict of interest.

References

  1. Ouimet, W.B. Landslides associated with the May 12, 2008 Wenchuan earthquake: Implications for the erosion and tectonic evolution of the Longmen Shan. Tectonophysics 2010, 491, 244–252. [Google Scholar] [CrossRef]
  2. Parker, R.N.; Densmore, A.L.; Rosser, N.J.; Michele, M.; Li, Y.; Huang, R.; Whadcoat, S.; Petley, D.N. Mass wasting triggered by the 2008 Wenchuan earthquake is greater than orogenic growth. Nat. Geosci. 2011, 4, 449–452. [Google Scholar] [CrossRef] [Green Version]
  3. Larsen, I.J.; Montgomery, D.R. Landslide erosion coupled to tectonics and river incision. Nat. Geosci. 2012, 5, 468–473. [Google Scholar] [CrossRef]
  4. Yang, Z.H.; Zhang, Y.S.; Guo, C.B.; Yao, X. Sensitivity analysis of causative factors of geohazards in Eastern margin of Tibetan Plateau. J. Eng. Geol. 2018, 26, 673–683. (In Chinese) [Google Scholar]
  5. Huang, R.Q. Large-scale landslides and their sliding mechanisms in China since the 20th century. Chin. J. Rock Mech. Eng. 2007, 26, 433–454. (In Chinese) [Google Scholar]
  6. Huang, R.Q.; Li, W.L. Research on development and distribution rules of geohazards induced by Wenchuan earthquake on 12th May, 2008. Chin. J. Rock Mech. Eng. 2009, 27, 2585–2592. (In Chinese) [Google Scholar]
  7. Fan, X.; Qiang, X.; Scaringi, G.; Dai, L.; Havenith, H.B. Failure mechanism and kinematics of the deadly June 24th 2017 Xinmo landslide, Maoxian, Sichuan, China. Landslides 2017, 14, 2129–2146. [Google Scholar] [CrossRef]
  8. Cui, S.; Pei, X.; Huang, R. Effects of geological and tectonic characteristics on the earthquake-triggered Daguangbao landslide, China. Landslides 2018, 15, 649–667. [Google Scholar] [CrossRef]
  9. Guo, C.; Zhang, Y.; Li, X.; Ren, S.; Yang, Z.; Wu, R.; Jin, J. Reactivation of giant Jiangdingya ancient landslide in Zhouqu County, Gansu Province, China. Landslides 2019, 17, 179–190. [Google Scholar] [CrossRef]
  10. Zhang, Z. Mechanism of the 2019 Yahuokou landslide reactivation in Gansu, China and its causes. Landslides 2020, 17, 1429–1440. [Google Scholar] [CrossRef]
  11. Ding, C.; Feng, G.; Liao, M.; Tao, P.; Zhang, L.; Xu, Q. Displacement history and potential triggering factors of Baige landslides, China revealed by optical imagery time series. Remote Sens. Environ. 2021, 254, 112253. [Google Scholar] [CrossRef]
  12. Kirschbaum, D.B.; Adler, R.; Hong, Y.; Hill, S.; Lerner-Lam, A. A global landslide catalog for hazard applications: Method, results, and limitations. Nat. Hazards 2010, 52, 561–575. [Google Scholar] [CrossRef] [Green Version]
  13. Stanley, T.; Kirschbaum, D.; Zhou, Y. Spatial and temporal analysis of a global landslide catalog. Geomorphology 2015, 249, 4–15. [Google Scholar]
  14. Ambrosi, C.; Crosta, G.B.; Crosta, G.B.; Clague, J.J. Large sackung along major tectonic features in the Central Italian Alps. Eng. Geol. 2006, 83, 183–200. [Google Scholar] [CrossRef]
  15. Korup, O.; Weidinger, J.T. Rock type, precipitation, and the steepness of Himalayan threshold hillslopes. Geol. Soc. Lond. Spec. Publ. 2011, 353, 235–249. [Google Scholar] [CrossRef]
  16. Crosta, G.B.; Frattini, P.; Agliardi, F. Deep seated gravitational slope deformations in the European Alps. Tectonophysics 2013, 605, 13–33. [Google Scholar] [CrossRef]
  17. Baroň, I.; Plan, L.; Grasemann, B.; Mitroviċ, I.; Lenhardt, W.; Hausmann, H.; Stemberk, J. Can deep seated gravitational slope deformations be activated by regional tectonic strain: First insights from displacement measurements in caves from the Eastern Alps. Geomorphology 2016, 259, 81–89. [Google Scholar] [CrossRef] [Green Version]
  18. Carlini, M.; Chelli, A.; Vescovi, P.; Artoni, A.; Clemenzi, L.; Tellini, C.; Torelli, L. Tectonic control on the development and distribution of large landslides in the Northern Apennines (Italy). Geomorphology 2016, 253, 425–437. [Google Scholar] [CrossRef]
  19. Mather, A.E.; Hartley, A.J.; Griffiths, J.S. The giant coastal landslides of Northern Chile: Tectonic and climate interactions on a classic convergent plate margin. Earth Planet. Sci. Lett. 2014, 388, 249–256. [Google Scholar] [CrossRef]
  20. Sanchez, G.; Rolland, Y.; Corsini, M.; Braucher, R.; Bourlès, D.; Arnold, M.; Aumaître, G. Relationships between tectonics, slope instability and climate change: Cosmic ray exposure dating of active faults, landslides and glacial surfaces in the SW Alps. Geomorphology 2010, 117, 1–13. [Google Scholar] [CrossRef]
  21. Geertsema, M.; Highland, L.; Vaugeouis, L. Environmental Impact of Landslides; Springer: Berlin/Heidelberg, Germany, 2009; pp. 589–607. [Google Scholar]
  22. Li, Y.; Zhou, R.; Zhao, G.; Li, H.; Su, D.; Ding, H.; Yan, Z.; Yan, L.; Yun, K.; Ma, C. Tectonic uplift and landslides triggered by the Wenchuan earthquake and constraints on orogenic growth: A case study from Hongchun Gully, Longmen Mountains, Sichuan, China. Quat. Int. 2014, 349, 142–152. [Google Scholar] [CrossRef]
  23. Břežný, M.; Pánek, T. Deep-seated landslides affecting monoclinal flysch morphostructure: Evaluation of LiDAR-derived topography of the highest range of the Czech Carpathians. Geomorphology 2017, 285, 44–57. [Google Scholar] [CrossRef]
  24. Pánek, T.; Břežný, M.; Kapustová, V.; Lenart, J.; Chalupa, V. Large landslides and deep-seated gravitational slope deformations in the Czech Flysch Carpathians: New LiDAR-based inventory. Geomorphology 2019, 346, 106852. [Google Scholar] [CrossRef]
  25. Malamud, B.D.; Turcotte, D.L.; Guzzetti, F.; Reichenbach, P. Landslide inventories and their statistical properties. Earth Surf. Process. Landf. 2004, 29, 687–711. [Google Scholar] [CrossRef]
  26. Marjanović, M.; Kovačević, M.; Bajat, B.; Voženílek, V. Landslide susceptibility assessment using SVM machine learning algorithm. Eng. Geol. 2011, 123, 225–234. [Google Scholar] [CrossRef]
  27. Goetz, J.N.; Brenning, A.; Petschko, H.; Leopold, P. Evaluating machine learning and statistical prediction techniques for landslide susceptibility modeling. Comput. Geosci. 2015, 81, 1–11. [Google Scholar] [CrossRef]
  28. Pham, B.T.; Pradhan, B.; Bui, D.T.; Prakash, I.; Dholakia, M.B. A comparative study of different machine learning methods for landslide susceptibility assessment: A case study of Uttarakhand area (India). Environ. Model. Softw. 2016, 84, 240–250. [Google Scholar] [CrossRef]
  29. Napoli, M.; Carotenuto, F.; Cevasco, A.; Confuorto, P.; Calcaterra, D. Machine learning ensemble modelling as a tool to improve landslide susceptibility mapping reliability. Landslides 2020, 17, 1897–1914. [Google Scholar] [CrossRef]
  30. Zhao, Y.; Meng, X.; Qi, T.; Qing, F.; Chen, G. AI-based identification of low-frequency debris flow catchments in the Bailong River basin, China. Geomorphology 2020, 359, 107–125. [Google Scholar] [CrossRef]
  31. Qi, T.; Zhao, Y.; Meng, X.; Chen, G.; Dijkstra, T. AI-Based Susceptibility Analysis of Shallow Landslides Induced by Heavy Rainfall in Tianshui, China. Remote Sens. 2021, 13, 1819. [Google Scholar] [CrossRef]
  32. Bai, S.B.; Jian, W.; Zhang, Z.G.; Chen, C. Combined landslide susceptibility mapping after WenChuan Earthquake at the Zhouqu segment in the Bailongjiang Basin, China. Catena 2012, 99, 18–25. [Google Scholar] [CrossRef]
  33. Qi, T.; Meng, X.; Qing, F.; Zhao, Y.; Dijkstra, T. Distribution and characteristics of large landslides in a fault zone: A case study of the NE Qinghai-Tibet Plateau. Geomorphology 2021, 379, 107592. [Google Scholar] [CrossRef]
  34. Mckean, J. Objective landslide detection and surface morphology mapping using high-resolution airborne laser altimetry. Geomorphology 2004, 57, 331–351. [Google Scholar] [CrossRef]
  35. Sato, H.P.; Harp, E.L. Interpretation of earthquake-induced landslides triggered by the 12 May 2008, M7.9 Wenchuan earthquake in the Beichuan area, Sichuan Province, China using satellite imagery and Google Earth. Landslides 2009, 6, 153–159. [Google Scholar] [CrossRef]
  36. Palenzuela, J.A.; Marsella, M.; Nardinocchi, C.; Pérez, J.; Irigaray, C. Landslide detection and inventory by integrating LiDAR data in a GIS environment. Landslides 2014, 12, 1035–1050. [Google Scholar] [CrossRef]
  37. Pandey, P. Inventory of rock glaciers in Himachal Himalaya, India using high-resolution Google Earth imagery. Geomorphology 2019, 340, 103–115. [Google Scholar] [CrossRef]
  38. Díaz-Uriarte, R.; Andrés, S. Gene selection and classification of microarray data using random forest. BMC Bioinform. 2006, 7, 3. [Google Scholar] [CrossRef] [PubMed] [Green Version]
  39. Friedman, J.H. Greedy Function Approximation: A Gradient Boosting Machine. Ann. Stat. 2001, 29, 1189–1232. [Google Scholar] [CrossRef]
  40. Gislason, P.O.; Benediktsson, J.A.; Sveinsson, J.R. Random Forests for land cover classification. Pattern Recognit. Lett. 2006, 27, 294–300. [Google Scholar] [CrossRef]
  41. Pregibon, D. Logistic Regression Diagnostics. Ann. Stat. 1981, 9, 705–724. [Google Scholar] [CrossRef]
  42. Taieb, S.B.; Hyndman, R.J. A gradient boosting approach to the Kaggle load forecasting competition. Int. J. Forecast. 2014, 30, 382–394. [Google Scholar] [CrossRef] [Green Version]
  43. Wang, X.; Sun, Y.; Zheng, C.; Zhang, H.; Zhao, X. A combined SYM classifier based on AdaBoost. J. Air Force Eng. Univ. 2006, 7, 54–57. [Google Scholar]
  44. Zhang, G.; Guo, A.; Yao, A. Western Qinling-Songpan continental tectonic node in China’s continental tectonics. Earth Sci. Front. 2004, 11, 23–32. (In Chinese) [Google Scholar]
  45. Yu, J.; Zheng, W.; Yuan, D.; Pang, J.; Liu, X.; Liu, B. Late Quaternary active characteristics and slip-rate of Pingding-Huama fault, the eastern segment of Guanggaishan-Dieshan fault zone (West Qinling Mountain). Quat. Sci. 2012, 32, 957–967. (In Chinese) [Google Scholar]
  46. Zheng, W.J.; Liu, X.W.; Yu, J.X.; Yuan, D.Y.; Zhang, P.Z.; Ge, W.P.; Pang, J.Z.; Liu, B.Y. Geometry and late Pleistocene slip rates of the Liangdang-Jiangluo fault in the western Qinling mountains, NW China. Tectonophysics 2016, 687, 1–13. [Google Scholar]
  47. Huang, X. The research of fault gouge from main active fault zone and its engineering significance in Bailongjiang Basin. Ph.D. Thesis, Lanzhou University, Lanzhou, China, 2014; pp. 25–39. [Google Scholar]
  48. Shen, J.F.; Yang, W.M.; Liu, T.; Huang, X.; Zheng, W.J.; Wang, G.Q.; Yu, L. Micro-morphology of Quartz in the Bailong River fault gouge, Western Qinling, China, and its chronological significance. Bull. Mineral. Petrol. Geochem. 2014, 33, 271–278. (In Chinese) [Google Scholar]
  49. Zhang, Y. Detecting Ground Deformation and Investigating Landslides Using InSAR Technique-Taking Middle Reach of Bailong River Basin as an Example. Ph.D. Thesis, Lanzhou University, Lanzhou, China, 2018; pp. 20–21. [Google Scholar]
  50. Yang, W.M.; Huang, X.; Zhang, C.S.; Si, H.B. Deformation behavior of landslides and their formation mechanism along Pingding-Huama active fault in Bailongjiang River region. J. Jilin Univ. 2014, 44, 574–583. (In Chinese) [Google Scholar]
  51. Li, Z.H.; Wen, B.P.; Jia, G.Y.; Zhang, Y.J.; Dong, K.J.; Yang, Y.B. Characteristics of the landslide distribution along the Bailongjiang river and its controlling factors. J. Lanzhou Univ. 2015, 51, 768–776. (In Chinese) [Google Scholar]
  52. Chen, M. Research on Development Characteristics and Formation Mechanism of Large-scale Landslides in Bailongjiang River. J. Eng. Geol. 2017, 26, 325–333. (In Chinese) [Google Scholar]
  53. Guzzetti, F.; Mondini, A.C.; Cardinali, M.; Fiorucci, F.; Santangelo, M.; Chang, K.T. Landslide inventory maps: New tools for an old problem. Earth-Sci. Rev. 2012, 112, 42–66. [Google Scholar] [CrossRef] [Green Version]
  54. Varnes, D.J. Slope movement types and processes. In Landslides, Analysis and Control, Special Report 176: Transportation Research Board; Schuster, R.L., Krizek, R.J., Eds.; National Academy of Sciences: Washington, DC, USA, 1978; pp. 11–33. [Google Scholar]
  55. Hungr, O.; Leroueil, S.; Picarelli, L. The Varnes classification of landslide types, an update. Landslides 2014, 11, 167–194. [Google Scholar] [CrossRef]
  56. Gallart, F.; Clotet-Perarnau, N. Some aspects of the geomorphic processes triggered by an extreme rainfall event: The November 1982 flood in The Eastern Pyrenees. Catena 1988, 13, 79–95. [Google Scholar]
  57. Roering, J. Tectonic geomorphology: Landslides limit mountain relief. Nat. Geosci. 2012, 5, 446–447. [Google Scholar] [CrossRef]
  58. Benjamin, N.B.; Grant, A.M.; Leslie, D.M. Aspect-related microclimatic influences on slope forms and processes, northeastern Arizona. J. Geophys. Res. 2008, 113, F03002. [Google Scholar]
  59. Wilson, M.F.J.; O’Connell, B.; Brown, C.; Guinan, J.C.; Grehan, A.J. Multiscale terrain analysis of multibeam bathymetry data for habitat mapping on the continental slope. Mar. Geod. 2007, 30, 3–35. [Google Scholar] [CrossRef] [Green Version]
  60. Wilson, J.P.; Gallant, J.C. Digital terrain analysis. Terrain Anal. Princ. Appl. 2000, 6, 1–27. [Google Scholar]
  61. Moore, I.D.; Grayson, R.B.; Ladson, A.R. Digital terrain modelling: A review of hydrological, geomorphological, and biological applications. Hydrol. Process. 1991, 5, 3–30. [Google Scholar] [CrossRef]
  62. Collettini, C.; Niemeijer, A.; Viti, C.; Marone, C. Fault zone fabric and fault weakness. Nature 2009, 462, 907–910. [Google Scholar] [CrossRef]
  63. Bois, T.; Bouissou, S.; Guglielmi, Y. Influence of major inherited faults zones on gravitational slope deformation: A two-dimensional physical modelling of the La Clapière area (Southern French Alps). Earth Planet. Sci. Lett. 2008, 272, 709–719. [Google Scholar] [CrossRef]
  64. Alexander, D.; Formichi, R. Tectonic causes of landslides. Earth Surf. Process. Landf. 2010, 18, 311–338. [Google Scholar] [CrossRef]
  65. Meentemeyer, R.K.; Moody, A. Automated mapping of conformity between topographic and geological surfaces. Comput. Geosci. 2000, 26, 815–829. [Google Scholar] [CrossRef]
  66. Dormann, C.F.; Elith, J.; Bacher, S.; Buchmann, C.; Carl, G.; Carré, G.; Marquéz, J.; Gruber, B.; Lafourcade, B.; Leitão, P. Collinearity: A review of methods to deal with it and a simulation study evaluating their performance. Ecography 2013, 36, 27–46. [Google Scholar] [CrossRef]
  67. Schapipe, R.E. A Brief Introduction to Boosting, Sixteenth International Joint Conference on Artificial Intelligence; Morgan Kaufmann Publishers Inc.: San Mateo, CA, USA, 1999; pp. 1401–1406. [Google Scholar]
  68. Xu, Y.; Ju, L.; Tong, J.; Zhou, C.M.; Yang, J.J. Machine Learning Algorithms for Predicting the Recurrence of Stage IV Colorectal Cancer after Tumor Resection. Sci. Rep. 2020, 10, 2519. [Google Scholar] [CrossRef]
  69. Jiang, S.; Wen, B.P.; Zhao, C.; Li, R.D. An analysis of the activity features of the Suoertou landslide in Zhouqu county of Gansu. Hydrogeol. Eng. Geol. 2013, 43, 69–74. (In Chinese) [Google Scholar]
  70. Zhao, Y.; Meng, X.; Qi, T.; Chen, G.; Li, Y.; Yue, D.; Qing, F. Modeling the Spatial Distribution of Debris Flows and Analysis of the Controlling Factors: A Machine Learning Approach. Remote Sens. 2021, 13, 4813. [Google Scholar] [CrossRef]
  71. Zhao, Y.; Meng, X.; Qi, T.; Li, Y.; Chen, G.; Yue, D. AI-based rainfall prediction model for debris flows. Eng. Geol. 2021, in press. [Google Scholar] [CrossRef]
  72. Baets, S.D.; Poesen, J.; Reubens, B.; Wemans, K.; Baerdemaeker, J.D.; Muys, B. Root tensile strength and root distribution of typical Mediterranean plant species and their contribution to soil shear strength. Plant Soil 2008, 305, 207–226. [Google Scholar] [CrossRef]
  73. Chirico, G.B.; Borga, M.; Tarolli, P.; Rigon, R.; Preti, F. Role of vegetation on slope stability under transient unsaturated conditions. Procedia Environ. Sci. 2013, 19, 932–941. [Google Scholar] [CrossRef]
  74. Johnson, D.W.; Sauceda, M.; Binshafique, S.; Huang, J. Soil shear strength enhancements from plant root templated georeinforcements. In GeoCongress 2012: State of the Art and Practice in Geotechnical Engineering; American Society of Civil Engineers: New York, NY, USA, 2012; pp. 424–431. [Google Scholar]
  75. Shu, J.; Bai, S.B.; Cui, Y.; Chen, Q.; Zhang, Z.G.; Wang, J. Study on 26Al exposure dating of Fenganshan landslide in the middle reaches of Bailong River. J. Geomech. 2017, 23, 914–922. (In Chinese) [Google Scholar]
Figure 1. Location of the study area in China and landslide inventory map including unclassified landslides, and the age, area and type of movement of landslides. 1. Location of Figure 2a and Figure 3d; 2. Location of Figure 2b; 3. Location of Figure 3a; 4. Location of Figure 3b; 5. Location of Figure 3c; 6. Location of Figure 3f; 7. Location of Figure 3e.
Remotesensing 13 04990 g001
Figure 5. Heat map of the parameter correlation matrix. The color value of right strip from high to low indicates the tightness of factor correlation.
Remotesensing 13 04990 g005
Figure 6. Proportional distribution of the three landslide types. (a) LS landslide size, (b) LA landslide age, (c) LT landslide type.
Remotesensing 13 04990 g006
Figure 7. Receiver Operating Characteristic Curve (ROC) and AUC using 10-times cross validation. (a) RF model of unclassified landslides, (b) GB model of landslide age, (c) GB model of landslide size, (d) GB model of landslide type.
Remotesensing 13 04990 g007
Table 1. Raster thematic maps of input dataset.
Data TypesFieldSource, Scale/Resolution
ElevationELDEM, 12.5 m
Average slope ASDEM, 12.5 m
Slope aspectSADEM, 12.5 m
Local reliefLRDEM, 12.5 m
Surface roughnessSRDEM, 12.5 m
Planar curvaturePLCDEM, 12.5 m
Profile curvaturePRCDEM, 12.5 m
Topographic wetness indexTWIDEM, 12.5 m
Vegetation coverage indexNDVIGaofen-1 satellite, 8 m
Formation lithological indexFLIGeo-map, 1:100,000
Soil typesSTHWSD, 1 km
Land useLUGLC_FCS30-2020, 30 m
Distance to riverDRDEM, 12.5 m
Distance to roadDTRGoogle Earth image, 1 m
Distance to faultDFGeo-map, 1:50,000
Annual precipitation indexAPI2000–2010, year
Stream power indexSPIDEM, 12.5 m
Topographic/bedding-plane intersection angleTOBIAGeo-map, 1:100,000
Table 2. Model evaluation of unclassified landslides, standard deviation, preliminary test accuracy, optimized test accuracy, and AUC score.
Model NameStd1Std2Acc1Acc2AUC
RandomForestClassifier0.00130.00110.9030.9200.97
GradientBoostingClassifier0.00290.00130.7720.9050.97
AdaBoostClassifier0.00240.00150.7270.7470.83
LogisticRegressionCV0.00150.00140.6840.6840.74
Table 3. Model evaluation of three classified landslide datasets, standard deviation, preliminary test accuracy, optimized test accuracy, and AUC score.
ModelStd1Std2Acc1Acc2
TypeRandomForestClassifier0.00060.00050.9650.965
GradientBoostingClassifier0.00110.00040.7330.975
AdaBoostClassifier0.00900.00210.5280.573
LogisticRegressionCV0.00100.00110.4790.479
FreshRandomForestClassifier0.00080.00050.9490.951
GradientBoostingClassifier0.00140.00100.6110.967
AdaBoostClassifier0.00310.00170.4960.525
LogisticRegressionCV0.00080.00080.4620.462
SizeRandomForestClassifier0.00090.00060.9480.951
GradientBoostingClassifier0.00230.00090.6110.967
AdaBoostClassifier0.00140.00080.5160.545
LogisticRegressionCV0.00140.00140.4830.483
Publisher’s Note: MDPI stays neutral with regard to jurisdictional claims in published maps and institutional affiliations.

