1. Introduction
Since geothermal energy is an important green energy resource, its development and utilization have received increasingly widespread attention. In order to improve the economic efficiency and reduce investment risks, geothermal resources must be surveyed before development. At present, geothermal-resource exploration methods are mainly based on traditional geophysical prospecting methods, and many studies have been conducted on underground temperature anomaly exploration. Tulinius et al. (2008) [
1] conducted magnetotelluric (MT) and gravity measurements in prospective geothermal exploration basins throughout Hungary and identified potential geothermal reservoirs using combined interpretation of MT and gravity data. Muñoz et al. (2013) [
2] presented several examples of successful applications of electromagnetic methods in geothermal exploration. Amatyakul et al. (2015) [
3] conducted an MT survey of the reservoir in the MaeChan geothermal area in Northern Thailand, in conjunction with years of geological and geophysical investigations, to assess the local geothermal prospects. Gasperikova et al. (2015) [
4] studied the Krafla and Hengill geothermal zones, using three-dimensional MT inversion, which revealed that obtaining information on the subsurface resistivity contributes to a better understanding of complex geothermal systems. Matsushima et al. (2020) [
5] used broadband MT data to infer the magmatic–hydrothermal system of Aso volcano in Japan from the resistivity structure.
Geophysical exploration is an effective method of finding geothermal resources, but geophysical exploration is prone to large workloads and blind investment. Therefore, other methods need to be sought to explore geothermal resources, together with geophysical exploration. Surface-temperature field anomalies are a direct indication of geothermal resources. Thermal infrared remote sensing can monitor the spatial-distribution characteristics of the land surface temperature (LST) and is an important means of obtaining information about LST anomalies. In addition, thermal infrared remote sensing has the advantages of a large area of continuous observation and low costs, and it does not destroy the thermodynamic state of the surface, making it the current advanced method of geothermal resource surveying. The application of thermal infrared remote sensing technology is gradually deepening, including urban heat-island-effect monitoring, volcanic- activity detection, CO
2 emission estimation, and tectonic activity information [
6,
7,
8,
9,
10,
11]. However, relatively few studies have been conducted on its use in geothermal resource exploration [
12,
13,
14]. Guo et al. (2013) [
15] applied remote sensing technology in the interpretation of information such as the regional tectonic and thermal control geological background to assist geothermal exploration studies. Freek et al. (2014) [
16] reviewed the potential of using remote sensing in geothermal resource exploration. Moreover, by studying the Chili geothermal field, the intersection between various surface manifestations of geothermal reservoirs and how remote sensing indicators can contribute to exploration were illustrated. Sekertekin et al. (2019) [
17] used thermal infrared (TIR) remote sensing data to investigate the thermal anomalies in the Tuzla geothermal zone, demonstrating that TIR remote sensing can be used in geothermal zone exploration studies.
However, few studies have been conducted on the direct use of thermal infrared remote sensing to obtain LST anomaly information and to synergistically analyze the geothermal resource prospects by using field survey data. This study was based on thermal infrared remote sensing technology for the pre-exploration of LST anomalies, and the possible thermal anomalies in the Wuerhe area were explored and studied by combining TIR data and actual field MT measurements. Then, favorable geothermal areas were identified to provide effective suggestions for subsequent development of these geothermal resources.
2. Geological Structure and Geothermal Characteristics of the Study Area
2.1. Geological Structure
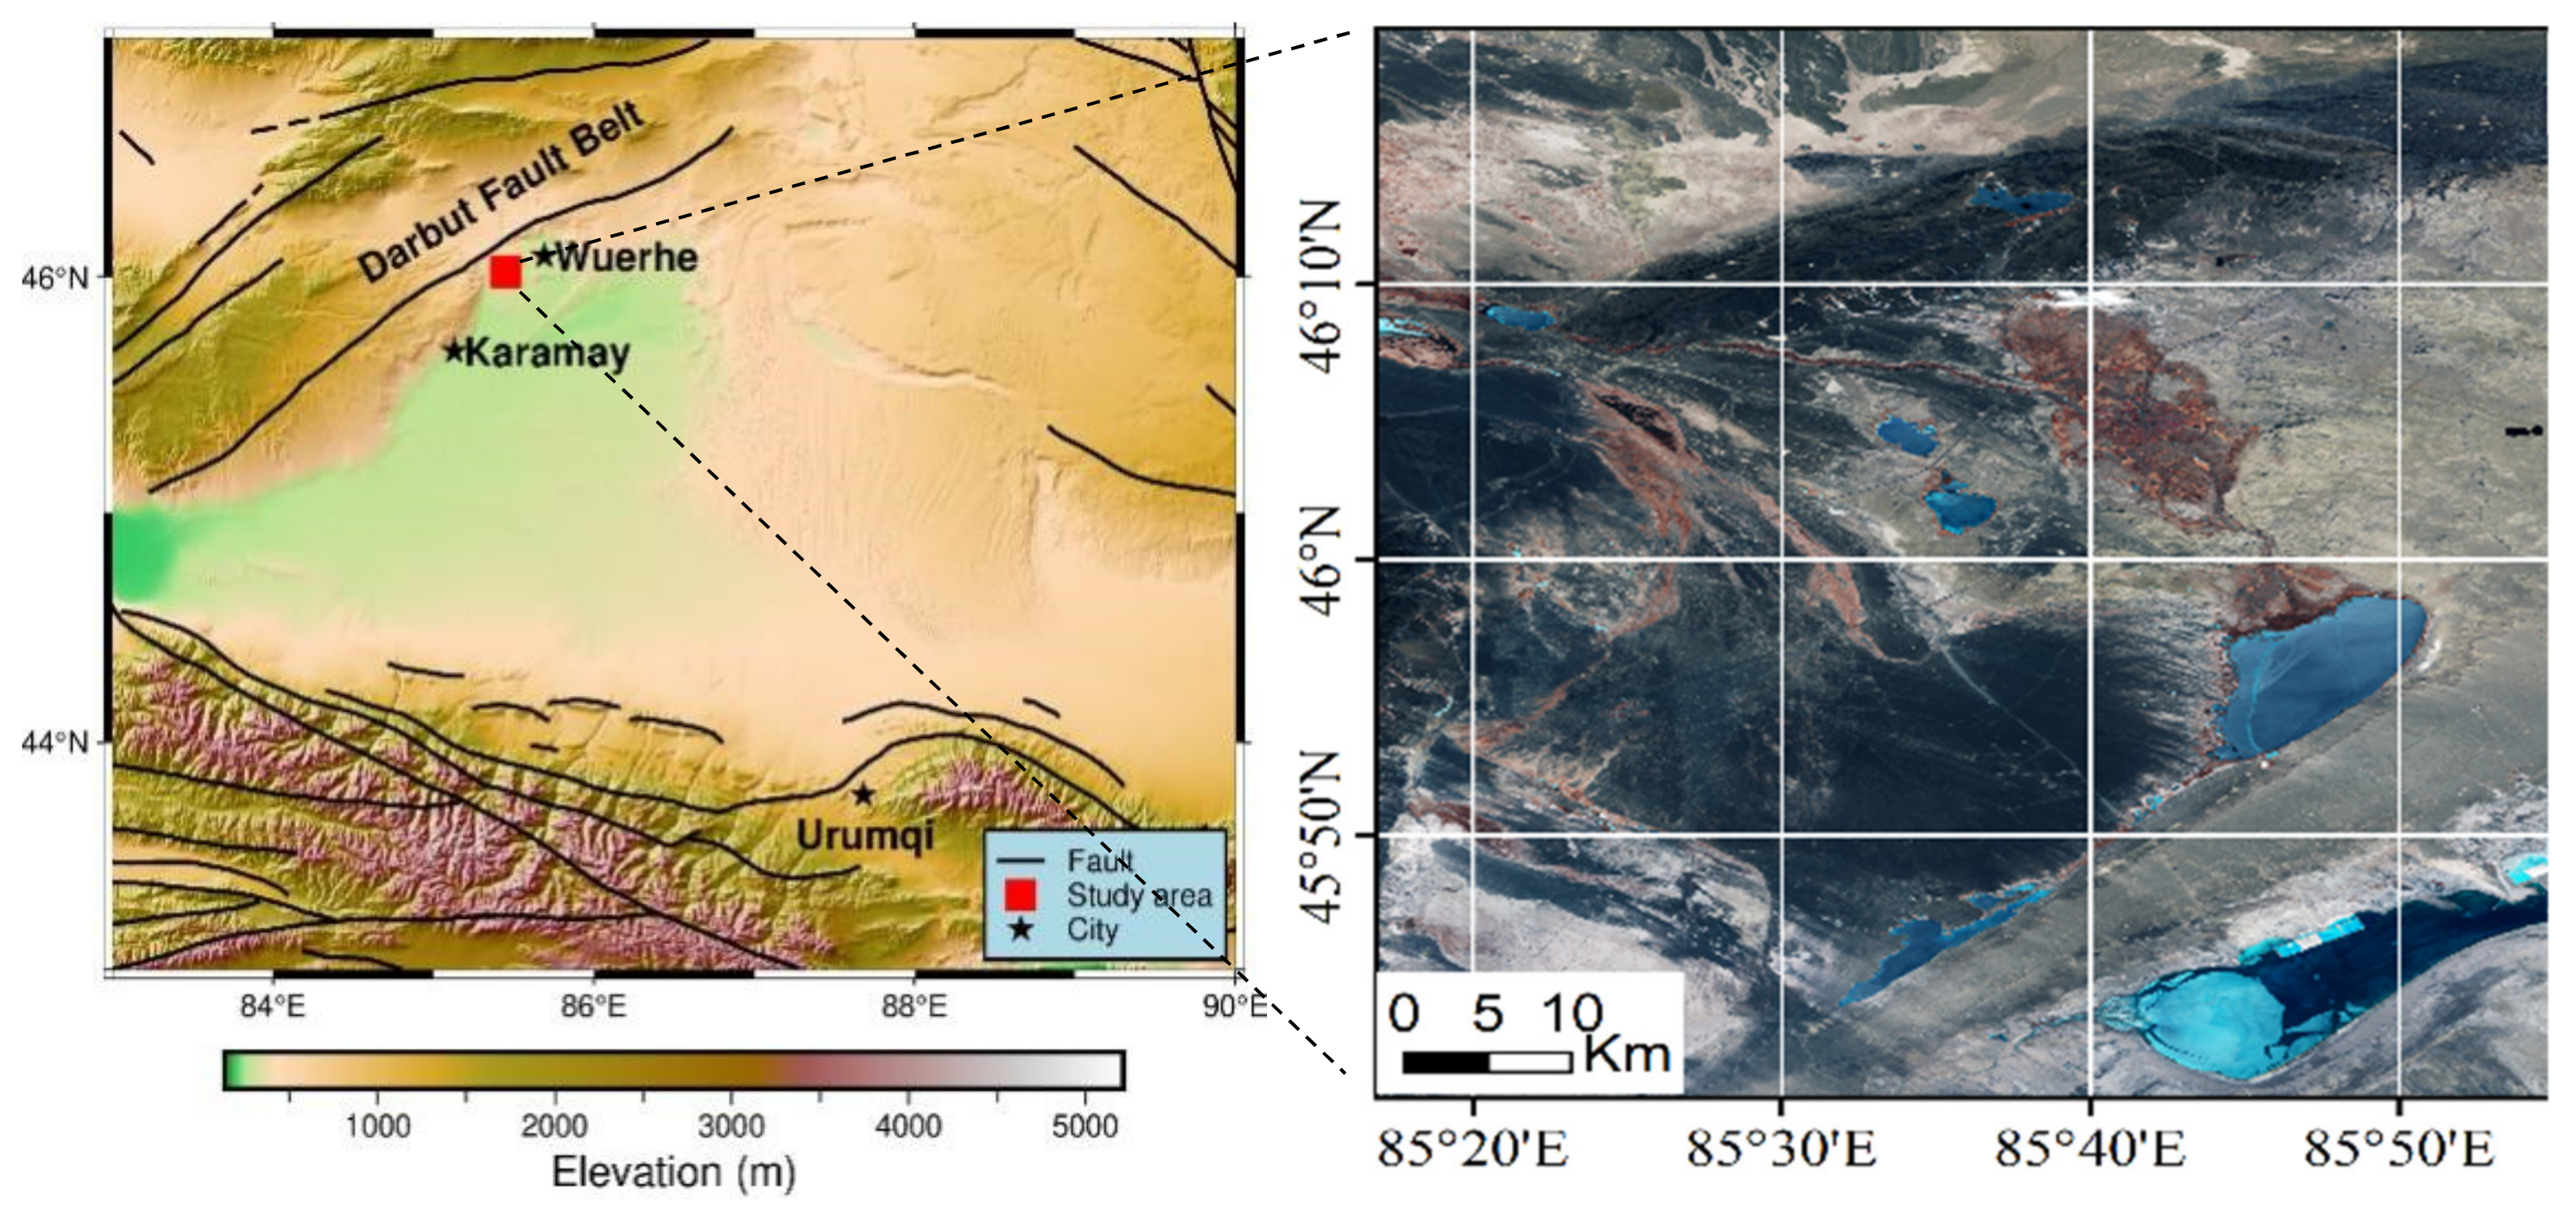
The study area (
Figure 1) is located in the Wuerhe area in the northern part of Karamay City, Xinjiang. The Wuerhe area is located in the Wu-Xia fault belt on the northwestern margin of the Junggar Basin. The Wu-Xia fault belt is a section of the north–central foreland thrust belt on the northwestern margin. There are many stratum defects in the hanging wall of the fault belt. Generally, the Cretaceous or Jurassic directly overlies the Permian, and the Triassic is generally missing, with only a few remnants of the Baikouquan Formation remaining locally. The foot wall is relatively well developed and preserved, with Carboniferous, Permian, Triassic, Jurassic, and Cretaceous strata developed from the bottom up, and the fractures are also relatively well developed. These faults were formed in the Middle and Late Permian, and there was still strong activity in the Triassic.
2.2. Geothermal Conditions
The geothermal resources in North Xinjiang are mainly distributed in the front of the Northern Tianshan Mountains. Urumqi Shuimogou hot spring, Shawan Lujiaowan hot spring, Wusuala mountain hot spring, Bole hot spring, and ditch hot spring are present in this area. The exposed hot springs in front of the Tianshan Mountains are located in structural positions that are connected to large strike-slip faults. This area is also adjacent to the rivers formed by these strike-slip faults, and the structural conditions are very favorable. These favorable geological conditions, including heat source, water source, access, and favorable storage space (i.e., storage, cover, access, and source), are required for geothermal resources to be endowed. According to the available drilling and geothermal gradient information in the study area, the increase in temperature in the western–central part of the study area varies between 17.5 and 28.5 °C per 1000 m. The highest geothermal value is around 49 °C at a depth of 1400 m, 77 °C at a depth of 2400 m, and 106 °C at a depth of 3400 m. Within a certain depth range, the stratigraphic temperature can reach a higher temperature. There are three rivers in the study area, namely the Baiyang River, the Kelasu River, and the Darbut River. The river runoff is mainly supplied by seasonal snowmelt water. The faults in the study area are relatively well developed, and the faults are generally open during the active period; thus, they can be used as a good channel for fluid transport. The development of these faults provides a favorable guarantee for fluid transport and shading. In addition, due to the development of fractures, cracks form easily; thus, the fracture development area is also the main area in which the crack-type storage group has formed.
3. LST Retrieval Based on Thermal Infrared Remote Sensing
3.1. Experimental Data
The remote-sensing data used in this study are Landsat8 data with a spatial resolution of 60 m in the thermal infrared band. The images were acquired on 25 March 2020 and were obtained from the Geospatial Data Cloud (URL:
http://www.gscloud.cn/, accessed on 1 November 2021). It was a sunny day, and the average atmospheric transmission was 0.97. The weather condition was very beneficial to the acquisition of the land surface temperature. Considering that the calibration parameters of the TIRS 11 are still unstable [
18], TIRS 10 was used for temperature inversion.
3.2. Basic Principle of Identifying Geothermal Anomalies, Using Thermal Infrared Remote Sensing
LST retrieval through the use of thermal infrared remote sensing is an important tool for obtaining information about the surface thermal conditions on a large scale. Thermal infrared remote sensing uses sensors to detect sensing objects from a distance and to receive thermal infrared information from target features, so it can be used to identify features and invert surface parameters. The internal thermal activity of the Earth is reflected at the surface as LST anomalies [
19]. Under the same thermodynamic conditions, if large areas of energy are buried underground, the physicochemical properties of the rocks and pore-filling materials are different from those of the surrounding area. This leads to differences in the heat transfer, and, consequently, the LST will be different from the surrounding LST [
20]. Thus, thermal-infrared-remote-sensing inversion of the LST can be used to discern LST anomalies and to obtain information about the subsurface energy distribution in order to provide a basis for identifying geothermal resources.
3.3. LST Retrieval Method Based on Thermal Infrared Remote Sensing
Based on the surface-heat radiation conduction equation, Qin et al. (2001) [
21] derived a simple and highly accurate algorithm, the Mono-window algorithm, which includes the atmospheric and surface effects directly in the equation. Through a large number of studies, it has been confirmed that the single-window algorithm has a high accuracy in LST retrieval [
22,
23,
24,
25]. Based on the surface-specific emissivity, ε; the equivalent atmospheric temperature, Ta; and the atmospheric transmittance, τ, the actual LST can be deduced from the brightness temperature by using the following equation:
where T
s is the actual LST; T
b is the brightness temperature; T
a is the equivalent atmospheric temperature; and a and b are the reference coefficients, which are taken as a = 67.355351 and b = 0.458606. C and D are intermediate variables and can be calculated by using the following two equations:
where ε is the surface-specific emissivity, and τ is the atmospheric transmittance. The methods of calculating the parameters, such as the surface brightness temperature (Tb), surface-specific emissivity (ε), and equivalent atmospheric temperature (Ta), are not specifically described here, but the details can be found in the literature [
26,
27].
In this study, we used Landsat8 thermal-infrared-remote-sensing data to obtain the LST distribution information for the study area based on the Mono-window algorithm for LST retrieval in the Urho region (
Figure 2). As can be seen from
Figure 2, the LST of some of the larger areas (I, II, III, IV, and V) in the study area is significantly higher than the LST of the surrounding areas, that is, there are obvious LST anomalies. The LST distribution in the study area exhibits a general trend of higher temperatures in the west and north and lower temperatures in the east and south.
3.4. Identification and Analysis of LST Retrieval Results
Regardless of the complexity of the surface influences, in terms of the energy balance, as the boundary where energy is exchanged between the Earth’s interior and external space, Earth’s surface is mainly subject to the combined action of the heat from the Sun, the atmosphere, and the subsurface. The deep heat source of the Earth is heat transferred via conduction and convection. It is mainly influenced by the geological structure and the physical properties of strata, and it is a local warming phenomenon. Only the thermal anomalies formed in the ground by this heat transfer are of practical importance in the search for geothermal resources. Domestic and international studies have shown [
28,
29] that the presence of geothermal resources is often manifested as LST anomalies. However, LST anomalies are not necessarily caused by geothermal resources; and geological, tectonic, geomorphological, and ground-cover factors may also cause LST anomalies. The identification of LST anomalies with deep geothermal significance also requires a combination of factors.
So, are all of the areas with LST anomalies in
Figure 2 due to geothermal heat? We must further consider the influence of the surface environmental factors, such as the topographic and geomorphic conditions and land-use types. Then, the pseudo-thermal anomalous areas due to surface environmental factors can be excluded.
- (1)
Combined analysis of the LST and topographic conditions:
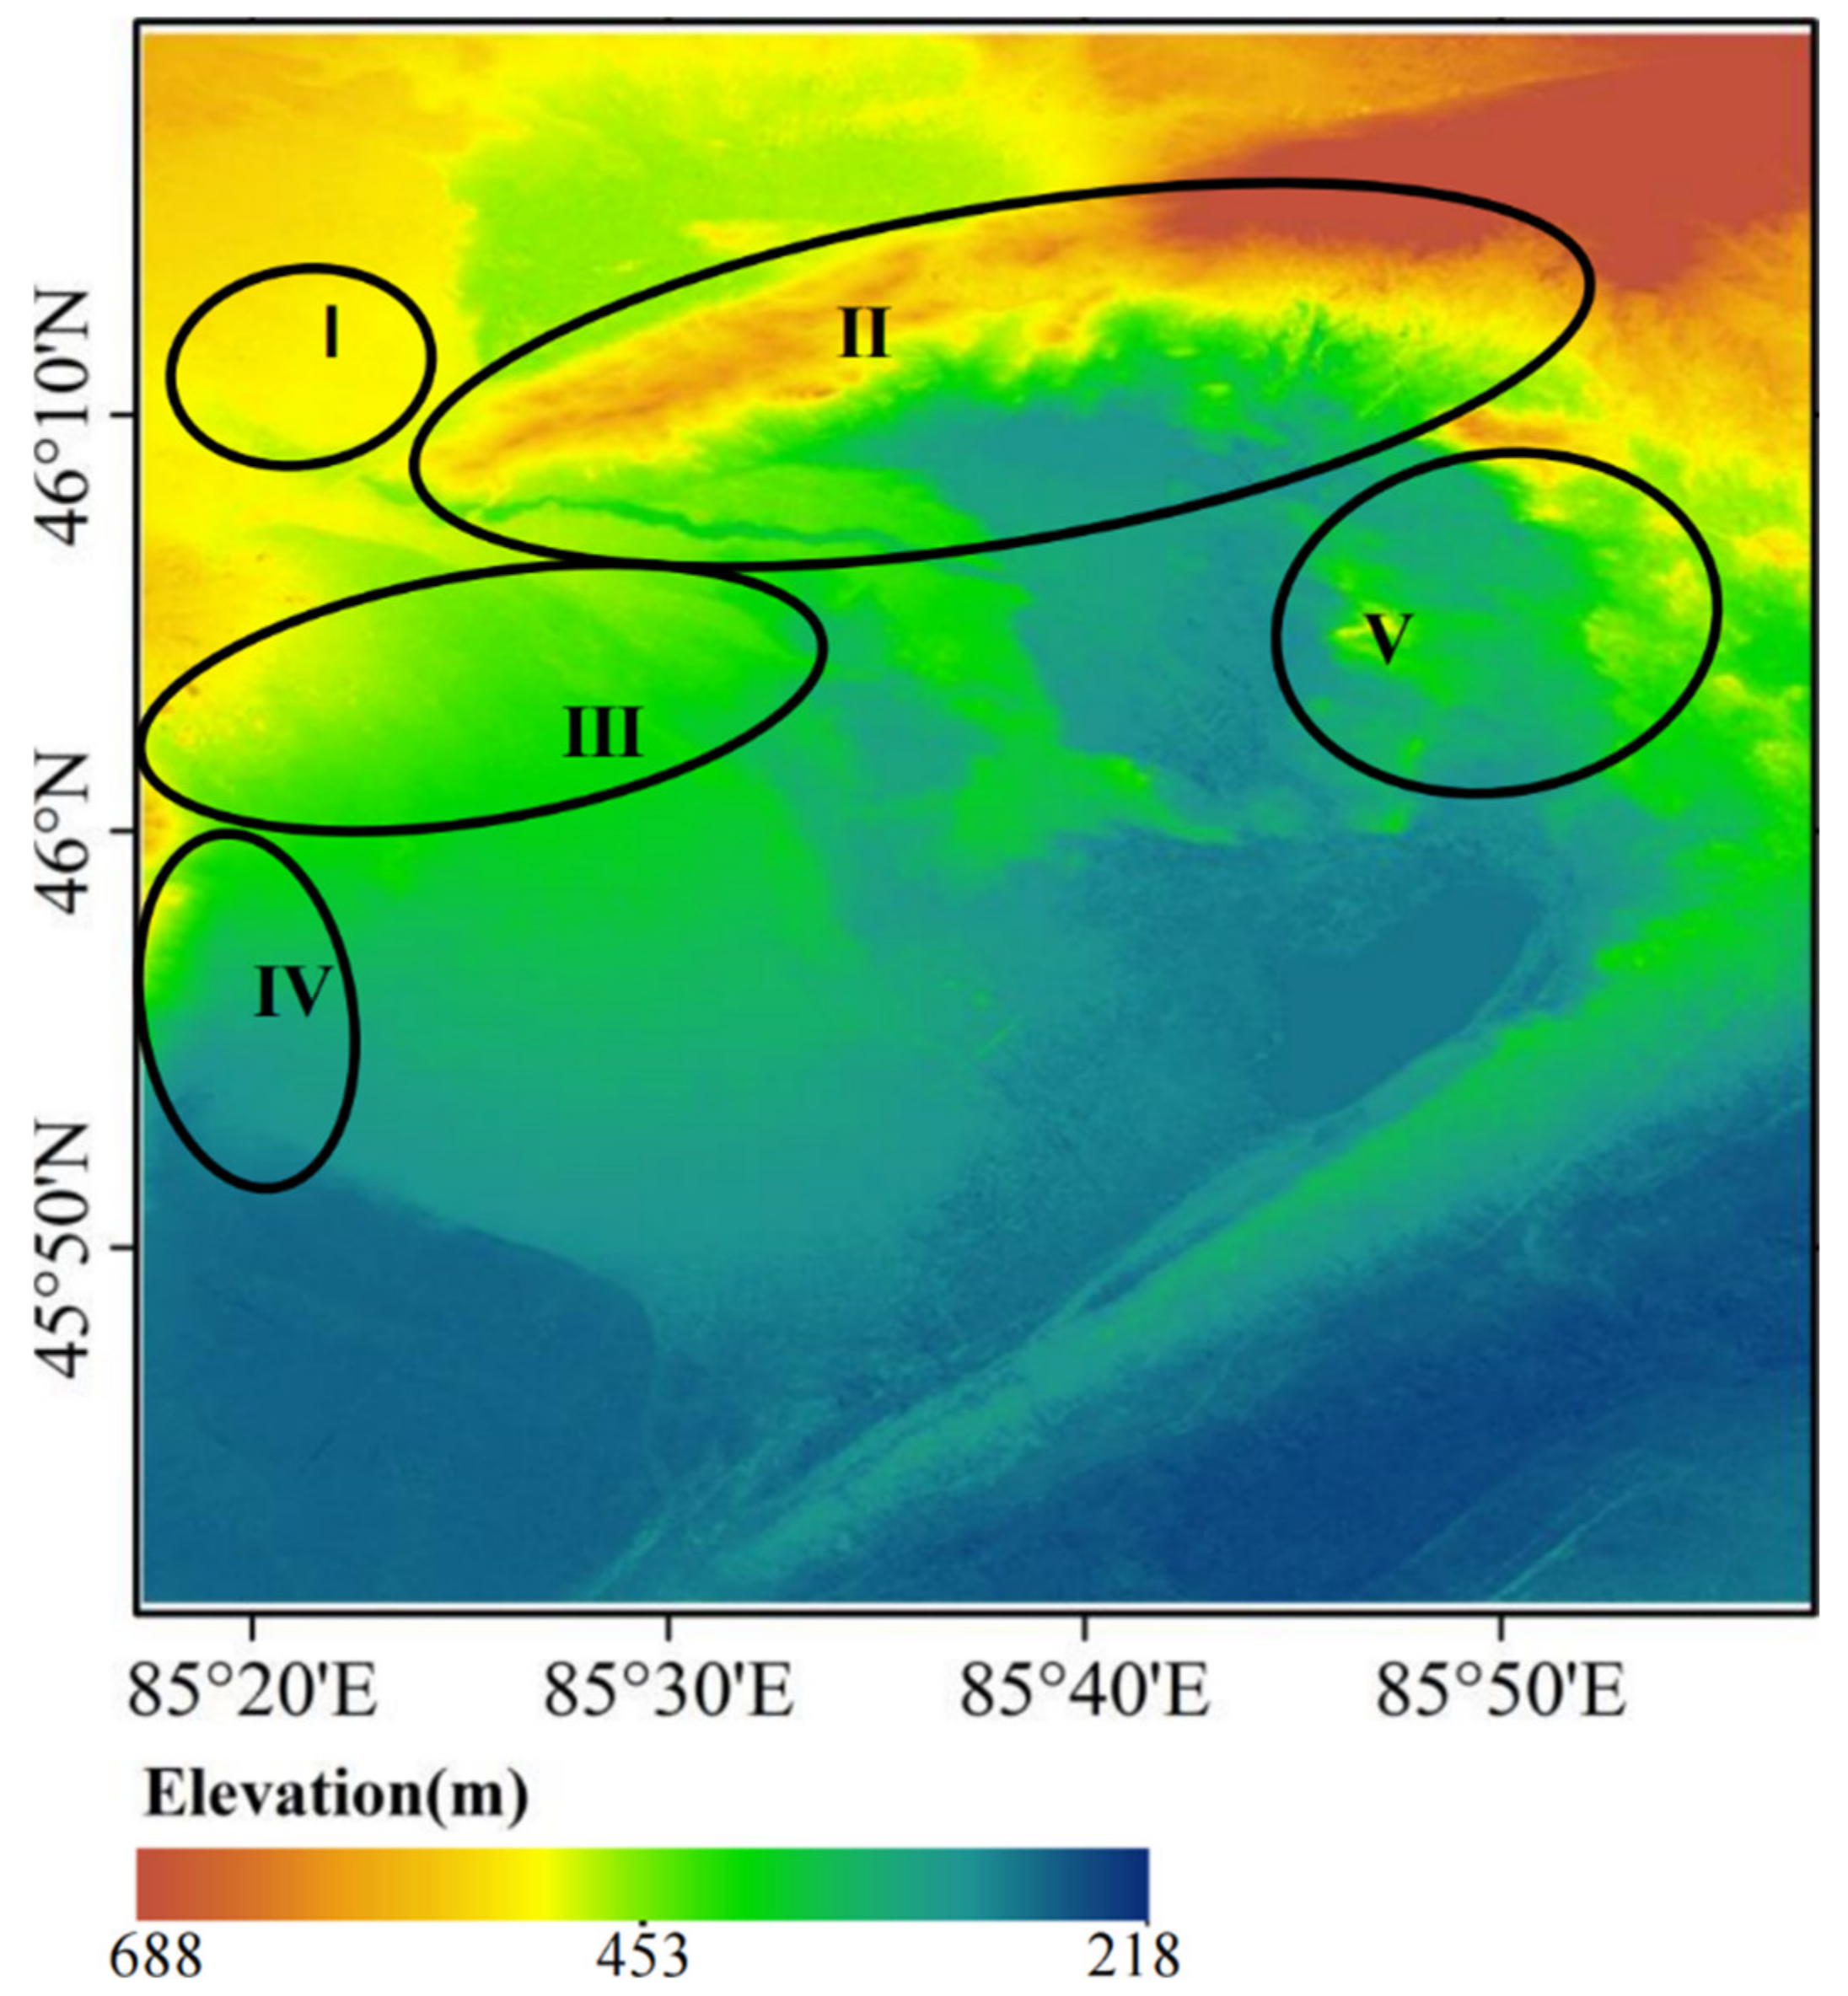
According to the elevation map of the study area (
Figure 3), the topographic and geomorphological conditions of the Wuerhe area can be interpreted as follows. The northern, northwestern, and northeastern parts of the study area are low mountainous hilly areas, while the central and southern parts are mainly plains. The overlay analysis of the elevation map and the high-temperature anomaly area reveals that high-temperature anomaly areas II and V are mainly located at the junction of the low mountainous hilly areas and plains, and anomaly area IV is located at the junction of the hills and plains. Therefore, the large elevation variation in these high-LST areas should be due to the influence of the topographic and geomorphological conditions.
- (2)
Combined analysis of the LST and land-use/cover type:
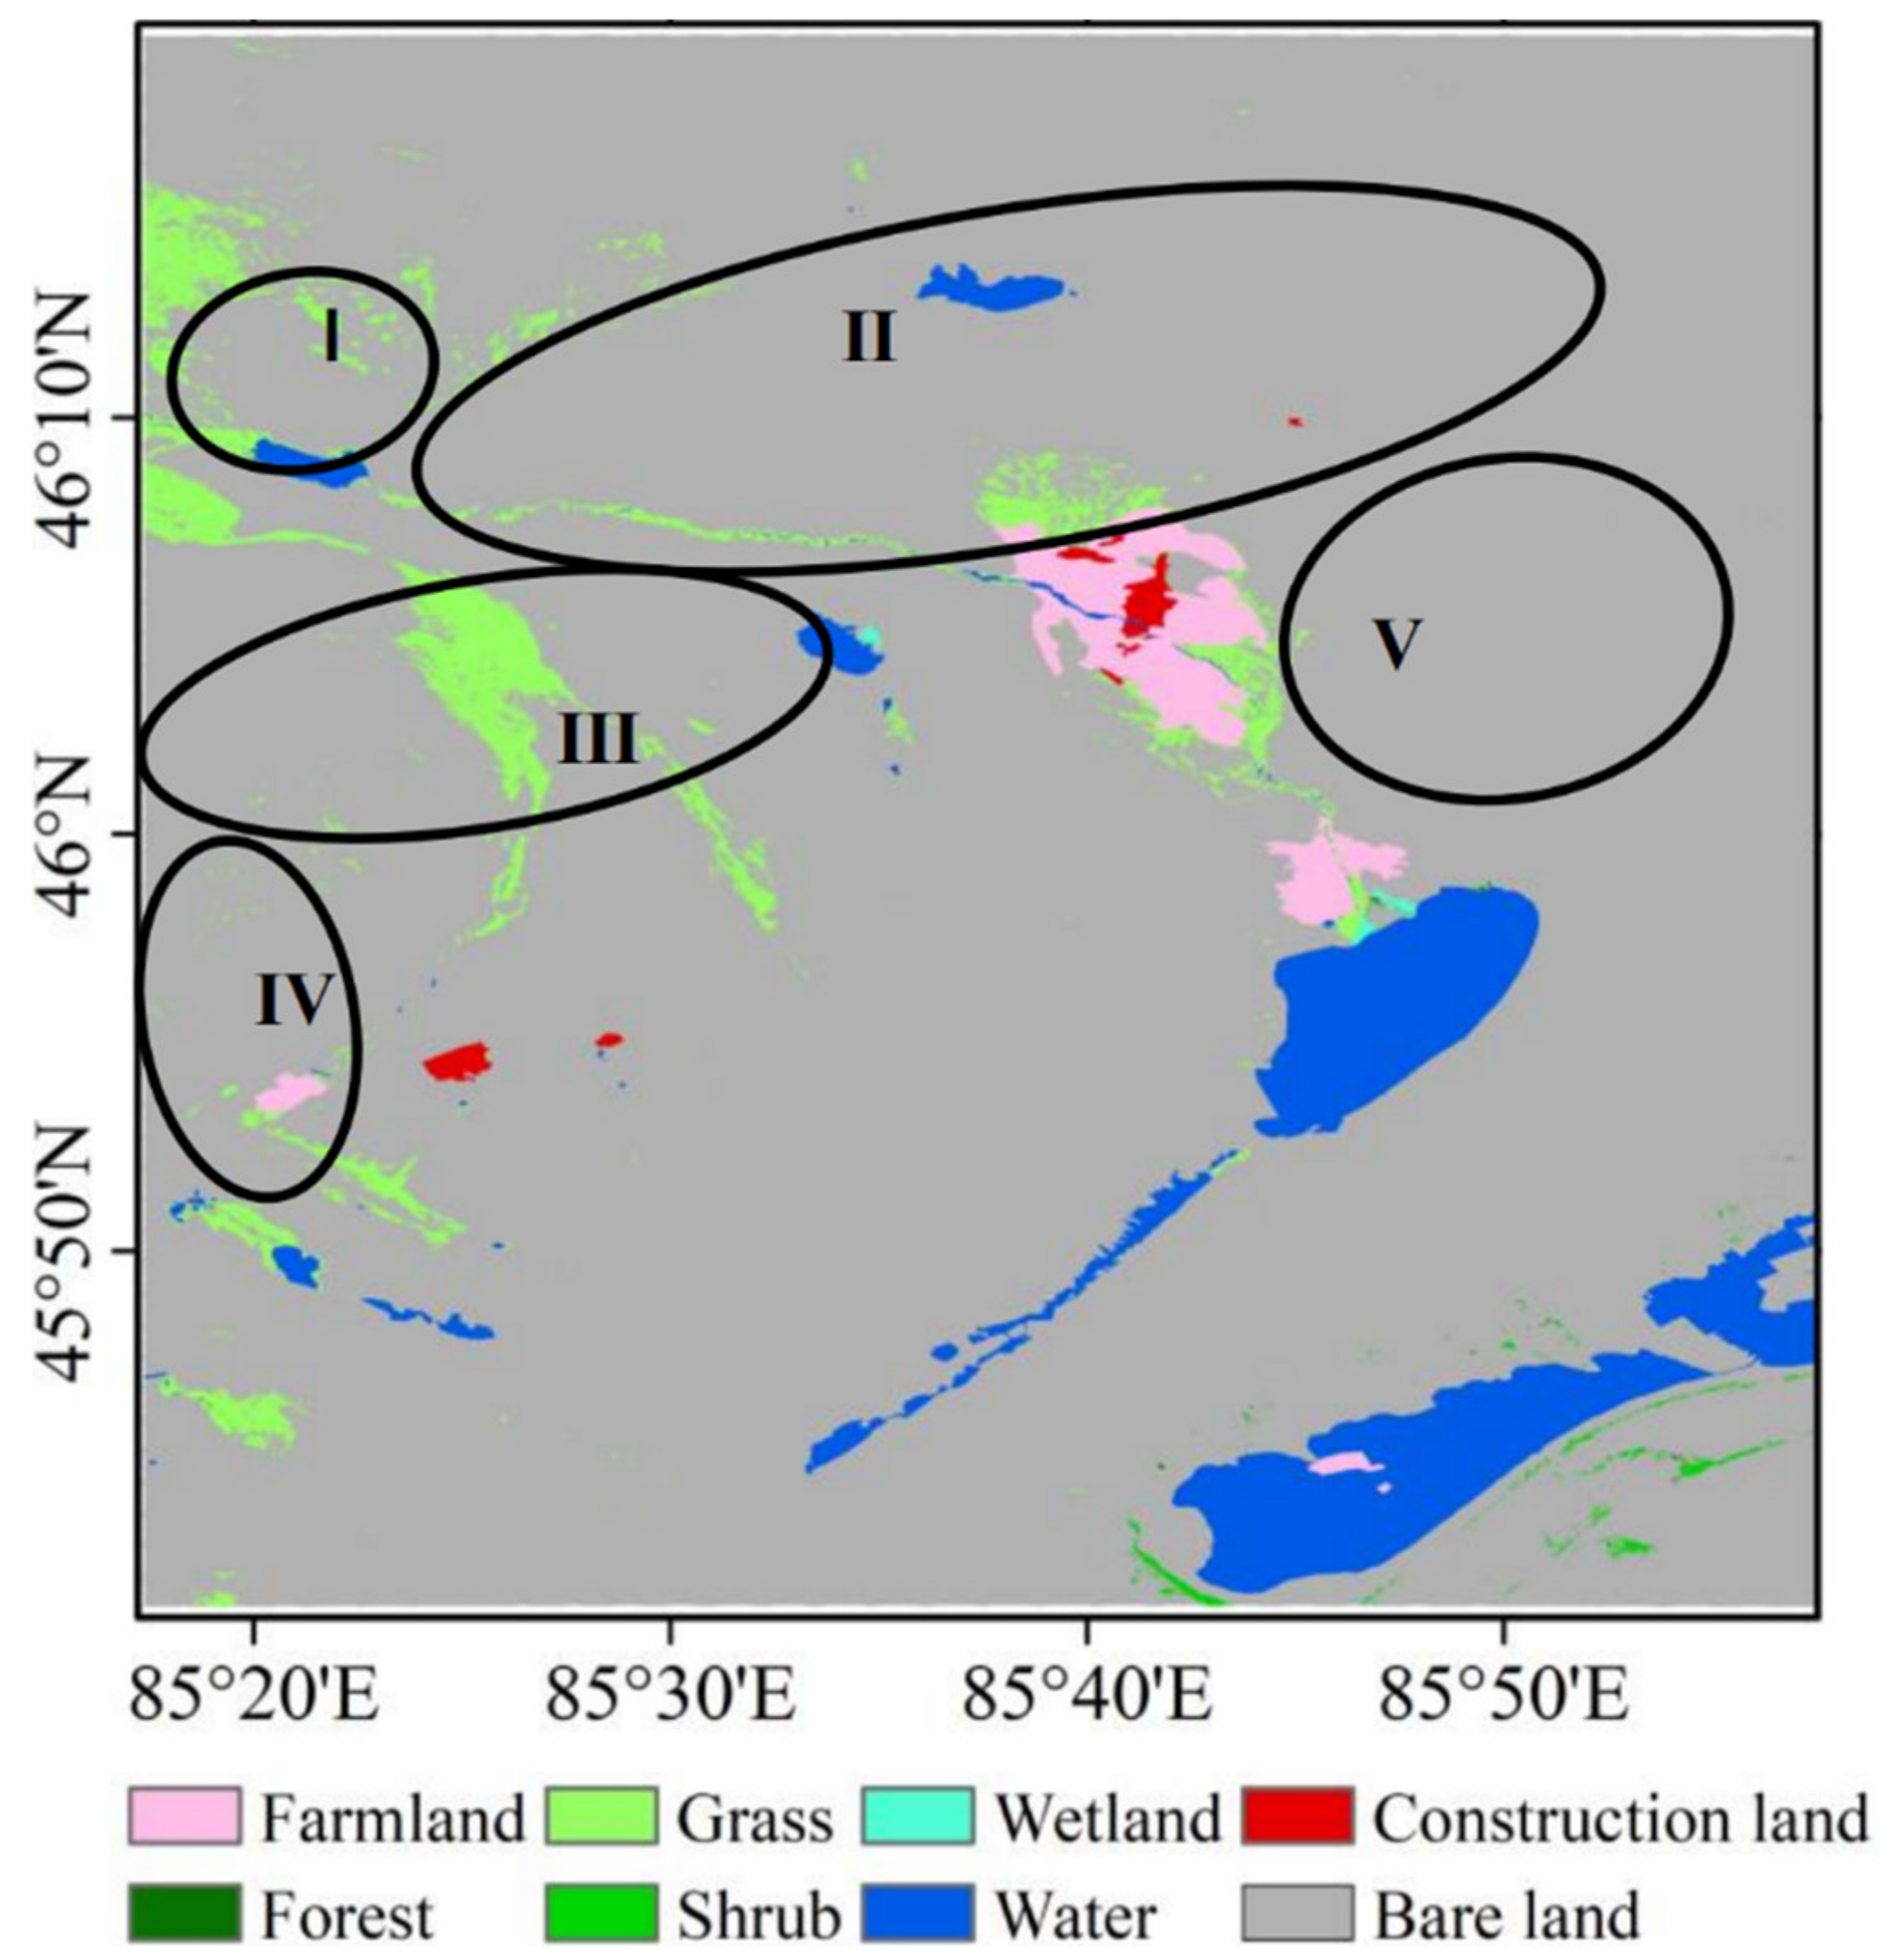
Different types of features have different surficial thermal properties, and the same type of features have similar thermal properties. The land-use/cover data (
Figure 4) were provided by the National Geomatics Center of China (
http://globeland30.org/, accessed on 18 October 2021), with an overall accuracy of 85.72% and kappa coefficient of 82. The combined analysis shown in
Figure 2 and
Figure 4 reveals that the LST is lower overall in the areas where the surface-cover/land-use type is lakes and vegetation. The bare land (desert) accounts for the largest proportion of the study area. Most of the surface land-use types in the large areas of the study area and in high-temperature anomalies I–V are bare land. Thus, it can be concluded that the thermodynamic properties of these regions and the pattern of the daily variations in the LST due to solar energy are similar. However, large areas in the east and south and in the high-temperature anomaly zone exhibit significant differences in the LST. The LSTs in the east and south are relatively low, and, thus, there must be other reasons for the high LST characteristics exhibited by the high-temperature anomaly zone.
The above comprehensive analysis of both the topographic and geomorphological conditions and the land-use/cover types reveals that high-temperature anomaly areas I and III may be caused by deep underground heat sources. However, the above findings need to be further verified by using the field MT survey data.
4. MT Data Inversion
4.1. MT Method
Terrestrial electromagnetic bathymetry is a geophysical exploration method proposed by Tikhonov (1950) and Cagniard (1953) in the 1950s to study the electrical structure of the Earth, using natural alternating electromagnetic fields [
30,
31,
32,
33]. When the natural alternating electromagnetic field is incident on the Earth and propagates in the form of waves in the subsurface, the observed value of the ground electromagnetic field will contain information about the resistivity distribution of the subsurface medium due to the electromagnetic induction. The electromagnetic field signals of different periods have different penetration depths, so geodetic electromagnetic sounding can invert the information of resistivity distribution of the subsurface medium at different depths by studying the electromagnetic data collected at the surface.
The MT method uses the natural alternating electromagnetic field as the signal source, and its frequency range is very low, which makes the detection depth of the MT method very large. As a means of electrical exploration, the MT method has a unique effect in geothermal resource exploration for the exploration of hidden deep geothermal sources.
4.2. Data Acquisition and Processing
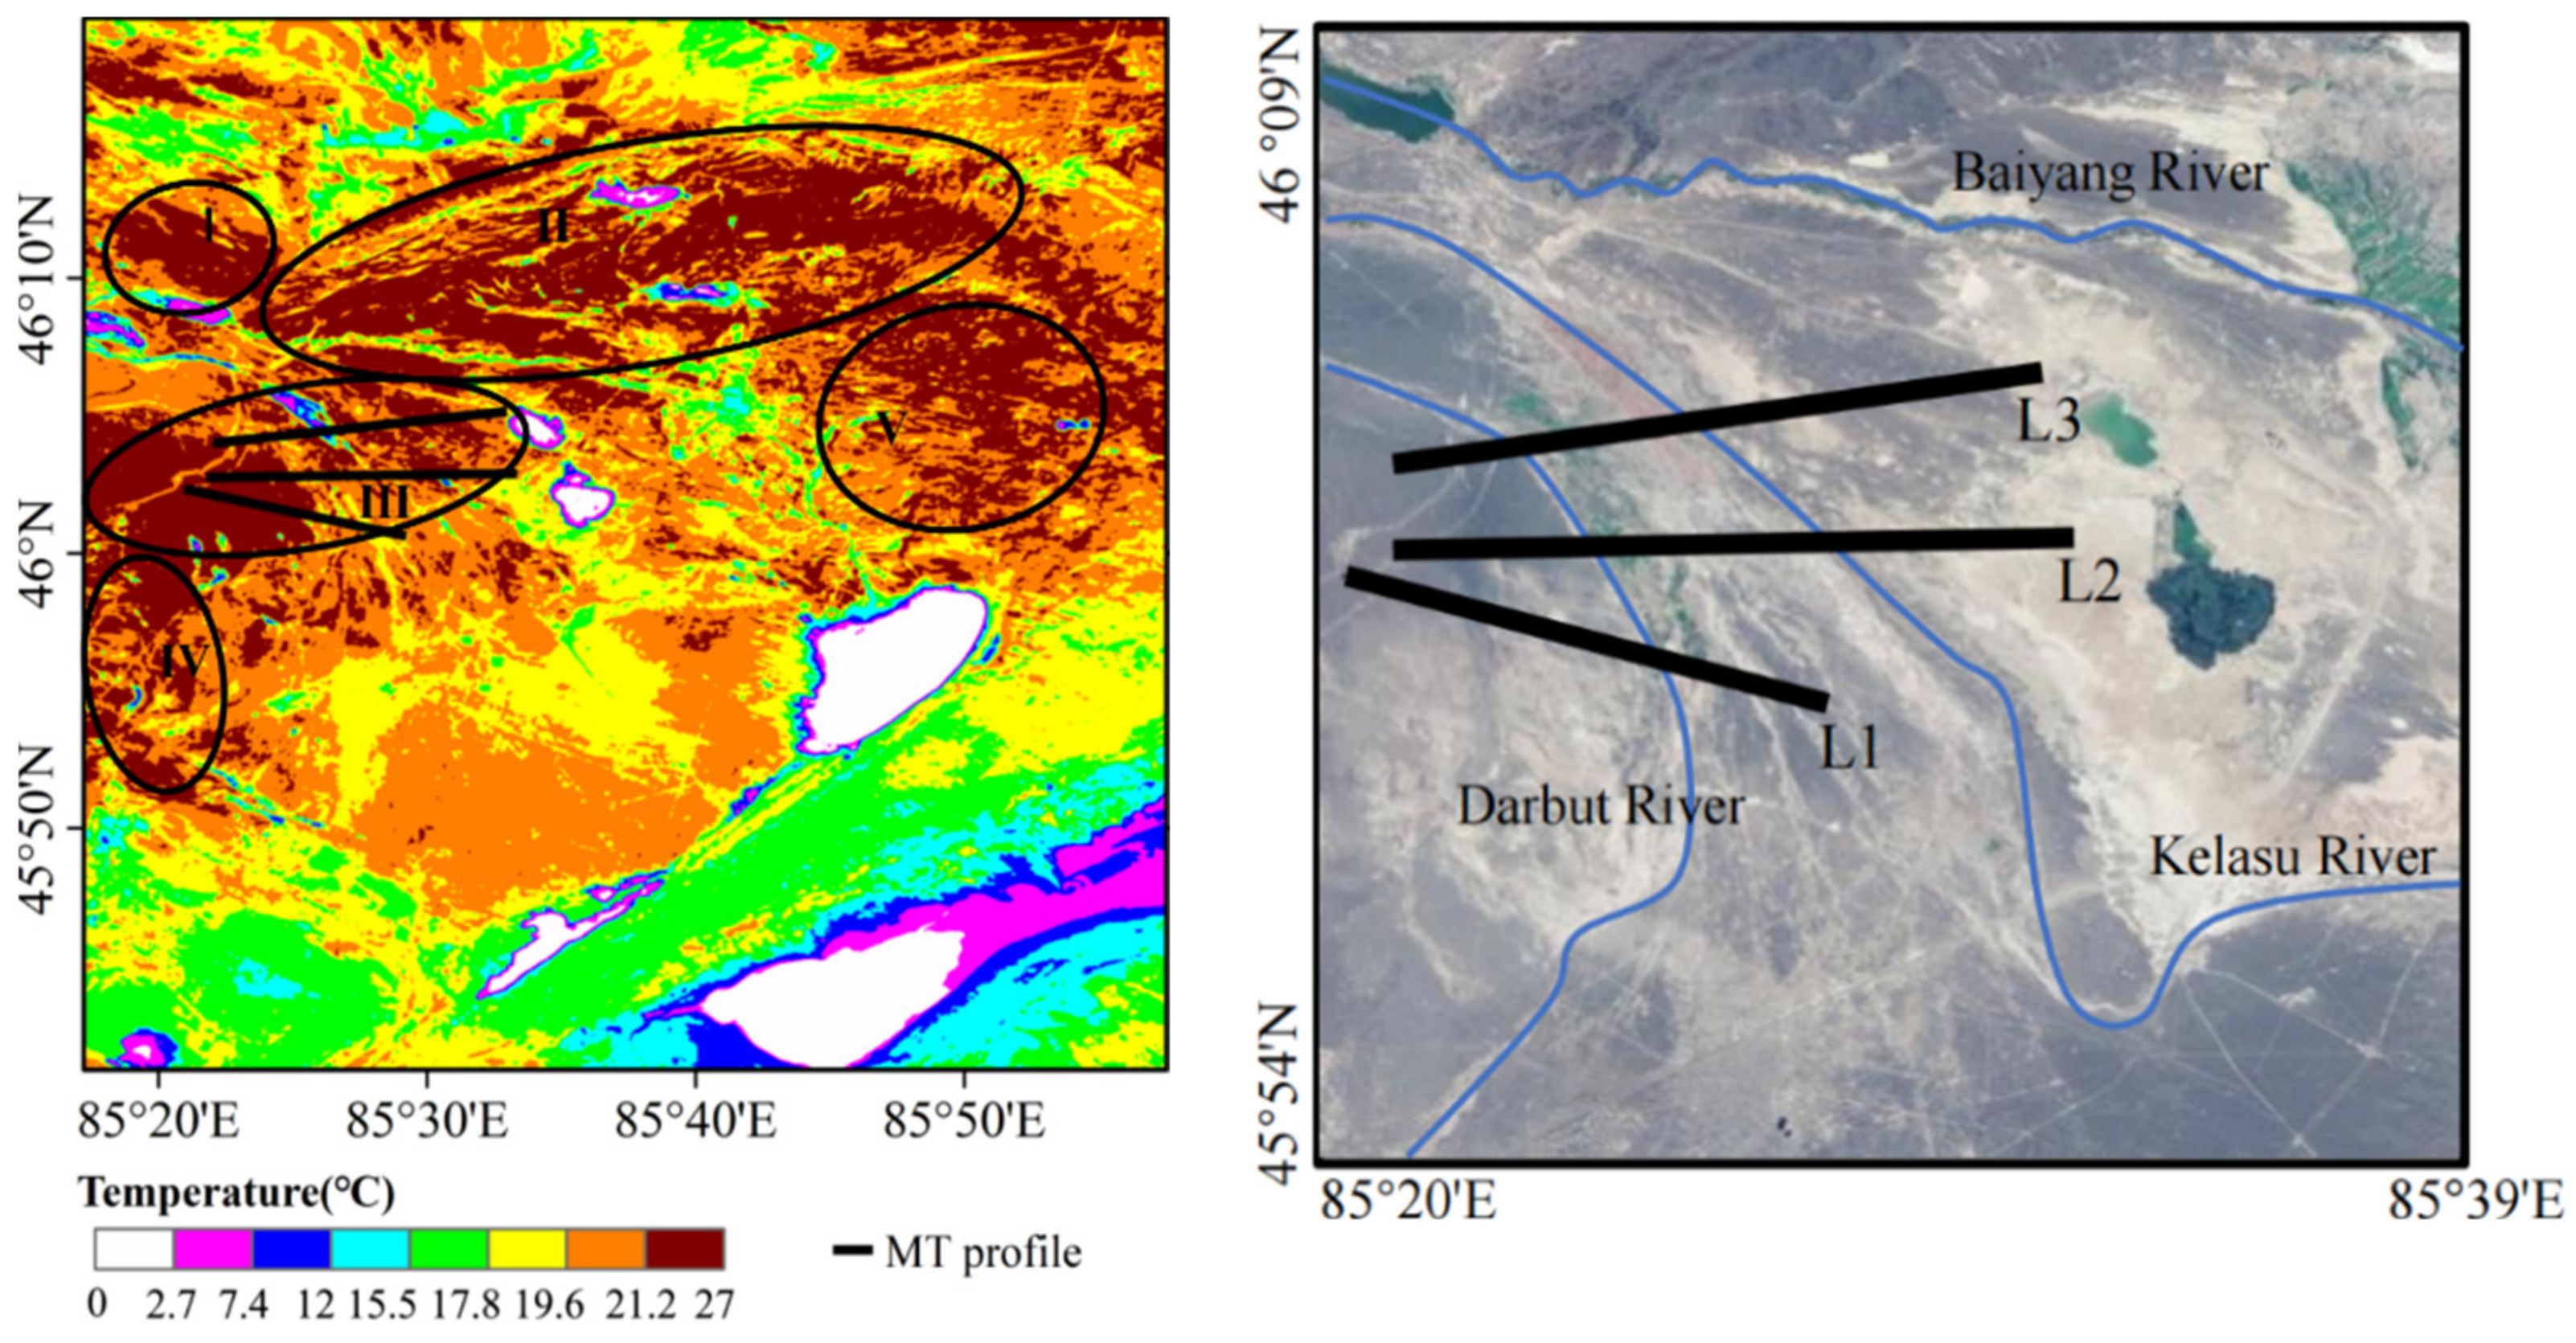
According to the LST retrieval results, MT data were collected in the high LST anomaly area III, using a MTU5A MT instrument (Phoenix Geophysical, Scarborough, ON, Canada), and three MT profiles were deployed (
Figure 5), namely Line L1, Line L2, and Line L3. The distance between the measurement points was generally 200 m, and the distance between the points in key areas was 100 m. The total length of the profile is 40.4 km, with 208 measurement points, including 53 measurement points on L1 line, with a profile length of 11.2 km; 76 measurement points on L2 line, with a profile length of 15 km; and 79 measurement points on L3 line, with a profile length of 13.9 km. To ensure the quality of the data, the far-reference channel observation method [
34] was used, with a single-point observation for more than 6 h and an effective observation frequency range of 320–0.002 Hz.
The collected MT data were processed as a time series, using the instrument’s own SSMT2000 and MT-Editor software. After robust processing, using the far-reference method [
35] and careful power spectrum selection, the MT responses at 208 measurement points were obtained.
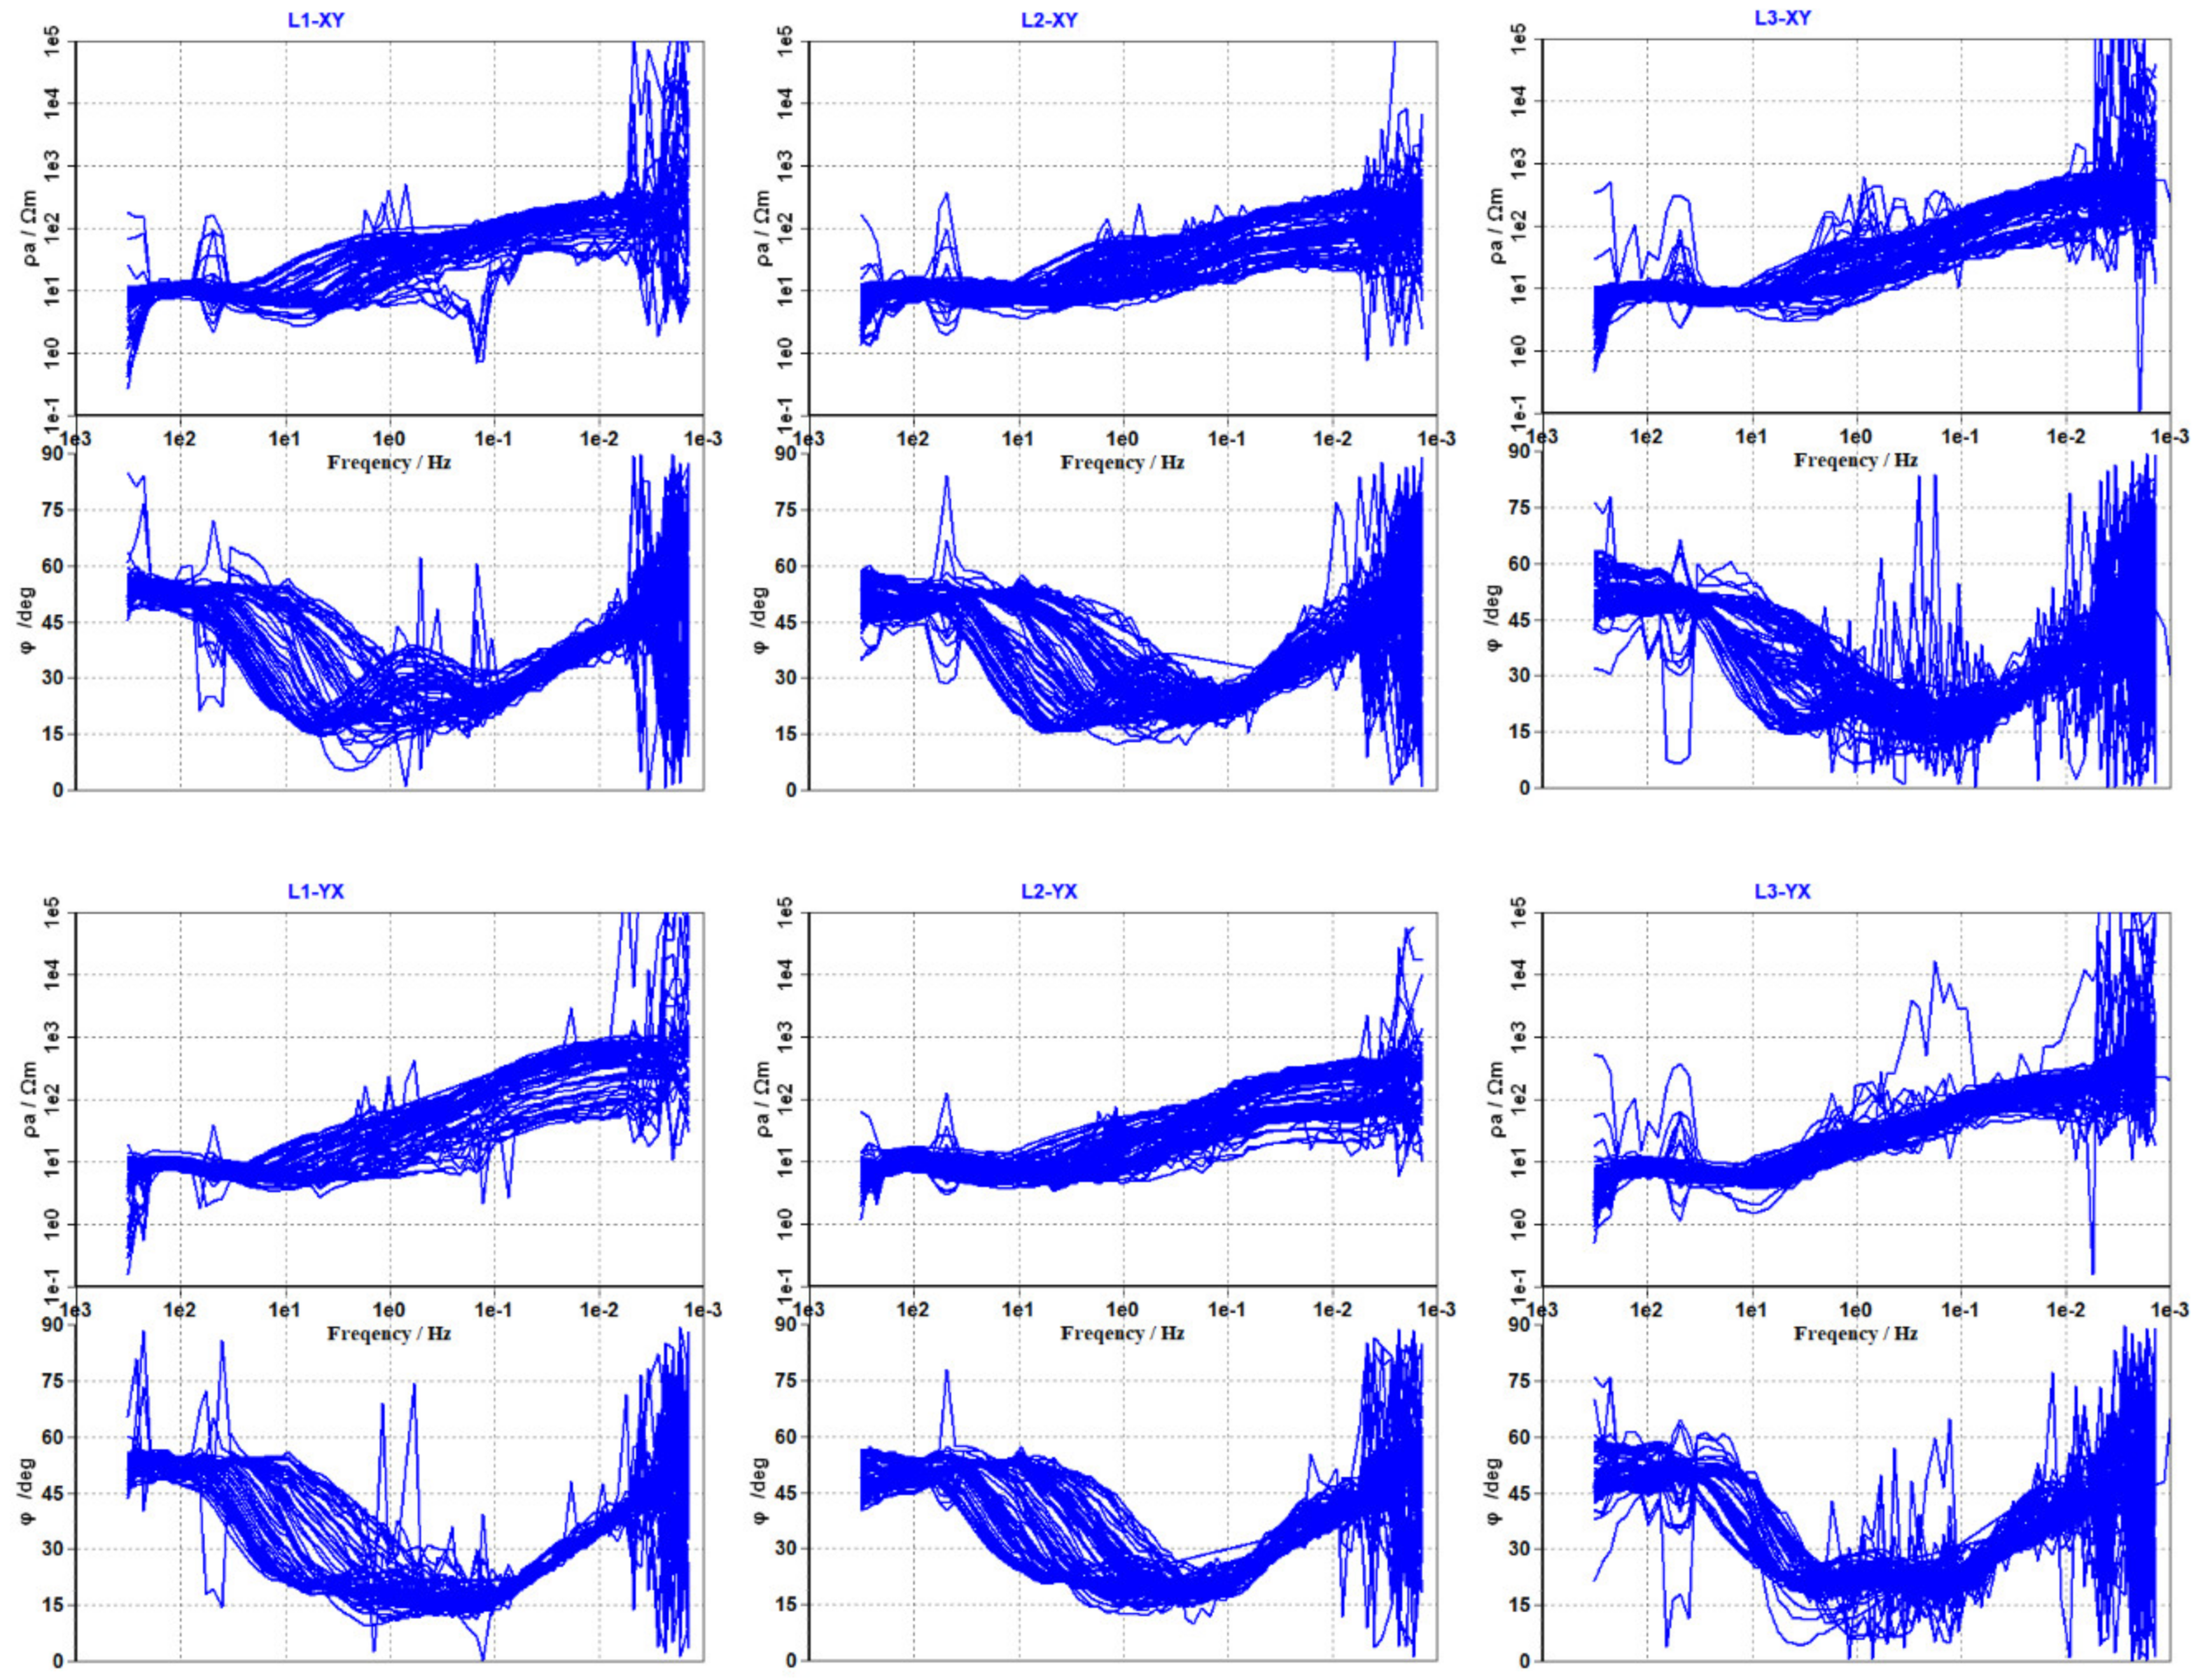
Figure 6 shows the overlapping plots of the apparent resistivity and the impedance phase for all of the measurement points. As can be seen from
Figure 6, the observation curves are smooth, the data are high in quality, and the valid period of most of the measurement point information reaches 500 s or more. Morphologically, the poles and inflection points of the apparent resistivity and phase curves correspond well, indicating a good agreement between the two. The overall shapes of the apparent resistivity and phase curves show that the electrical structure below the measurement area is characterized by low resistivity in the shallow part and relatively high resistivity in the middle and deep parts.
4.3. Dimensional Analysis and Structural Strike Analysis
After obtaining the impedance tensor information related to the frequency, in order to eliminate the influence of the local distortion of the MT response, it is necessary to obtain parameters such as the regional structural impedance and strike in order to further confirm suitable data processing and inversion methods. There are several impedance tensor decomposition methods, mainly including the Swift decomposition [
36], Bahr decomposition [
37], phase tensor decomposition [
38], and G-B decomposition methods [
36]. The Swift decomposition and Bahr decomposition methods are mainly used to determine whether the MT data satisfy the two-dimensionality assumption. The phase tensor decomposition and G-B decomposition methods are mainly used to analyze the direction of the main electrical axes of the regional structures.
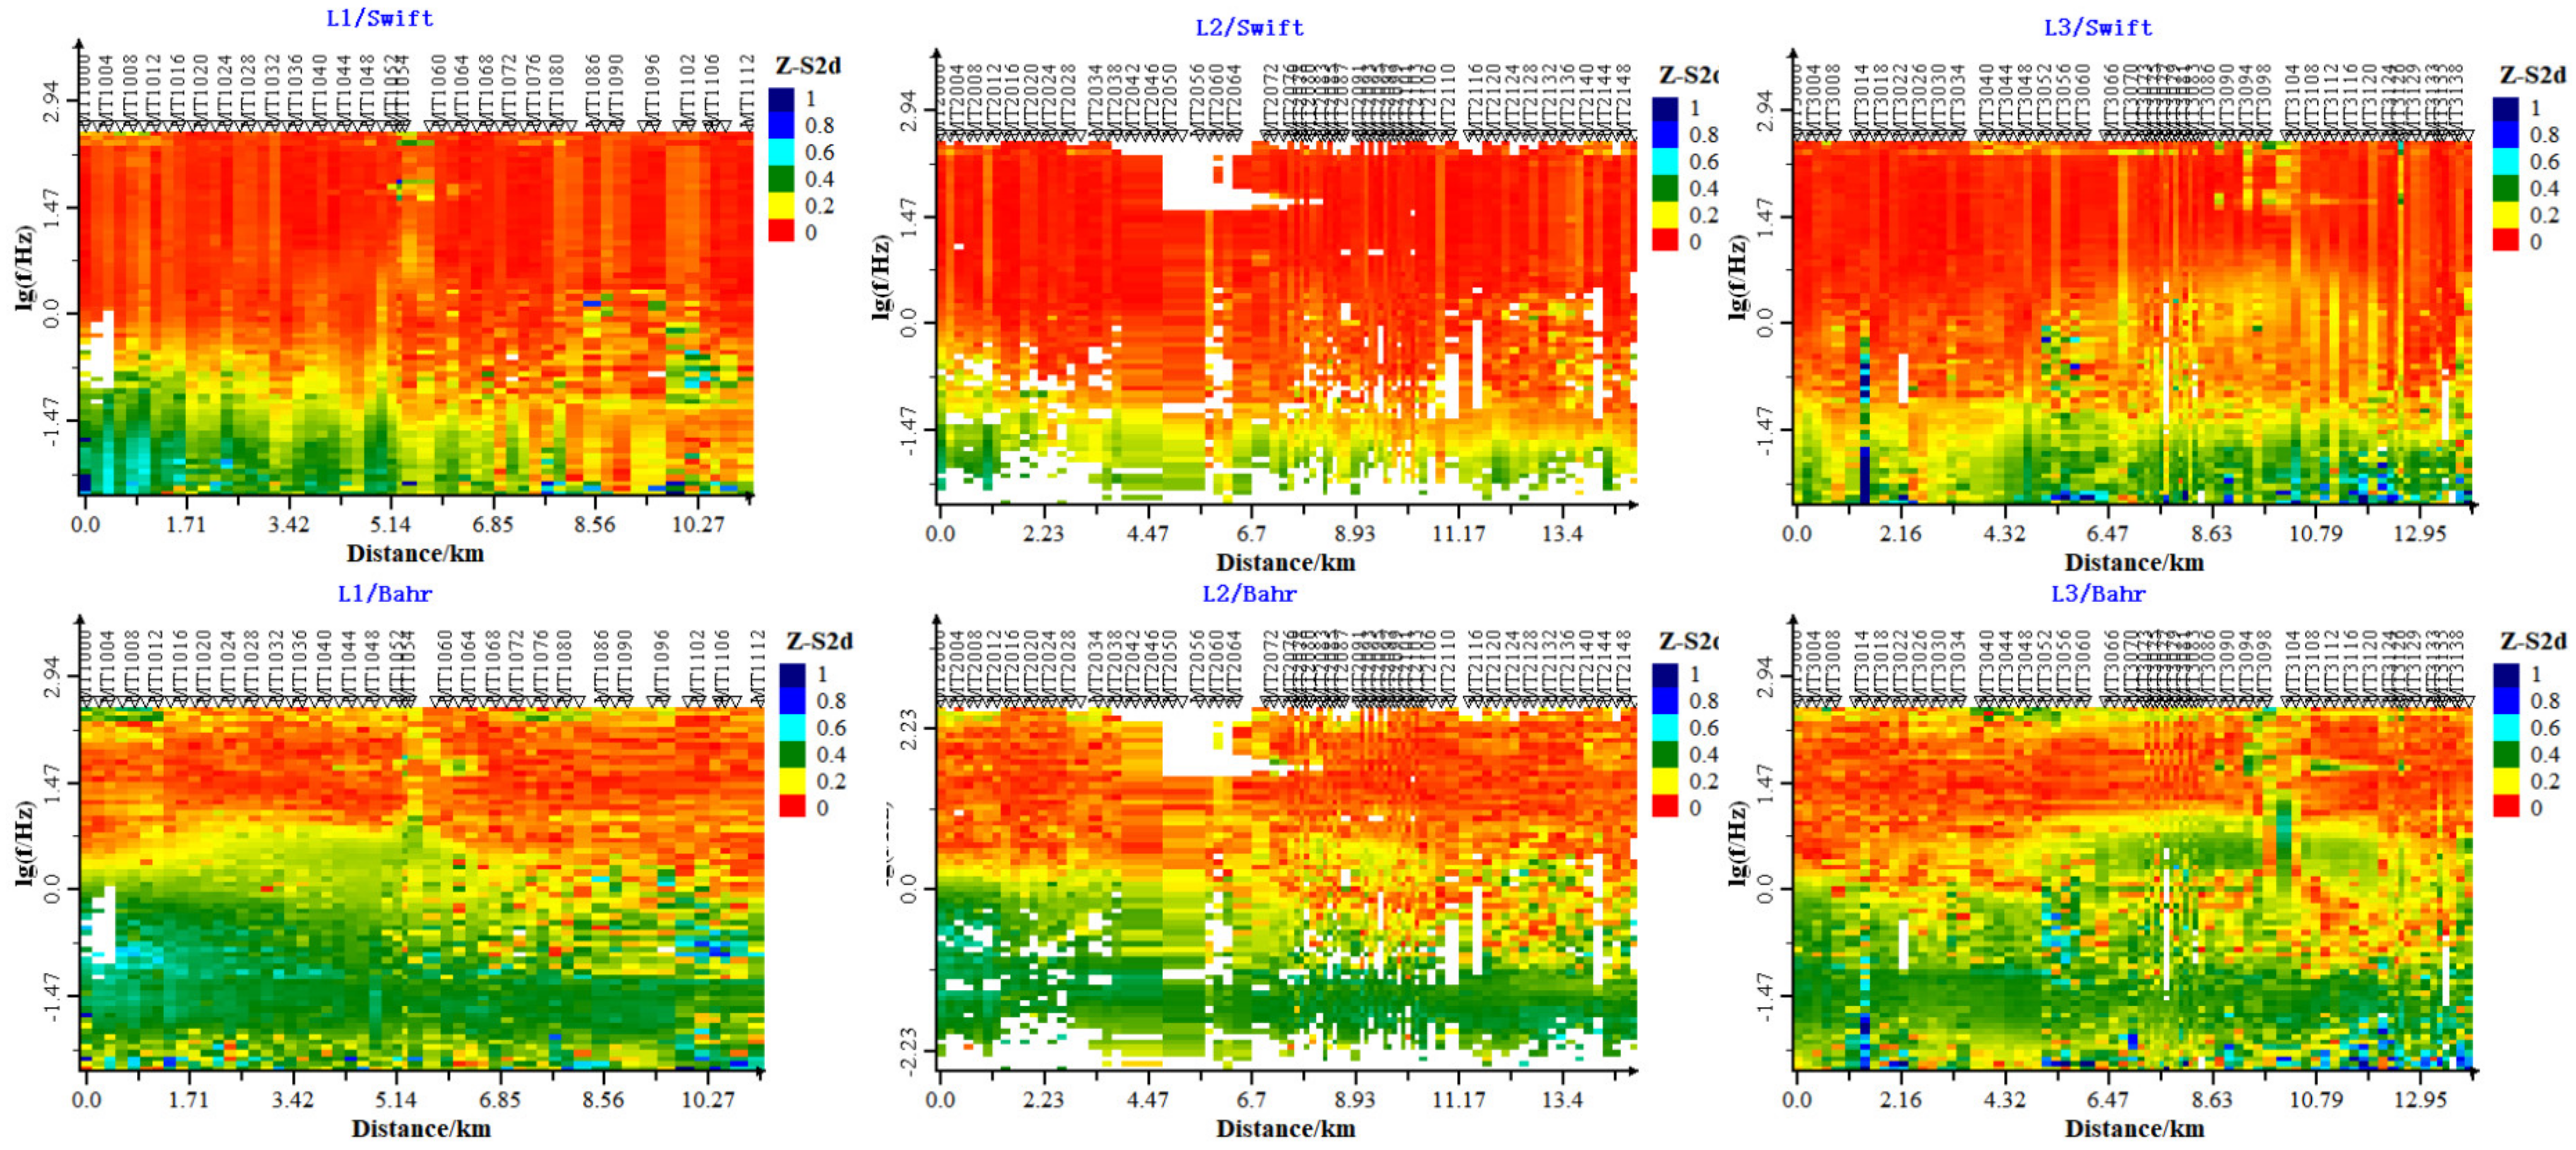
The Swift decomposition and Bahr decomposition methods were used to analyze the dimensionality of all of the MT data. The two-dimensional (2-D) deviation is an important parameter reflecting the dimensionality of the electrical structure of the subsurface medium. In general, when the value of the 2-D deviation is less than 0.3, it can be approximately regarded as a 2-D situation. Dimensionality analysis was performed on the profile, and
Figure 7 shows the pseudo section of the 2-D deviation of the profile. As can be seen from
Figure 7, the 2-D deviations of most of the measured points along the profile are less than 0.3. This indicates that the electrical structure of the subsurface medium generally satisfies the assumption of two-dimensionality and can be interpreted by using 2-D inversion.
The G-B decomposition method is the most widely used tensor decomposition method. It can separate the regional constructed impedance from the local electric field distortion effect from the observed impedance tensor, thus recovering the undistorted regional 2-D impedance tensor. The structural strike analysis of the L1–3 profiles was carried out by using the G-B decomposition method, and the statistical results of each profile are shown in the form of a rose diagram in
Figure 8. It can be seen from
Figure 8 that the principal electrical axes of profile L1 are about NE54° and SE144°, those of profile L2 are about NE45° and SE135°, and those of profile L3 are about NE40° and SE130°. According to the regional geological and structural data, the structural strikes of the three sections are NE54°, NE45°, and NE40°.
4.4. Data Inversion
There are various models for 2-D MT inversion, generally including the transverse electric (TE), transverse magnetic (TM), and TE+TM models. However, according to the existing studies [
39], the TE model requires the model to have a much higher two-dimensionality compared to the TM model. In this study, based on the results of the impedance tensor decomposition and the analysis of the regional geological and structural features, the MT-pioneer data-processing software was used to perform the inversion. In addition, the nonlinear conjugate gradient (NLCG) algorithm was used to test various inversion parameters for different modes of the MT data [
40]. By comparing and analyzing the various inversion models with different modes and parameters, it was concluded that the inversion of the TM model reflected the distribution pattern of the electrical structure of the subsurface medium most accurately.
The regularization factor is a key parameter in the inversion of the MT regularization. A reasonable selection of the regularization factor can both make the inversion results fit the observed data well and make the model have a good smoothness. In the NLCG algorithm, the regularization factor needs to be set artificially [
41]. In this study, a number of different regularization factors in the range of 10,000–0.01 were selected for the 2-D inversion calculations, and the optimal regularization factor of 30 was identified by comparing the ϕd–ϕm curve intersection plots (
Figure 9) with multiple inversions. The final selected inversion parameters of the model are as follows: TM threshold error of 5%, regularization factor tau of 30; initial model is a 100 Ω·m uniform half-space; inversion frequency range of 320–0.001 Hz; and 120 iterations. The final root mean square (RMS) inversion fit differences of 2.35, 2.75, and 3.67 for the profiles L1–3, respectively, indicate that the fit is good and can reflect the real structure of the subsurface to some extent.
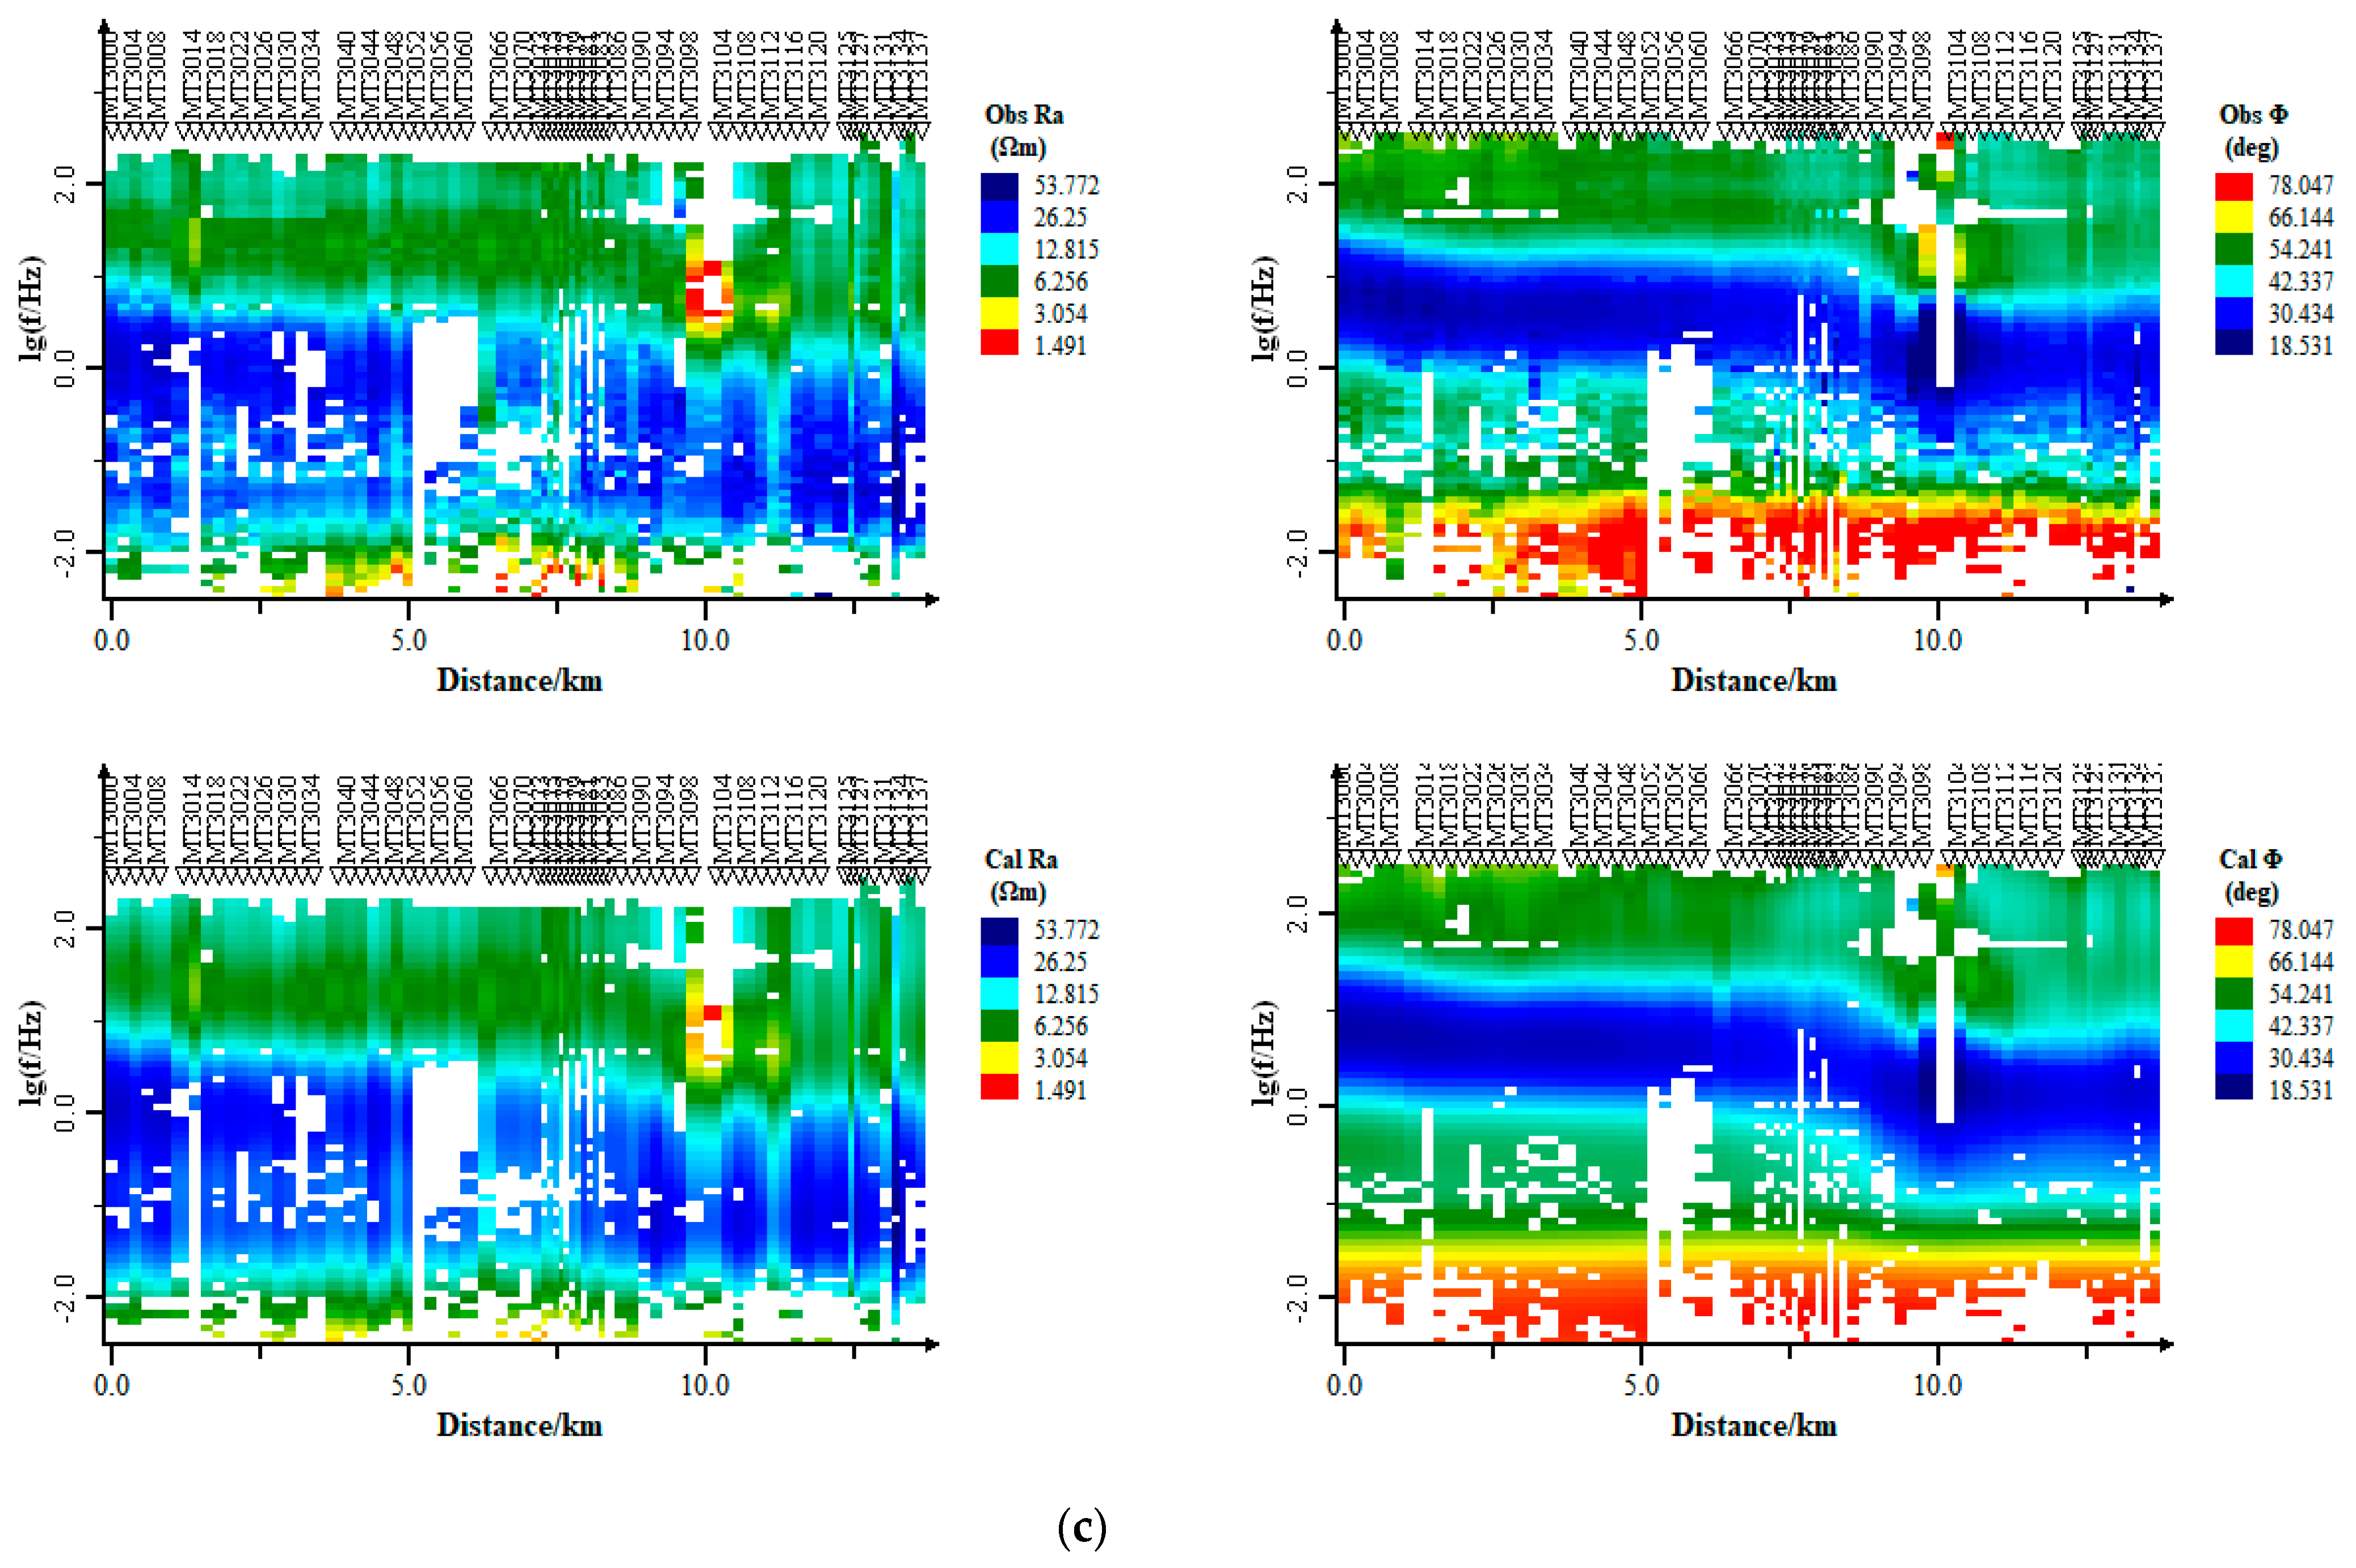
To evaluate whether the 2-D inversion results are reliable, the apparent resistivity and the phase pseudo section before and after the inversion are important evaluation criteria.
Figure 10 shows the 2-D inversion of the measured data for profiles L1–3 used to calculate the apparent resistivity and phase pseudo section. As can be seen from
Figure 10, the inversion model response data of the apparent resistivity and phase are in very good agreement with the original observation data, indicating that the reliability of these 2-D inversion results is guaranteed.
5. Geologic Interpretation
The resistivity-depth profiles of the three lines of measurement were obtained by collecting and analyzing the relevant known information about the study area, combined with the geological characteristics of the study area and the inversion results of the collected MT data (
Figure 11). The survey lines trend nearly east–west, with the small end of the survey point located in the western part of the profile and the large end in the eastern part of the profile. As can be seen from
Figure 11, the inversion results show a consistent electrical structure within the zone. The shallow stratum is a relatively low resistivity electrical layer, which gradually becomes thicker from west to east. Its lower stratum mainly has a relatively high resistivity, and the burial depth of the high resistivity layer is shallower in the western part of the profile and deeper in the eastern part.
5.1. Stratigraphic Division
Based on the logging resistivity statistics of the known wells (
Table 1), the lithological stratification of the wells, and the characteristics of the inverse resistivity profiles, the interpretation delineated two sets of electrical layers. The first layer is a shallow, relatively low resistivity layer of Cretaceous and Jurassic strata. The profile shows resistivity values of less than 100 Ω·m. The lithology is mainly sandy conglomerate, muddy sandstone, mudstone, conglomerate-bearing muddy sandstone, and fine sandstone. The second layer is composed of relatively high resistivity Carboniferous strata. The profiles show resistivity values varying from 100 to 10,000 Ω·m. The lithologies are mainly tuffs, andesites, volcanic clastic rocks, metamorphic rocks, and anorthosite. The inversion results are consistent with the local geological structure and logging data, thus indicating that the inversion results are credible.
5.2. Fracture Structure Interpretation
The fracture structure interpretation was considered from the perspective of physical analysis. Where the fracture zone is developed, the rock structure is prone to loosening and fragmentation, and the fracture zone is often filled with a large amount of low resistivity material, forming a low resistivity anomaly zone with significant electrical differences from those of the surrounding strata. The existence of such electrical structure differences results in the fracture zone containing obvious electrical gradient bands or distortion bands in its electrical structure.
From the model of the electrical structure shown in
Figure 11, it can be seen that the high resistivity values in the lower stratum at the location of the profile corresponding to the Dalbout riverbed in profile L1 are anomalous. The high resistivity electrical layer is interrupted laterally, and the relatively low resistivity electrical layer thickens at this location, inferring the existence of fracture F1-1 at this location. The strata under measurement points 1044–1050 exhibit a lateral interruption of the high resistivity electrical layer and a low resistivity intrusion, inferring the existence of fracture F1-2 at this location. The location of the profile corresponding to the Dalbout riverbed in profile L2, where the high resistivity electrical layer exhibits a lateral interruption and a relatively low resistivity intrusion, is presumed to have a possible fracture (i.e., F2-1). The location of the profile corresponding to the Klasu riverbed exhibits a break in the high resistivity electrical layer laterally and a relatively low resistivity intrusion, and it is speculated that fracture F2-2 may exist at this location. A lateral discontinuity exists in the high resistivity electrical layer at the location of the profile corresponding to the Dalbout riverbed in profile L3, where fracture F3-1 is presumed to exist. Low resistivity intrusions appear in the strata under measurement points 3086–3092, and the presence of fracture F3-2 is inferred at this location.
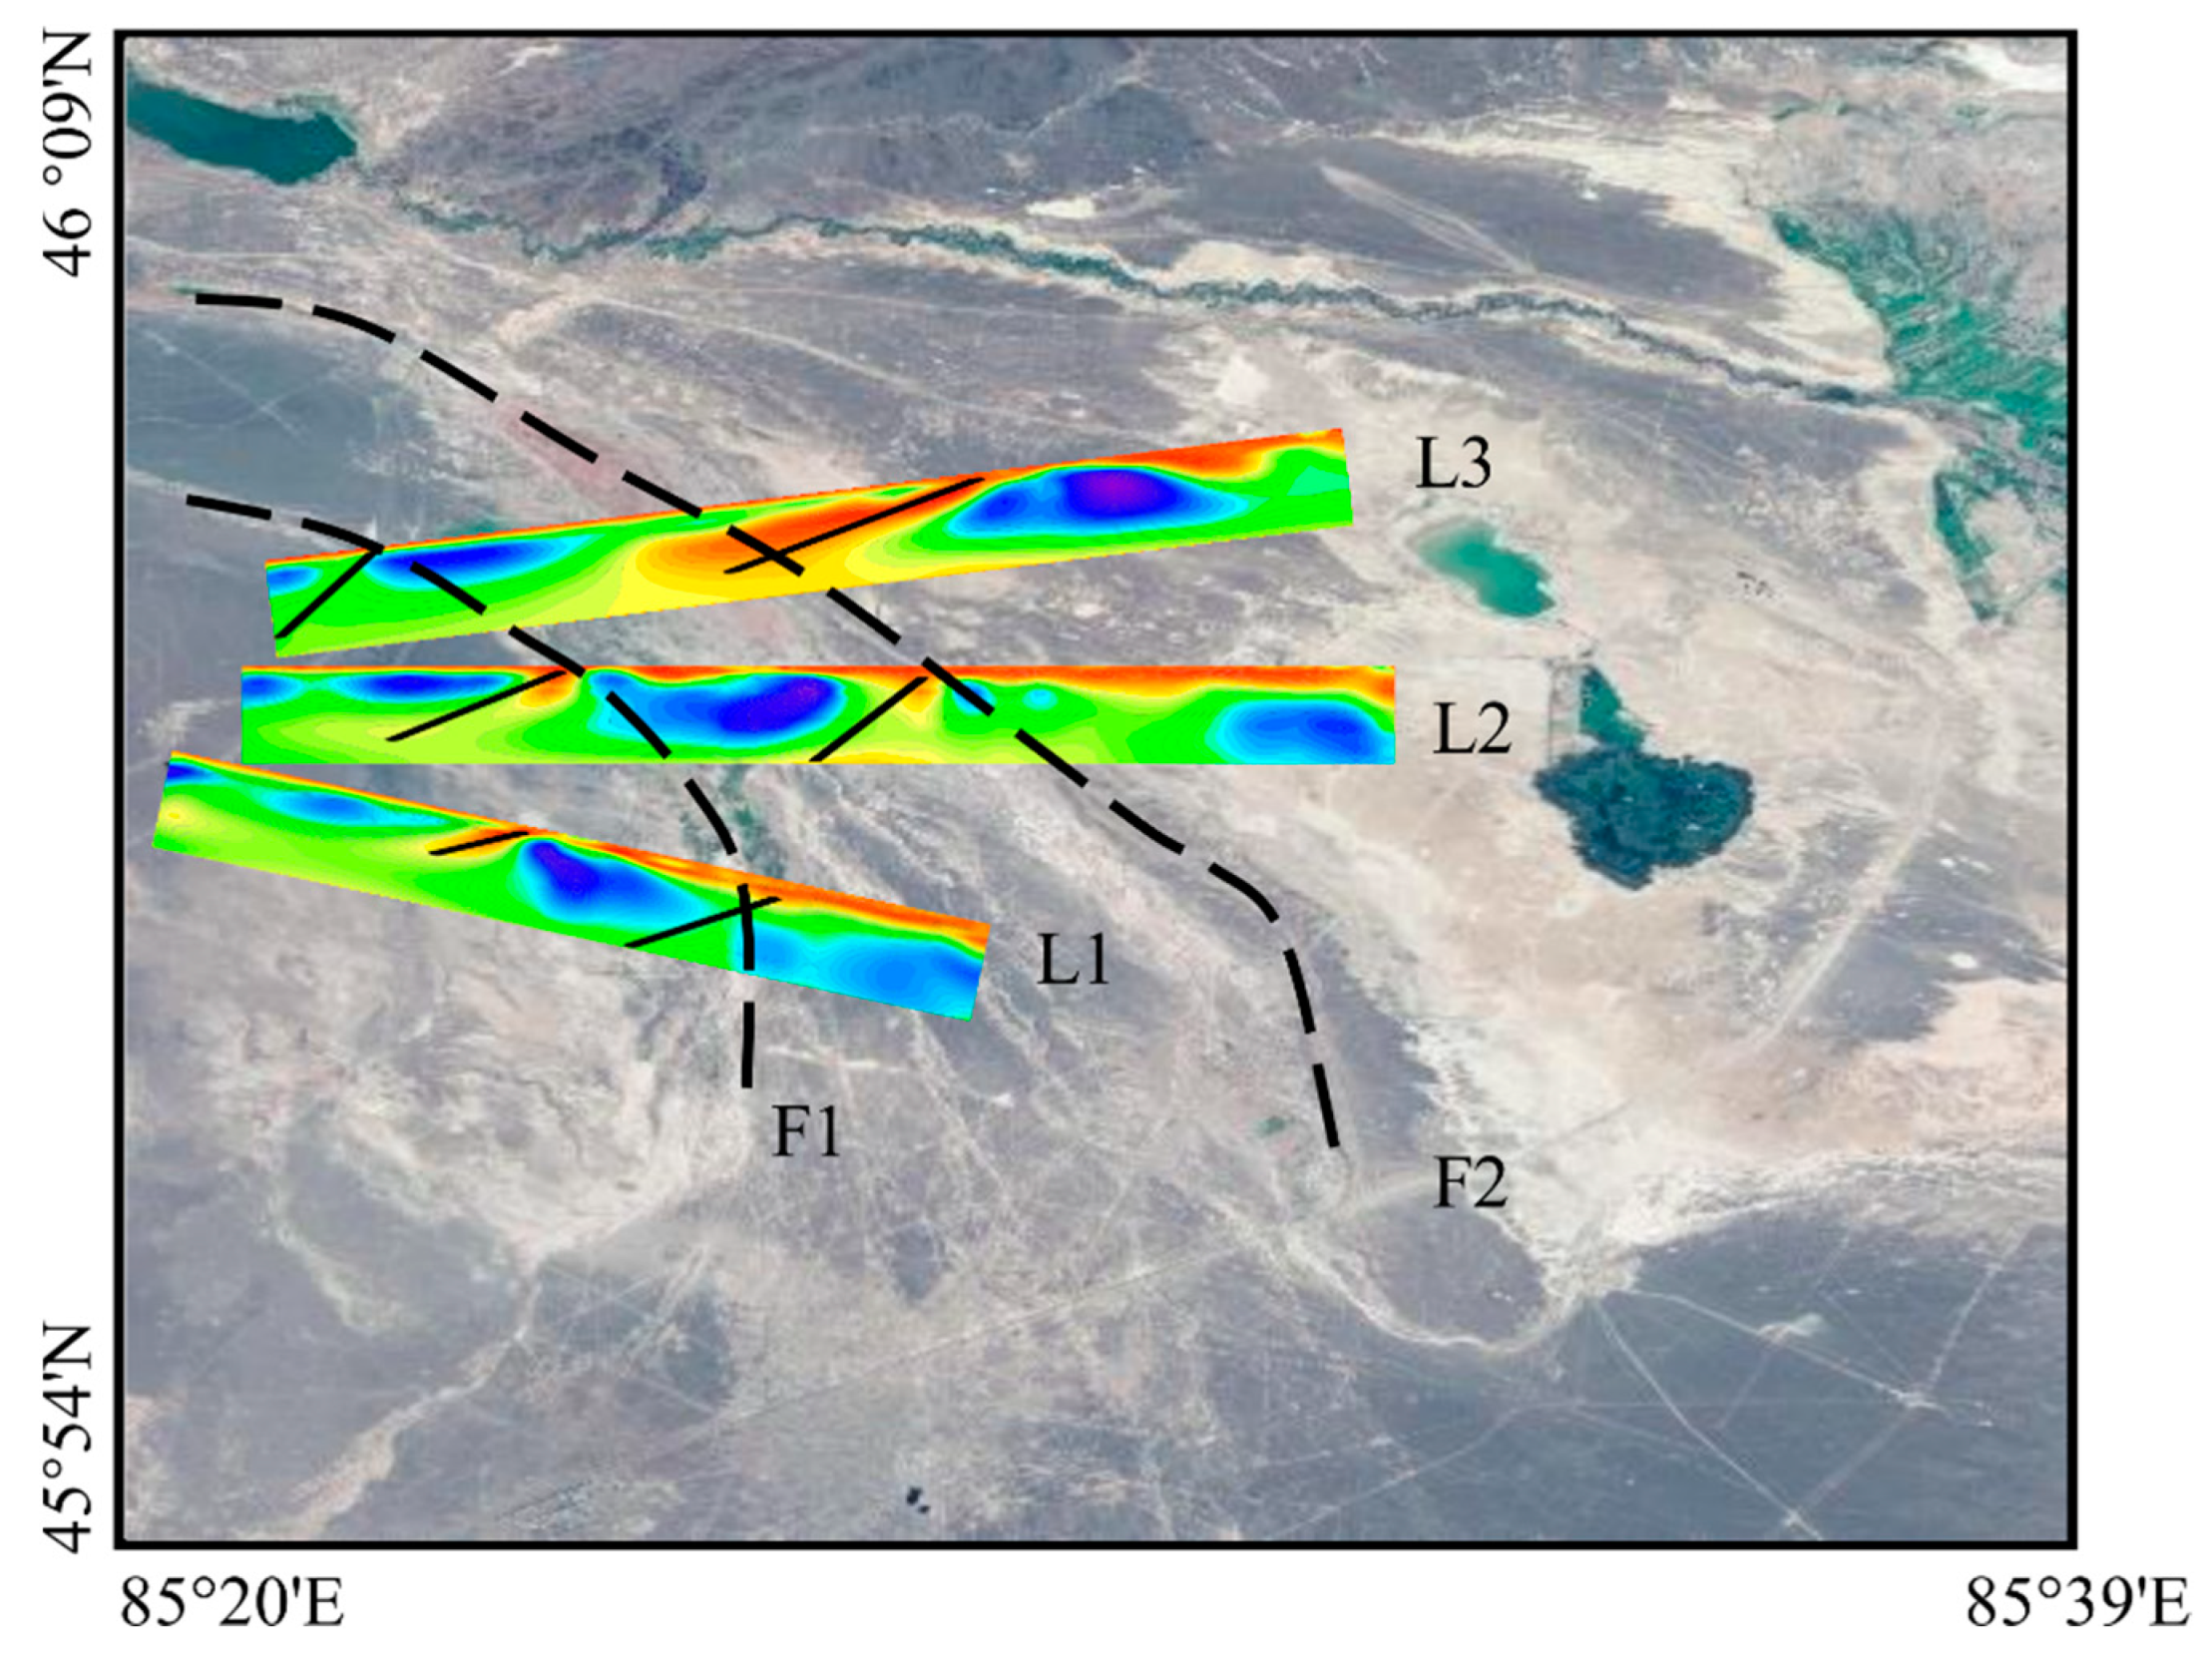
Based on the geological and geomorphological conditions and the location of the inferred faults, it can be basically concluded that F1-1, F2-1, and F3-1, the locations of which are interpreted from the characteristics of each resistivity profile, constitute fracture F1 of the pre-mountain occultation; and fractures F2-2 and F3-2 constitute fracture F2 of the pre-mountain occultation (
Figure 12). The fractures spread in a northwest–southeast arc in front of the mountain.
6. Geothermal Exploration Prospect Evaluation
The normal warming by the Earth’s heat flow is one of the main heat sources of underground hidden geothermal resources. The heat source from normal warming by the Earth’s heat flow comes from the lower crust or upper mantle and diffuses to the near surface via conduction and convection. In the convective mode, the degree of development of the fracture structure is the key factor. The fracture structure in the study area is relatively well developed, and the Dalbout Fault is the main deep major fracture in the study area, which easily communicates with the deep heat sources. Through the analysis of the results of this survey, we see that there are two main northwest–southeast arcing fractures (F1 and F2) in the study area. Moreover, the fractures are developed and easily form cracks; thus, the fracture development area is also the main area of the crack type storage group. In addition, based on known drilling and geothermal gradient information, it is concluded that the formation temperature in the high temperature anomaly zone III can reach higher temperatures within a certain depth range. The overall analysis shows that the underground heat source in the study area is quite favorable. There are three rivers in the area, i.e., the Darbut River, the Kelasu River, and the Baiyang River, which are supplied by seasonal snowmelt from the Northern Zaire Mountains and the Halaalat Mountains. The interpretation results of this survey reveal that fractures F1 and F2 are associated with the location of the surface riverbed and may provide a channel for underground hot water recharge. In the northern mountainous region where the fracture penetrates the surface, the river recharge source infiltrates along the fracture channel to the favorable thermal reservoir. The infiltrated groundwater is heated by the rocks’ temperature during deep circulation until the rocks and water attain thermal equilibrium. Under the action of the head pressure difference, groundwater is endowed in the thermal reservoir with a good permeability, forming a hot-water storage set. In summary, it is speculated that geothermal resources exist in the high-temperature anomaly zone III in the study area.
7. Discussion and Conclusions
The application of a single method in remote sensing or MT in geothermal exploration is relatively mature, but relatively little research has been conducted on the simultaneous application of remote sensing and MT to geothermal exploration. However, with the implementation of new satellites and calculation algorithms for remote sensing and the improvement of MT inversion technology, the joint application of both methods to geothermal exploration has gradually become feasible. Shoujin et al. (2013) identified the location of the hidden fracture zone of the strip thermal reserve based on the remote-sensing interpretation date and integrated electrical exploration method, which effectively reduces the risk of geothermal exploration and is an important guideline for the geothermal exploration of the hidden fracture. Larasati et al. (2020) determined that West Sumatra has geothermal potential by using the correlation between remote sensing, geochemistry, and MT. Puspita et al. (2020) determined the lineaments based on geological data from remote sensing methods. Moreover, based on MT and gravity data, it showed the existence of a northwest–southeast trending geological formation that was inferred to be a geothermal fluid channel with suitability to the location of hot spring. It is clear from previous studies that remote sensing and geomagnetic can be used simultaneously for geothermal exploration and is a very advanced and effective method.
In this study, thermal-infrared-remote-sensing images from the Landsat8 satellite were used to retrieve the LST of the study area based on the Mono-window algorithm, and the pseudo-high temperature anomalies were eliminated by considering the influence of various factors on the LST, such as topography and land-use type. In addition, the geothermal anomaly area was initially identified as the key area for geothermal research. MT data were used to analyze the remote sensing LST anomaly area and to analyze and interpret the deep causes of the thermal anomalies and the geothermal storage conditions. In this study, through combined analysis and utilization of two information extraction methods, the following was discussed.
- (1)
Thermal infrared remote sensing technology can be used to identify the spatial distribution of surface thermal anomalies through LST retrieval. This technique has a great potential for the monitoring and study of geothermal anomalies, and it can be used as an effective technical means in geothermal pre-surveys.
- (2)
Two methods, thermal infrared remote sensing and MT methods, can be used to analyze geothermal temperature anomalies in terms of their horizontal spatial distribution on the surface and their deep vertical distribution in the subsurface, respectively. Based on the results of the two interpretations corroborating each other, we can infer whether geothermal anomalies may exist in the area and the reasons for their existence through a progressive in-depth investigation of the spatial distribution of vertical depth from the surface to the subsurface. This combined method avoids the one-sidedness of geothermal surveys conducted by using a single method, and it greatly improves the efficiency and reduces the investment risk of geothermal resource exploration. Thus, it is conducive to guiding the exploration of geothermal resources in unknown areas and the identification of prospective geothermal resource areas.
- (3)
The inversion results of the two methods are in good agreement. The thermal infrared remote sensing technology can be used to invert the distribution pattern of the LST anomalies, has a low cost and high efficiency, reduces the blindness of field exploration work, and has a better prospect for field survey work. In addition, by collecting data in the field, the MT method can detect longitudinal electrical anomalies in the subsurface and provide theoretical support for the LST anomalies.
Therefore, it is suggested that, in future geothermal investigations, thermal infrared remote sensing and MT method be used together to determine the favorable geothermal distribution, and then more information can be obtained in field investigations to explain and corroborate the causes and mechanisms of the identified temperature anomalies.
Author Contributions
Conceptualization, H.C., X.X., E.L., L.Z. and L.Y.; methodology, X.X. and E.L.; validation, all authors; formal analysis, H.C.; investigation, all authors; resources, X.X.; data curation, H.C.; writing—original draft preparation, H.C.; writing—review and editing, all authors; supervision, X.X.; project administration, X.X.; funding acquisition, X.X. All authors have read and agreed to the published version of the manuscript.
Funding
This research was funded by the National Natural Science Foundation of China (No. 41774082,41904077) and the State Key Program of National Natural Science of China (No. 42030805).
Data Availability Statement
All freely available data are mentioned in Section Experimental data. The MT data need to be kept confidential; this is why they cannot be freely distributed.
Conflicts of Interest
The authors declare no conflict of interest.
References
- Tulinius, H.; Ádám, L.; Halldórsdóttir, H.; Yu, G.; Strack, K.; Allegar, N.; He, L.; He, Z. Exploring for geothermal reservoirs using broadband 2-D MT and gravity in Hungary. SEG Tech. Program Expand. Abstr. 2008, 27, 1147–1151. [Google Scholar] [CrossRef][Green Version]
- Muñoz, G. Exploring for Geothermal Resources with Electromagnetic Methods. Surv. Geophys. 2013, 35, 101–122. [Google Scholar] [CrossRef]
- Amatyakul, P.; Rung-Arunwan, T.; Siripunvaraporn, W. A pilot magnetotelluric survey for geothermal exploration in Mae Chan region, northern Thailand. Geothermics 2015, 55, 31–38. [Google Scholar] [CrossRef]
- Gasperikova, E.; Rosenkjaer, G.K.; Arnason, K.; Newman, G.A.; Lindsey, N.J. Resistivity characterization of the Krafla and Hengill geothermal fields through 3D MT inverse modeling. Geothermics 2015, 57, 246–257. [Google Scholar] [CrossRef]
- Matsushima, N.; Utsugi, M.; Takakura, S.; Yamasaki, T.; Hata, M.; Hashimoto, T.; Uyeshima, M. Magmatic–hydrothermal system of Aso Volcano, Japan, inferred from electrical resistivity structures. Earth Planets Space 2020, 72, 57. [Google Scholar] [CrossRef]
- Huang, X.; Wang, Y. Investigating the effects of 3D urban morphology on the surface urban heat island effect in urban functional zones by using high-resolution remote sensing data: A case study of Wuhan, Central China. ISPRS J. Photogramm. Remote Sens. 2019, 152, 119–131. [Google Scholar] [CrossRef]
- Blackett, M. An Overview of Infrared Remote Sensing of Volcanic Activity. Imaging 2017, 3, 13. [Google Scholar] [CrossRef]
- Chan, H.; Chang, C. Exploring and monitoring geothermal and volcanic activity using Satellite Thermal Infrared data in TVG, Taiwan. Terr. Atmos. Ocean. Sci. 2018, 29, 387–404. [Google Scholar] [CrossRef]
- Ramsey, M.S.; Flynn, I.T.W. The Spatial and Spectral Resolution of ASTER Infrared Image Data: A Paradigm Shift in Volcanological Remote Sensing. Remote Sens. 2020, 12, 738. [Google Scholar] [CrossRef]
- Li, F.; Qian, A.; Sun, G.; Wang, Q. Estimation of Annual CO2 Emission from Coal Fires in Majiliang Mine, Datong, Northen China Using UAVs Thermal Infrared Remote Sensing Technology. In Proceedings of the 2018 Fifth International Workshop on Earth Observation and Remote Sensing Applications (EORSA), Xi’an, China, 18–20 June 2018; IEEE: Piscataway, NJ, USA, 2018; pp. 1–4. [Google Scholar] [CrossRef]
- Zhang, Y.; Meng, Q. A statistical analysis of TIR anomalies extracted by RSTs in relation to an earthquake in the Sichuan area using MODIS LST data. Nat. Hazards Earth Syst. Sci. 2019, 19, 535–549. [Google Scholar] [CrossRef]
- Wang, K.; Jiang, Q.-G.; Yu, D.-H.; Yang, Q.-L.; Wang, L.; Han, T.-C.; Xu, X.-Y. Detecting daytime and nighttime land surface temperature anomalies using thermal infrared remote sensing in Dandong geothermal prospect. Int. J. Appl. Earth Obs. Geoinf. 2019, 80, 196–205. [Google Scholar] [CrossRef]
- Seward, A.; Ashraf, S.; Reeves, R.; Bromley, C. Improved environmental monitoring of surface geothermal features through comparisons of thermal infrared, satellite remote sensing and terrestrial calorimetry. Geothermics 2018, 73, 60–73. [Google Scholar] [CrossRef]
- Nugroho, I.A.; Kurniawahidayati, B.; Mulyana, R.S.; Saepuloh, A. Preliminary determination of geothermal working area based on Thermal Infrared and Synthetic Aperture Radar (SAR) remote sensing. IOP Conf. Ser. Earth Environ. Sci. 2017, 103, 12017. [Google Scholar] [CrossRef]
- Guo, S.; Li, B.; Zhou, X.; He, C.; Li, W.; Zhang, S.; Li, Z. The application of the remote-sensing and electric methods to geothermal water exploration. Geophys. Geochem. Explor. 2013, 37, 230–232. [Google Scholar] [CrossRef]
- Van der Meer, F.; Hecker, C.; van Ruitenbeek, F.; van der Werff, H.; de Wijkerslooth, C.; Wechsler, C. Geologic remote sensing for geothermal exploration: A review. Int. J. Appl. Earth Obs. Geoinf. 2014, 33, 255–269. [Google Scholar] [CrossRef]
- Sekertekin, A.; Arslan, N. Monitoring thermal anomaly and radiative heat flux using thermal infrared satellite imagery—A case study at Tuzla geothermal region. Geothermics 2019, 78, 243–254. [Google Scholar] [CrossRef]
- Hanqiu, X.U. Retrieval of the reflectance and land surface temperature of the newly launched Landsat 8 satellite. Chin. J. Geophys. 2015, 58, 741–747. [Google Scholar] [CrossRef]
- Tang, M.; Zhong, D. The Yarlung Zangbo River/Big Fjord is evidence of the earth’s hot spot. Sci. Sin. 1998, 28, 463–468. [Google Scholar]
- Coolbaugh, M.; Kratt, C.; Fallacaro, A.; Calvin, W.; Taranik, J. Detection of geothermal anomalies using Advanced Spaceborne Thermal Emission and Reflection Radiometer (ASTER) thermal infrared images at Bradys Hot Springs, Nevada, USA. Remote Sens. Environ. 2007, 106, 350–359. [Google Scholar] [CrossRef]
- Qin, Z.; Karnieli, A.; Berliner, P. A mono-window algorithm for retrieving land surface temperature from Landsat TM data and its application to the Israel-Egypt border region. Int. J. Remote Sens. 2001, 22, 3719–3746. [Google Scholar] [CrossRef]
- Sobrino, J.A.; Jiménez-Muñoz, J.C.; Zarco-Tejada, P.J.; Sepulcre-Cantó, G.; de Miguel, E. Land surface temperature derived from airborne hyperspectral scanner thermal infrared data. Remote Sens. Environ. 2006, 102, 99–115. [Google Scholar] [CrossRef]
- Bendib, A.; Dridi, H.; Kalla, M.I. Contribution of Landsat 8 data for the estimation of land surface temperature in Batna city, Eastern Algeria. Geocarto Int. 2017, 32, 503–513. [Google Scholar] [CrossRef]
- Wang, Q.; Qin, Z.; Fei, W. Mono-window algorithm for retrieving land surface temperature based on Multi-source Remote Sensing Data. Geogr. Geo-Inf. Sci. 2012, 28, 24–26. [Google Scholar]
- Qi, P.; Zhao, C.; Feng, Z.; Wang, X. Influence of land use change on land surface temperature in arid desert region. Trans. Chin. Soc. Agric. Eng. 2010, 26, 310–315. [Google Scholar]
- Ding, F.; Xu, H. Comparison of Three Algorithms for Retrieving Land Surface Temperature from Landsat TM Thermal Infrared Band. J. Fujian Norm. Univ. 2008, 24, 91–96. [Google Scholar]
- Zhu, W.; Pan, J.; Song, G. Study on Retrieving Land Surface Temperature from ETM+ Data in Nanjing on Basis of Spatial Mode. Remote Sens. Inf. 2008, 4, 50–55. [Google Scholar]
- Peng, F.; Huang, S.; Shi, Q.; Cheng, Y.; Jing, Y. Application of satellite thermal infrared remote sensing technology in geothermal exploration in volcanic area—Taking Xilingol volcanic area in Inner Mongolia as an example. Chin. J. Geol. (Sci. Geol. Sin.) 2014, 49, 899–914. [Google Scholar]
- Mia, B.; Nishijima, J.; Fujimitsu, Y. Exploration and monitoring geothermal activity using Landsat ETM+images. J. Volcanol. Geotherm. Res. 2014, 275, 14–21. [Google Scholar] [CrossRef]
- Tikhonov, A.N. On determining electric characteristics of the deep layers of the Earth’s crust. Dokl. Akad. Nauk SSSR 1950, 73, 281–285. [Google Scholar]
- Cagniard, L. Basic theory of the magneto-telluric method of geophysical prospecting. Geophysics 1953, 18, 605–635. [Google Scholar] [CrossRef]
- Cantwell, T.; Madden, T.R. Preliminary report on crustal magnetotelluric measurements. J. Geophys. Res. 1960, 65, 4202–4205. [Google Scholar] [CrossRef]
- Vozoff, K. The magnetotelluric method in the exploration of sedimentary basins. Geophysics 1972, 37, 98–141. [Google Scholar] [CrossRef]
- Gamble, T.D.; Goubau, W.M.; Clarke, J. Magnetotellurics with a remote magnetic reference. Geophysics 1979, 44, 53–68. [Google Scholar] [CrossRef]
- Egbert, G.D. Robust multiple-station magnetotelluric data processing. Geophys. J. Int. 1997, 130, 475–496. [Google Scholar] [CrossRef]
- Swift, C.M. A Magnetotelluric Investigation of an Electrial Conductivity Anomary in the South-Western United State. Ph.D. Thesis, Massachusetts Institute of Technology, Cambridge, MA, USA, 1967. [Google Scholar]
- Bahr, K. Geological noise in magnetotelluric data: A classification of distortion types. Phys. Earth Planet. Inter. 1991, 66, 24–38. [Google Scholar] [CrossRef]
- Caldwell, T.G.; Bibby, H.M.; Brown, C. The magnetotelluric phase tensor. Geophys. J. Int. 2004, 158, 457–469. [Google Scholar] [CrossRef]
- Cai, J.; Chen, X. Refined techniques for data processing and two-dimensional inversion in magnetotelluric Ⅱ: Which data polarization mode should be used in 2D inversion. Chin. J. Geophys. 2010, 53, 2703–2714. [Google Scholar]
- Rodi, W.; Mackie, R.L. Nonlinear conjugate gradients algorithm for 2-D magnetotelluric inversion. Geophysics 2001, 66, 174–187. [Google Scholar] [CrossRef]
- Chen, X.; Ye, T.; Cai, J.; Wang, L. Refined techniques for data processing and two dimensional inversion in magnetotelluric Ⅶ: Electrical structure and seismogenic environment of Yingjiang- Longling seismic area. Chin. J. Geophys. 2019, 62, 191–207. [Google Scholar]
Figure 1.
Study area map. (left) Tectonic background map. (right) Regional remote sensing map.
Figure 1.
Study area map. (left) Tectonic background map. (right) Regional remote sensing map.
Figure 2.
Map of LST retrieval results in the Wuerhe area (circles I, II, III, IV, and V are the high LST anomaly areas).
Figure 2.
Map of LST retrieval results in the Wuerhe area (circles I, II, III, IV, and V are the high LST anomaly areas).
Figure 3.
Elevation map of the study area overlain with the high LST anomaly areas.
Figure 3.
Elevation map of the study area overlain with the high LST anomaly areas.
Figure 4.
Land-use map of the study area overlain with the high-temperature anomaly areas.
Figure 4.
Land-use map of the study area overlain with the high-temperature anomaly areas.
Figure 5.
(left) LST retrieval results in the study area; (right) MT profile location.
Figure 5.
(left) LST retrieval results in the study area; (right) MT profile location.
Figure 6.
Superimposed display of the observed apparent resistivity and impedance phase curves in the geographic coordinate system. The top part presents apparent resistivity, and the bottom part presents the impedance phase. (left) L1 line, (middle) L2 line, and (right) L3 line.
Figure 6.
Superimposed display of the observed apparent resistivity and impedance phase curves in the geographic coordinate system. The top part presents apparent resistivity, and the bottom part presents the impedance phase. (left) L1 line, (middle) L2 line, and (right) L3 line.
Figure 7.
Two-dimensional deviation of the L1–3 profile. Top is swift 2-D deviation, and bottom is Bahr 2-D deviation. (left) L1 profile, (middle) L2 profile, and (right) L3 profile.
Figure 7.
Two-dimensional deviation of the L1–3 profile. Top is swift 2-D deviation, and bottom is Bahr 2-D deviation. (left) L1 profile, (middle) L2 profile, and (right) L3 profile.
Figure 8.
Rose histogram of the results of the electrical principal axis analysis of the L1-3 profile. (left) L1 profile, (middle) L2 profile, and (right) L3 profile.
Figure 8.
Rose histogram of the results of the electrical principal axis analysis of the L1-3 profile. (left) L1 profile, (middle) L2 profile, and (right) L3 profile.
Figure 9.
L curve analysis, which is based on the data object function (ϕ;d) and the model object function (ϕ;m), was used to select the optimal regularization factor (tau). The numbers shown on the curve are the regularization factors used in the inversions. (a) L1 profile, (b) L2 profile, and (c) L3 profile.
Figure 10.
Pseudo cross-section of the observed data and inverse model response for profiles L1–3. (Left is apparent resistivity, right is impedance phase, top is observed data, and bottom is inverse model response. The blank region in the pseudo sections represents the deleted data.) (a) L1 profile, (b) L2 profile, and (c) L3 profile.
Figure 11.
Model of MT inversion of the electrical structure for profiles L1–3. (a) L1 profile, (b) L2 profile, and (c) L3 profile.
Figure 11.
Model of MT inversion of the electrical structure for profiles L1–3. (a) L1 profile, (b) L2 profile, and (c) L3 profile.
Figure 12.
Model of MT inversion of the electrical structure for profiles L1–3.
Figure 12.
Model of MT inversion of the electrical structure for profiles L1–3.
Table 1.
Lithological and resistivity characteristic calibration results.
Table 1.
Lithological and resistivity characteristic calibration results.
| Age | Lithological Characteristics | Logging Resistivity Value (Ω·m) |
|---|
| Cretaceous, Jurassic | Interbedded sandstone and mudstone | 20–100 |
| Carboniferous | Tuff | 30–1000 |
| Metamorphic rock | 20–200 |
| Pyroclastic rock | 60–1000 |
| Andesite | 20–1000 |
| Plagioclasite | Over 1000 |
| Publisher’s Note: MDPI stays neutral with regard to jurisdictional claims in published maps and institutional affiliations. |
© 2021 by the authors. Licensee MDPI, Basel, Switzerland. This article is an open access article distributed under the terms and conditions of the Creative Commons Attribution (CC BY) license (https://creativecommons.org/licenses/by/4.0/).
