Article

Retrieval of Leaf Area Index by Linking the PROSAIL and Ross-Li BRDF Models Using MODIS BRDF Data

1
State Key Laboratory of Remote Sensing Science, Beijing Normal University, Beijing 100875, China
2
Beijing Engineering Research Center for Global Land Remote Sensing Products, Institute of Remote Sensing Science and Engineering, Faculty of Geographical Science, Beijing Normal University, Beijing 100875, China
3
College of Water Sciences, Beijing Normal University, Beijing 100875, China
4
School of Geographic and Environmental Sciences, Tianjin Normal University, Tianjin 300387, China
5
State Key Laboratory of Remote Sensing Science, Aerospace Information Research Institute of Chinese Academy of Sciences, Beijing 100101, China
*
Author to whom correspondence should be addressed.
Remote Sens. 2021, 13(23), 4911; https://doi.org/10.3390/rs13234911
Submission received: 23 August 2021 / Revised: 9 November 2021 / Accepted: 30 November 2021 / Published: 3 December 2021
(This article belongs to the Special Issue Multi-Angular Remote Sensing)

Abstract

:
Canopy structure parameters (e.g., leaf area index (LAI)) are key variables of most climate and ecology models. Currently, satellite-observed reflectances at a few viewing angles are often directly used for vegetation structure parameter retrieval; therefore, the information content of multi-angular observations that are sensitive to canopy structure in theory cannot be sufficiently considered. In this study, we proposed a novel method to retrieve LAI based on modelled multi-angular reflectances at sufficient sun-viewing geometries, by linking the PROSAIL model with a kernel-driven Ross-Li bi-directional reflectance function (BRDF) model using the MODIS BRDF parameter product. First, BRDF sensitivity to the PROSAIL input parameters was investigated to reduce the insensitive parameters. Then, MODIS BRDF parameters were used to model sufficient multi-angular reflectances. By comparing these reference MODIS reflectances with simulated PROSAIL reflectances within the range of the sensitive input parameters in the same geometries, the optimal vegetation parameters were determined by searching the minimum discrepancies between them. In addition, a significantly linear relationship between the average leaf angle (ALA) and the coefficient of the volumetric scattering kernel of the Ross-Li model in the near-infrared band was built, which can narrow the search scope of the ALA and accelerate the retrieval. In the validation, the proposed method attains a higher consistency (root mean square error (RMSE) = 1.13, bias = −0.19, and relative RMSE (RRMSE) = 36.8%) with field-measured LAIs and 30-m LAI maps for crops than that obtained with the MODIS LAI product. The results indicate the vegetation inversion potential of sufficient multi-angular data and the ALA relationship, and this method presents promise for large-scale LAI estimation.

1. Introduction

Vegetation monitoring is critical for the development of adaptation strategies to address the challenges caused by climate change and human activities in ecosystems, such as global warming and precision farming [1]. In particular, satellite remote sensing has provided an effective way to perform quick global investigations [2], where the vegetation structure and biochemical parameters commonly considered in monitoring are derived from physical canopy reflectance models. Among the vegetation parameters, the leaf area index (LAI) has attracted the interest of many researchers due to its easy measurement method, and the LAI has remained a key biophysical variable required in most global models of climate, ecosystem productivity, biogeochemistry, hydrology, and ecology [3].
Generally, satellite-observed reflectances at limited sun-viewing geometries are usually directly employed for LAI retrieval in large regions. Observations retrieved from VEGETATION/SPOT, PROBA-V, Moderate Resolution Imaging Spectroradiometer (MODIS)/Terra + Aqua, and Visible Infrared Imaging Radiometer Suite (VIIRS)/Suomi National Polar-orbiting Partnership (SNPP) have been applied to generate LAI products, including GEOV2 [4], GLASS [5], GLOMAP [6], MODIS [7,8], PROBA-V [9], and VIIRS [10] products. Reflectances in the red and near-infrared (NIR) bands are commonly adopted due to their sensitivity to vegetation parameters, and observations in the shortwave infrared and blue bands are applied in GEOV2 and PROBA-V, respectively. Neural network regression (e.g., GEOV2, GLASS, and PROBA-V) and look-up tables (e.g., MODIS and VIIRS LAI products) between the directional reflectance and vegetation parameters are usually considered in the estimation. In addition, the LAI has been retrieved from physical models such as the PROSAIL model and Two-Layer Canopy Reflectance Model (ACRM) based on reflectance observations with novel algorithms [11,12]. To perform a quick estimation, relationships between the land cover-specific LAI and vegetation indices have been determined to derive the LAI, such as the GLOMAP LAI product [6], as well as the backup algorithm of the MODIS LAI product [8].
However, the vegetation parameter retrieval accuracy can be affected by satellite limitations in capturing anisotropic reflectances in the sun-viewing hemisphere and random noise in satellite observations, which are highly sensitive to the vegetation structure [13]. Well-designed ground experiments have demonstrated that sufficient bi-directional reflectance distribution function (BRDF) data at wide geometries, especially including hotspots, can significantly improve the estimation accuracy of the LAI and chlorophyll a and b contents (Cab) than observations at a few angles [14]. Nevertheless, satellite observations can usually obtain data at limited viewing angles [15], which cannot meet the high demand for sufficient BRDF information in vegetation parameter retrieval. In addition, previous studies have indicated that random noise in observed multi-angular reflectances caused by cloud cover and other reasons can affect both BRDF and albedo retrieval [16,17].
To address these limitations in satellite observations, the semi-empirical, linear kernel-driven Ross-Li model [13,18] has been widely adopted to reconstruct BRDF data in the sun-viewing hemisphere from limited observations [19], and these customized multi-angular data can be further utilized in the retrieval of vegetation parameters. Reconstructed BRDF data theoretically consider an overall reasonable variance in BRDF, and these data can thus help smooth observation noise [13,18]. Based on the Ross-Li model, MODIS [20,21] and POLDER [22,23] BRDF parameter products have been generated from limited satellite observations, which have been widely applied for parameter estimation. For example, the canopy albedo can be calculated as the integral of the bi-directional reflectance in the sun-viewing hemisphere [20,21,24,25,26,27,28], and vegetation biophysical/structure parameters, including the clumping index (CI) [29,30,31,32,33,34], canopy height [35,36,37], and fractional vegetation cover (FVC) [38], have been retrieved from customized reflectance data at sensitive sun-viewing geometries. In particular, a hotspot-revised version of the Ross-Li model [39,40] was employed to retrieve the CI highly sensitive to both hotspot and darkspot reflectances in a recent study [29], which indicates an excellent ability in hotspot reconstruction. In addition, reflectances directionally normalized to the illumination and an observation zenith angle of 0 [13] were used to retrieve the EUMESAT Polar System (EPS, V1.0) LAI product [41]. These successful applications support the good performance of the reconstructed BRDF information in vegetation inversion.
Considering the good performance of the reconstructed sufficient BRDF information in retrieving the vegetation parameters, this study aims to further apply them to improve the estimation accuracy of the essential vegetation structure parameter LAI. Meanwhile, the MODIS LAI product were used for cross comparisons, which are generated based on satellite observations at a few angles [7,8]. To utilize sufficient anisotropy reflectances, multiangle data with a good sampling distribution at 397 sun-viewing angles were modelled by the well-known MODIS BRDF parameter product and a hotspot-revised Ross-Li model [39,40]. Despite of the different limitations behind the model mechanism, a good BRDF agreement has been represented in linking the Ross-Li model and the PROSAIL canopy BRDF model [42], which includes several essential vegetation parameters [43,44]. Therefore, the robust PROSAIL model was selected for LAI retrieval from these modelled MODIS multi-angular data. First, the sensitivities of the BRDF variables to vegetation parameters of the PROSAIL model were investigated to reduce the free variables in the physical model inversion. Then, the estimated LAIs were validated based on field measurements and high-resolution LAI maps, and the reasons for the estimation error were analysed. Finally, some explanations, limitations, and future expectations were discussed.

2. Data

2.1. Canopy BRDF Simulations with the PROSAIL Model

The robust canopy radiative transfer model, i.e., the PROSAIL model, was adopted for vegetation parameter inversion, considering its simple input parameters and good BRDF consistency with the Ross-Li model [42]. The latest 4SAIL canopy BRDF model considering the hotspot effect and the PROSPECT-5 model, which describes the leaf optical reflectance and transmittance, are referenced in this study (http://teledetection.ipgp.jussieu.fr/prosail/, accessed on 10 August 2021) [43,44,45]. This 1-D model adopts a simplified assumption that considers horizontal homogeneity, where N layers of leaves are contained in the model scene. The input model parameters are listed in Table 1, covering the main structure and biology information of the vegetation. First, the leaf reflectance ρl and transmittance τl can be calculated from leaf parameters, as given in Equation (1), which are then input into the SAIL model to calculate the canopy reflectance ρc, as expressed in Equation (2). Following the general process, the PROSAIL model can simulate canopy reflectance spectra in the optical domain from 400–2500 nm at a 1-nm resolution in addition to BRFs in an arbitrary sun-viewing geometry, which have been widely applied in vegetation inversion [11,43,44,45,46,47,48,49,50].
ρ l ( λ )   &   τ l ( λ ) = P R O S P E C T ( N s , C a b , C a r , C b r o w n , C w , C m )
ρ c ( λ ) = 4 S A I L ( ρ l ( λ ) , τ l ( λ ) , L A I , A L A , H s p o t , P s o i l , S K Y L , S Z A , V Z A , φ )
To support vegetation inversion, a comprehensive simulation dataset containing 20,000 vegetation parameter combinations was generated with the Saltelli periodic function [51] via uniform sampling (Figure 1a) of seven leaf and canopy parameters. The parameters varied within the ranges listed in Table 1, which references the experimental designs of previous studies [39,52,53] except for Car, Cbrown, Hspot, and SKYL. Considering that most leaves do not contain brown pigment [52] and that the intrinsic BRDF is not necessarily related to the diffuse irradiance component [54], these two parameters were set to zero. In addition, the insensitive parameters of Car and Hspot have typically been defined as constants in vegetation inversion [11,14,52]. Compared to a previous study [42], Car and Hspot were defined as constants, and more reasonable ranges were considered for Cab, LAI, and average leaf angle (ALA) based on the application studies mentioned above.
Subsequently, we simulated the corresponding directional reflectance values with the PROSAIL model by inputting the 20,000 sets of vegetation parameters. Most LAI products are retrieved from data in the red and NIR bands due to their high sensitivity [55]. Therefore, PROSAIL simulations were performed at the central wavelength in these two MODIS bands (645 and 858 nm). Moreover, 397 sun-viewing angles were selected to simulate the BRFs, as indicated in Table 1 and Figure 1b, which can suitably reflect the general BRDF variance [42,56]. The PROSAIL simulation dataset of the BRFs was applied in this study, including for the sensitivity analysis and LAI estimation.

2.2. 500-m MODIS BRDF Parameter Product

The 500-m MODIS global BRDF parameter products provide the weight coefficients of three typical scattering components in the Ross-Li model, including isotropic scattering, volumetric scattering, and geometric-optical scattering [20,21]. The RossThick-LiSparseReciprocal (RTLSR) model was chosen as the operational algorithm to generate the MODIS BRDF parameter product [13,18], and its general expression is given in Equation (3). Numerous validation studies have demonstrated the good accuracy of the Ross-Li model [57,58,59,60]. In Equation (3), R denotes the surface directional reflectance as a function of three angles (solar zenith angle (SZA) (θs), viewing zenith angle (VZA) (θv), and relative azimuth angle (RAA) (φ)) and the waveband, which comprises three scattering kernel types: isotropic scattering kernel (1.0), volumetric scattering kernel (Kvol), and geometric-optical scattering kernel (Kgeo). By inputting multi-angular reflectance data into the model, the three weight coefficients of fiso, fvol, and fgeo can be determined based on least-squares regression. Notably, the three coefficients were restricted to be no less than 0.0 to represent a positive contribution of different kinds of scattering. Subsequently, the directional reflectance at arbitrary orientations can be simulated.
R ( θ s , θ v , φ , λ ) = f i s o ( λ ) + f v o l ( λ ) K v o l ( θ s , θ v , φ ) + f g e o ( λ ) K g e o ( θ s , θ v , φ )
The latest Collection V006 daily BRDF parameter product (i.e., MCD43A1) and quality data (i.e., MCD43A2) [20] (https://urs.earthdata.nasa.gov/, accessed on 10 August 2021) were implemented in this study, which are concurrent with the field LAI measurements and LAI maps introduced in Section 2.3. MCD43A1 data were retrieved from the RTLSR model by inputting 16-day aggregation values of the multi-angular reflectance of the MODIS sensors onboard the Terra (overpass occurs at 10:30 am) and Aqua (overpass occurs at 1:30 pm) satellites. BRDF parameters were retrieved with the main algorithm (full inversion, quality flag = 0/1) and backup algorithm (magnitude inversion, quality flag = 2/3) in the red and NIR bands, respectively. High-quality BRDF data were retrieved via the Ross-Li model with good angular sampling and small fitting root mean square errors (RMSEs) in the inversion results. When a high-quality full inversion could not be accomplished due to poor angular sampling or insufficient input observations (i.e., obs. num. < 7), a priori knowledge method of the backup algorithm was employed (also called a magnitude inversion), which performs quite well in many situations [20,21,59,61,62]. The backup algorithm relies on an a priori archetypal BRDF shape with each pixel on the globe, and then the satellite-observed directional reflectances are used to adjust these archetypal shapes by a multiplicative factor to obtain suitable BRDF variances at each pixel [20,21].
These MODIS BRDF parameters were applied to model BRFs with angle sampling, as shown in Figure 1b, using the hotspot-revised Ross-Li model [39,40], and these modelled MODIS BRFs then functioned as reference data to search for the best vegetation estimation among the 20,000 PROSAIL vegetation parameter datasets, as introduced in Section 2.1.

2.3. LAI Measurements at the 500-m Plot Level and with 30-m LAI Maps

Field-measured LAI values at the 500-m plot level and 30-m LAI maps were adopted for method validation, which encompassed two sites (Honghe and Hailun) in Heilongjiang Province, northeastern China.
There were 180 sets in total of field-measured LAI data, which were collected by Fang et al. in 2012, 2013, and 2016 (https://doi.pangaea.de/10.1594/PANGAEA.900090, accessed on 10 August 2021) [55,63,64]. Both sites cover a homogeneous area of approximately 30 km2, and 5 plots were selected to perform measurements at each site. The first site is located at Honghe Farm (47°39′ N, 133°31′ E), planted with paddy rice, and each plot covers an area of 400 m × 600 m. To reduce the measurement disturbance, weekly measurements on four elementary sampling units (ESU) in each plot were averaged to represent the plot LAI value, from June 11 (day of year (DOY 163)) to September 17 (DOY 261) in 2012 and from June 22 (DOY 173) to August 27 (DOY 239) in 2013. The second site is located in a farmland near Hailun city (47°24′ N~47°26′ N, 126°47′ E~126°51′ E), planted with maize, soybean, and sorghum, and each plot covers an area of 100 m × 500 m. Similarly, there were three ESUs in each plot to obtain the plot LAI value from June 20 (DOY 172) to September 22 (DOY 266) in 2016. Finally, 110 sets of LAI measurements in Honghe and 70 sets in Hailun at the 500-m plot level were obtained.
Field measurements were carried out under twilight and overcast conditions to avoid direct sun flecks, from shortly after the crop greening stage to the harvest readiness stage. LAI-2200 measurements were used in this study, which agreed well with the results obtained via the destructive leaf sampling method in most of the growing seasons from DOYs 160 to 230. These LAI measurements contained the main crop types, and they have been considered in the validation of several essential satellite LAI products, such as the MODIS LAI product generated by the main algorithm [55]. These field-measured LAI values were used to validate the retrieval accuracy of the new method proposed in this study, as described in Section 3.3, Section 4.2 and Section 4.3.
In addition, LAI maps concurrent with these LAI measurements with a spatial resolution of 30 m were applied for method validation, which were provided by a previous study [55]. High-resolution reference LAI maps were derived from HJ-1, Landsat 7, and Sentinel-2A images, which agree well with the field-measured LAI values. Moreover, these maps were adopted in the validation of the moderate-resolution LAI products mentioned above, where average values of 3 × 3 pixels were considered to cross validate the moderate-resolution LAI products and concurrent reference LAI maps. In this study, 284 sets of aggregated LAI values at 1.5 km derived from 30-m LAI maps were used to cross validate our proposed novel method, as introduced in Section 4.4, and the data numbers were 108 and 176 in Honghe and Hailun, respectively.

3. Methods

Considering the satellite limitations when capturing BRDF data in the viewing hemisphere as well as their underlying observation noise, the semi-empirical Ross-Li BRDF model has been widely adopted to model BRDF data at arbitrary sun-viewing geometries of good quality from satellite-observed reflectances at a few viewing angles. In this study, a novel method for the simultaneous retrieval of the LAI and other vegetation parameters based on sufficient multi-angular reflectance data using the Ross-Li-derived MODIS BRDF parameter product was developed, in conjunction with the hotspot-revised Ross-Li model and physical PROSAIL BRDF model, considering their good BRDF consistency [42]. The new method mainly includes two parts: sensitivity analysis and vegetation parameter retrieval, and the flowchart is shown as Figure 2.
First, BRDF sensitivity to the PROSAIL input parameters was investigated to reduce the number of insensitive parameters in the vegetation inversion. The analysis was performed based on PROSAIL-simulated multi-angular reflectance data at 397 angles in the red and NIR bands, as described in Section 2.1, as well as the corresponding BRDF variables retrieved with the Ross-Li model, including the three kernel coefficients and anisotropy flat index (AFX) [65]. To maintain consistency with the MODIS BRDF parameter product used for LAI retrieval in this study, the RTLSR model was employed. Subsequently, the extended Fourier amplitude sensitivity test (EFAST) method was implemented to explore the sensitivity of the BRDF variance to the vegetation biophysical/structure parameters, thereby further investigating the empirical relationship between these highly sensitive parameters. Encouragingly, a significantly linear relation between the ALA and fvol in the NIR band was established.
Via the application of the obtained sensitivity analysis results, simultaneous retrieval was accomplished to estimate the sensitive vegetation parameters, including the LAI, from the MODIS BRDF parameter product by linking the PROSAIL and Ross-Li BRDF models. BRFs with the same 397 angles of the PROSAIL simulations, as shown in Figure 1b, were modelled using the MODIS BRDF parameters and Ross-Li model, and the latest hotspot-corrected version of the Ross-Li model was employed here to better simulate the hotspot reflectance [39,40]. Then, these MODIS multi-angular reflectance values functioned as reference data to retrieve the optimal vegetation parameters by simultaneously searching the minimum discrepancies and the PROSAIL-simulated reflectances from the PROSAIL vegetation parameter database. Both wide and local searches with the empirically calculated ALA were designed. Finally, the reference LAI data in Section 2.3 were utilized for method validation.

3.1. Sensitivity Analysis of the BRDF to Vegetation Parameters

Previous studies have indicated that compensation occurs between canopy variables such as the LAI, leaf inclination, Cab, and leaf water content [45,66,67], and these mutually dependent parameters can therefore be hard to accurately determine during retrieval. Therefore, the sensitivity of the BRDF variance to vegetation parameters was investigated to reduce the number of insensitive and dependent parameters. The vegetation parameters refer to the simulated 20,000 PROSAIL parameter database, and the BRDF variables were retrieved via the Ross-Li model corresponding to the simulated PROSAIL BRFs. Considering that the MODIS BRDF parameter product used for LAI retrieval was generated from the RTLSR model, we further applied this model to calculate the BRDF variables in the sensitivity analysis.
In detail, the directional reflectance values obtained from the PROSAIL model in Section 2.1 were then input into the RTLSR model to invert the three kernel coefficients (fiso, fvol, and fgeo) and BRDF index (AFX). The AFX was calculated as the ratio of the white sky albedo (WSA) to fiso [65], which is sensitive to the scattering type. An AFX higher than 1.0 indicates that volumetric scattering is prominent, while an AFX lower than 1.0 indicates dominant geometric-optical scattering. Based on the 20,000 sets of BRDF variables and concurrent vegetation parameters, their sensitivity was investigated via the EFAST statistic method and linear regression analysis.
The EFAST method was first used for the sensitivity analysis [68], which provides the global sensitivity to evaluate the contribution of the input parameters to the output by considering the interactions among the input data. The calculation process is given as follows: first, the total variance in the model output attributed to the input parameters was divided into two parts: the variance resulting from the specific Xi (Di) value and the variance resulting from the interactions between the input parameters under multiple combinations. Then, the local sensitivity Si and mutual sensitivity Si…k could be obtained by dividing the total variance D by the corresponding individual and interaction variances, respectively. Finally, the global sensitivity SiT could be obtained as the accumulation of the local sensitivity Si and all the mutual sensitivity values related to Xi. In total, the global sensitivity of the four BRDF variables (fiso, fvol, fgeo, and AFX) to seven vegetation parameters (Ns, Cab, Cw, Cm, LAI, ALA, and Psoil) was calculated to perform a qualitative analysis.
D = i = 1 n D i + i = 1 n j = 1 , j i n D i j + + D 1 , 2 , , n
S i = D i / D
S i k = D i j + D i j + 1 + + D i k D ( j , k i )
S i T = S i + j = 1 , j i n S i j + + S 1 , 2 , , n
To further explore the quantitative relations between the BRDF variables and vegetation parameters, the highly sensitive parameters determined according to the EFAST method were used for linear regression. Notably, only parameters that met the above requirement were considered in the sensitivity analysis, where the fitting RMSE values between the PROSAIL BRFs and BRFs inverted from the RTLSR model were smaller than 0.02 and 0.05 in the red and NIR bands, respectively [42]. To reduce the influence of data uncertainty, the 10-fold cross-validation method was utilized in the regression, and 90% of the data was selected for regression, and the remaining 10% was reserved for validation. In total, 10 independent regressions were performed, and those linear relationships with the minimum regression error were recorded as the final result. Encouragingly, a significantly linear relationship between the ALA and fvol in the NIR band was established, which was used to develop the LAI retrieval method.

3.2. LAI Estimation from MODIS BRDF Data by Linking the PROSAIL and Ross-Li Models

Based on the sensitivity analysis of the BRDF sensitivity to vegetation parameters in Section 3.1, a general vegetation inversion method was proposed in this study to retrieve these sensitive vegetation parameters. The MODIS BRDF parameter product was applied for multi-angular reflectance modelling at sufficient sun-viewing geometries with the Ross-Li model, which was then used to retrieve the vegetation parameters from the robust PROSAIL physical BRDF model.
First, the modelled BRFs from the MODIS BRDF parameters were employed as reference data in the vegetation parameter inversion. BRFs considering 397 angles, as shown in Figure 1b, were modelled with the Ross-Li model based on the daily MODIS BRDF parameters introduced in Section 2.2, and a hotspot-revised version of the Ross-Li model, namely, RTLSR_C, was used here [39,40]. The revised model achieves a higher hotspot capability than that of the RTLSR model by applying the corrected exponential hotspot function developed by Chen and Cihlar [69] to the volumetric and geometric-optical scattering kernels. The best hotspot parameters of the height (C1) and width (C2) of the RTLSR_C model in several typical bands were given based on a wide search of sufficient hotspot data, as listed in Table 2 [39], and the hotspot parameters at 645 and 858 nm for MODIS (C1 = 0.5, C2 = 3.4° at 645 nm; C1 = 0.5, C2 = 3.0° at 858 nm) were used to model the MODIS BRFs based on the obtained MODIS BRDF parameters.
Then, two search strategies, including wide and local search strategies based on the fvol–ALA relationship, were developed to retrieve the optimal vegetation parameters from the 20,000 vegetation parameter database introduced in Section 2.1. The cost function is expressed below and calculates the discrepancies between the simulated PROSAIL BRFs and reference MODIS BRFs, where ρireference and ρiPROSAIL denote the simulated MODIS BRFs and PROSAIL BRFs, respectively, for a specific group of PROSAIL input parameters among the 20,000 vegetation parameter databases. Considering the BRFs in both the red and NIR bands, the value of N is 397 times two (i.e., 794). Finally, the first 50 records with the minimum cost values were selected, and the corresponding LAI values were averaged as the retrieved LAI result.
Cost = 1 N i = 1 N ( ρ i r e f e r e n c e ρ i P R O S A I L ρ i r e f e r e n c e ) 2
In the wide search strategy, the optimal estimation is determined by traversing all 20,000 vegetation parameter datasets. In the local search strategy with the ALA, the linear relationship between the ALA and fvol in the NIR band mentioned in Section 3.1 was applied, and the empirical ALA could thus be obtained from the MODIS fvol value in the NIR band. Consequently, this narrowed the search scope within the theoretical error range of the empirical ALA rather than the whole reasonable range, which could greatly improve the search speed.

3.3. LAI Validation and Error Analysis

The 180 LAI measurements at the 500-m plot level and the 30-m LAI maps covering the main crop types were utilized for method validation, as introduced in Section 2.3. The evaluation indicators include the RMSE, relative RMSE (RRMSE), bias, and coefficient of determination (R2) between the reference LAIs and retrieved data, where the RMSE and RRMSE are expressed below. LAIiobs and LAIiestimate denote the reference LAI and the estimated LAI with the PROSAIL model, respectively.
R M S E = 1 N i = 1 N ( L A I i o b s L A I i e s t i m a t e ) 2
R R M S E = R M S E 1 N i = 1 N L A I i o b s
Then, we investigated the error underlying the proposed method to further improve the vegetation estimation accuracy. By comparing the LAI estimation accuracies based on the MODIS BRDF data between the main and backup algorithms, we investigated the influence of the MODIS BRDF quality on the LAI estimation accuracy. As expected, BRDF data from the main algorithm have better LAI estimations than those from the backup algorithm. Therefore, the BRDF data retrieved with the backup algorithm were alternated by those retrieved with the main algorithm at the nearest time to reduce the impact of the BRDF quality on the proposed method. In addition, the LAI estimation accuracy of the new method proposed in this study was cross compared to published accuracy results for MODIS LAI products generated from satellite-observed reflectances at a few viewing angles [55]. Considering the effects of the point spread function and geometric distortion of satellite data, 30-m LAI maps were further used for cross validation in the upscaling process to obtain a 1.5 km × 1.5 km area [55].

4. Results and Analysis

4.1. Sensitivity of the BRDF to Vegetation Parameters

4.1.1. Analysis Based on EFAST

Based on the 20,000 sets of PROSAIL multi-angular canopy reflectance simulations and BRDF variables retrieved from the Ross-Li RTLSR model, the global sensitivity of the BRDF to the vegetation parameters was calculated, as shown in Figure 3. The sensitivity of the nadir reflectance to the vegetation parameters has been investigated in previous studies [52]. This study first analysed the results regarding BRDF indicators. Figure 3 shows that most BRDF variables are highly sensitive to many vegetation parameters in the red band (Ns, Cab, LAI, ALA and Psoil). In the NIR band, Ns, LAI, and ALA appear to be the most sensitive parameters, and fvol reveals the most significant sensitivity to the ALA among all the statistics. It is foreseeable for the high sensitivity of canopy BRDF to the two essential canopy structure parameters of LAI and ALA, which have shown similar results associated to nadir reflectance [45,52]. In addition, the sensitivity to Cab may be caused by high chlorophyll absorption in the red band, and the non-negligible BRDF change in the background soil associated with Psoil also makes important contributions to the overall canopy BRDF [70]. The leaf structure parameter Ns represents the number of compact layers specifying the average number of air/cell wall interfaces within the mesophyll and the leaf biochemical content, which changes with vegetation species and phenology that are sensitive to canopy BRDF [42,45]. Ns for the monocotyledons changes from 1.0 to 1.5, while values for the dicotyledons range from 1.5 to 2.5. Meanwhile, the senescent leaves always show an Ns larger than 2.5.
These results generally comply with the sensitivity of the canopy nadir reflectance to PROSAIL variables [45,52], although there are few connections between canopy reflectance anisotropy and some vegetation parameters, especially for the chlorophyll and water content in the NIR band. Nevertheless, all seven vegetation parameters have showed evident sensitivities in the red or NIR bands, which can be considered to be an overall sensitivity to the seven vegetation parameters. In addition, observations in the two bands have been widely utilized together to generate a series of LAI products [55], and thus all seven PROSAIL variables were applied in the vegetation inversion algorithm owing to their sensitivity.

4.1.2. Modelling and Evaluation of Linear Relationships

The sensitive parameters determined with the EFAST method were further utilized for modelling and evaluation of their linear relations, where only the data meeting the fit-RMSE requirements of the Ross-Li model in the red and NIR bands were selected. Among the 20,000 sets of PROSAIL canopy BRFs and corresponding Ross-Li BRDF variables, there are 15,707 sets of data where the fit-RMSE is less than 0.02 and 0.05 in the red and NIR bands, respectively. When performing 10-fold cross regression and validation, all 15,707 datasets were divided into 10 parts through equal-interval sampling.
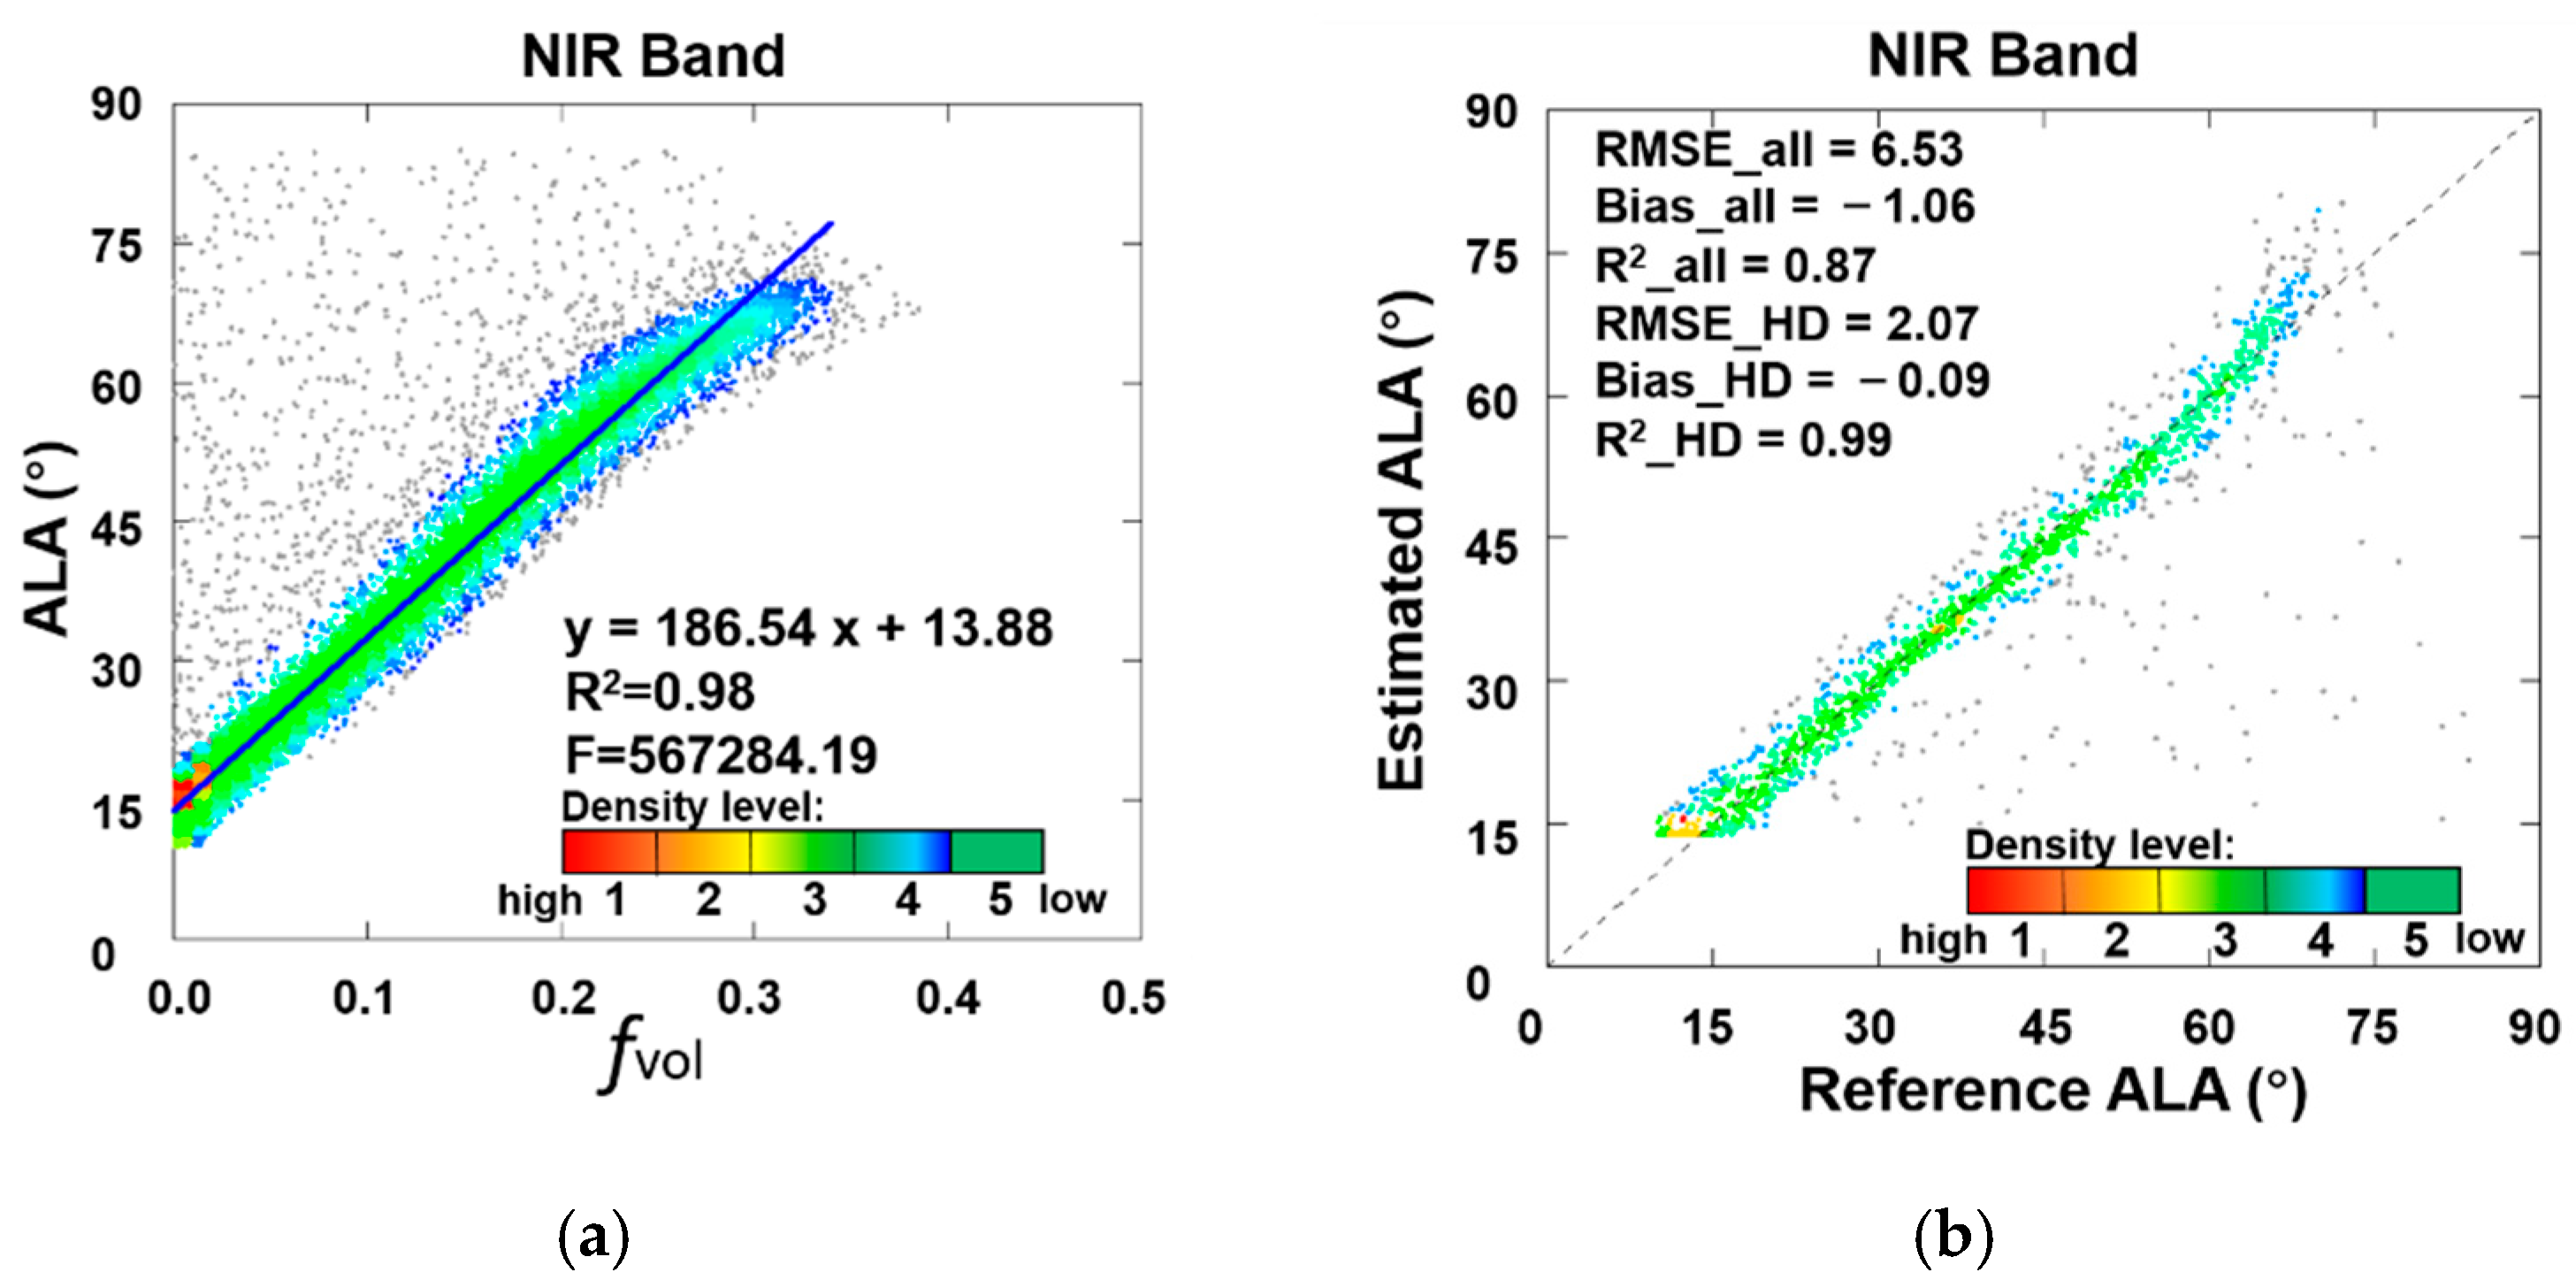
Encouragingly, a significantly linear relationship between the ALA and fvol in the NIR band was obtained. The regression coefficients and evaluation accuracies considering the 10 parts are listed in Table 3. The table indicates that the fit coefficients are extremely similar for all 10 data groups, exhibiting a highly significant F at the significance level of 0.01 in the F test. The equations of the F test are shown in (11)–(13), where F is calculated as the ratio of the averaged regression sum of squares (SSR) to the averaged error sum of squares (SSE). The variables yi, y ¯ , and ŷi refer to the values of the ith ALA, the averaged ALAs, and the predicted ALAs by the linear regression relation, respectively. Considering that only a small amount of data is sparsely distributed in the ALA evaluation, the accuracy indicators were calculated according to all the evaluation data as well as the high-density data, except the sparse evaluation data. By considering the errors in both regression and evaluation, the fourth regression showed a relatively smaller error for both all data and high-density data. Therefore, the results from the fourth data group were recorded as the final regression results.
S S R = i = 1 n ( y ^ i y ¯ ) 2
S S E = i = 1 n ( y i y ^ i ) 2
F = S S R / 1 S S E / ( n 2 )
The final optimal linear relation is shown in Equation (14), and the fitting results are shown in the density scatter plots (Figure 4). The scatter plots are sliced into five equal-density levels from 1 (highest) to 5 (lowest), by classifying the data number with intervals of 1.0° and 0.01 for ALA and fvol, respectively. Considering the effective range of the ALA from 10° to 85°, as explained in Table 1, only fvol in the NIR band smaller than 0.3813 could be used to retrieve the empirical ALA based on this linear relationship. Figure 4 clearly shows that only a small amount of data is sparsely distributed in both the regression and ALA evaluation, and most high-density data are clustered. The high R2 value of 0.98 and significance F value, as shown in Figure 4a, indicate that the linear relationship achieves a high quality. Similarly, independent evaluation also reveals a high R2 value between the reference ALA and estimated ALA based on 10% of the 15,707 datasets, which is 0.87 for the total data and 0.99 for the high-density data. By removing a small amount of sparse data, a generally good accuracy was attained for empirical ALA retrieval based on Equation (14) (RMSE = 2.07°, bias = −0.09°, R2 = 0.99). The significant linear relationship may be attributed to the intrinsic radiative transfer hypotheses of the PROSAIL model, where multiple scattering (i.e., volumetric scattering) can easily arise in horizontal homogeneous scenes [45]. In addition, the relationship in the NIR band complies with a previous study, which indicates that volumetric scattering is prominent in the NIR band for the PROSAIL model [42].
A L A = 186.54 × f v o l N I R + 13.88 ( A L A [ 10 , 85 ] , f v o l N I R [ 0 , 0.3813 ] )

4.2. Validation of the LAI Estimations Based on Field Measurements

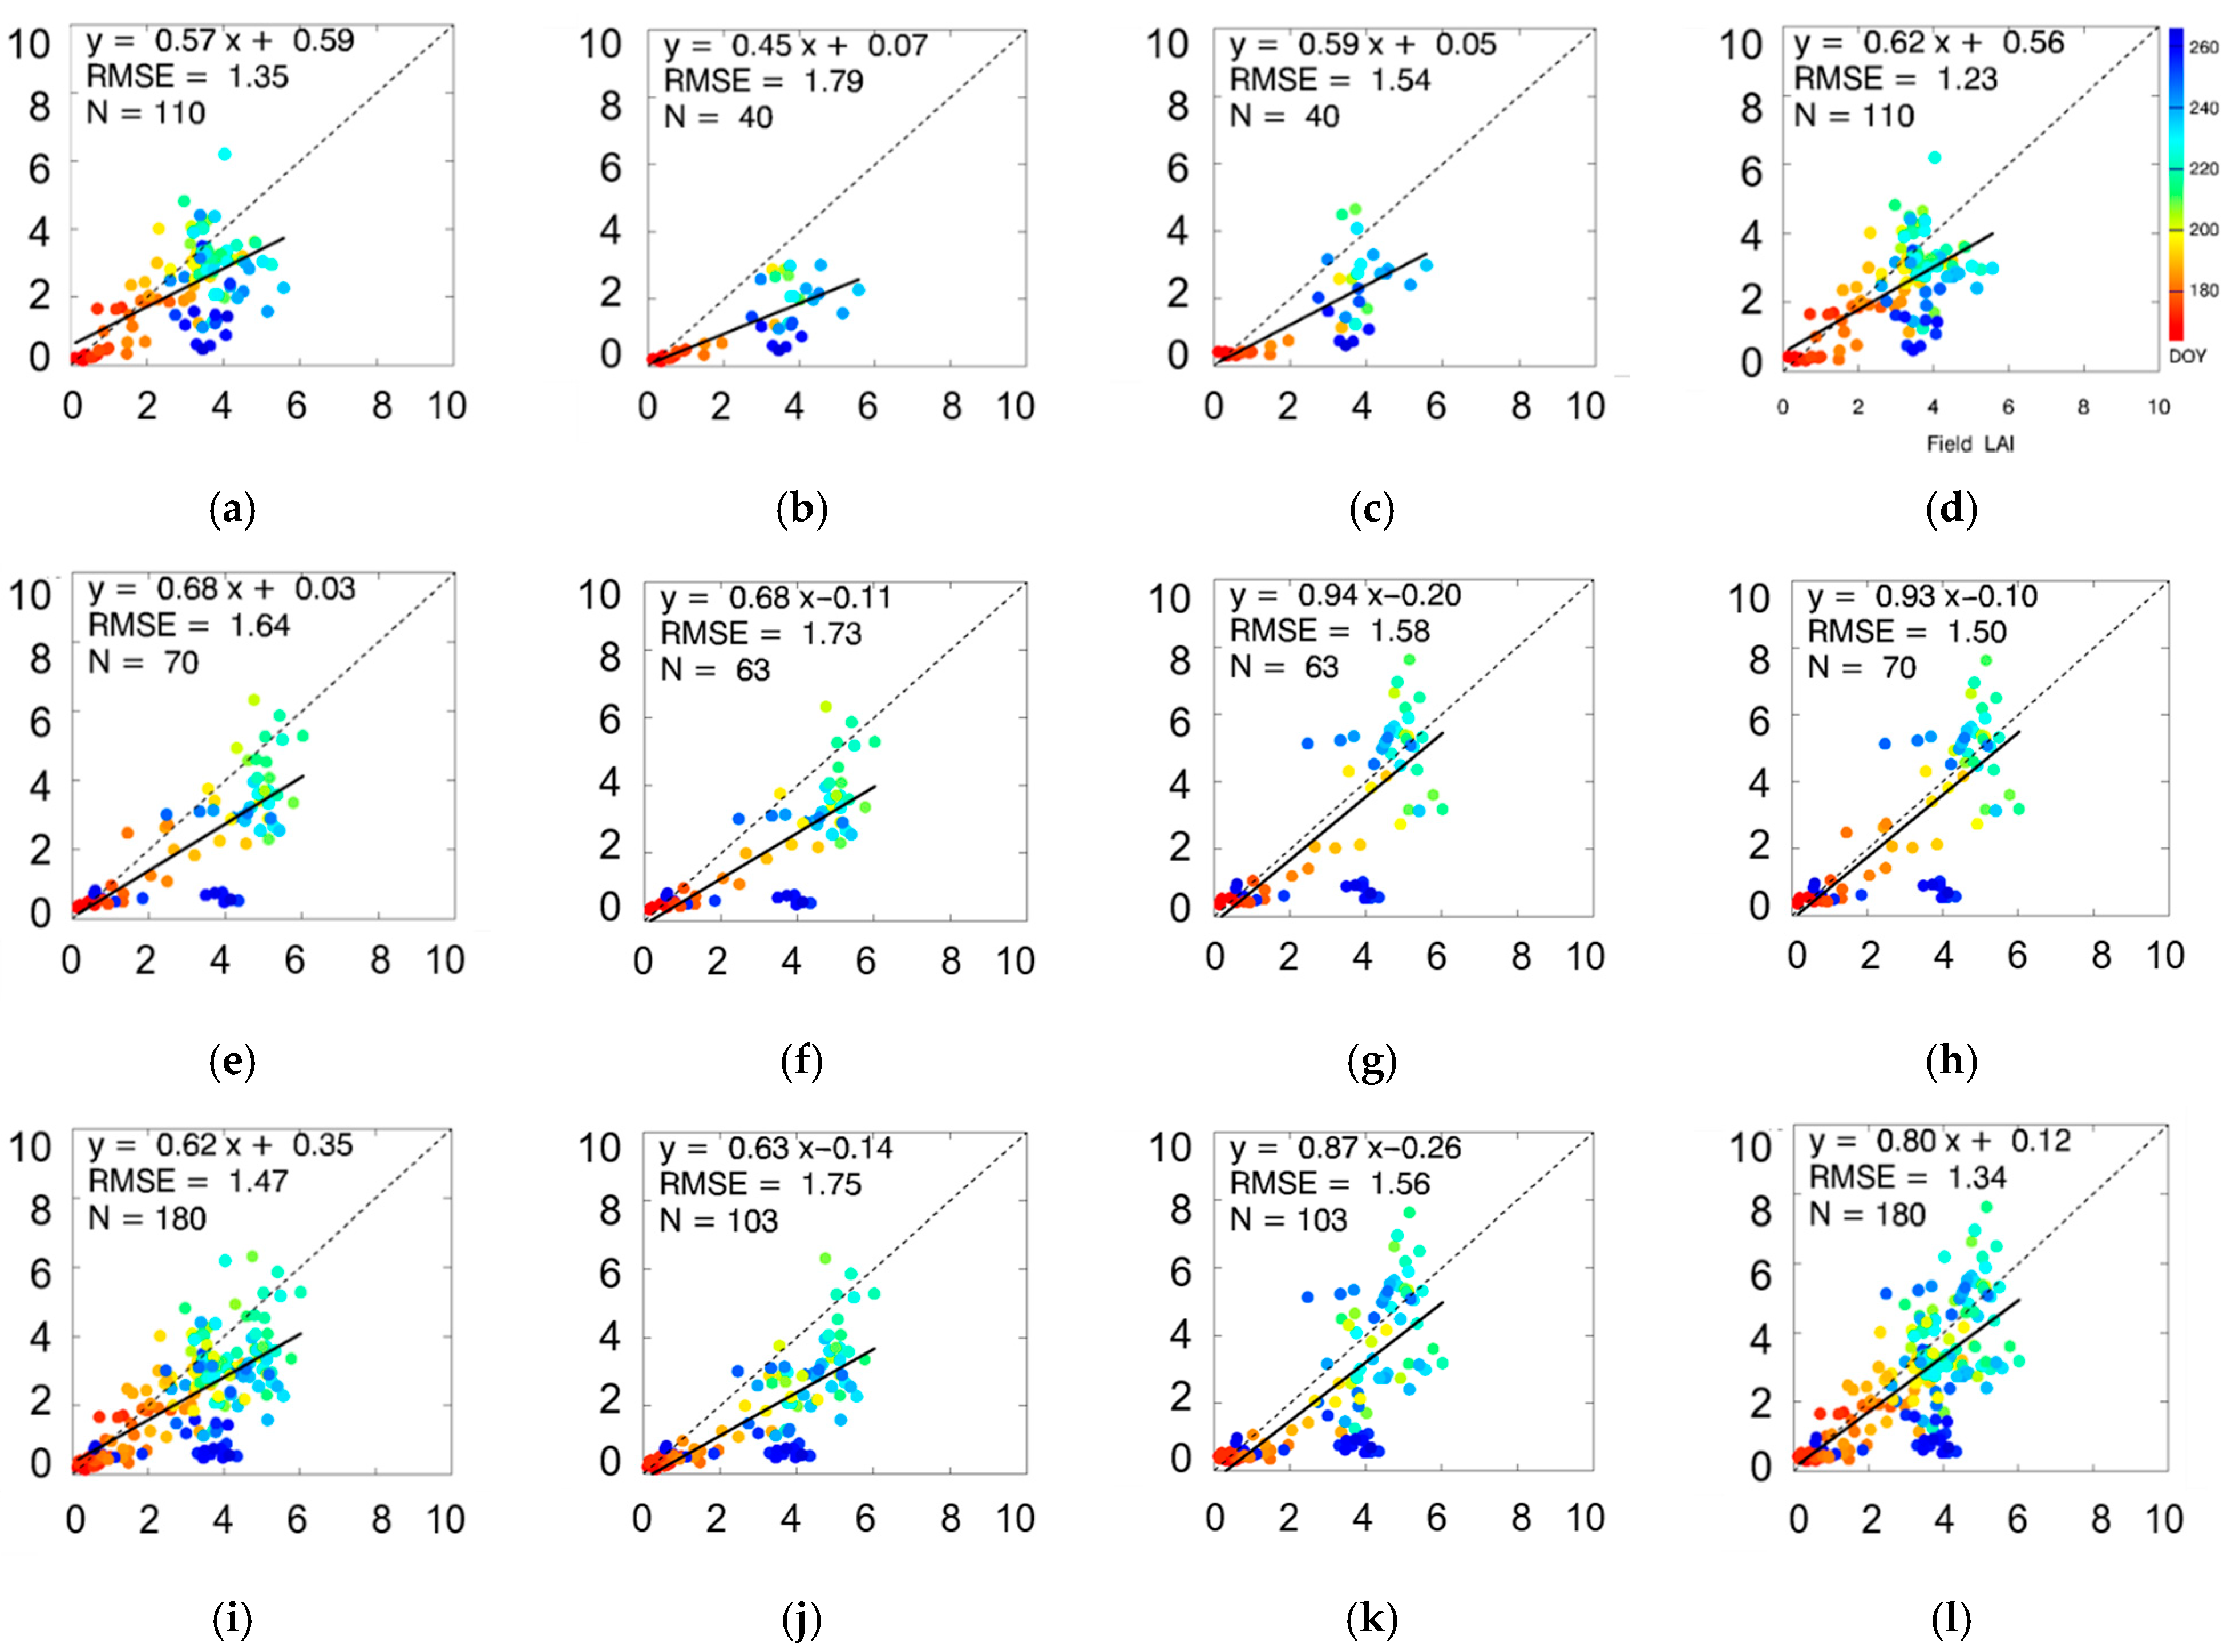
A total of 180 LAI measurements at the 500-m plot level were used for algorithm validation, including wide and local search strategies via the empirical ALA based on Equation (14). Among the 180 sets of field-measured LAI values, nine sets of concurrent MODIS BRDF parameters comprised fill values, for which BRDF data retrieved with the main and backup algorithms at the nearest time were added as alternative data to guarantee data integrity. There are 103 sets of BRDF data that yielded reasonable ALA values ranging from 10° to 85°, while the remaining data could not employ the local search method because the fvol value in the NIR band was larger than 0.3813. Considering that the theoretical estimation-based RMSE of the linear estimated ALA is 2.07°, vegetation parameter combinations with ALAs varying by ±3° around the empirical value were used in the local search strategy. Notably, the local search range directly decreased to approximately 1600 sets of data, while all 20,000 sets of data were traversed in the wide search. As a result, the local search was 11.5 times faster than the wide search, which greatly improved the retrieval speed.
Figure 5 and Table 4 illustrate the validation results of the estimated LAIs using the proposed method based on LAI field measurements. During the late growing season after DOY 240 (bluish points), the estimated LAIs were lower than the reference LAIs, which agrees with the validation results of the MODIS LAI product [55]. The local search method based on the empirical ALA is not applicable mainly to paddy rice in Honghe, where fvol in the NIR band for 70 sets of data was larger than 0.3813 among all 110 sets. Regarding the crops in Hailun, only in 7 sets of data did the retrieved empirical ALA occur beyond the range in the 70 sets. With the use of the same data, the LAI estimation accuracy was obviously improved with the local search method (the third column of Figure 5) over the wide search method (the second column of Figure 5). Consequently, fusion results could be obtained by combining all of the results obtained in the local search and the remaining results of the wide search. As expected, the fused LAI retrievals of these two methods (the fourth column of Figure 5; RMSE = 1.34, bias = −0.52, R2 = 0.49, RRMSE = 41.3%) exhibited a higher LAI estimation accuracy than that achieved with the wide search method (the first column of Figure 5), as well as the MODIS LAI product generated with the main algorithm (RMSE = 1.57, bias = −0.21, R2 = 0.24, RRMSE = 48.3%) [8] given the same data, as listed in Table 4. The results highlight the importance of sufficient BRDF information in vegetation parameter retrieval over the utilization of satellite observation data at a few viewing angles, such as the MODIS LAI product.
There are five methods included in total: (1) MODIS refers to the latest Collection V006 MODIS LAI product (i.e., MCD15A2H), where only data generated by the main algorithm are used [55]; (2) wide search refers to results retrieved by the wide research method; (3) wide search of local search data refers to results retrieved with the wide research method considering the same LAI data as those considered under the local search method; (4) local search by the ALA refers to results retrieved with the local research method; (5) fused results refers to the combined results obtained from the local search method and the remaining results of the wide search method.

4.3. Error Analysis and Method Improvement

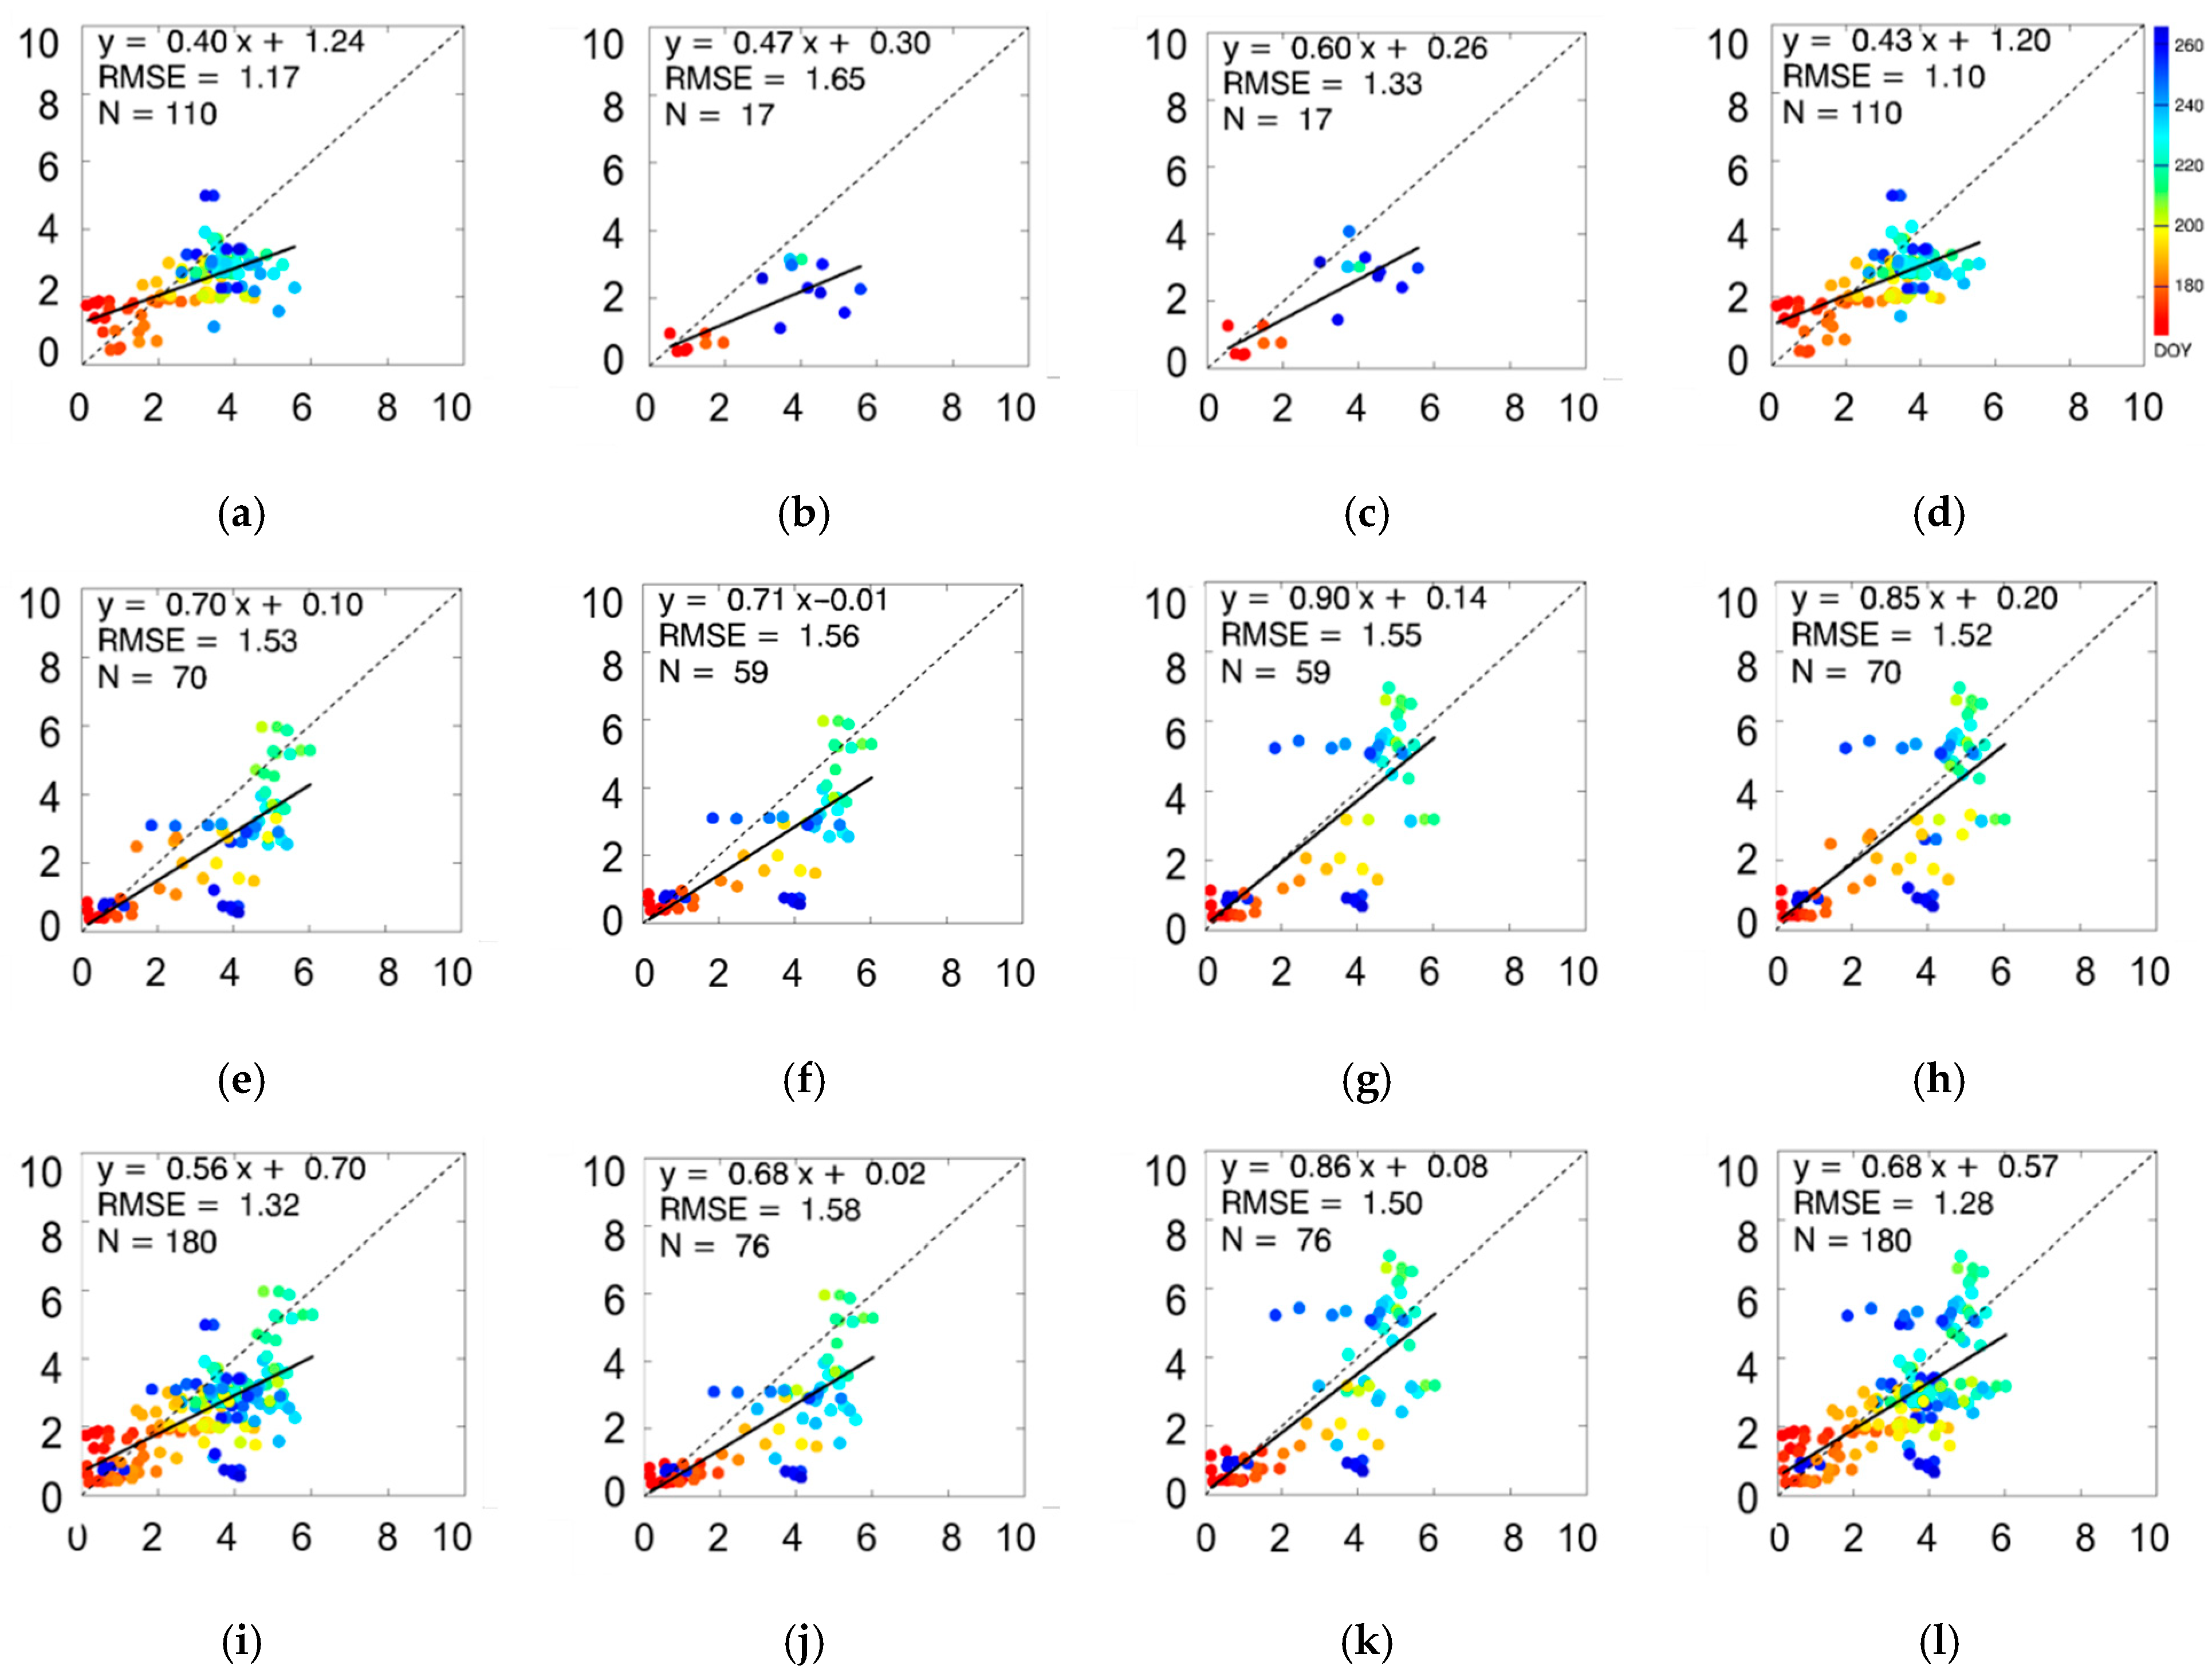
We further analyzed the reason for the estimation error, especially in the quality of the MODIS BRDF parameters. The ALA validation results for the MODIS BRDF parameters of different qualities are shown in Figure 6, and the estimation accuracy based on high-quality BRDF data (QA = 0/1) is obviously higher than that based on data retrieved from the backup algorithm (QA = 2/3). The difference in LAI estimation accuracy resulting from the BRDF quality is easy to understand because the backup algorithm is employed when the main algorithm cannot be implemented due to poor angular sampling or insufficient input observations [20,21,59,61,62]. The analysis further emphasizes the significance of sufficient high-quality BRDF information for vegetation parameter retrieval.
To reduce the impact of the BRDF quality on the proposed method and further improve the LAI retrieval accuracy, BRDF data obtained from the backup algorithm were tentatively alternated by data retrieved from the main algorithm at the nearest time. This strategy follows the assumption that there exists a similar BRDF pattern in half to all of the months as the MODIS [20] and POLDER BRDF products [22]. The updated validation results of the estimated LAI values using high-quality MODIS BRDF data are shown in Figure 7 and Table 5, which indicate a better accuracy than that using BRDF data with both the main and backup algorithms in Section 4.2. Similarly, the local search method via the ALA attains better estimations than does the wide search method for the same data, and the fused results yield the optimal LAI estimations (RMSE = 1.28, bias = −0.46, R2 = 0.45, RRMSE = 39.5%) among all the methods proposed in this study. Unfortunately, estimation cannot be accomplished by the local search method considering more data than before. Similarly, the local search method still failed for mainly paddy rice in Honghe, but the data number increased from 70 to 93. For the crops in Hailun, the number of data points that failed to implement the local search method increased from 7 to 11.

4.4. General Flowchart for LAI Estimation and Validation Based on LAI Maps

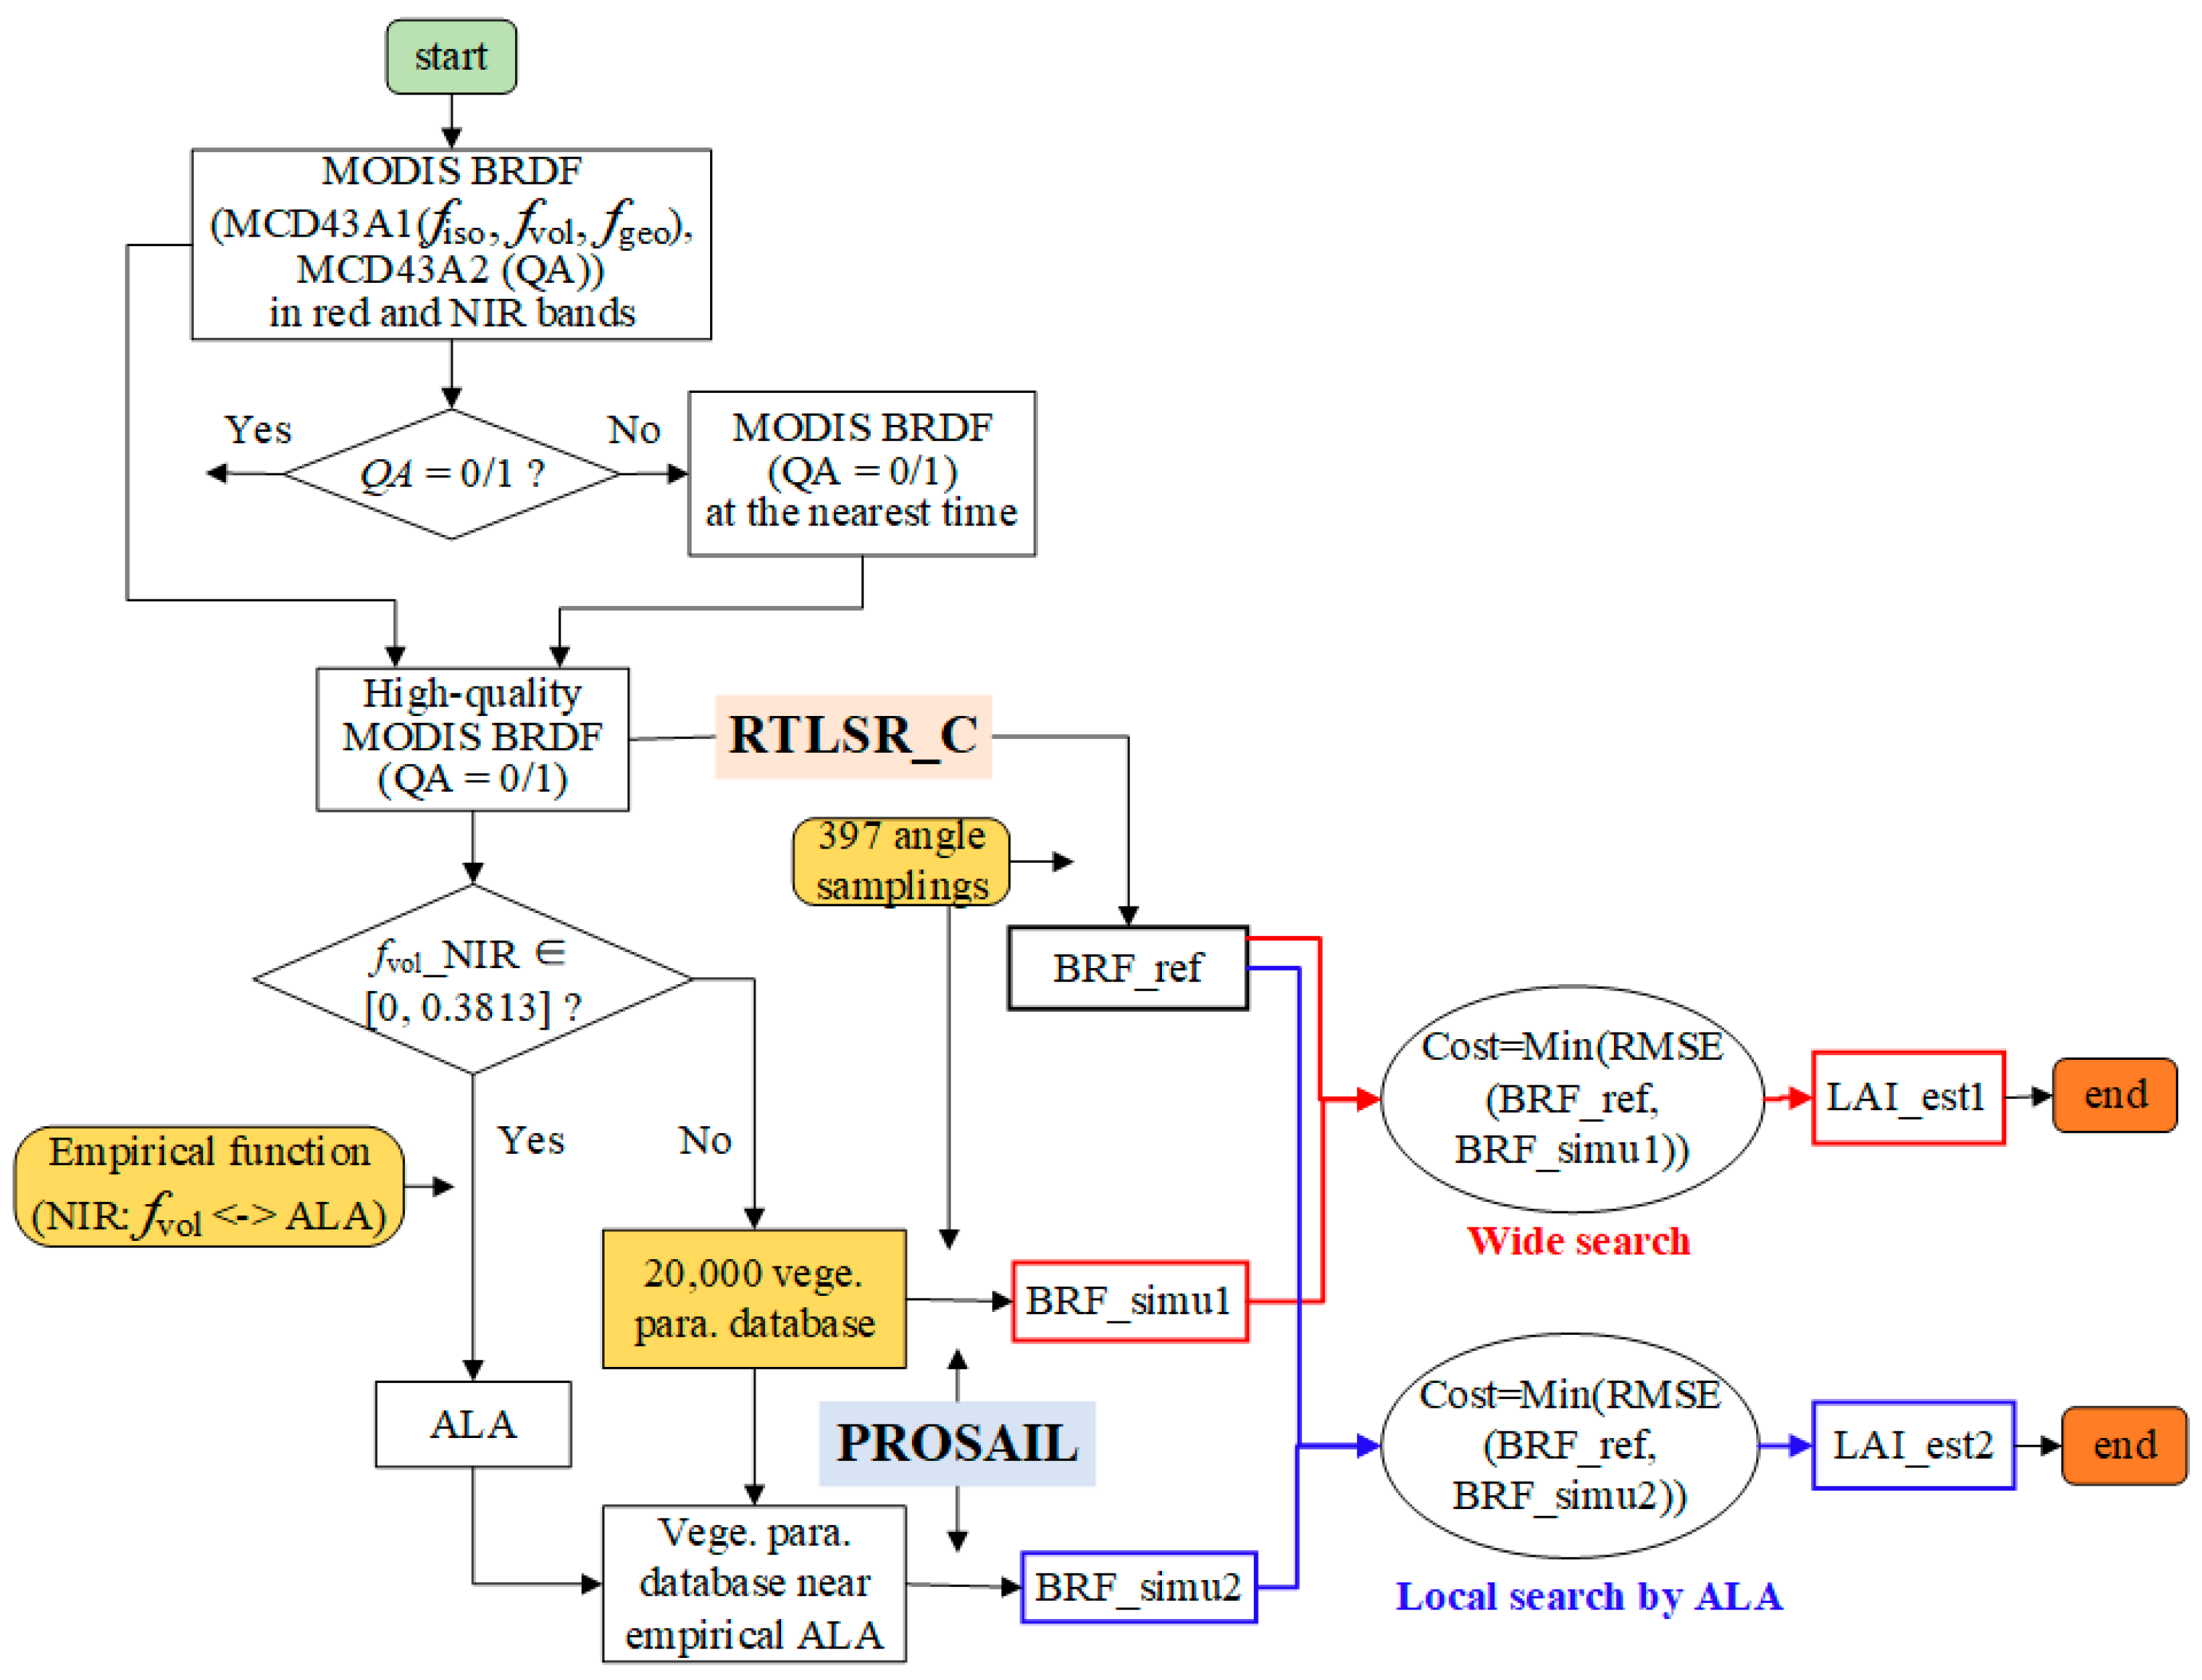
According to the validation and error analysis results for the proposed method based on field measurements, a general flowchart for LAI retrieval by using the novel method is shown in Figure 8. The process describes the flow scheme to estimate LAI via wide and local search strategies based on the MODIS BRDF parameter product.
Before method application, the data and methods should be prepared, including the PROSAIL model, hotspot-corrected Ross-Li RTLSR_C model, 20,000 PROSAIL vegetation parameter datasets, 397 angle samplings, and empirical function between the ALA and fvol in the NIR band, as expressed in Equation (14).
After preparation, we can start the estimation process. First, the quality of the MODIS BRDF parameters should be examined, and lower-quality BRDF data are alternated by high-quality data at the nearest time. Then, a second evaluation is performed to determine whether the value of fvol in the NIR band is less than 0.3813. If fvol satisfies this condition, the local search method is applied to estimate the final LAI, which searches the 20,000 vegetation parameter database only for those values approaching the empirical ALA calculated by the fvol-ALA relationship. In contrast, when the value of fvol exceeds the critical value, the wide search method is applied to estimate the LAI by searching the optimal results from the total 20,000 dataset. In this way, a continuous LAI estimation both in time and space can be obtained by jointly applying these two search methods.
Following the flowchart, 500-m LAI values estimated from the MODIS BRDF parameters concurrent with the high-resolution LAI maps were calculated. Comparisons of the retrieved LAI to the upscaled 30-m reference LAI maps at 500-m and 1.5-km resolutions (3 × 3 MODIS pixels) are shown in Figure 9. Generally, the estimated LAIs based on the proposed method present a variance trend similar to that of the reference data throughout the whole growing season, especially in Hailun, while the estimations are lower than the reference LAI data at the senescence stage, as shown in Figure 9a,c. Based on the scatter plots, an overall underestimation can be observed for paddy rice in Honghe, which agrees with the validation analysis at the 500-m plot level. For the maize, soybean, and sorghum crops in Hailun, a better fitting line close to the 1:1 line was obtained. Finally, the total accuracy for the crops at both sites (RMSE = 1.13, bias = −0.19, R2 = 0.64, RRMSE = 36.8%) was higher than that at the plot level in Section 4.3 (RMSE = 1.28, bias = −0.46, R2 = 0.45, RRMSE = 39.5%). Moreover, the estimated LAI values also indicate a better consistency with the reference data than does the MODIS LAI product (RMSE = 1.50, bias = −0.23, R2 = 0.24, RRMSE = 47.1%) [55]. Similarly, there exists a better agreement with the LAI maps for the retrieved LAIs using the flowchart in this study than that for the MODIS LAI product, as described in Section 4.2 and Section 4.3, which further indicates that modelled multi-angular reflectance data at sufficient sun-viewing geometries can provide effective BRDF information and thus can be applied in vegetation parameter retrieval.

5. Discussion

The intrinsic surface anisotropic reflectance (i.e., the BRDF effect) is sensitive to vegetation structure parameters, and satellite-observed reflectance data can in turn promote global vegetation parameter retrieval. Nevertheless, BRDF information retrieved from satellite observations at a few viewing angles cannot sufficiently be considered in general. Therefore, modelled multi-angular reflectance values at sufficient sun-viewing geometries were used in this study, which were calculated based on the kernel-driven Ross-Li BRDF model by inputting the MODIS BRDF parameter product. As a result, compared to direct satellite observations, these modelled, multi-angular data encompass sufficient angles, by which BRDF information can be better considered in theory. Moreover, cloud cover and other reasons often lead to noise in satellite observations, which may, in turn, affect the retrieval accuracy of vegetation parameters by directly using these observed data. However, the widely employed Ross-Li model for BRDF reconstruction (e.g., using the global MODIS BRDF parameter product) provides an advantage in terms of greatly smoothing random noise in satellite observations by theoretically considering the overall BRDF variance [13,18].
Based on these advantages, the potential of sufficient modelled BRDF data as input for LAI retrieval was explored in this study by coupling the robust PROSAIL model with the hotspot-corrected Ross-Li model using the MODIS BRDF parameter product as input. One of the main contributions of this study is to find a significantly linear relationship between the ALA and fvol of the Ross-Li model in the NIR band, which was used to narrow the search scope of the ALA. The local search method based on the ALA relationship is approximately 11.5 times faster than the wide search method, and therefore, it is promising for rapid large-scale inversion. In addition, the local search method also has a better inversion accuracy of LAI than the wide search method, as validated in Section 4. However, the two search methods also need to be jointly applied, due to the constraint of the fvol-ALA relationship that is applicable for fvol values ranging from 0 to 0.3813. The LAIs subsequently retrieved by combining the two search methods attain good accuracy, especially for high-quality MODIS BRDF data, which presents the importance of quality in modelling multi-angular data. A higher accuracy was achieved for crops than does the MODIS LAI product generated based on limited observations [55], which demonstrates the significance of modelled, sufficient BRDF information in parameter retrieval. For medium-resolution, multi-angular satellites with a few sun-viewing geometries, this novel method can help surface inversion and even attain a higher accuracy. For high-resolution satellites that usually do not have multi-angular observations, these modelled, sufficient BRDF data from the Ross-Li model are promising to act as the compensation.
This study linked the semi-empirical Ross-Li model and the PROSAIL physical model, and the existing model inconsistencies between them may lead to some confusion. The initial two primary components of the Ross-Li model include the volumetric scattering and geometric-optical scattering, which were divided into three parts after employing many simplifications to keep a linear function that is applicable for different spatial scaling [13]. The items associated with background reflectance and a series of parameters of elements (e.g., the height, length and LAI of protrusions) in the whole scene are integrated into three kernel coefficients. Therefore, these non-negative kernel coefficients (i.e., fiso, fvol, and fgeo) are strongly associated with canopy structure, which can roughly indicate the weight of the scattering type. Through numerous validations, the RTLSR model was demonstrated to be robust among a series of kernel combinations, and then it was used as the operational algorithm for generating the global MODIS BRDF parameter product. The hotspot revised version (i.e., the RTLSR_C model) used in this study has significantly improved the accuracy in modelling hotspot reflectance, which also presents a high inheritance from the RTLSR model in the remaining geometries. For the PROSAIL model, more elaborate descriptions of light scattering have been considered, following radiative transfer theory [43,44]. Despite model differences, a previous study represented an overall good BRDF agreement in linking the two models with a wide change in the PROSAIL input parameters [42], which lays a foundation for this study.
In terms of the newly built empirical fvol–ALA relationship, several associated model inconsistencies were discussed here in detail. First, the relationship does not seem to be rigorous, without a clear physical meaning. In fact, both the volumetric scattering Rossthick kernel and the SAIL model are developed based on radiative transfer theory [13,44], which is highly sensitive to the leaf structure inside the canopy, such as the ALA and LAI. Therefore, it is generally understandable for the empirical relationship between the ALA and the fvol that acts as the weight coefficients of the volumetric scattering Rossthick kernel. Second, only single scattering is considered in the Rossthick model, while both single scattering and multiple scattering are included in the SAIL model. Towards the initial volumetric scattering component of the Ross-Li model, the isotropic contribution resulting from multiple scattering has been included in the Lambertian term [13], so multiple scattering has indirectly been considered. Finally, the Rossthick model has also been simplified to describe a spherical distribution of the leaf inclination angle with a large LAI [13], while the PROSAIL model has a wide change in the ALA and LAI. In fact, the broad adaptability of the RTLSR model has been presented in various land cover types from soil to forest–shrub–grass areas [21,57,59,60], and therefore, the model is expected to be applied much more than a specific range of the ALA and LAI, such as the global MODIS BRDF data. This performance may be attributed to the semi-empirical property of the Ross-Li model, where the final fitting accuracies are greatly affected by the observations apart from the theoretical variance of these kernels.
The possible limitations of this study and future expectations of similar studies were also analyzed. First, the following points need to be noted in terms of algorithm accuracy: (1) In the validation of five mainstream global LAI products based on the field-measured crop LAIs used in this study [55], the RMSEs change from 1.24 to 1.77, except for that of the GLASS LAI (i.e., 0.92) for pixel-to-pixel comparisons. In this case, the RMSE of 1.13 for this proposed method shows a relatively good accuracy compared to these LAI products. (2) This study focuses on the improvement of LAI retrieval by using sufficient multiangle reflectances modelled from MODIS BRDF parameters, which was demonstrated by the better estimation accuracy of the novel method than that of the Collection 6 MODIS LAI product generated from observations at a few angles (i.e., RMSE = 1.50). (3) Even so, the accuracy of this study still seems to be large considering the target accuracy (±0.5) required by the Global Climate Observing System (GCOS) [8]. Based on global sites over forest–shrub–grass surfaces, validations of the Collection 6 MODIS LAI product show a smaller RMSE of 0.66 [8]; therefore, the accuracies of this novel method at sufficient sites and vegetation types need to be further investigated. Notably, the reliability of the LAI indirectly validated the retrieval accuracy of the ALA. Then, the potential issue of the Ross-Li model regarding large angles (e.g., SZA values > 70°) [71,72] may lead to insufficiency constraints of the corresponding BRDF data when performing retrieval. In addition, the PROSAIL model is more applicable for homogeneous continuous surfaces, such as the crops associated in this study, and geometric-optical physical models (e.g., 5-scale) can be used for heterogeneous discrete canopies, such as forests, in the future. More importantly, the general flowchart of LAI estimation in this study can be applied to different physical and semi-empirical/empirical models [73,74,75,76,77,78,79,80] to retrieve various vegetation parameters, which is one of the main implications for the field of surface parameter estimation. Before model linking, the BRDF consistency should be investigated to reduce model coupling errors [42].

6. Conclusions

Satellite data play an essential role in surface parameter inversion for monitoring changes in global climate and ecology. Currently, satellite-observed reflectances at a few viewing angles are often directly used for vegetation structure parameter retrieval; however, noise in observations as well as these insufficient sun-viewing geometries always bring difficulties to accurate inversion, generally from physical BRDF models. To address these limitations, modelled sufficient multi-angular reflectances through BRDF models have been widely used as supplemented anisotropy information, which has achieved good performance in the retrieval of several essential vegetation parameters. In this study, we attempted to apply this reconstructed BRDF information to better retrieve LAI from the physical PROSAIL BRDF model using the widely used semi-empirical Ross-Li BRDF model by inputting the MODIS BRDF parameter product. As a contrast, we compared the estimated LAIs with the MODIS LAI product that are retrieved from satellite-observed reflectances at a few angles, which aims to evaluate the potential of the sufficiently modelled BRDF information in the improvement of LAI retrieval. Specifically, an empirical linear relationship between the ALA and fvol of the Ross-Li model in the NIR band was built, which was used for a local search compared to the wide search strategy to determine the optimal combinations of the PROSAIL model parameters. By combining the two search strategies, the novel method attains a good LAI retrieval accuracy, especially given high-quality MODIS BRDF data. Both the validation results at the field-measured plot level (i.e., RMSE = 1.28, bias = −0.46, RRMSE = 39.5%) and 30-m LAI maps (i.e., RMSE = 1.13, bias = −0.19, RRMSE = 36.8%) for crops achieve higher accuracies than the MODIS LAI product, which is generated based on observed reflectance data at a few angles.
The good performance of the novel method demonstrates the significance of the modelled, sufficient BRDF information in parameter retrieval, and the obtained ALA–fvol relationship can significantly accelerate the inversion process and improve accuracy. Despite several limitations in our method, as introduced in the Discussion section, the developed method is promising for LAI estimation in large homogeneous regions, and the flowchart of this study can be applied to a series of empirical/semi-empirical and physical BRDF models for retrieving various surface parameters. Meanwhile, more algorithm validations at widespread sites for homogeneous canopies need to be performed in future work. In addition, efforts should be made to reduce the uncertainties of the Ross-Li BRDF model at large angles to provide more accurate anisotropy reflectance reconstructions, and geometric-optical physical BRDF models can be joined to retrieve vegetation parameters from heterogeneous surfaces.

Author Contributions

Conceptualization, X.Z. and Z.J.; data curation, X.Z. and S.Y.; formal analysis, X.Z., Z.J., C.Z., L.C., Y.D., H.Z., J.G., R.X., S.L., Z.Z. and Y.T.; methodology, X.Z. and Z.J.; funding acquisition, Z.J., X.Z. and Y.D.; writing—original draft, X.Z.; and writing—review and editing, X.Z., Z.J. and Y.D. All authors have read and agreed to the published version of the manuscript.

Funding

This work was supported by the National Natural Science Foundation of China (42090013 & 41971288), the China Postdoctoral Science Foundation under Grant 2021M690424, and the National Natural Science Foundation of China under Grant 41801237 & 41971306.

Data Availability Statement

All satellite remote sensing and field measured data used in this study are openly and freely available. The Collection 6 MODIS BRDF parameter product (MCD43A1 & MCD43A2) is available at https://search.earthdata.nasa.gov/search, accessed on 10 August 2021. LAI measurements at the 500-m Plot Level and with 30-m LAI maps are available at https://doi.pangaea.de/10.1594/PANGAEA.900090, accessed on 10 August 2021.

Acknowledgments

We greatly appreciate the LAI measurements shared as public data by the research team of Hongliang Fang at the Chinese Academy of Sciences. In addition, Hongliang Fang also provided some useful advice. We thank the PROSAIL team for providing the model code online for free. In addition, we thank the research team of the MODIS BRDF products who freely provided global data. Finally, we are also grateful for the careful review and valuable comments provided by the anonymous reviewers.

Conflicts of Interest

The authors declare no conflict of interest.

References

  1. Jiang, L.; Guli, J.; Bao, A.; Guo, H.; Ndayisaba, F. Vegetation Dynamics and Responses to Climate Change and Human Activities in Central Asia. Sci. Total. Environ. 2017, 599–600, 967–980. [Google Scholar] [CrossRef]
  2. Privette, J.L.; Emery, W.J.; Schimel, D.S. Inversion of a Vegetation Reflectance Model with NOAA AVHRR Data. Remote Sens. Environ. 1996, 58, 187–200. [Google Scholar] [CrossRef]
  3. Sellers, P.J.; Dickinson, R.E.; Randall, D.A.; Betts, A.K.; Hall, F.G.; Berry, J.A.; Collatz, G.J.; Denning, A.S.; Mooney, H.A.; Nobre, C.A.; et al. Modeling the Exchanges of Energy, Water, and Carbon Between Continents and the Atmosphere. Science 1997, 275, 502–509. [Google Scholar] [CrossRef] [PubMed] [Green Version]
  4. Verger, A.; Baret, F.; Weiss, M. Near Real-Time Vegetation Monitoring at Global Scale. IEEE J. Sel. Top. Appl. Earth Obs. Remote Sens. 2014, 7, 3473–3481. [Google Scholar] [CrossRef]
  5. Xiao, Z.; Liang, S.; Wang, J.; Chen, P.; Yin, X.; Zhang, L.; Song, J. Use of General Regression Neural Networks for Generating the GLASS Leaf Area Index Product from Time-Series MODIS Surface Reflectance. IEEE Trans. Geosci. Remote Sens. 2014, 52, 209–223. [Google Scholar] [CrossRef]
  6. Liu, Y.; Liu, R.; Chen, J.M. Retrospective Retrieval of Long-Term Consistent Global Leaf Area Index (1981–2011) from Combined AVHRR and MODIS Data. J. Geophys. Res. Biogeosci. 2012, 117, G04003. [Google Scholar] [CrossRef]
  7. Yan, K.; Park, T.; Yan, G.; Chen, C.; Yang, B.; Liu, Z.; Nemani, R.R.; Knyazikhin, Y.; Myneni, R.B. Evaluation of MODIS LAI/FPAR Product Collection 6. Part 1: Consistency and Improvements. Remote Sens. 2016, 8, 359. [Google Scholar] [CrossRef] [Green Version]
  8. Yan, K.; Park, T.; Yan, G.; Liu, Z.; Yang, B.; Chen, C.; Nemani, R.R.; Knyazikhin, Y.; Myneni, R.B. Evaluation of MODIS LAI/FPAR Product Collection 6. Part 2: Validation and Intercomparison. Remote Sens. 2016, 8, 460. [Google Scholar] [CrossRef] [Green Version]
  9. Baret, F.; Weiss, M.; Verger, A.; Smets, B. ATBD for LAI, FAPAR and FCOVER from PROBA-V Products at 300M Resolution (Geov3). In IMAGINES_RP2.1_ATBD-LAI300m; Implementing Multi-scale AGricultural INdicators Exploiting Sentinels (ImagineS): INRA, France, 2016; pp. 1–61. [Google Scholar]
  10. Yan, K.; Park, T.; Chen, C.; Xu, B.; Song, W.; Yang, B.; Zeng, Y.; Liu, Z.; Yan, G.; Knyazikhin, Y.; et al. Generating Global Products of LAI and FPAR from SNPP-VIIRS Data: Theoretical Background and Implementation. IEEE Trans. Geosci. Remote Sens. 2018, 56, 2119–2137. [Google Scholar] [CrossRef]
  11. Zhou, H.M.; Wang, J.D.; Liang, S.L.; Xiao, Z.Q. Extended Data-Based Mechanistic Method for Improving Leaf Area Index Time Series Estimation with Satellite Data. Remote Sens. 2017, 9, 533. [Google Scholar] [CrossRef] [Green Version]
  12. Xiao, Z.Q.; Liang, S.L.; Wang, J.D.; Xie, D.H.; Song, J.L.; Fensholt, R. A Framework for Consistent Estimation of Leaf Area Index, Fraction of Absorbed Photosynthetically Active Radiation, and Surface Albedo from MODIS Time-Series Data. IEEE Trans. Geosci. Remote Sens. 2015, 53, 3178–3197. [Google Scholar] [CrossRef]
  13. Roujean, J.L.; Leroy, M.M.; Deschamps, P.Y. A Bidirectional Reflectance Model of the Earth’s Surface for the Correction of Remote Sensing Data. J. Geophys. Res. Atmos. 1992, 97, 20455–20468. [Google Scholar] [CrossRef]
  14. Roosjen, P.P.J.; Brede, B.; Suomalainen, J.M.; Bartholomeus, H.M.; Kooistra, L.; Clevers, J.G.P.W. Improved Estimation of Leaf Area Index and Leaf Chlorophyll Content of a Potato Crop Using Multi-Angle Spectral Data-Potential of Unmanned Aerial Vehicle Imagery. Int. J. Appl. Earth Obs. 2018, 66, 14–26. [Google Scholar] [CrossRef]
  15. Barnsley, M.J.; Strahler, A.H.; Morris, K.P.; Muller, J.P. Sampling the Surface Bidirectional Reflectance Distribution Function (BRDF): 1. Evaluation of Current and Future Satellite Sensors. Remote Sens. Rev. 1994, 8, 271–311. [Google Scholar] [CrossRef]
  16. Lucht, W.W.; Lewis, P.E. Theoretical Noise Sensitivity of BRDF and Albedo Retrieval from the EOS-MODIS and MISR Sensors with Respect to Angular Sampling. Int. J. Remote Sens. 2000, 21, 81–98. [Google Scholar] [CrossRef]
  17. Chen, A.; Bian, L.; Liu, Y. Deriving Albedo over Cloudy Areas with Composite Inversion. In Proceedings of the SPIE-The International Society for Optical Engineering, Nanjing, China, 25 May 2007; Volume 6753, pp. 1–11. [Google Scholar]
  18. Wanner, W.; Li, X.W.; Strahler, A.H. On the Derivation of Kernels for Kernel-Driven Models of Bidirectional Reflectance. J. Geophys. Res. Atmos. 1995, 100, 21077–21089. [Google Scholar] [CrossRef]
  19. Nicodemus, F.E.; Richmond, J.C.; Hsia, J.J.; Ginsberg, I.W.; Limperis, T. Geometrical Considerations and Nomenclature for Reflectance; National Bureau of Standards: Washington, DC, USA, 1977. [Google Scholar]
  20. Schaaf, C.B.; Liu, J.C.; Gao, F.; Strahler, A.H. Aqua and Terra MODIS Albedo and Reflectance Anisotropy Products. In Land Remote Sensing and Global Environmental Change: NASA’s Earth Observing System and the Science of ASTER and MODIS; Ramachandran, B., Justice, C.O., Abrams, M.J., Eds.; Springer: New York, NY, USA, 2011; Volume 11, pp. 549–561. [Google Scholar]
  21. Schaaf, C.B.; Gao, F.; Strahler, A.H.; Lucht, W.W.; Li, X.W.; Tsang, T.; Strugnell, N.C.; Zhang, X.Y.; Jin, Y.F.; Muller, J.P.; et al. First Operational BRDF, Albedo Nadir Reflectance Products from MODIS. Remote Sens. Environ. 2002, 83, 135–148. [Google Scholar] [CrossRef] [Green Version]
  22. Bréon, F.M.; Maignan, F. A BRDF–BPDF Database for the Analysis of Earth Target Reflectances. Earth Syst. Sci. Data. 2017, 9, 31–45. [Google Scholar] [CrossRef] [Green Version]
  23. Bacour, C.; Breon, F.M. Variability of Biome Reflectance Directional Signatures as Seen by POLDER. Remote Sens. Environ. 2005, 98, 80–95. [Google Scholar] [CrossRef]
  24. He, T.; Liang, S.L.; Wang, D.D.; Cao, Y.F.; Gao, F.; Yu, Y.Y.; Feng, M. Evaluating Land Surface Albedo Estimation from Landsat MSS, TM, ETM Plus, and OLI Data Based on the Unified Direct Estimation Approach. Remote Sens. Environ. 2018, 204, 181–196. [Google Scholar] [CrossRef]
  25. Qu, Y.; Liu, Q.; Liang, S.L.; Wang, L.Z.; Liu, N.F.; Liu, S.H. Direct-Estimation Algorithm for Mapping Daily Land-Surface Broadband Albedo from MODIS Data. IEEE Trans. Geosci. Remote Sens. 2014, 52, 907–919. [Google Scholar] [CrossRef]
  26. Liang, S.L. A Direct Algorithm for Estimating Land Surface Broadband Albedos from MODIS Imagery. IEEE Trans. Geosci. Remote Sens. 2003, 41, 136–145. [Google Scholar] [CrossRef]
  27. Zhang, X.; Jiao, Z.; Dong, Y.; He, T.; Ding, A.; Yin, S.; Zhang, H.; Cui, L.; Chang, Y.; Guo, J.; et al. Development of the Direct-Estimation Albedo Algorithm for Snow-Free Landsat TM Albedo Retrievals Using Field Flux Measurements. IEEE Trans. Geosci. Remote Sens. 2020, 58, 1550–1567. [Google Scholar] [CrossRef]
  28. Jiao, Z.T.; Zhang, H.; Dong, Y.D.; Liu, Q.; Xiao, Q.; Li, X.W. An Algorithm for Retrieval of Surface Albedo from Small View-Angle Airborne Observations through the Use of BRDF Archetypes as Prior Knowledge. IEEE J. Sel. Top. Appl. Earth Obs. Remote Sens. 2015, 8, 3279–3293. [Google Scholar] [CrossRef]
  29. Jiao, Z.T.; Dong, Y.D.; Schaaf, C.B.; Chen, J.M.; Román, M.; Wang, Z.S.; Zhang, H.; Ding, A.X.; Erb, A.; Hill, M.J.; et al. An Algorithm for the Retrieval of the Clumping Index (CI) from the MODIS BRDF Product Using an Adjusted Version of the Kernel-Driven BRDF Model. Remote Sens. Environ. 2018, 209, 594–611. [Google Scholar] [CrossRef]
  30. Chen, J.M.; Menges, C.H.; Leblanc, S.G. Global Mapping of Foliage Clumping Index Using Multi-Angular Satellite Data. Remote Sens. Environ. 2005, 97, 447–457. [Google Scholar] [CrossRef]
  31. He, L.M.; Chen, J.M.; Pisek, J.; Schaaf, C.B.; Strahler, A.H. Global Clumping Index Map Derived from the MODIS BRDF Product. Remote Sens. Environ. 2012, 119, 118–130. [Google Scholar] [CrossRef]
  32. Pisek, J.; Govind, A.; Arndt, S.K.; Hocking, D.; Wardlaw, T.J.; Fang, H.; Matteucci, G.; Longdoz, B. Intercomparison of Clumping Index Estimates from POLDER, MODIS, and MISR Satellite Data over Reference Sites. ISPRS J. Photogramm. 2015, 101, 47–56. [Google Scholar] [CrossRef]
  33. Wei, S.; Fang, H. Estimation of Canopy Clumping Index from MISR and MODIS Sensors Using the Normalized Difference Hotspot and Darkspot (NDHD) Method: The Influence of BRDF Models and Solar Zenith Angle. Remote Sens. Environ. 2016, 187, 476–491. [Google Scholar] [CrossRef]
  34. Zhu, G.L.; Ju, W.M.; Chen, J.M.; Gong, P.; Xing, B.L.; Zhu, J.F. Foliage Clumping Index over China’s Landmass Retrieved from the MODIS BRDF Parameters Product. IEEE Trans. Geosci. Remote Sens. 2012, 50, 2122–2137. [Google Scholar] [CrossRef]
  35. Wang, Z.S.; Schaaf, C.B.; Lewis, P.E.; Knyazikhin, Y.; Schull, M.A.; Strahler, A.H.; Yao, T.; Myneni, R.B.; Chopping, M.J.; Blair, B.J. Retrieval of Canopy Height Using Moderate-Resolution Imaging Spectroradiometer (MODIS) Data. Remote Sens. Environ. 2011, 115, 1595–1601. [Google Scholar] [CrossRef] [Green Version]
  36. Cui, L.; Jiao, Z.; Dong, Y.; Sun, M.; Zhang, X.; Yin, S.; Ding, A.; Chang, Y.; Guo, J.; Xie, R. Estimating Forest Canopy Height Using MODIS BRDF Data Emphasizing Typical-Angle Reflectances. Remote Sens. 2019, 11, 2239. [Google Scholar] [CrossRef] [Green Version]
  37. Wang, Y.; Li, G.; Ding, J.; Guo, Z.; Tang, S.; Wang, C.; Huang, Q.; Liu, R.; Chen, J.M. A Combined GLAS and MODIS Estimation of the Global Distribution of Mean Forest Canopy Height. Remote Sens. Environ. 2016, 174, 24–43. [Google Scholar] [CrossRef]
  38. Mu, X.; Song, W.; Gao, Z.; McVicar, T.R.; Donohue, R.J.; Yan, G. Fractional Vegetation Cover Estimation by Using Multi-Angle Vegetation Index. Remote Sens. Environ. 2018, 216, 44–56. [Google Scholar] [CrossRef]
  39. Dong, Y.; Jiao, Z.; Cui, L.; Zhang, H.; Zhang, X.; Yin, S.; Ding, A.; Chang, Y.; Xie, R.; Guo, J. Assessment of the Hotspot Effect for the PROSAIL Model with POLDER Hotspot Observations Based on the Hotspot-Enhanced Kernel-Driven BRDF Model. IEEE Trans. Geosci. Remote Sens. 2019, 57, 8048–8064. [Google Scholar] [CrossRef]
  40. Jiao, Z.T.; Schaaf, C.B.; Dong, Y.D.; Roman, M.O.; Hill, M.J.; Chen, J.M.; Wang, Z.S.; Zhang, H.; Saenz, E.; Poudyal, R.; et al. A Method for Improving Hotspot Directional Signatures in BRDF Models Used for MODIS. Remote Sens. Environ. 2016, 186, 135–151. [Google Scholar] [CrossRef] [Green Version]
  41. Javier Garcia-Haro, F.; Campos-Taberner, M.; Munoz-Mari, J.; Laparra, V.; Camacho, F.; Sanchez-Zapero, J.; Camps-Valls, G. Derivation of Global Vegetation Biophysical Parameters from Eumetsat Polar System. ISPRS J. Photogramm. 2018, 139, 57–74. [Google Scholar] [CrossRef]
  42. Zhang, X.; Jiao, Z.; Dong, Y.; Zhang, H.; Li, Y.; He, D.; Ding, A.; Yin, S.; Cui, L.; Chang, Y. Potential Investigation of Linking PROSAIL with the Ross-Li BRDF Model for Vegetation Characterization. Remote Sens. 2018, 10, 437. [Google Scholar] [CrossRef] [Green Version]
  43. Feret, J.B.; François, C.; Asner, G.P.; Gitelson, A.A.; Martin, R.E.; Bidel, L.P.R.; Ustin, S.L.; le Maire, G.; Jacquemoud, S. PROSPECT-4 and 5: Advances in the Leaf Optical Properties Model Separating Photosynthetic Pigments. Remote Sens. Environ. 2008, 112, 3030–3043. [Google Scholar] [CrossRef]
  44. Verhoef, W.; Jia, L.; Xiao, Q.; Su, Z. Unified Optical-Thermal Four-Stream Radiative Transfer Theory for Homogeneous Vegetation Canopies. IEEE Trans. Geosci. Remote Sens. 2007, 45, 1808–1822. [Google Scholar] [CrossRef]
  45. Jacquemoud, S.; Verhoef, W.; Baret, F.; Bacour, C.; Zarco Tejada, P.J.; Asner, G.P.; François, C.; Ustin, S.L. PROSPECT+SAIL Models: A Review of Use for Vegetation Characterization. Remote Sens. Environ. 2009, 113, 56–66. [Google Scholar] [CrossRef]
  46. Wang, L.J.; Dong, T.F.; Zhang, G.M.; Niu, Z. LAI Retrieval Using PROSAIL Model and Optimal Angle Combination of Multi-Angular Data in Wheat. IEEE J. Sel. Top. Appl. Earth Obs. Remote Sens. 2013, 6, 1730–1736. [Google Scholar] [CrossRef]
  47. Yi, Y.H.; Yang, D.W.; Huang, J.F.; Chen, D.Y. Evaluation of MODIS Surface Reflectance Products for Wheat Leaf Area Index (LAI) Retrieval. ISPRS J. Photogramm. 2008, 63, 661–677. [Google Scholar] [CrossRef]
  48. Zarco-Tejada, P.J.; Miller, J.R.; Noland, T.L.; Mohammed, G.H.; Sampson, P.H. Scaling-Up and Model Inversion Methods with Narrowband Optical Indices for Chlorophyll Content Estimation in Closed Forest Canopies with Hyperspectral Data. IEEE Trans. Geosci. Remote Sens. 2001, 39, 1491–1507. [Google Scholar] [CrossRef] [Green Version]
  49. Knyazikhin, Y.; Martonchik, J.V.; Diner, D.J.; Myneni, R.B.; Verstraete, M.; Pinty, B.; Gobron, N. Estimation of Vegetation Canopy Leaf Area Index and Fraction of Absorbed Photosynthetically Active Radiation from Atmosphere-Corrected MISR Data. J. Geophys. Res. Atmos. 1998, 103, 32239–32256. [Google Scholar] [CrossRef] [Green Version]
  50. Jacquemoud, S.; Ustin, S.L.; Verdebout, J.; Schmuck, G.; Andreoli, G.; Hosgood, B. Estimating Leaf Biochemistry Using the PROSPECT Leaf Optical Properties Model. Remote Sens. Environ. 1996, 56, 194–202. [Google Scholar] [CrossRef]
  51. Saltelli, A.; Tarantola, S.; Chan, K.P.S. A Quantitative Model-Independent Method for Global Sensitivity Analysis of Model Output. Technometrics 1999, 41, 39–56. [Google Scholar] [CrossRef]
  52. Xiao, Y.F.; Zhao, W.J.; Zhou, D.M.; Gong, H.L.; Du, P.P. Sensitivity Analysis of Vegetation Reflectance to Biochemical and Biophysical Variables at Leaf, Canopy, and Regional Scales. IEEE Trans. Geosci. Remote Sens. 2014, 52, 4014–4024. [Google Scholar] [CrossRef]
  53. Bacour, C.; Jacquemoud, S.; Tourbier, Y.; Dechambre, M.; Frangi, J.P. Design and Analysis of Numerical Experiments to Compare Four Canopy Reflectance Models. Remote Sens. Environ. 2002, 79, 72–83. [Google Scholar] [CrossRef]
  54. Schaepman-Strub, G.; Schaepman, M.E.; Painter, T.H.; Dangel, S.; Martonchik, J.V. Reflectance Quantities in Optical Remote Sensing-Definitions and Case Studies. Remote Sens. Environ. 2006, 103, 27–42. [Google Scholar] [CrossRef]
  55. Fang, H.; Zhang, Y.; Wei, S.; Li, W.; Ye, Y.; Sun, T.; Liu, W. Validation of Global Moderate Resolution Leaf Area Index (LAI) Products Over Croplands in Northeastern China. Remote Sens. Environ. 2019, 233, 111377. [Google Scholar] [CrossRef]
  56. Sandmeier, S.R.; Strahler, A.H. BRDF Laboratory Measurements. Remote. Sens. Rev. 2000, 18, 481–502. [Google Scholar] [CrossRef]
  57. Huang, X.Y.; Jiao, Z.T.; Dong, Y.D.; Zhang, H.; Li, X.W. Analysis of BRDF and Albedo Retrieved by Kernel-Driven Models Using Field Measurements. IEEE J. Sel. Top. Appl. Earth Obs. Remote Sens. 2013, 6, 149–161. [Google Scholar] [CrossRef]
  58. Shuai, Y.M.; Schaaf, C.B.; Strahler, A.H.; Liu, J.C.; Jiao, Z.T. Quality Assessment of BRDF/Albedo Retrievals in MODIS Operational System. Geophys. Res. Lett. 2008, 35, 1–5. [Google Scholar] [CrossRef]
  59. Jin, Y.F.; Schaaf, C.B.; Woodcock, C.E.; Gao, F.; Li, X.W.; Strahler, A.H.; Lucht, W.W.; Liang, S.L. Consistency of MODIS Surface Bidirectional Reflectance Distribution Function and Albedo Retrievals: 2. Validation. J. Geophys. Res. Atmos. 2003, 108, 4159. [Google Scholar] [CrossRef] [Green Version]
  60. Hu, B.X.; Lucht, W.; Li, X.W.; Strahler, A.H. Validation of Kernel-Driven Semiempirical Models for the Surface Bidirectional Reflectance Distribution Function of Land Surfaces. Remote Sens. Environ. 1997, 62, 201–214. [Google Scholar] [CrossRef]
  61. Wang, Z.S.; Schaaf, C.B.; Strahler, A.H.; Chopping, M.J.; Roman, M.O.; Shuai, Y.M.; Woodcock, C.E.; Hollinger, D.Y.; Fitzjarrald, D.R. Evaluation of MODIS Albedo Product (MCD43A) over Grassland, Agriculture and Forest Surface Types During Dormant and Snow-Covered Periods. Remote Sens. Environ. 2014, 140, 60–77. [Google Scholar] [CrossRef] [Green Version]
  62. Jin, Y.F.; Schaaf, C.B.; Gao, F.; Li, X.W.; Strahler, A.H.; Lucht, W.; Liang, S.L. Consistency of MODIS Surface Bidirectional Reflectance Distribution Function and Albedo Retrievals: 1. Algorithm Performance. J. Geophys. Res. Atmos. 2003, 108, 4158. [Google Scholar] [CrossRef]
  63. Fang, H.; Ye, Y.; Liu, W.; Wei, S.; Ma, L. Continuous Estimation of Canopy Leaf Area Index (LAI) and Clumping Index over Broadleaf Crop Fields: An Investigation of the PASTIS-57 Instrument and Smartphone Applications. Agr. Forest Meteorol. 2018, 253, 48–61. [Google Scholar] [CrossRef]
  64. Fang, H.; Li, W.; Wei, S.; Jiang, C. Seasonal Variation of Leaf Area Index (LAI) Over Paddy Rice Fields in NE China: Intercomparison of Destructive Sampling, LAI-2200, Digital Hemispherical Photography (DHP), and AccuPAR Methods. Agr. Forest Meteorol. 2014, 198, 126–141. [Google Scholar] [CrossRef]
  65. Jiao, Z.T.; Hill, M.J.; Schaaf, C.B.; Zhang, H.; Wang, Z.S.; Li, X.W. An Anisotropic Flat Index (AFX) to Derive BRDF Archetypes from MODIS. Remote Sens. Environ. 2014, 141, 168–187. [Google Scholar] [CrossRef]
  66. Weiss, M.; Baret, F.; Myneni, R.B.; Pragnere, A.; Knyazikhin, Y. Investigation of a Model Inversion Technique to Estimate Canopy Biophysical Variables from Spectral and Directional Reflectance Data. Agronomie 2000, 20, 3–22. [Google Scholar] [CrossRef]
  67. Jacquemoud, S.; Bacour, C.; Poilve, H.; Frangi, J.P. Comparison of Four Radiative Transfer Models to Simulate Plant Canopies Reflectance: Direct and Inverse Mode. Remote Sens. Environ. 2000, 74, 471–481. [Google Scholar] [CrossRef]
  68. Saltelli, A. Sensitivity Analysis: Could Better Methods be Used? J. Geophys. Res. Atmos. 1999, 104, 3789–3793. [Google Scholar] [CrossRef]
  69. Chen, J.M.; Cihlar, J. A Hotspot Function in a Simple Bidirectional Reflectance Model for Satellite Applications. J. Geophys. Res. Atmosph. 1997, 102, 25907–25913. [Google Scholar] [CrossRef]
  70. Chappell, A.; Zobeck, T.M.; Brunner, G. Using Bi-Directional Soil Spectral Reflectance to Model Soil Surface Changes Induced by Rainfall and Wind-Tunnel Abrasion. Remote Sens. Environ. 2006, 102, 328–343. [Google Scholar] [CrossRef]
  71. Liu, J.C.; Schaaf, C.B.; Strahler, A.H.; Jiao, Z.T.; Shuai, Y.M.; Zhang, Q.L.; Roman, M.O.; Augustine, J.A.; Dutton, E.G. Validation of Moderate Resolution Imaging Spectroradiometer (MODIS) Albedo Retrieval Algorithm: Dependence of Albedo on Solar Zenith Angle. J. Geophys. Res. Atmos. 2009, 114, 1–11. [Google Scholar] [CrossRef]
  72. Chang, Y.X.; Jiao, Z.T.; Zhang, X.N.; Mei, L.L.; Dong, Y.D.; Yin, S.Y.; Cui, L.; Ding, A.X.; Guo, J.; Xie, R.; et al. Assessment of Improved Ross-Li BRDF Models Emphasizing Albedo Estimates at Large Solar Angles Using POLDER Data. IEEE Trans. Geosci. Remote Sens. 2021, 59, 9968–9986. [Google Scholar] [CrossRef]
  73. Widlowski, J.L.; Mio, C.; Disney, M.; Adams, J.; Andredakis, I.; Atzberger, C.; Brennan, J.; Busetto, L.; Chelle, M.; Ceccherini, G.; et al. The Fourth Phase of the Radiative Transfer Model Intercomparison (RAMI) Exercise: Actual Canopy Scenarios and Conformity Testing. Remote Sens. Environ. 2015, 169, 418–437. [Google Scholar] [CrossRef]
  74. Kuusk, A. A Two-Layer Canopy Reflectance Model. J. Quant. Spectrosc. Ra. 2001, 71, 1–9. [Google Scholar] [CrossRef]
  75. Leblanc, S.G.; Chen, J.M. A Windows Graphic User Interface (GUI) for the Five-Scale Model for Fast BRDF Simulations. Remote. Sens. Rev. 2000, 19, 293–305. [Google Scholar] [CrossRef]
  76. Gastellu-Etchegorry, J.P.; Lauret, N.; Yin, T.G.; Landier, L.; Kallel, A.; Malenovsky, Z.; Al Bitar, A.; Aval, J.; Benhmida, S.; Qi, J.B.; et al. DART: Recent Advances in Remote Sensing Data Modeling with Atmosphere, Polarization, and Chlorophyll Fluorescence. IEEE J. Sel. Top. Appl. Earth Obs. Remote Sens. 2017, 10, 2640–2649. [Google Scholar] [CrossRef]
  77. Qi, J.; Xie, D.; Yin, T.; Yan, G.; Gastellu-Etchegorry, J.; Li, L.; Zhang, W.; Mu, X.; Norford, L.K. LESS: Large-Scale Remote Sensing Data and Image Simulation Framework over Heterogeneous 3D Scenes. Remote Sens. Environ. 2019, 221, 695–706. [Google Scholar] [CrossRef]
  78. Rahman, H.; Verstraete, M.M.; Pinty, B. Coupled Surface-Atmosphere Reflectance (CSAR) Model. 1. Model Description and Inversion on Synthetic Data. J. Geophys. Res. Atmosph. 1993, 98, 20779–20789. [Google Scholar] [CrossRef]
  79. Li, X.W.; Strahler, A.H.; Friedl, M.A. A Conceptual Model for Effective Directional Emissivity from Nonisothermal Surfaces. IEEE Trans. Geosci. Remote Sens. 1999, 37, 2508–2517. [Google Scholar]
  80. Huang, H.; Qin, W.; Liu, Q. Rapid: A Radiosity Applicable to Porous Individual Objects for Directional Reflectance over Complex Vegetated Scenes. Remote Sens. Environ. 2013, 132, 221–237. [Google Scholar] [CrossRef]
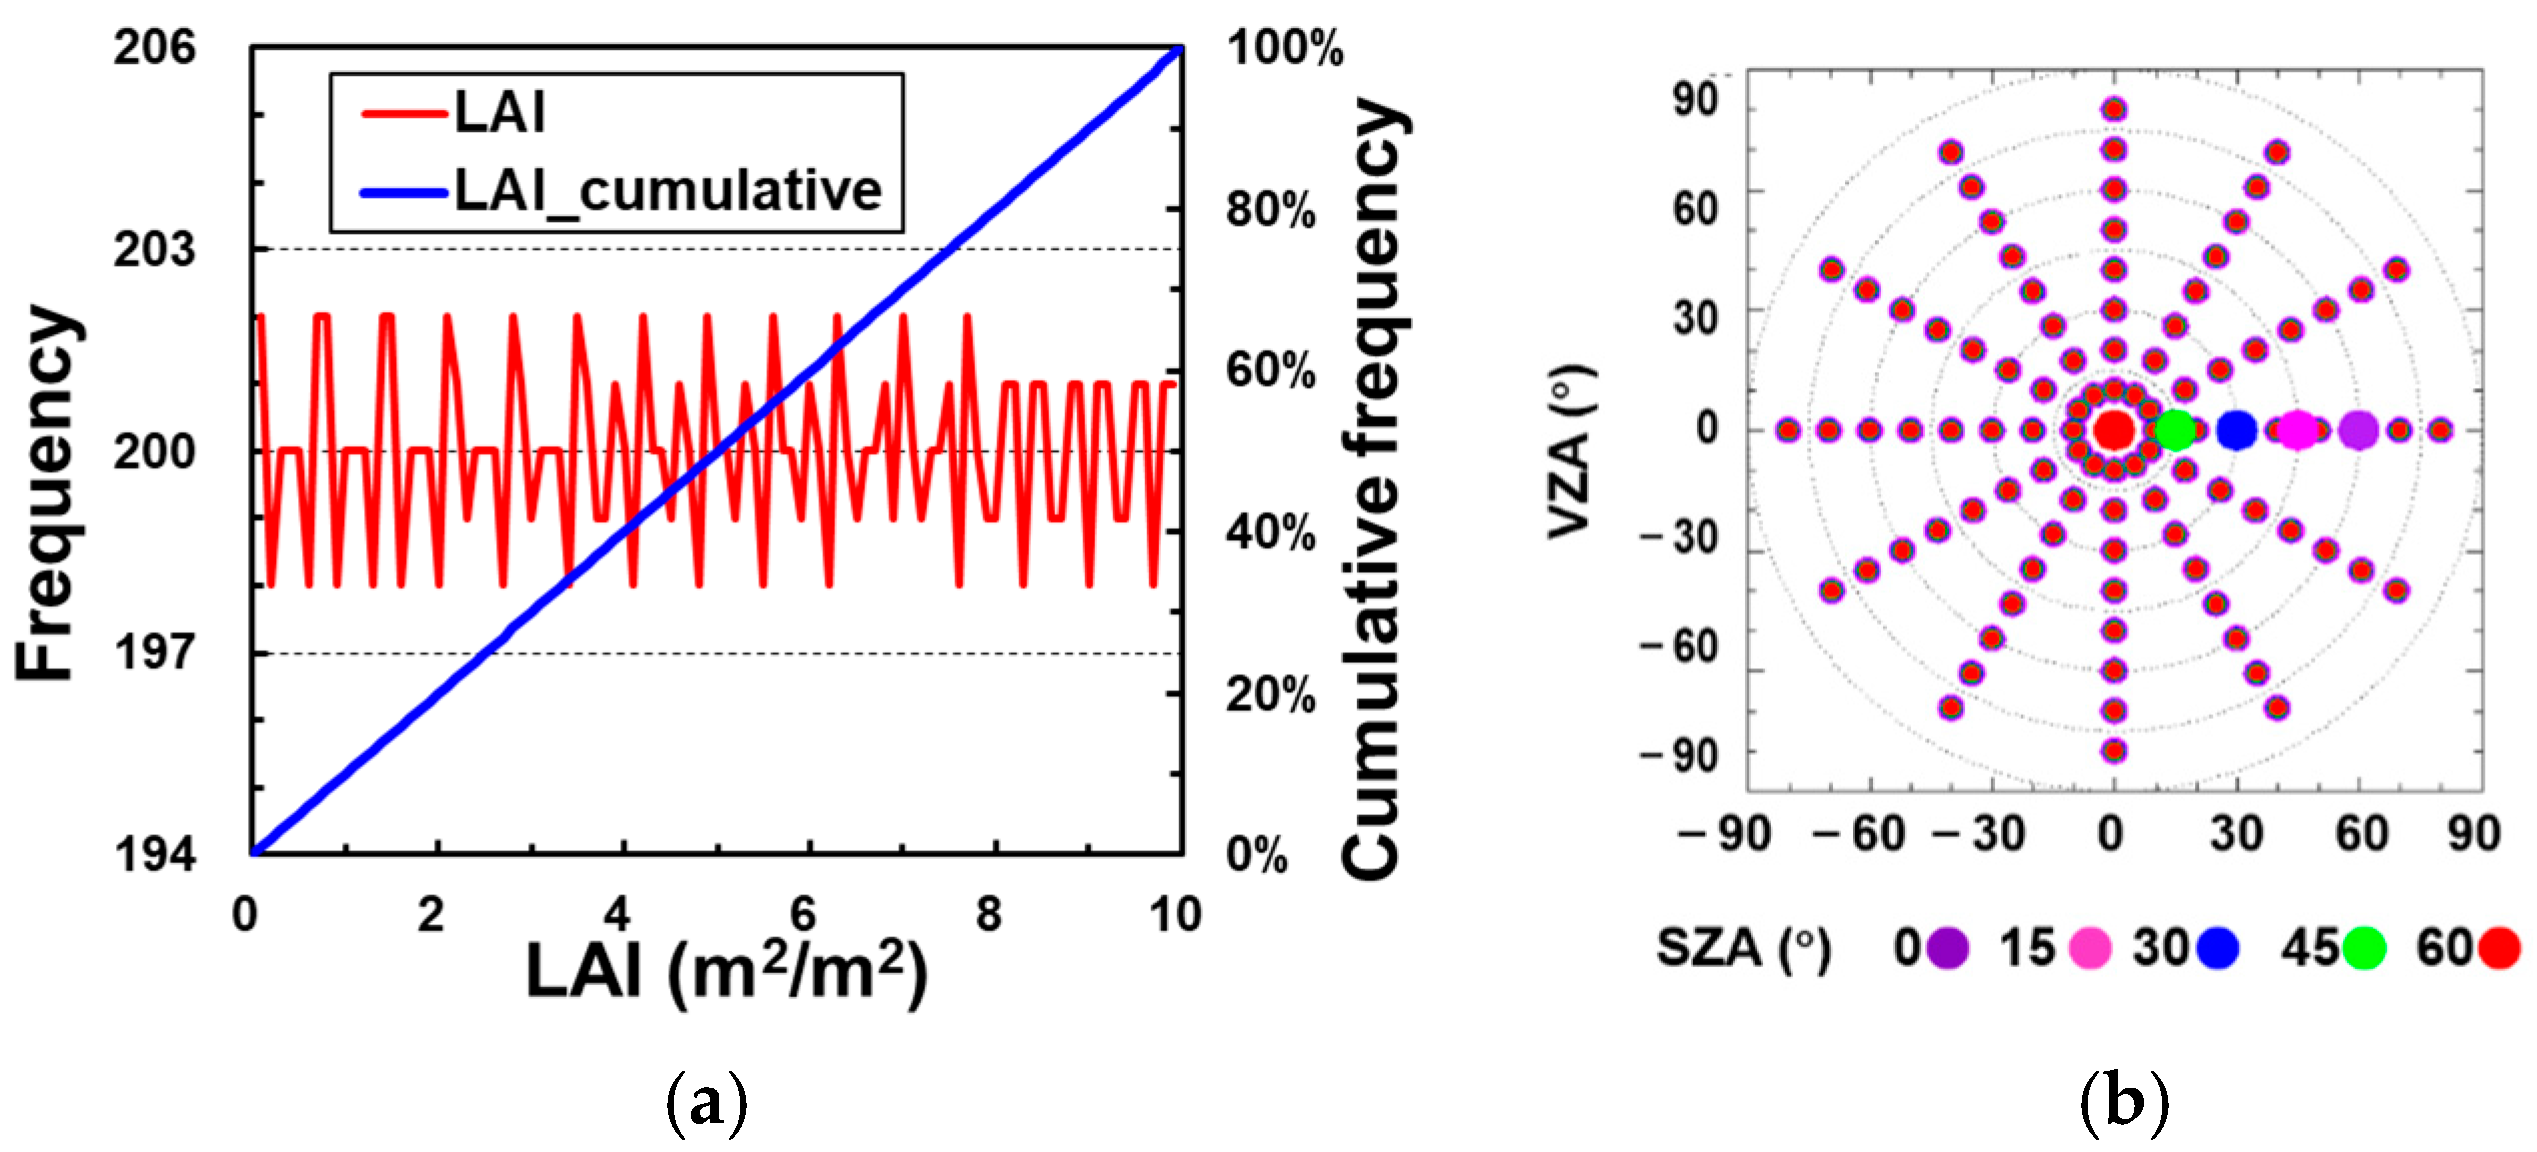
Figure 1. Distribution of the vegetation parameters and observation geometry for the PROSAIL simulations: (a) uniform distribution of the LAI; (b) angle sampling of the PROSAIL simulations.
Remotesensing 13 04911 g001
Figure 2. Flowchart of vegetation parameter estimation by linking the PROSAIL and Ross-Li BRDF models using the MODIS BRDF parameter product.
Remotesensing 13 04911 g002
Figure 3. Global sensitivity of the BRDF variables to the vegetation parameters: (a) red band; (b) NIR band.
Remotesensing 13 04911 g003
Figure 4. Regression and evaluation of the linear relationships between the ALA and fvol in the NIR band: (a) the optimal linear regression relationships based on the modelling data; (b) comparison of the estimated ALA to the reference value based on the independent evaluation data.
Remotesensing 13 04911 g004
Figure 5. Comparison of the estimated LAI values to the field-measured data for paddy rice in Honghe (ad), for maize, soybean, and sorghum in Hailun (eh), and for all crops (il). The colors indicate the different observation dates. The estimated LAIs in the four columns from left to right are obtained based on the wide search method, the wide search method using local search data, the local search method, and the fused results from the wide and local search methods.
Remotesensing 13 04911 g005
Figure 6. Comparison of the estimated LAI values to the field-measured data for the MODIS BRDF parameters of different qualities: (a,b) refer to the results for the wide search method based on BRDF data retrieved by the main algorithm (QA = 0/1) and backup algorithm (QA = 2/3), respectively, and the total number of data points is 180; (c,d) are similar to (a,b) but for the local search method, and the total number of data points is 103.
Remotesensing 13 04911 g006
Figure 7. Comparison of the estimated LAI values to the field-measured data for paddy rice in Honghe (ad), for maize, soybean, and sorghum in Hailun (eh), and for all crops (il) based on MODIS BRDF parameters with high quality. The colours indicate the different observation dates. The estimated LAIs in the four columns from left to right are obtained based on the wide search method, the wide search method using local search data, the local search method, and the fused results from the wide and local search methods.
Remotesensing 13 04911 g007
Figure 8. Application process of the proposed method in this study for LAI estimation with the MODIS BRDF parameter product.
Remotesensing 13 04911 g008
Figure 9. Comparison of the estimated LAIs to the upscaled reference LAI maps: (a,b) show the results at 500 m in Honghe (a) and Hailun (b); (ce) show the results for 3 × 3 MODIS pixels at 1.5 km in Honghe (c), Hailun (d), and both sites (e). The colours indicate the different observation dates.
Remotesensing 13 04911 g009
Table 1. The input parameters of the PROSAIL model.
ParametersUnitCommon ValueSearch Range (Step)
Leaf scale
leaf structure parameter (Ns)--1.51–3
chlorophyll a and b content (Cab)μg/cm25020–80
carotenoids content (Car)μg/cm212
brown pigment content (Cbrown)--0
Equivalent water thickness (Cw)cm0.0150.004–0.04
leaf mass per unit leaf area (Cm)g/cm20.0090.0019–0.0165
Canopy scale
leaf area index (LAI)m2/m23.50–10
average leaf angle (ALA)degrees (°)5010–85
hot spot (Hspot)--0.2
soil coefficient (Psoil)--0.1 [0,1]0–1
diffuse/direct radiation (SKYL)%0
Observation geometry
solar zenith angle (SZA)degrees (°)300–60 (15)
view zenith angle (VZA)degrees (°)00–80 (10)
relative azimuth angle (RAA (φ))degrees (°)00–330 (30)
Table 2. The best C1 and C2 for MODIS in seven common bands.
Band (nm)645858469555124016402130
C10.50.50.40.50.40.40.4
C2 (°)3.43.03.83.14.54.54.5
Table 3. Regression coefficients and accuracies of the linear relationships between the ALA and fvol in the NIR band.
Data for Linear Modelling
(90%, ALA = a × fvol_NIR + b)
Data for Evaluation (10%)
GroupabR2FRMSE_AllBias_AllR2_AllRMSE_HDBias_HDR2_HD
1186.66 13.87 0.98 565,079 7.35 −1.18 0.83 2.27 0.00 0.98
2186.69 13.85 0.98 584,873 6.68 −1.18 0.86 2.43 −0.10 0.98
3186.78 13.85 0.98 584,443 6.83 −1.08 0.85 2.96 −0.10 0.97
4186.54 13.88 0.98 567,284 6.53 −1.06 0.87 2.07 −0.09 0.99
5186.68 13.85 0.98 585,602 6.75 −1.05 0.85 2.95 −0.19 0.97
6186.54 13.87 0.98 568,940 6.05 −1.07 0.88 2.22 −0.13 0.98
7186.64 13.85 0.98 587,354 6.36 −1.00 0.87 2.29 −0.15 0.98
8186.59 13.86 0.98 586,356 7.10 −1.25 0.84 1.98 −0.10 0.99
9186.66 13.85 0.98 586,247 6.92 −1.17 0.85 2.10 −0.19 0.98
10186.69 13.85 0.98 585,865 6.80 −1.07 0.86 2.30 −0.08 0.98
average----0.98 580,204 6.74 −1.11 0.86 2.36 −0.11 0.98
RMSE_all, Bias_all, and R2_all denote the results for all of the evaluation data, while RMSE_HD, Bias_HD, and R2_HD denote the results for the high-density data in the scatter plot distribution between the reference ALA and estimated ALA among the evaluation data.
Table 4. Estimation accuracy of the LAI for pixel-to-plot comparison.
DatasetMethodData NumberRMSEBIASR2RRMSE(%)
HongheMODIS1101.55−0.280.1350.2
wide search1101.35−0.750.3443.7
wide search of local search data401.79−1.450.5565.0
local search by the ALA401.54−1.090.5255.9
fused results1101.23−0.620.4039.8
HailunMODIS701.59−0.100.3545.4
wide search701.64−1.090.5346.9
wide search of local search data631.73−1.240.5749.1
local search by the ALA631.58−0.420.5544.9
fused results701.50−0.360.5542.9
All cropsMODIS1801.57−0.210.2448.3
wide search1801.47−0.890.4445.3
wide search of local search data1031.75−1.320.5754.4
local search by the ALA1031.56−0.680.5448.5
fused results1801.34−0.520.4941.3
Table 5. Estimation accuracy of the LAI for pixel-to-plot comparison based on high-quality MODIS BRDF data.
DatasetMethodData NumberRMSEBIASR2RRMSE(%)
Honghewide search1101.17−0.600.3637.8
wide search of local search data171.65−1.250.5855.7
local search by the ALA171.33−0.940.6645.1
fused results1101.10−0.550.4135.8
Hailunwide search701.53−0.970.5743.5
wide search of local search data591.56−1.000.5945.0
local search by the ALA591.55−0.220.5344.8
fused results701.52−0.320.5043.4
All cropswide search1801.32−0.740.4740.6
wide search of local search data761.58−1.050.5847.2
local search by the ALA761.50−0.380.5445.0
fused results1801.28−0.460.4539.5
The four methods are the same as those in Table 4.
Publisher’s Note: MDPI stays neutral with regard to jurisdictional claims in published maps and institutional affiliations.