
Performance Analysis of Ocean Eddy Detection and Identification by L-Band Compact Polarimetric Synthetic Aperture Radar

 ,
,  ,
,
Abstract
:1. Introduction
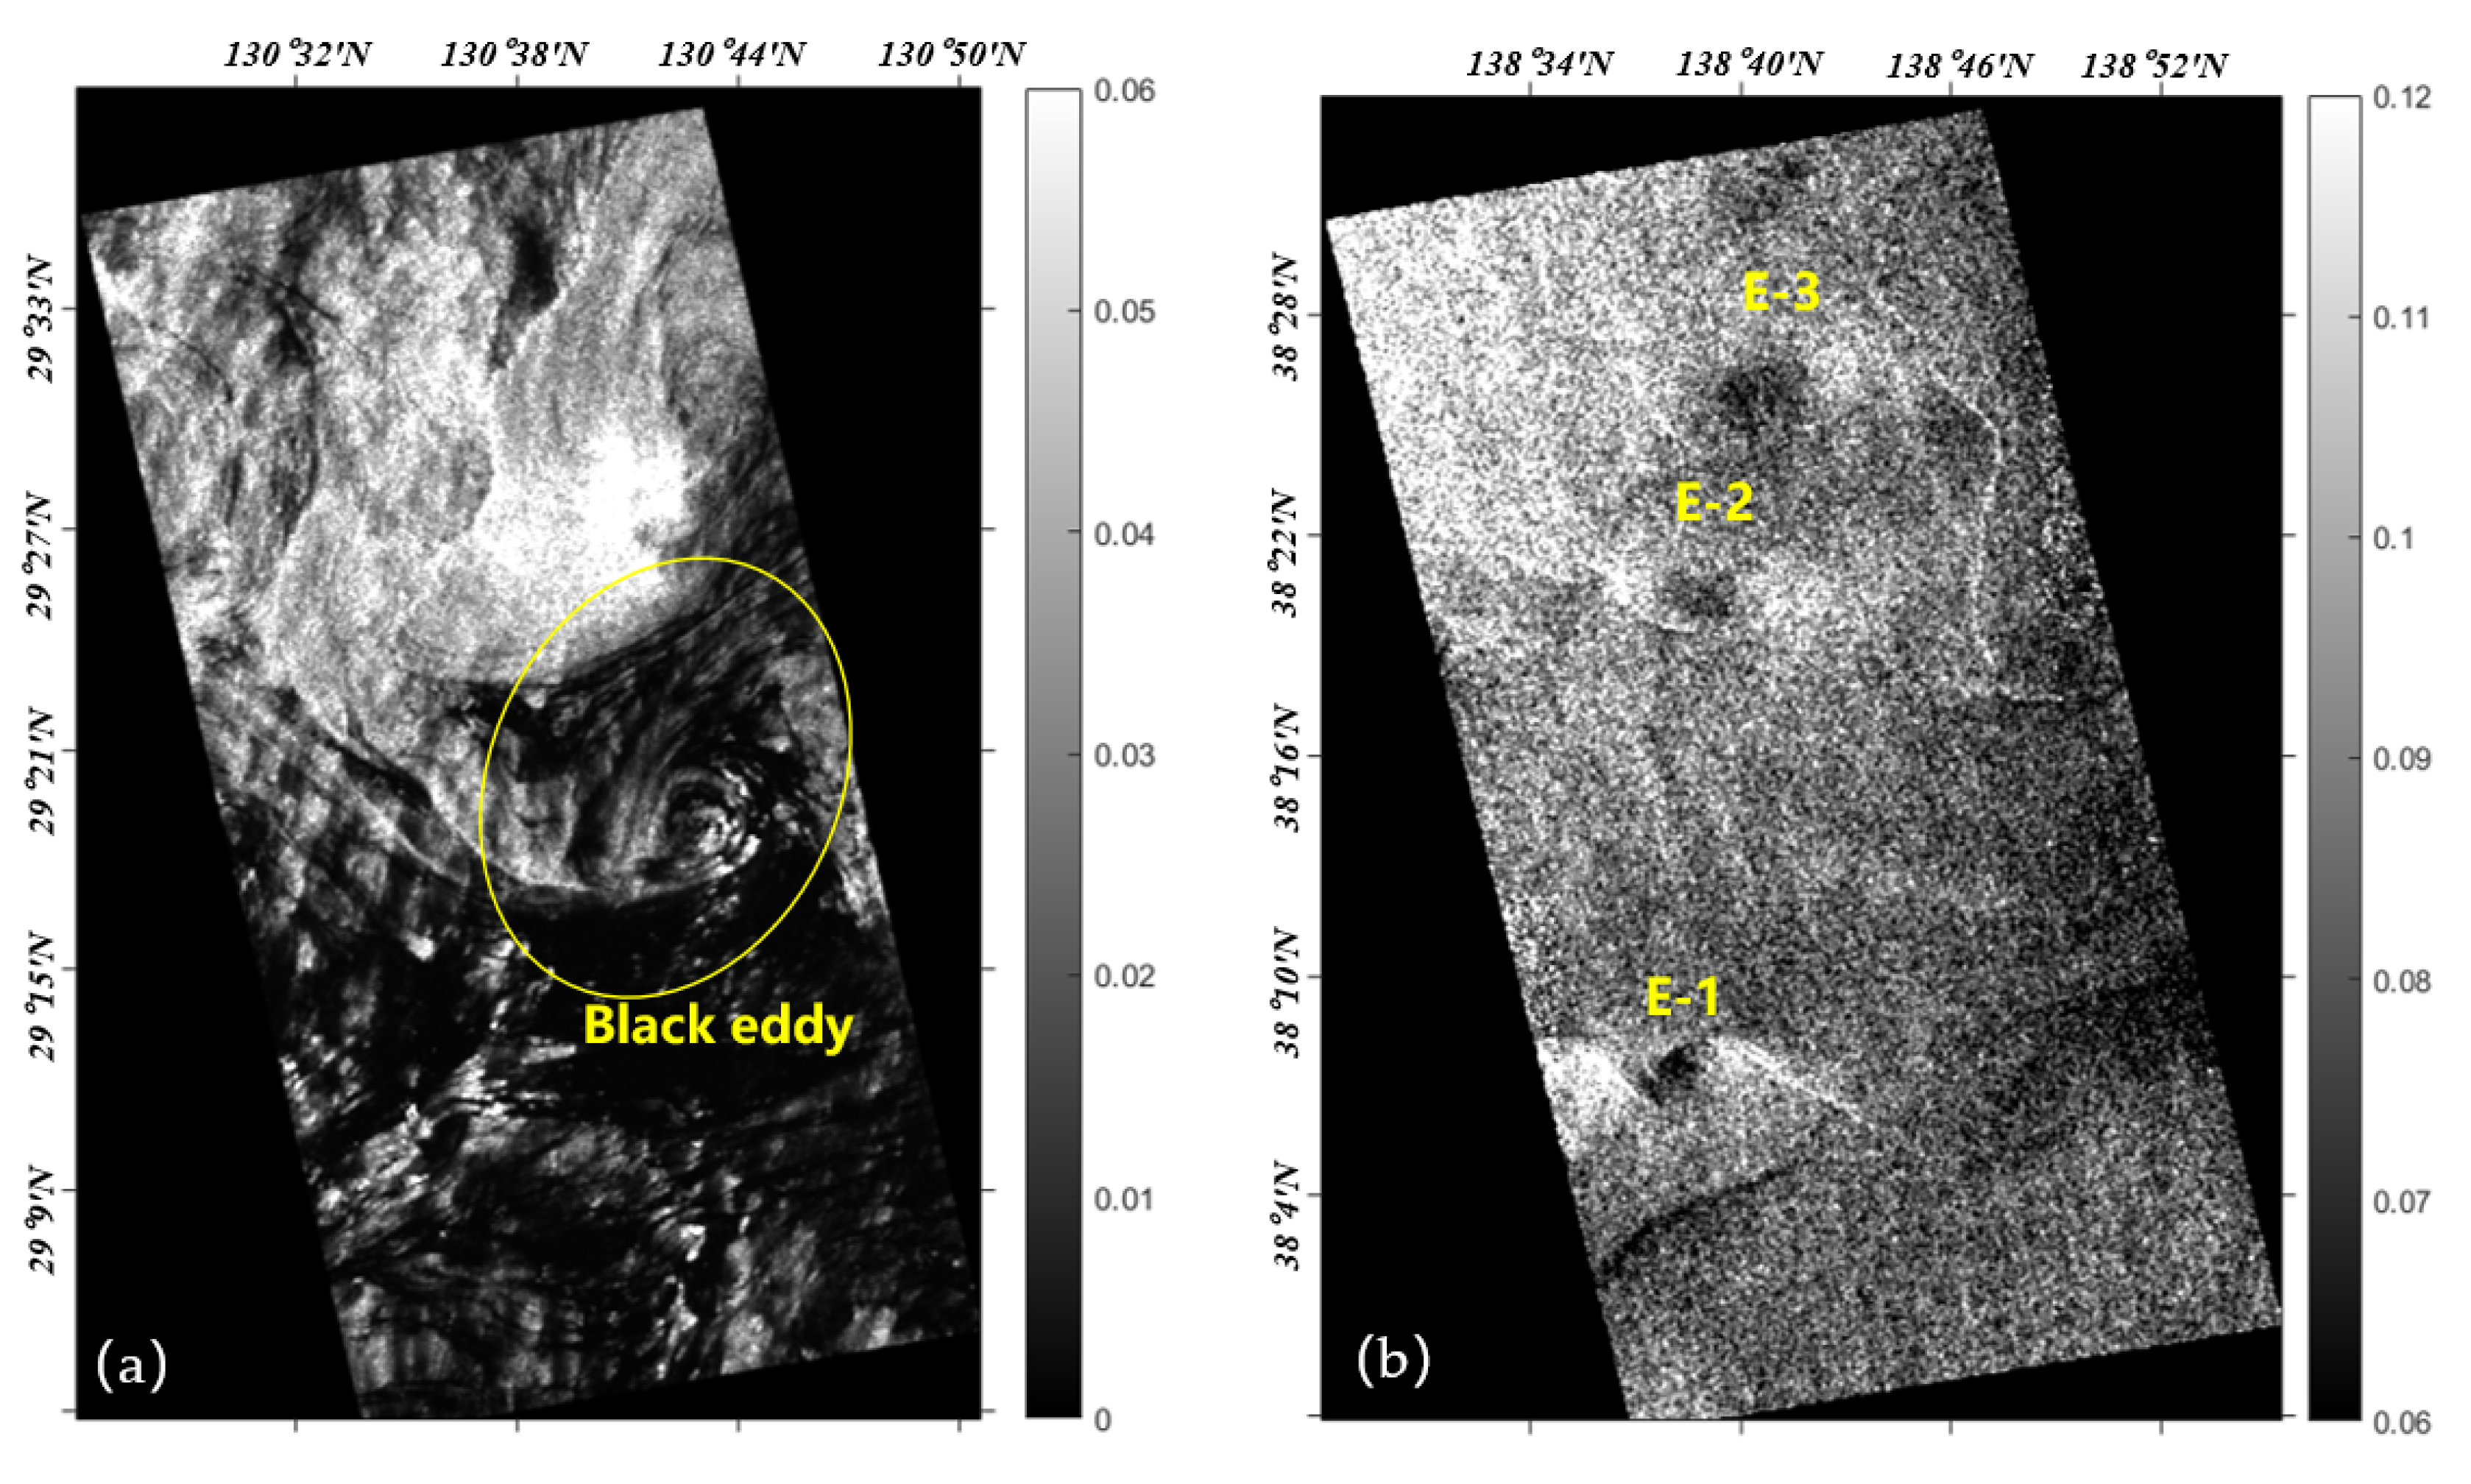
- When there are natural tracers present on the sea surface such as sea ice, plankton, and oil spills, the resulting dampening of the capillary gravity waves and reduction of sea surface fluctuations cause weakening of the SAR backscatter. Moreover, because eddies are characterized by a significant transport capacity and material entrapment, if the tracer’s area is coupled with an eddy, the tracer will show a specific spiral distribution pattern under the influence of the eddy and appear in the SAR image. As a result, the backscattering contrast difference can reach 5–10 dB, and thus the eddy can be detected by identifying the tracer [21,22]. This effect typically results in a black-colored appearance for the eddies, which are collectively referred to as “black” eddies (B-E);
- As a contrasting mechanism, the interaction of surface waves with converging and shearing surface currents results in a significant enhancement of the SAR backscatter, leading to a series of bright bands on the image that outline the contours of the eddies. These eddies are collectively referred to as “white” eddies (W-E) [23,24].
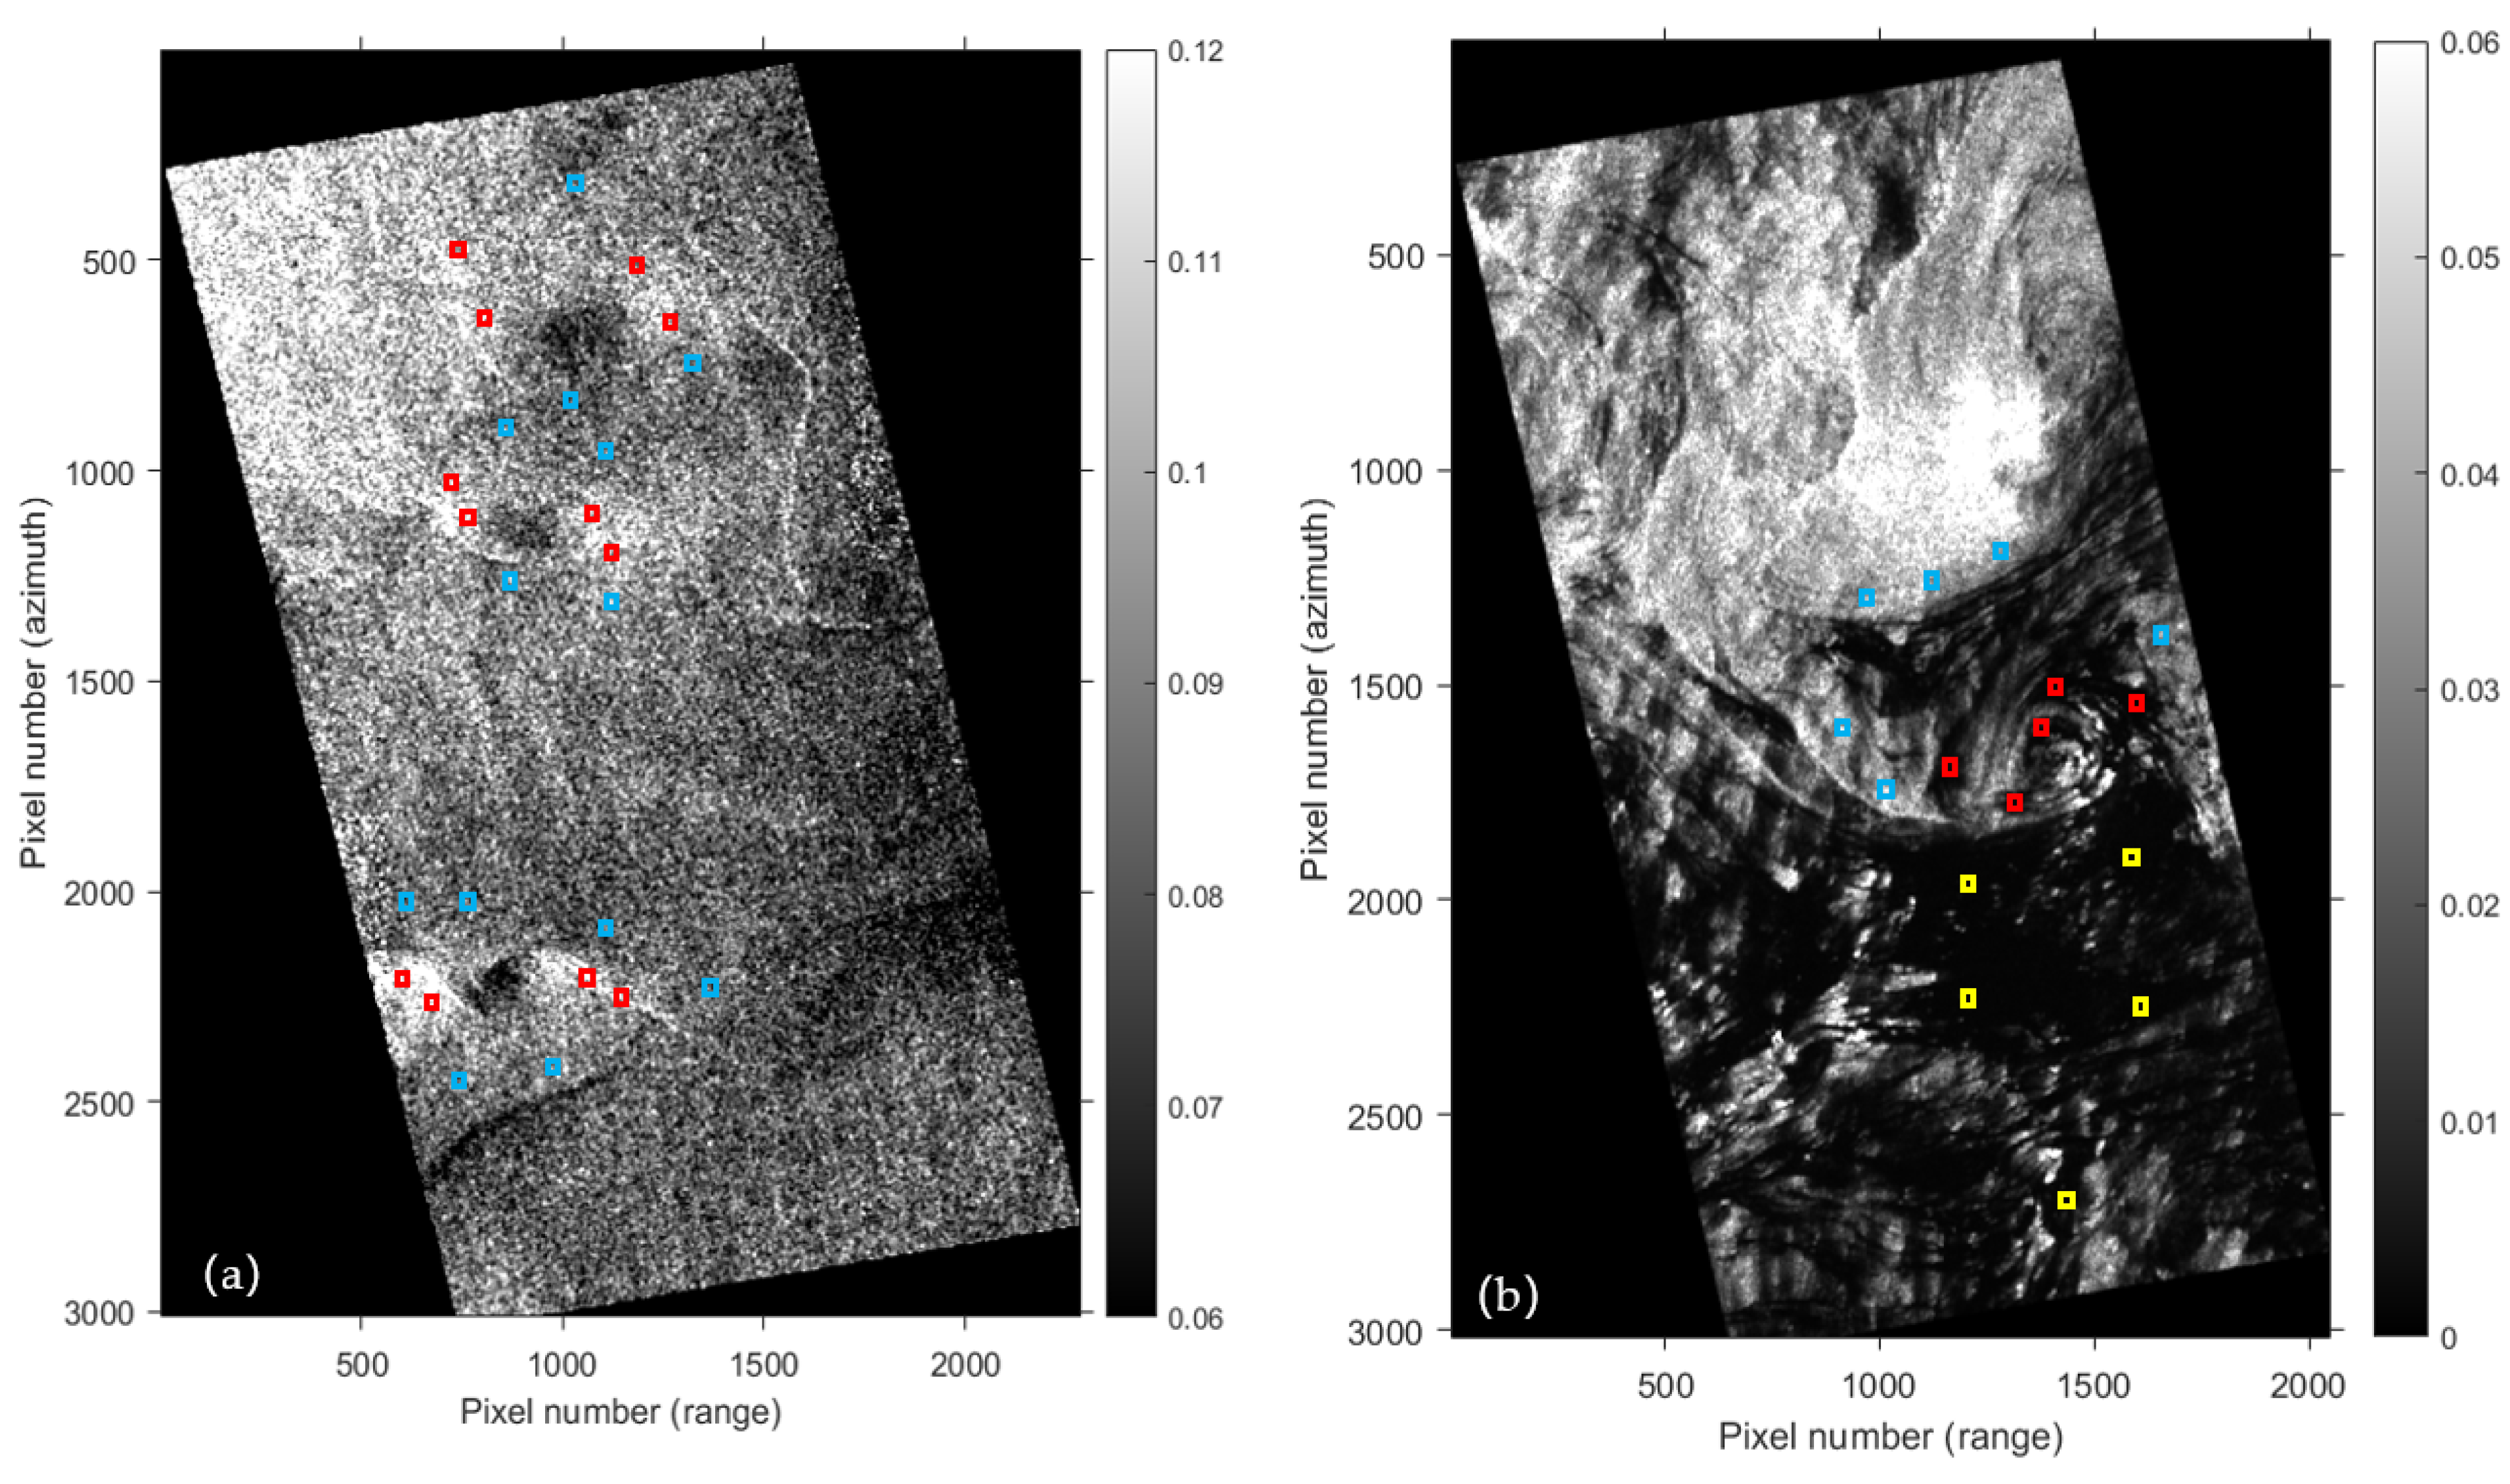
2. Data and Eddies
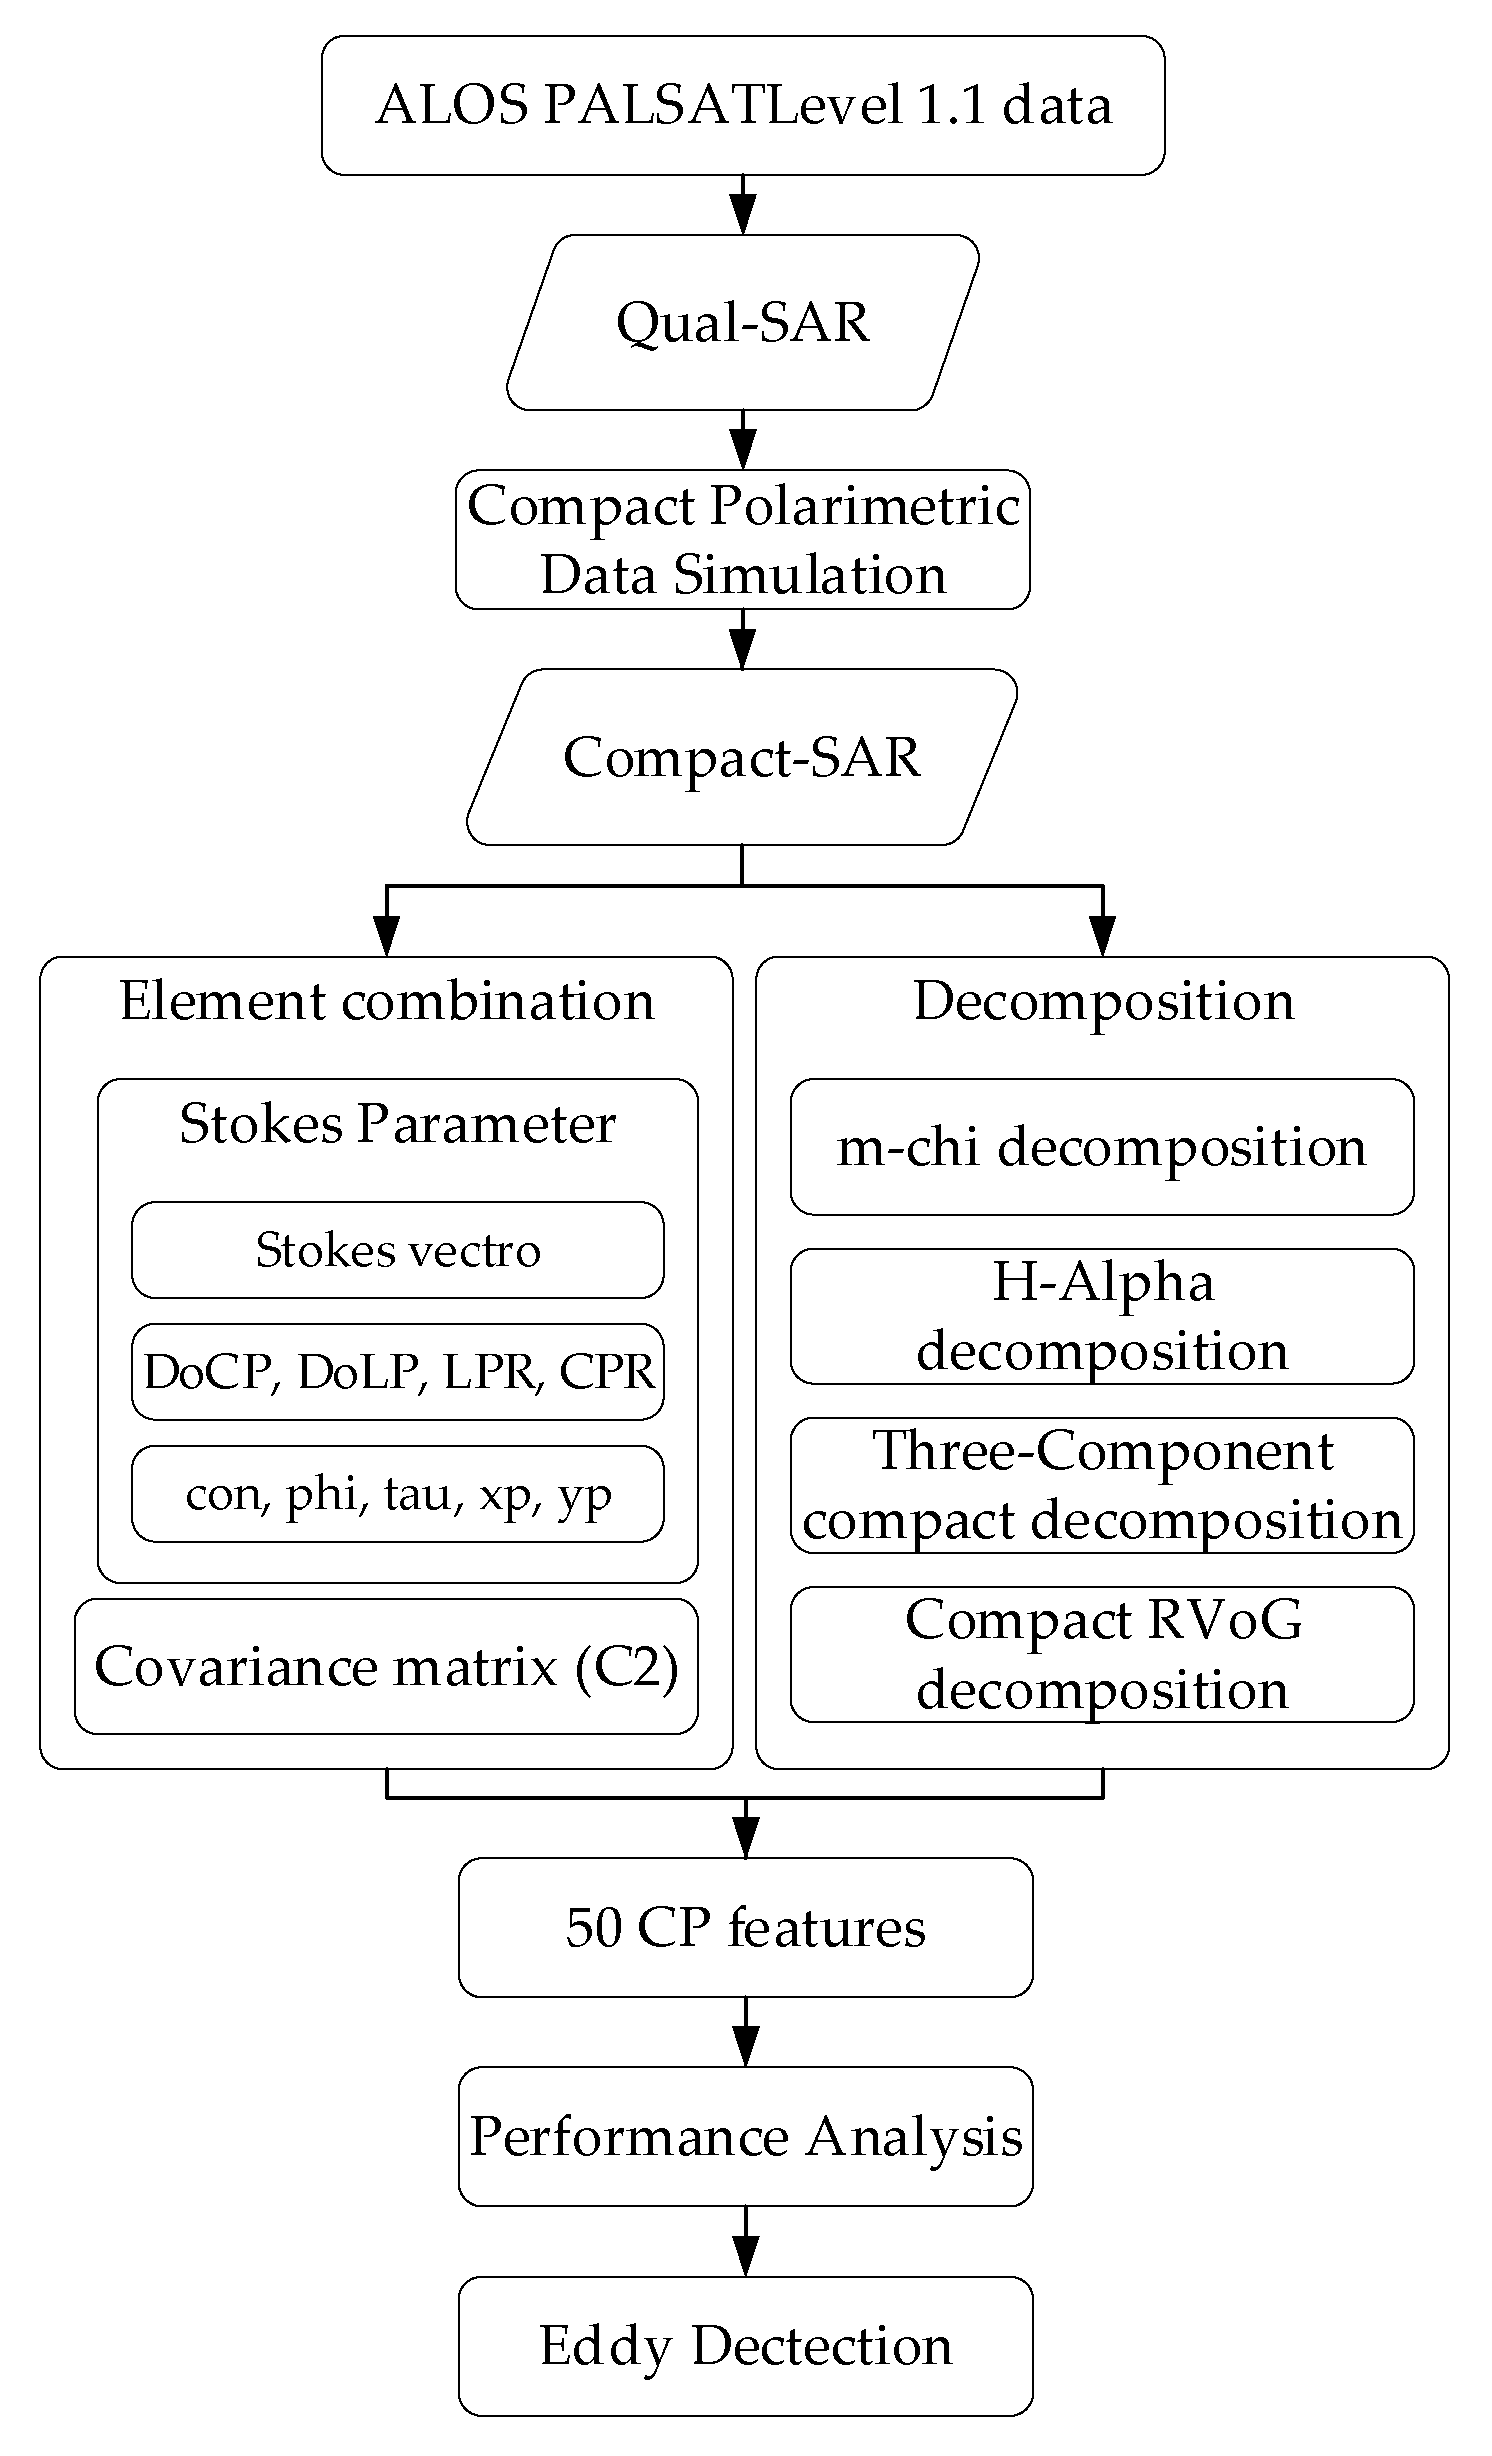
3. Compact Polarimetric SAR Data Acquisition and Feature Extraction
- The π/4 mode of transmitting 45° linearly polarized waves and receiving horizontal (H) and vertical (V) linearly polarized waves [40];
- The dual circular polarization (DCP) mode that transmits left-hand or right-hand circularly polarized waves and receives left-hand and right-hand circularly polarized waves [47];
- The hybrid polarization (HP) mode, which transmits left-handed or right-handed circularly polarized waves and receives H and V linearly polarized waves. This mode is also known as the circular transmit and linear receive (CTLR) mode [48].
3.1. Compact Polarimetric Data Simulation
3.2. Feature Extraction from Compact Polarimetric SAR Data
3.2.1. Polarimetric Decomposition Based on Stokes Parameters
3.2.2. m-χ Decomposition
3.2.3. H/α Decomposition
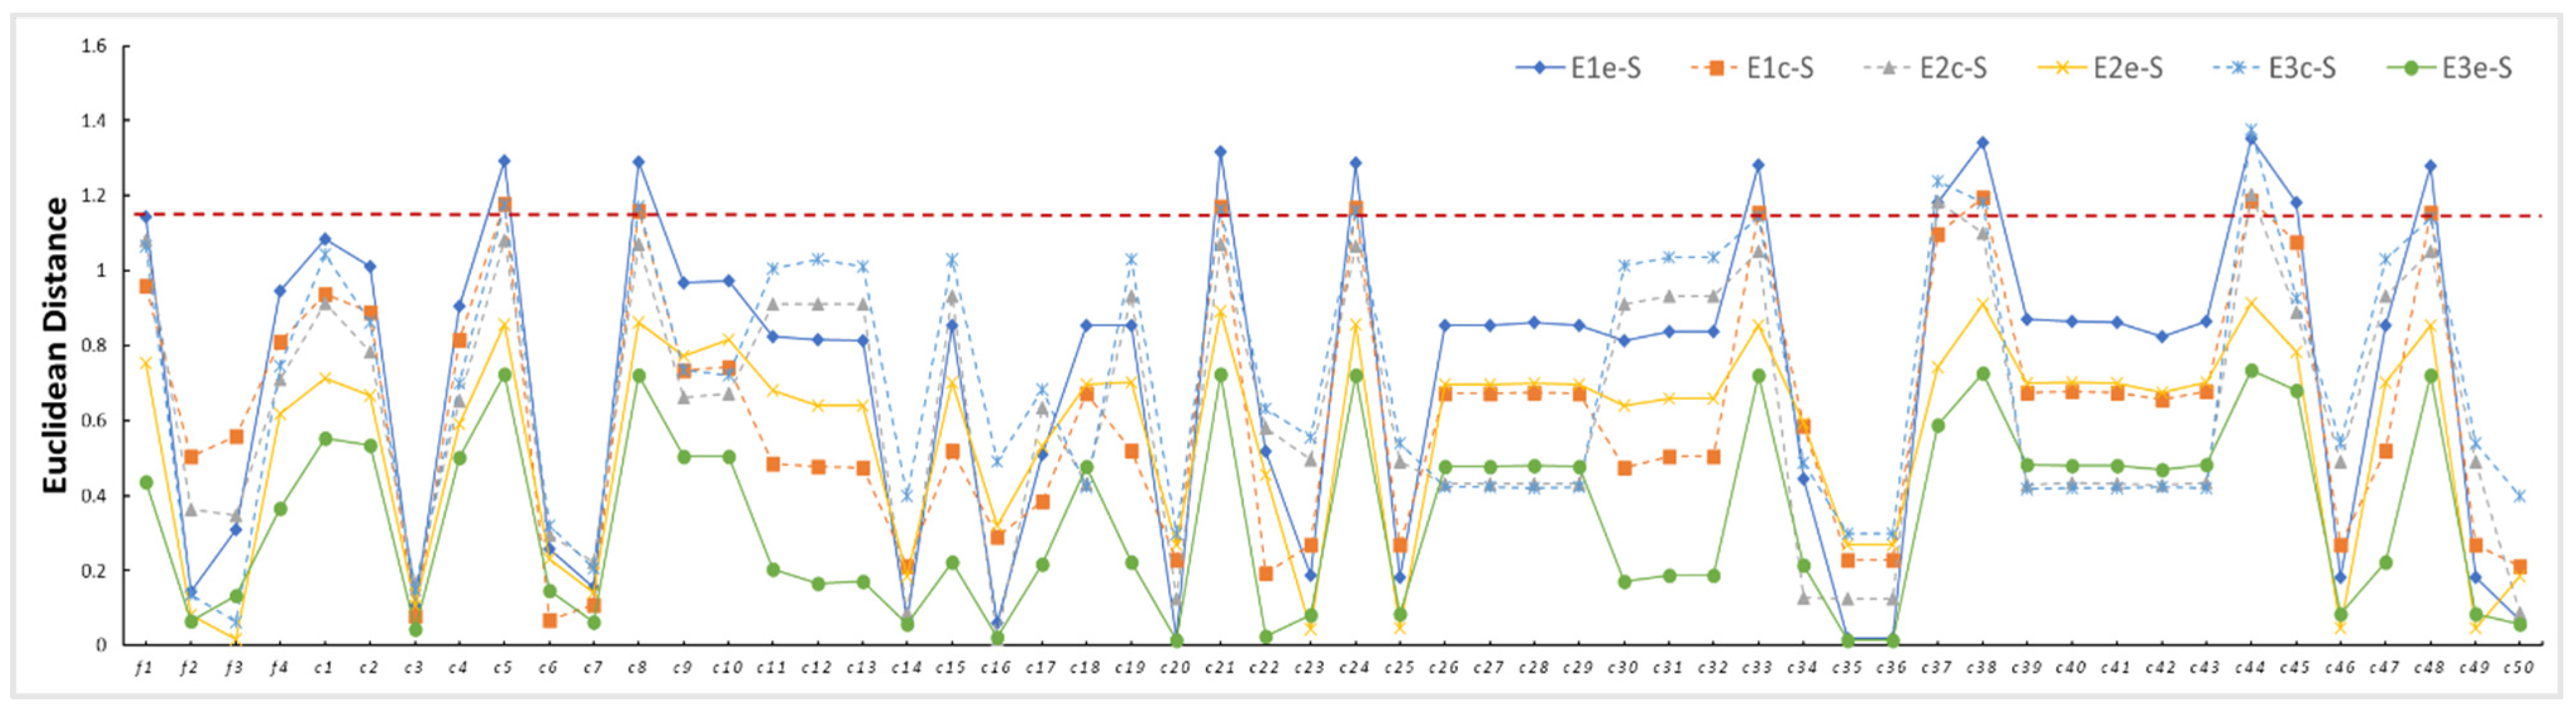
4. Comprehensive Quantification and Evaluation of CP Features for Eddy Detection
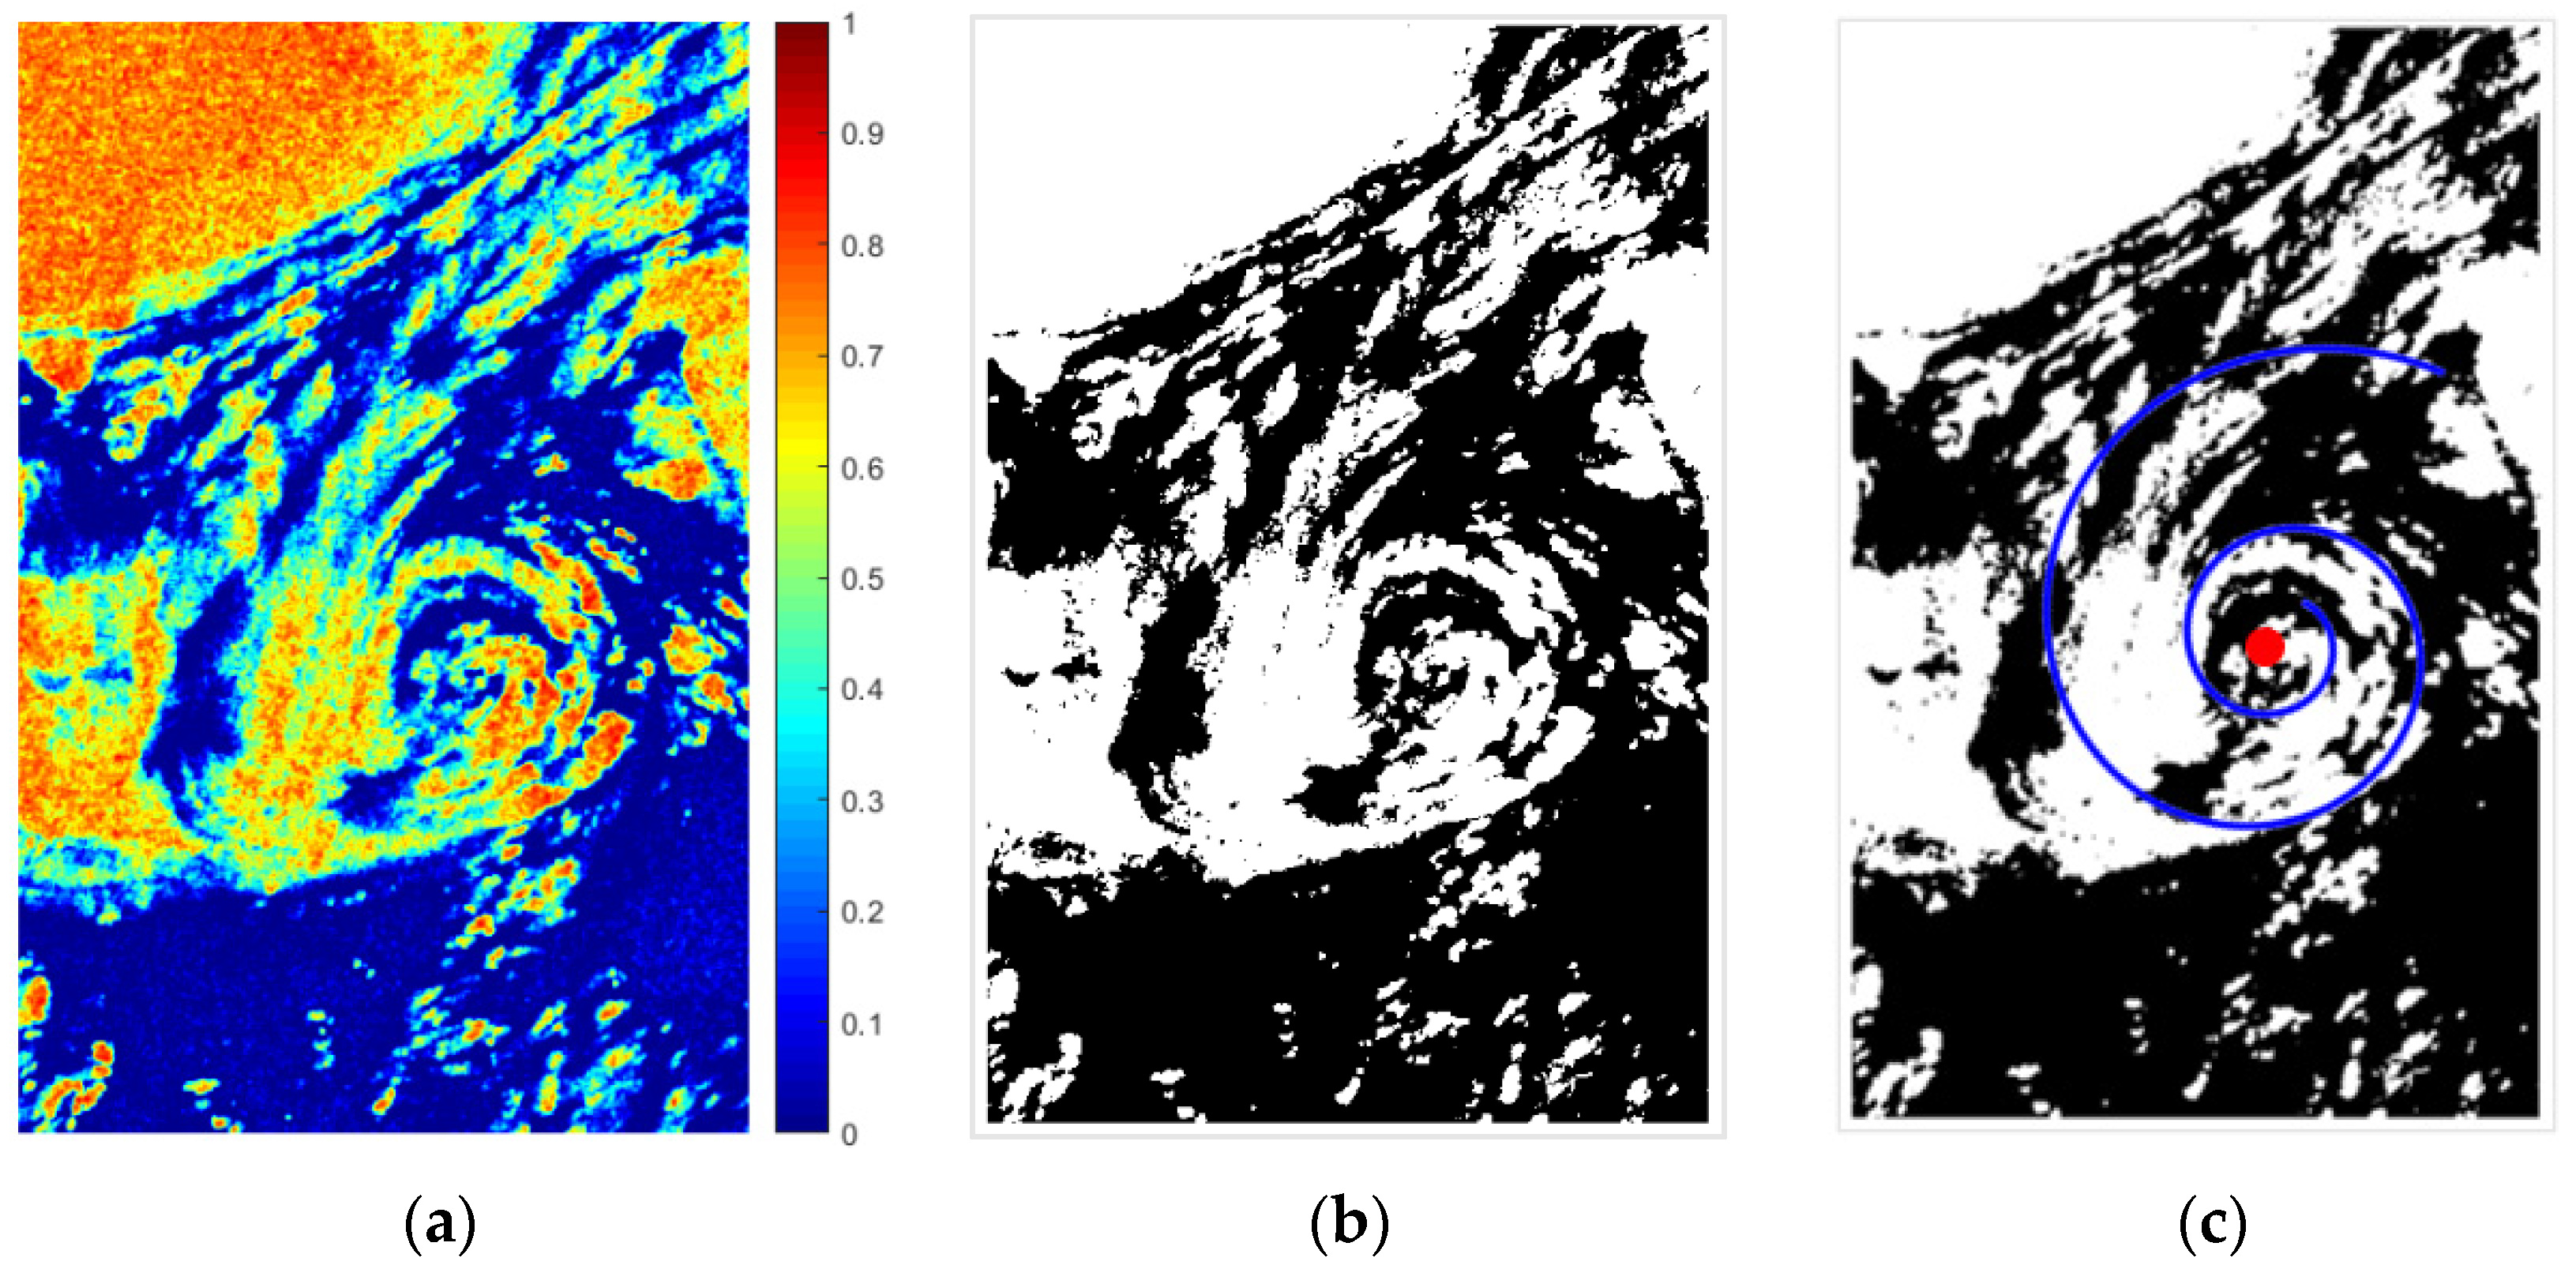
4.1. Method and Sample Selection
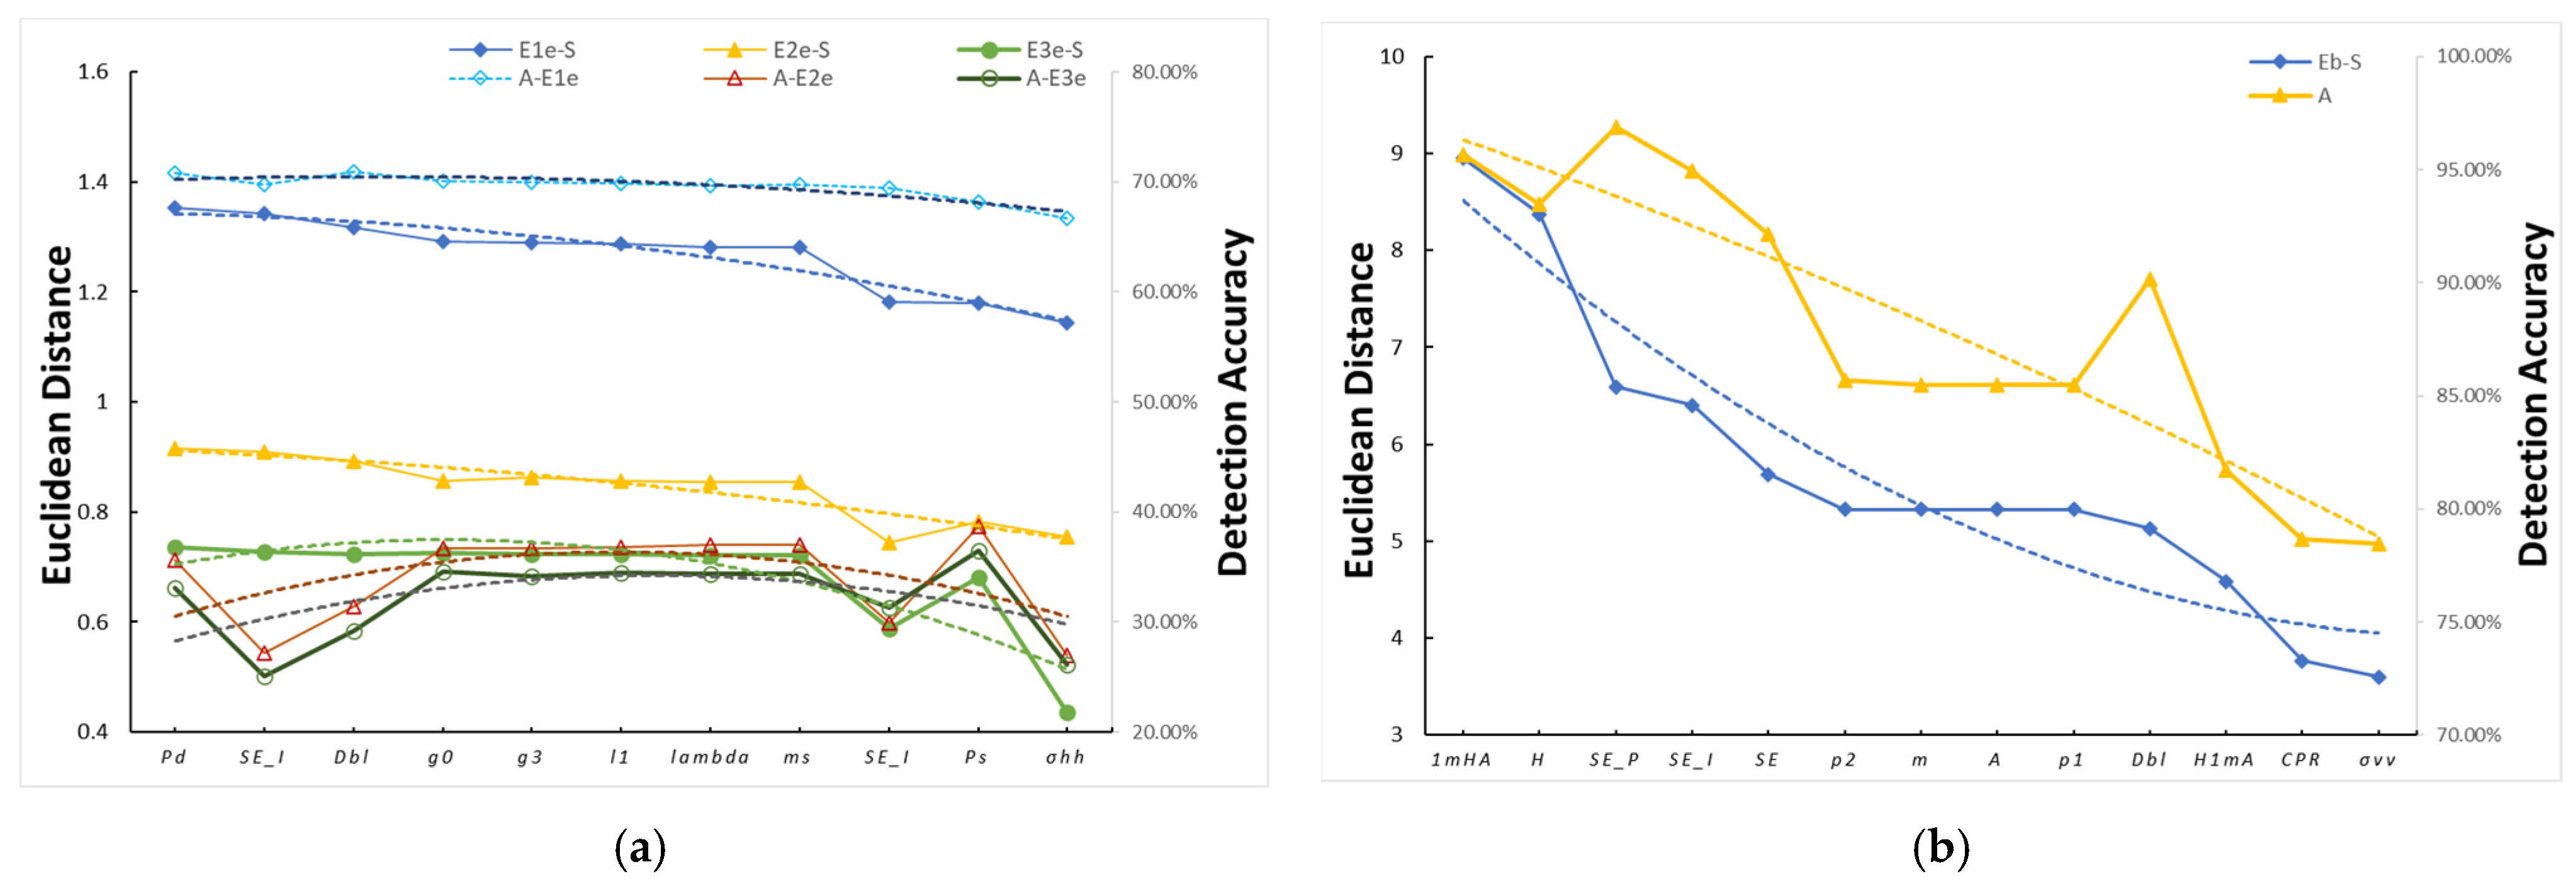
4.2. Evaluation of Different Features by Euclidean Distance
4.2.1. White Eddy
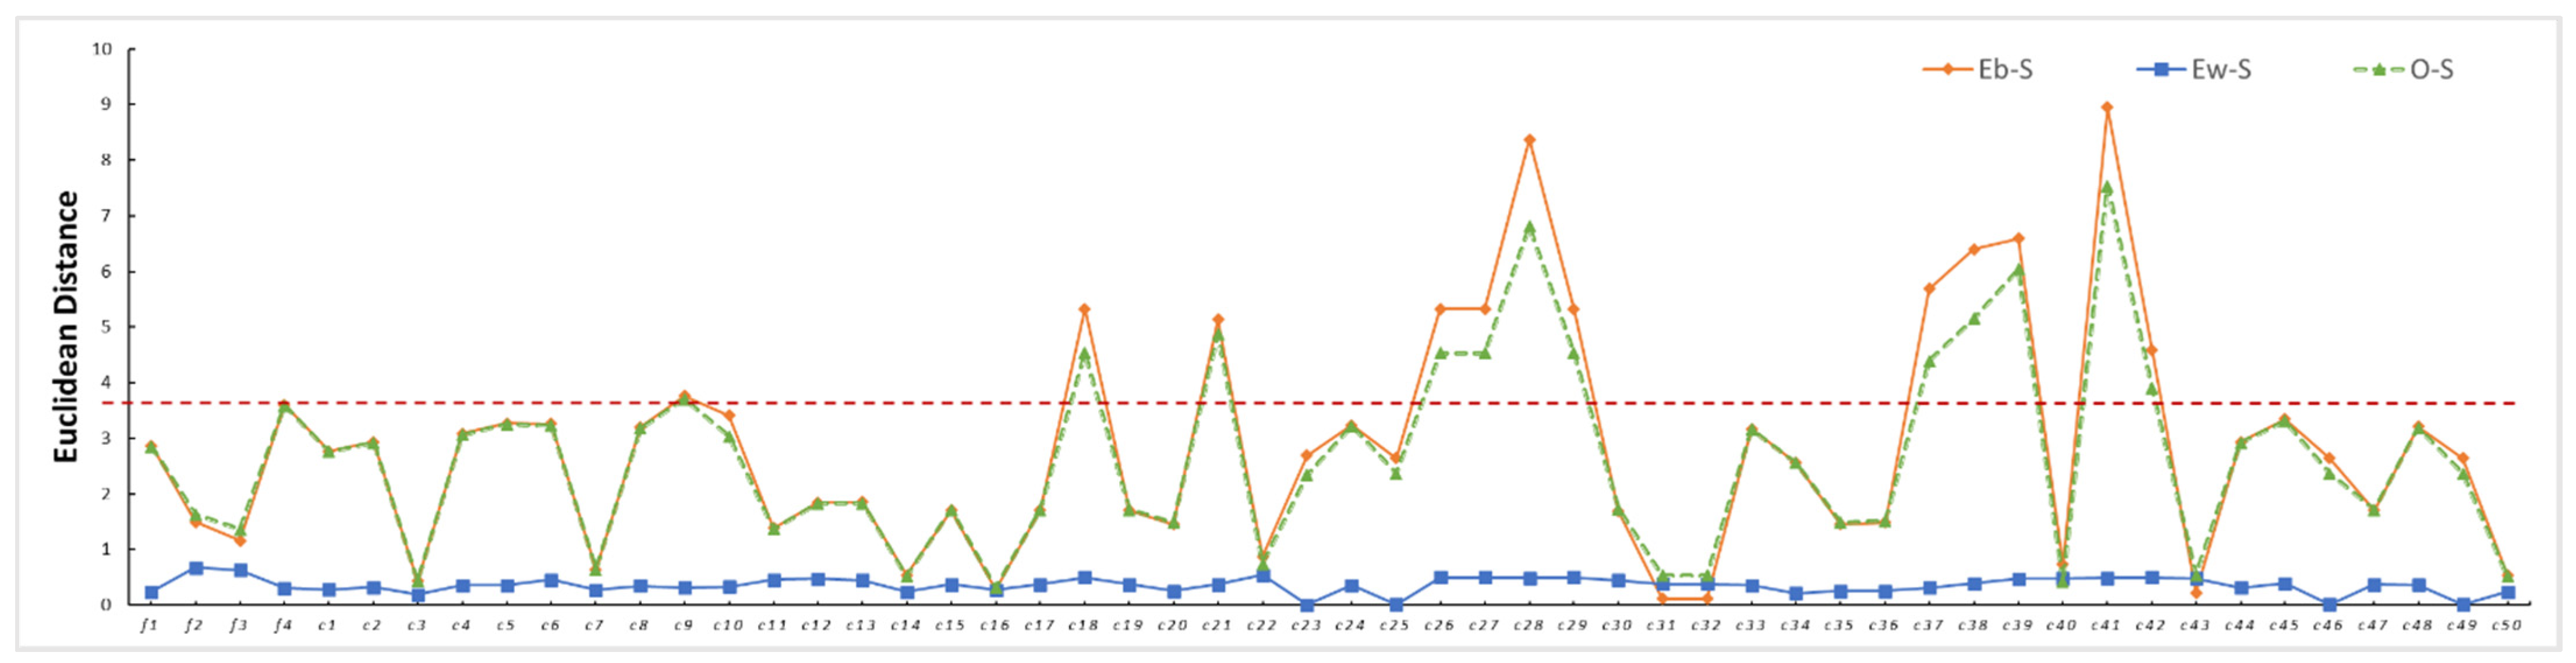
4.2.2. Black Eddy
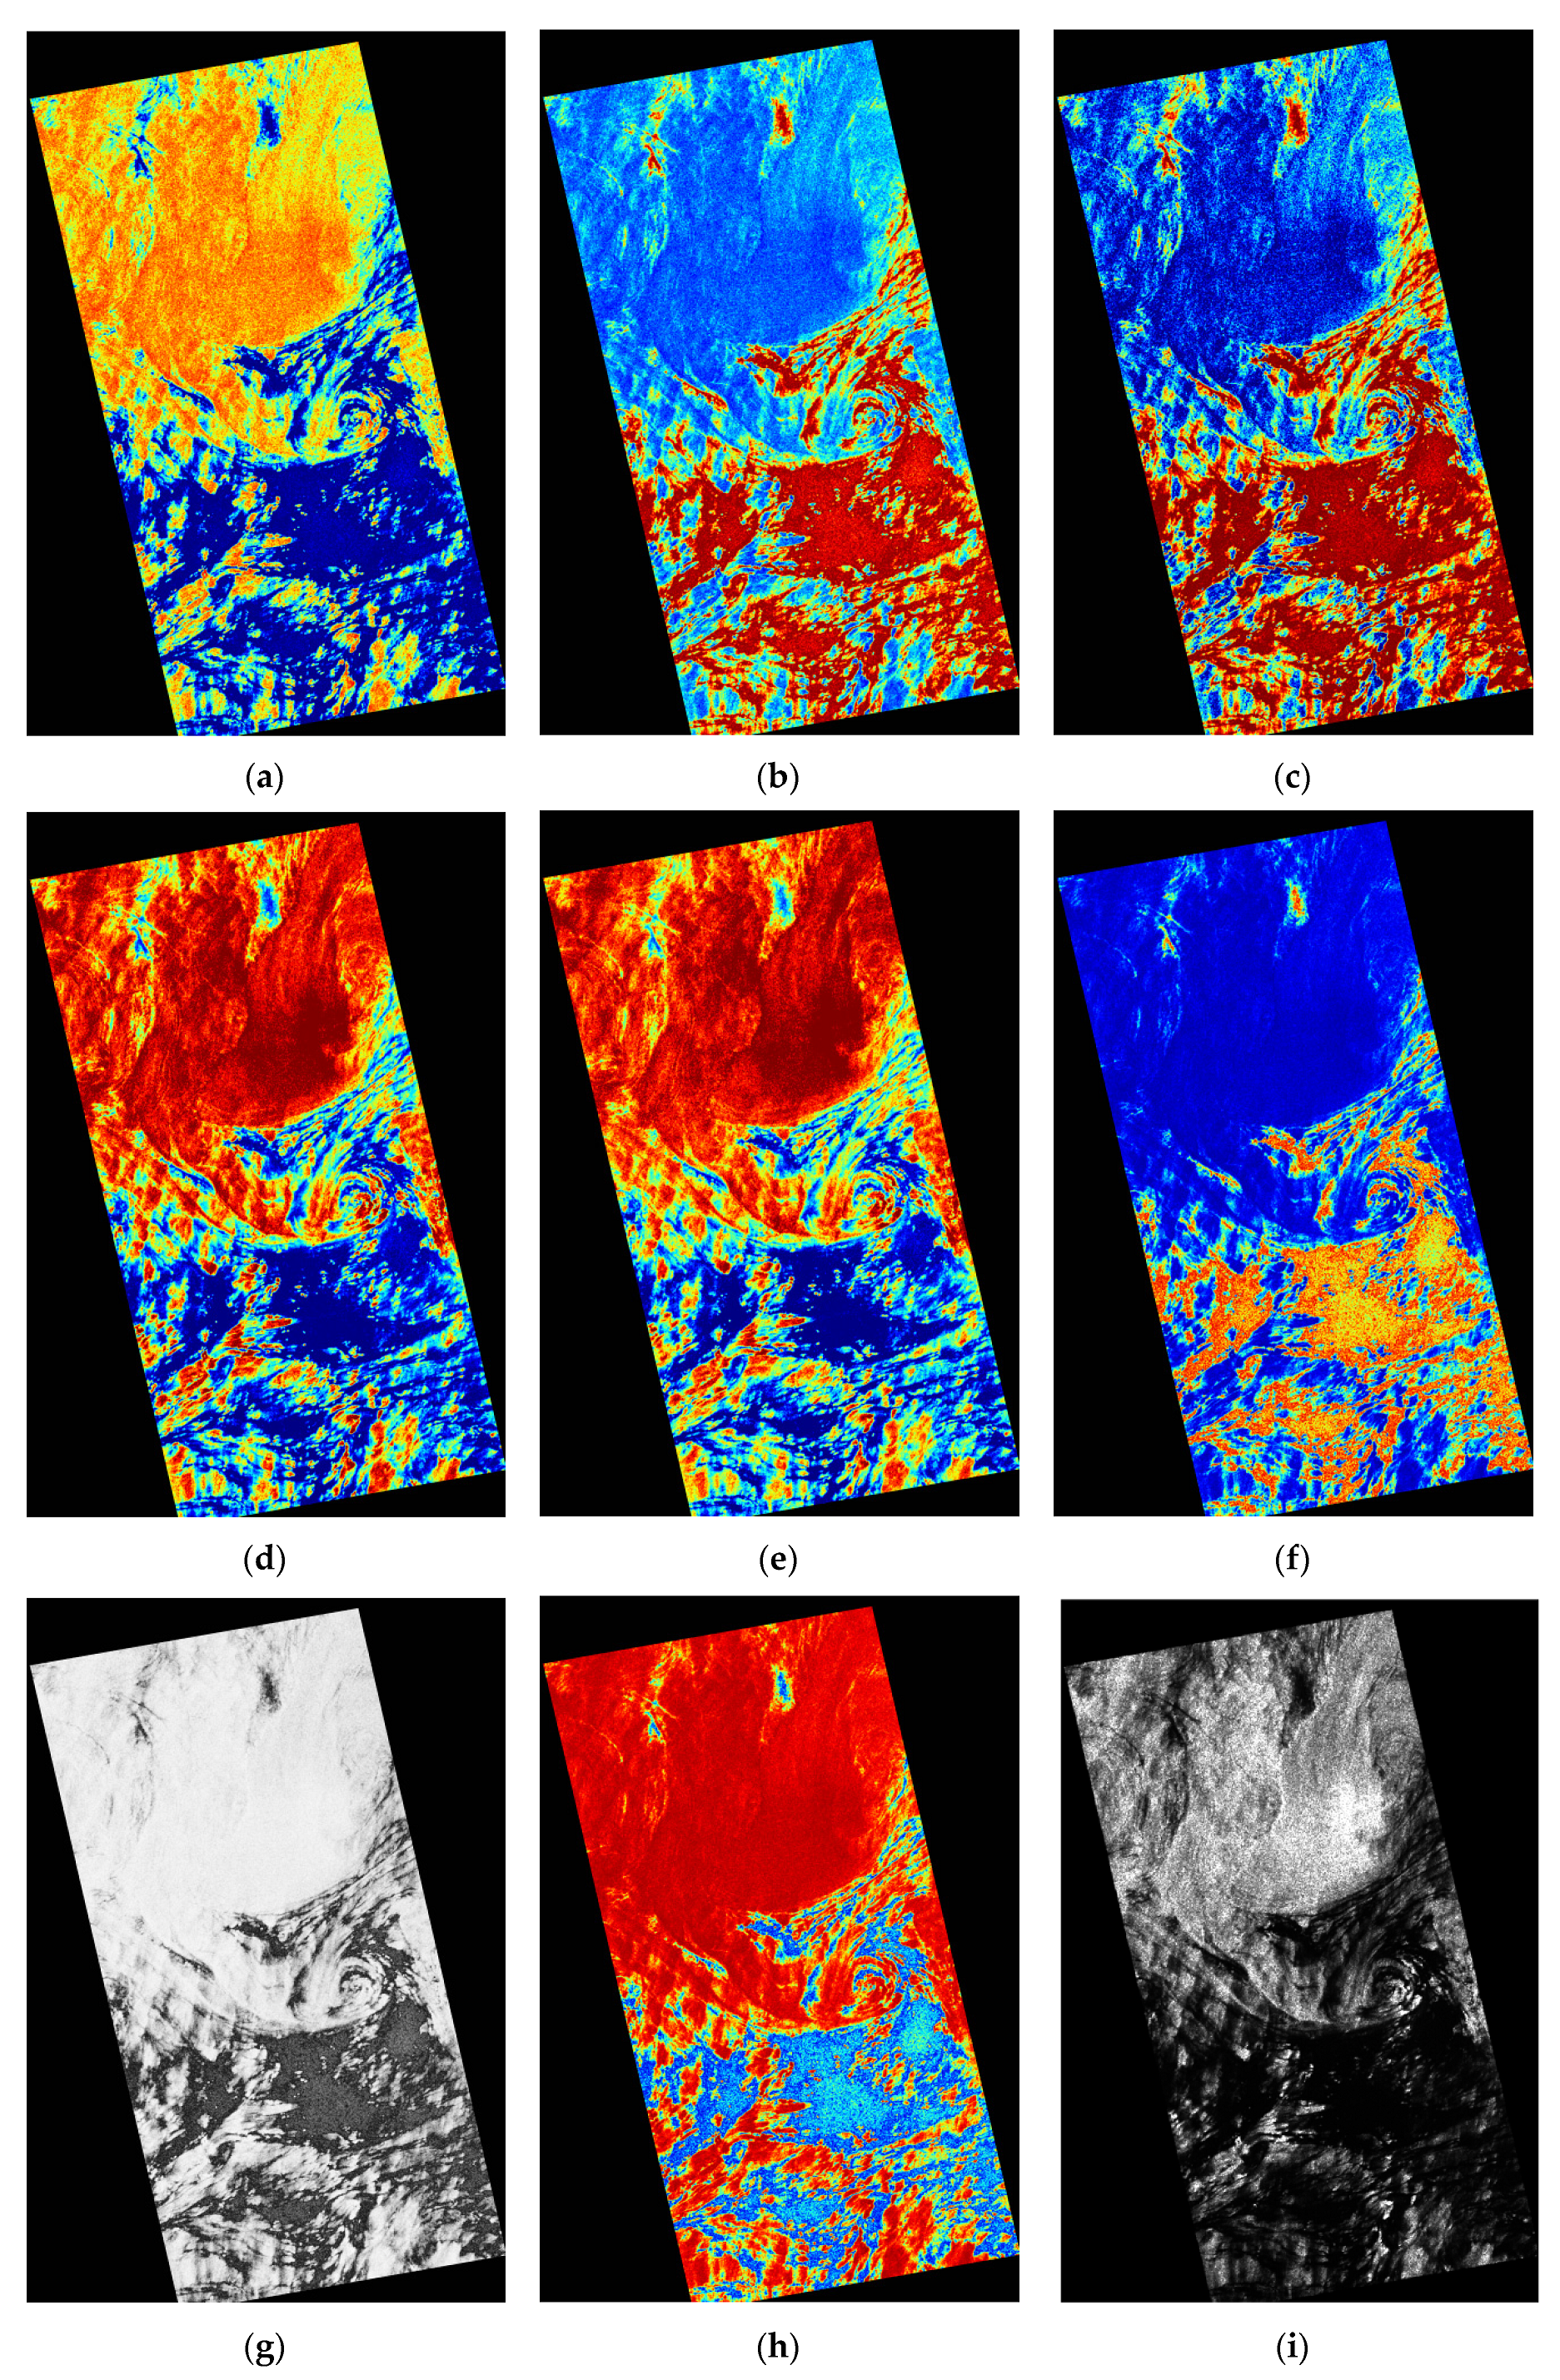
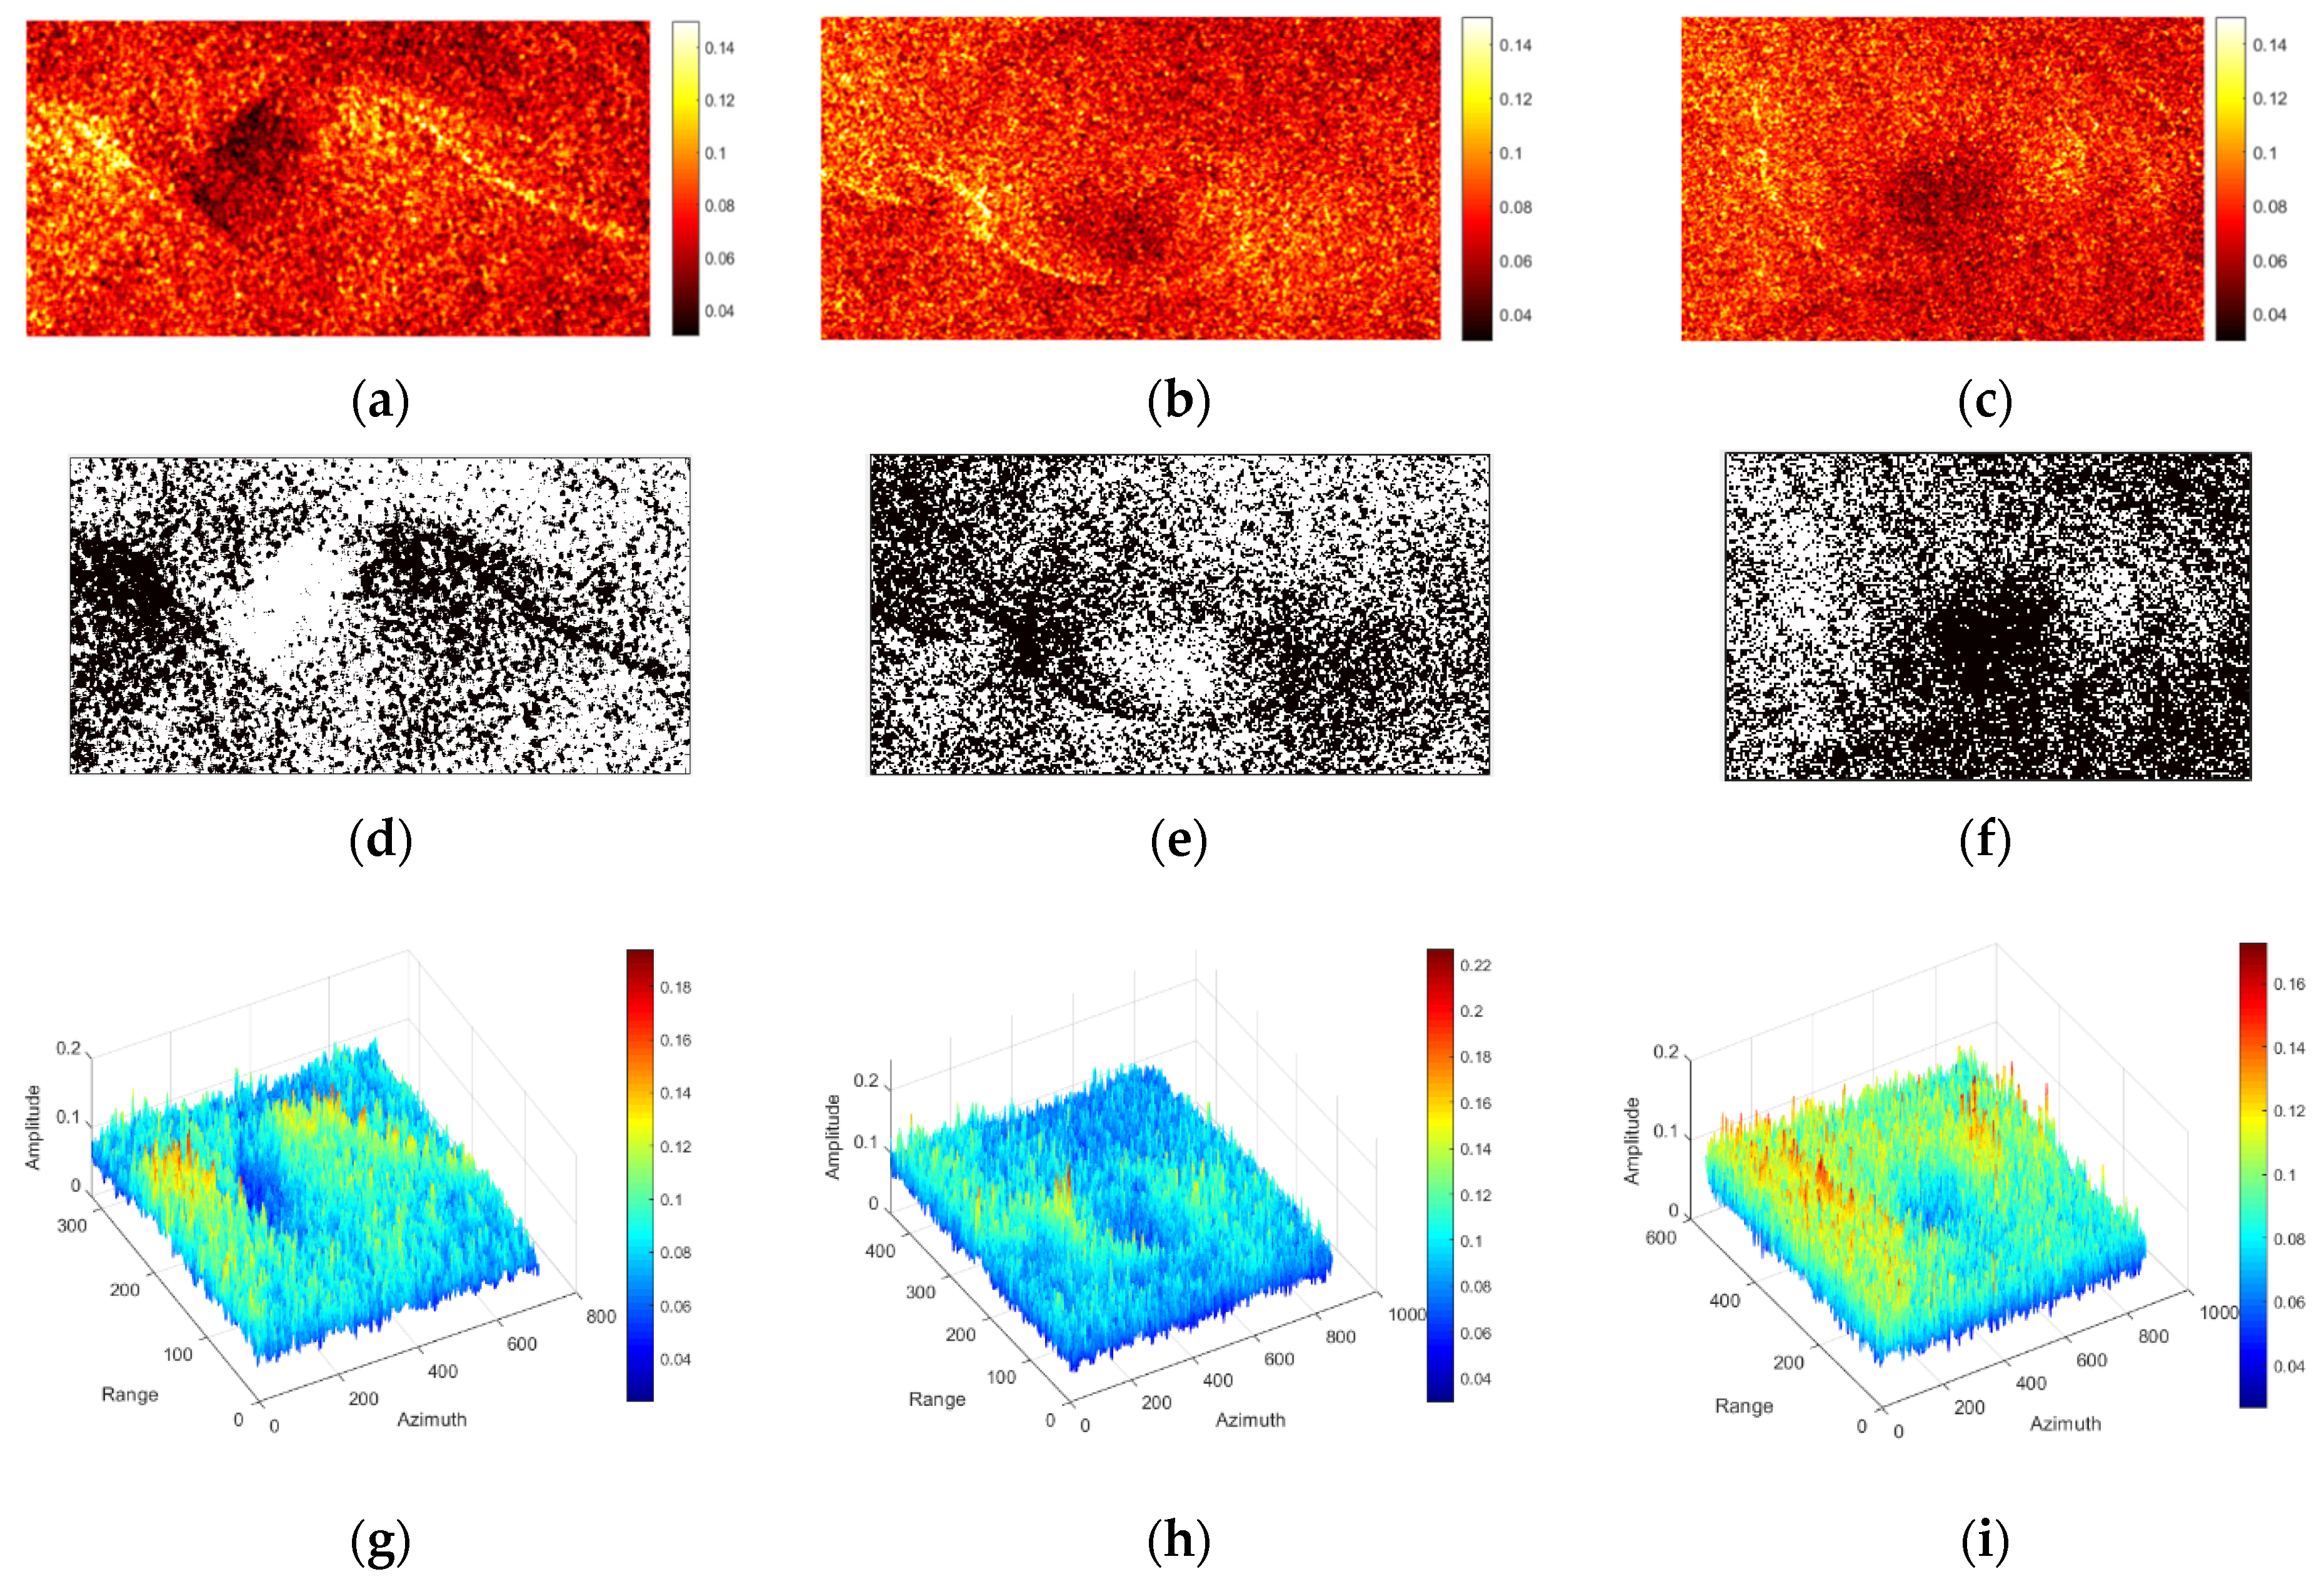
5. Detection Results
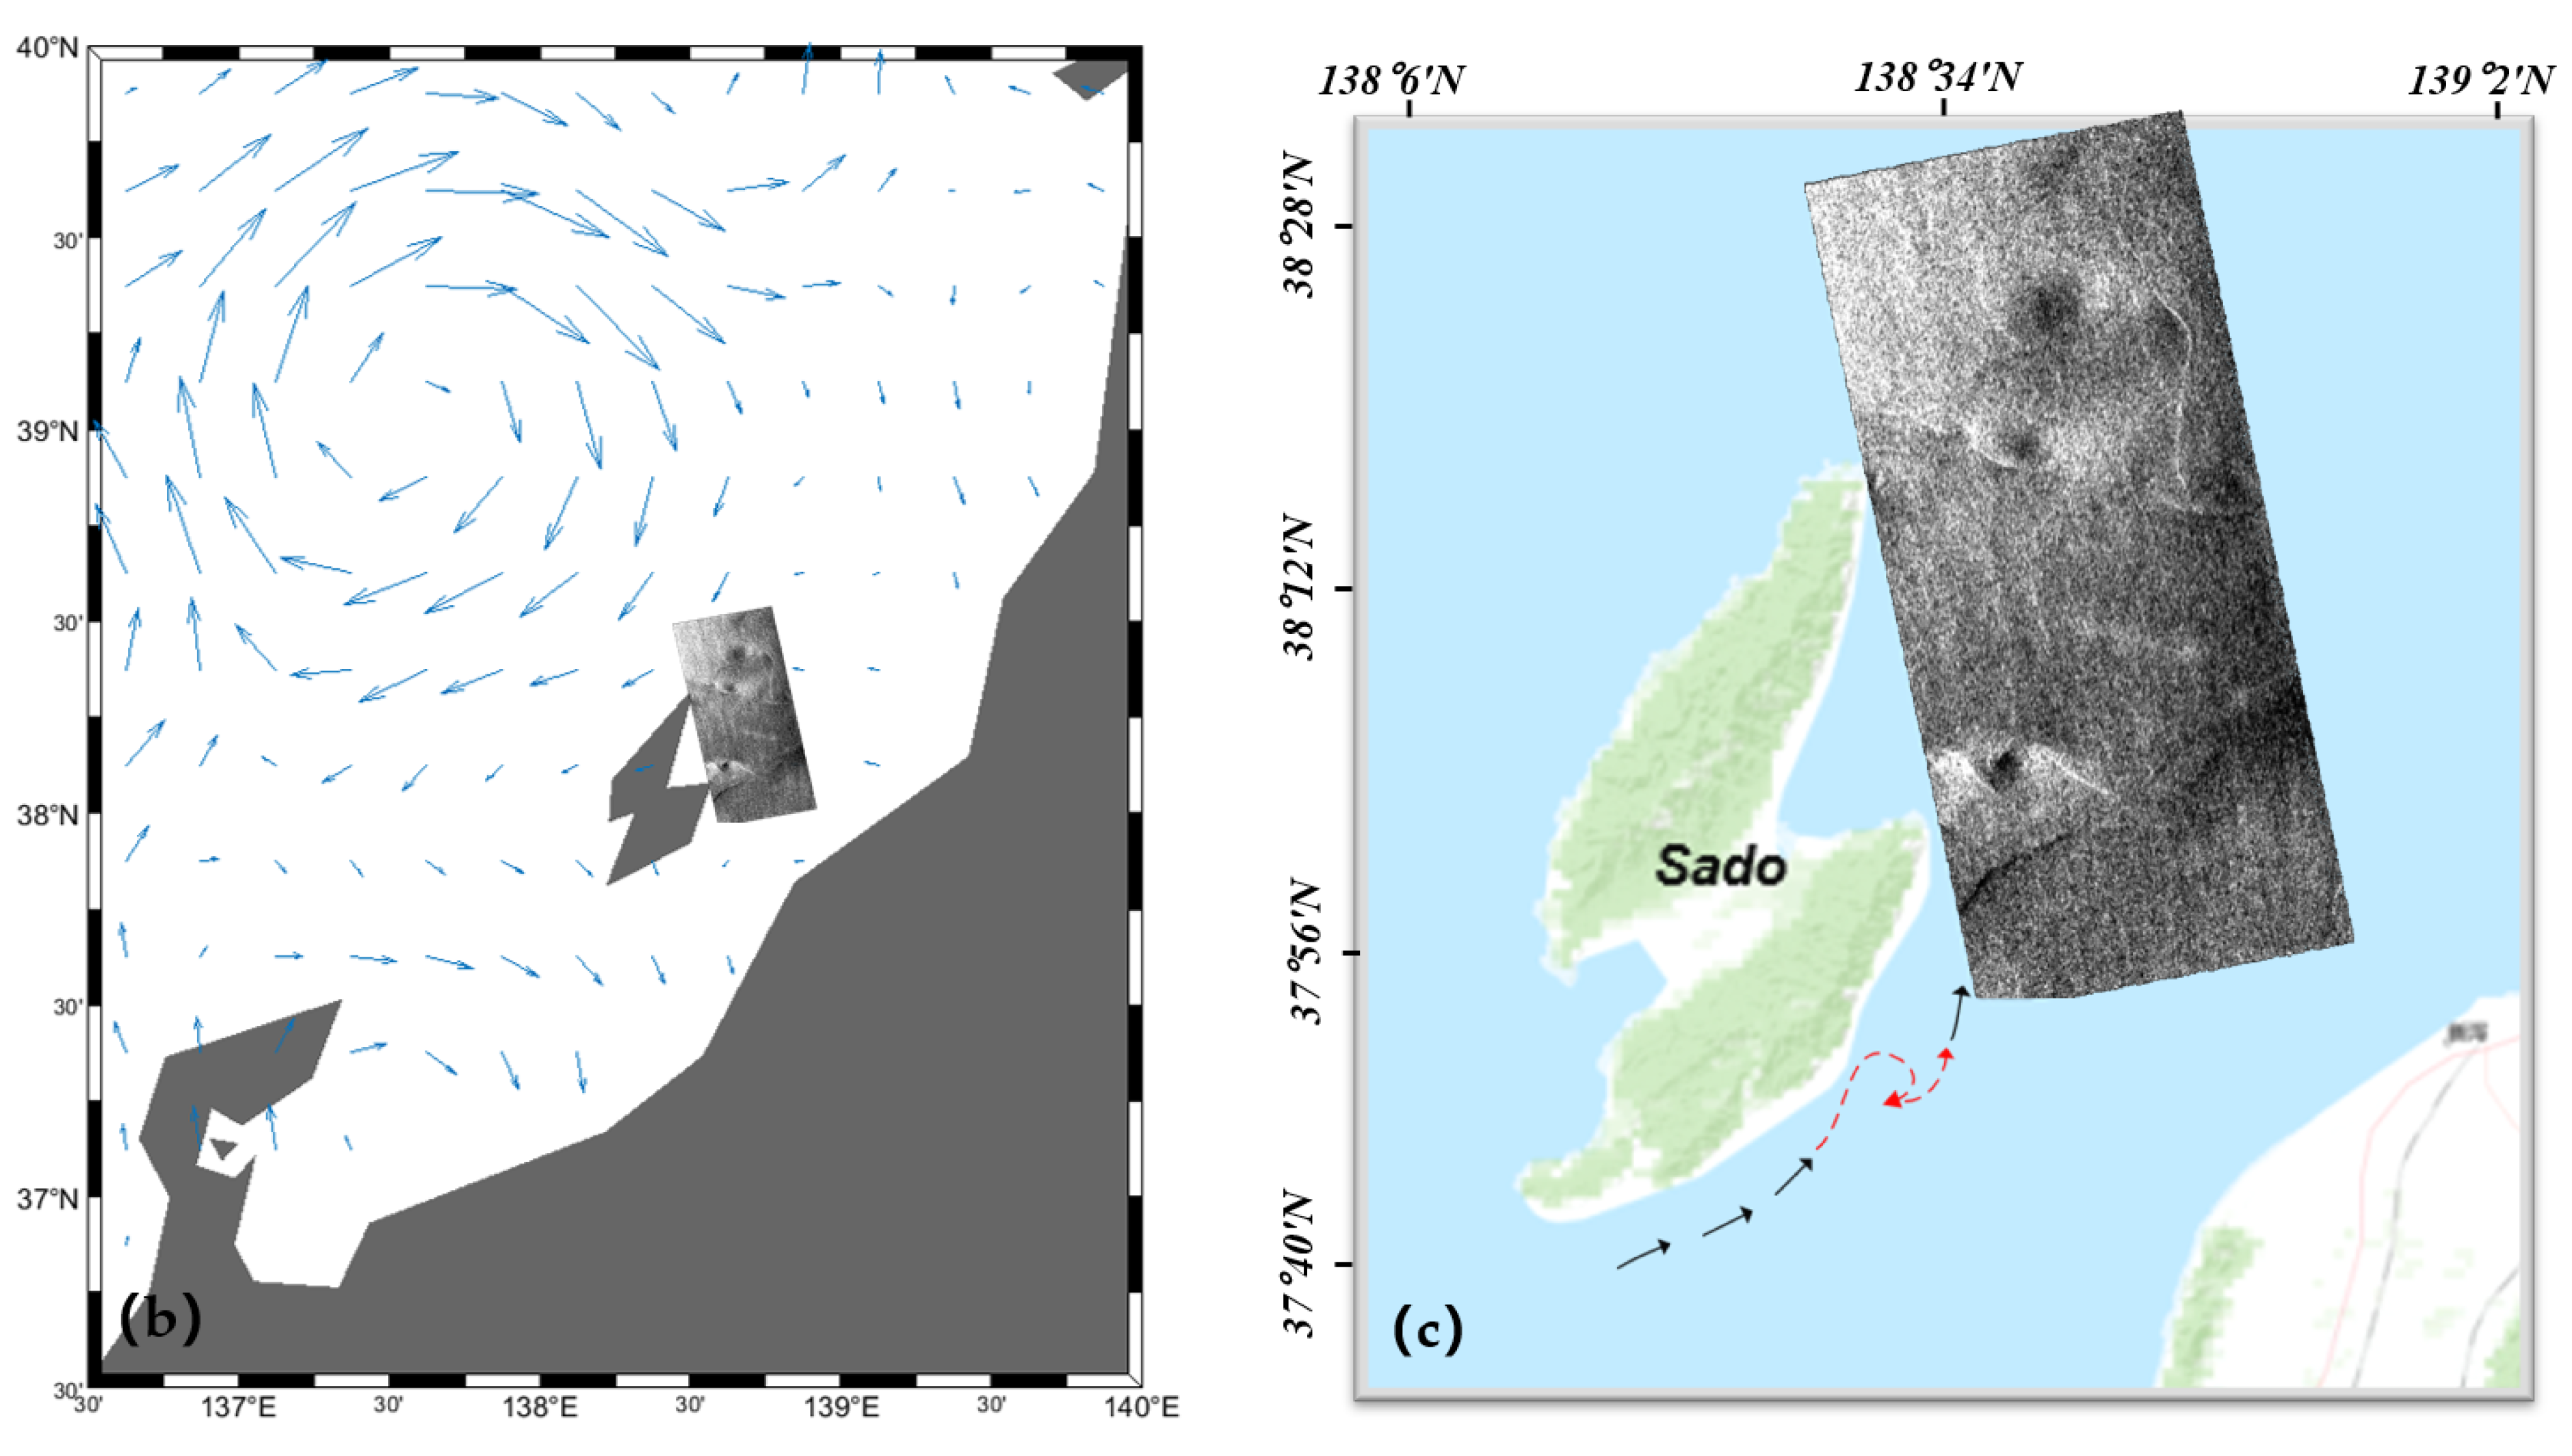
5.1. White Eddy
5.2. Black Eddy
6. Discussion
7. Conclusions
Author Contributions
Funding
Data Availability Statement
Conflicts of Interest
References
- Karimova, S. Spiral eddies in the Baltic, Black and Caspian seas as seen by satellite radar data. Adv. Space Res. 2012, 50, 1107–1124. [Google Scholar] [CrossRef]
- Ivanov, A.Y.; Ginzburg, A.I. Oceanic eddies in synthetic aperture radar images. J. Earth Syst. Sci. 2002, 111, 3. [Google Scholar] [CrossRef] [Green Version]
- Robinson, A.R. Overview and Summary of Eddy Science. In Eddies in Marine Science; Springer: Berlin, Germany, 1983; pp. 3–15. [Google Scholar]
- Chen, G.; Yang, J.; Tian, F.L.; Chen, S.G.; Zhao, C.F.; Tang, J.W.; Liu, Y.J.; Wang, Y.N.; Yuan, Z.H.; He, Q.; et al. Remote sensing of oceanic eddies: Progresses and challenges. Natl. Remote Sens. Bull. 2021, 25, 302–322. [Google Scholar] [CrossRef]
- Pérez-Muñuzuri, V.; Huhn, F. The role of mesoscale eddies time and length scales on phytoplankton production. Nonlinear Process. Geophys. 2010, 17, 177–186. [Google Scholar] [CrossRef] [Green Version]
- Williams, S.; Hecht, M.; Petersen, M.; Strelitz, R.; Maltrud, M.; Ahrens, J.; Hlawitschka, M.; Hamann, B. Visualization and Analysis of Eddies in a Global Ocean Simulation. Comput. Graph. Forum 2011, 30, 991–1000. [Google Scholar] [CrossRef]
- Alpers, W.; Brandt, P.; Lazar, A.; Dagorne, D.; Sow, B.; Faye, S.; Hansen, M.W.; Rubino, A.; Poulain, P.-M.; Brehmer, P. A small-scale oceanic eddy off the coast of West Africa studied by multi-sensor satellite and surface drifter data. Remote Sens. Environ. 2013, 129, 132–143. [Google Scholar] [CrossRef]
- Dong, C.; Nencioli, F.; Liu, Y.; McWilliams, J.C. An automated approach to detect oceanic eddies from satellite remotely sensed sea surface temperature data. IEEE Geosci. Remote Sens. Lett. 2011, 8, 1055–1059. [Google Scholar] [CrossRef]
- Zhang, C.; Li, H.; Liu, S.; Shao, L.; Zhao, Z.; Liu, H. Automatic detection of oceanic eddies in reanalyzed SST images and its application in the East China Sea. Sci. China Earth Sci. 2015, 58, 2249–2259. [Google Scholar] [CrossRef]
- Marcello, J.; Eugenio, F.; Estrada-Allis, S.; Sangra, P. Segmentation and tracking of anticyclonic eddies during a submarine volcanic eruption using ocean colour imagery. Senses 2015, 15, 8732–8748. [Google Scholar] [CrossRef] [Green Version]
- He, Z.; Wang, D.; Chen, J.; Hu, J. Eddy structure in south China sea from satellite tracked surface drifting buoys and satellite remote sensing sea surface height. J. Trop. Oceanogr. 2001, 20, 27–35. [Google Scholar]
- Lyzenga, D.; Wackerman, C. Detection and classification of ocean eddies using ERS-1 and aircraft SAR images. Variations 1997, 414, 1267. [Google Scholar]
- Topouzelis, K.; Kitsiou, D. Detection and classification of mesoscale atmospheric phenomena above sea in SAR imagery. Remote Sens. Environ. 2015, 160, 263–272. [Google Scholar] [CrossRef]
- Magalhães, J.; Alpers, W.; Santos-Ferreira, A.; da Silva, J. Surface Wave Breaking Caused by Internal Solitary Waves: Effects on Radar Backscattering Measured by SAR and Radar Altimeter. Oceanography 2021, 34, 166–176. [Google Scholar] [CrossRef]
- De Macedo, C.R.; da Silva, J.C.B. Internal Wave Dark-Band Signatures in ALOS-PALSAR Imagery Revealed by the Standard Deviation of the Co-Polarized Phase Difference. Remote Sens. 2020, 12, 2372. [Google Scholar] [CrossRef]
- Isoguchi, O.; Ebuchi, N.; Shimada, M. Meso- and Submeso-Scale Ocean Front Detection Using SAR and Optical Data. In Proceedings of the IEEE International Geoscience and Remote Sensing Symposium, Beijing, China, 10–15 July 2016. [Google Scholar]
- Fu, L.L.; Ferrari, R. Observing oceanic submesoscale processes from space. Eos Trans. Am. Geophys. Union 2008, 89, 488. [Google Scholar] [CrossRef]
- Karimova, S.; Gade, M. Submesoscale Eddies Seen by Spaceborne Radar. In Proceedings of the EMEC 10-MEDCOAST, Marmaris, Turkey, 30 October–3 November 2013; pp. 665–676. [Google Scholar]
- Di Giacomo, P.M.; Holt, B. Satellite observations of small coastal ocean eddies in the Southern California Bight. J. Geophys. Res. Ocean. 2001, 106, 22521–22543. [Google Scholar] [CrossRef]
- Xu, G.; Yang, J.; Dong, C.; Chen, D.; Wang, J. Statistical study of submesoscale eddies identified from synthetic aperture radar images in the Luzon Strait and adjacent seas. Int. J. Remote Sens. 2015, 36, 4621–4631. [Google Scholar] [CrossRef]
- Alpers, W.; Hühnerfuss, H. The damping of ocean waves by surface films: A new look at an old problem. J. Geophys. Res. Ocean. 1989, 94, 6251–6265. [Google Scholar] [CrossRef]
- Johannessen, J.A.; Shuchman, R.A.; Johannessen, O.M.; Davidson, K.L.; Lyzenga, D.R. Synthetic aperture radar imaging of upper ocean circulation features and wind fronts. J. Geophys. Res. Ocean. 1991, 96, 10,411–10,422. [Google Scholar] [CrossRef] [Green Version]
- Johannessen, J.; Digranes, G.; Espedal, H.; Johannessen, O.; Samuel, P.; Browne, D.; Vachon, P. SAR ocean feature catalogue. ESA Spec. Publ. 1994, 1174, 106. [Google Scholar]
- Karimova, S.S.; Gade, M. Eddies in the Red Sea as Seen by Satellite SAR Imagery. In Remote Sensing of the African Seas; Gade, V.B.a.M., Ed.; Springer: Berlin/Heidelberg, Germany, 2014; pp. 357–378. [Google Scholar]
- Was, N.; Andharia, H. Determination of the velocity of ocean gyres through Synthetic Aperture Radar. Int. J. Remote Sens. 1987, 8, 243–249. [Google Scholar] [CrossRef]
- Min, Y.; Jin-Song, C. A Method Based on Logarithmic Spiral Edge Fitting for Information Extraction of Eddy in the SAR Image. J. Radars 2013, 2, 243–249. [Google Scholar] [CrossRef]
- Schuler, D.L.; Lee, J.S. Mapping ocean surface features using biogenic slick-fields and SAR polarimetric decomposition techniques. IEE Proc. Radar Sonar Navig. 2006, 153, 260–270. [Google Scholar] [CrossRef]
- Huang, D.; Du, Y.; He, Q.; Song, W.; Liotta, A. DeepEddy: A simple deep architecture for mesoscale oceanic eddy detection in SAR images. In Proceedings of the IEEE 14th International Conference on Networking, Sensing and Control (ICNSC), Calabria, Italy, 16–18 May 2017; pp. 673–678. [Google Scholar]
- Friedman, K.S.; Li, X.; William, G.P. Eddy Detection Using RADARSAT-1 Synthetic Aperture Radar. In Proceedings of the International Geoscience and Remote Sensing Symposium, Anchorage, Alaska, 20–24 September 2004. [Google Scholar]
- Liu, A.K.; Peng, C.Y.; Chang, S.-S. Wavelet analysis of satellite images for coastal watch. IEEE J. Ocean. Eng. 1997, 22, 9–17. [Google Scholar] [CrossRef]
- Liu, A.; Hsu, M.-K. Deriving Ocean Surface Drift Using Multiple SAR Sensors. Remote Sens. 2009, 1, 266–277. [Google Scholar] [CrossRef] [Green Version]
- Lorenzzetti, J.A.; Kampel, M.; Bentz, C.; Torres, A., Jr. A Meso-Scale Brazil Current Frontal Eddy: Observations by ASAR, RADARSAT-1 Complemented with Visible and Infrared Sensors, in situ Data and Numerical Modeling. In Advances in SAR Oceanography from Envisat and ERS Misions, Proceedings of SEASAR, Frascati, Italy, 23–26 January 2006; Citeseer: Princeton, NJ, USA, 2006; pp. 23–26. [Google Scholar]
- Yamaguchi, S.; Kawamura, H. SAR-imaged spiral eddies in Mutsu Bay and their dynamic and kinematic models. J. Oceanogr. 2009, 65, 525–539. [Google Scholar] [CrossRef]
- Wang, Y.; Yang, M.; Chong, J. SAR image simulation method for oceanic eddies. J. Radars 2019, 8, 382–390. [Google Scholar] [CrossRef]
- Buono, A.; Nunziata, F.; Migliaccio, M. Analysis of Full and Compact Polarimetric SAR Features Over the Sea Surface. IEEE Geosci. Remote Sens. Lett. 2016, 13, 1527–1531. [Google Scholar] [CrossRef]
- Li, Y.; Zhang, Y.; Chen, J.; Zhang, H. Improved Compact Polarimetric SAR Quad-Pol Reconstruction Algorithm for Oil Spill Detection. IEEE Geosci. Remote Sens. Lett. 2014, 11, 1139–1142. [Google Scholar] [CrossRef]
- Buono, A.; de Macedo, C.R.; Nunziata, F.; Velotto, D.; Migliaccio, M. Analysis on the Effects of SAR Imaging Parameters and Environmental Conditions on the Standard Deviation of the Co-Polarized Phase Difference Measured over Sea Surface. Remote Sens. 2018, 11, 18. [Google Scholar] [CrossRef] [Green Version]
- Yin, J.; Yang, J.; Zhou, L.; Xu, L. Oil Spill Discrimination by Using General Compact Polarimetric SAR Features. Remote Sens. 2020, 12, 479. [Google Scholar] [CrossRef] [Green Version]
- Souyris, J.C.; Mingot, S. Polarimetry based on one transmitting and two receiving polarizations: The π/4 mode. In Proceedings of the IEEE International Geoscience and Remote Sensing Symposium, Toronto, ON, Canada, 24–28 June 2002. [Google Scholar]
- Souyris, J.C.; Imbo, P.; Fjortoft, R.; Sandra, M.; Jong-Sen, L. Compact polarimetry based on symmetry properties of geophysical media: The/spl pi//4 mode. IEEE Trans. Geosci. Remote Sens. 2005, 43, 634–646. [Google Scholar] [CrossRef]
- Dabboor, M.; Geldsetzer, T. On the classification of sea ice types using simulated radarsat constellation mission (RCM) compact polarimetric SAR parameters. In Proceedings of the ASPRS 2014 Annual Conference, Louisville, KY, USA, 23–28 March 2014; pp. 23–28. [Google Scholar]
- Misra, T.; Rana, S.; Bora, V.; Desai, N.; Rao, C.; Jyothi, R. SAR Payload of Radar Imaging Satellite (RISAT) of ISRO. In Proceedings of the 6th European Conference on SAR, EUSAR-06, Dresden, Germany, 16–18 May 2006; pp. 16–18. [Google Scholar]
- Nencioli, F.; Dong, C.; Dickey, T.; Washburn, L.; McWilliams, J.C. A Vector Geometry–Based Eddy Detection Algorithm and Its Application to a High-Resolution Numerical Model Product and High-Frequency Radar Surface Velocities in the Southern California Bight. J. Atmos. Ocean. Technol. 2010, 27, 564–579. [Google Scholar] [CrossRef]
- Johannessen, J.A.; Shuchman, R.A.; Digranes, G.; Lyzenga, D.R.; Wackerman, C.; Johannessen, O.M.; Vachon, P.W. Coastal ocean fronts and eddies imaged with ERS 1 synthetic aperture radar. J. Geophys. Res. Ocean. 1996, 101, 6651–6667. [Google Scholar] [CrossRef] [Green Version]
- Le Vu, B.; Stegner, A.; Arsouze, T. Angular Momentum Eddy Detection and Tracking Algorithm (AMEDA) and Its Application to Coastal Eddy Formation. J. Atmos. Ocean. Technol. 2018, 35, 739–762. [Google Scholar] [CrossRef]
- Fingas Merv, B.C. A Review of Oil Spill Remote Sensing. Sensors 2017, 18, 91. [Google Scholar] [CrossRef] [Green Version]
- Stacy, N.; Preiss, M. Compact polarimetric analysis of X-band SAR data. In Proceedings of the European Conference on Syntethic Aperture Radar EUSAR, Dresden, Germany, 16–18 May 2006. [Google Scholar]
- Raney, R.K. Hybrid-polarity SAR architecture. IEEE Trans. Geosci. Remote Sens. 2007, 45, 3397–3404. [Google Scholar] [CrossRef] [Green Version]
- Nord, M.E.; Ainsworth, T.L.; Jong-Sen, L.; Stacy, N.J.S. Comparison of Compact Polarimetric Synthetic Aperture Radar Modes. IEEE Trans. Geosci. Remote Sens. 2009, 47, 174–188. [Google Scholar] [CrossRef]
- Li, H.; Perrie, W.; He, Y.; Lehner, S.; Brusch, S. Target Detection on the Ocean With the Relative Phase of Compact Polarimetry SAR. IEEE Trans. Geosci. Remote Sens. 2013, 51, 3299–3305. [Google Scholar] [CrossRef]
- Haijiang, W. Study on Classification Methods of Polarimetric SAR Images. Ph.D. Thesis, University of Electronic Science and Technology of China, Chengdu, China, 2008. [Google Scholar]
- Cloude, S.; Goodenough, D.; Chen, H. Compact Decomposition Theory. IEEE Geosci. Remote Sens. Lett. 2012, 9, 28–32. [Google Scholar] [CrossRef]
- Raney, R.K.; Cahill, J.; Patterson, G.W.; Bussey, D. The m-chi decomposition of hybrid dual-polarimetric radar data with application to lunar craters. J. Geophys. Res. Planets 2012, 117, 5093–5096. [Google Scholar] [CrossRef]
- Ainsworth, T.L.; Cloude, S.R.; Lee, J.S. Eigenvector Analysis of Polarimetric SAR Data. In Proceedings of the IEEE International Geoscience & Remote Sensing Symposium, Toronto, ON, Canada, 24–28 May 2002. [Google Scholar]
- Lee, J.S.; Pottier, E. Polarimetric Radar Imaging: From Basics to Applications; CRC Press: Boca, Raton, FL, USA, 2009. [Google Scholar]
- Refregier, P.; Morio, J. Shannon entropy of partially polarized and partially coherent light with Gaussian fluctuations. J. Opt. Soc. Am. A Opt. Image Sci. Vis. 2006, 23, 3036–3044. [Google Scholar] [CrossRef] [PubMed]
- Cloude, S.R.; Pottier, E. An entropy based classification scheme for land applications of polarimetric SAR. IEEE Trans. Geosci. Remote Sens. 1997, 35, 68–78. [Google Scholar] [CrossRef]
- Cao, C.; Zhang, J.; Meng, J.; Zhang, X.; Mao, X. Analysis of Ship Detection Performance with Full-, Compact- and Dual-Polarimetric SAR. Remote Sens. 2019, 11, 2160. [Google Scholar] [CrossRef] [Green Version]
- Shu, S.; Meng, J.M.; Zhang, X.; Liu, G. Oil Spill Detection and Classification Method Based on Compact Polarization SAR. Adv. Mar. Sci. 2020, 39, 146–157. [Google Scholar]
- Skrunes, S.; Brekke, C.; Eltoft, T. Characterization of Marine Surface Slicks by Radarsat-2 Multipolarization Features. IEEE Trans. Geosci. Remote Sens. 2014, 52, 5302–5319. [Google Scholar] [CrossRef] [Green Version]
- Eldevik, T.D.; Kristian, B. Spiral Eddies. J. Phys. Oceanogr. 2002, 32, 851–869. [Google Scholar] [CrossRef]
- Espedal, H.A.; Johannessen, O.M.; Johannessen, J.A.; Dano, E.; Lyzenga, D.; Knulst, J.C. ERS-1/2 SAR Detection of Natural Film on the Ocean Surface. In Proceedings of the The Third ERS Symposium on Space at the Service of Our Environment, Florence, Italy, 14–21 March 1997; pp. 24969–24982. [Google Scholar]


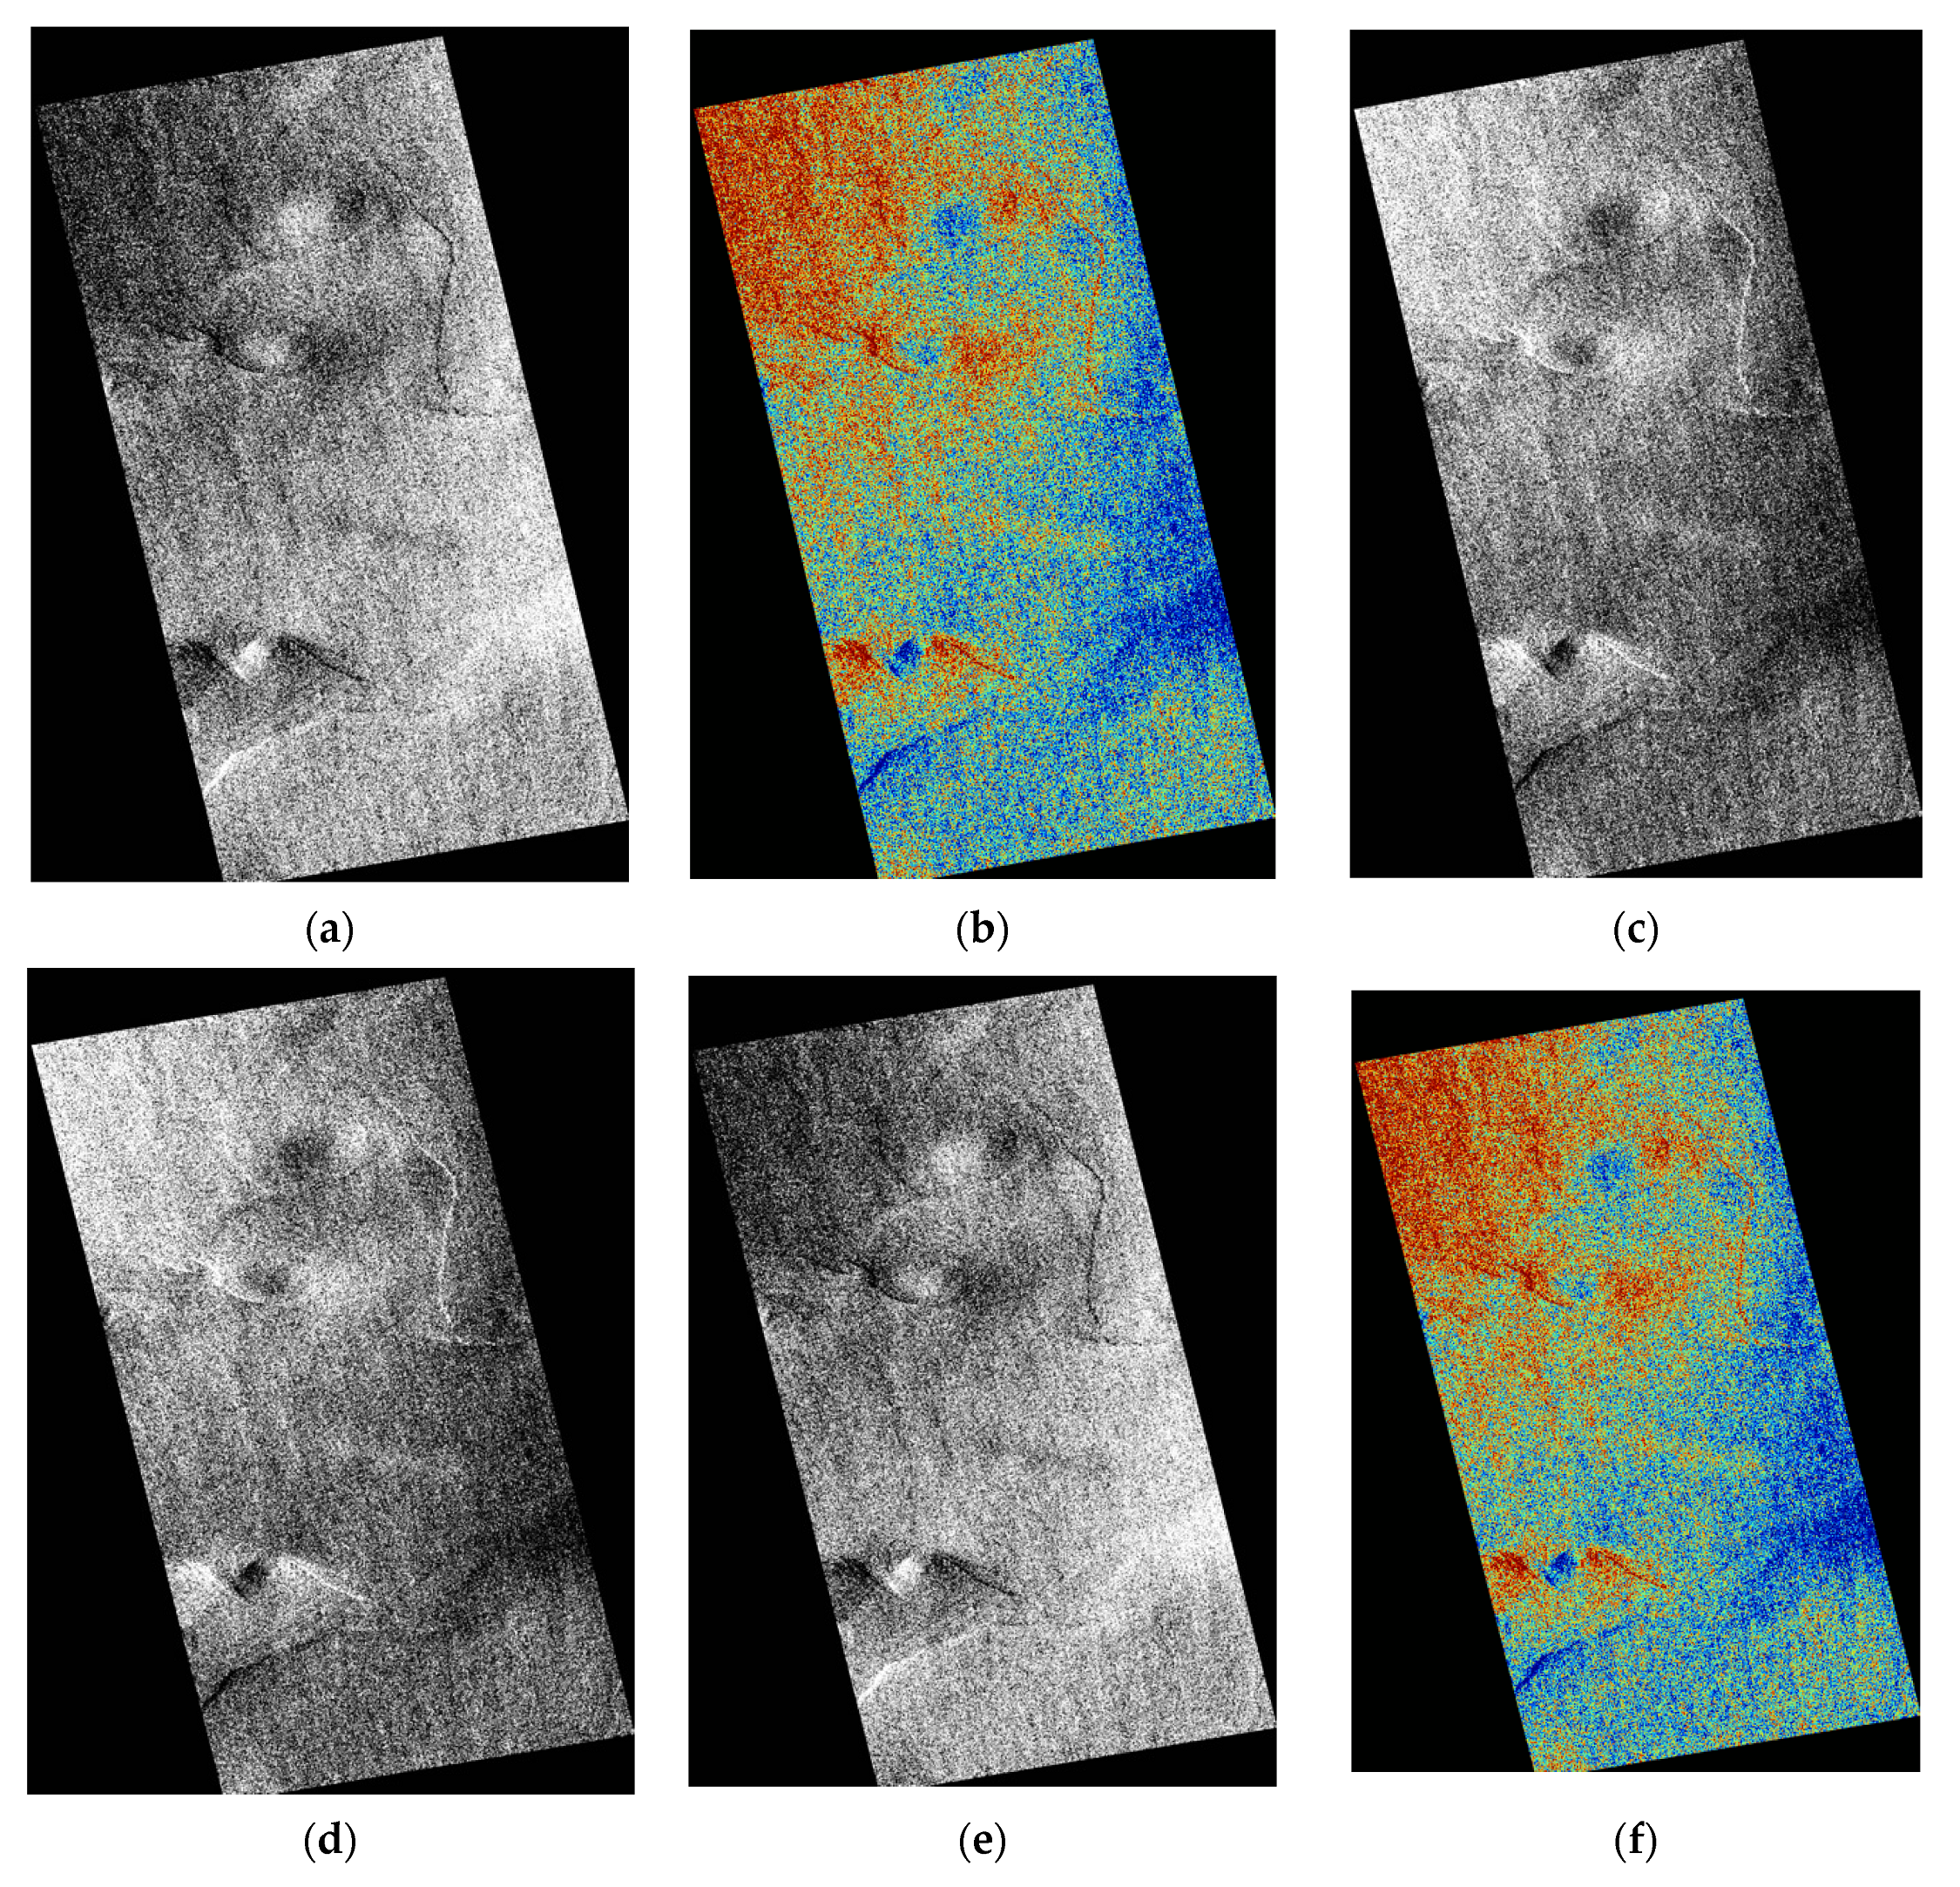
| Image Number | Image Name | Area | Date (UTC) | Wind Speed | Phenomenon |
|---|---|---|---|---|---|
| #A | ALPSRP256070760 | Japan Sea (38.329°N 138.599°E) | 11 November 2010, 1:00 p.m. | 8.1 m/s | White eddies (W-E) |
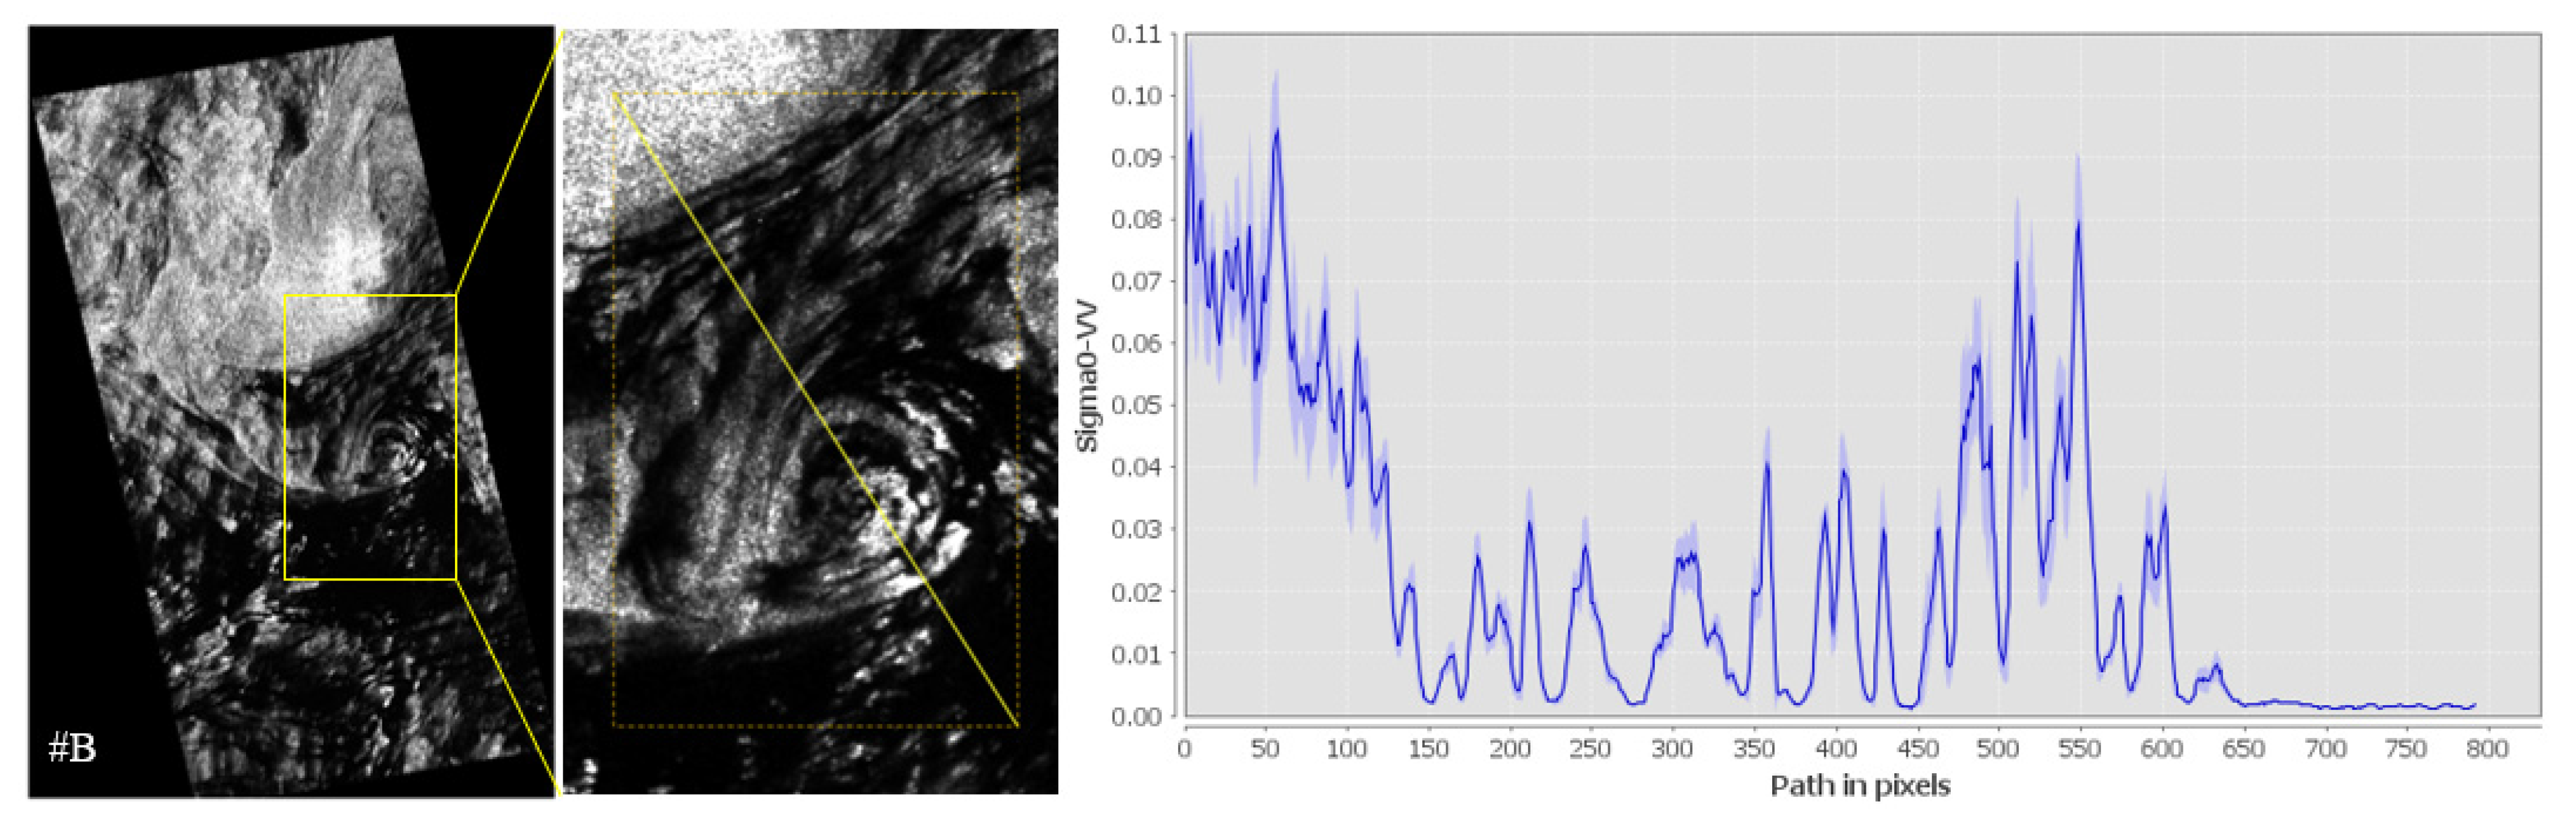
| #B | ALPSRP276350580 | Japan Sea (29.367°N 130.652°E) | 2 April 2011, 1:23 p.m. | 3.3 m/s | Black eddies (B-E) |
| film |
| No. | Feature | Ref. | Description |
|---|---|---|---|
| f1–f4 | , , , | Backscatter coefficient | |
| c1–c4 | C11, C12_imag, C12_real, C22 | [52] | Covariance matrix components |
| c5–c8 | g0, g1, g2, g3 | [53] | Stokes components |
| c9–c12 | Circular polarization ratio (CPR), degree of circular polarization (DoCP), degree of linear polarization (DoLP), linear polarization ratio (LPR) | [53] | Stokes decomposition |
| c13–c15 | Contrast (con), orientation Angle (phi), ellipticity Angle, (tau) | ||
| c16–c17 | Stokes_xp, yp | ||
| c18–c20 | m, chi (), delta () | [53] | m-χ decomposition |
| c21–c23 | Dbl (VG), Odd (VR), Rnd (VB) | ||
| c24–c27 | Eigenvalues (l1, l2), probabilities (p1, p2) | [48] | decomposition |
| c28–c29 | Entropy (H), anisotropy (A) | [52,54] | |
| c30–c32 | Alpha, alpha1, alpha2 | [55] | |
| c33 | Lambda | ||
| c34–c36 | Delta, delta1, delta2 | ||
| c37–c39 | Shannon entropy (SE), SEI, SEP | [56] | |
| c40–c43 | Combination (H, A): 1mH1mA, 1mHA, H1mA, HA | [57] | |
| c44–c46 | Dihedral component power (Pd), the surface scattering component (Ps), volume power (Pv) | [52] | Three-component compact decomposition |
| c47–c50 | Alpha_s, ms, mv, phi | [52] | Compact RVoG (random volume over ground) decomposition |
| Level | Features | E-1 | E-2 | E-3 |
|---|---|---|---|---|
| I | Pd, SEI, Dbl, g0, g3, l1, lambda, ms, SE, Ps | ⬤ | ⦿ | ⦿ |
| II | C11, C12_imag, DoCP, CPR | ⦿ | ⦿ | 🞅 |
| III | C22, SEP, HA, 1mH1mA, 1mHA, H, p2, A, p1, m, tau, chi, alpha_s, alpha1, alpha2, H1mA, DoLP, LPR, Alpha, contrast | 🞅 | ⮿ | ⮿ |
| Level | Features | Eb | O |
|---|---|---|---|
| I | 1mHA, H, SEP, SEI | ⬤ | ⬤ |
| II | SE, p2, m, A, p1, Dbl, H1mA | ⦿ | ⦿ |
| III | alpha, CPR, , DoCP, Ps, g0, g1, l1, ms, g3, Lambda, C22, Pd, C12_imag, , C11, Rnd, l2, Pv, mv, delta, contrast, LPR, yp, tau, alpha_s, chi, alpha, , delta2, delta1, delta, DoLP, | 🞅 | 🞅 |
| Features | Pd | SEI | Dbl | g0 | g3 | l1 | lambda | ms | SE | Ps | |
|---|---|---|---|---|---|---|---|---|---|---|---|
| E-1 | 70.80% | 69.71% | 70.97% | 70.05% | 69.92% | 69.81% | 69.70% | 69.72% | 69.48% | 68.18% | 66.67% |
| E-2 | 35.59% | 27.21% | 31.42% | 36.70% | 36.74% | 36.84% | 36.99% | 37.00% | 29.97% | 38.71% | 27.01% |
| E-3 | 33.13% | 25.12% | 29.18% | 34.54% | 34.12% | 34.51% | 34.41% | 34.34% | 31.34% | 36.44% | 26.12% |
| Features | 1mHA | H | SEP | SEI | SE | p2 | m | A | p1 | Dbl | H1mA | CPR | |
|---|---|---|---|---|---|---|---|---|---|---|---|---|---|
| B-E | 95.64% | 93.50% | 96.91% | 94.95% | 92.17% | 85.71% | 85.47% | 85.47% | 85.47% | 90.16% | 81.71% | 78.64% | 78.47% |
Publisher’s Note: MDPI stays neutral with regard to jurisdictional claims in published maps and institutional affiliations. |
© 2021 by the authors. Licensee MDPI, Basel, Switzerland. This article is an open access article distributed under the terms and conditions of the Creative Commons Attribution (CC BY) license (https://creativecommons.org/licenses/by/4.0/).
Share and Cite
Shu, S.; Yang, J.; Yang, C.; Hu, H.; Jing, W.; Hu, Y.; Li, Y. Performance Analysis of Ocean Eddy Detection and Identification by L-Band Compact Polarimetric Synthetic Aperture Radar. Remote Sens. 2021, 13, 4905. https://doi.org/10.3390/rs13234905
Shu S, Yang J, Yang C, Hu H, Jing W, Hu Y, Li Y. Performance Analysis of Ocean Eddy Detection and Identification by L-Band Compact Polarimetric Synthetic Aperture Radar. Remote Sensing. 2021; 13(23):4905. https://doi.org/10.3390/rs13234905
Chicago/Turabian StyleShu, Sijing, Ji Yang, Chuanxun Yang, Hongda Hu, Wenlong Jing, Yiqiang Hu, and Yong Li. 2021. "Performance Analysis of Ocean Eddy Detection and Identification by L-Band Compact Polarimetric Synthetic Aperture Radar" Remote Sensing 13, no. 23: 4905. https://doi.org/10.3390/rs13234905
APA StyleShu, S., Yang, J., Yang, C., Hu, H., Jing, W., Hu, Y., & Li, Y. (2021). Performance Analysis of Ocean Eddy Detection and Identification by L-Band Compact Polarimetric Synthetic Aperture Radar. Remote Sensing, 13(23), 4905. https://doi.org/10.3390/rs13234905