Article

Coordination Conflicts between Urban Resilience and Urban Land Evolution in Chinese Hilly City of Mianyang

1
Department of Civil Engineering and Architecture, Southwest University of Science and Technology, Mianyang 621000, China
2
The National Remote Sensing Center, Mianyang S&T City Division, Mianyang 621000, China
3
Department of Earth and Environmental Sciences, Geography and Tourism Research Group, KU Leuven, Celestijnenlaan 200E, 3001 Leuven, Belgium
*
Author to whom correspondence should be addressed.
Remote Sens. 2021, 13(23), 4887; https://doi.org/10.3390/rs13234887
Submission received: 11 September 2021 / Revised: 28 November 2021 / Accepted: 30 November 2021 / Published: 1 December 2021
(This article belongs to the Special Issue Remote Sensing of Natural Disasters)

Abstract

:
Urban resilience, the combinational characteristic of nature and society, that reflects the dynamic accumulation process that is multi-level and multi-dimensional. Particularly, the rational spatial distribution structure of land mixture and compactness is an effective way to improve urban resilience because the evolution of morphology and density of the urban land blocks in the process of land spatial conversion reflect the performance characteristics of complexity, diversity, stability, compactness, and connectivity. Therefore, we evaluated the relationship between urban resilience and land use and land cover (LULC) change, to find the keys to resilient urban development for urban land and space planning. In this study, taking the Chinese hilly city of Mianyang as an example, the results show: (1) the complexity of homogeneous patch shape and heterogeneous patch combination leads to the decrease of urban morphology resilience. (2) the development trend of LULC spatial layout and structure ratio were more rational with the increased of land mixing degree. (3) the speed and intensity of urban expansion were basically coordinated with the development of urban resilience. The research provides the new ideas, approaches, and toolkits for solving the intractable problems of urban spatial planning based on coordinating conflicts between urban resilience and urban land evolution.

Graphical Abstract

1. Introduction

As an important material basis of an urban system, the land, is one of the most promising factors to observe and develop interventions in service to urban resilience [1]. Land resilience has increasingly common usage among landscape ecologists, landscape planners, geographers, as an important strategy for buffering risks and helping urban system recover quickly from disturbances [2]. Excessive urban size and population were the most direct reasons for the increase of urban risk when sudden disasters occur [3,4]. The responses of different urban systems differ greatly when facing the same disasters and urban problems. Some cities will recession after the crisis, while others will overcome the adverse effects gradually even improve long-term development taking this as an opportunity. The fundamental reason for the difference lies in the level of urban resilience. The level of urban resilience is closely related to the spatial pattern of urban land landscape. Therefore, poor urban LULC patterns will significantly increase urban risks, reduce urban resilience, and become a serious threat to urban survival and sustainable development [5].
Urban landscape patches are the stem cells of cities, which reflects the social and economic activities of human beings in the urban space. They are the basis for the emergence and development of cities and guide the growth and development of cities. Their structural characteristics and transposition information are likely to lock the urban system on a negative or positive path, leading to major changes in the structure, process, and function of the urban ecosystem. If it falls into a negative path, it will weaken the city’s ability to adapt to change. Therefore, research into the dynamic evolution of urban capacity, density, diversity, and green infrastructure construction (these factors that can significantly improve urban resilience and sustainability) has gradually become the focus of resilient urban planning [1]. Generally, the urban land involves two types: social land (referring to the human environment represented by the built-up areas), which reflects the potential of economic and social abilities to address uncertainties. And ecological land (referring to the natural environment including natural and semi-artificial land), which contributes to the conservation of ecological functions and services. Thus, the overall performance of urban areas relies on the carrying capacity of these two land types. Optimizing the distribution of ecological land and social land could improve the urban system’s ability to deal with disturbances, thus enhance urban resilience [2].
“Scale-Density-Morphology” was the basic feature of dynamic urban development making, it a clear indicator to measure urban development. Although many scholars have discussed the relationship between urban resilience and scale, density and morphology, their perspectives mostly start from a single urban dynamic attribute. This approach fails to fully understand that urban scale, density, and morphology exist in the dynamic urban development process. Neglecting this understanding causes the dynamic and coupling relationship between urban resilience and scale, density, and morphology to be ignored [6]. Although it is important to determine the threshold of urban density and morphology, the urban system are nested in an interconnected cyberspace of a social ecosystem constantly evolving under the inflence of changing social, economic and environmental conditions. Therefore, the threshold may vary in different environments [7,8]. The basis of urban spatial planning based on the concept of resilience has to find balance between the developmental inertia of the urban physical structure and the dynamics and complexity of the urban system [9].
In short, there is no integrated research framework for the study of the conflict between urban resilience and urban expansion, so we advocate focusing on this relationship to study urban development rather than blindly controlling urban area as the most effective means. The achievement of study is to propose the idea clearly, namely, the crux of the research of urban resilience development is the dynamic relationship between morphology-density of landscape patch during land use conversion and urban expansion. Therefore, we summarized the coupled development relationship between urban land use and urban land patch morphology and density based on the concept of resilient by dynamically judging the coupling and coordinated development relationship. It is hope that improve the ability of urban resilience development effectively by combining the idea with urban land planning and urban spatial planning, etc.

2. Literature Review

The concept of resilience has been a hot topic in urban planning since it was introduced in the 1990s. Because people realize that the urban system is a huge complex system, facing a lot of uncertainty, it is difficult to deal with the complicated and various urban problems with the former “One-sided” governance mode [10]. How to improve the response and adaptability of urban system to uncertain factors has become a hot and important topic in the current academic research. Meerow, Newell, and Stults (2016) argue [11] that urban resilience refers to the resilience and resilience of urban systems and their socio-ecological and technological networks to maintain or rapidly recover to an ideal state in the face of disturbances. according to the SPAANS and Waterhout (2017) [12], urban Resilience is the ability of cities to mitigate and prevent disaster risks, mitigate potential risks and respond in a manner that minimizes loss or damage to life, livelihoods, property, infrastructure, economic activities and the environment. The key characteristics of resilient cities, populations, neighborhoods, and systems include: diversity, flexibility, adaptive governance, and capacity for learning and innovation [13,14,15,16]. These characteristics are also hallmarks of cities and urban industries that are at the forefront of technological innovation and efforts to develop sustainable urban infrastructure [17].
The urban morphology and landscape pattern are significant driving factors impacted on urban resilience. The urban morphology mainly refers to the specific spatial material morphology shown by the urban entity. In a narrow sense, the urban morphology refers to the geometric features of the outer contours of the entire urban built-up area or its clusters. Broadly speaking, the physical space composition of a city, the spatial configuration of various land types, the spatial organization of transportation, water systems, and green space systems can all belong to the characteristics of urban morphology. Urban morphology is a comprehensive representation of human activities on a spatiotemporal scale [5]. The evolution of urban morphology is the evolution process of adapting to the changing requirements of urban functions. Landscape pattern is one of the important influencing factors to alleviate the urban heat island (UHI) effect. The most important influencing factor is the area and shape of the landscape [18,19,20], which are related to a certain degree [21,22], effecting the cooling efficiency of the green space on the surrounding environment [21]. The integration of the built environment and the ecological space is conducive to dissolving the unfavorable landscape pattern, improving the self-organization and independence of the city, and increasing the city’s resilience. However, if only considering the suitability of the urban ecological environment and the amount of high-quality farmland, urban land is likely to be fragmented, and this excessive fragmentation will reduce urban resilience.
Currently, “Urban resilience” has been used to address urban issues such as climate change and disaster impacts, with an emphasis on prevention and mitigation actions [23,24,25], including: (1) enhancing urban resilience from a resilience perspective; (2) applying resilience to urban climate change(sea level rise, extreme weather phenomena)and disasters(hurricanes, tsunamis, earthquakes, floods, forest fires, etc.); (3) application of resilience in regional, urban planning layout and morphology studies; (4) application of resilience in building community resilience and enhancing community safety and cohesion [23,24,26]. In conclusion, the concept of urban resilience emphasizes three important capabilities: (1) the ability to absorb shocks and maintain a particular state, (2) the ability to self-organize, and (3) the ability to adapt and learn. Ahern proposed that resilient cities should have five characteristics (the characteristics of urban resilience): (1) biodiversity, (2) versatility, (3) multi-scale network, (4) modularity, and (5) adaptability [27].
China’s urbanization has attracted the attention of the world with its speed and scale. China is the largest of all Asian countries and has the largest population of any country in the world. Occupying nearly the entire East Asian landmass, it covers approximately one-fourteenth of the land area of Earth. The mountainous and hilly terrain accounts for 69% of the total land area of China, and the mountain and hilly cities account for nearly 50% of the total number of Chinese cities. Therefore, the study of urban resilience in these countries its terrain dominated by mountains, such as China, is critical to sustainable urban development. Based on the previous literature review and background of urban resilience studies, the goal of the present study is to explored the coordinated development relationship between urban evolution and urban resilience changes from the cellular level firstly. Then provide perspectives and ideas for judging and evaluating urban resilience under the view of Landscape ecology. Finally, give recommendations on the focus and direction of land and space planning and urban resilience construction combined with local conditions to provide a scientific basis of strategy and path for urban spatial planning.

3. Research Design

Developing resilience requires cities to grasp the complexity and interaction of urban and disturbance factors using systematic methods to more fully understand how an urban system’s components respond to threats and their interactions in different temporal and spatial scales [9]. This requirement coincides with landscape spatial configurations, dynamic evolution, and multi-scale ecological processes that are the focus of landscape ecology. In the process of rapid urbanization, urban expansion is mainly carried out through transformation, fragmentation, and occupation, which shows that rapid urbanization will greatly reduce the natural landscape and make it highly fragmented. The resulting evolution of the landscape pattern will lead to significant changes in the structure, process, and function of the urban ecosystem, thereby affecting urban resilience [28,29].
Landscape ecology research reveals the relationship between the spatial pattern and ecological process at the landscape level [30,31], and explores the environmental disputes and ecological complexity of urbanized landscapes. Involving land use and biodiversity, landscape security patterns, earthquake disaster mitigation, and rural housing construction, etc. The analysis results of landscape index between landscape spatial pattern and process can provide planners or researchers with information about landscape functions [32]. Moreover, the landscape index can also be used to describe the impact of urbanization on the landscape structure, and to explore social-ecological resilience [33,34,35]. Therefore, the thesis design uses the density and morphological changes of different land use landscape patches to reflect the process of urban resilience development.

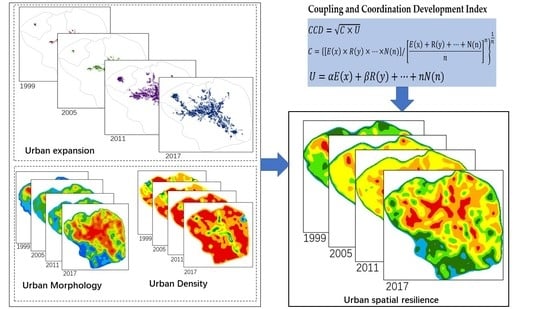
3.1. Dynamic Analysis of Urban Resilience Based on LULC Change

3.1.1. Urban Morphology Resilience

Urban morphology mainly refers to the specific spatial material morphology shown by the urban entity. In a narrow sense, the urban morphology refers to the geometric features of the outer contours of the entire urban built-up area or its clusters. Broadly speaking, the physical space composition of a city, the spatial configuration of various land types, the spatial organization of transportation, water systems, and green space systems can all belong to the characteristics of urban morphology. In short, urban morphology is a comprehensive representation of human activities on a spatiotemporal scale. The evolution of urban morphology is the evolution process of adapting to the changing requirements of urban functions.
In this study, the indexes of urban morphology resilience include neighborhood factors and average patch fractal dimension index. Neighborhood factors, such as the proportion of urban land in the neighborhood, are important because the built-up area can be regarded as a self-organizing system where neighboring interaction strongly influences new developments [36]. Many developers tend to develop land near to existing built-up areas because of the lower development risk for their investment [37]. Therefore, a reasonable and moderate urban form is most conducive to the development of urban resilience. In order to regularize the urban patches, this paper adopts the average compactness index [38], which is expressed as:
M a x R M o r = N = 1 N 2 π α n / π p n / N
where RMor is the urban morphology resilience, N is the total number of patches, αn and pn are the area and perimeter of patch n.
The weighted average of urban morphological resilience and urban density resilience is the urban land resilience level value. Because morphology and density are equally important, the weights of this study are chosen to be 0.5.

3.1.2. Urban Density Resilience

Urban density resilience is determined by the space ratio between different types of land, such as the layout of open spaces, residential land and green space, to maintain and promote the diverse function, especially the promotion of species diversity. It is referenced repeatedly in specific structural planning or more detailed land use planning.
This paper introduces the “source-sink” landscape theory to measure the characteristics of urban density resilience from the perspective of land landscape ecology. The “source-sink” landscape theory can better reflect the mutual feedback between landscape patterns and processes [39,40], and reflect the dynamics of ecological processes [41]. The “source” landscape of UHI refers to the type of urban landscape that strengthens the effect of UHI. The “sink” landscape is a landscape that has a mitigating effect on the UHI. The connotation of the “source-sink” landscape theory in UHI research has been widely recognized [18,40,42]. (The theory believes that the negative effects produced by the “source” landscape can be absorbed and offset by the “sink” landscape. From the perspective of supply and demand, the balance of spatial allocation of the “source” and “sink” landscape can be measured by the accessibility of the “source-sink” landscape.)
Combined with the LULC classification of this study, gray landscapes such as urban impervious surfaces, urban bare land and other land are classified as “sources”, and agricultural land, forest land and water bodies are classified as “sinks”, the specific calculation process is as follows:
(1)
Rasterize the surface of the study area indicating both “source” and “sink” patches employing a consistent grids.
(2)
Calculate the distance from each grid inside a certain “source” patch to the nearest grid inside the nearest “sink” patch. The greater the adjacency of “source” and “sink” patches. The more resilient the urban condition vice versa, if the “source” patch and the “sink” patch are severely separated in space, the possibility of offsetting the negative effects is significatantly reduced resulting in a lower resilience in the urban condition.
(3)
Through the standardized operation of negative indicators, the urban density resilience index can be obtained. The higher the index value, the higher the urban density and resilience. Conversely, the lower the index value, the lower the urban density and resilience.

3.2. Coupling and Coordination Development Index

There is a dynamic coupling process of the changes of land spatial layout and LULC, especially with the expansion of urban impervious surface. Therefore, it can more effectively judge whether the city is sustainable development through analysis of the coupling coordination degree (CCD) between urban resilience and LULC in the process of urbanization.
C C D = C × U
C = E x × R y × × N n / E x + R y + + N n n n 1 n
U = α E x + β R y + + n N n
In the formulas, C is the coupling degree. D is the comprehensive coordination evaluation index. α, β, …, n are the undetermined coefficient. Due to the equal importance of sub-system in this research, the value of α, β, …, n were one-nth respectively. CCD belong to [0, 1]. Then, we divided the grade of CCD. See Table 1 for details.

4. Study Area and Data Processing

4.1. Study Area

Chinese city of Mianyang is located between 30°42′–33°03′ north latitude and 103°45′–105°43′ east longitude. It governs 3 districts, 5 counties and 1 escrow city. In this study, our research area is the build-up area of Mianyang, which includes 3 main and central districts, called Fucheng, Youxian, and Anzhou, respectively. It has a total administrative area of 1134.33 km2 and a population of 2.23 million by the end of 2020. Mianyang is a typical hilly type and inland city in southwest of China. It has undulating topography surrounded by mountains on three sides and crossed by the Upper Middle Fujiang River, Anchang River and Furong River. The city has a ‘Y’ shape corresponding to the Fujiang reiver aluvial plain. Mianyang is an important base for national defense research and electronic industry production in China. It is the only science and technology city ap-proved by the State Council of China. It has been designated as the regional central city in the northwest of Chengdu-Chongqing Economic Zone in the “Regional Planning of Chengdu-Chongqing Economic Zone”. The combination of the city’s special geographical location and important human activities control the urban spatial form and the expansion characteristics of the urban area boundary, and influence the development and change law of urban resilience.

4.2. LULC Remote Sensing Interpretation Method

The main data sources are shown in Table 2. Remote sensing data from Landsat TM and OLI were downloaded from USGS website (https://earthexplorer.usgs.gov (accessed on 20 March 2018), Path = 130, Row = 38). Landsat TM bands 1–5 and Landsat OLI bands 1–7 are used for LUCC interpretation. LULC information was interpreted by hierarchical classification [43] of four batches of Landsat TM/OLI series remote sensing images (1999, 2005, 2011 and 2017). The procedure was used to divide LULC types into six categories: urban bare lots, urban impervious surface, cultivated land, forest land, surface water, and others (Figure 1). First, the urban bare lots were extracted, and then the urban impervious surfaces were extracted after processing the urban bare lot mask. Similarly, after extracting the urban impervious surface, the two types of land (urban bare lots and urban impervious surface) extracted are masked before extracting the third type of land. The procedure was repeated until all land use types were extracted. Among them, urban impervious surface and urban bare lot extraction was based on Normalized Difference Impervious Surface Index (NDISI) [44,45,46] and Normalized Difference Soil Index (NDSI) [47,48] indices. Vegetation and surface water are relatively easy to extract because of obvious differences in spectral characteristics. Forest land and cultivated land were discriminated from one another based on an NDVI (Normalized Difference Vegetation Index) [49] threshold.
The land use types assigned to the others categories were obtained by erasing the area of the above five types of land from the whole study area using the erase tool in ArcMap 10.2 (ESRI, Redlands, CA, USA), after verifying the accuracy of the lands assigned to the five types. Based on reference to historical HD images of the study area from Google Earth (Alphabet Inc., Mountain View, CA, USA) in 2010–2017, interpretation accuracy verification selected the purest ROI (region of interest, ROI) as possible using Landsat TM and OLI data. The number of ROI for each land use type was not less than 100. Subsequently, the extracted information was compared with the ROI to ensure that the accuracy of each type of land was maintained at 90% or greater. The specific process see reference [50].

5. Results

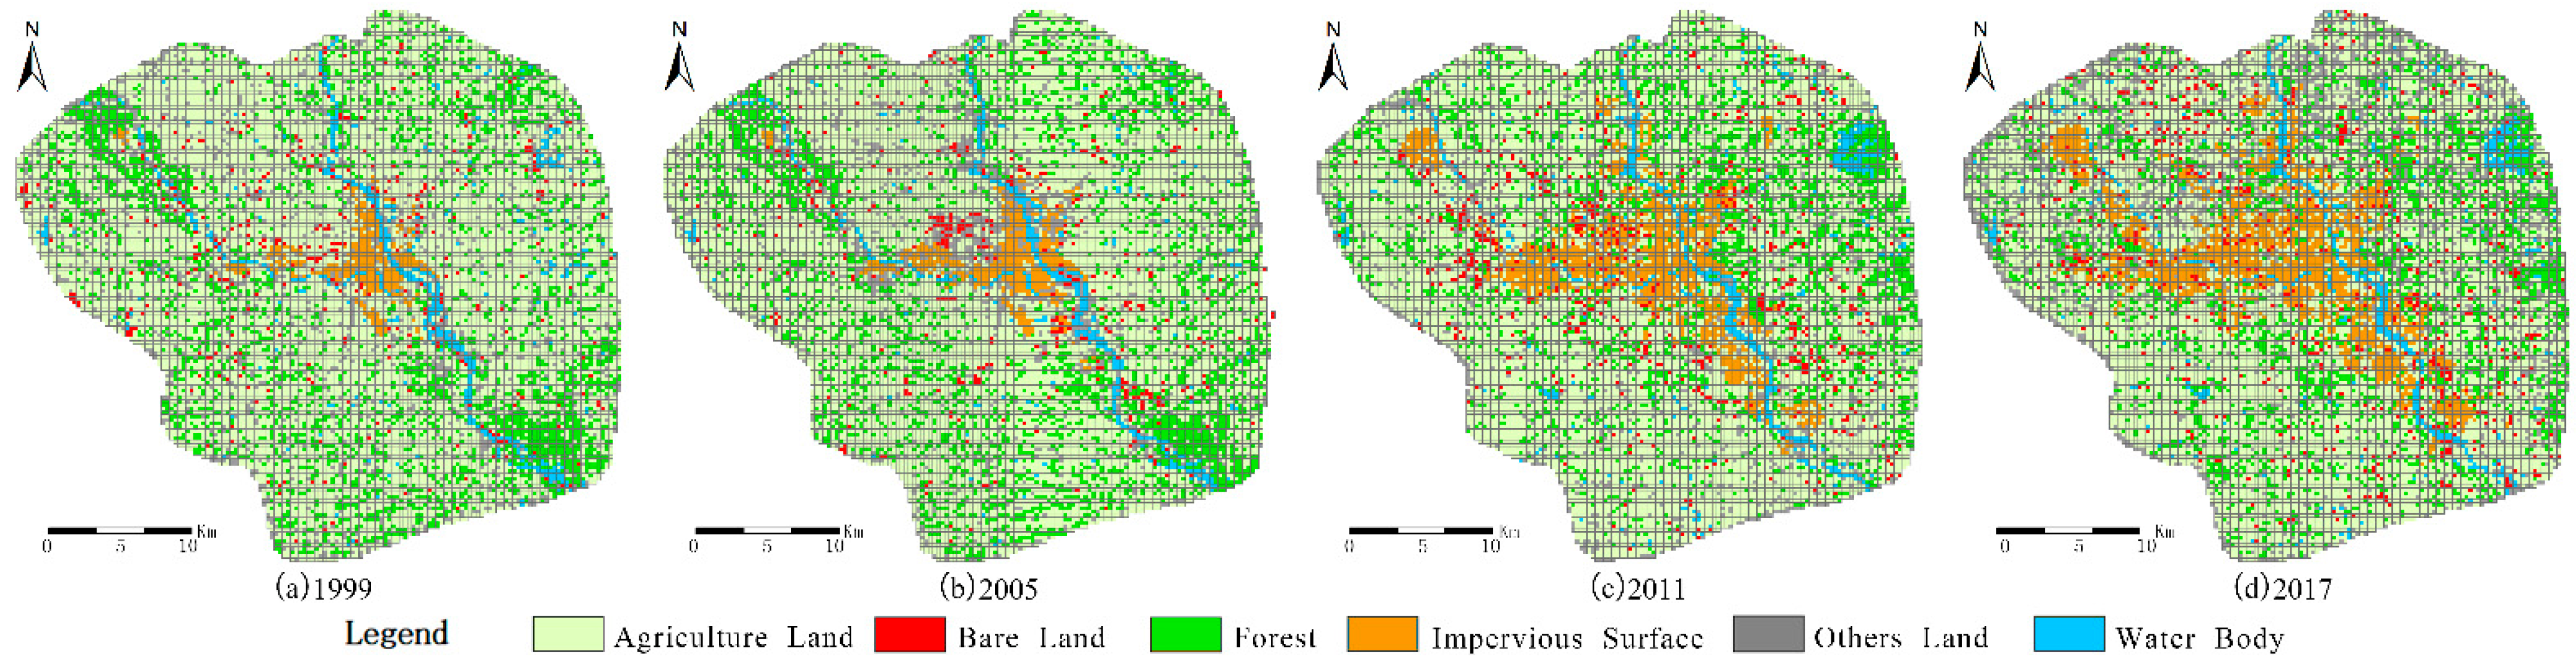
5.1. LULC Variation Characteristics

5.1.1. Changes of Direction and Intensity

The forest and the agriculture land in built-up area of Mianyang were reduced, while the urban impervious surface and urban bare land were increased in 1999–2017 (See in Figure 1). The forest was 230.1 km2 in 1999 but reduced to 187.0 km2 in 2017, which dropping 18.72%; The cultivated land was 742.9 km2 and 625.8 km2 in 1999 and 2017 respectively, dropping 15.76%; While, the area of urban impervious surface was increased sharply from 27.3 km2 in 1999 to 117.2 km2 in 2017, an increase of 329.3%.
The urban impervious surface, an important part of the urban built-up area, exhibited the highest expansion intensity in 2005–2011. The increase was highest (164.7 per cent). Its expansion in 2005–2011 was nearly nine times stronger than in 1999–2005 and more than four times higher than in 2011–2017. Therefore it reflects 2005–2011 as a period of rapid urbanization.
In addition, if we pay more attention to the expansion intensity of bare land, the growth rate of urban bare land also reached a peak in 2005–2011. Its expansion strength is second only to urban impervious surface in all urban land types.

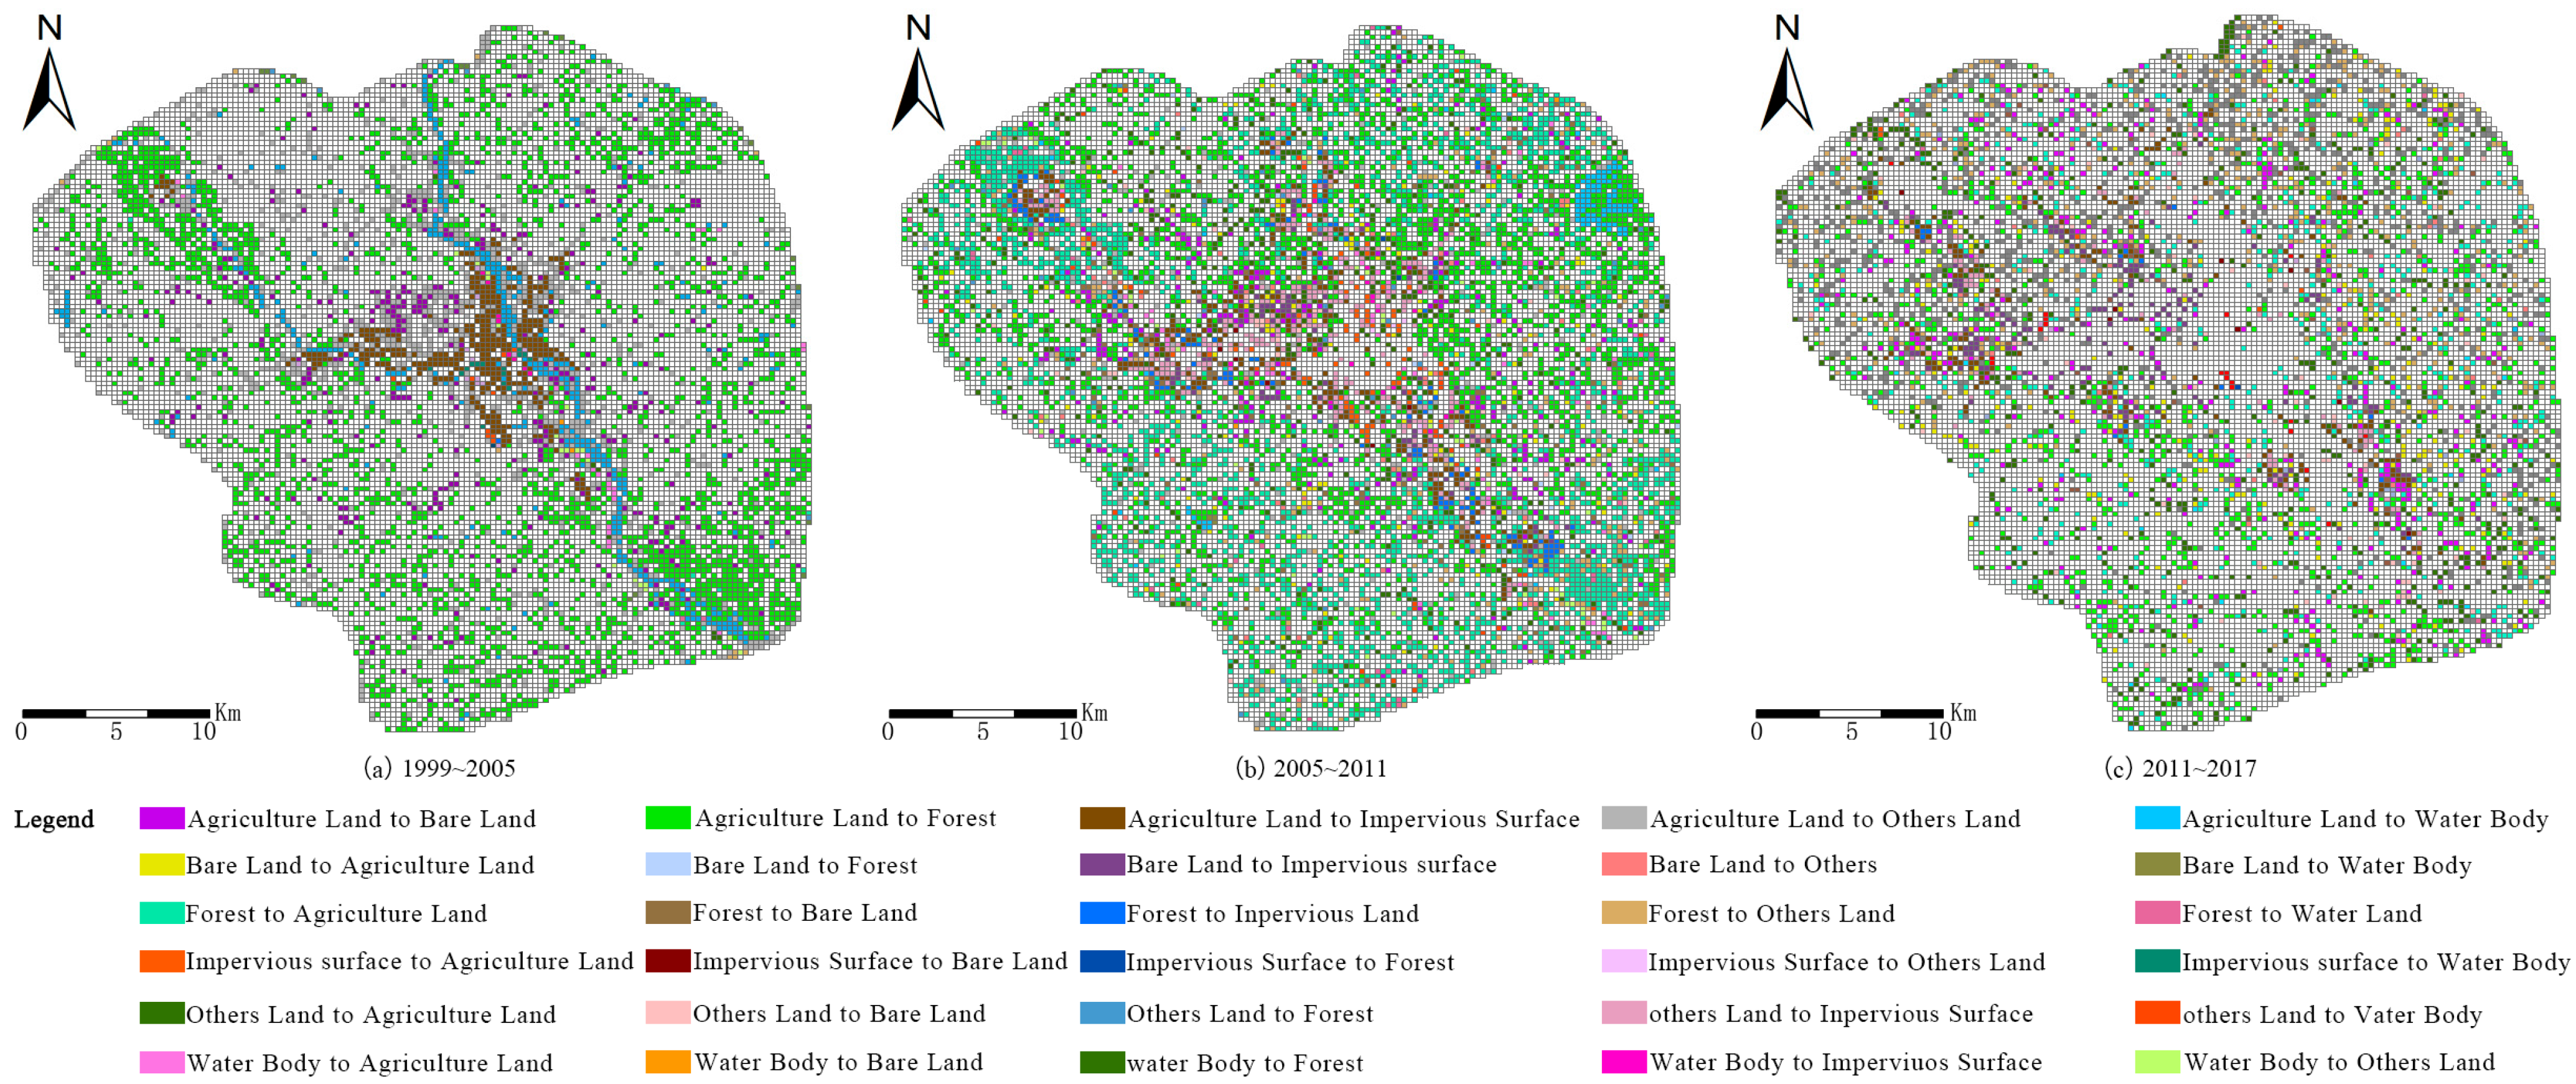
5.1.2. Land Conversion of Different LULC

The agricultural land was the most active land use type in terms of absolute area in 1999–2005 (See in Figure 2). It is shown as the land use type with the most transfer-out area (419.72 km2), with most of that has been converted to forest land (217 km2). The change makes forest land the most transferred land type during this period (217 km2). The changes can be described as “plain and unusual” in 2005–2011. The agriculture land was still the land use type with the largest total conversion during this period even though the total conversion area has declined. It because the land use type with the most transferred into area (227 km2), and most of it was converted from forest (166.39 km2). This type of agricultural and forest land is transferred and transferred to the largest land types by each other.
In 2011–2017, the flow of land types tended to level off (See in Table 2). The type of land where activity has increased significantly is “other”. During this period, the “other” types of land were transferred to agricultural land (83.303 km2), while agricultural land was transferred to “other” land types (77 km2). The activity of “Other“ land use types is increasing, which indicates that the complexity and mixture of land use are increasing. This also poses new challenges to the traditional classification and extraction methods of LULC based on remote sensing images.

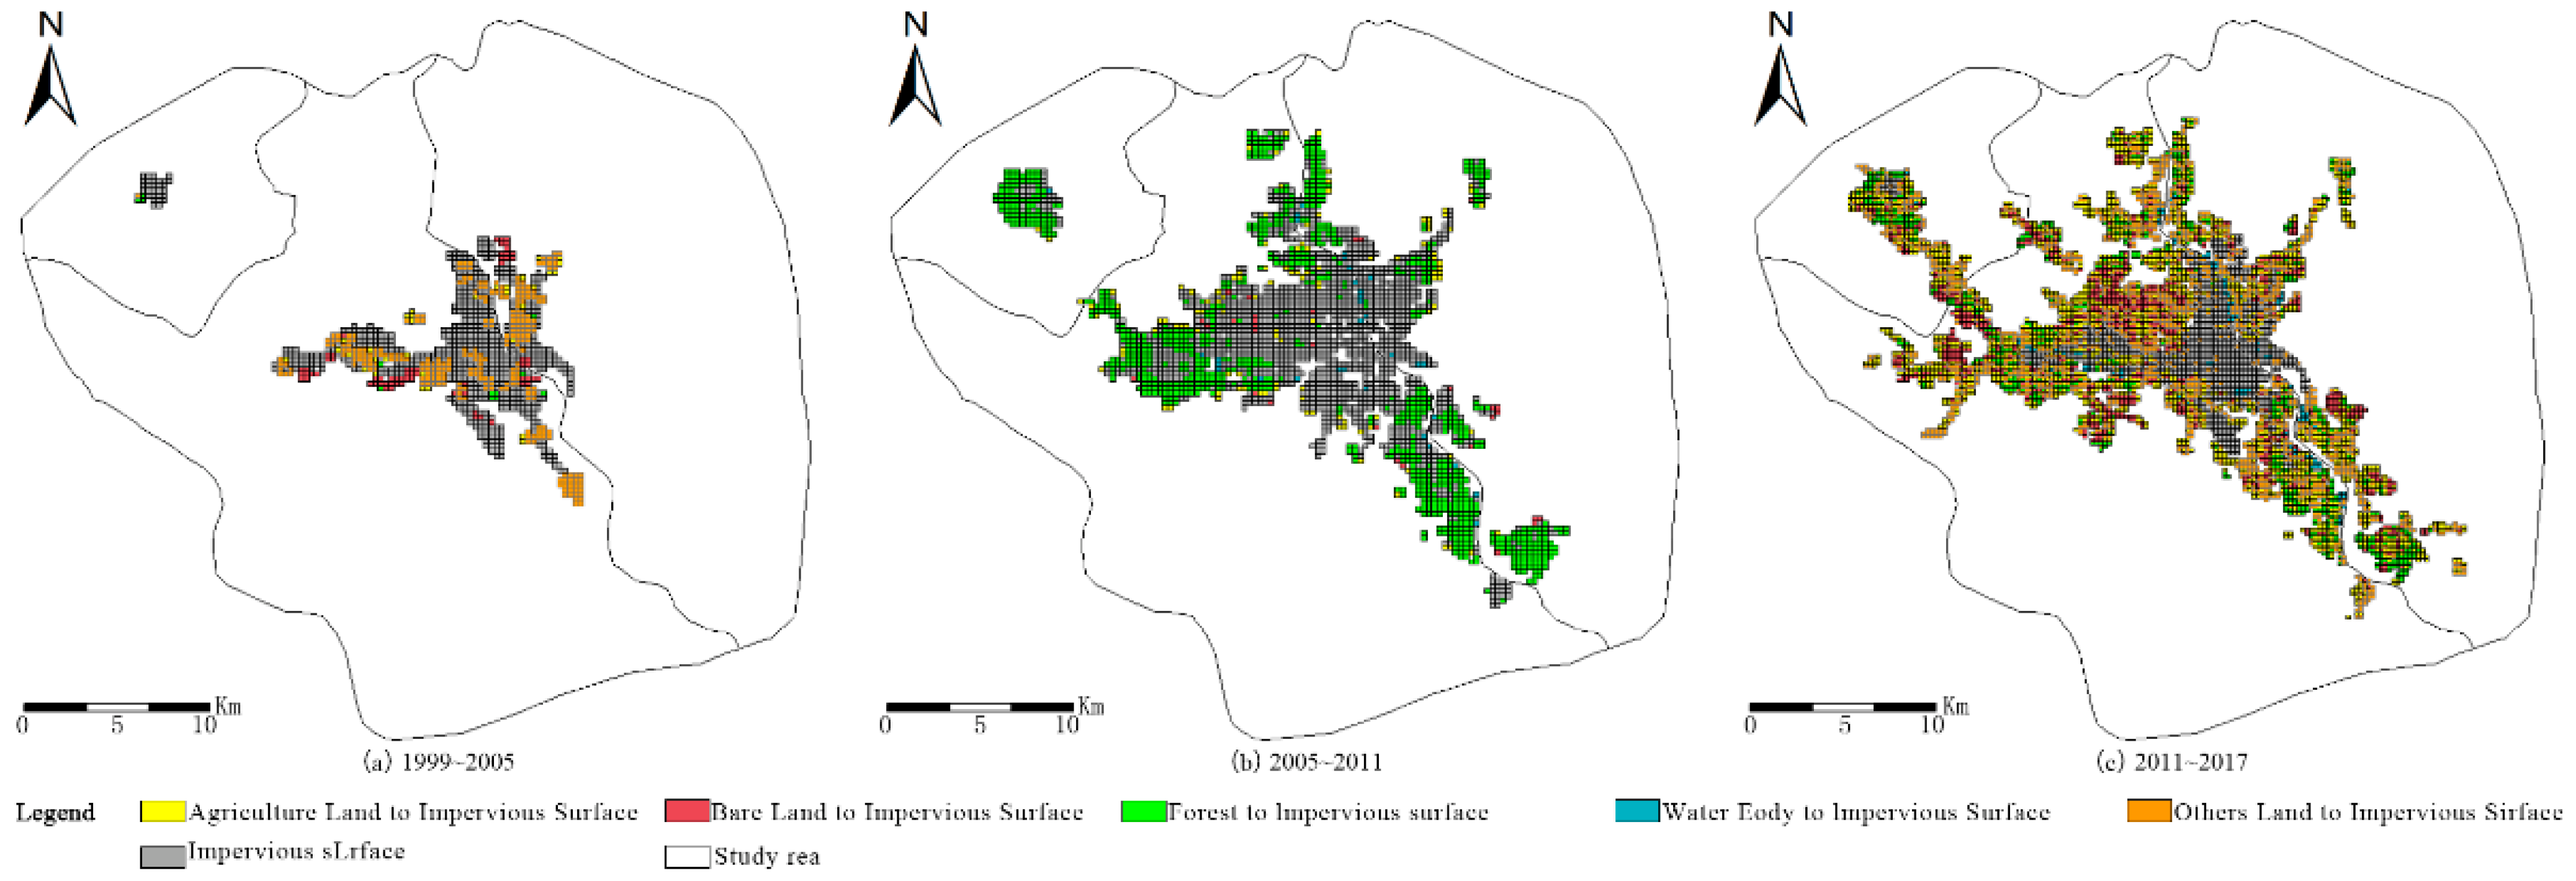
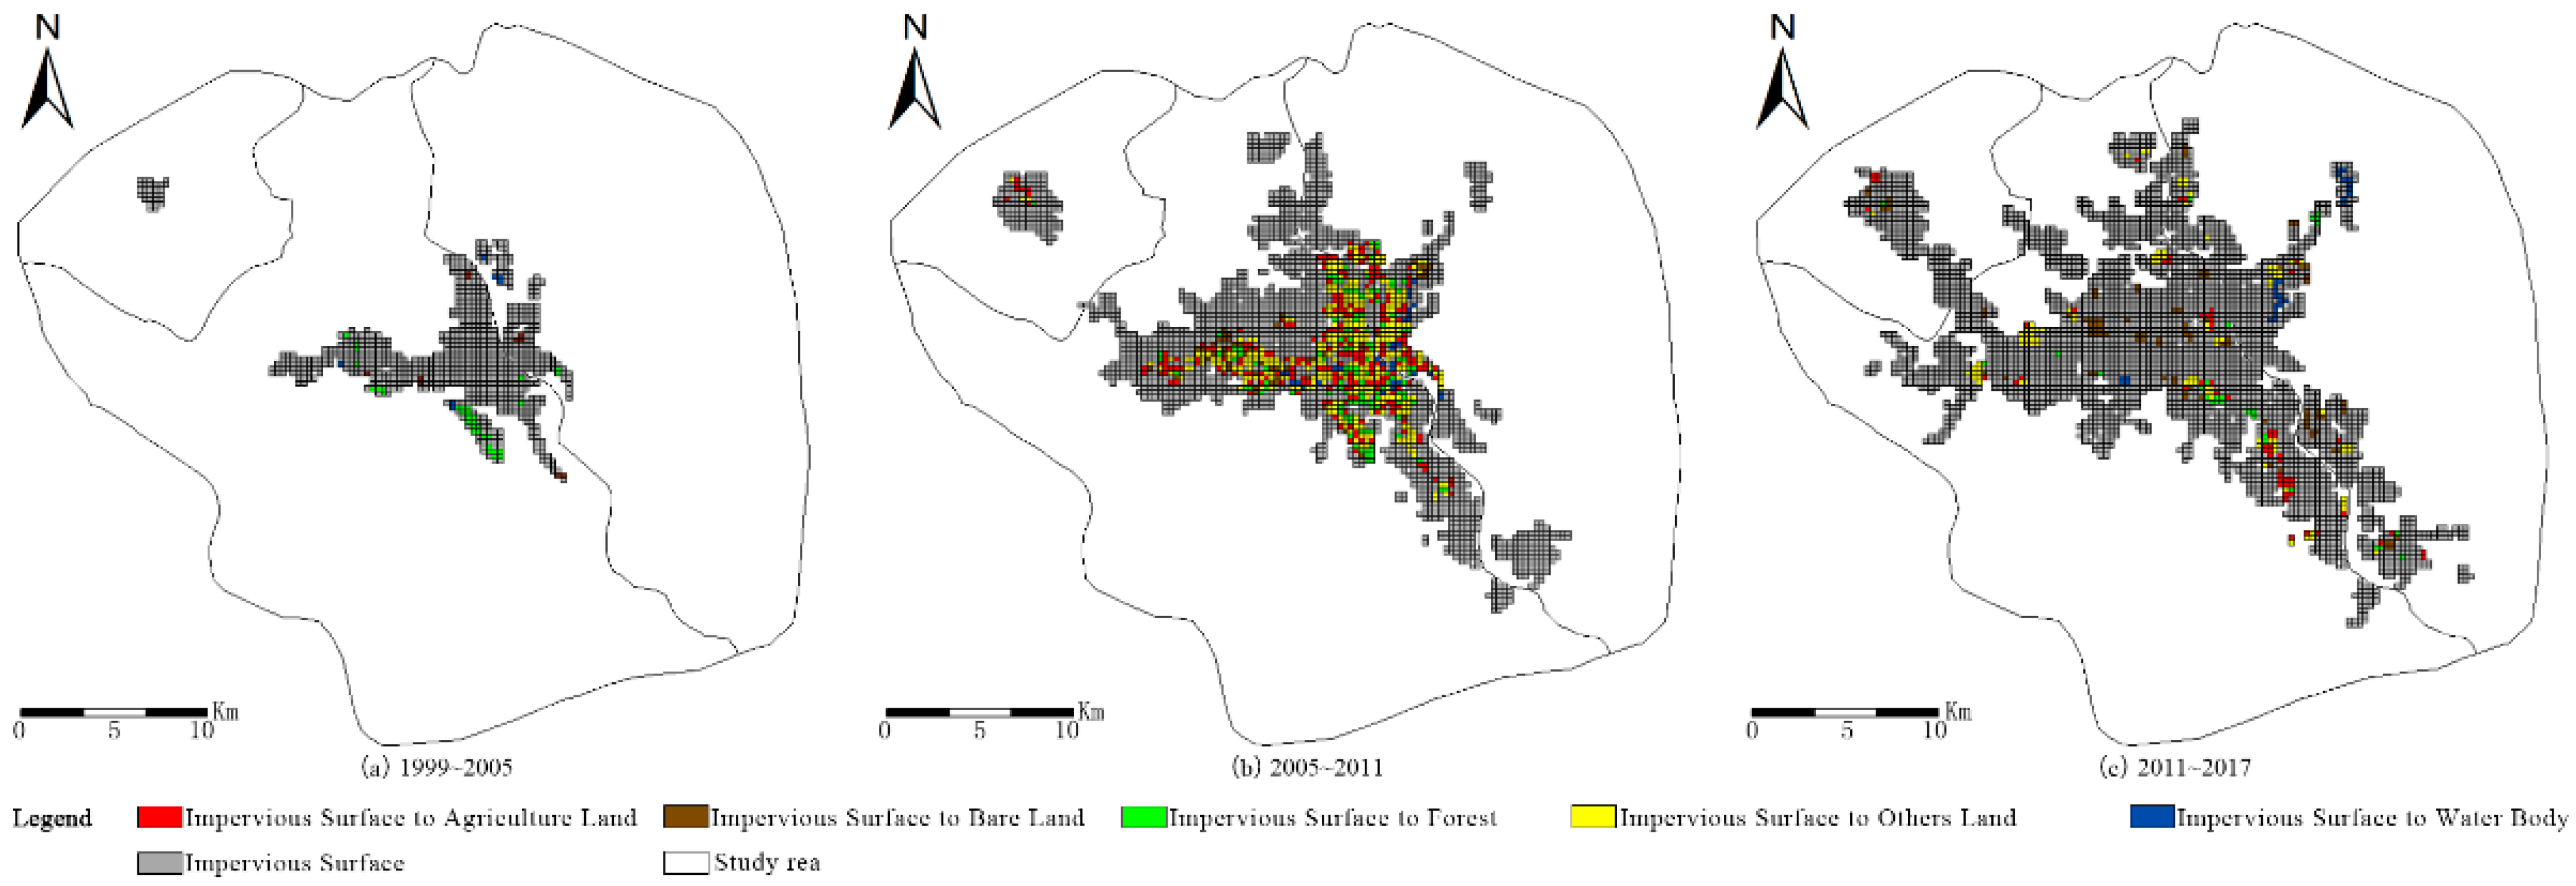
5.1.3. Expansion and Transpose of Urban Impervious Surface

The urban impervious surface defines as artificial surface cover form which contains architecture system including roof and square, etc. and traffic system including road and park, etc. The characteristics of LULC conversion of urban impervious surface were continuous transfer-in but less transfer-out, and the source and whereabouts were complex and diverse. The largest change regarding urban impervious surface was converted from agricultural land (27.36 km2) in 1999–2005, at the same time, the urban impervious surface with area of 1.09 km2 was transferred-out to the water body.
From 2005 to 2011, the total area of patches transferred to the urban impervious surface increased obviously (See in Figure 3), and the transfer sources were mainly “Other” land (22.55 km2) and agricultural land (21.89 km2). The increasing of the urban impervious surface makes this period as the development period of rapid urbanization.
The transfer-in and transfer-out of urban impervious surface decreased in 2011–2017 compared with 2005–2011. The LULC converted to urban impervious surface are mainly agricultural land (13.8 km2) and bare land (12.0 km2). Although with the small amount (1.38 km2), the most of the land of transferred-out from the urban impervious surface was converted to agricultural land (See in Figure 4). Up to now, the urban impervious surfaces were still a type of “only enter but no exit”.

5.2. Dynamic Evolution of Urban Resilience

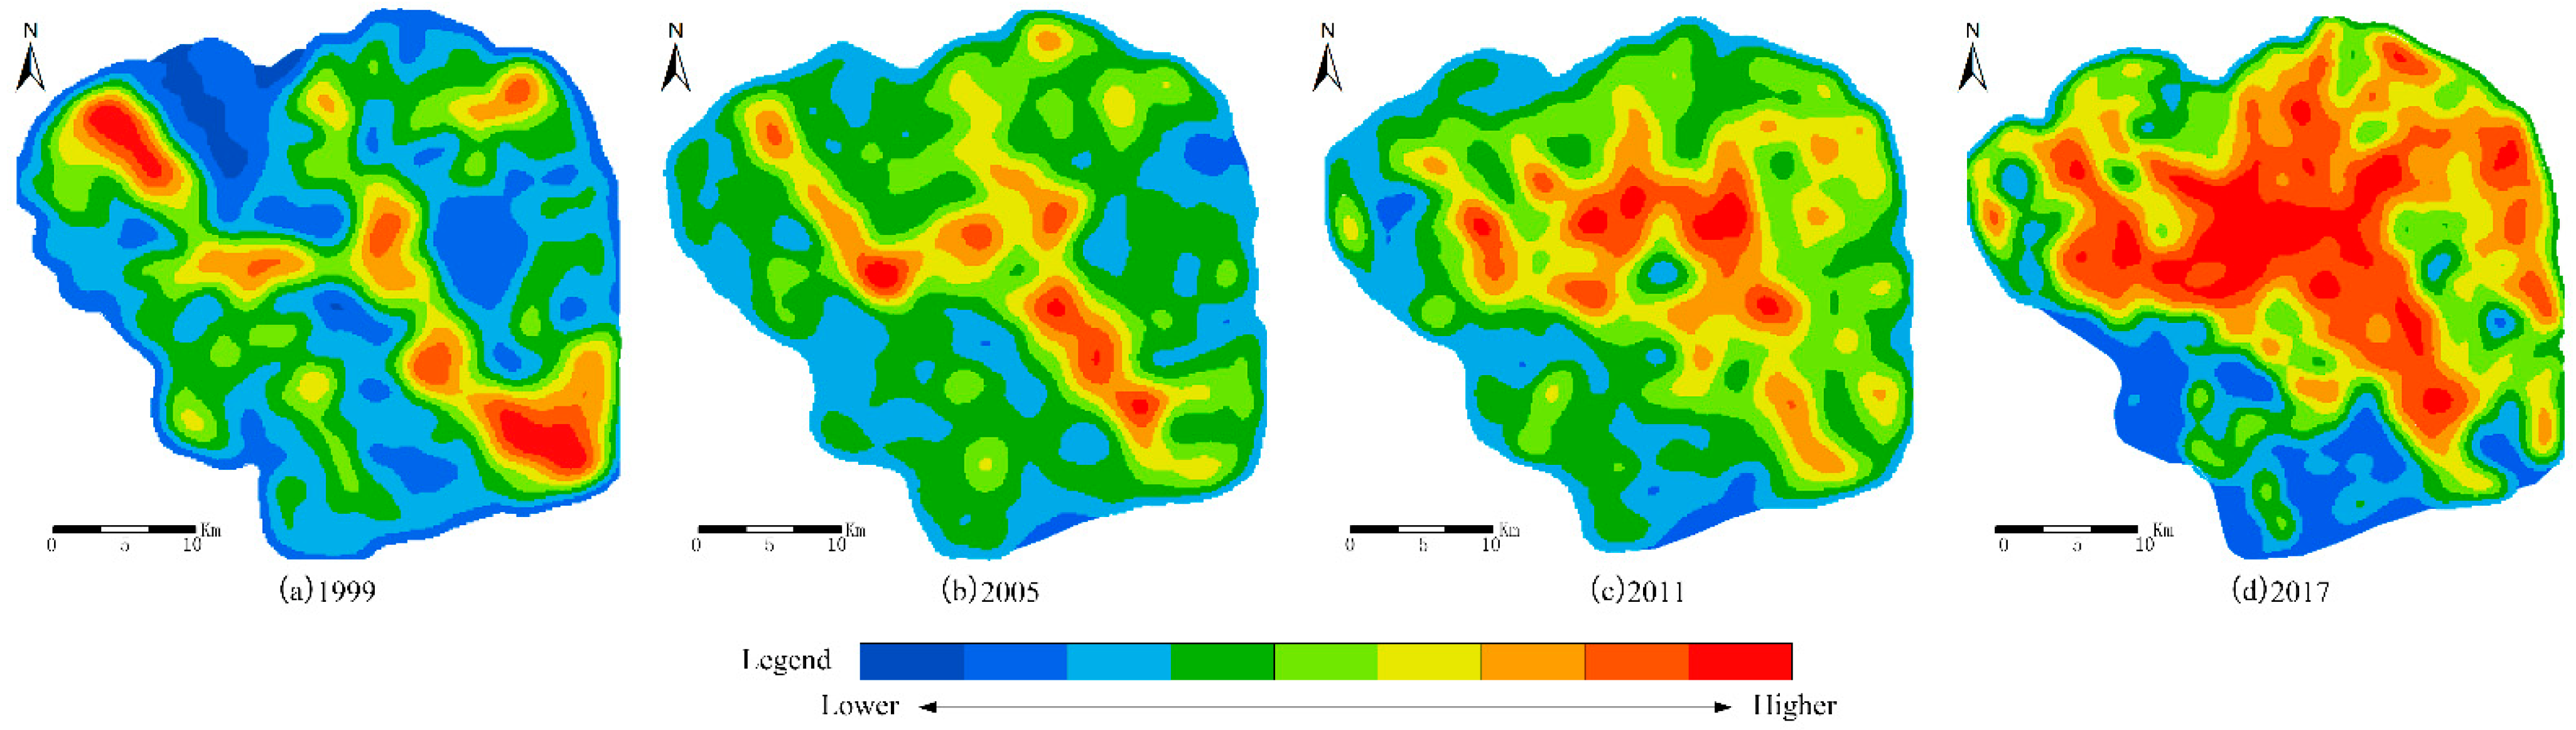
5.2.1. Urban Morphology Resilience

From 1999 to 2017, The highest morphology resilience of LULC were agriculture land and others land, followed by forest, bare land, water body, and the lowest was impervious surface (See in Table 3). Dynamic analysis of urban morphology from 1999 to 2017 shows a decreasing trend. From the viewpoint of patch level, the complexity of homogeneous patch shape and heterogeneous patch combination leads to the decrease of urban morphology resilience. With some exceptions, the morphological resilience of forest land is enhanced because the near-circularity and compactness of shape of forest were improved both single patch and the combination among patches. However, the development trend of all other land is opposite to that of forest land, so the resilience of urban morphology has not improved during the 20 years of urban development.

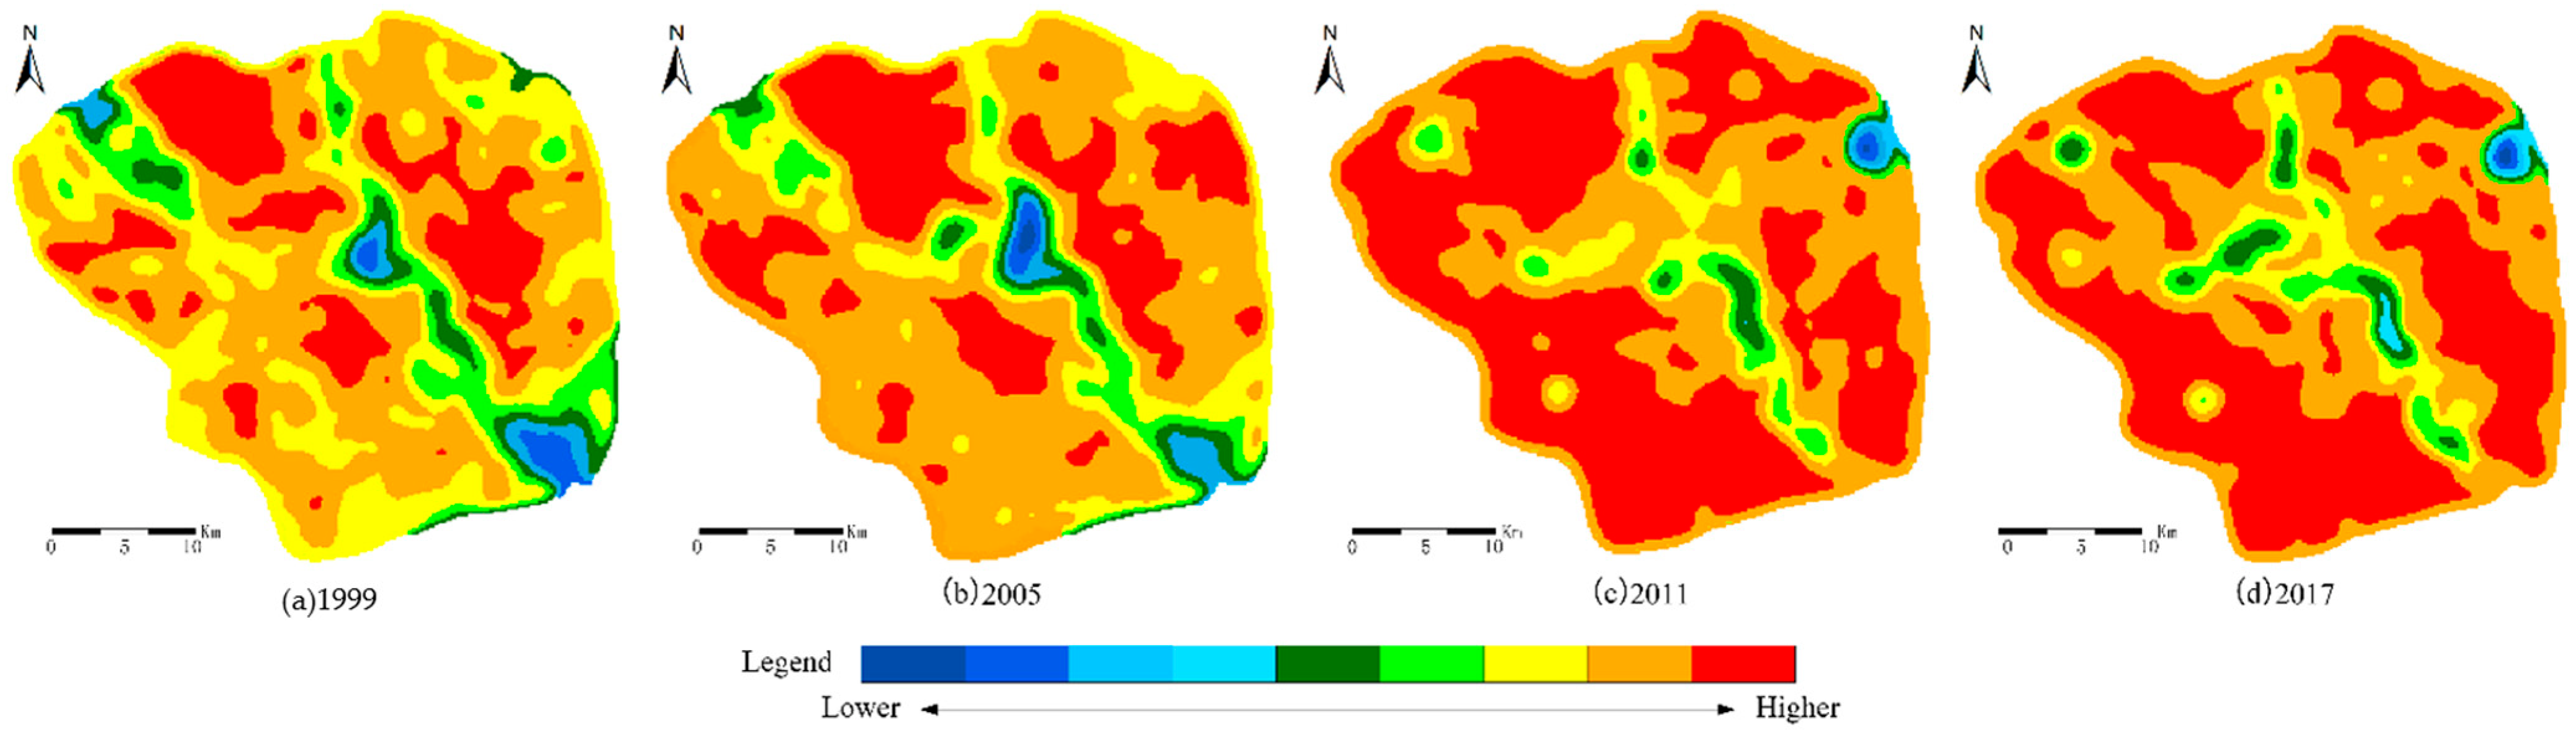
5.2.2. Urban Density Resilience

In general, the urban density resilience of urban system was improved (See in Table 4). It shows that, the development trend of LULC spatial layout and structure ratio were more rational with the increased of land mixing degree. It was conducive to the urban system from the land use structure on the reduce of risks caused by uncertain factors. In addition, depending on the type of LULC, the density resilience of urban gray landscape (urban impervious surface and urban bare land) was less than that of urban green and blue landscape (agriculture land and forest). For example, the index of urban density resilience of urban impervious surface had gradually increased from 0.527 in 1999 to 0.650 in 2011, and then basically stabilized at 0.610 in 2017. While that of agricultural land was between 0.957–0.984, with an average of 0.973. The urban bare land was the land use/cover type with the fastest change of spatial layout and conversion. The water body was the land use type with the lowest value of density resilience, which was the key points to be considered in the study area to improve the whole resilience of urban land use structures.

5.3. Coordination Analysis of Urban Resilience and LULC

The CCD between urban morphological resilience and LULC were between 0.590–0.819. And the grade of CCD was from reluctant coupling to good coupling (See in Figure 5 and Table 5). Each of the LULC got the highest CCD with the morphology resilience of urban impervious surface. While the morphological resilience of each LULC also had the highest CCD with the agricultural land. Among them, it was highest (0.819) between the size change of agriculture land and the morphology resilience of impervious surface, and the grade of coupling coordination is good coupling.
The CCD between density resilience and LULC were between 0.611–0.790 belong to primary coupling and satisfactory coupling. And the density resilience of agricultural land got the highest degree of CCD with any other LULC (See in Figure 6 and Table 6), which reflects the land patch density of agricultural land was highly unified with the layout structure and spatial conversion of each LULC.
The CCD was 0.672 between patch change of morphology-density and area change of urban impervious surface (Table 7). It shows that the speed and intensity of urban expansion were primary coupling with the development of urban resilience. The spatial structure of LULC basically met the needs of the urban development direction. It was worth noting that the CCD between the morphology-density resilience and the urban impervious surface was the lowest (0.672) compared with that with any other LULC.

6. Discussions

6.1. Morphological and Density Characteristics of Urban Resilience

From the study area, urban morphology resilience was at 0.652–0.728, see in Table 4, and urban density resilience at 0.596–0.655, see in Table 4. From the perspective of dynamic changes, urban morphology resilience decreased showing a downward trend from 1999 to 2017, while urban density resilience was gradually increasing. The morphology and density resilience of agricultural land were the highest. The urban impervious surface and water body had the lowest value of morphology resilience and density resilience, respectively. This is mainly caused by the ecological characteristics of landscape patches.The more obvious the difference and irregularity of the patch shape, density, and size of urban land types, the lower the connectivity and compactness, and the lower the urban resilience. The complex shape and structure of the urban impervious surface patches are high, which reduces urban resilience. This is in line with the conclusions of existing studies, Mianyang has the strongest UHI effect on urban impervious surfaces than other land use type [51].
On the contrary, Mixed evidence is reported on the association between compactness and the effect of UHI [5]. A county level cross-sectional study shows that the UHI effect is more intense in compact counties. Increase in the UHI effect (due to increase in density) not only increases energy demand for cooling in hot climates, but also may cause higher mortality in compact urban areas as observed during Europe’s 2003 heat wave [52]. Therefore, an important issue to note is that the impact of compact/decentralized urban scenes may vary from location to location.
The morphological and density characteristics of urban land patches are closely related to urban ecological environment such as UHI effect and biodiversity. Urban form would affect UHI intensity to the extent that it alters the thermal properties of urban surfaces [53]. Regular land landscapes are more advantageous in terms of connectivity and absorbing capacity of urban resilience [54]. For example, the park cold island (PCI) effect of an irregularly shaped park has a lower intensity, while regular-shaped land has more advantages in terms of PCI [46] and biodiversity of protection of monkey [54]. Urban density resilience is determined by whether the space ratio between different types of land is reasonable. Regarding to urban ecological security, its spatial configuration is particularly important when the area of blue landscape and green landscape is constant. This is consistent with the following research conclusions. The more irregular the boundary of the patch and the more severe the fragmentation of the landscape, the more likely the lake water quality is to be polluted [55]. And Jakarta’s patches of impervious surface were larger, more complex, and more aggregated than those of Bangkok and Manila. This helps explain why Jakarta’s impervious surface had the highest mean LST among the three cities [56].

6.2. Coupling Relationships between Urban Expansion and the Urban Resilience

The expansion of urban impervious surface in Mianyang during 2011–2017 was mainly based on the utilization of bare land, and the damage to the connectivity of the landscape during the expansion was lower than that of 1999–2011. Therefore, the satisfactory coordinated coupling and primary coordinated coupling are the final summary of the relationship between urban expansion and urban resilience in the study area, which belong to acceptable scope (see in Table 7). If the urban impervious surface comes from the encroachment of agriculture land and forest, it will bring about a decline in urban resilience, while if urban growth means the internal revitalization of the old slum and the external exploration of bare land and tidal flats, then the urban resilience will not reduce. “Where did the land resource come from for urban expansion” is something that needs to be focused on in research on the coordinated development of urban expansion and urban resilience. Changes in LULC and conversion patterns are the main reasons that determine whether urban expansion will be accompanied by a decrease in urban resilience.
There are many research methods on urban resilience and coupling coordinated development. Undeniably, A notable limitation of the present analysis is that our urban form measures focus only on the macro spatial structure at the urbanized area level [57], leaving out other urban form dimensions such as street connectivity. The advantage of our research framework is that it is easy to operate and implement, and the required data is easy to obtain, which is very important for hilly cities. Due to affect by water vapor, clouds, and topography, etc., high-definition remote sensing images are difficult to obtain for hilly cities.

7. Conclusions

We studied the characteristics of urban morphology and density resilience in terms of urban land use at the patch scale in Chinese hilly city of Mianyang from the landscape-ecology perspective, and found that it can well reflect the urban resilience during urban expansion. We advocate that the resilience approach, instead of focusing on the resources consumed by cities, deeper analyses the interdependencies along the chain of supply and demand. The dynamic relationship between urban land transfer mode and urban resilience development level is the crux of urban resilience development research. Based on the land use maps, we effectively estimated the urban resilience through the urban morphology and density, and further revealed the coupling relationships between the urban resilience and LULC. The urban morphology can characterize the UHI effect, and the urban density can evaluate biodiversity. The coupling relationships can be used to characterize whether the city is sustainable, healthy, and resilient development. In the future, we should pay more attention to the integrated research of the integration of multiple resources such as population density, transportation network, and land attributes, as well as increase the horizontal comparison and verification experiment in the method.

Author Contributions

Conceptualization, Q.C. and A.V.R.; methodology, Q.C. and M.S.; software, M.S.; validation, Q.C.; formal analysis, Q.C.; investigation, Q.C. and M.S.; writing—original draft preparation, Q.C., B.R. and Y.H.; writing—review and editing, Q.C. and B.R.; visualization, B.R.; supervision, G.Z.; project administration, Q.C. and M.S.; funding acquisition, Q.C. and M.S. All authors have read and agreed to the published version of the manuscript.

Funding

This research was funded by (1) the Foreign Expert Project Foundation of Ministry of Science and Technology of China (Grant No. G2021036009L). (2) the Landscape and Recreation Research Center Foundation of Sichuan (Grant No. JGYQ2021035). (3) the National Natural Science Foundation of China (Grant No. 41701172). http://www.nsfc.gov.cn/ (accessed on 18 August 2018). The funders had no role in study design, data collection and analysis, decision to publish, or preparation of the manuscript. (4) the National Natural Science Foundation of China (Grant No. 51908475). http://www.nsfc.gov.cn/ (accessed on 20 August 2020). The funders had no role in study.

Institutional Review Board Statement

Not applicable.

Informed Consent Statement

Informed consent was obtained from all subjects involved in the study.

Data Availability Statement

Restrictions apply to the availability of these data. Data was obtained from Google Map at public network and are available at https://earthexplorer.usgs.gov/, (accessed on 10 September 2021).

Conflicts of Interest

The authors declare no conflict of interest.

References

  1. Liu, Z.; Xiu, C.; Song, W. Landscape-Based Assessment of Urban Resilience and Its Evolution: A Case Study of the Central City of Shenyang. Sustainability 2019, 11, 2964. [Google Scholar] [CrossRef] [Green Version]
  2. Du, M.; Zhang, X.; Wang, Y.; Tao, L.; Li, H. An operationalizing model for measuring urban resilience on land expansion. Habitat Int. 2020, 102, 102206. [Google Scholar] [CrossRef]
  3. Oertli, B.; Parris, K.M. Review: Toward management of urban ponds for freshwater biodiversity. Ecosphere 2019, 10, e02810. [Google Scholar] [CrossRef] [Green Version]
  4. Nozdrovická, J.; Dostál, I.; Petroviˇc, F.; Jakab, I.; Havlíˇcek, M.; Skokanová, H.; Falt’an, V.; Mederly, P. Land-Use Dynamics in Transport-Impacted Urban Fabric: A Case Study of Martin-Vrútky, Slovakia. Land 2020, 9, 273. [Google Scholar] [CrossRef]
  5. Sharifi, A. Resilient urban forms: A macro-scale analysis. Cities 2019, 85, 1–14. [Google Scholar] [CrossRef]
  6. Feng, X.; Xiu, C.; Bai, L.; Zhong, Y.; Wei, Y. Comprehensive evaluation of urban resilience based on the perspective of landscape pattern: A case study of Shenyang city. Cities 2020, 104, 102722. [Google Scholar] [CrossRef]
  7. Harrison, P.; Bobbins, K.; Culwick, C.; Humby, T.L.; La Mantia, C.; Todes, A.; Weakley, D. Urban Resilience Thinking for Municipalities; University of the Witwatersrand, Gauteng City-Region Observatory: John Leesburg, South Africa, 2016. [Google Scholar]
  8. Lohrey, S.; Creutzig, F. A ‘Sustainability Window’ of Urban Form. Transp. Res. Part D Transp. Environ. 2016, 45, 96–111. [Google Scholar] [CrossRef]
  9. Ahern, J. Urban landscape sustainability and resilience: The promise and challenges of integrating ecology with urban planning and design. Landsc. Ecol. 2013, 28, 1203–1212. [Google Scholar] [CrossRef]
  10. Chen, Y.; Ge, Y.; Chen, R. Recent Advances in Urban Resilience Research Abroad under Climate Change: A Bibliometric Analysis Based on Citespace. Disaster Sci. 2020, 2, 136–141. [Google Scholar]
  11. Meerow, S.; Newell, J.P.; Stults, M. Defining urban resilience: A review. Landsc. Urban Plan. 2016, 147, 38–49. [Google Scholar] [CrossRef]
  12. Spaans, M.; Waterhout, B. Building up resilience in cities worldwide—Rotterdam as participant in the 100 Resilient Cities Programme. Cities 2017, 61, 109–116. [Google Scholar] [CrossRef] [Green Version]
  13. Pelling, M. The Vulnerability of Cities: Natural Disasters and Social Resilience; Earthscan Publications Ltd.: London, UK, 2012. [Google Scholar]
  14. O’Brien, K.; Hayward, B.; Berkes, F. Rethinking Social Contracts: Building Resilience in a Changing Climate. Ecol. Soc. 2009, 14, 292. [Google Scholar] [CrossRef] [Green Version]
  15. Tanner, T.; Mitchell, T.; Polack, E.; Guenther, B. Urban Governance for Adaptation: Assessing Climate Change Resilience in Ten Asian Cities. IDS Work. Pap. 2009, 2009, 1–47. [Google Scholar] [CrossRef]
  16. Hardoy, J.; Pandiella, G. Urban poverty and vulnerability to climate change in Latin America. Environ. Urban. 2009, 21, 203–224. [Google Scholar] [CrossRef] [Green Version]
  17. Ernstson, H.; Van Der Leeuw, S.E.; Redman, C.L.; Meffert, D.J.; Davis, G.E.; Alfsen, C.; Elmqvist, T. Urban Transitions: On Urban Resilience and Human-Dominated Ecosystems. AMBIO 2010, 39, 531–545. [Google Scholar] [CrossRef] [PubMed] [Green Version]
  18. Chen, A.; Sun, R.; Chen, L. Studies on urban heat island from a landscape pattern view: A review. Acta Ecol. Sin. 2012, 32, 4553–4565. [Google Scholar] [CrossRef] [Green Version]
  19. MA, Y.; Huang, Y.; Yang, J. Effects of Landscape Pattern Change on Urban Heat-island Effect in Arid Areas—A Case Study in Urumqi. Arid. Zone Res. 2006, 23, 172–176. [Google Scholar]
  20. Wang, Y.; Zhao, Y.; Han, L. Coupling relationship of landscape pattern and urban heat island effect in Xi’an, China. Chin. J. Appl. Ecol. 2017, 28, 2621–2628. [Google Scholar]
  21. Yuan, Z.; Wu, X.; Zang, S. Cooling Effect of Green Patches Based on TM Image in Harbin Downtown City. Sci. Geogr. Sin. 2017, 37, 1600–1608. [Google Scholar]
  22. Feyisa, G.L.; Dons, K.; Meilby, H. Efficiency of parks in mitigating urban heat island effect: An example from Addis Ababa. Landsc. Urban Plan. 2014, 123, 87–95. [Google Scholar] [CrossRef]
  23. Davoudi, S.; Crawford, J.; Mehmood, A. Planning for Climate Change: Strategies for Mitigation and Adaptation for Spatial Planners. Int. J. Clim. Chang. Strateg. Manag. 2009, 48, 2905–2910. [Google Scholar]
  24. Jabareen, Y. Planning the resilient city: Concepts and strategies for coping with climate change and environmental risk. Cities 2013, 31, 220–229. [Google Scholar] [CrossRef]
  25. Lam, N.S.-N.; Arenas, H.; Brito, P.L.; Liu, K.-B. Assessment of vulnerability and adaptive capacity to coastal hazards in the Caribbean Region. J. Coast. Res. 2014, 70, 473–478. [Google Scholar] [CrossRef]
  26. Fleischhauer, M. The Role of Spatial Planning in Strengthening Urban Resilience. Overexploitation Contam. Shar. Groundw. Resour. 2008, 4, 273–298. [Google Scholar]
  27. Ahern, J.; Cilliers, S.; Niemelä, J. The concept of ecosystem services in adaptive urban planning and design: A framework for supporting innovation. Landsc. Urban Plan. 2014, 125, 254–259. [Google Scholar] [CrossRef] [Green Version]
  28. Mcmichael, A.J. Global climate change and health: An old story writ large. In Mudana Climática Geneva; World Health organization: Geneva, Switzerland, 2003. [Google Scholar]
  29. Xu, J.; Sharma, R.; Fang, J.; Xu, Y. Critical linkages between land-use transition and human health in the Himalayan region. Environ. Int. 2008, 34, 239–247. [Google Scholar] [CrossRef]
  30. Wu, J. Landscape ecology. In Encyclopedia of Ecology; Jorgensen, S.E., Ed.; Elsevier: Oxford, UK; Elsevier: Amsterdam, The Netherlands, 2008. [Google Scholar]
  31. Wu, J.; Hobbs, R.J. Key Topics in Landscape Ecology; Cambridge University Press: Cambridge, UK, 2007. [Google Scholar]
  32. Botequilha Leitão, A.; Miller, J.N.; Mc, G.K. Landscape Metrics for Planning and Management: A primer and Handbook; Island Press: Washington, WS, USA, 2011. [Google Scholar]
  33. Li, X.; Lu, L.; Cheng, G.; Xiao, H. Quantifying landscape structure of the Heihe River Basin, north-west China using FRAGSTATS. J. Arid. Environ. 2001, 48, 521–535. [Google Scholar] [CrossRef]
  34. DiBari, J.N. Evaluation of five landscape-level metrics for measuring the effects of urbanization on landscape structure: The case of Tucson, Arizona, USA. Landsc. Urban Plan. 2007, 79, 308–313. [Google Scholar] [CrossRef]
  35. Tang, J.; Wang, L.; Yao, Z. Analyzing Urban Sprawl Spatial Fragmentation Using Multi-temporal Satellite Images. Mapp. Sci. Remote Sens. 2006, 43, 218–232. [Google Scholar] [CrossRef] [Green Version]
  36. Poelmans, L.; Van Rompaey, A. Complexity and performance of urban expansion models. Comput. Environ. Urban Syst. 2010, 34, 17–27. [Google Scholar] [CrossRef]
  37. Rui, Y.; Ban, Y. Multi-agent Simulation for Modeling Urban Sprawl in the Greater Toronto Area. In Proceedings of the 13th AGILE International Conference on Geographic Information Science 2010, Guimarães, Portugal, 10–14 May 2010. [Google Scholar]
  38. Ma, S.; Li, X.; Cai, Y. Delimiting the urban growth boundaries with a modified ant colony optimization model. Comput. Environ. Urban Syst. 2017, 62, 146–155. [Google Scholar] [CrossRef]
  39. Chen, L.; Fu, B.; Zhao, W. Source-sink landscape theory and its ecological significance. Front. Biol. China 2008, 3, 131–136. [Google Scholar] [CrossRef]
  40. Gao, J.; Gong, J.; Li, J. Effects of source and sink landscape pattern on land surface temperature: An urban heat island study in Wuhan City. Prog. Geogr. 2019, 38, 1770–1782. [Google Scholar] [CrossRef] [Green Version]
  41. Chen, L.; Fu, B.; Xu, J.; Gong, J. Location-weighted landscape contrast index: A scale independent approach for landscape pattern evaluation based on “Source-Sink” ecological processes. Acta Ecol. Sin. 2003, 23, 2406–2413. [Google Scholar]
  42. Xu, S. An approach to analyzing the intensity of the daytime surface urban heat island effect at a local scale. Environ. Monit. Assess. 2008, 151, 289–300. [Google Scholar] [CrossRef]
  43. Dong, T.; Jiao, L.M.; Xu, G. Extracting City Bare Land Using Hierarchical Classification Method. J. Geomat. 2016, 41, 56–61. [Google Scholar]
  44. Salat, S.; Bourdic, L. Urban Complexity, Efficiency and Resilience. In Energy Efficiency-A Bridge to Low Carbon Economy; InTech: Rijeka, Croayia, 2012. [Google Scholar]
  45. Monteiro, M.; Doick, K.J.; Handley, P.; Peace, A. The Impact of Greenspace Size on the Extent of Local Nocturnal Air Tem-perature Cooling in London. Urban For. Urban Green. 2016, 16, 160–169. [Google Scholar] [CrossRef]
  46. Cao, X.; Onishi, A.; Chen, J.; Imura, H. Quantifying the cool island intensity of urban parks using ASTER and IKONOS data. Landsc. Urban Plan. 2010, 96, 224–231. [Google Scholar] [CrossRef]
  47. Li, X.; Xu, H.Q.; Li, J.; Guo, Y.B. Extraction of Bare Soil Features from SPOT-5 Imagery Based on NDSI and NDISI. J. Geo-Inf. Sci. 2016, 18, 117–123. [Google Scholar]
  48. Maimaitiaili, A.; Aji, X.; Matniyaz, A.; Kondoh, A. Monitoring and Analysing Land Use/Cover Changes in an Arid Region Based on Multi-Satellite Data: The Kashgar Region, Northwest China. Land 2018, 7, 6. [Google Scholar] [CrossRef] [Green Version]
  49. Jing, W.; Zhang, P.; Zhao, X. Reconstructing Monthly ECV Global Soil Moisture with an Improved Spatial Resolution. Water Resour. Manag. 2018, 32, 2523–2537. [Google Scholar] [CrossRef]
  50. Cao, Q.; Shi, M. Spatio-temporal distribution and classification of utilization of urban bare lots in low-slope hilly regions. PLoS ONE 2021, 16, e0246746. [Google Scholar] [CrossRef] [PubMed]
  51. Cao, Q.; Shi, M.J.; Zhou, L.; Wang, T.; Peng, L.J.; Zheng, S.L. Study of the response characteristic of thermal environment with spatial and temporal changes of bare land in the mountain city. Remote Sens. Land Resour. 2019, 31, 190–198. [Google Scholar]
  52. Ewing, R.; Rong, F. The impact of urban form on U.S. residential energy use. Hous. Policy Debate 2008, 19, 1–30. [Google Scholar] [CrossRef]
  53. Oke, T.R.; Johnson, G.T.; Steyn, D.G.; Watson, I.D. Simulation of surface urban heat islands under ?ideal? conditions at night part 2: Diagnosis of causation. Bound. Layer Meteorol. 1991, 56, 339–358. [Google Scholar] [CrossRef]
  54. Guan, C.Y.; Chen, Z.; Hang, C.M.; Zhou, Q.H. Analysis of fragmentation in landscape pattern for the Francois langur’s habitats in Gangxi and its influence on population. Acta Ecol. Sin. 2022, 42, 216–221. [Google Scholar]
  55. Qi, L.L.; Wang, J.L.; Ye, H.; Zhu, H. Study on the Land Use Landscape Pattern and Water Quality Change in the ‘There Lakes’ Basin in Central Yunnan. Res. Soil Water Conserv. 2021, 28, 199–208. [Google Scholar]
  56. Estoque, R.C.; Murayama, Y.; Myint, S.W. Effects of landscape composition and pattern on land surface temperature: An urban heat island study in the megacities of Southeast Asia. Sci. Total Environ. 2017, 577, 349–359. [Google Scholar] [CrossRef]
  57. Lee, S.; Lee, B. The influence of urban form on GHG emissions in the U.S. household sector. Energy Policy 2014, 68, 534–549. [Google Scholar] [CrossRef]
Figure 1. Land use and land cover change in 1999–2017.
Remotesensing 13 04887 g001
Figure 2. Conversion map of LULC.
Remotesensing 13 04887 g002
Figure 3. Conversation-into urban impervious surface in 1999–2017.
Remotesensing 13 04887 g003
Figure 4. Conversation-out from urban impervious surface in 1999–2017.
Remotesensing 13 04887 g004
Figure 5. The spatial correlation of urban morphological resilience of Mianyang.
Remotesensing 13 04887 g005
Figure 6. The spatial correlation of urban density resilience of Mianyang.
Remotesensing 13 04887 g006
Table 1. The classification criteria of coupling coordination degree.
ScopeCoupling Coordination Level (D)Rank
Coordination development
(Acceptable scope)
0.90–1.00Excellent coupling
0.80–0.89Good coupling
0.70–0.79Satisfactory coupling
0.60–0.69Primary coupling
Transformation development
(Transitional scope)
0.50–0.59Reluctant coupling
0.40–0.49Near disorder
Disorder development
(Unacceptable scope)
0.30–0.39Mild disorder
0.20–0.29Moderate disorder
0.10–0.19Serious disorder
0.00–0.09Extreme disorder
Table 2. The growth intensity index of different types of LULC.
Growing Intensity/%Impervious SurfaceBare LandForestWater BodyAgriculture LandOthers Land
1999–200518.911.6−3.00.3−0.69.9
2005–2011164.750.2−11.63.6−4.0−19.6
2011–201736.59.7−5.3−0.1−11.775.9
Table 3. Urban morphology resilience index of each landscape of Mianyang.
Impervious SurfaceBare LandForestWaterArable LandOther LandAverage
19990.5050.6370.6410.6680.9030.9350.715
20050.4600.7010.7280.6770.8970.9020.728
20110.5020.6140.7150.4580.8870.9250.684
20170.3510.6170.7130.4540.8830.8960.652
Table 4. Urban density resilience index of each landscape of Mianyang.
Impervious SurfaceBare LandForestWaterArable LandOther LandAverage
19990.5270.6610.50.3210.9670.60.596
20050.6010.6150.5890.2510.9570.5810.599
20110.6500.7240.7510.2310.9840.5910.655
20170.6100.6070.790.0830.9830.640.619
Table 5. The CCD between urban growth and urban morphology resilience of Mianyang.
Urban Morphology Resilience
Impervious SurfaceBare LandForestWaterAgriculture LandOther Land
Area changeImpervious surface0.7320.6100.7310.6780.6710.671
Bare land0.7560.6300.7560.7000.6930.693
Forest0.7690.6410.7680.7120.7050.705
Water0.7660.6380.7650.7090.7020.702
Agriculture land0.8190.6820.8180.7580.7510.750
Others land0.7080.5900.7070.6560.6490.649
Table 6. The CCD between urban growth and urban density resilience of Mianyang.
Urban Density Resilience
Impervious SurfaceBare LandForestWaterAgriculture LandOther Land
Area
change
Impervious surface0.7020.6360.6940.7060.7070.632
Bare land0.7250.6570.7170.7060.7300.653
Forest0.7380.6680.7290.7420.7420.664
Water0.7340.6650.7260.7390.7390.661
Agriculture land0.7850.7110.7760.7900.7900.706
Others land0.6790.6150.6710.6830.6830.611
Table 7. The CCD between urban growth and urban morphology-density resilience of Mianyang.
Urban Morphology-Density Resilience
Impervious SurfaceBare LandForestWaterAgriculture LandOther Land
Area changeImpervious surface0.6720.7160.7100.6960.7360.726
Bare land0.6940.7390.7340.7190.7610.749
Forest0.7060.7520.7460.7310.7730.762
Water0.7030.7490.7430.7280.7700.759
Agriculture land0.7510.8000.7940.7790.8230.811
Others land0.7460.7940.7880.7730.8170.805
Publisher’s Note: MDPI stays neutral with regard to jurisdictional claims in published maps and institutional affiliations.

