Abstract
The collapse of buildings caused by the earthquake seriously threatened human lives and safety. So, the quick detection of collapsed buildings from post-earthquake images is essential for disaster relief and disaster damage assessment. Compared with the traditional building extraction methods, the methods based on convolutional neural networks perform better because it can automatically extract high-dimensional abstract features from images. However, there are still many problems with deep learning in the extraction of collapsed buildings. For example, due to the complex scenes after the earthquake, the collapsed buildings are easily confused with the background, so it is difficult to fully use the multiple features extracted by collapsed buildings, which leads to time consumption and low accuracy of collapsed buildings extraction when training the model. In addition, model training is prone to overfitting, which reduces the performance of model migration. This paper proposes to use the improved classic version of the you only look once model (YOLOv4) to detect collapsed buildings from the post-earthquake aerial images. Specifically, the k-means algorithm is used to optimally select the number and size of anchors from the image. We replace the Resblock in CSPDarkNet53 in YOLOv4 with the ResNext block to improve the backbone’s ability and the performance of classification. Furthermore, to replace the loss function of YOLOv4 with the Focal-EOIU loss function. The result shows that compared with the original YOLOv4 model, our proposed method can extract collapsed buildings more accurately. The AP (average precision) increased from 88.23% to 93.76%. The detection speed reached 32.7 f/s. Our method not only improves the accuracy but also enhances the detection speed of the collapsed buildings. Moreover, providing a basis for the detection of large-scale collapsed buildings in the future.
1. Introduction
Earthquakes often cause serious damage to buildings. The rapid positioning of collapsed buildings can grasp the disaster situation at the first time [1], so as to better deploy disaster relief forces, thereby reducing personnel and property losses to the greatest extent. Traditional methods mainly use manual statistics to obtain the accurate location and number of collapsed buildings [2]. However, these methods cannot quickly obtain critical information about disasters, which is costly and threatens the lives of investigators, which hinders the deployment of rapid earthquake disaster rescue operations. Recently, with the appearance of various remote sensing datasets, remote sensing and information extraction technology have been widely used to study disaster element extraction.
There are many methods for extracting earthquake-damaged buildings based on remote sensing images [3,4]. According to the types of remote sensing data, there are radar [5,6], laser [7,8] and optical remote sensing data [9] for automatic building damage information extraction. As for the data usage methods, there are methods based on single-phase remote sensing images and multi-temporal remote sensing images to detect the collapsed buildings [10]. Zhou et al. [11] proposed a new cluster matching method using multi-temporal airborne LiDAR data and a density-based algorithm to detect the damage to community buildings by hurricanes. The robust matching of the clusters built before and after the disaster shows that the method can effectively identify building objects, extract damage features, and characterize the damage degree of a single building attribute. Janalipour et al. [12] proposed to build a new type of building damage automatic detection framework using only post-event LiDAR data. In this framework, three texture extraction strategies are first used to obtain texture features. Then, the extracted texture features K-means [13] and the nDSM method are used to detect damaged buildings. The results show that choosing an appropriate texture extraction strategy can greatly improve the accuracy of the extraction results. Moreover, the use of post-earthquake texture features combined with the K-means algorithm can achieve better building damage detection results.
Fan et al. [14] used the annual average of VIIRS night light data before and after the Nepal earthquake and MODIS land cover type data to select areas where the average image difference between pre- and post- the earthquake is greater than the selected threshold as the earthquake disaster area. It shows a good result but still has some shortcomings, such as the uncertainty and the low resolution of the night light data. Moya et al. [15] proposed an improved unsupervised logistic regression method to detect collapsed buildings in the 2011 Eastern Japan earthquake. It can significantly help to quickly estimate the number and locations of collapsed buildings, with an overall accuracy of over 80%. However, these methods all have the problems of the low resolution of remote sensing data, inconsistent quality of multi-temporal data, complicated data preprocessing process, manual selection of classification features, and insufficient image segmentation accuracy.
At present, in the field of computer vision, image classification and segmentation using convolutional neural networks has made a lot of progress [16,17]. The application of deep learning in remote sensing is becoming more and more extensive [18]. Some studies use a convolutional neural network (CNN) to detect damage to buildings and achieve better results than traditional methods [19]. Ji et al. [20] used a pre-trained VGG model to identify collapsed buildings caused by the Haiti earthquake using remote sensing spatial images before and after the earthquake. The experimental results show that the overall accuracy (OA) of the fine-tuned VGG model is increased from 83.38% to 85.19%, and Kappa is increased from 60.69% to 67.14%, the recognition effect of collapsed buildings performs better, the producer accuracy rate reaches 86.31% of earthquake-induced building destruction from space using a pretrained CNN model, which shows that the CNN model can effectively extract the features of damaged buildings. Wu et al. [21] proposed to use the improved U-Net network to classify collapsed buildings at the pixel level, and the classification accuracy obtained by this method reached 0.792.This method shows that the CNN network has great potential in the identification and classification of collapsed buildings. Compared with traditional object-oriented classification methods, the CNN-based object detection method can automatically select and extract classification features. It can not only classify the object of interest, but also determines the position and size of the target through the bounding box, which has strong learning capability and robustness. However, the current object detection models cannot balance the relationship between detection speed and detection accuracy [22]. Although Faster R-CNN [23] and Mask R-CNN [24] have higher accuracy, low speed detection cannot meet the application requirements of real-time detection. The you only look once (YOLO) model [25] has become a hot spot in the current object detection field under its balance of detection speed and better accuracy. Many versions of the YOLO model were developed. Xu [26] has proposed an improved YOLOv3 model that uses DenseNet (densely connected network) to enhance feature extraction capabilities. Based on the original YOLOv3 [27], the detection scale is increased to four. The improved model is applied to the remote sensing data set for object detection. Experiments show that this method is better than Fast-RCNN, SSD (single shot multibox detector), YOLOv3 and YOLOv3 tiny in terms of accuracy. Compared with the original YOLOv3, the AP (average precision) of this method is increased from 77.10% to 88.73%. Miura et al. [28] used the improved CNN network and aerial images acquired after the two earthquakes in Japan and relied on the CNN model to extract the feature that the rooves of damaged buildings were covered with blue tarpaulin after the earthquakes to classify the damage of buildings.
In this research, we propose to use the YOLOv4 model, not the newest but the classic version of the YOLO model [29], and aerial images to identify collapsed buildings after the earthquake. We improved the backbone of the YOLOv4 model, and the focal-EIOU loss function was used to get the higher detection speed and accuracy of the model. Section 2 introduces the research area and data. Section 3 explains the details of the model improvement. Section 4 describes the experimental setup and discussion results and evaluation indicators. Section 5 describes the conclusions and ideas for future research.
2. Materials and Methods
2.1. Material
2.1.1. Aerial Images
On 12 May 2008, a major earthquake occurred in Wenchuan, Sichuan Province. The magnitude reached 8. Another earthquake occurred in Yushu Tibetan Autonomous Prefecture, Qinghai Province on 14 April 2010. The magnitude reached 7.1. Both earthquakes caused a large number of collapsed buildings and casualties. In the Wenchuan earthquake, Beichuan County was one of the areas most damaged by the earthquake. Most of the masonry structure buildings in Beichuan County were damaged to varying degrees, such as wall cracking, partial collapse of buildings and overall collapse of buildings. In the Yushu earthquake, most buildings in the Jiegu Town area were of civil structure and their earthquake resistance was weak, which caused the collapse of more than 85% of the buildings in the area, and a large number of temple buildings collapsed.
This study uses the 0.5 m aerial images of Yushu earthquake and Beichuan earthquake acquired the day after the earthquake. These images include a large number of collapsed and uncollapsed buildings. The two-study area is presented in Figure 1.
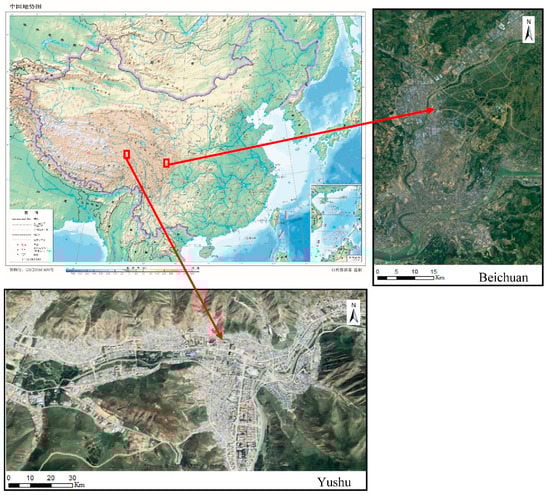
Figure 1.
Location of the study areas.
2.1.2. Input Images
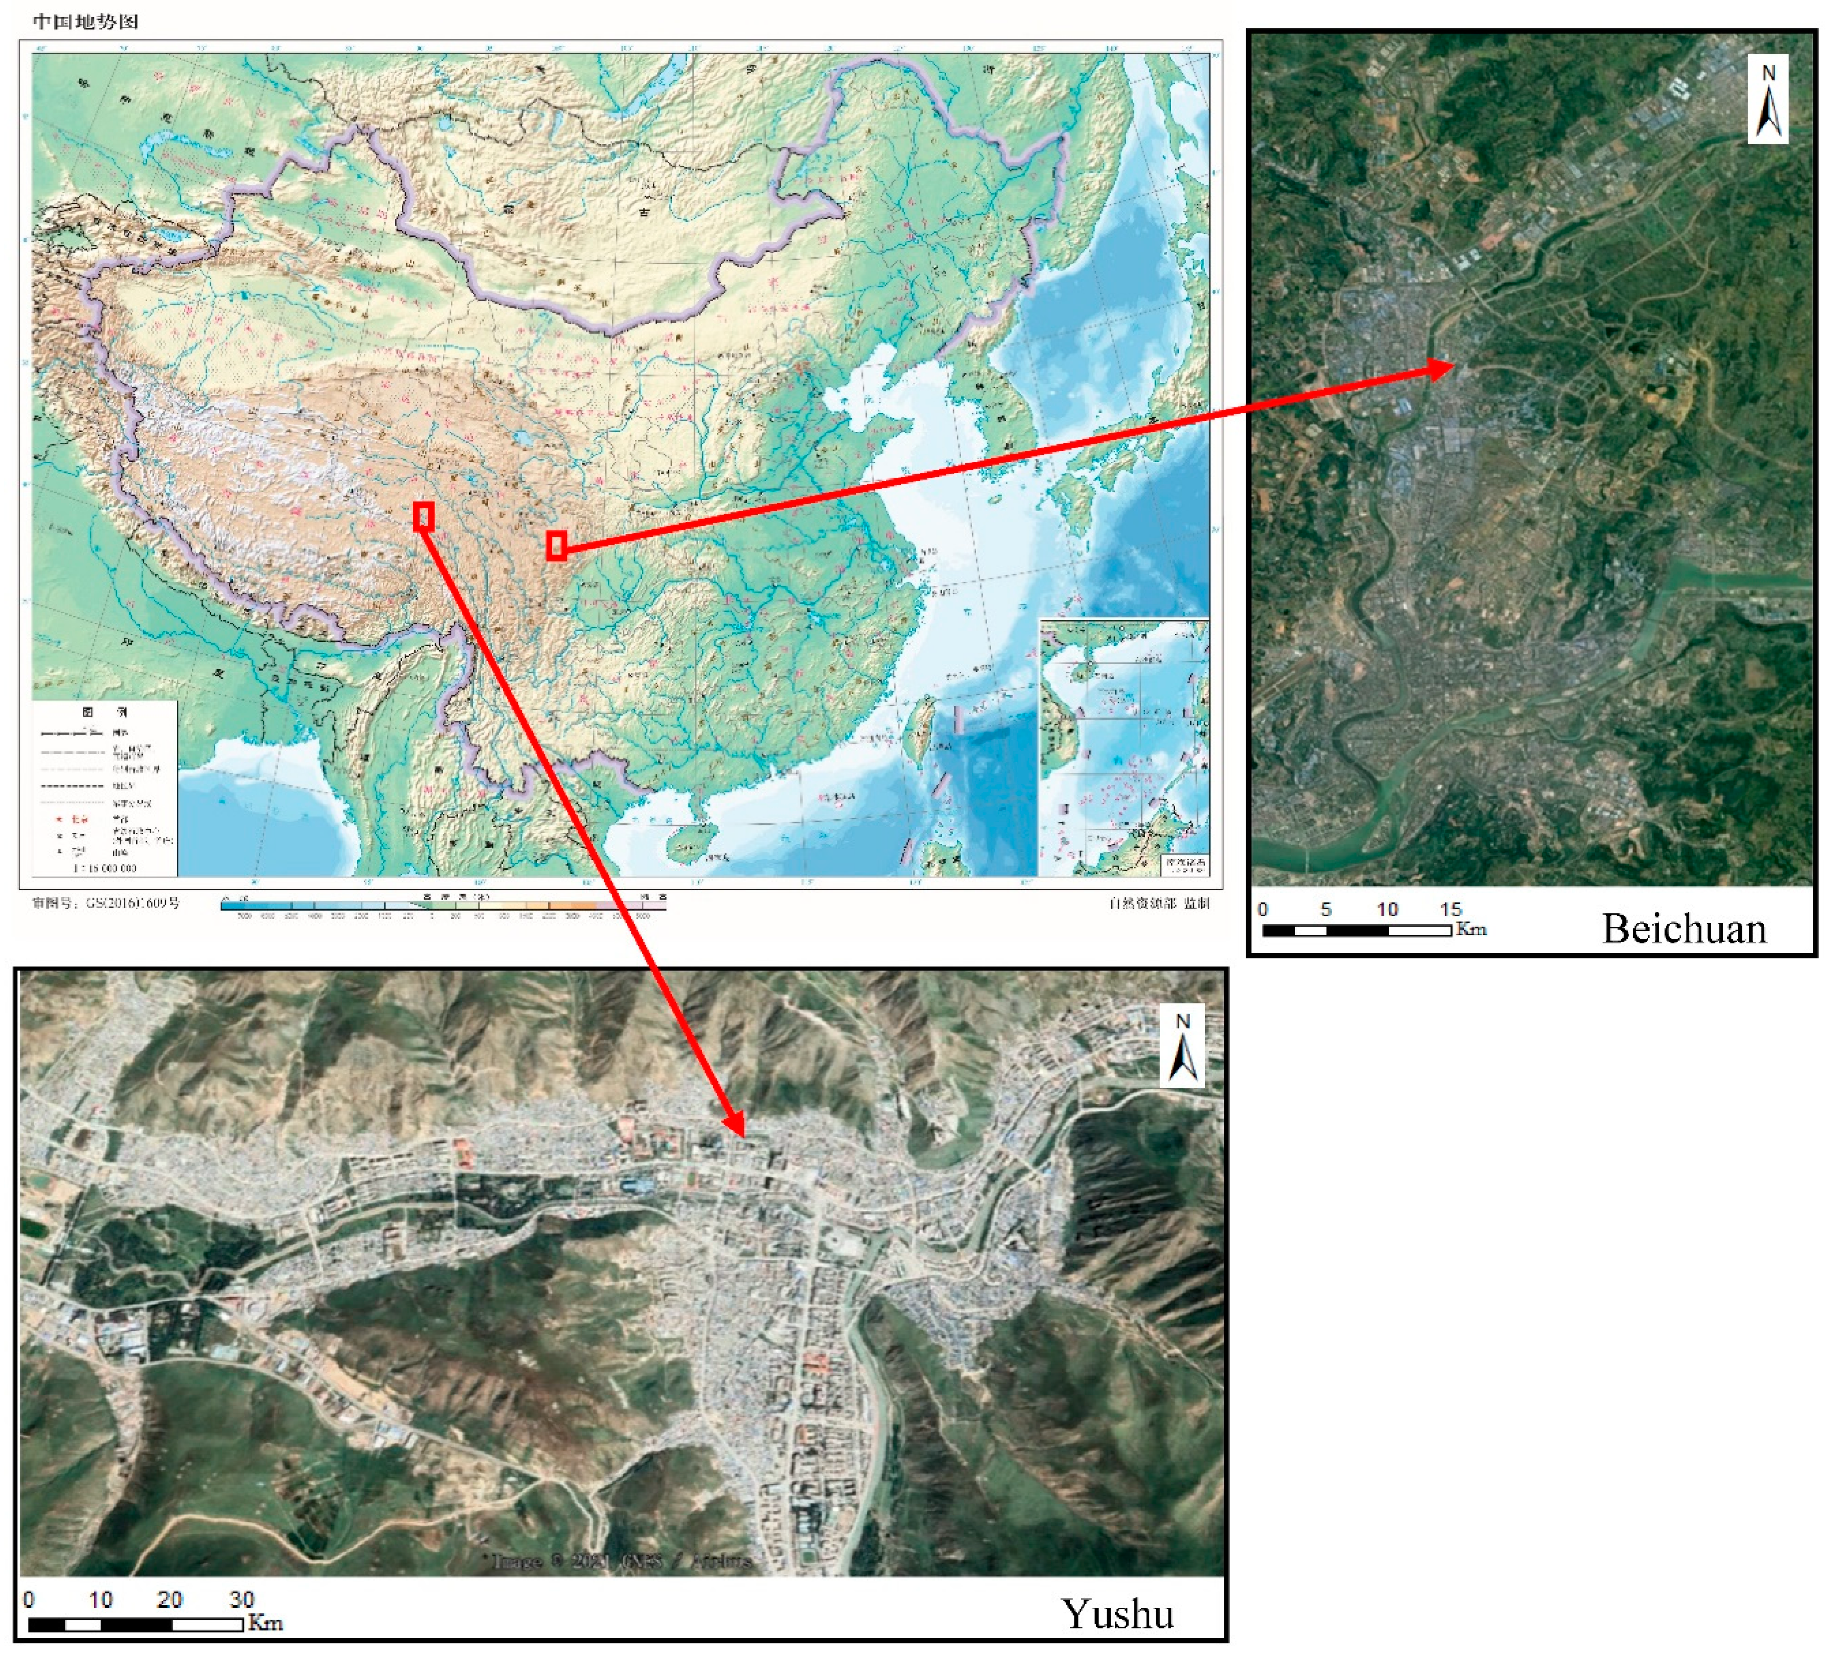
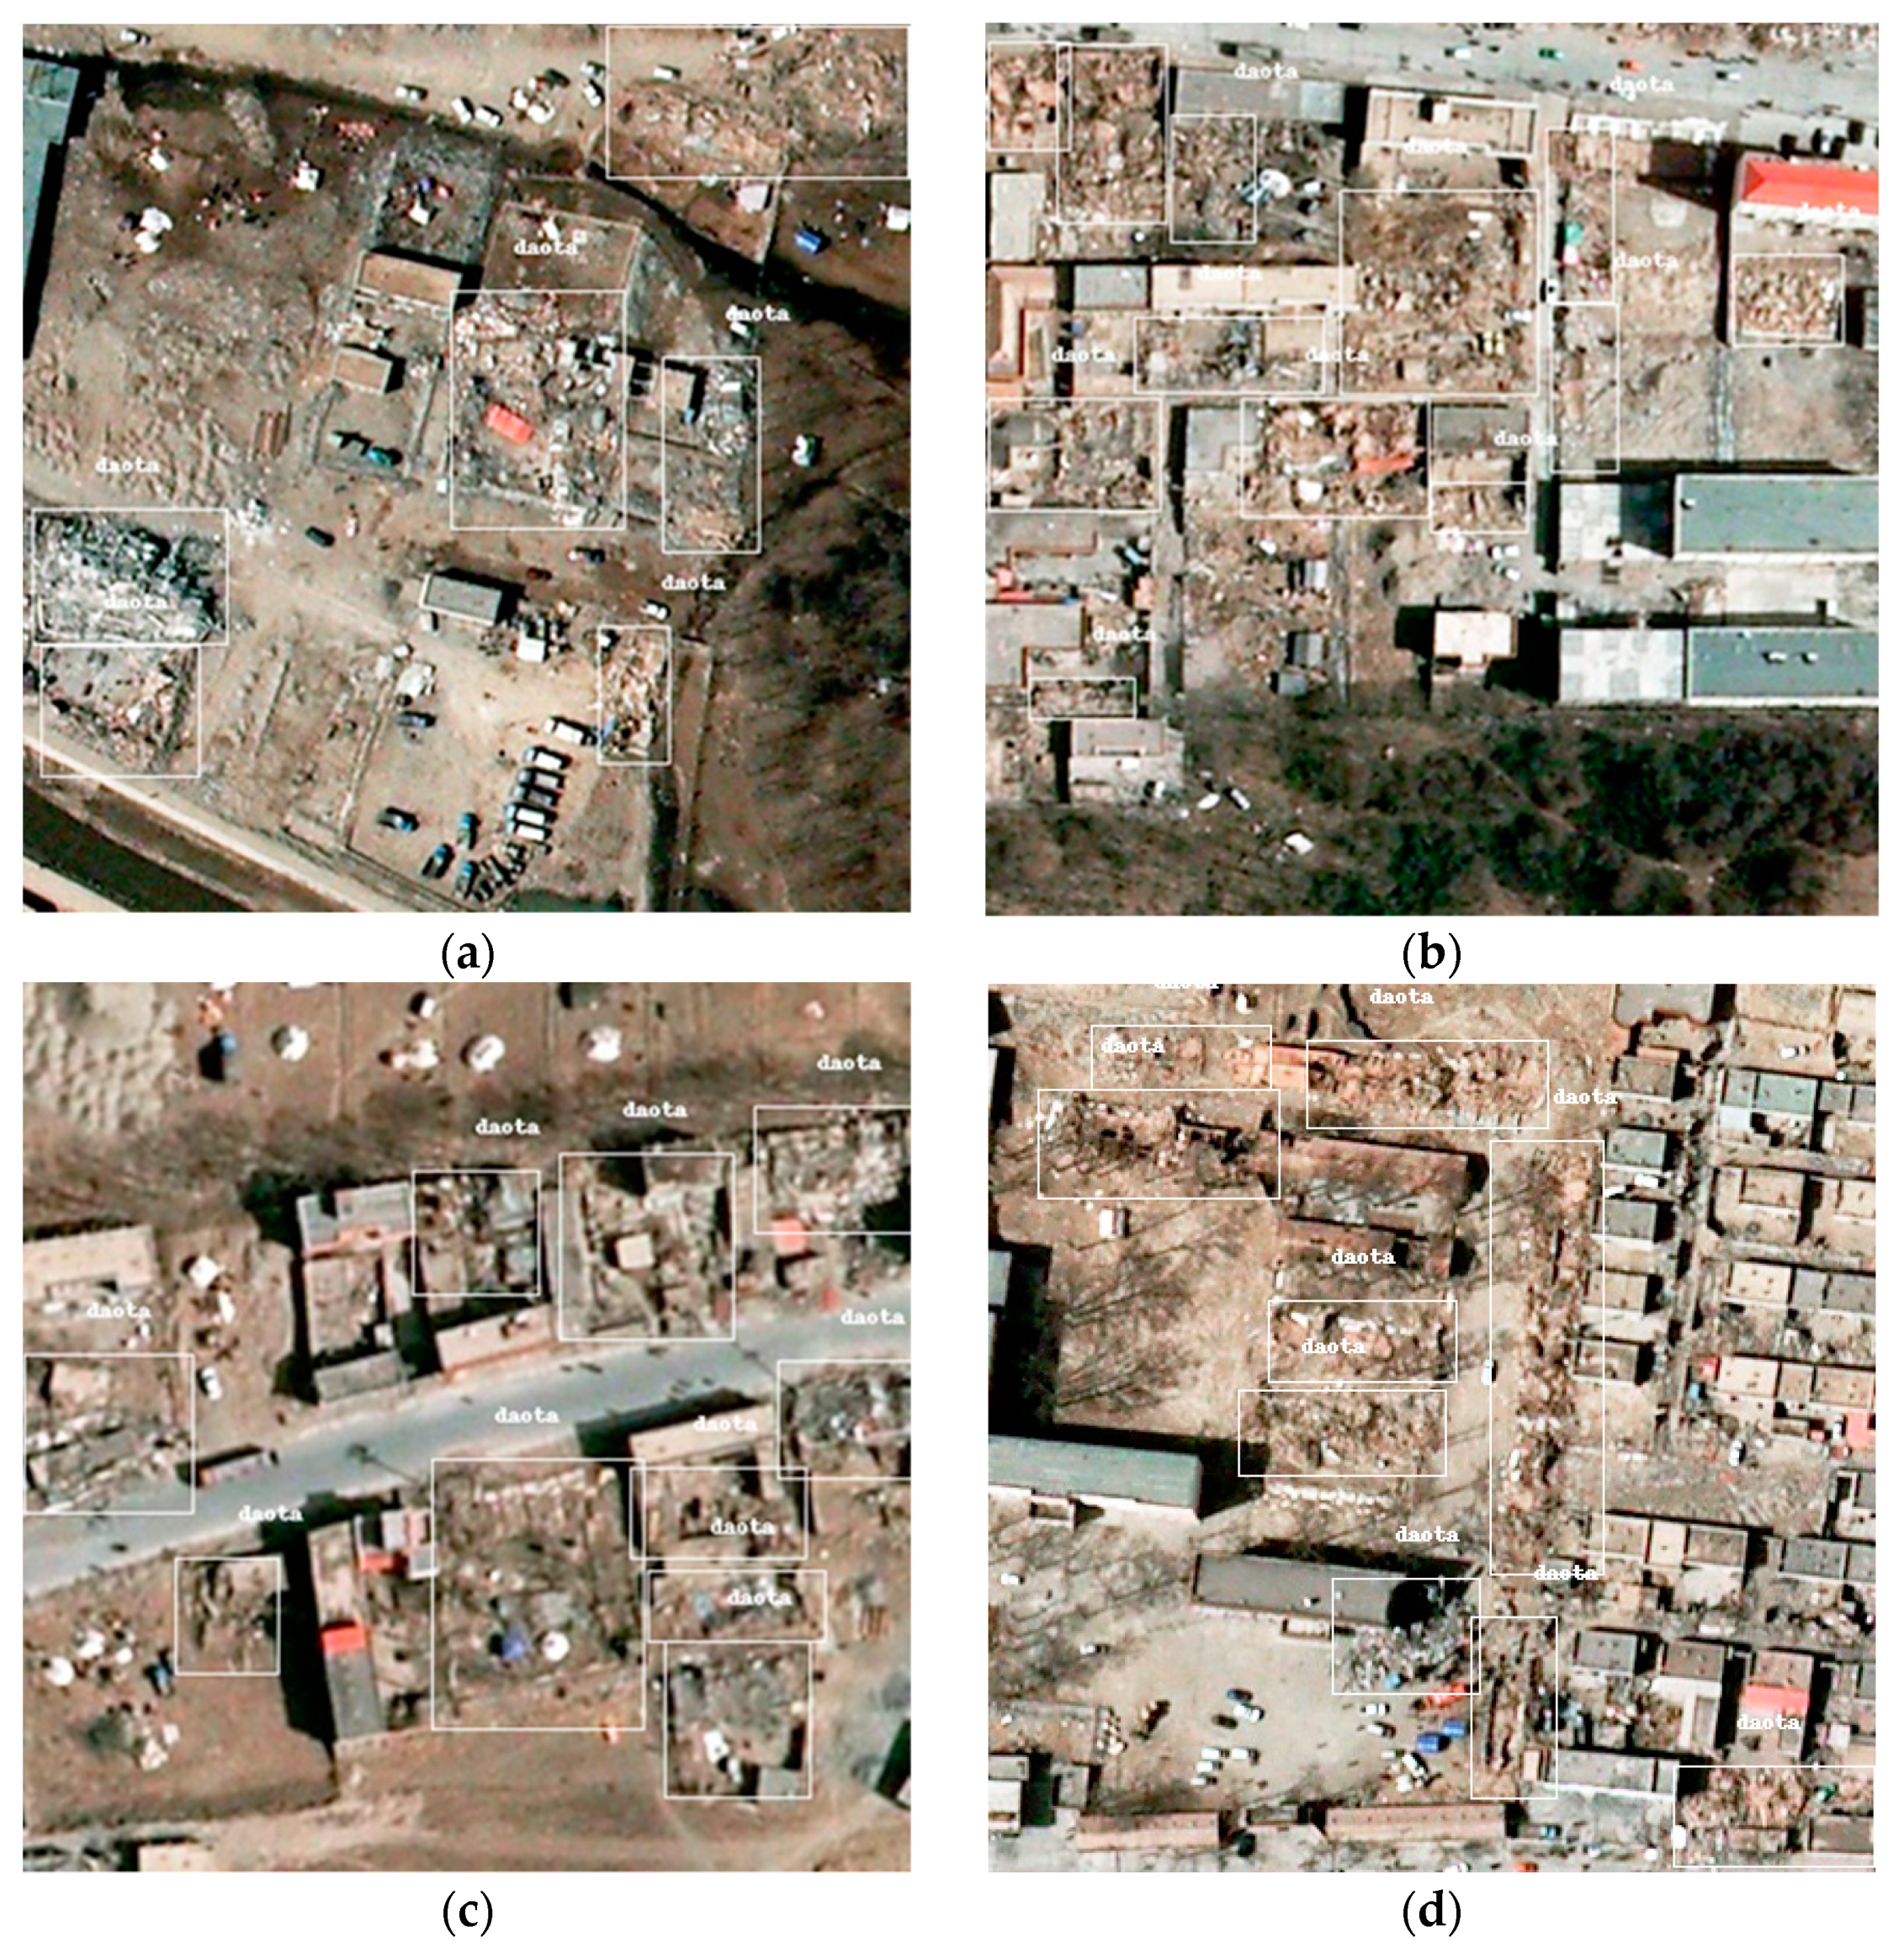
Due to the limitation of the input image size in the YOLOv4 model, it is necessary to preprocess the images. First, the image is divided into blocks. Then divide the partitioned image block according to the size of 416 pixels to get the 416 × 416 pixels image samples. To ensure that each image has a certain number of collapsed buildings, we use LabelImg software to label the samples according to the PASCAL VOC format (the PASCAL visual object classes (VOC) challenge) [30], as presented in Figure 2.

Figure 2.
Sample post-earthquake aerial image tag (a–d) (white box represents labeled collapsed buildings).
Due to the limitation of the weather and the flight capacity of aviation aircraft, the image data we can obtain is limited, but the deep learning model has high requirements for the amount of data, so we need to enhance the original data, including flipping, stretching and color transformation of the image. Finally, 2180 sample images are obtained, and then these images are divided into three groups at the ratio of 0.7, 0.2, and 0.1, which are training set, validation set and test set with the number of 1526, 436 and 218, respectively. There are 9182 samples of collapsed buildings in the training set and 2528, 1187 samples in validation set and test set.
2.2. Method
2.2.1. Overview of YOLOv4
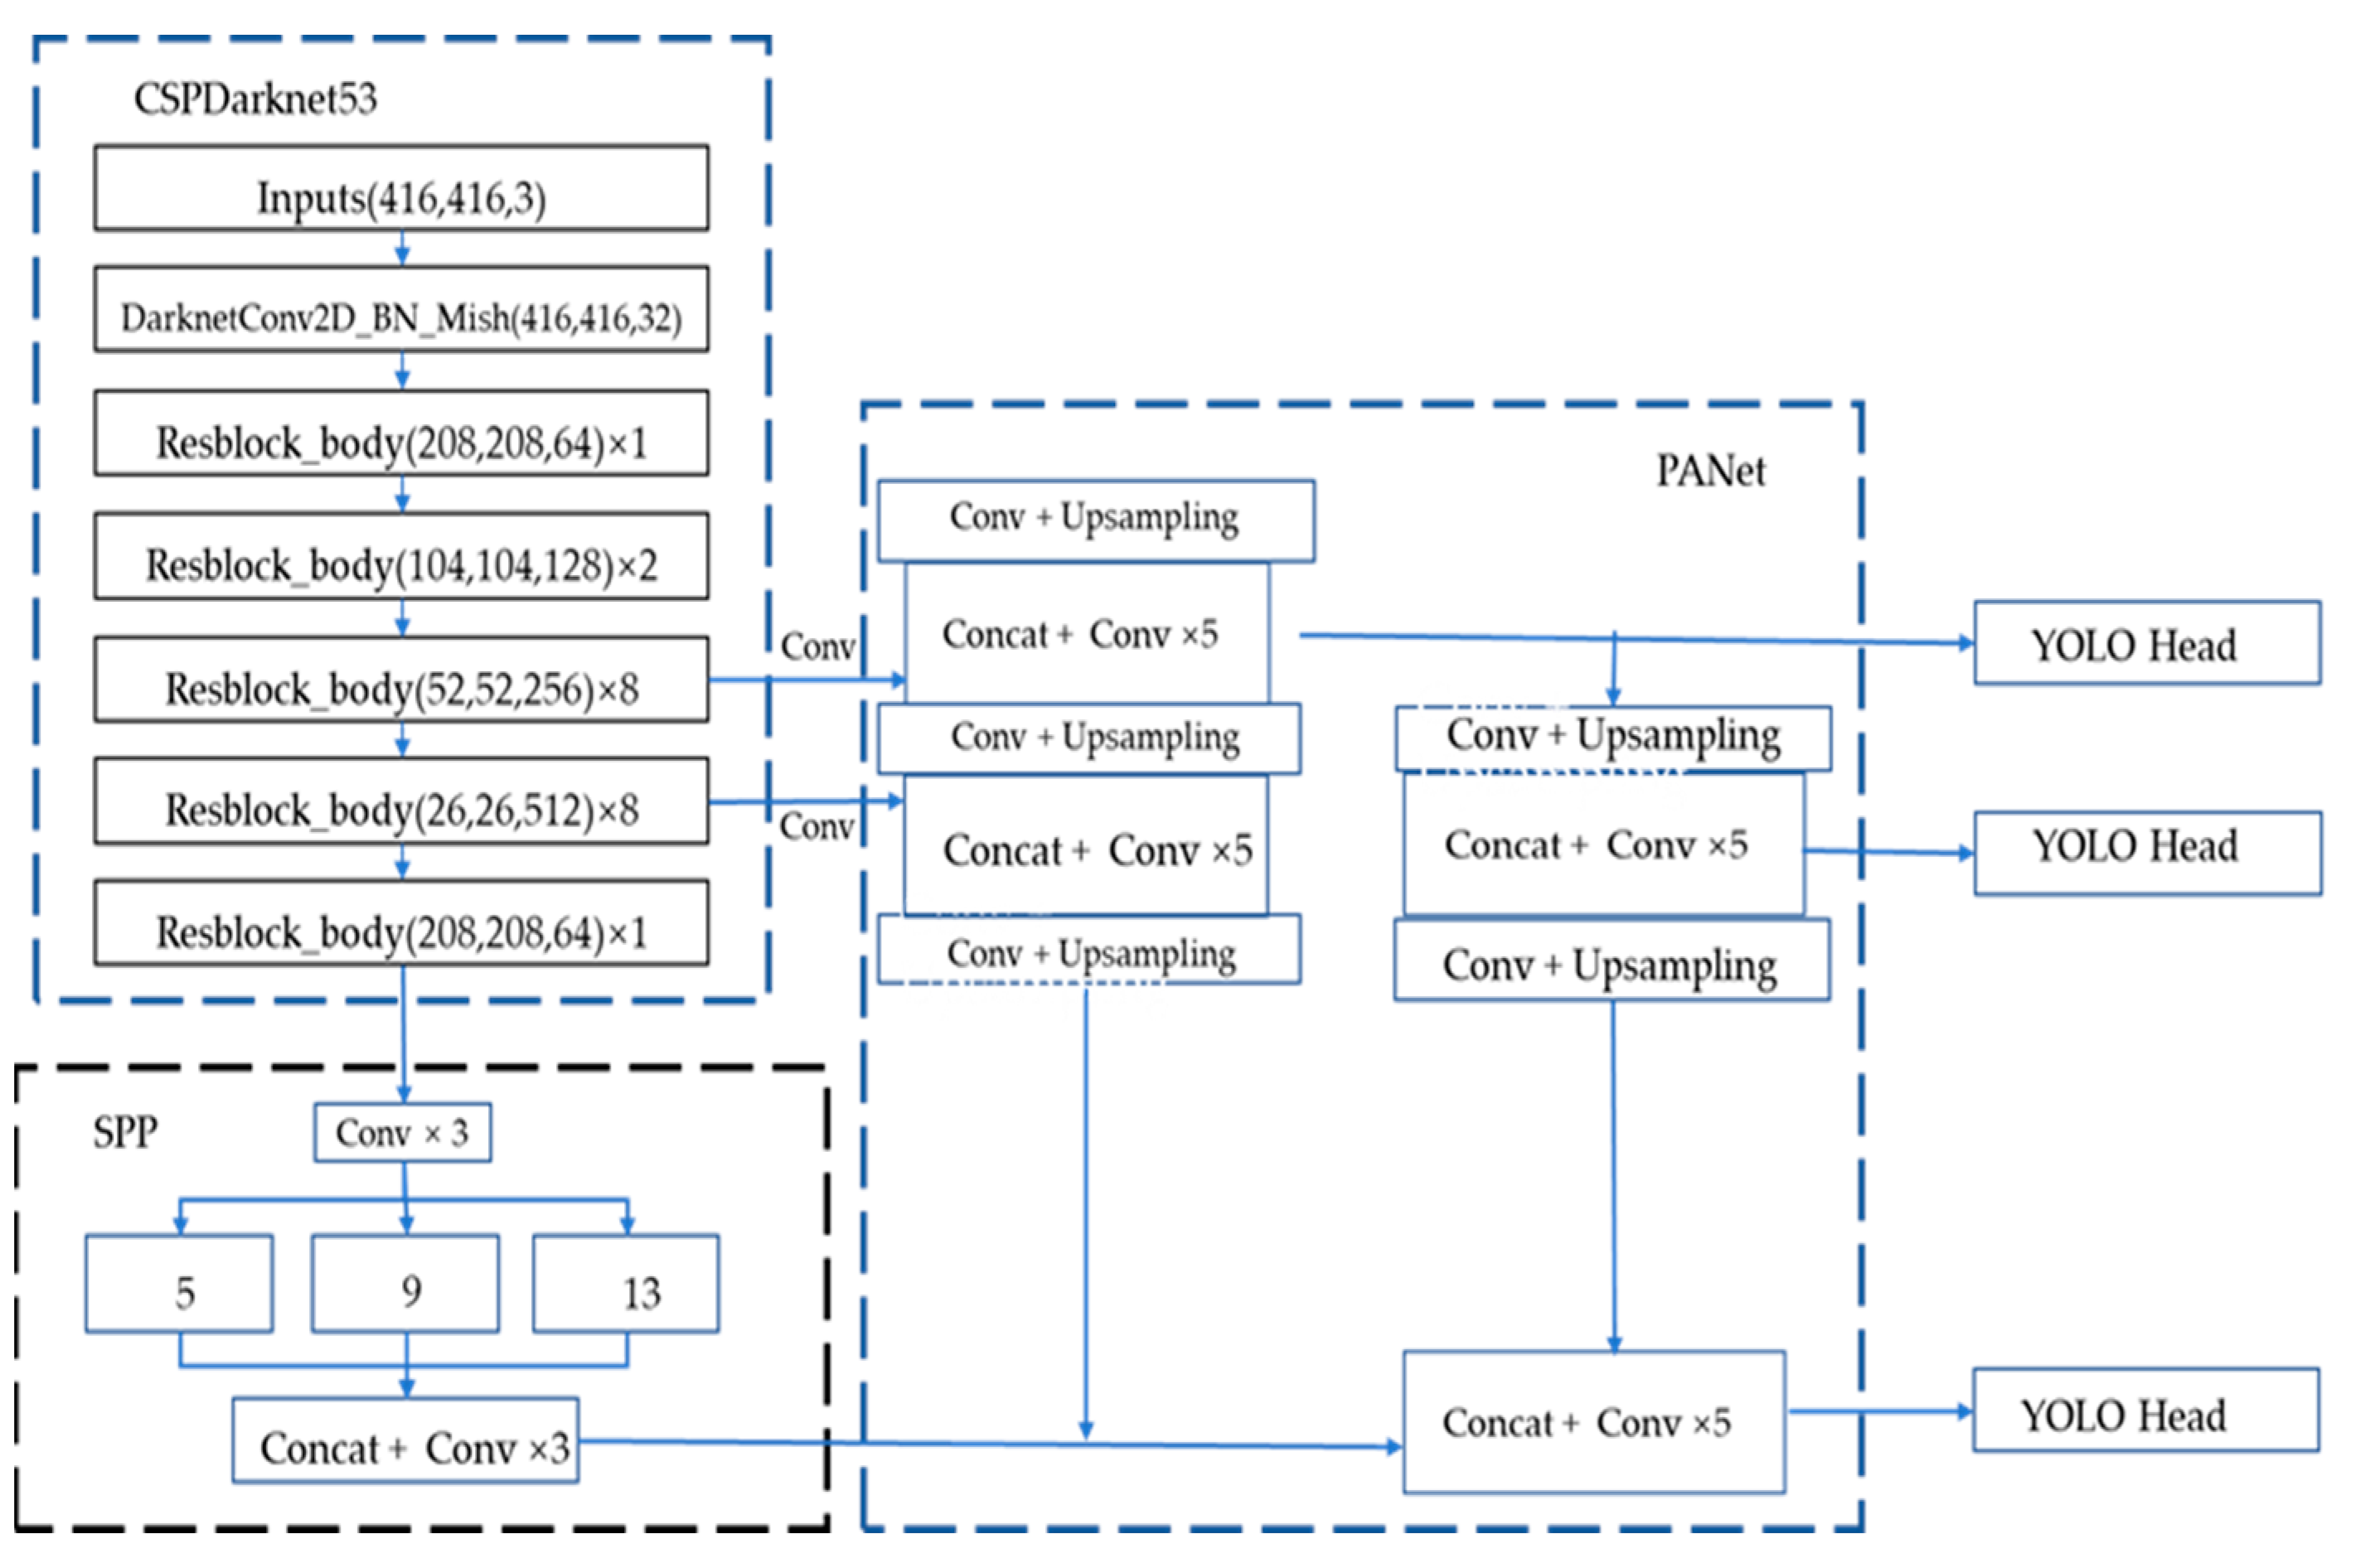
YOLOv4 is developed on the basis of YOLOv3. As presented in the Figure 3 [29] (the figure refers to the model structure diagram in the original YOLOv4 paper), YOLOv4 is composed of CSPDarknet53 + SPP + PANet + YOLOv3 head, and its image detection process is similar to YOLOv3. The input image size is adjusted to a resolution of 416 pixels × 416 pixels, and then it is input into the backbone feature extraction network of CSPDarnet53 for feature extraction operations. CSPDarnet53 introduces the CSP module on the basis of the Darknet53 network of YOLOv3. The CSP module [31] is the original residual block stack which is split into two parts; the main part continues to stack the residual block and the other one is directly connect to the end after a small amount of processing. The CSP module solves the problem of gradient information duplication in the backbone of other large-scale convolutional neural network frameworks, and integrates the gra-dient changes into the feature map from beginning to end. This not only ensures the speed and accuracy of inference, but also reduces the size of the module. The CSPDarknet53 module convolution finally outputs three scale feature layers. The SPP (spatial pyramid pooling) is the last feature layer of CSPdarknet53. After the SPP is convolved three times, four multi-scale pooling cores are used to perform maximum pooling on the input feature layer. Change, and then stack. The SPP [32] can expand the receptive field and isolate the most significant context features. In YOLOv4, the PANet [33] structure replaces the feature pyramid network (FPN) [34] in YOLOv3, combines the up-sampling and down-sampling processes, and performs feature fusion operations on the input multi-level features. The head part of YOLOv4 uses the head of YOLOv3, and the feature layer is detected and regressed through the convolution of 3 × 3 and 1 × 1. It applies anchor points on the feature map and generates anchor boxes with class probabilities and bounding box offsets.
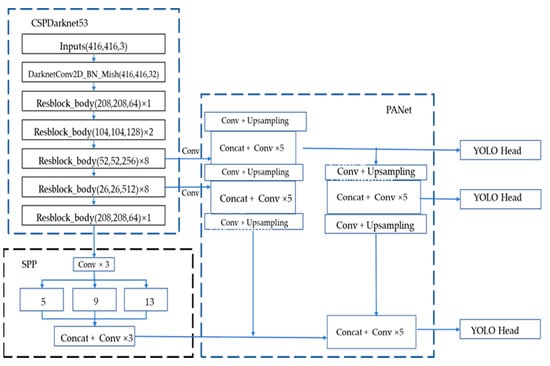
Figure 3.
Structure of YOLOv4 [29].
2.2.2. Proposed Method
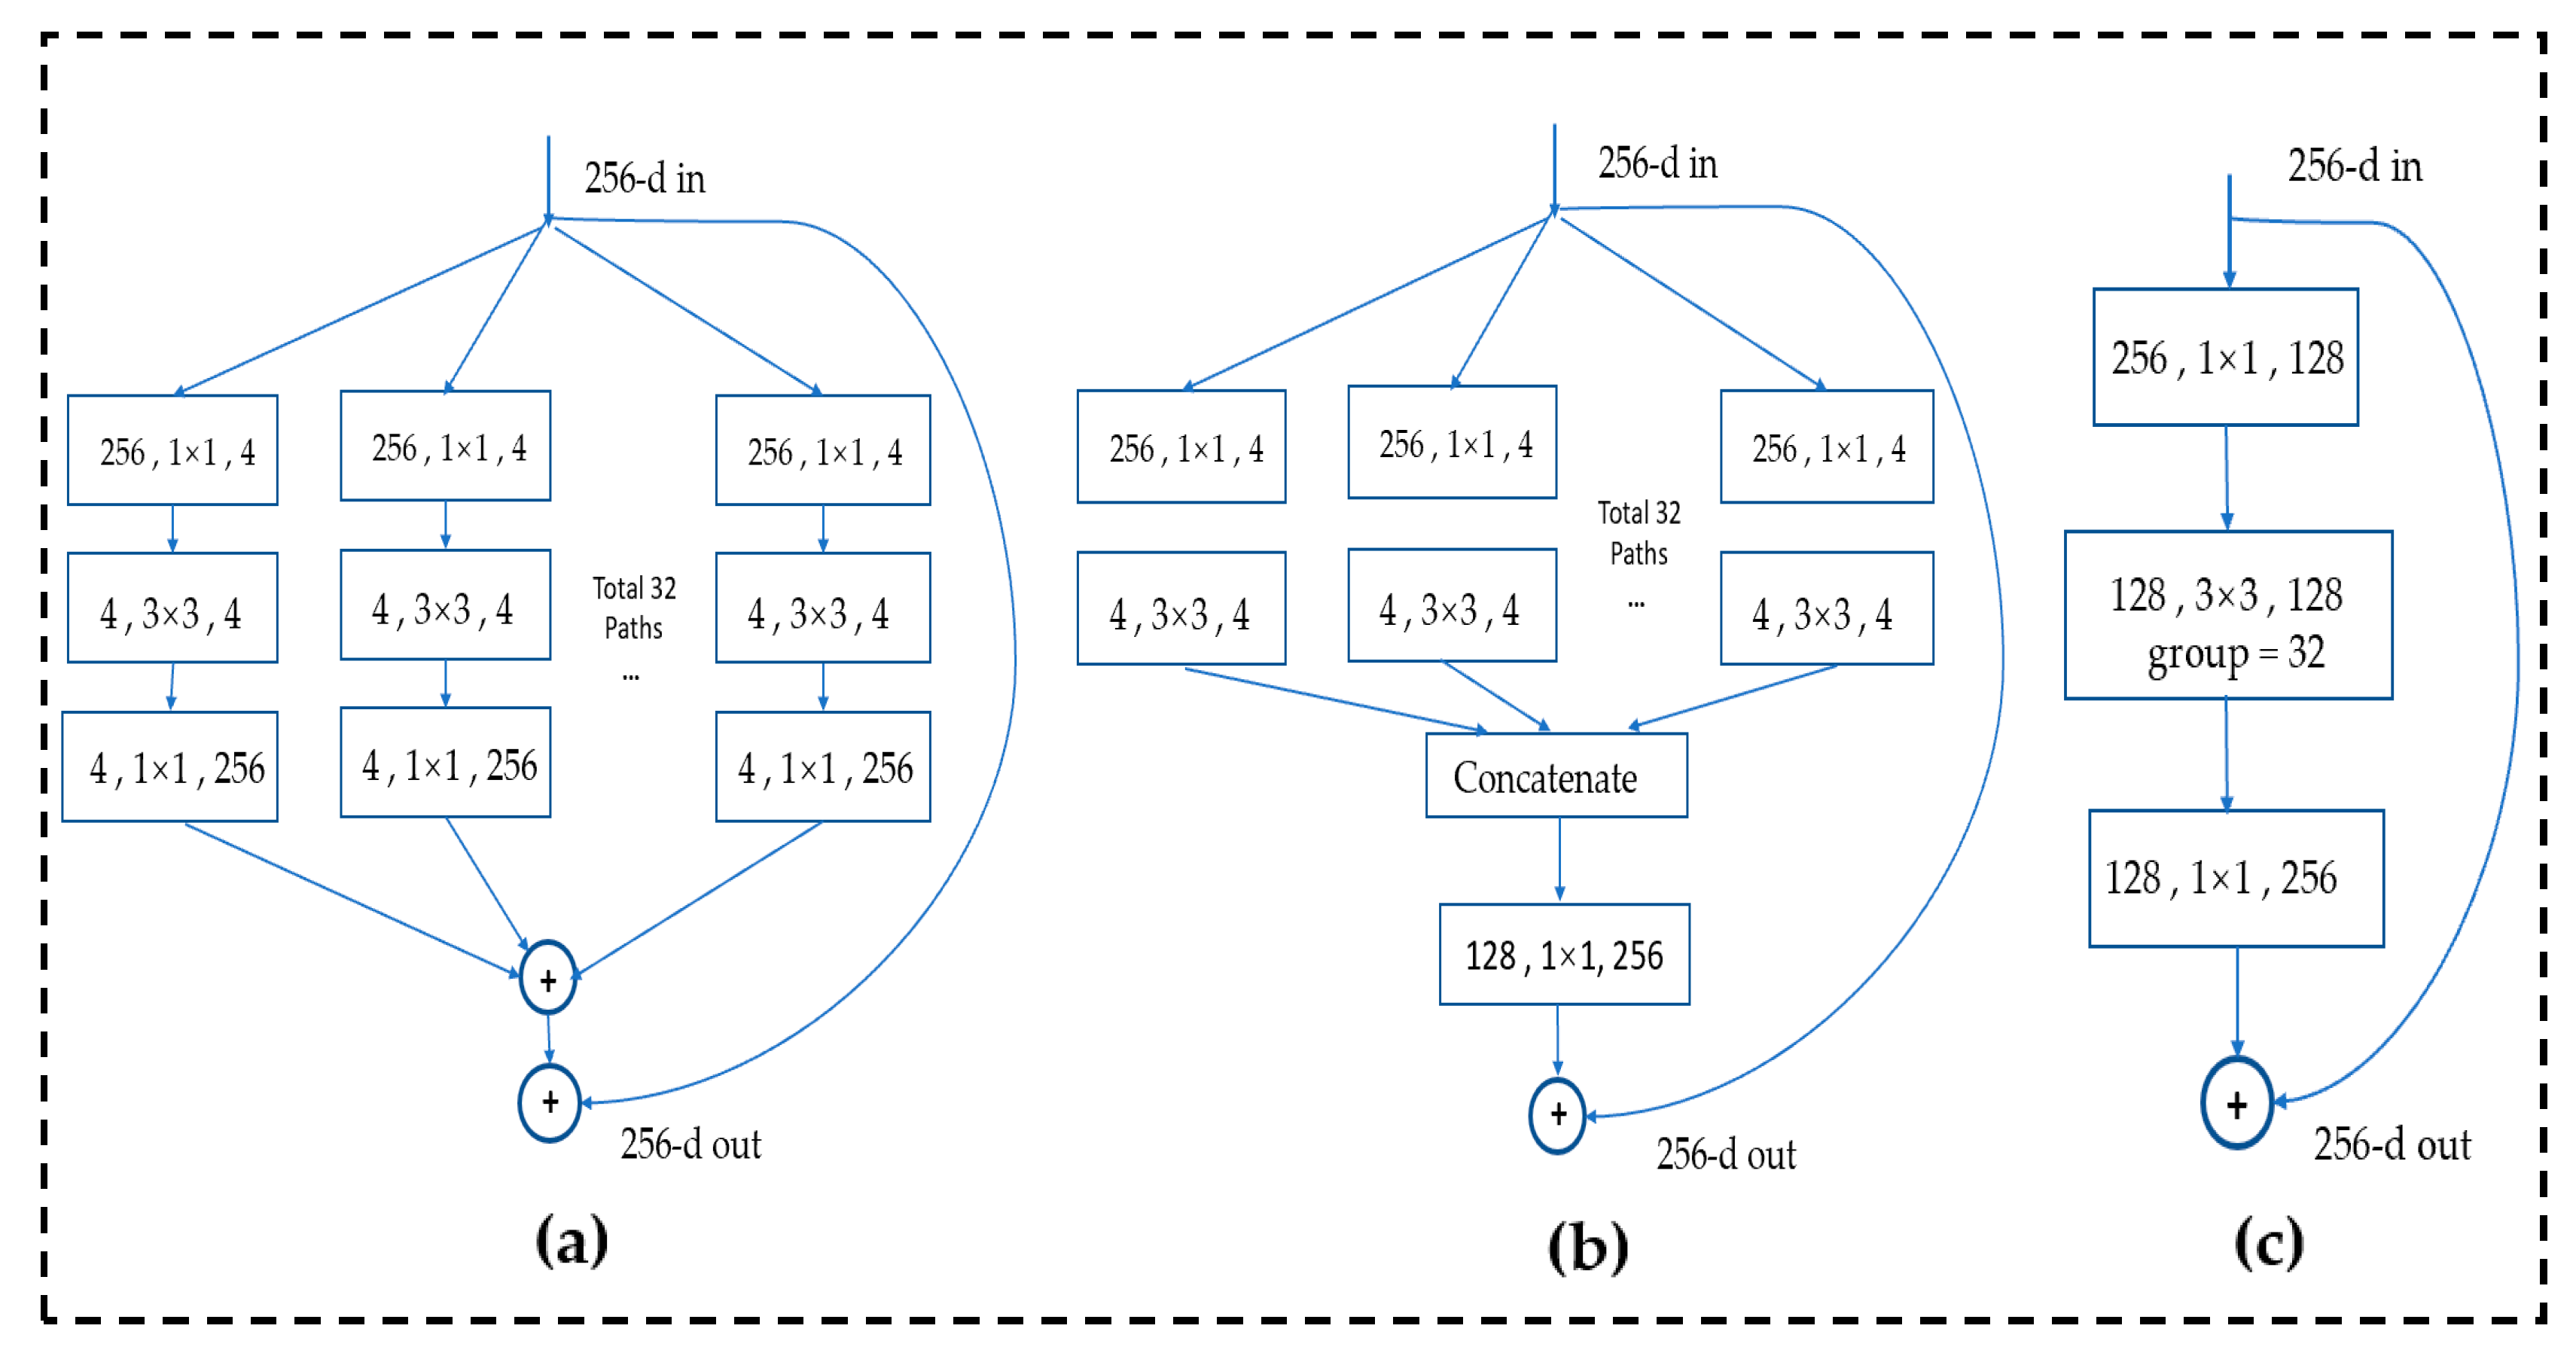
This section will introduce the improved method of YOLOv4. The traditional convolution calculation is complicated, the parameter amount is large, and the feature extraction power is limited, so it cannot meet the requirements for timely identification of collapsed buildings in disaster environments. We improved the backbone part of the YOLOv4 network. First, in order to improve the feature extraction power of the convolutional network, we changed the Resblock_body in CSPDarkNet53 to ResNext block_body. The ResNext model [35] refers to the excellent ideas of the VGG, RsNet, and inception series, which uses split-transform-merge and three equivalent block grouping convolution ideas to improve the multi-scale feature extraction power of image targets. The richness is helpful to improve the detection ability of the model, and then the number of groups is controlled by cardinality (base). ResNext’s convolution block structure is presented in Figure 4a–c below (the figure refers to the model structure diagram in the original ResNext paper), where each rectangular box represents a convolution, and the parameters include are the input channel, the size of the convolution kernel, and the output channel. Then, each column represents a cardinality, a total of 32, and finally, all the results of cardinality are added together and a shortcut link from input to output is added. By simplifying the structures of (a) and (b), we use the structure (c) as the basis of ResNext block.
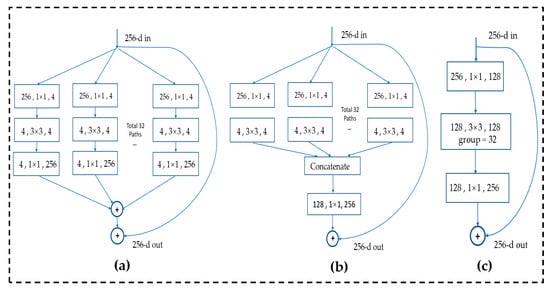
Figure 4.
Structure of ResNext, (a–c) are the equivalent structure which use the grouped convolutions(cited form ResNext paper, we use structure c in our model) [35].
Secondly, the original backbone network is too complicated for a single classification task such as collapsed house detection. Therefore, we use depth-wise separable convolution instead of the traditional convolution method, thereby reducing the amount of model parameters and speeding up the detection speed of the model.
For the loss function part, the loss in the object detection process in YOLOv4 consists of category loss, confidence loss, and bounding box loss. For the classification task of collapsed buildings, it is found through previous experiments that in the model training process, confidence loss and category loss will quickly converge and tend to 0. Hence, the bounding box loss is important in the accurate positioning of the object detection regression box. At present, the commonly used regression box loss functions are mainly modified based on IOU loss, which are IOU (intersection of union) loss, GIoU loss, DIU loss, and CIoU loss.
IOU loss measures the intersection of the predicted regression box and the ground truth box in the object detection. The formula of IOU loss is as follows:
and represent the intersection and union of the prediction and the ground truth boxes, respectively. IOU loss has a scale symmetry and it is not negative, but its disadvantages are as follows: first, when these two these boxes have no intersection, IOU loss is equal to 0, always can’t optimize the prediction box; second, the IOU loss convergence rate is slow.
In order to overcome the shortcomings of IOU loss, GIOU loss is proposed [36]. The calculation formula of GIOU loss is as follows:
Among them, A and B are the prediction box and the real box, respectively, and C is the smallest outer rectangle of the prediction box and the real box. The advantage of GIOU loss is that even if the prediction box and the real box do not intersect, GIOU loss can still reflect the prediction loss. However, GIOU loss also has some defects. Firstly, when the predict box and the real box have no intersection, the GIOU loss method reduces the loss by expanding the prediction box instead of adjusting the position of the prediction box, which will make the prediction box too large. Secondly, when the intersection of these two boxes is larger than 0, GIOU loss will degenerate to IOU loss, so the convergence speed of GIOU loss will still become very slow.
In order to avoid the shortcomings of GIOU loss, CIOU loss is proposed as the loss function of the YOLOv4 model. The distance between the center point of the overlapping area and the aspect ratio between the two boxes are considered. The formula is defined as follows:
refers to the degree of the intersection between the center of the predict box and the center of the ground truth box, and refers to the least contain forecast box and real box outsourcing rectangular diagonal length of the square. measures the aspect ratio between the prediction box and the real box. The overall effect of CIOU loss is excellent but there are still some disadvantages. only reflects the difference in aspect ratio between the predicted box and the real box, it does not truly reflect the relationship between the predict box’s width and the true box’s width or the predict box’s height and the true box’s height.
Given some deficiencies of the loss function in current object detection, we refer to the research progress of IOU loss function. We proposed to replace the CIOU loss function in the original YOLOv4 model with the latest Focal-EIOU loss function [37], where EIOU loss is defined as follows.
and are the width and height of the smallest outer rectangle covering the predict box and the ground truth box. We divide the loss function into three parts: IOU losses, distance and phase loss. In this way, we can preserve the benefits of CIOU loss. At the same time, EIOU loss directly minimizes the width and height difference between the target box and the anchor box, which enables the model have faster convergence speed and better positioning results. In the process of BBR (bounding box regression), there is also the problem of unbalanced training samples, that is, due to the sparsity of the target object in the image, the number of high-quality samples (anchor boxes) with small regression errors is far less than low-quality samples. Recent research shows that excessive attention to low-quality samples during model training will produce excessively large gradients, which is harmful to model training.Therefore, creating high quality samples for network training process is very important [38]. In this paper, we use the focal-EIOU loss to improve the performance of EIOU loss. Calculated as follows.
Among them, , γ is a parameter that controls the degree of suppression of outliers. This ensures that the gradient will not decrease or disappear during the training process. The training samples are weighted by γ, so that the model pays more attention to the high-quality training samples during the training process, making the training process more efficient and accelerating the speed of model convergence.
3. Experiment
3.1. Evaluation Metrics
Since our aim is to detect a single collapsed buildings in one category, we use the loss function curve, the precision-recall curve, F1 score [39], the AP, and the FPS (frames per second) to evaluate the detection capabilities of different models.
3.1.1. Precision Recall Curve
In the object detection project, four indicators are usually generated for the detection object, namely, false negative (FN), false positive (FP), true negative (TN), and true positive (TP). The model cannot be evaluated well from these indicators alone. Recall rate (R) and precision (P) are generated based on these four basic statistical values [40]. Accuracy measures the ratio of the correct goals to the one judged to be the correct goals. The recall rate measures the rate at which the correct targets is judged to be the correct targets. In the precision recall curve, the equation is as follows:
Based on the calculated precision recall rate, a precision-recall curve can be generated. The performance of different models can be obtained through the precision recall rate curve. For example, if the precision recall rate curve of a model is higher than the latter model, it indicates that it performs better. However, if the precision recall curves of the two models intersect, this evaluation index cannot be used.
3.1.2. F1 Score
The F1 score evaluates the model through precision and recall rate indexes. The equation is as follows:
3.1.3. Average Precision
AP is equal to the surrounding area under precision recall curve, and the average value of the precision of each point of the recall rate from 0 to 1. The calculation formula is:
N is the total number of images in the data set, P(k) is the precision when the identified image is k, and ∆γ (k) is the difference between the recall ratio of image k and k − 1.
3.2. Experiment Setting
The experiments are based on the NVIDIA GTX 2080 GPU. Under the Linux operating system, the Python 3.7 language is used to improve the Pytorch1.6 deep learning framework based on the officially released YOLOv4 code. During the training process, the parameters are gradually optimized and adjusted with, at most, 300 epochs. In order to balance the storage capacity of the GPU and the efficiency of model training, the optimal batch size is 8. Finally, we choose Adam as our optimizer. The learning rate set as 10−4. During the training process, if the loss value on the validation part no longer decreases after 60 epochs (each epoch represents the forward propagation of all training images), The learning rate is reduced to 0.1 times to acquire the updated learning rate, where the lowest learning rate is declined to 10−6. The momentum of the model setting is 0.9. The weight attenuation coefficient is 0.0005. The IOU threshold loss is 0.5. We stop the training process when the loss function no longer drops, then save the optimal training weight. Parameters, such as loss and accuracy during training, are recorded in log files.
4. Result
4.1. Loss Evaluation
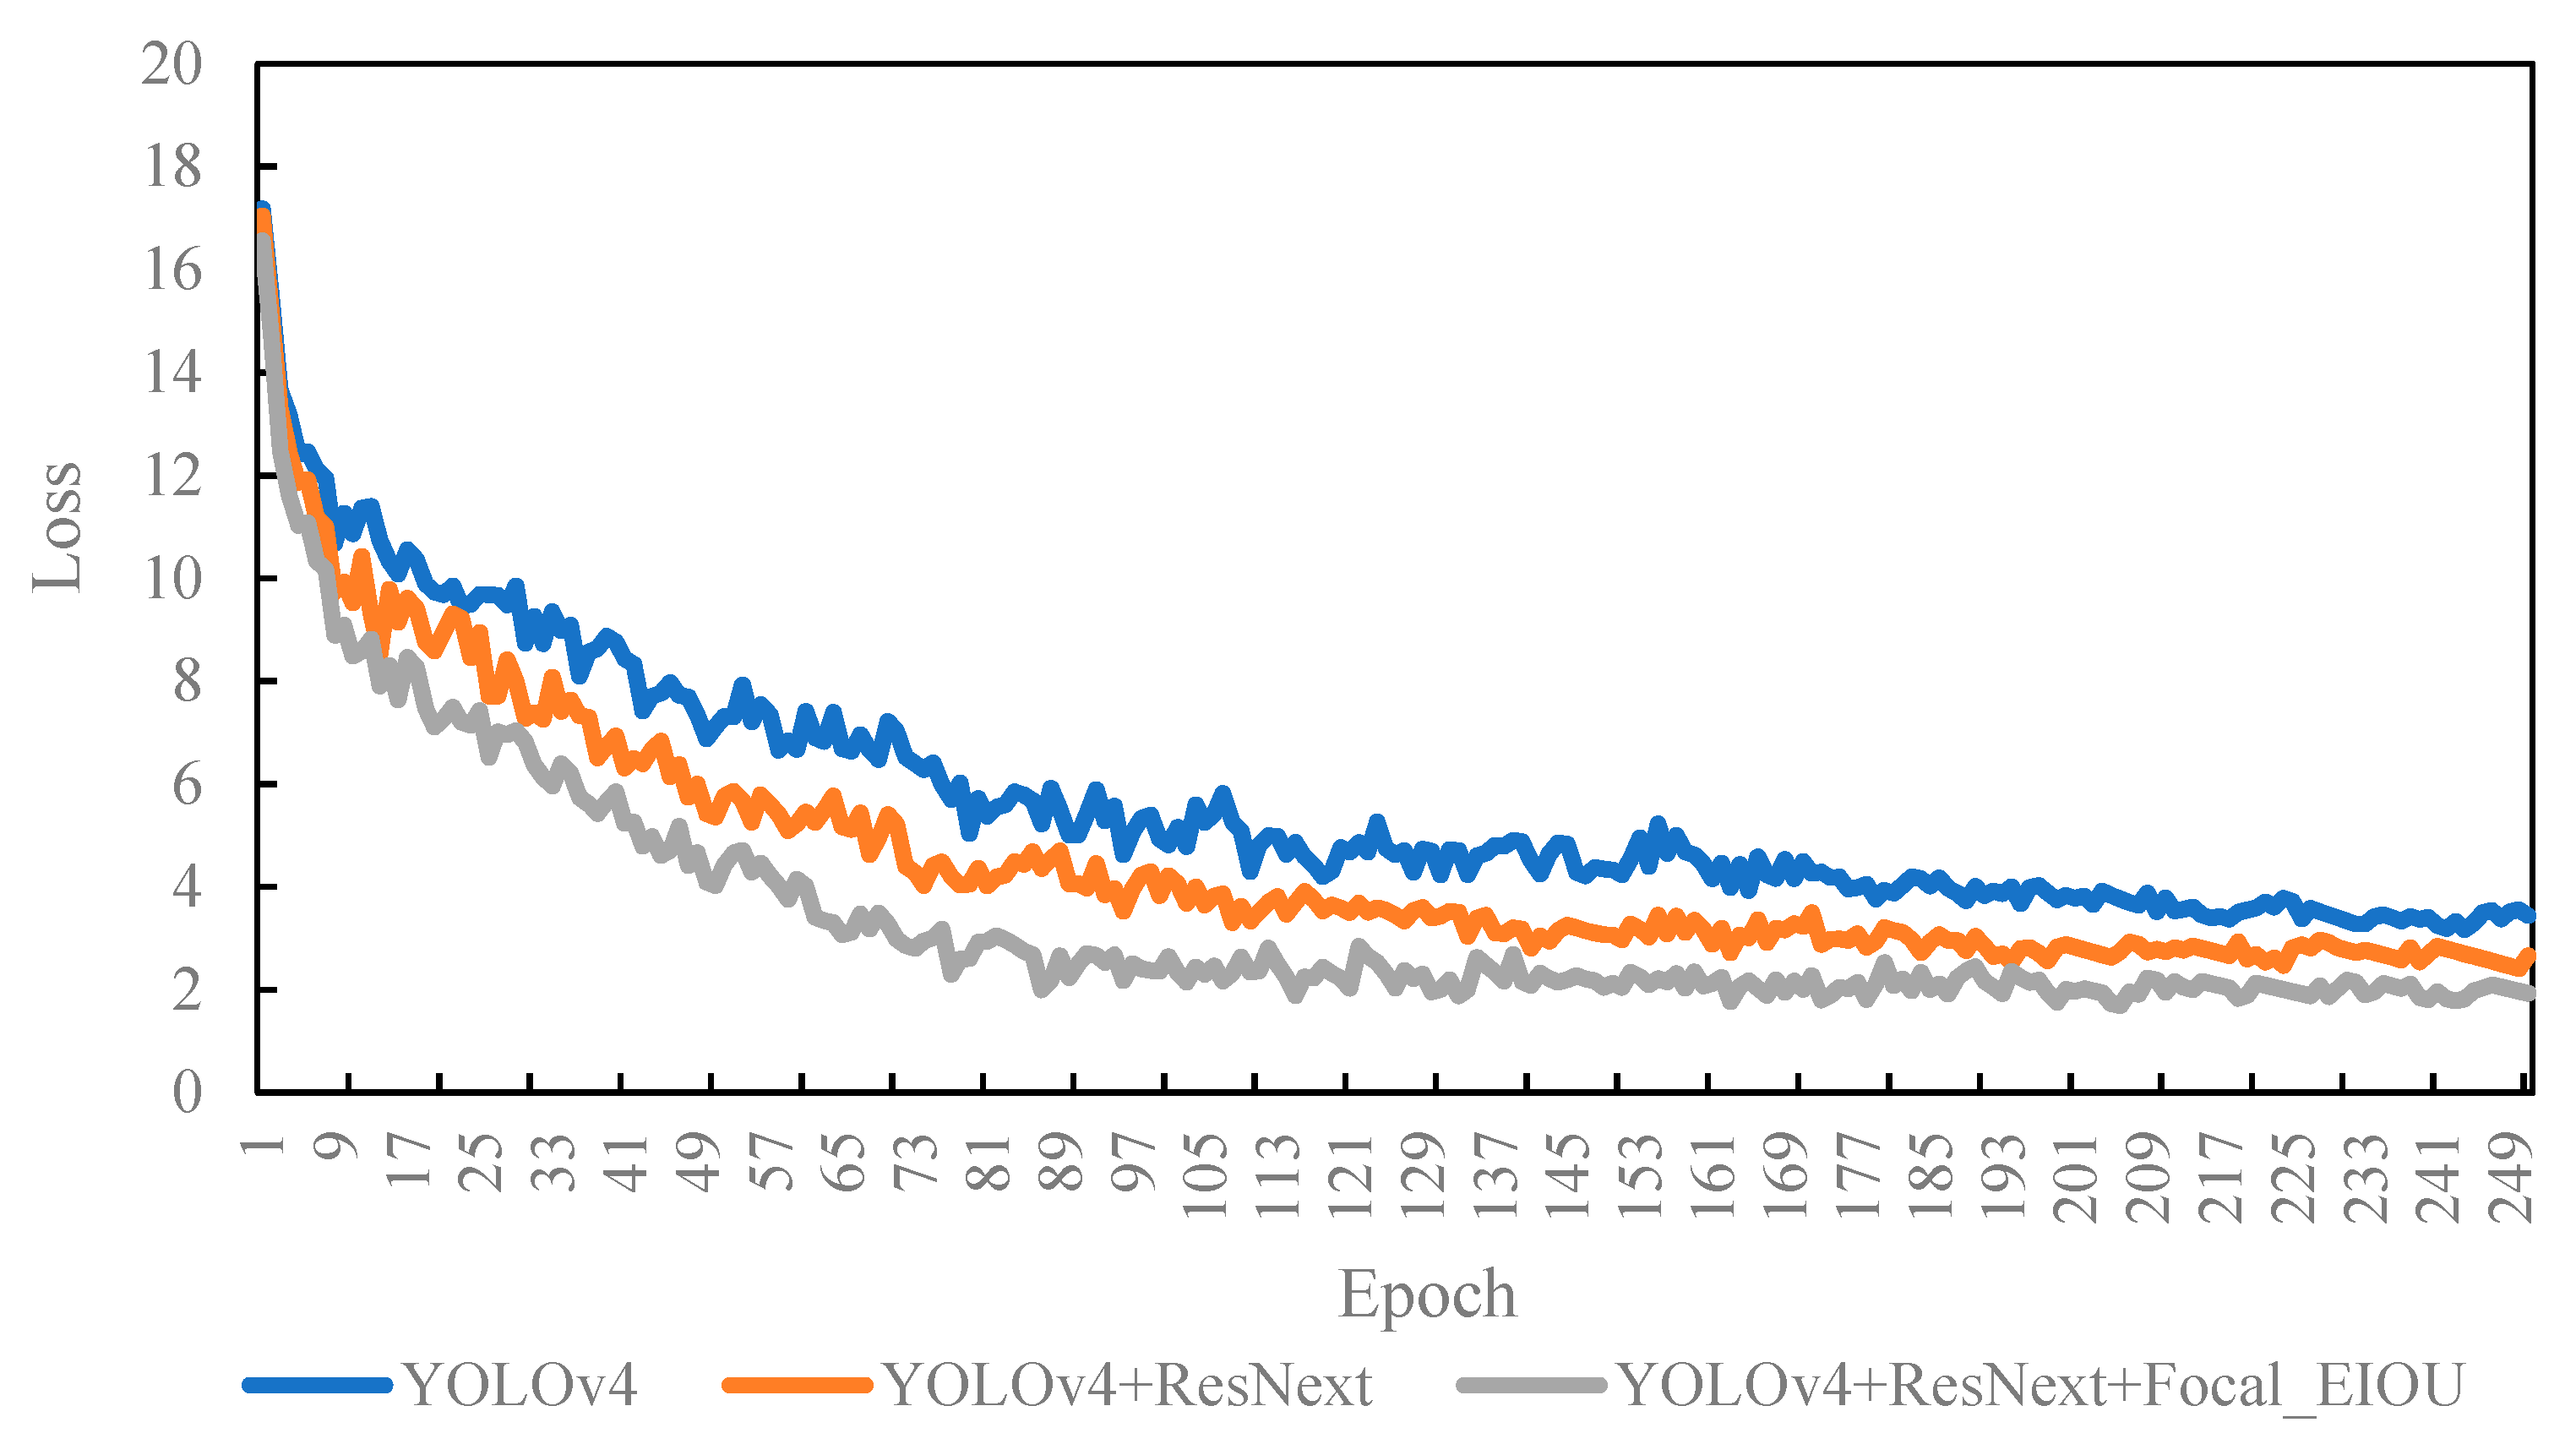
The method proposed in this research improves the feature extraction network (backbone) and loss function of YOLOv4. First, we used ResNext block body to replace the Residual_block module in CSPDarknet53, and then replaced the regular convolution in CSPDarknet53 with a depth-wise separable convolution. Second, we replaced the CIOU loss of YOLOv4 with a more accurate Focal_EIOU loss. In order to test the impact of these two improvements on CNN detection performance, we trained and tested three networks: the original YOLOv4, the first improved YOLOv4+ResNext model, and the second improved YOLOv4+ResNext+Focal_EIOU loss. Each model was set to 300 epochs to prevent insufficient training. From the network training curve, it can be seen that all models converge in the middle of the loss function, and the model has completed training. The three curves presented in Figure 5 represent the training losses of the three models. Through analysis, the following two conclusions can be drawn.
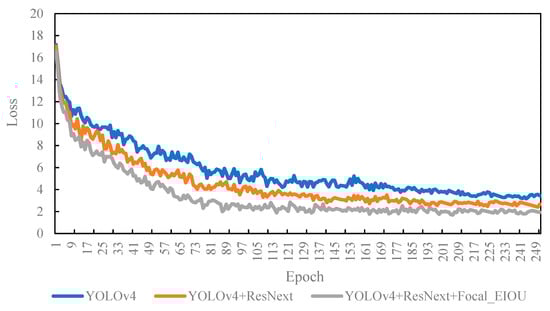
Figure 5.
Training loss curves of the YOLOv4 and improved model.
All of the loss curves show a downward trend, and all decline rapidly, then the downward trend slows down, and finally. it reaches a plateau. This shows that the three networks perform well on the data set. In order to compare the size of the loss value after the training of each model converges, all the loss values are standardized. Then use the tensorboard tool to extract the data recorded in the training log, and obtain the training loss map of the model, as presented in Figure 5. The loss value of YOLOv4 converges very slowly. After improvement, the model’s loss function converges significantly faster, and the training convergence loss value of the YOLOv4+ResNext model and YOLOv4+ResNext+Focal-EIOU loss is lower than that of YOLOv4, indicating that the improved model is not only easier to train, but also the performance of the model better than traditional YOLOv4. After improving the loss function, when the model training converges, the loss value of the YOLOv4-ResNext-Focal-EIOU loss model is lower than that of YOLOv4-ResNext, which shows the better performance.
4.2. Index Metrics
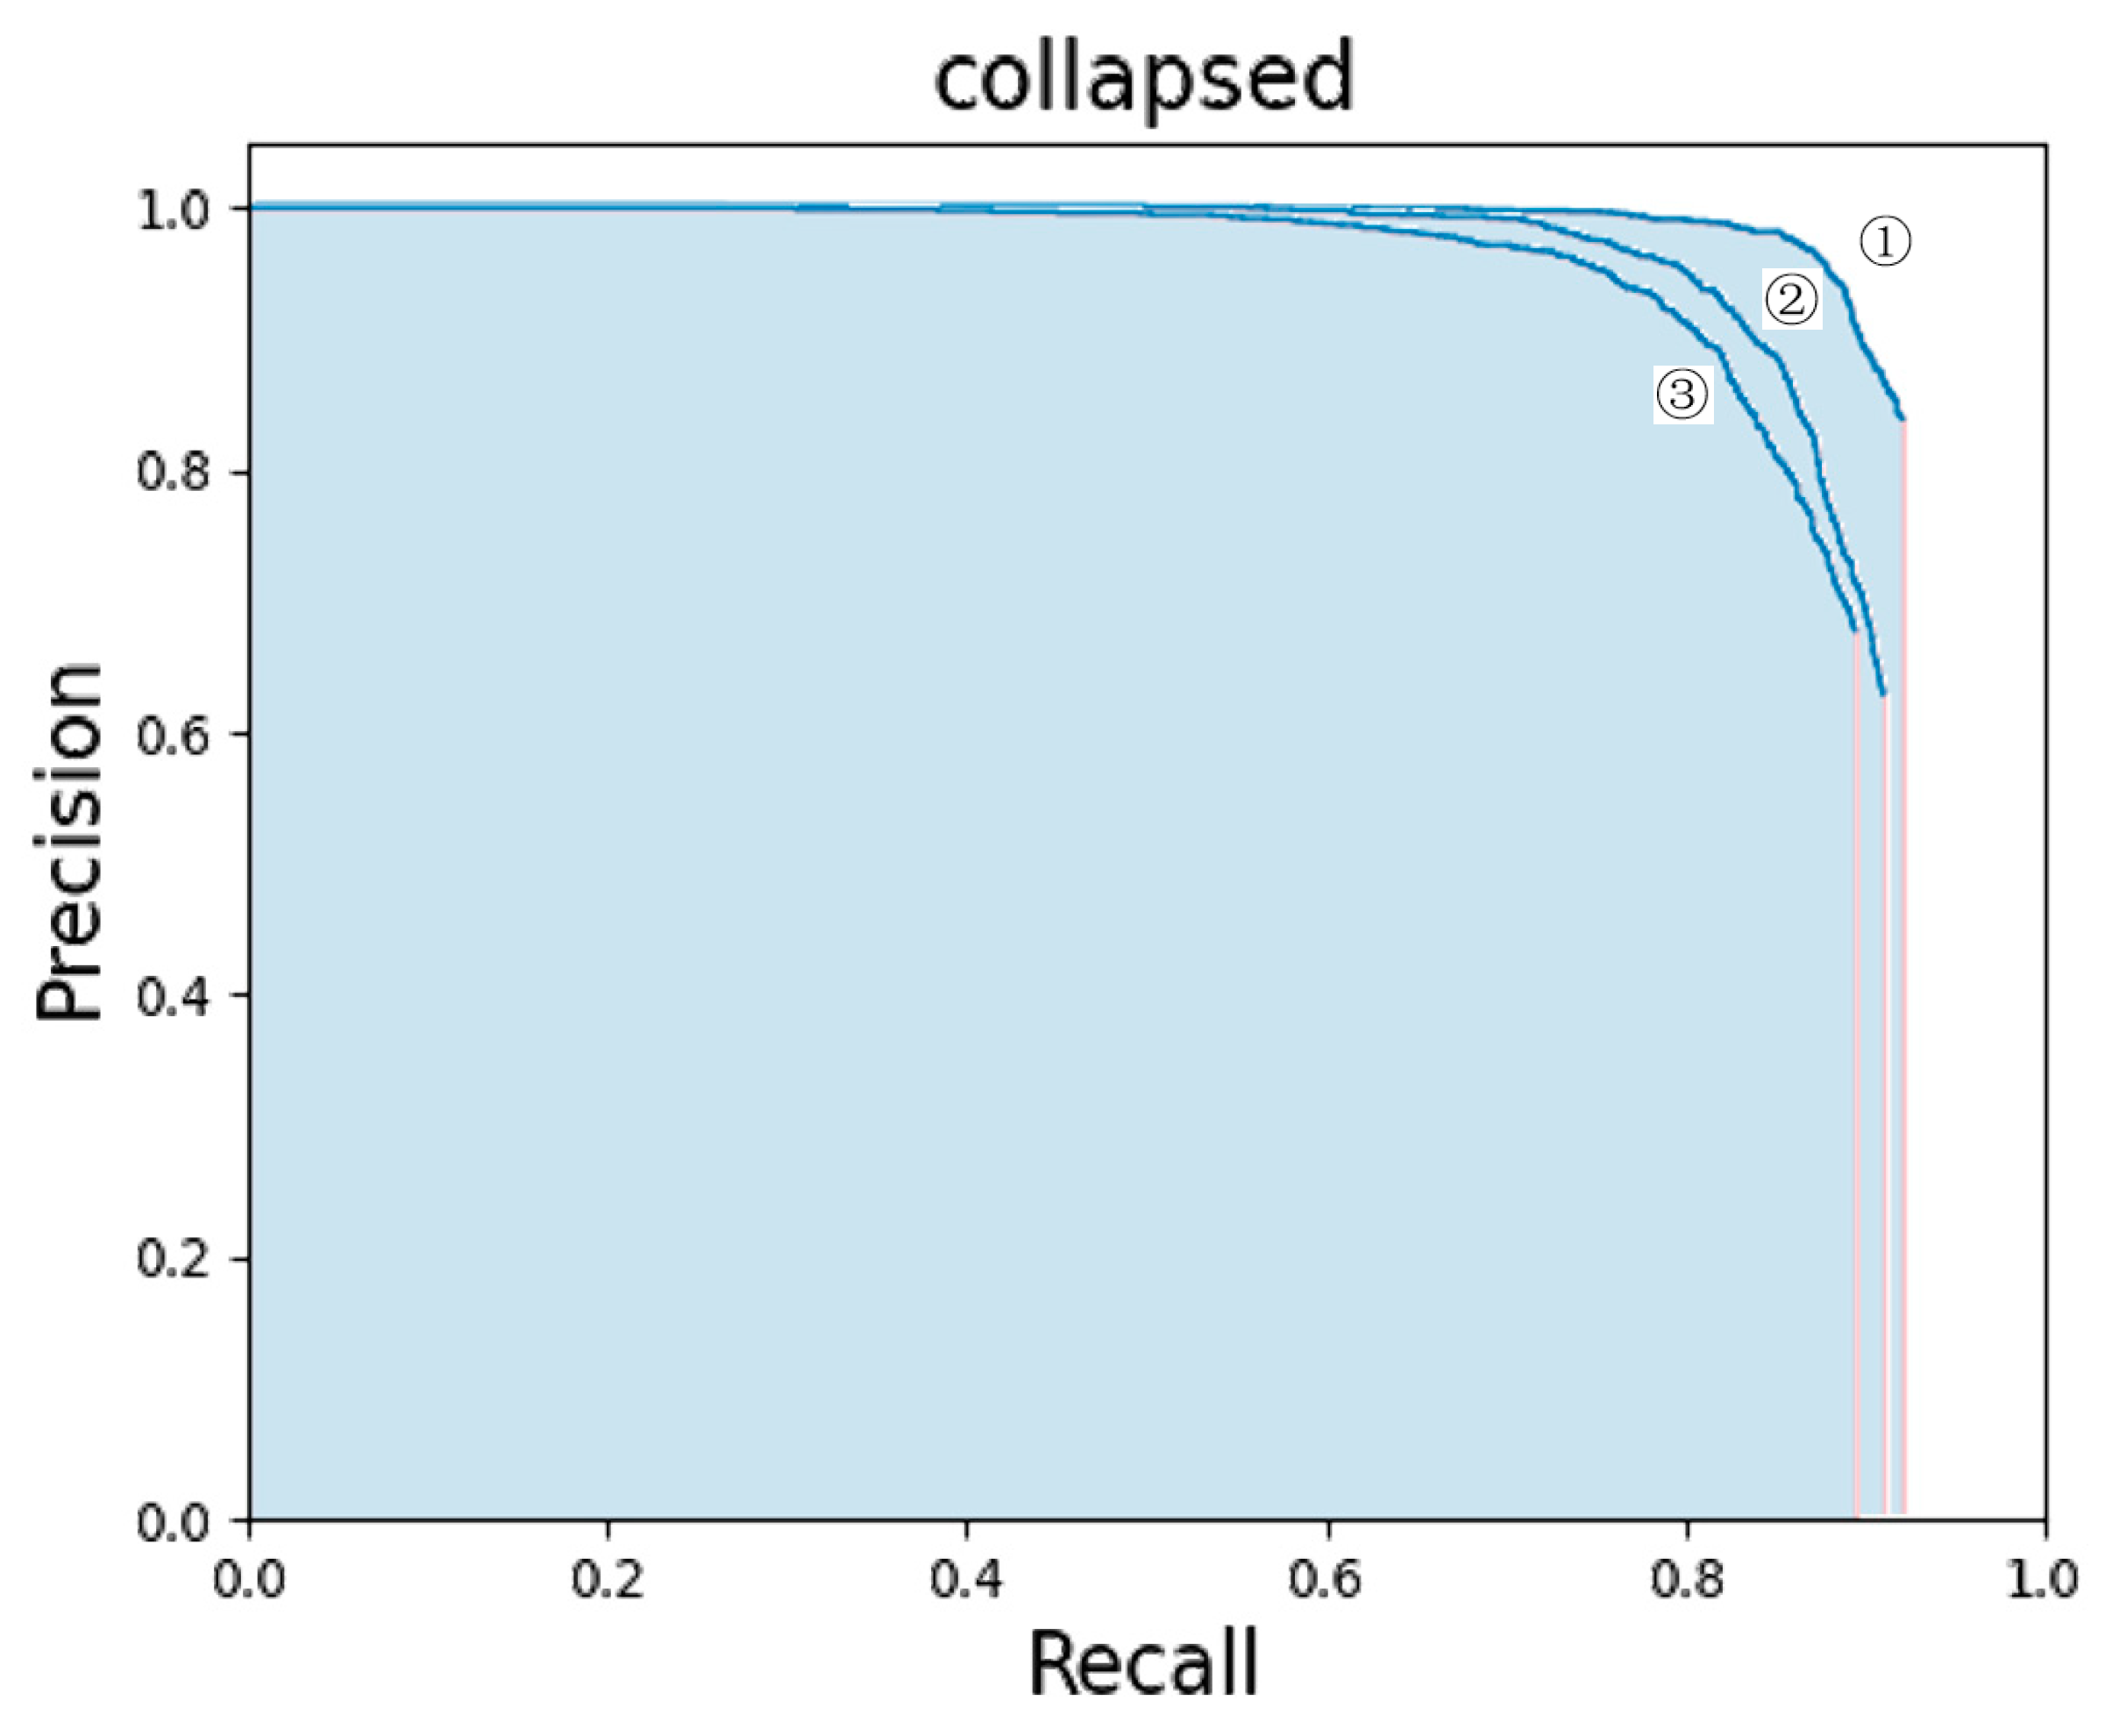
In order to evaluate the network intuitively, Figure 6 shows the PRC of the three networks which are labeled ③②①. These are the PRC curves of the ③ YOLOv4+ResNext+Focal-EIOU Loss, ② YOLOv4+ResNet, and ① YOLOv4 models. According to the characteristics of the PRC curve, the network represented by the latter curve performs better when one curve is surrounded by another curve. It can be clearly seen from the figure that the curves of the YOLOv4+ResNext model and the YOLOv4+ResNext+Focal-EIOU loss model surround the curve of YOLOv4, but the curve of the YOLOv4+ResNext+Focal-EIOU loss model surrounds the curve of YOLOv4+ResNext, and this fact is still clearly visible. We can observe from the curve that as the recall rate increases, the accuracy rate gradually decreases. When the recall rate was about 0.88, the accuracy of YOLOv4 and YOLOv4+ResNext dropped significantly to about 0.6, while the accuracy of the YOLOv4+ResNext+Focal-EIOU loss model remained at about 0.93. In other words, the improved model has an obvious advantage in accuracy when the recall rate is the same. This shows that using Focal-EIOU loss as the loss function can train the model better and more adequately, and improve the detection performance of the model, which is suitable for the detection of collapsed buildings. Amongst the three networks, the YOLOv4+ResNext+Focal-EIOU loss model is the most effective, followed by YOLOv4+ResNext.

Figure 6.
Comparison of three model precision-recall curves. ①: YOLOv4+ResNext+Focal-EIOU Loss. ②: YOLOv4+ResNext. ③: YOLOv4.
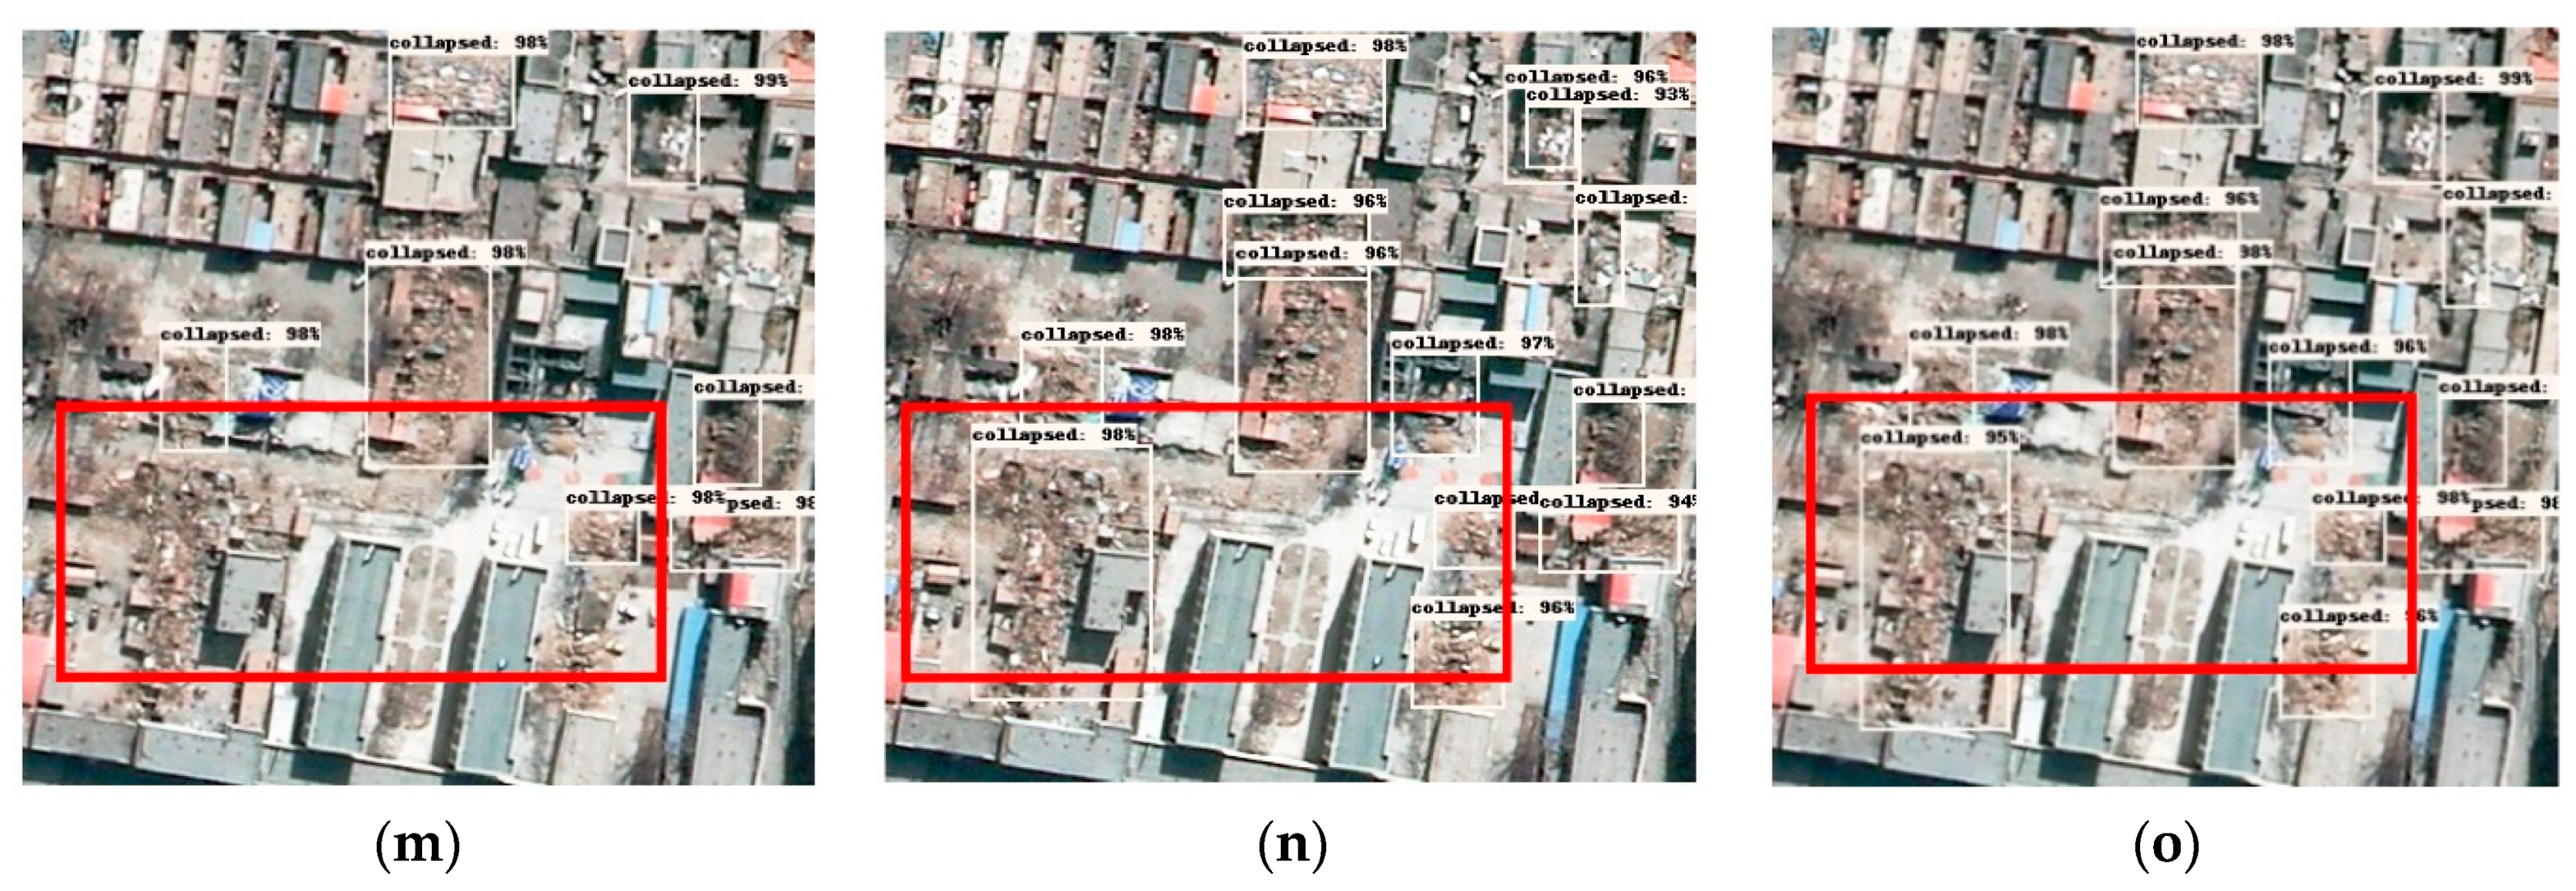
The two improved models were compared with the YOLOv4 model, and the results are presented in Table 1. Compared with the YOLOv4 model, the indicators of the two improved models were significantly improved. Amongst them, the YOLOv4+ResNext+Focal EIOU loss model performed best, with AP of 93.76%, F1 of 87.25%, and FPS of 32.7 f/s. The FPS of the three models were obtained under the same hardware conditions to avoid the influence of other variables. The improvement of the F1 score and AP can be attributed to the improvement of the backbone feature extraction module and the improvement of loss function. Additionally, we can find that the improvement of the loss function can better improve the accuracy of detection. By replacing the original loss function with the Focal-EIOU loss function that pays more attention to the high-quality training samples, we can more accurately evaluate the connection between the prediction box and the real box and evaluate the deviation of the loss of the predict box relate to the real box. In this way, the loss function can better guide the back propagation of the model in the training process and improve the ability of the model. Secondly, the increase in detection speed benefits from the improvement of the network detail. Then change the residual block in CSPDarknet53 and in YOLOv4 to the ResNext block module, and replace the original convolution with a depth-wise separable convolution, which not only improves the feature extraction ability of the model, but also reduces the number of network parameters, thus making the improved model. It not only maintains a high target detection accuracy, but also reduces the number of parameters and improves the detection speed. In Figure 7, three columns of images from left to right is an example of the detection results of the YOLOv4, YOLOv4+ResNext, and YOLOv4+ResNext+Focal_EIOU loss models in the test remote sensing images, and the parts with obvious differences in the detection results of the three models are marked in red boxes. From the test results, the improved models have higher detection performance than YOLOv4. Among them, the YOLOv4+ResNext+Focal-EIOU loss model has the highest detection accuracy. Most of the collapsed buildings in the remote sensing images can be detected in three models, but there are also certain detection errors and missed detections. For example, in Figure 7a–c, the improved model can well detect some small collapsed buildings, but YOLOv4 has missed detection. The background environment of high-resolution remote sensing images after an earthquake is much more complicated than natural images, which causes the model to detect certain objects in the background environment as collapsed buildings. For example, Figure 7d–f, bare soil similar to the image features of collapsed buildings can be easily detected by mistake. In addition, the model detection results can easily ignore collapsed buildings that have similar features to the background image. In order to verify the robustness of the model, we have performed image brightness enhancement processing on some detected images, as presented in Figure 7 g–i, to ensure the improved model also performs better. Moreover, salt and pepper noise are added to some detected images, as presented in Figure 7j–l, and the results show that the improved model can still detect collapsed buildings very well after adding noise, and the detection effect is better than the original model. In addition, in Figure 7m–o, we could find from the right side of the picture that the original YOLOv4 model does not perform well for small collapsed buildings, and missed many small objects, while the improved model has significantly improved the detection results.

Table 1.
Performance comparison of three models.
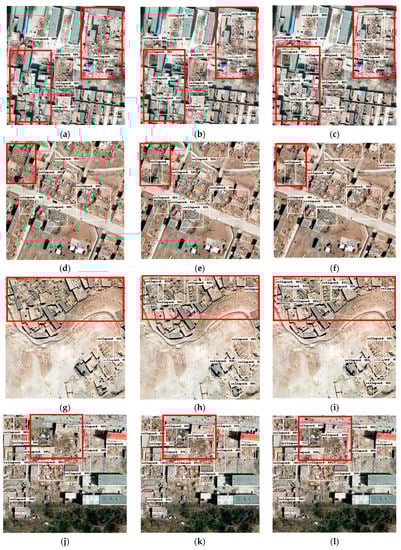
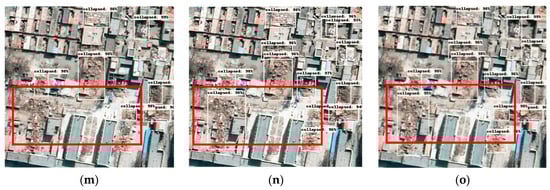
Figure 7.
The results of the detection of collapsed buildings of the three models. From left column to right column are the detection results of YOLOv4 (a,d,g,j,m), YOLOv4+ResNext (b,e,h,k,n), and YOLOv4+ResNext-Focal+EIOU Loss (c,f,i,l,o) respectively.
We could also find that the original YOLOv4 model missed some damaged buildings that are mixed with the background, and the confidence of the detection is lower than that of the YOLOv4+ResNext model. Compared with the ResNet module in YOLOv4, the ResNext module we use has a group convolution method to perform feature calculations on images in different dimensional spaces, so that more features can be obtained, thereby improving the accuracy of classification. Furthermore, YOLOv4+ResNext+Focal-EIOU improves the confidence of the detected object and produces the best effect of the three models. This is because Focal-EIOU loss allows the model to pay more attention to samples that are difficult to train during the training process, and solves the problem of imbalance in the number of samples with high and low quality, thus making the training of the model more efficient, so the YOLOv4+ResNext+Focal-EIOU loss model is more fully trained than the YOLOv4-ResNext model and has a better convergence effect.
The detection results of remote sensing images also exposed some problems, such as false detection and missed detection of targets. First, this may be due to the complex background of remote sensing images and the large number of types and numbers of features causing interference; second, although some data enhancement strategies are used before training, the diversity of training data is still relatively weak. Existing problems will be gradually solved by expanding the data set. Despite these problems, our proposed CNN still has some improvements compared with traditional methods.
5. Conclusions
In this research, we have developed an improved YOLOv4 model, which is used to extract the collapsed buildings in aerial images after the earthquake. The improvement is mainly made from two parts, namely the improvement of the backbone feature extraction network and the improvement of the loss function. For the backbone part, we replaced the residual block body in the CSPDarknet53 module in YOLOv4 with ResNext block body, and then used the depth-wise separable convolution to replace the traditional convolution to reduce the amount of parameters and complexity of backbone. The improved model improves the feature extraction ability of object detection without adding additional parameters. Second, we used Focal-EIOU loss to replace the original CIOU loss in the YOLOv4 model to obtain a better bounding box regression effect. The results show that the YOLOv4+ResNext+Focal-EIOU loss model performs best, with an AP of 93.76%% and F1 score of 87.25%. Compared with YOLOv4, the AP of YOLOv4+ResNext+Focal-EIOU loss model increased by 9.48%, the F1 score increased by 33.3%, and FPS increased by 34%. In terms of detection capabilities, the improved YOLOv4+ResNext+Focal-EIOU loss model reduces the false detections and missed detections, and enhances the detection capabilities of small buildings and collapsed buildings with similar backgrounds. The experimental results show that the YOLOv4+ResNext+Focal-EIOU loss model has strong robustness, indicating the effectiveness of the model in identifying collapsed buildings in remote sensing images. However, the test results of the model also revealed some problems, such as the fact that missed detection and error detection problems still exist, and model training takes a long time, so end-to-end detection cannot be achieved. Moreover, the model has high requirements for training equipment and cannot be deployed to mobile terminals [41]. The future research plans to use remote sensed spectrum, texture and other information to assist the extraction of collapsed buildings information, and there are methods to further reduce the complexity of the model. This will be the next direction of work.
Author Contributions
Conceptualization, L.S. and F.Z.; methodology, L.S.; software, L.S. writing—original draft preparation, L.S.; writing—review and editing, L.S., F.Z. and J.X. (Junshi Xia); visualization, L.S.; supervision, Z.D. and Z.Z.; project administration, F.Z. and J.X. (Jibo Xie); funding acquisition, F.Z., Z.D., R.L. and J.X. (Junshi Xia) All authors have read and agreed to the published version of the manuscript.
Funding
This research was funded by the National Key R&D Program of China (2019YFE0127400); KAKENHI (19K20309) and the National Natural Science Foundation of China (41671391, 41922043 and 41871287).
Acknowledgments
The authors would like to thank the editors and anonymous reviewers for their efforts on improving this paper.
Conflicts of Interest
The authors declare no conflict of interest.
References
- Song, D.; Tan, X.; Wang, B.; Zhang, L.; Shan, X.; Cui, J. Integration of super-pixel segmentation and deep-learning methods for evaluating earthquake-damaged buildings using single-phase remote sensing imagery. Int. J. Remote Sens. 2020, 41, 1040–1066. [Google Scholar] [CrossRef]
- Zhang, R.; Li, H.; Duan, K.; You, S.; Liu, K.; Wang, F.; Hu, Y. Automatic detection of earthquake-damaged buildings by integrating AERIAL oblique photography and infrared thermal imaging. Remote Sens. 2020, 12, 2621. [Google Scholar] [CrossRef]
- Wei, D.; Yang, W. Detecting damaged buildings using a texture feature contribution index from post-earthquake remote sensing images. Remote Sens. Lett. 2020, 11, 127–136. [Google Scholar] [CrossRef]
- Wang, X.; Li, P. Extraction of urban building damage using spectral, height and corner information from VHR satellite images and airborne LiDAR data. ISPRS J. Photogramm. Remote Sens. 2020, 159, 322–336. [Google Scholar] [CrossRef]
- Hajeb, M.; Karimzadeh, S.; Matsuoka, M. SAR and LIDAR datasets for building damage evaluation based on support vector machine and random forest algorithms—A case study of Kumamoto earthquake, Japan. Appl. Sci. 2020, 10, 8932. [Google Scholar] [CrossRef]
- Saganeiti, L.; Amato, F.; Nolè, G.; Vona, M.; Murgante, B. Early estimation of ground displacements and building damage after seismic events using SAR and LiDAR data: The case of the Amatrice earthquake in central Italy, on 24th August 2016. Int. J. Disaster Risk Reduct. 2020, 51, 101924. [Google Scholar] [CrossRef]
- Janalipour, M.; Mohammadzadeh, A. Evaluation of effectiveness of three fuzzy systems and three texture extraction methods for building damage detection from post-event LiDAR data. Int. J. Digit. Earth 2018, 11, 1241–1268. [Google Scholar] [CrossRef]
- Jiao, Q.; Jiang, H.; Li, Q.; Šipoš, T.K. Building Earthquake Damage Analysis Using Terrestrial Laser Scanning Data. Adv. Civ. Eng. 2019, 2019, 8308104. [Google Scholar] [CrossRef]
- Gong, L.; Li, Q.; Zhang, J. Earthquake Building Damage Detection With Object-ORIENTED Institute of Crustal Dynamics. In Proceedings of the 2013 IEEE International Geoscience and Remote Sensing Symposium, Melbourne, Australia, 21–26 July 2013; pp. 3674–3677. [Google Scholar]
- Wang, C.; Qiu, X.; Liu, H.; Li, D.; Zhao, K. Damaged Buildings Recognition of Post- Earthquake High-Resolution Remote Sensing images based on Feature Space and Decision Tree Optimization. Comput. Sci. Inf. Syst. 2020, 17, 619–646. [Google Scholar]
- Zhou, Z.; Gong, J.; Hu, X. Automation in Construction Community-scale multi-level post-hurricane damage assessment of residential buildings using multi-temporal airborne LiDAR data. Autom. Constr. 2019, 98, 30–45. [Google Scholar] [CrossRef]
- Janalipour, M.; Mohammadzadeh, A. A novel and automatic framework for producing building damage map using post-event LiDAR data. Int. J. Disaster Risk Reduct. 2019, 39, 101238. [Google Scholar] [CrossRef]
- Likas, A.; Vlassis, N.J.; Verbeek, J. The global k-means clustering algorithm. Pattern Recognit. 2003, 36, 451–461. [Google Scholar] [CrossRef] [Green Version]
- Fan, X.; Nie, G.; Deng, Y.; An, J.; Zhou, J.; Xia, C.; Pang, X. International Journal of Disaster Risk Reduction Estimating earthquake-damage areas using Landsat-8 OLI surface re fl ectance data. Int. J. Disaster Risk Reduct. 2019, 33, 275–283. [Google Scholar] [CrossRef]
- Moya, L.; Perez, L.R.M.; Mas, E.; Adriano, B.; Koshimura, S.; Yamazaki, F. Novel unsupervised classification of collapsed buildings using satellite imagery, hazard scenarios and fragility functions. Remote Sens. 2018, 10, 296. [Google Scholar] [CrossRef] [Green Version]
- He, K.; Sun, J. Deep Residual Learning for Image Recognition. In Proceedings of the IEEE Conference on Computer Vision and Pattern Recognition (CVPR), Las Vegas, NV, USA, 27–30 June 2016. [Google Scholar]
- Krizhevsky, B.A.; Sutskever, I.; Hinton, G.E. ImageNet Classification with Deep Convolutional Neural Networks. Adv. Neural Inf. Process. Syst. 2012, 25, 1097–1105. [Google Scholar] [CrossRef]
- Esteva, A.; Kuprel, B.; Novoa, R.A.; Ko, J.; Swetter, S.M.; Blau, H.M.; Thrun, S. Dermatologist-level of skin cancer with deep neural networks. Nat. Publ. Gr. 2017. [Google Scholar] [CrossRef]
- E Yu, Z.; Shen, Y.; Shen, C. A real-time detection approach for bridge cracks based on YOLOv4-FPM. Autom. Constr. 2021, 122, 103514. [Google Scholar] [CrossRef]
- Ji, M.; Liu, L.; Zhang, R.; Buchroithner, M.F. Discrimination of earthquake-induced building destruction from space using a pretrained CNN model. Appl. Sci. 2020, 10, 602. [Google Scholar] [CrossRef] [Green Version]
- Wu, C.; Zhang, F.; Xia, J.; Xu, Y.; Li, G.; Xie, J.; Du, Z.; Liu, R. Building Damage Detection Using U-Net with Attention Mechanism from Pre- and Post-Disaster Remote Sensing Datasets. Remote Sens. 2021, 13, 905. [Google Scholar] [CrossRef]
- Wang, Q.; Shen, F.; Cheng, L.; Jiang, J.; He, G.; Sheng, W.; Jing, N.; Mao, Z. Ship detection based on fused features and rebuilt YOLOv3 networks in optical remote-sensing images. Int. J. Remote Sens. 2021, 42, 520–536. [Google Scholar] [CrossRef]
- Ren, S.; He, K.; Girshick, R.; Sun, J. Faster R-CNN: Towards Real-Time Object Detection with Region Proposal Networks. IEEE Trans. Pattern Anal. Mach. Intell. 2017, 39, 1137–1149. [Google Scholar] [CrossRef] [Green Version]
- He, K.; Gkioxari, G.; Dollár, P. Mask R-CNN. In Proceedings of the IEEE Conference on Computer Vision and Pattern Recognition, Honolulu, HI, USA, 21–26 July 2017; pp. 2961–2969. [Google Scholar]
- Redmon, J.; Divvala, S.; Girshick, R. You only look once: Unified, real-time object detection. In Proceedings of the IEEE Conference on Computer Vision and Pattern Recognition, Las Vegas, NV, USA, 27–30 June 2016; pp. 779–788. [Google Scholar]
- Xu, D.; Wu, Y. Improved YOLO-V3 with densenet for multi-scale remote sensing target detection. Sensors 2020, 20, 4276. [Google Scholar] [CrossRef] [PubMed]
- Redmon, J.; Farhadi, A. YOLOv3: An incremental improvement. arXiv 2018, arXiv:1804.02767. [Google Scholar]
- Miura, H.; Aridome, T.; Matsuoka, M. Deep learning-based identification of collapsed, non-collapsed and blue tarp-covered buildings from post-disaster aerial images. Remote Sens. 2020, 12, 1924. [Google Scholar] [CrossRef]
- Bochkovskiy, A.; Wang, C.Y.; Liao, H.Y.M. YOLOv4: Optimal Speed and Accuracy of Object Detection. arXiv 2020, arXiv:2004.10934. [Google Scholar]
- Everingham, M.; Van Gool, L.; Williams, C.K.I.; Winn, J. The P ASCAL Visual Object Classes (VOC) Challenge. Int. J. Comput. Vis. 2010, 88, 303–338. [Google Scholar] [CrossRef] [Green Version]
- Wang, C.; Liao, H.M.; Wu, Y.; Chen, P. CSPNet: A New Backbone That Can Enhance Learning Capability of CNN. In Proceedings of the IEEE/CVF Conference on Computer Vision and Pattern Recognition (CVPR) Workshops, Seattle, WA, USA, 13–19 June 2020; pp. 390–391. [Google Scholar]
- He, K.; Zhang, X.; Ren, S.; Sun, J. Spatial Pyramid Pooling in Deep Convolutional Networks for Visual Recognition. IEEE Trans. Pattern Anal. Mach. Intelligence 2015, 37, 1904–1916. [Google Scholar] [CrossRef] [PubMed] [Green Version]
- Liu, S.; Qi, L. Path Aggregation Network for Instance Segmentation. In Proceedings of the IEEE/CVF Conference on Computer Vision and Pattern Recognition, Salt Lake City, UT, USA, 18–23 June 2018; pp. 8759–8768. [Google Scholar]
- Lin, T.; Doll, P.; Girshick, R.; He, K.; Hariharan, B.; Belongie, S.; Ai, F. Feature Pyramid Networks for Object Detection. In Proceedings of the IEEE Conference on Computer Vision and Pattern Recognition (CVPR), Honolulu, HI, USA, 21–26 July 2017; pp. 2117–2125. [Google Scholar]
- Xie, S.; Girshick, R.; Doll, P. Aggregated Residual Transformations for Deep Neural Networks. In Proceedings of the IEEE Conference on Computer Vision and Pattern Recognition (CVPR), Honolulu, HI, USA, 21–26 July 2017; pp. 1492–1500. [Google Scholar]
- Rezatofighi, H.; Tsoi, N.; Gwak, J.; Reid, I.; Savarese, S. Generalized Intersection over Union: A Metric and A Loss for Bounding Box Regression. In Proceedings of the IEEE/CVF Conference on Computer Vision and Pattern Recognition (CVPR), Long Beach, CA, USA, 15–20 June 2019; pp. 658–666. [Google Scholar]
- Zhang, Y.-F.; Ren, W.; Zhang, Z.; Jia, Z.; Wang, L.; Tan, T. Focal and Efficient IOU Loss for Accurate Bounding Box Regression. arXiv 2021, arXiv:2101.08158. [Google Scholar]
- Lin, T.Y.; Goyal, P.; Girshick, R.; He, K.; Dollár, P. Focal loss for dense object detection. In Proceedings of the IEEE Conference on Computer Vision and Pattern Recognition (CVPR), Honolulu, HI, USA, 21–26 July 2017; pp. 2980–2988. [Google Scholar]
- Tian, Y.; Yang, G.; Wang, Z.; Wang, H.; Li, E.; Liang, Z. Apple detection during diff erent growth stages in orchards using the improved YOLO-V3 model. Comput. Electron. Agriculture. 2019, 157, 417–426. [Google Scholar] [CrossRef]
- Nhu, V.H.; Janizadeh, S.; Avand, M.; Chen, W.; Farzin, M.; Omidvar, E.; Shirzadi, A.; Shahabi, H.; Clague, J.J.; Jaafari, A.; et al. GIS-Based gully erosion susceptibility mapping: A comparison of computational ensemble data mining models. Appl. Sci. 2020, 10, 2039. [Google Scholar] [CrossRef] [Green Version]
- Hou, T.; Ahmadyan, A.; Zhang, L.; Wei, J. MobilePose: Real-Time Pose Estimation for Unseen Objects with Weak Shape Supervision. arXiv 2020, arXiv:2003.03522. [Google Scholar]

Publisher’s Note: MDPI stays neutral with regard to jurisdictional claims in published maps and institutional affiliations. |
© 2021 by the authors. Licensee MDPI, Basel, Switzerland. This article is an open access article distributed under the terms and conditions of the Creative Commons Attribution (CC BY) license (https://creativecommons.org/licenses/by/4.0/).