Article

Continuous Detection of Forest Loss in Vietnam, Laos, and Cambodia Using Sentinel-1 Data

1
GlobEO, 31400 Toulouse, France
2
CNRS/CNES/IRD/INRAE/UPS, CESBIO, Université de Toulouse, 31400 Toulouse, France
3
Centre National d’Etudes Spatiales, 31400 Toulouse, France
4
World Wildlife Fund France, 93310 Le Pré-Saint-Gervais, France
5
LaSTIG, IGN, University of Gustave Eiffel, 77420 Champs-sur-Marne, France
6
Cerema Sud-Ouest, 31400 Toulouse, France
*
Author to whom correspondence should be addressed.
Remote Sens. 2021, 13(23), 4877; https://doi.org/10.3390/rs13234877
Submission received: 3 October 2021 / Revised: 5 November 2021 / Accepted: 20 November 2021 / Published: 1 December 2021
(This article belongs to the Section Forest Remote Sensing)

Abstract

:
In this study, we demonstrate the ability of a new operational system to detect forest loss at a large scale accurately and in a timely manner. We produced forest loss maps every week over Vietnam, Cambodia, and Laos (>750,000 km2 in total) using Sentinel-1 data. To do so, we used the forest loss detection method based on shadow detection. The main advantage of this method is the ability to avoid false alarms, which is relevant in Southeast Asia where the areas of forest disturbance may be very small and scattered and detection is used for alert purposes. The estimated user accuracy of the forest loss map was 0.95 for forest disturbances and 0.99 for intact forest, and the estimated producer’s accuracy was 0.90 for forest disturbances and 0.99 for intact forest, with a minimum mapping unit of 0.1 ha. This represents an important step forward compared to the values achieved by previous studies. We also found that approximately half of forest disturbances in Cambodia from 2018 to 2020 occurred in protected areas, which emphasizes the lack of efficiency in the protection and conservation of natural resources in protected areas. On an annual basis, the forest loss areas detected using our method are found to be similar to the estimations from Global Forest Watch. These results highlight the fact that this method provides not only quick alerts but also reliable detections that can be used to calculate weekly, monthly, or annual forest loss statistics at a national scale.

1. Introduction

The world’s forests have undergone substantial changes in the last few decades. In the tropics, the authors of [1] estimated that 17% of moist forests disappeared between 1990 and 2019. In certain regions and countries, these changes have been more rapid. This is the case in the Greater Mekong subregion, which is recognized as deforestation hotspot. Vietnam is one of the countries that has seen the largest annual changes in primary forest and planted forest area in the last 20 years. The primary forest area in Vietnam decreased by 6.9%, 15.6%, and 1.2% from 1990 to 2000, 2000 to 2005, and 2005 to 2010 [2], respectively. In 2020, the proportion of primary forest area reached 0.5% of the total forest area (Table 1). Meanwhile, the extent of planted trees increased by values of 0.75 Mha in 1990, 1.92 Mha in 2000, and 3.08 Mha in 2010 [2]. Vietnam is considered by the FAO as a reforesting country because tree plantations are included as forests, as shown by the forest area temporal evolution carried out from 1990 to 2020 listed in Table 1. On the contrary, the amount of forest in Cambodia dropped from approximately 11 to 8 Mha between 1990 and 2020. Laos has also experienced a constant decline in its forest surface.
In this region, illegal and unsustainable logging and the conversion of forests for agriculture, the construction of dams, and infrastructure are direct causes of deforestation and biodiversity loss. These activities are driven by population growth, increasing market demand, and policies that promote short-term economic growth. Commercial logging and log exports are regulated by governments in all Greater Mekong subregion countries. However, the higher demand for timber and weak law enforcement have hindered efforts to control logging and the log trade. Effective tools are thus urgently needed to survey illegal logging operations that are causing widespread concern in the region.
Forest disturbance detection systems have been developed prior to this research. For instance, the FORMA [3], Terra-I [4], and IDEAM systems were developed for the national (IDEAM) and pantropical scale. These systems are based on MODIS data at a 250 m resolution and provide biweekly, monthly, and quarterly detections, respectively. The Brazilian operational system DETER-B [5] provides detections at a 60 m spatial resolution every 5 days. In addition, the MINAM (Peru) produces weekly forest alerts through the so-called PNCB Early Warning Alerts, while the Global Land Analysis and Discovery (GLAD) team from the University of Maryland (UMD) produces GLAD forest alerts [6]; both of these use Landsat data at a 30 m resolution. However, most monitoring approaches rely predominantly on optical remote sensing, following the opening of the Landsat archive in 2008 together with the availability of easily downloadable fully processed images. Nevertheless, a major limitation for optical-based alerts is the presence of haze in the dry season (caused by fire) and, more importantly, of clouds persisting in the tropics during the wet season, causing substantial temporal detection delays.
Synthetic aperture radar (SAR) images have great potential in tropical areas because electromagnetic waves are partly insensitive to clouds. However, SAR images have been used less than optical images for forest loss monitoring, in particular because of the low data availability until the Sentinel-1 program and the lack of data processing chains, as detailed in [7]. The JJ-FAST system developed by JAXA/JICA and based on ALOS-2 SAR allows one to produce forest loss alerts every 1.5 months at a 5 ha resolution over 77 tropical countries [8]. The dense time series of the Sentinel-1 satellites offer a great opportunity to monitor forests weekly at the global scale. Since the launch of Sentinel-1 in 2014, SAR images are now easily accessible with systematic acquisitions at a 5 × 20 m spatial resolution and a 6- to 12-day revisit time, regardless of the weather conditions. As a result, Sentinel-1 data are increasingly becoming the subject of research works on forest loss detection. We counted 28 papers related to forest loss detection using Sentinel-1 data published in peer-reviewed journals as of January 2021. The study areas covered in these papers are relatively small, i.e., <10,000 km2 in 20 out of 28 papers. However, large-scale forest loss mapping emerged very recently. The authors of [9,10] mapped forest loss over areas of approximately 265,000 km2 and 227,000 km2, respectively. In [11], the authors used Google Earth Engine to develop a method for forest loss detection over the Brazilian Amazon, which may lead to the creation of an automated, cloud-based deforestation detection system running on INPE’s servers. More recently, the authors of [12] released a new forest loss alert detection system based on Sentinel-1 data called RADD. This system has been applied over the Congo Basin, insular Southeast Asia and Amazonia thus far, and the map is available via Google Earth Engine. It is interesting to note that the minimum mapping unit (MMU), when reported in the 28 papers, is always larger than 0.2 ha, except in [13,14,15]. We found this surprising given the high impact of the MMU on forest loss detection accuracy. There is thus a need for methods that could allow us to detect, over large areas, small and scattered areas of disturbance, as encountered in many illegal logging operations around the world.
In this study, we present a new operational system that allows one to accurately detect forest loss in a timely manner. The method is applied to Vietnam, Cambodia, and Laos (approximately 750,000 km2 in total) in the Greater Mekong region in Southeast Asia, which is considered to be a hotspot of deforestation. For the demonstration, we produced forest loss maps every week using Sentinel-1 data from January 2018 to January 2021, with an MMU of 0.1 ha. To do so, we used the forest loss detection method based on the detection of shadows that occur at the edge of intact and disturbed forest, as detailed in [13,14,15]. The main advantage of the method is the low false alarm detection rate. This method is based on the use of the radar change ratio (RCR) indicator [16] at VH polarization. Two different thresholds are applied for RCR temporal values to first detect shadows and then the forest loss areas around the shadows. We investigated the adaptation of the forest loss detection method to the context of Vietnam, Laos, and Cambodia. We then assessed the capacity of the method to provide not only quick alerts but also reliable detections that can be used to calculate weekly, monthly, or annual forest loss statistics. The results were thoroughly validated following the recommendations from [17,18]. We also compared the annual detections rates from this study and from Global Forest Watch (GFW) and estimated, in each country, the proportion of forest disturbances occurring in protected areas.
The study area, data, and methods are described in Section 2 of this paper. The results and discussion are provided in Section 3. Finally, conclusions are given in Section 4.

2. Materials and Methods
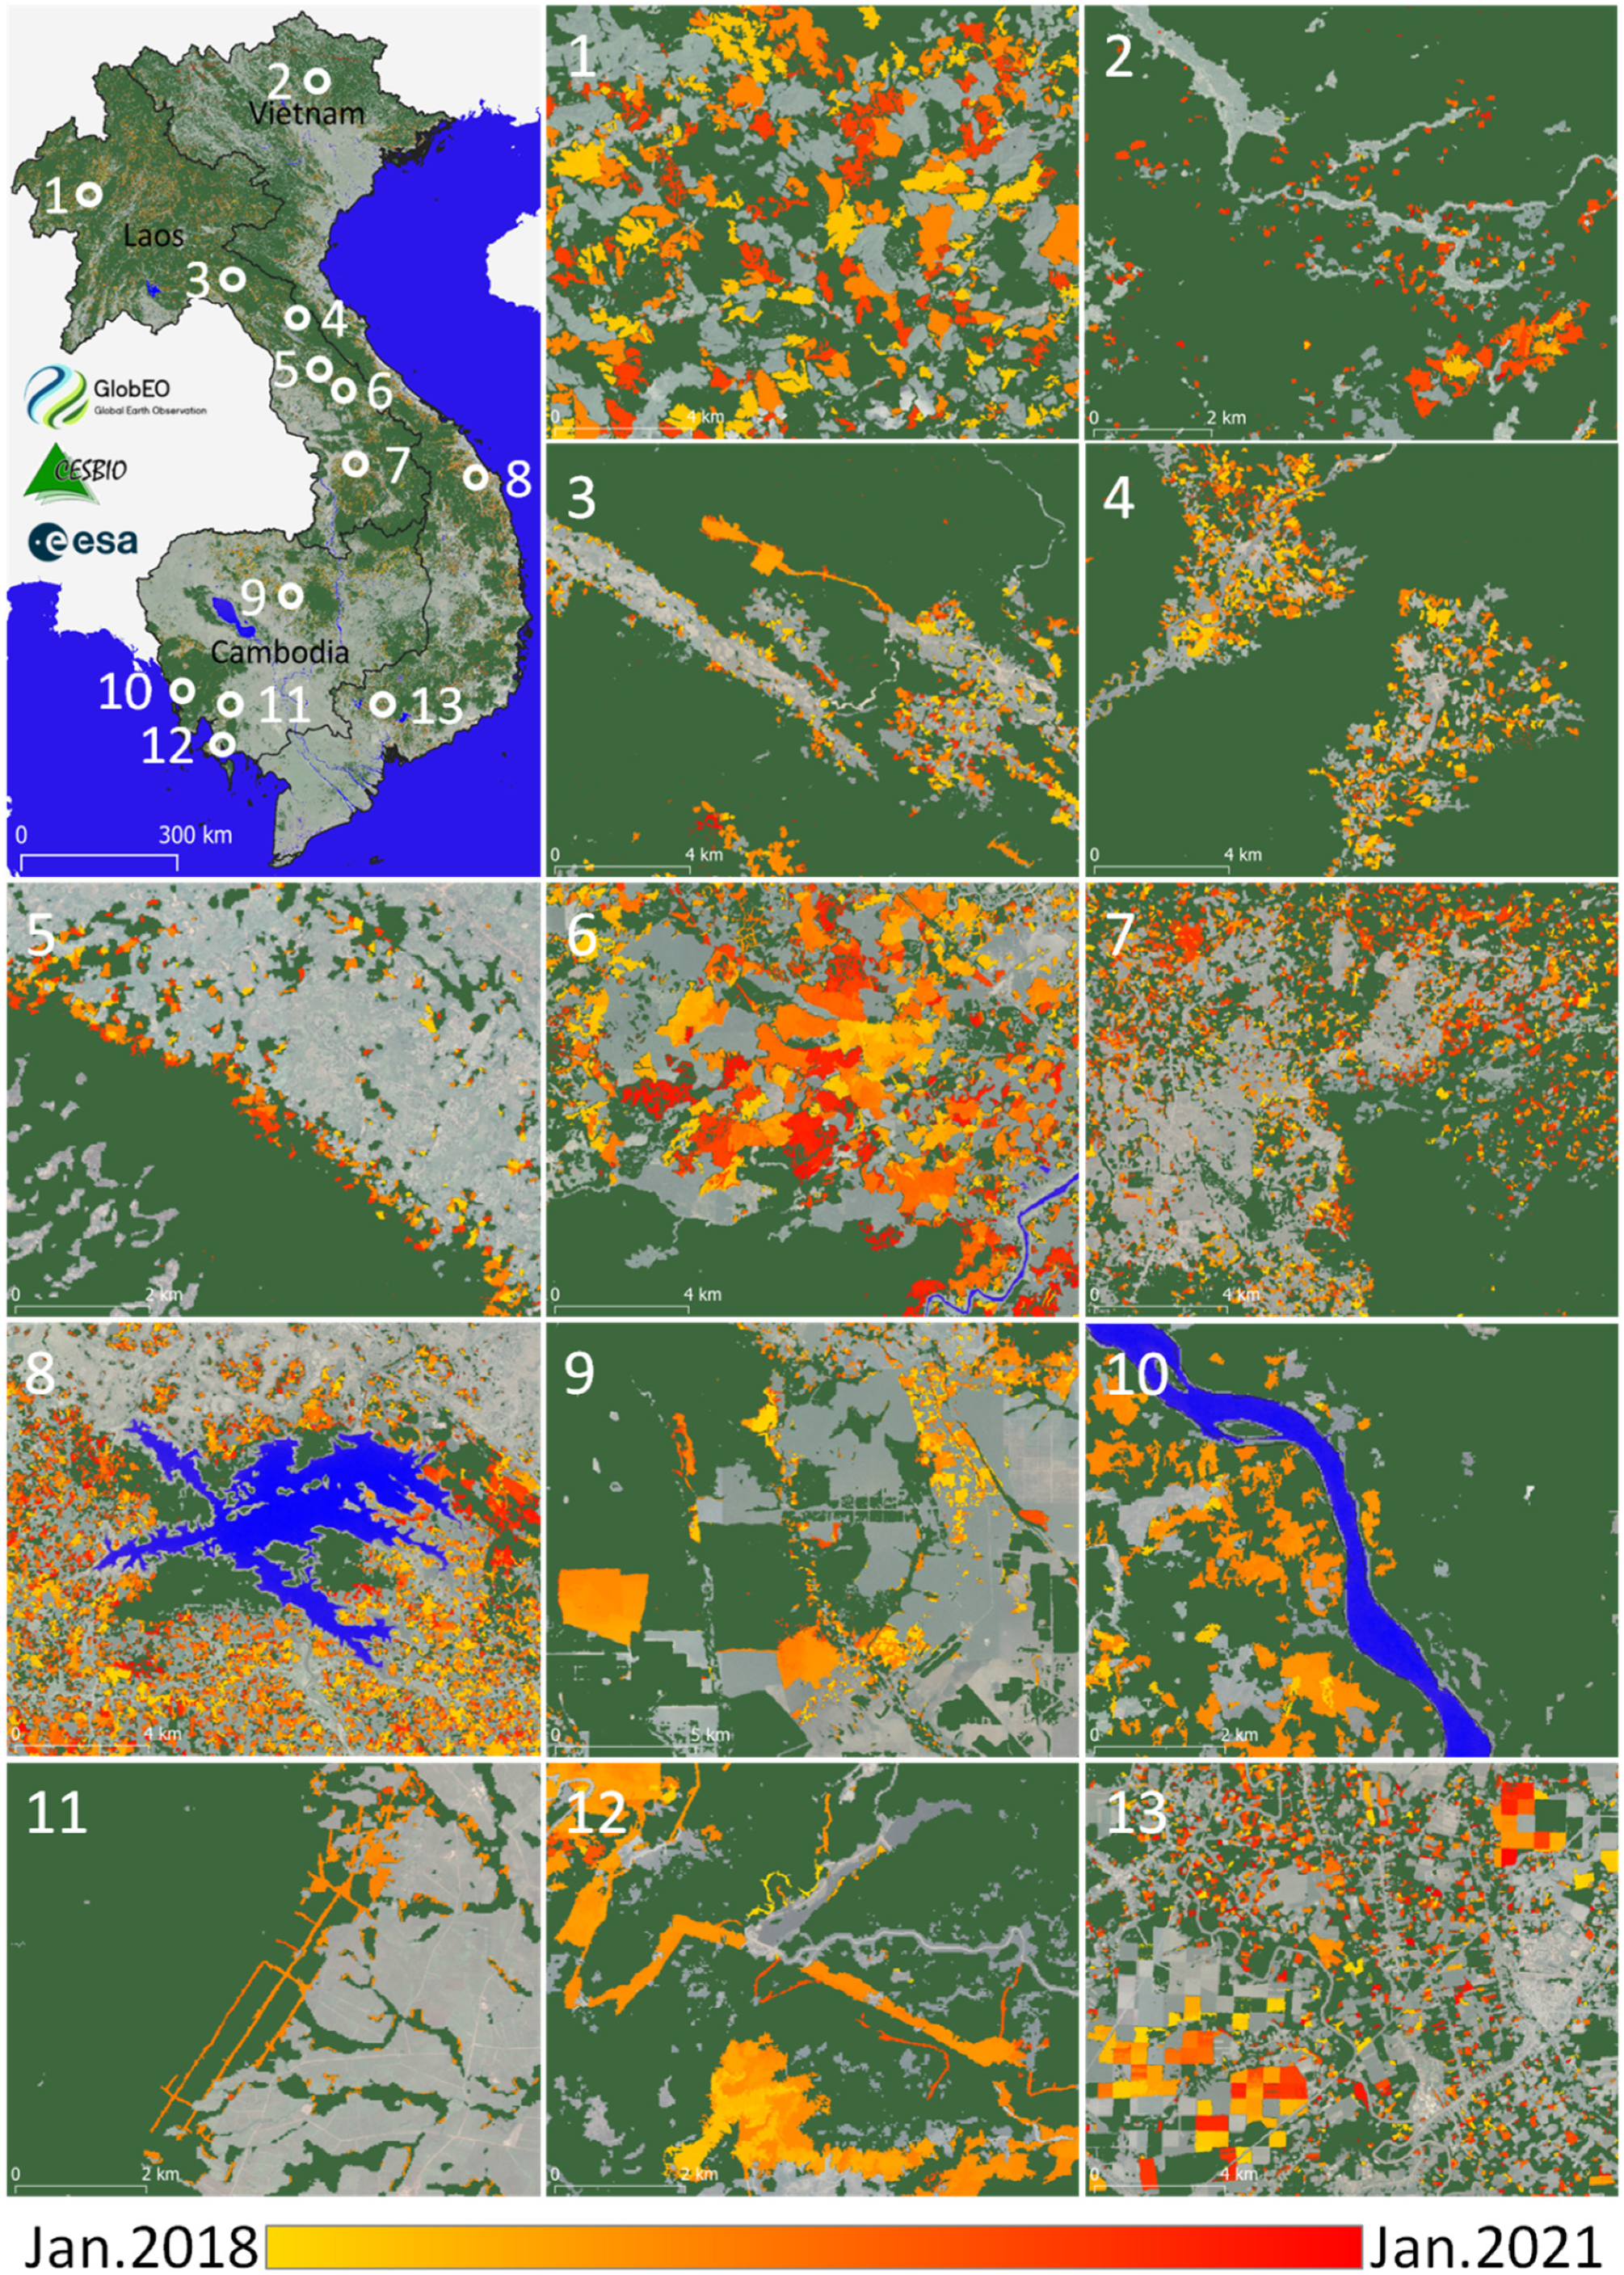
2.1. Study Area

Vietnam is located in Southeast Asia from roughly 9 to 23°N and covers approximately 332,000 km2. The country shares borders with Cambodia, Laos, and China. Vietnam has a dry season and a rainy season, the latter from May to September with rainfalls above 1000 mm per year in nearly every region. The terrain of Vietnam is mountainous in the northwest and in the Central Highlands, with elevations reaching up to 2450 m. In contrast, there are extensive flat regions with a low elevation in the Red River Delta and the Mekong Delta. In Vietnam, forest ecosystems are considered to be abundant and rich in biodiversity [2]. Three main types of forests constitute most of the Vietnamese natural forest: (1) evergreen broadleaf forest occupying approximately 85% of the natural forest area; (2) deciduous forest, mainly occurring in the Central Highlands and South-Central Coast; (3) coniferous forest, in particular in the Central Highlands. According to FAO FRA [2], the Vietnam forest extent amounted to 14.6 Mha in 2020, as shown in Table 1 (47.2% of the land area), representing an increase of 13.4 Mha from 2010 (43.2% of the land area), with an annual rate of +0.4% in 10 years, due to reforestation through tree plantations compensating for forest loss. However, it is important to know where and to what extent forest loss occurs due to its impacts on biodiversity reduction and carbon emissions.
Cambodia is located roughly between 10.5 and 14.5°N and 102 to 107.5°E and covers more than 180,000 km2. Cambodia has a dry season and a rainy season, with the mean daily temperature rising and falling in both seasons, creating four annual seasons. Cambodia is relatively flat except in the southwest (mostly in Koh Kong province). The forest in south and central Cambodia is mostly evergreen, being deciduous in the north and east. Cambodia is recognized as the world hotspot of deforestation. According to [2], forested area amounted to 8.1 Mha (45.7% of the land area), representing a large decrease of 11 Mha from 2010 (60% of the land area), with an annual rate of −0.58%.
Laos is located from 20 to 26°N and from 100 to 107°E, covering approximately 237,000 km2, and is surrounded entirely by land. Mountains and plateaus constitute approximately 75% of the country’s surface area, particularly in the north. Laos has a rainy season that lasts from May to September and a dry season from October to April. Mixed deciduous forest is the most dominant forest type occurring in the region, accounting for about approximately 10 Mha of the forested area. Other types of forest include dry evergreen, coniferous, and mixed coniferous and broadleaved forests. The forest extent in 2020 amounted to 15.6 Mha (67.6% of the land area), which represents a decrease of 16.9 Mha from 2010 (73.46% of the land area), with an annual rate of −1.43%.
In this region, where a substantial part of the population is forest-dependent, strong anthropization increases the pressure on forests. In addition, strong anthropization increases the risk of transmission of viruses. As a result, the risk of newly emerging CoV-associated diseases in Southeast Asia should be taken seriously [19].

2.2. Forest Definition

In this study, we defined forest as trees that are at least 5 m tall with a tree cover exceeding 50%. Forest loss was defined as a forest area that had a tree cover of greater than 50% before disturbance and a very low percent of cover after the disturbance (less than 10%, although this value is qualitative). Forest loss (also called forest disturbance in the following) is detected without distinction between deforestation and degradation. The selected forest loss definition applies to severe disturbances, such as natural forest and plantation logging, as well as the conversion of forest areas to other types of land use, such as agriculture and the construction of infrastructure, which are the main causes of forest disturbances in Southeast Asia. Note that the selected tree cover threshold of 50% is much higher than the ones mentioned in the official reports submitted by the three countries to the United Nations Climate Change (UNFCCC). In the latter, Vietnam and Cambodia use the same forest definition—i.e., a tree cover of 10%, a minimum tree height of 5 m at maturity and a minimum area of 0.5 ha. Laos employs a tree cover value of 20%, a 10 cm stand diameter at breast height, and a minimum area of 0.5 ha. Rubber, oil palm, eucalyptus, acacia, and teak plantations, amongst others, which are included under the above criteria, are also considered to be forests, as they are in this study.

2.3. Data

2.3.1. Sentinel-1 Data

Over the three countries of interest in this study, Sentinel-1a and -1b images were both acquired at a repeat cycle of 12 days and in interferometric wide swath (IW) mode, defined by the European Space Agency (ESA) as the predefined mode over land. In IW mode, images were provided at a resolution of 5 m in azimuth and 20 m in range, with a pixel size of 10 m after processing. The incidence angle ranged approximately from 29° to 41° over the 250 km-wide swath. In this study, we used Level-1 ground range-detected (GRD) products that consisted of multi-looked focused SAR data projected to ground range using an Earth ellipsoid model. A total of 37 and 34 frames of Sentinel-1 data in ascending and descending geometry, respectively, were processed every 12 days to cover the whole study area.

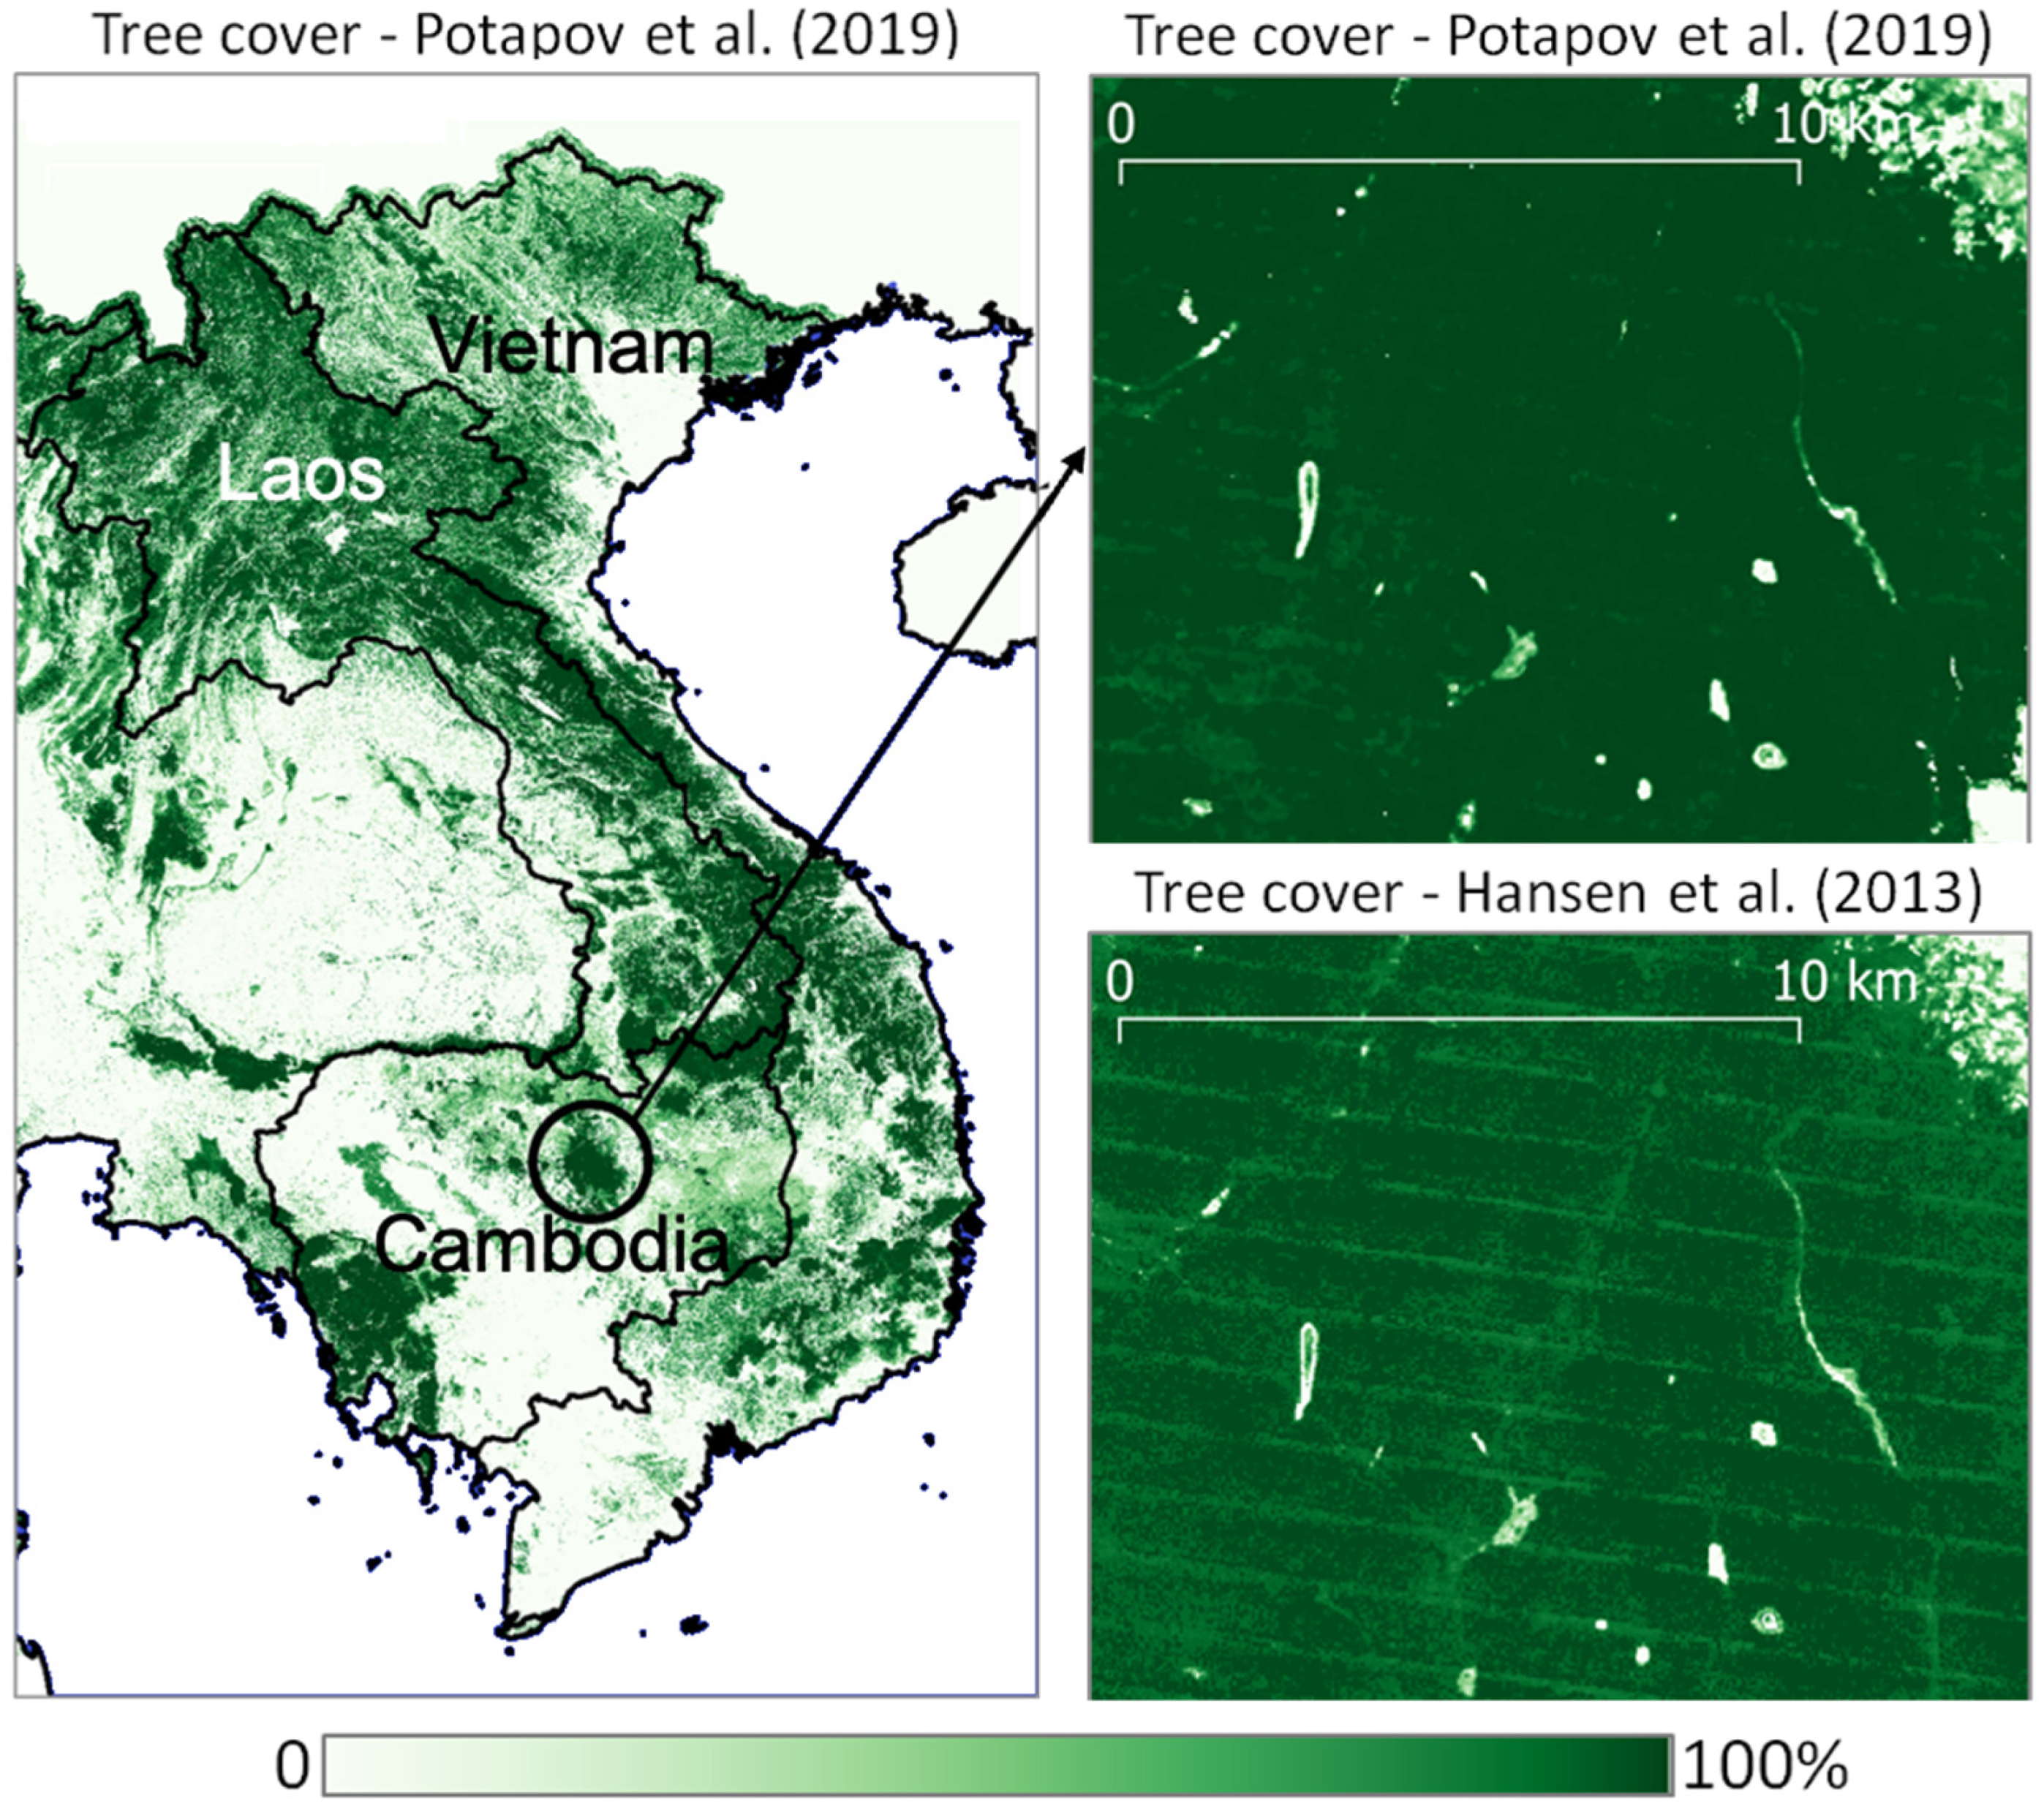
2.3.2. Forest/Non-Forest Map
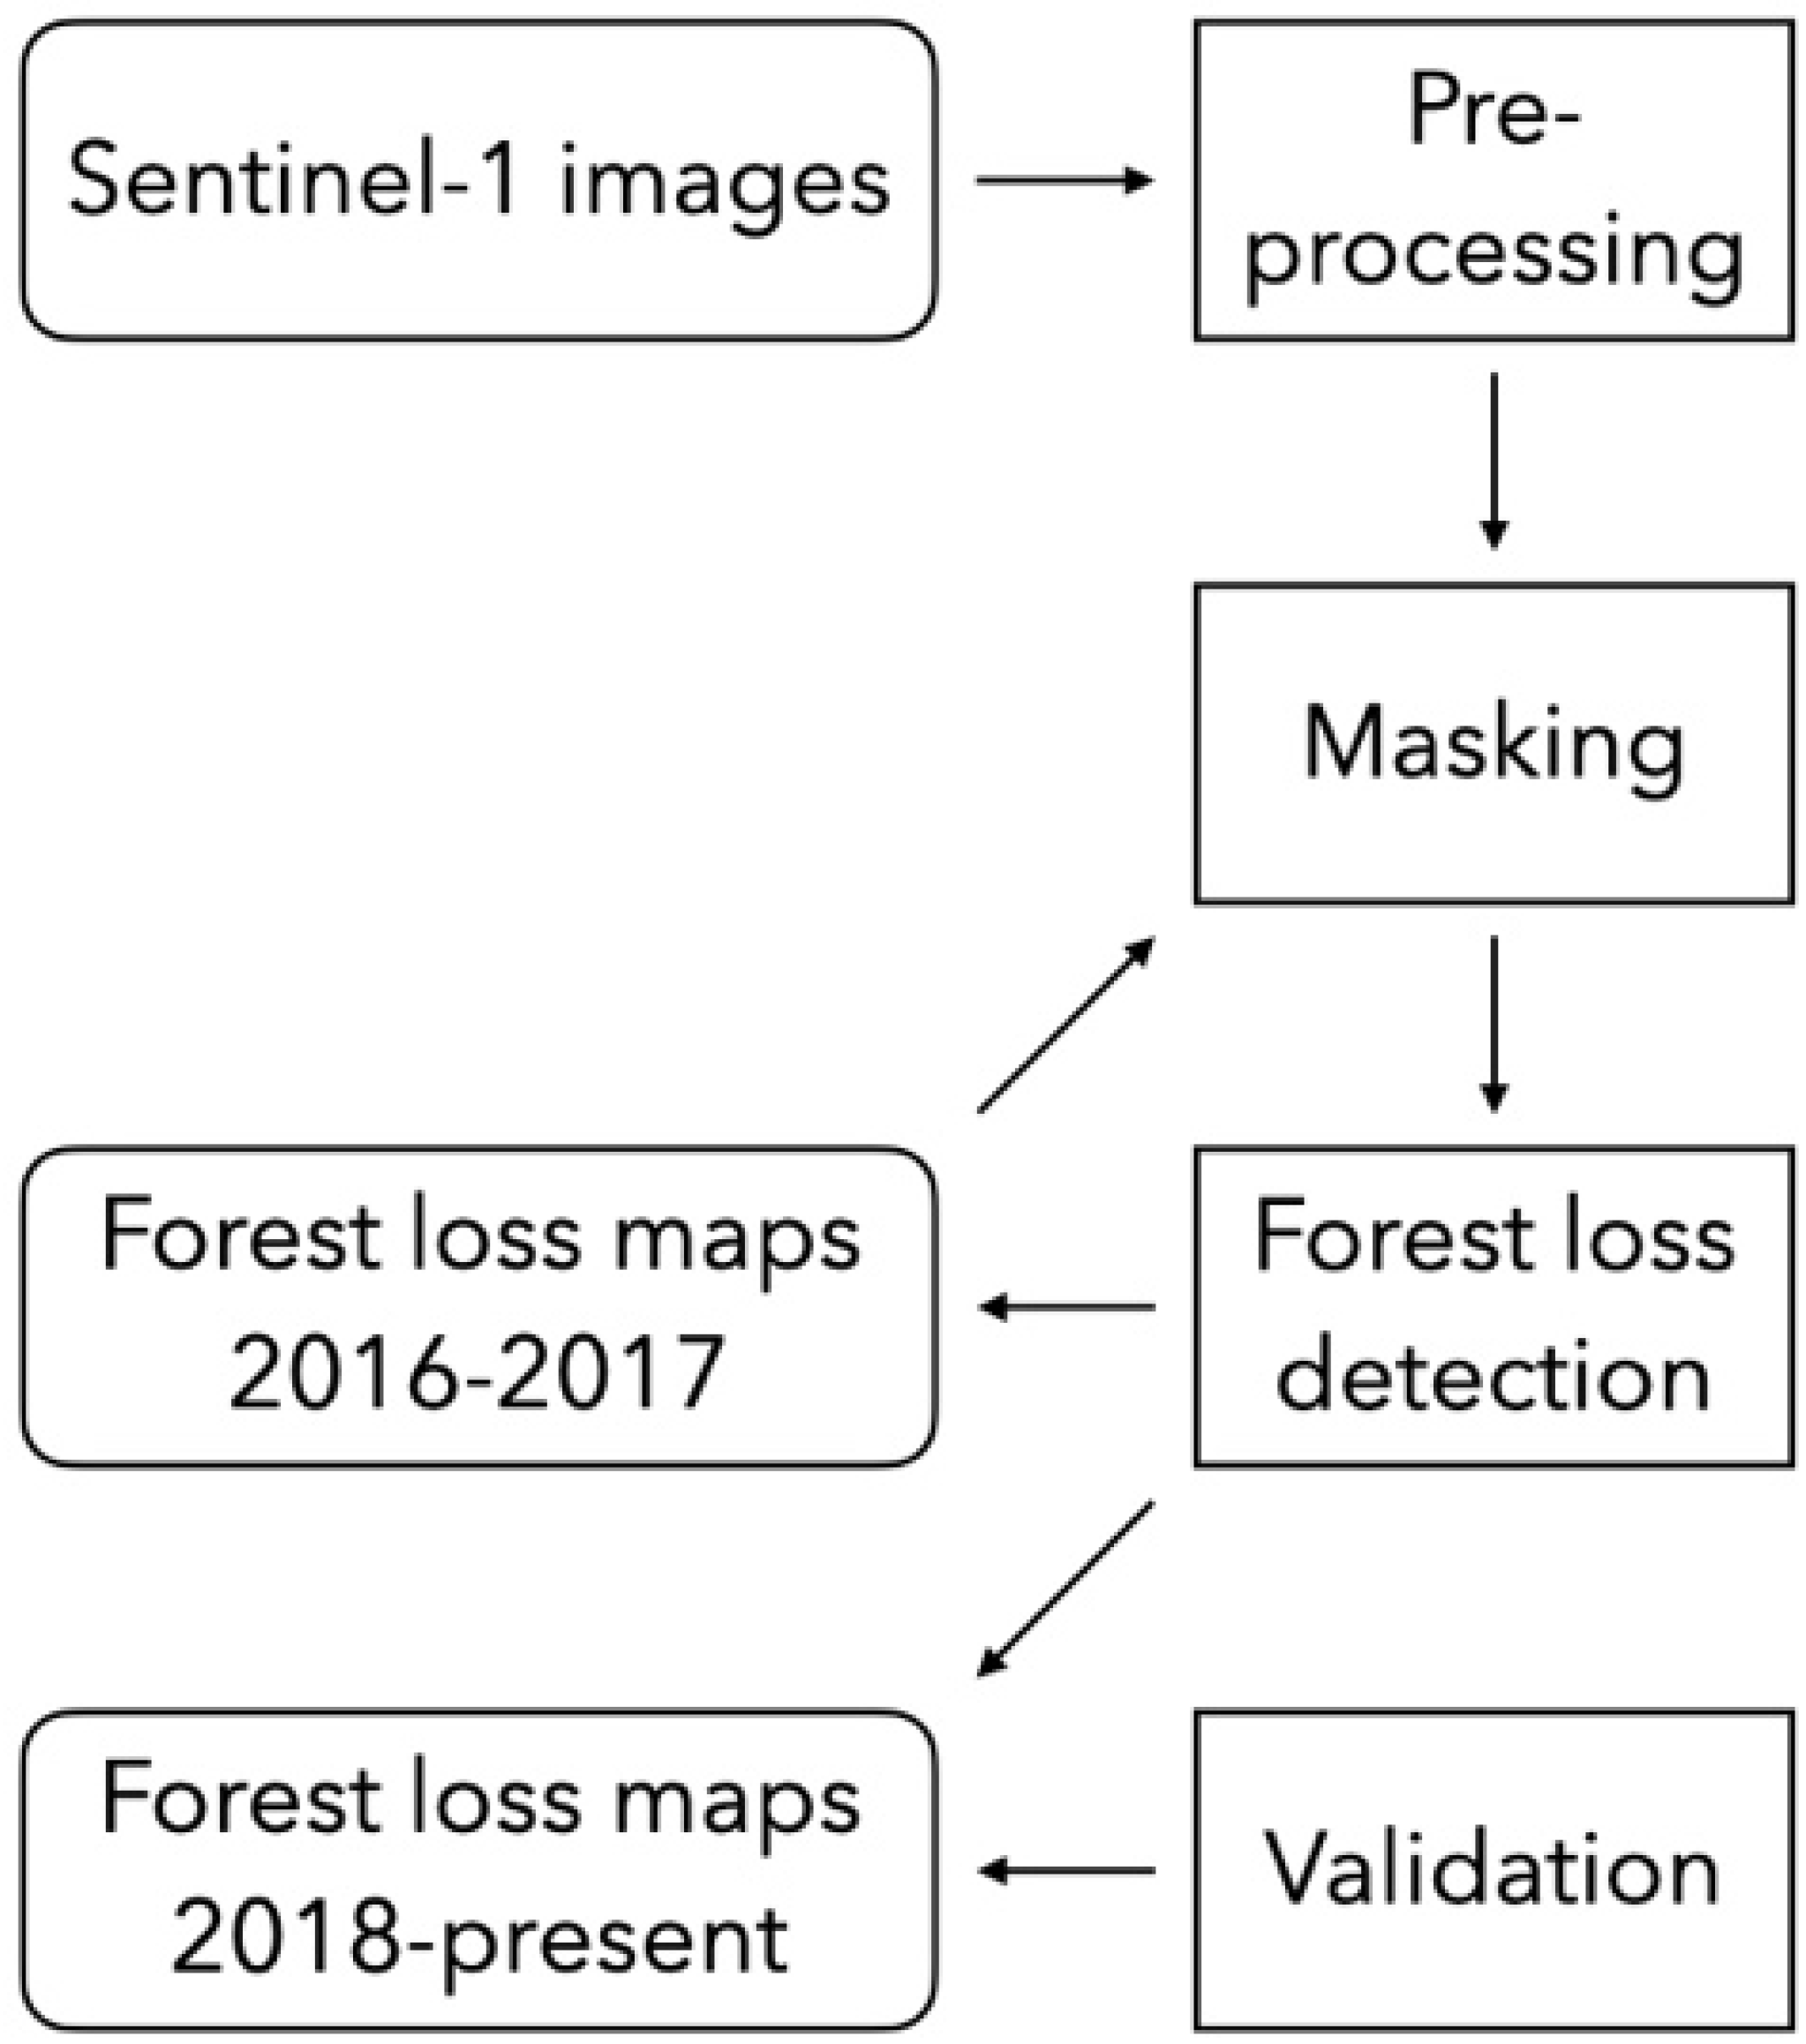
Forest/non-forest maps are crucial for detecting changes in forests and for removing false alarms due to changes in non-forest areas (e.g., due to soil moisture variations or to changes in other land use-land cover classes). The quality of the initial forest/non-forest map has a huge impact on the quality of the resulting forest loss maps. We compared various tree canopy cover maps and finally selected the annual tree canopy cover map that was produced in a joint project conducted by the GLAD laboratory from UMD and SERVIR-Mekong. The method used to derive the tree canopy cover map is extensively described in [20]. The obtained tree canopy cover (shown in Figure 1) is defined as the proportion of canopy cover from woody vegetation taller than 5 m at a 30 m pixel size from 2010 until now. Note that the natural tree cover and tree plantations and agroforestry were not distinguished. Figure 1 illustrates the gain in the quality of the regional tree map from [20] compared to the global one from [21] hosted on the GFW platform. In this example, the map from Hansen is particularly affected by the failure of the Landsat-7 Scan Line Corrector in the Enhanced Thematic Mapper Plus (ETM+) instrument.

2.4. Method

The overall method is summarized in the flowchart in Figure 2 and includes pre-processing, masking, the detection of forest loss areas for the years 2016 and 2017 (used to improve the quality of the forest/non-forest map), forest loss detection from 2018 using the improved forest/non-forest map, and the validation of the final maps.

2.4.1. Pre-Processing

A pre-processing chain was developed at CESBIO [22] to efficiently process the large quantity of available Sentinel-1 data. This chain is an operational tool for Sentinel-1 GRD data processing and tiling as per the 110 × 110 km2 Military Grid Reference System (MGRS). The chain is highly scalable (multithreading and multiprocessor) and autonomous. It is based on open-source libraries and can be used freely [23]. The processing steps include downloading it from the Sentinel Product Exploitation Platform (PEPS) repository, a mirror of the ESA’s Scihub handled by the French Spatial Agency (CNES) that provides access to Sentinel satellite data (https://www.peps.cnes.fr, accessed on 2 July 2021). Then, calibration in the gamma naught of the multi-polarized images was performed using the CNES Orfeo ToolBox (OTB) utilities (https://www.orfeo-toolbox.org, accessed on 2 July 2021) to obtain the SAR backscatter coefficient. The obtained images were orthorectified at a 10 m pixel size using digital elevation models (DEM) from the Shuttle Radar Topographic Mission (SRTM), cut into tiles using the MGRS grid, normalized using incidence and local incidence angles to reduce the effects of terrain slope, and finally filtered using prior images (i.e., each new acquired image was filtered using previously acquired images instead of filtering the whole stack of images) [24,25,26]. To do so, we used the multi-image filter developed by [24,27], which allowed us to obtain new images with reduced speckle effects from multi-temporal and multi-polarized images while preserving the spatial resolution in the image. The resulting processed images were used as inputs for the forest loss detection method (see Section 2.4.3).

2.4.2. Masking

We masked out areas that may have been falsely detected as forest loss areas. We first masked out water areas using the Global Surface Water dataset [28], because regular flooding or wind over water areas (such as lakes) can cause significant variations in the Sentinel-1 backscatter. Likewise, mangroves were masked out using the Global Mangrove Watch product [29] because of the double bounce that may occur with tidal changes. We also used SRTM DEM to discard shadow detections over slopes greater than 15°, as explained further in Section 2.4.3. Finally, the forest/non-forest map from [20] for the year 2015 was used to mask out non-forest areas, as detailed in Section 2.3.2.

2.4.3. Forest Loss Detection Method

We used the method developed by CESBIO and CNES based on shadow detection, which provided excellent results over Peru [13], Gabon [14], and French Guiana [15]. This method is fully described in these papers.
Due to the purely geometrical nature of the shadowing effect that occurs at the edge of intact and disturbed forests, backscattering does not depend on soil moisture, remaining vegetation, or other factors affecting the SAR backscatter, and the sudden and strong decrease in backscattering due to forest loss persists over time. Therefore, the main advantage of this method is the ability to avoid false alarms, which would be worse if forest loss patches were detected without the prior detection of shadows. The indicator used was the RCR [16] at VH polarization. In a time series of N dates, the backscatter change in a given pixel at date ti with i ∈ (1, N), denoted by γ0i, which occurs between date ti and date ti+1, was measured using the following RCRi:
R C R i = m a , i m b , i
where mb,i is the mean backscatter value in Xb available images until date ti (inclusive) and ma,i is the mean backscatter value in the Xa images acquired after date ti+1 (inclusive):
m b , i = 1 X b j = i X b + 1 i γ j 0
Additionally,
m a , i = 1 X a j = i + 1 i + X a γ j 0
RCR is computed at each date by dividing the mean of three images acquired after date ti+1 (Xa = 3) and a higher number of images acquired before date ti (10 dates in this study—i.e., Xb = 10), which allows for the filtering of environmental effects (such as seasonal effects) and speckle. Then, the date corresponding to the lowest RCR value is considered as our estimate of the detected forest loss date if the lowest RCR value is smaller than a given threshold.
The forest loss detection system is composed of two main steps, both based on the use of the RCR indicator:
  • The detection of shadows that appear at the boundary between forest and forest loss areas in a series of images;
  • The detection of the deforested patches associated with the shadows (which we call “reconstructed patches”).
The thresholds in [13] were found to be −4.5 db for shadows and −3 db for reconstructed patches. Before detecting forest loss, we investigated the need to adapt the methodology already used in [13,14,15]—in particular:
  • The values of the two thresholds applied to the RCR used to detect shadows and reconstructed patches;
  • The polarization to be used.
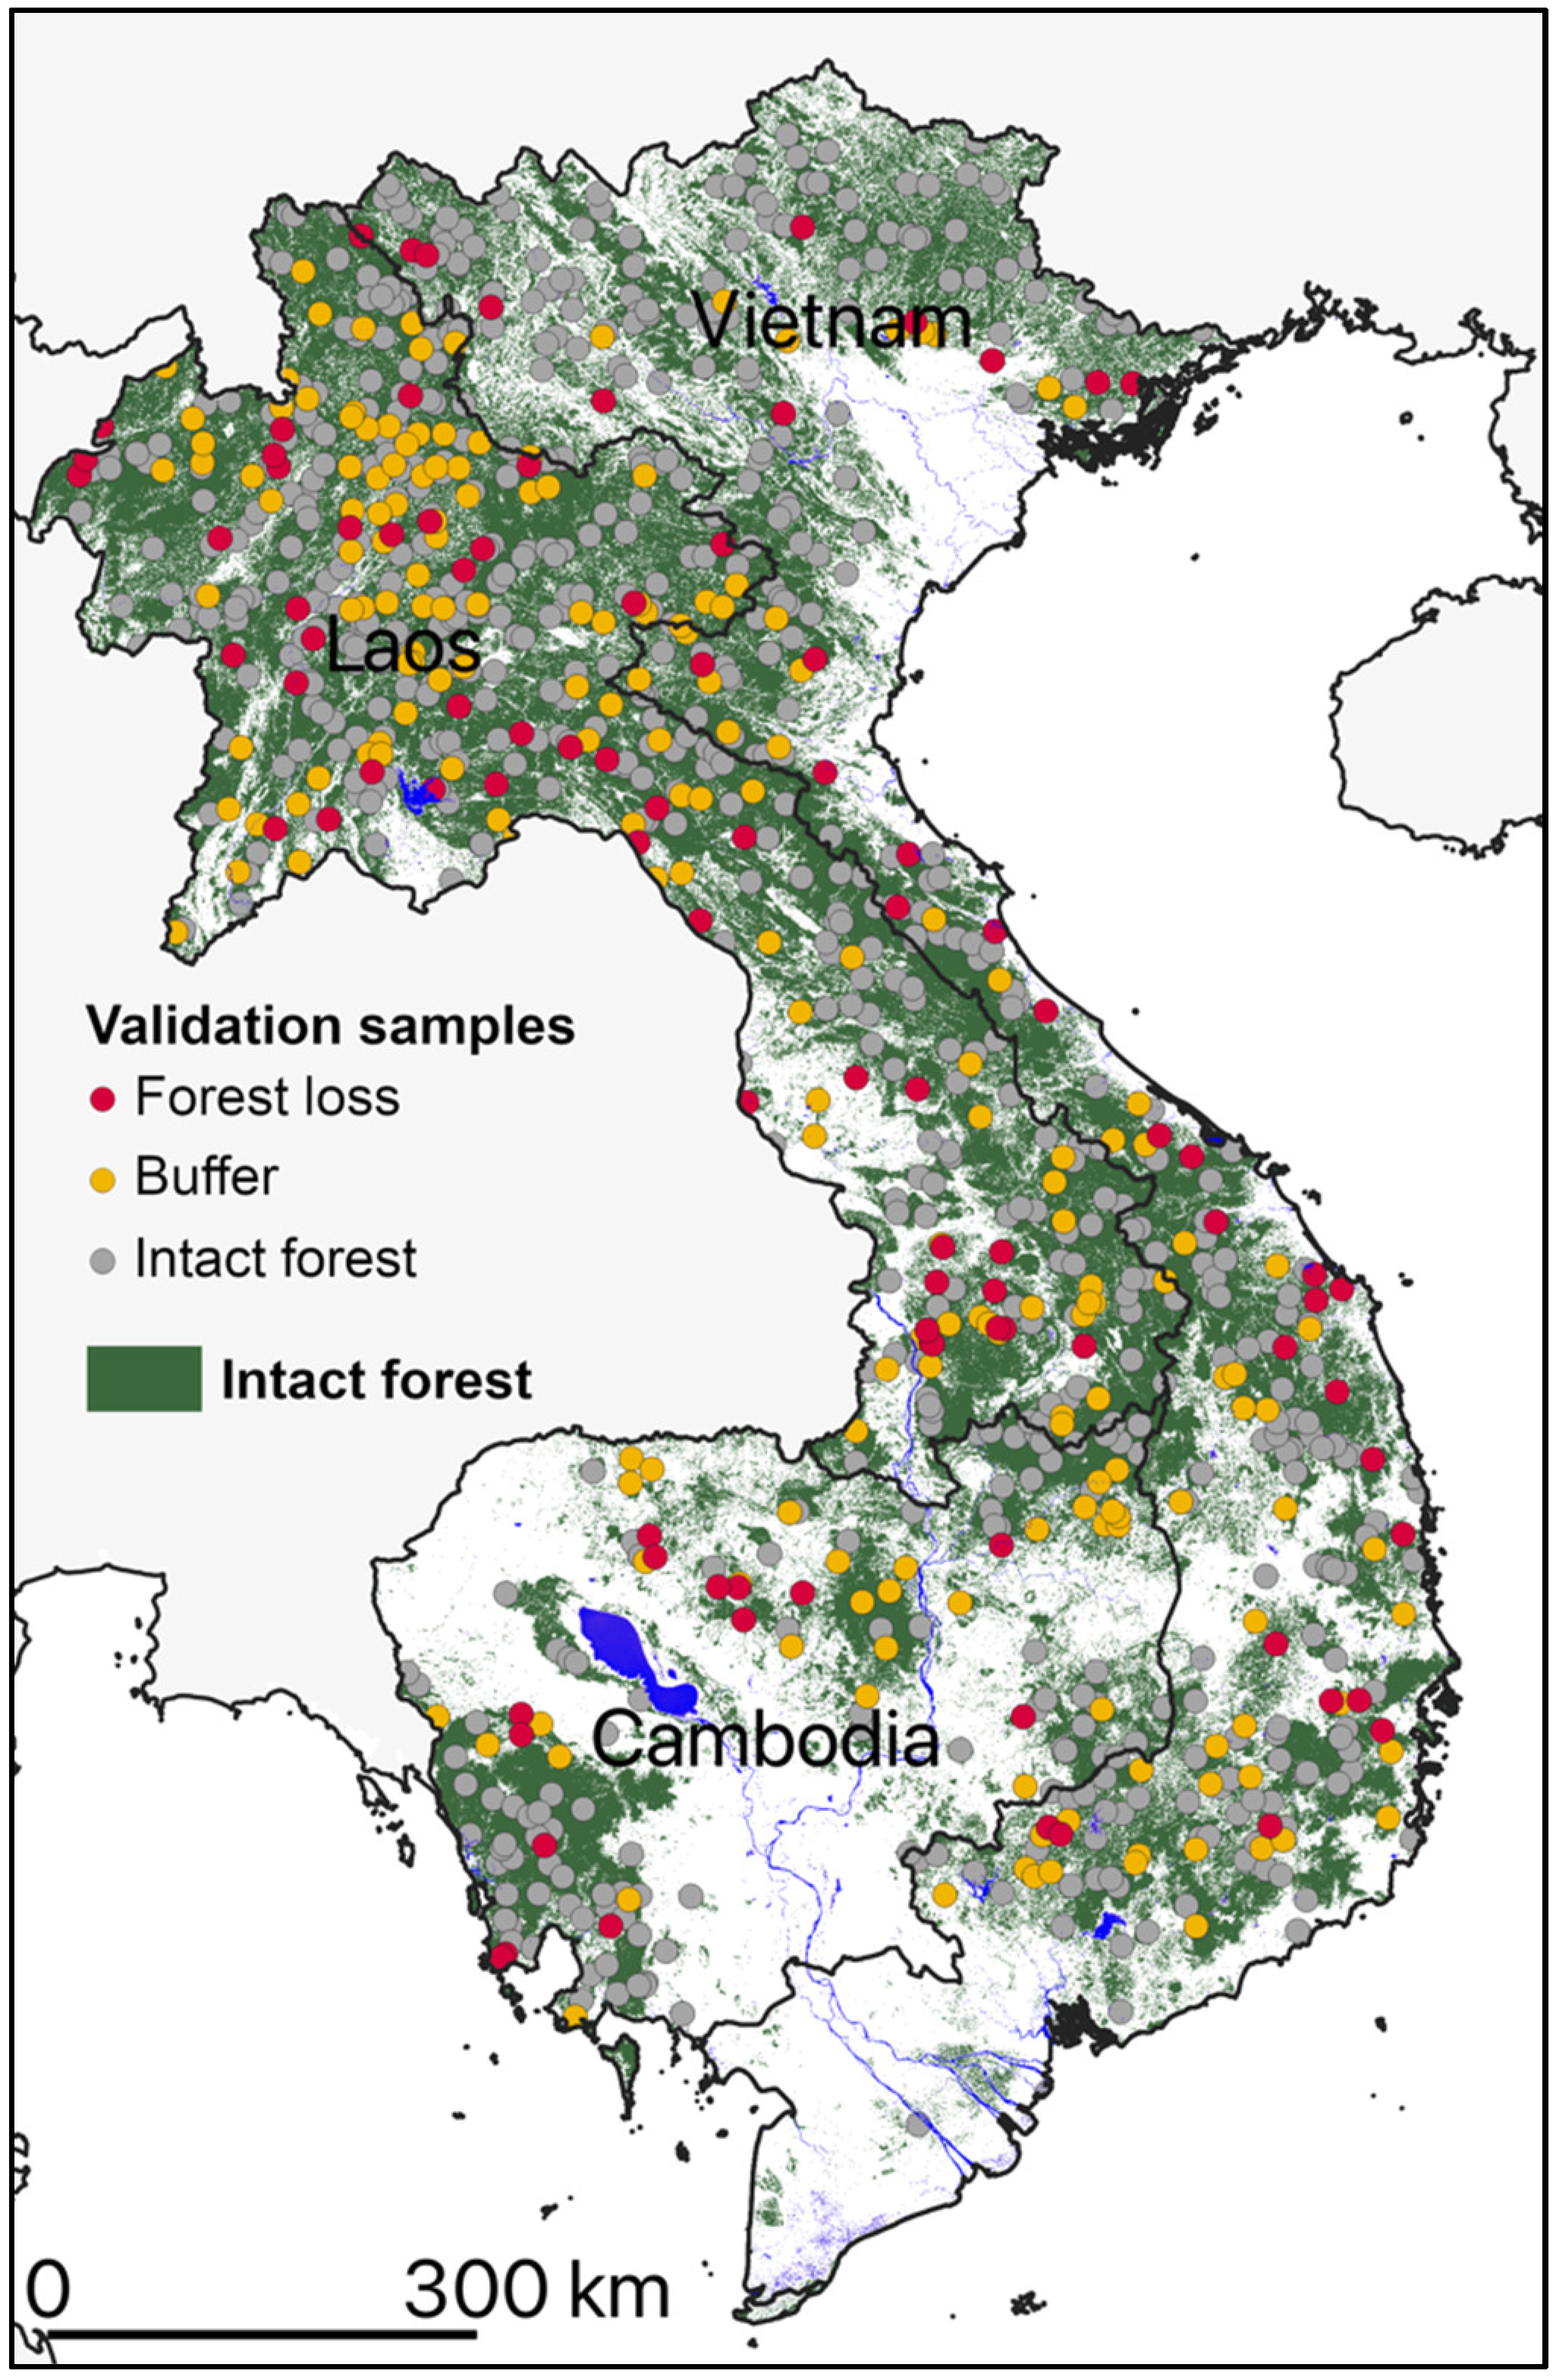
To do so, we quantified the separability of forest loss areas and intact forest areas in order to calibrate threshold values applied on minimum RCR at VH and VV polarizations. A total of 539 reference data plots were selected manually over Vietnam, Laos, and Cambodia using Google Earth data. The plots were selected in natural forest areas and plantations, with sizes ranging from 0.1 to dozens of ha, and over flat and steep terrain and various different landscapes. We selected 457 plots of forest loss (with a mean size of 4.3 ha and a total surface area of 1971 ha) and 82 plots of intact forest (mean size of 381.2 ha and a total surface area of 31,260 ha). We then analyzed the probability density functions (PDF) and cumulative PDF of the minimum RCR over the reference plots of forest loss and intact forest areas. It was apparent that the thresholds applied on the minimum RCR values to accurately detect forest loss were remarkably stable over the study sites covered in this study and in [13,14,15]—i.e., systematically lower than −4 db whatever the polarization. However, the VH polarization provided slightly better separability between forest loss and intact forest areas than VV polarization, especially over steep slopes, whereas VH and VV exhibited similar results over Peru [13]. This is the reason why we used VH polarization in this study. Finally, the detection method was found to be generalizable to the three countries.
The processing of the whole study area was achieved using the CNES High Performance Computing (HPC) cluster. We mosaicked the maps first derived for the years 2016 and 2017. We used these detections for the improvement of the forest/non-forest map only (i.e., these detections were not distributed to any end-user) in order to ensure higher-quality detections for the year 2018 to the present. Indeed, the forest/non-forest map used in this study, despite performing better than any other mask to the best of our knowledge, had its flaws and uncertainties. It is likely that non-forest areas that are considered to be forest areas in the forest/non-forest map would be detected as forest loss areas due to the strong variations in backscatter over the non-forest areas. These detections (including true and false detections) were used to update the 2017 forest/non-forest map from [20]. We again applied the forest loss detection method using the updated 2017 forest/non-forest map and Sentinel-1 images acquired from 2018.
We mosaicked the resulting maps, checked their quality, and manually corrected outliers. Outliers were found to be rarer in our maps than in the 2016–2017 forest loss maps, as the forest loss detection method was not applied over areas with potential false alarms—i.e., with backscattering that varied in time (such as water areas, bare soils, mangroves, and non-forest areas in general).

2.4.4. Validation

We selected as our sampling design a stratification with strata defined by the map classes, mainly to improve the precision of the accuracy and area estimates. We selected a buffer stratum in addition to an intact forest stratum and a forest loss stratum, as recommended by [18]. We specified a target standard error of 0.01 for the overall accuracy and supposed that the user accuracies of the change class were 0.70 for forest disturbances and 0.90 for intact forest. The resulting sample size was therefore 803 in total, which we rounded up to 1000 samples. We then assessed the allocation of the sample to strata so that the sample size allocation resulted in precise estimates of accuracy and area. We followed Olofsson’s recommendations and allocated a sample size of 100 for the forest disturbance stratum, then allocated the remainder of the samples to the intact forest classes—i.e., 200 in the buffer areas around detected disturbances and 700 in intact forest outside of these buffers. Figure 3 shows the location of the 1000 samples in the study area.
Both high and very high spatial resolution (<10 m and <1 m, respectively) satellite data were viable candidates for the reference data. We used, when possible, freely accessible very high spatial resolution imagery online through Google Earth™ [30], which offers low-cost interpretation options. When Google Earth images were not available at the relevant dates, we instead accessed Planet’s very high-resolution analysis-ready mosaics as reference data. Through Norway’s International Climate and Forests Initiative, these pan-tropical 4.8 m-resolution mosaics were recently released to help reduce the loss of tropical forests, among other things.

3. Results and Discussion

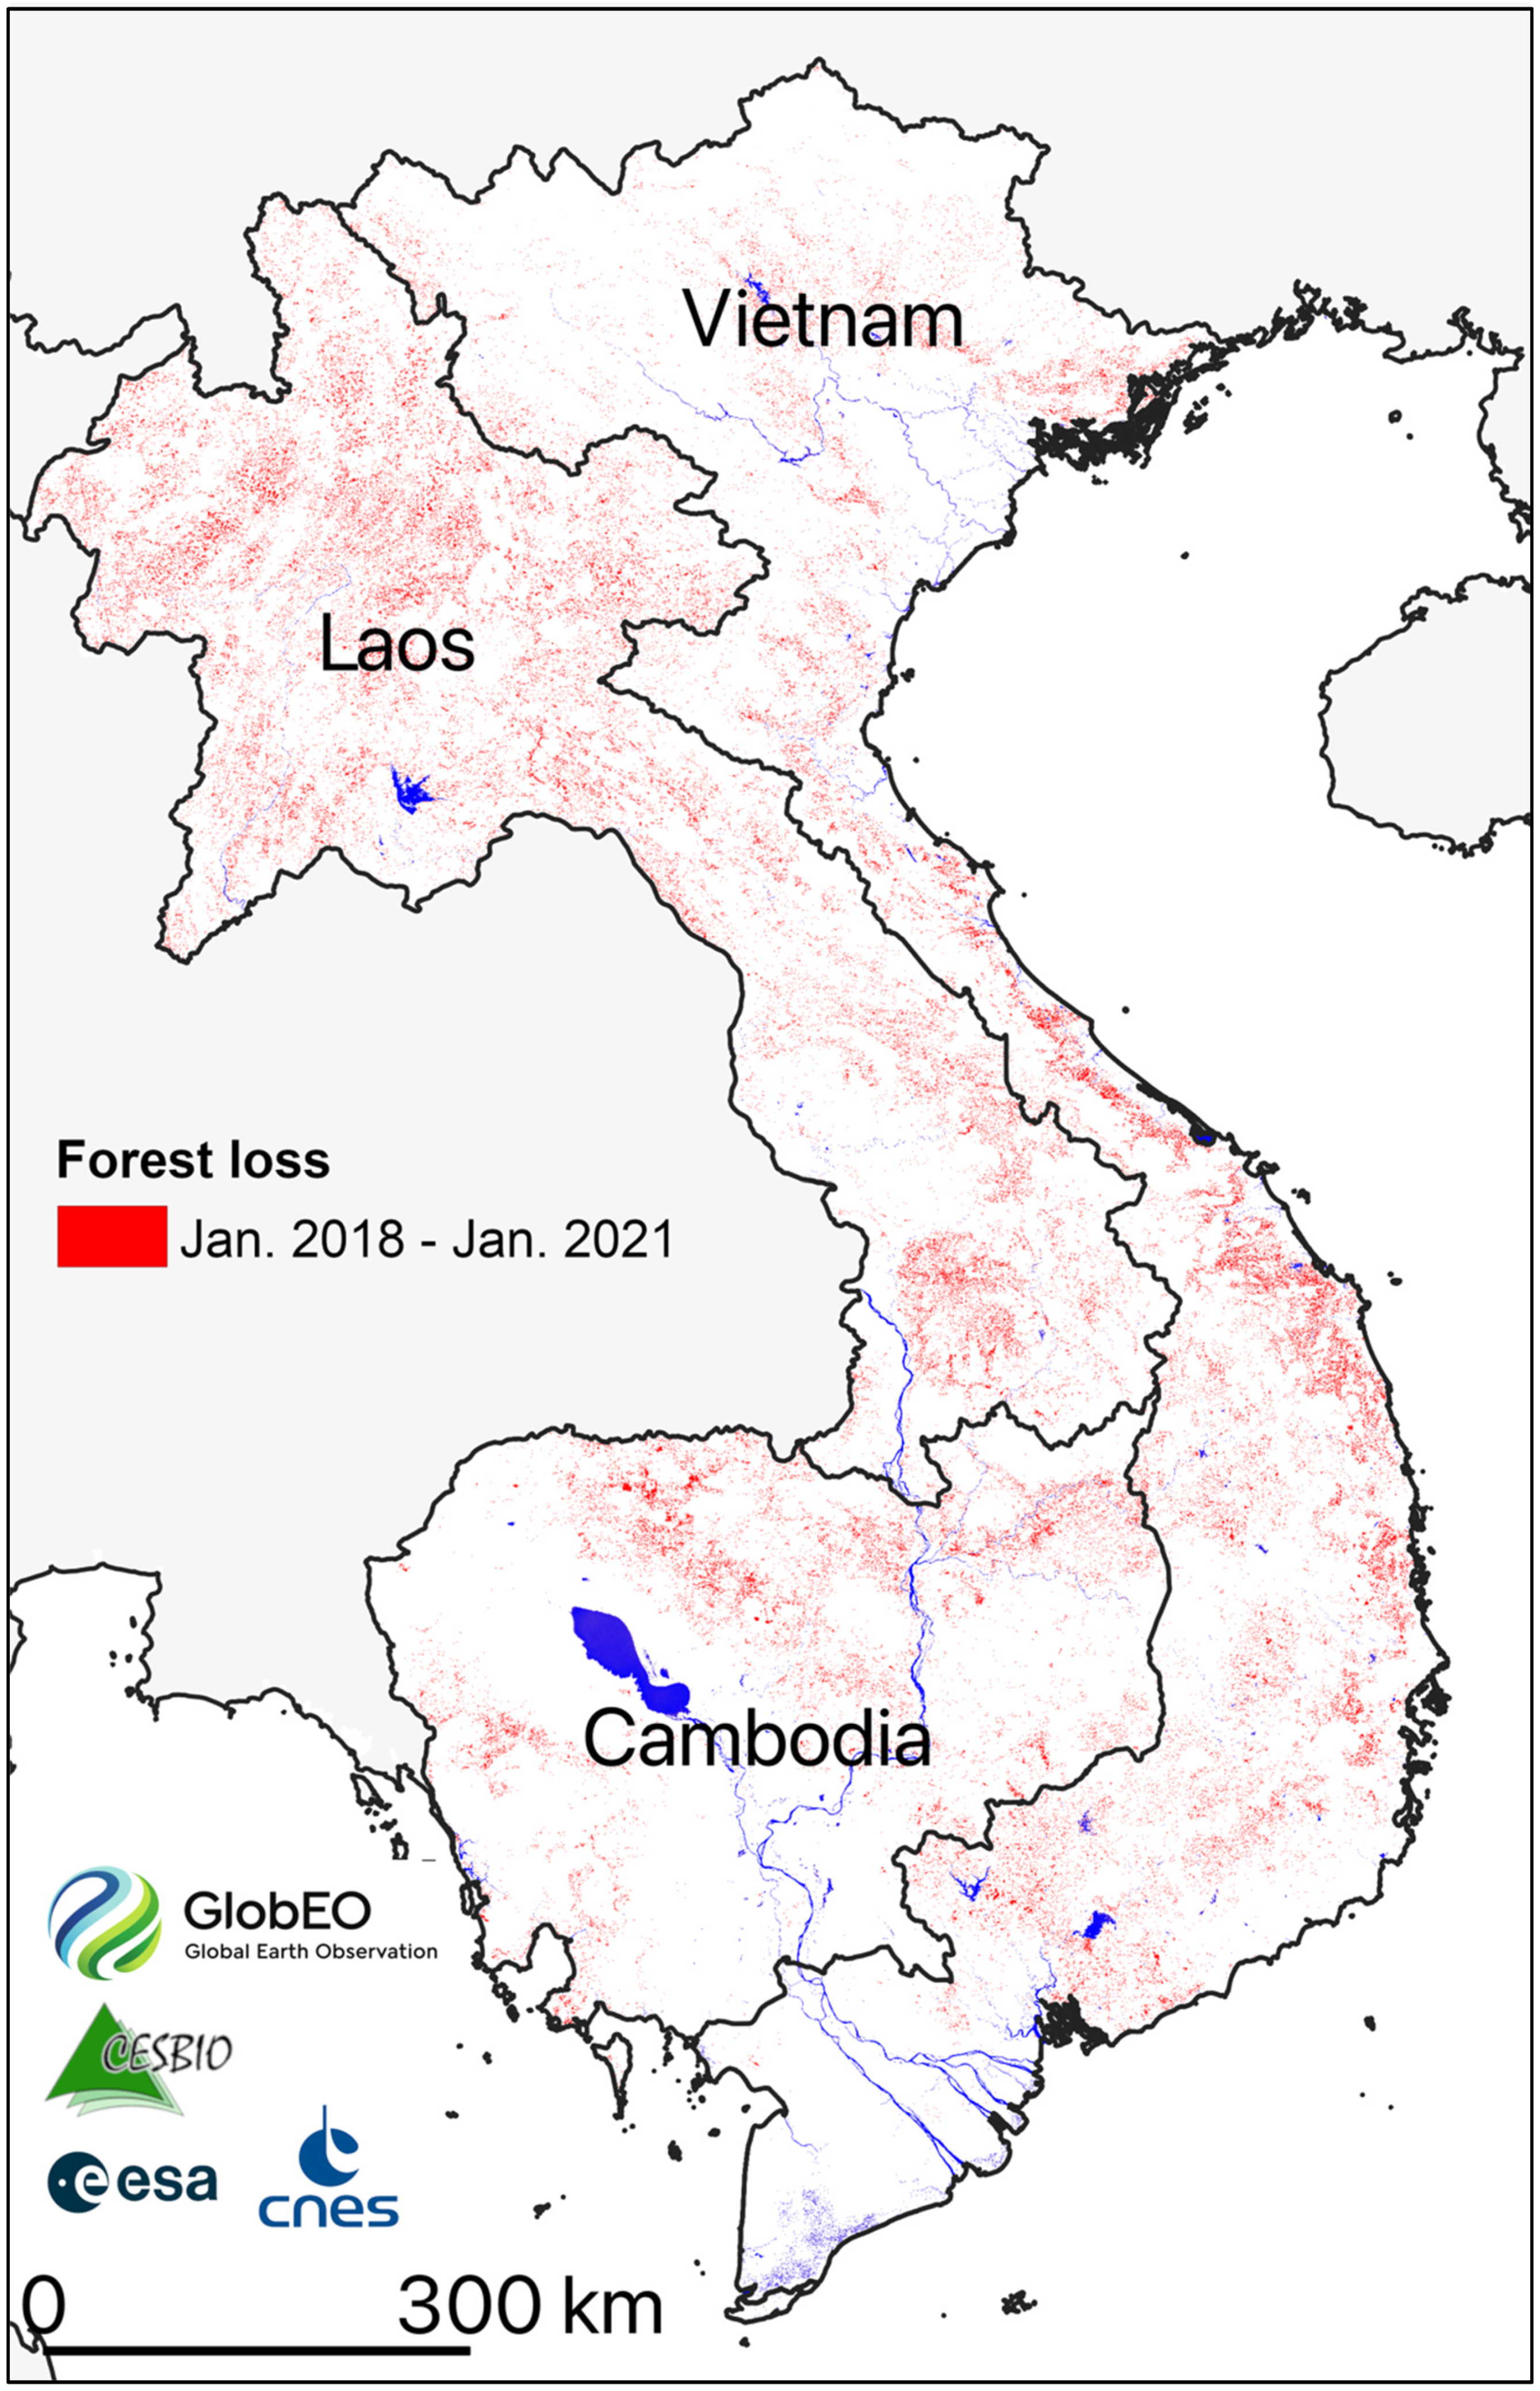
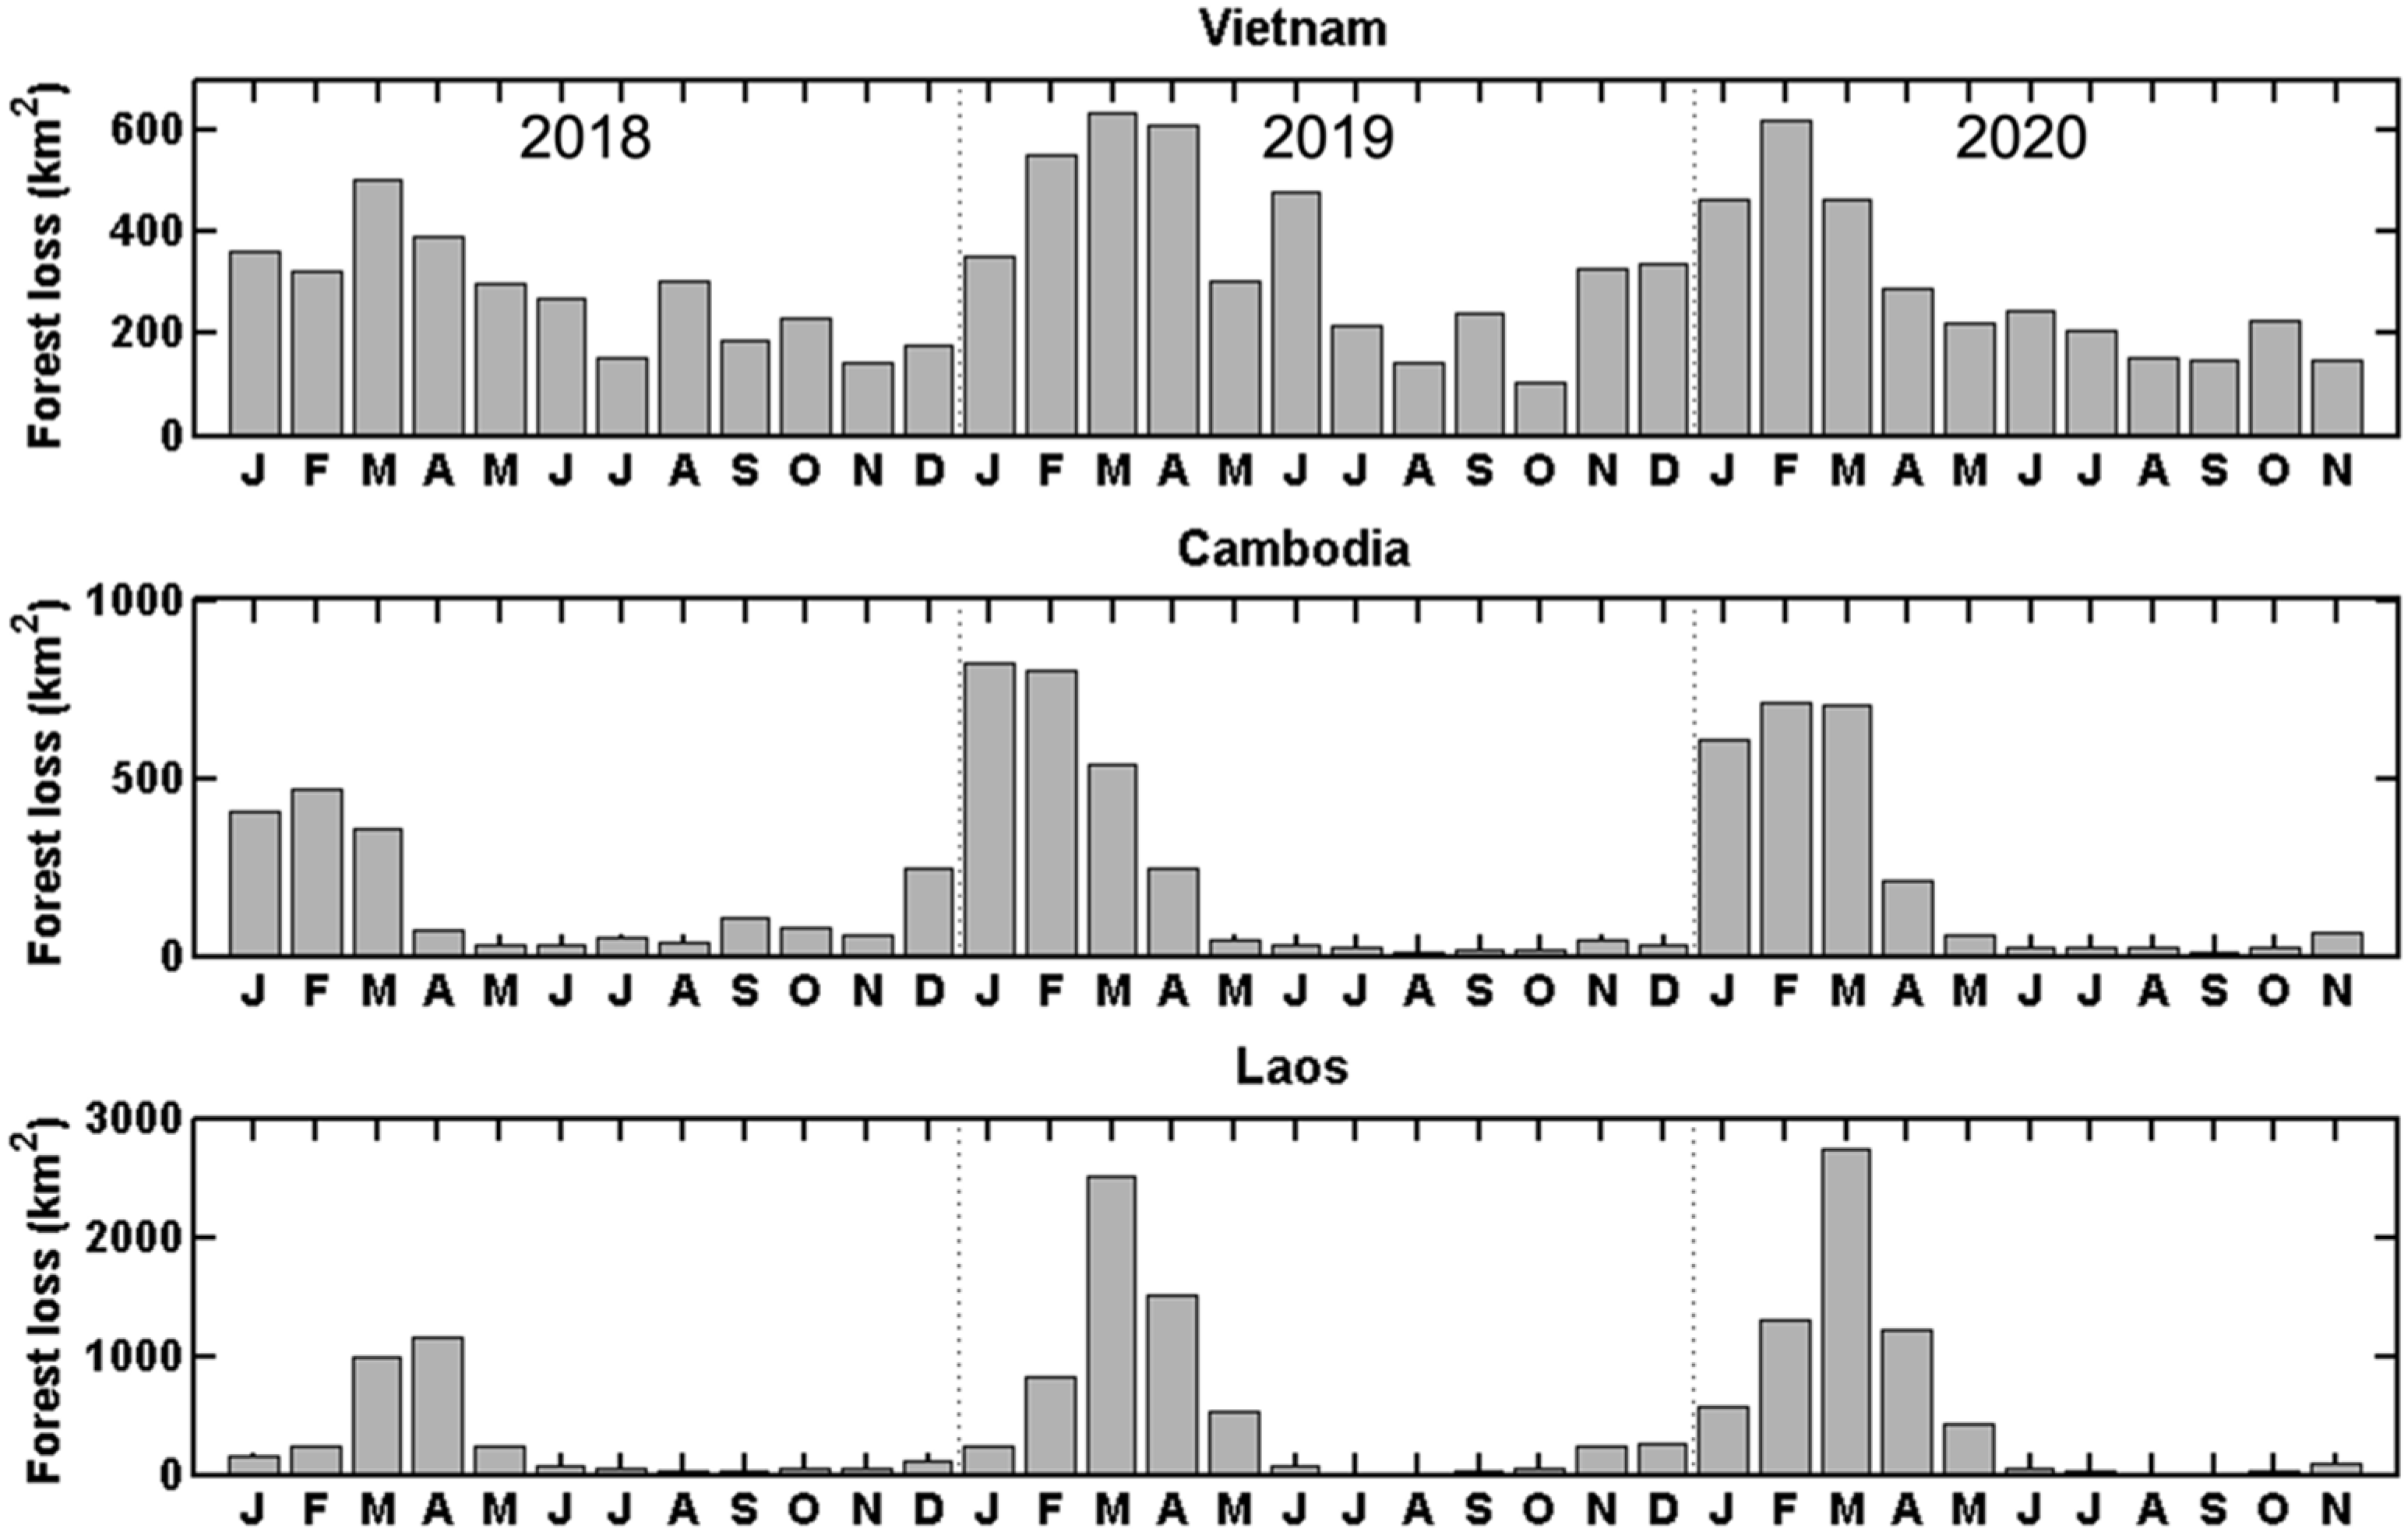
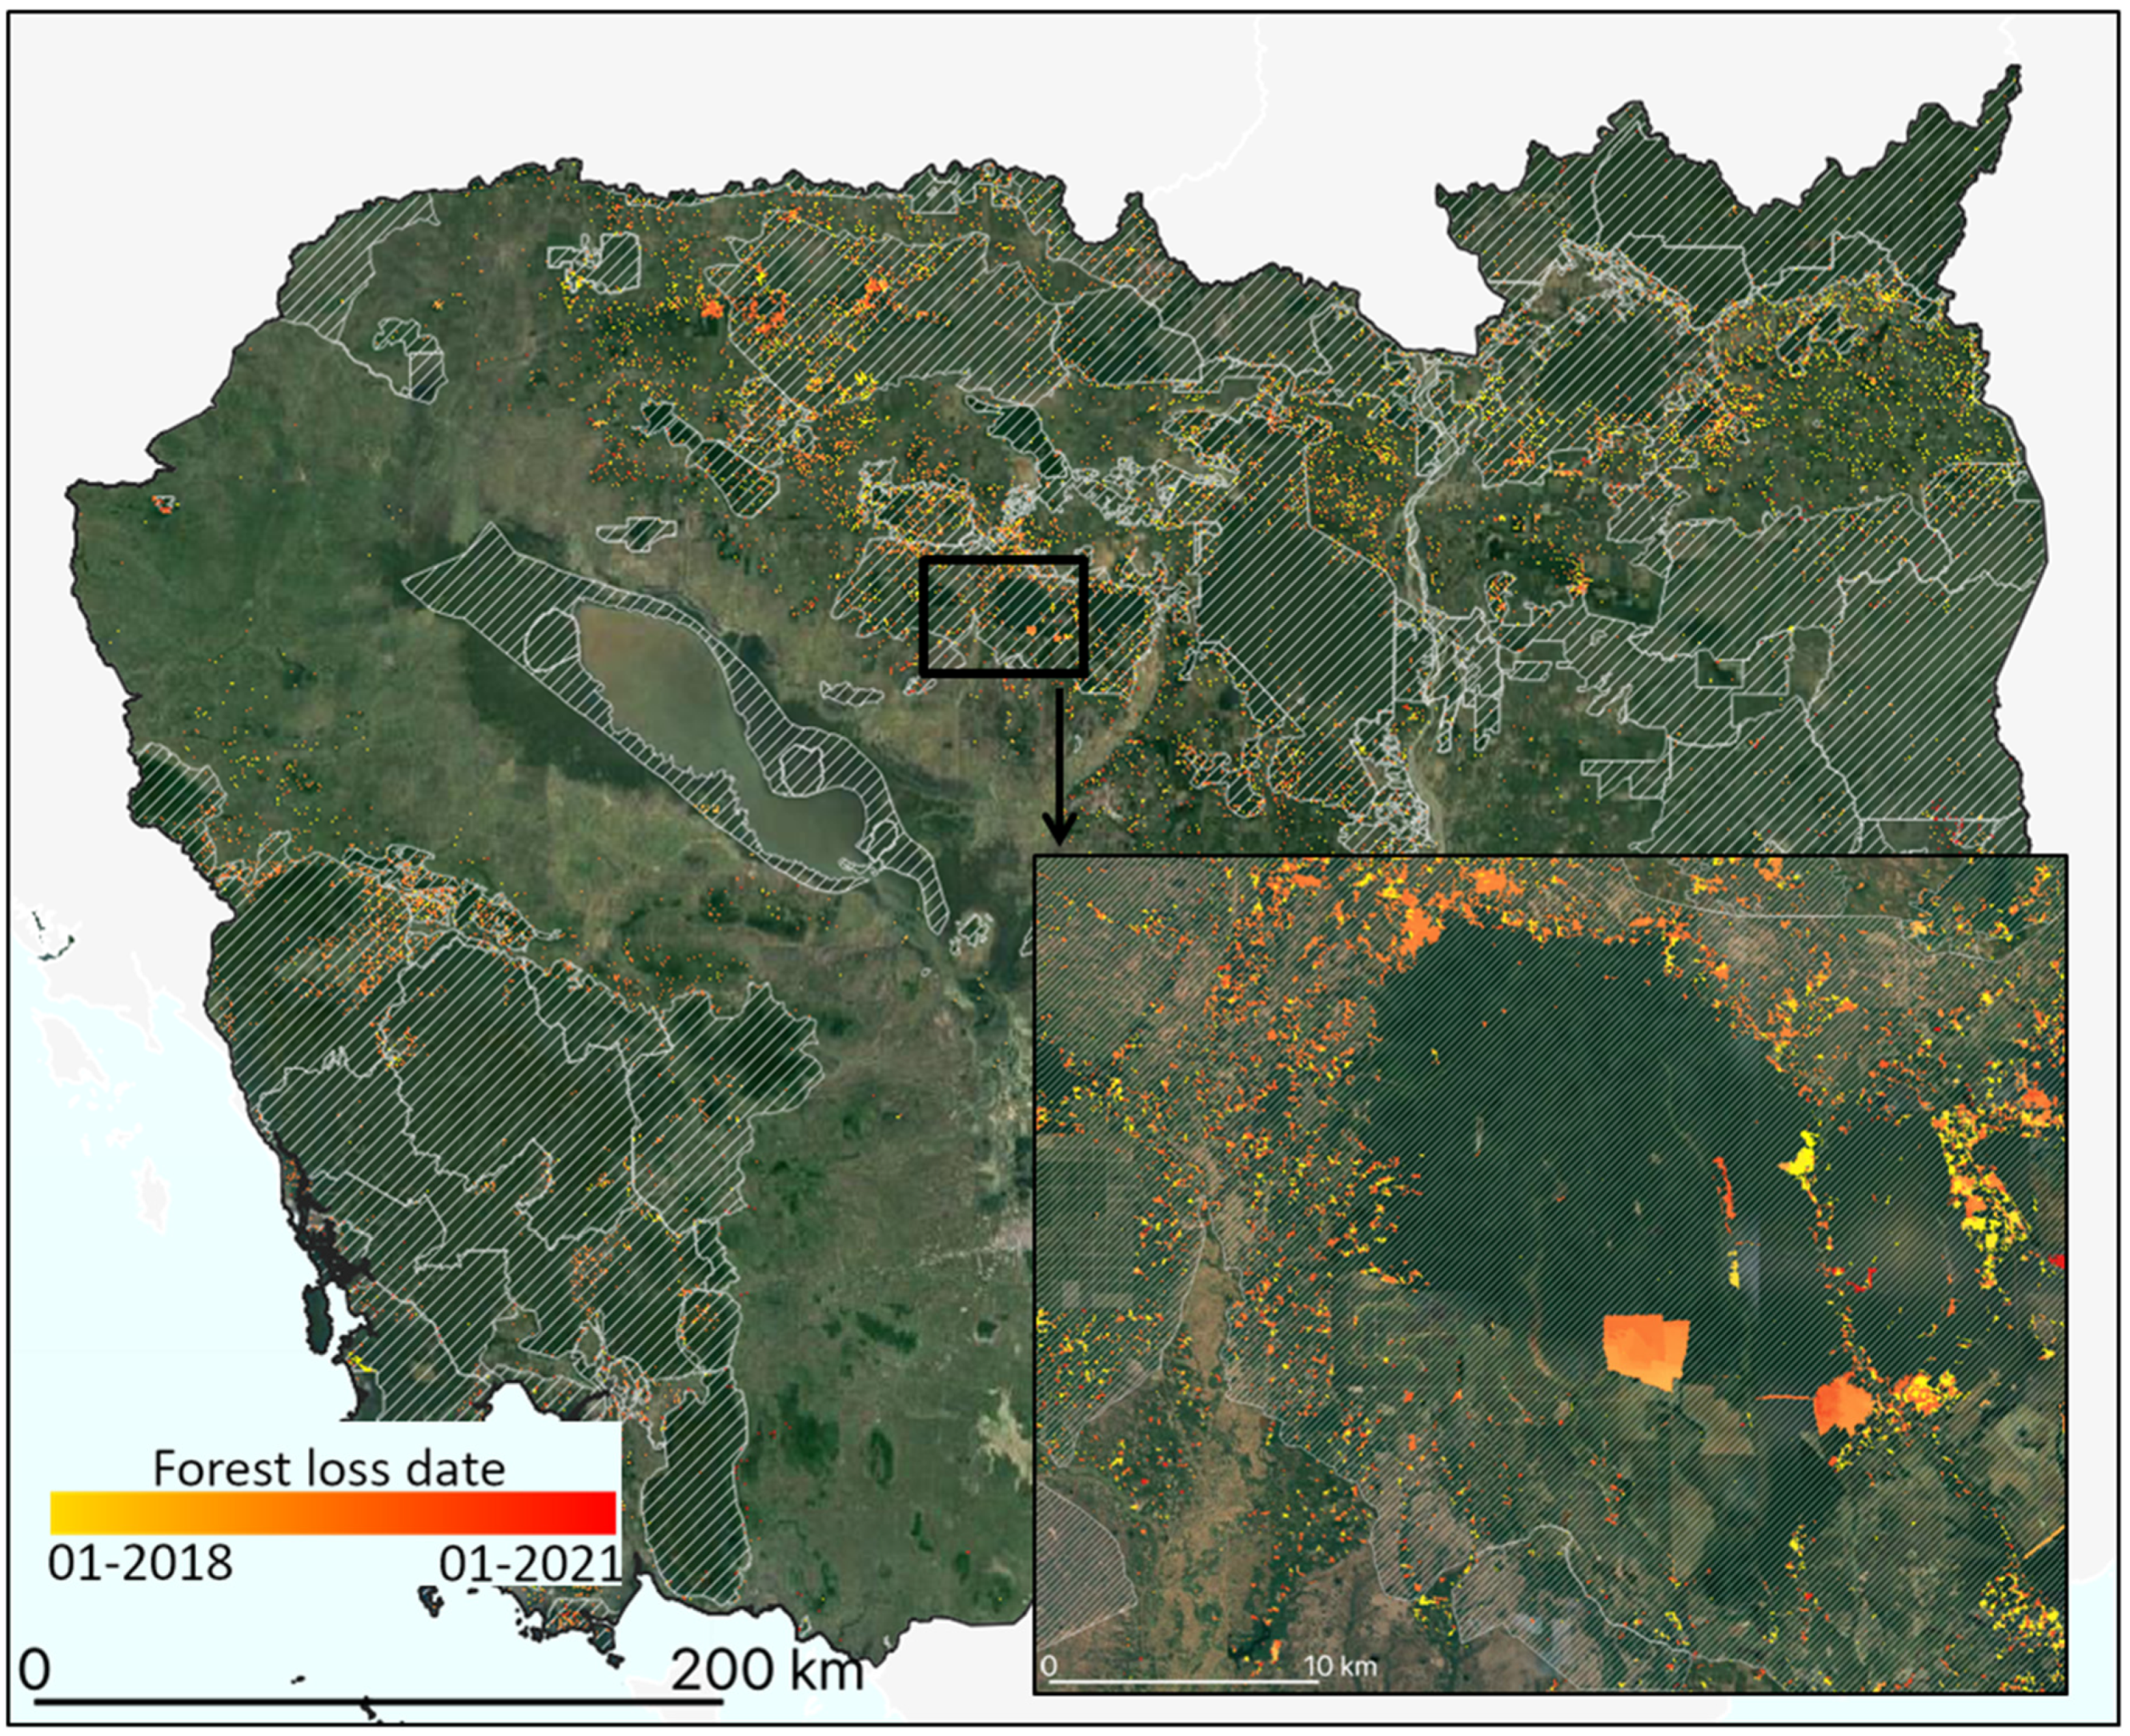
3.1. Forest Loss Map

The final forest loss map over Vietnam, Laos, and Cambodia from 2018 to 2021 is shown in Figure 4. The map provides clear hints of the spatial and temporal distribution of forest losses. For example, the map highlights the fact that forest losses are prevalent in the three countries and occur everywhere. The map demonstrates the striking difference between the low forest loss rates in Vietnam (northern Vietnam was severely affected in the last few decades and its more efforts are being made to preserve its forests now) and the high forest losses currently happening in northern Laos, which is explained as follows. The impacts of the transboundary displacement of forest disturbances from Vietnam to Laos and Cambodia are important and have sped up over the past decade [31]. The risks of transboundary displacement are increasing with globalization and the growth of commercial exchange. Reduced Emissions from Deforestation and Forest Degradation (REDD+) initiative aims to conserve forest carbon stocks primarily through national policies and interventions. However, the dominant drivers of forest loss are becoming increasingly global in scope. The fragmentary adoption of REDD+ across forest nations has left room for the move of forest loss from early adopters to late adopters of REDD+. Vietnam is an early adopter of REDD+ that has experienced substantial reforestation despite exponential growth in exports of commodities, sourced to a great extent from Laos and Cambodia. For example, firms in Vietnam have leased large land areas for plantations in Laos and Cambodia, with important implications for local communities and the environment [31].
Specific areas of the whole forest loss map are shown in Figure 5. Figure 5 shows the forest loss in various environments and forest types and due to various drivers from the north to south of the study area. Northern Laos recently experienced the largest deforestation rates as compared with the rest of Laos, Cambodia, and Vietnam. Forest was cut mostly for commodities in northwestern Laos, as seen in Figure 5(1) (meaning Subfigure 1 in Figure 5). The shape of the loss areas is not uniform, and their size is large. In the region located from 101.3°E to 101.5°E and from 20.2°N to 20.4°N, we detected 963 forest loss areas with a mean size of 12 ha and a median size of 0.95 ha. Northern Laos is also experiencing a rubber boom, in particular in Namtha Province [32]. Figure 5(3) shows infrastructure construction at the border between north and central Laos, whereas Figure 5(5), in central Laos, shows cashew plantations [33]. In the latter, particularly in the region located from 105.5°E to 105.7°E and from 17°N to 17.2°N, we detected 2509 forest loss areas with a mean size of 1.92 ha and a median size of 0.73 ha. Compared to the plantations located in northern Laos, the cashew plantations in the center of Laos are much more numerous and far smaller.
Pulp tree, sugarcane, coffee, and rubber plantations can be found in southern Laos (Figure 5(7)) [33]. In this region, land concessions are mostly conceded to Vietnamese investors in rubber. Figure 5(8) shows an area where pulp trees have been planted en masse. We found mean and median sizes of forest loss areas of 6 ha and 0.69 ha, respectively, with a mix of large and small plots. These figures were computed over the 1936 forest loss areas detected in the region located from 108.4°E to 108.6°E and from 15.3°N to 15.5°N. Figure 5(8) shows the center of a huge area of plantations that extends roughly from 13°N to 18°N; the forest loss in this area corresponds mostly to plantation logging. Pulp trees are dominant in this area and spread until reaching northern Vietnam. This constitutes the largest amount of forest loss detected by our method in Vietnam, as forest loss was found to occur far less in northern Vietnam, and even less in the Mekong Delta.
Logging roads are visible in Figure 5(11), whereas large areas of timber and particularly rubber plantations can be seen in Figure 5(9) and Figure 5(11)–(13), as well as cashew plantations in Figure 5(10)–(13) [32]. Although southwestern Cambodia has been partially preserved thus far, as in the Cardamom mountains that constitute one of the last remaining natural forests in southeast Asia, Figure 5(10) shows that forest loss occurs in this region.
In Figure 5(13), the rubber plantations are mostly square with a size of 25 ha. From 106.6°E to 106.8°E and from 11.1°N to 11.3°N, we found 1746 forest loss areas with a mean size of 2.7 ha and a median size of 0.54 ha, which reflects the variety of very large and very small plots in this area. In the triangle formed by locations in Figure 5(7)–(9), Vietnam plantations are composed of old and new rubber as well as cashew, coffee, and pulp trees, whereas the Laos and Cambodia plantations are mostly 10-year-old rubber. Indeed, a large number of the rubber plantations in Cambodia were planted in the early 2010s, replacing natural forest. However, the following decrease in rubber prices, from 2012, encouraged farmers to diversify their plantings, which contributed strongly to reducing rubber expansion. For example, this led to a boom in banana plantations, which replaced rubber in northern Laos [33].
We assessed forest disturbances occurring in protected areas using the database from [34] (Figure 6). Vietnam has the largest number of protected areas, i.e., 209, but the smallest land area coverage (7.9%). We found that the proportion of forest disturbances occurring in protected areas in relation to the total amount of disturbances in Vietnam in 2018, 2019, and 2020 to be 8.6%, 10.2%, and 9.8%, respectively. Laos contains the smallest number of protected areas, with a total of 31 areas covering 18.7% of Laos. The estimated proportion of forest disturbances occurring in protected areas in Laos in 2018, 2019, and 2020 is 8.3%, 10.1%, and 11.6%, respectively. Cambodia has 69 protected areas covering a large proportion of the country—i.e., 40%. However, we estimated the proportion of forest disturbances occurring in protected areas in Cambodia in 2018, 2019, and 2020 to be 46%, 57.1%, and 52%, respectively. Approximately half of the forest disturbances in Cambodia occur in protected areas, emphasizing the lack of effectiveness of the protection and conservation of natural resources and biodiversity in protected areas.
The temporal distribution of detected forest loss over Vietnam, Cambodia, and Laos from 2018 to 2021 is shown in Figure 7. Forest loss is detected throughout the year, in particular in Vietnam, with an expected and systematic peak of losses occurring during the dry season between December and April in the three countries. Note that this finding may be exacerbated by the fact that soil moisture can lead to an underestimation of forest loss. Figure 7 also highlights a strong decrease in forest loss at the end of the 2020 dry season, particularly in April and in Vietnam, compared to 2018 and 2019. This may be because Vietnam decided to suspend cross-border activities with Cambodia and Laos in April 2020, thus preventing it from importing wood and thereby curbing forest loss. This hypothesis does not contradict the fact that forest loss may have intensified locally in some regions since the appearance of COVID-19 due to the lack of on-site inspection interventions.

3.2. Validation Results

The resulting confusion matrix of the sample counts is shown in Table 2. The confusion matrix populated by the estimated proportions of area used to report the accuracy results is shown in Table 3.
We estimated from the confusion matrix shown in Table 3 the user accuracy, producer accuracy, and overall accuracy. Variances for these accuracy measures were estimated using Equations (5)–(7) on the basis of [17]:
  • The estimated user accuracy (±95% confidence interval) is 0.950 ± 0.043 for forest disturbances and 0.993 ± 0.005 for intact forest (including buffer areas around disturbances).
  • The estimated producer accuracy is 0.898 ± 0.061 for forest disturbances and 0.997 ± 0.043 for intact forest.
  • The estimated overall accuracy is 0.991 ± 0.006.
By comparison, ref. [12] estimated the producer accuracy to be 0.83 for forest disturbances with the same validation methodology and MMU (using the same number of validation points, i.e., 1100, with a relatively higher number of validation points for the forest disturbance stratum at 500). We also estimated the area proportions from the confusion matrix shown in Table 3. In the confusion matrix, the row totals give the mapped area proportions Wi, while the column totals give the estimated area proportions according to the reference samples. Multiplying the estimated area proportions by the total mapped area gives the stratified area estimate of each class according to the reference samples. For instance, the estimated area of the 2018 and 2019 forest loss according to the reference data is A ^ d i s = p ^ . d i s × A t o t = 0.0616 × 380,351   km 2 = 23,437   km 2 . The mapped area of forest loss Am,1 of 22,222 km2 was thus underestimated by 1215 km2.
The final step is to estimate a confidence interval for the area of each class. From Equation (10) in [17], the standard error for the stratified estimator of proportion of area is S ( p ^ . d i s ) = 0.0029 , while the standard error for the estimated area of forest loss is S ( A ^ d i s ) = S ( p ^ . d i s ) × A t o t = 0.0029 × 380,351   km 2 = 1092   km 2 . The margin of error of the confidence interval is 1.96 × S ( A ^ d i s ) = 1.96 = 1.96 × 1092 = 2140 km2. We thus estimated the area of forest loss with a 95% confidence interval: 23,437 ± 2140 km2. All the equations and explanations used to estimate the confidence interval of the forest loss area can be found in [17].

3.3. Comparison with GFW and GLAD

We compared the forest loss surface areas obtained from our method with the results from GFW and GLAD. Although we do not consider the maps of GFW and GLAD as benchmark and although the use of Sentinel-1 is much more relevant in terms of the timely detection of forest, we quantitatively compared the statistics per year and country (Table 4). Note that the GLAD 2018 alerts were not available online.
As expected, the GLAD alerts allowed us to detect far fewer forest loss areas, with notable time delays (see [15] for a detailed analysis of this topic). The results from this study and from GFW are remarkably similar. When computing the average surface areas of forest loss over 2018, 2019, and 2020, for Vietnam, we obtained surfaces areas of 374,918 and 413,758 from this study and GFW, respectively (+10% for GFW); for Cambodia, we obtained surfaces areas of 248,061 and 216,022, respectively (−13% for GFW); and for Laos, we obtained surfaces areas of 541,760 and 458,806, respectively (−15% for GFW).
This result highlights the fact that our detection system can be used as an annual detection system similar to GFW, which is used for example to compute national statistics, in addition to being an alert system with a fast detection for Sentinel-1 data.

4. Conclusions

Substantial changes, including deforestation and forest degradation, occurred in the Greater Mekong subregion. Effective tools are thus urgently needed for monitoring illegal logging operations, which cause widespread trouble in this region. Forest disturbance detection systems have been developed prior to this study and are mainly based on optical satellite data. However, it has recently been demonstrated that forest losses can be accurately monitored using Sentinel-1 dense time series.
In this context, the primary objective of this study was to provide weekly forest loss maps over Vietnam, Cambodia, and Laos using Sentinel-1 data with the forest loss detection method from [13]. We selected an adapted forest definition and relevant ancillary data and ran our processing chain through the high-performance computing cluster of CNES. The resulting map provided clear hints of the spatial and temporal distribution of forest losses. For example, the difference between the high forest losses currently occurring in northern Laos and the low forest losses occurring in northern Vietnam can clearly be seen, although the whole northern mountainous region is covered by similar forest types. We also found that approximately half of the forest disturbances in Cambodia occur in protected areas.
The forest loss map was thoroughly validated following the recommendations made by [17,18]. We allocated a sample size of 100 for the forest disturbance stratum, then allocated the remainder of the samples to the intact forest classes, i.e., 200, in the buffer areas around detected disturbances and 700 in the intact forest outside of these buffers. We primarily used Planet’s very high resolution analysis-ready mosaics as reference data. We then calculated the confusion matrix populated by the estimated proportions of area and used this to report the accuracy results. The estimated user accuracy was 0.95 for forest disturbances and 0.99 for intact forest, while the estimated producer accuracy was 0.90 for forest disturbances and 0.99 for intact forest with an MMU of 0.1 ha. Detecting small forest loss areas up to 0.1 ha with such an accuracy is, to the best of our knowledge, almost unprecedented.
We also compared the forest loss surface areas obtained from our method with the results obtained from GFW and GLAD. We quantitatively compared the statistics per year and country and qualitatively compared both maps. The results obtained from this study and from GFW are remarkably similar, with the largest difference (26%) being found for Laos in 2020.
These results highlight the fact that our detection system provides accurate detections with few false alarms and can thus be used as an alert system (fast detection from Sentinel-1 data) and as an annual detection system similar to GFW, which can be used for example to compute national statistics.

Author Contributions

Conceptualization, S.M., T.L.T. and A.B.; methodology, S.M., M.B. and A.B.; software, T.K. and M.B.; validation, A.B., S.M. and M.B.; formal analysis, S.M. and A.B.; writing, S.M., A.B. and T.L.T. All authors have read and agreed to the published version of the manuscript.

Funding

This research was funded by ESA in the frame of the SOFT project (Sentinel-1 for Observing Forests in the Tropics), Contract 4000129739/20/I-DT-EO Science for Society EOEP-5 Block-4. Marie Ballère’s Ph.D. was funded by CNES and WWF. The processing of the data was strongly supported by CNES in the frame of the Biomass valorization program. This work has also been partly funded through the TropiSCO project funded by CNES (Marché n° 211140/00).

Institutional Review Board Statement

Not applicable.

Informed Consent Statement

Informed consent was obtained from all subjects involved in the study.

Data Availability Statement

Data can be browsed and downloaded at https://www.tropisco.org (available from 1 October 2022).

Acknowledgments

The authors deeply thank Frank-Martin Seifert for his advice and support. Many thanks to the five reviewers whom suggestions helped improve this manuscript.

Conflicts of Interest

The authors declare no conflict of interest.

References

  1. Vancutsem, C.; Achard, F.; Pekel, J.-F.; Vieilledent, G.; Carboni, S.; Simonetti, D.; Gallego, J.; Aragão, L.E.O.C.; Nasi, R. Long-term (1990–2019) monitoring of forest cover changes in the humid tropics. Sci. Adv. 2021, 7, eabe1603. [Google Scholar] [CrossRef] [PubMed]
  2. FAO. Global Forest Resources Assessment; Technical Report; Food and Agriculture Association of the United-States: Rome, Italy, 2020. [Google Scholar]
  3. Wheeler, D.; Hammer, D.; Kraft, R.; Steelr, A. Satellite-Based Forest Clearing Detection in the Brazilian Amazon: FORMA, DETER, and PRODES. 2014. Available online: https://www.wribrasil.org.br/sites/default/files/forma-issue-brief_1.pdf (accessed on 25 June 2021).
  4. Reymondin, L.; Jarvis, A.; Perez-Uribe, A.; Touval, J.; Argote, K.; Coca, A.; Rebetez, J.; Guevara, E.; Mulligan, M. Terra-i: A Methodology for Near Real-Time Monitoring of Habitat Change at Continental Scales Using MODIS-NDVI and TRMM. 2012. Available online: www.terra-i.org/dam/jcr:508a0e27-3c91-4022-93dd-81cf3fe31f42/Terra-i%20Method.pdf (accessed on 14 June 2021).
  5. Diniz, C.G.; Souza, A.A.D.A.; Santos, D.C.; Dias, M.C.; Luz, N.; de Moraes, D.R.V.; Maia, J.S.A.; Gomes, A.R.; Narvaes, I.D.S.; Valeriano, D.M.; et al. DETER-B: The New Amazon Near Real-Time Deforestation Detection System. IEEE J. Sel. Top. Appl. Earth Obs. Remote Sens. 2015, 8, 3619–3628. [Google Scholar] [CrossRef]
  6. Hansen, M.C.; Krylov, A.; Tyukavina, A.; Potapov, P.V.; Turubanova, S.; Zutta, B.; Ifo, S.; Margono, B.; Stolle, F.; Moore, R. Humid tropical forest disturbance alerts using Landsat data. Environ. Res. Lett. 2016, 11, 034008. [Google Scholar] [CrossRef]
  7. Reiche, J.; Lucas, R.; Mitchell, A.L.; Verbesselt, J.; Hoekman, D.H.; Haarpaintner, J.; Kellndorfer, J.M.; Rosenqvist, A.; Lehmann, E.A.; Woodcock, C.E.; et al. Combining satellite data for better tropical forest monitoring. Nat. Clim. Chang. 2016, 6, 120–122. [Google Scholar] [CrossRef]
  8. Watanabe, M.; Koyama, C.; Hayashi, M.; Kaneko, Y.; Shimada, M. Development of Early-Stage Deforestation Detection Algorithm (Advanced) with PALSAR-2/ScanSAR for JICA-JAXA Program (JJ-FAST); IEEE: Fort Worth, TX, USA, 2017; pp. 2446–2449. [Google Scholar]
  9. Belenguer-Plomer, M.A.; Tanase, M.A.; Fernandez-Carrillo, A.; Chuvieco, E. Burned area detection and mapping using Sentinel-1 backscatter coefficient and thermal anomalies. Remote Sens. Environ. 2019, 233, 111345. [Google Scholar] [CrossRef]
  10. Hoekman, D.; Kooij, B.; Quiñones, M.; Vellekoop, S.; Carolita, I.; Budhiman, S.; Arief, R.; Roswintiarti, O. Wide-Area Near-Real-Time Monitoring of Tropical Forest Degradation and Deforestation Using Sentinel-1. Remote Sens. 2020, 12, 3263. [Google Scholar] [CrossRef]
  11. Doblas, J.; Shimabukuro, Y.; Sant’Anna, S.; Carneiro, A.; Aragão, L.; Almeida, C. Optimizing near real-time detection of deforestation on tropical rainforests using Sentinel-1 data. Remote Sens. 2020, 12, 3922. [Google Scholar] [CrossRef]
  12. Reiche, J.; Mullissa, A.; Slagter, B.; Gou, Y.; Tsendbazar, N.-E.; Odongo-Braun, C.; Vollrath, A.; Weisse, M.J.; Stolle, F.; Pickens, A.; et al. Forest disturbance alerts for the Congo Basin using Sentinel-1. Environ. Res. Lett. 2021, 16, 024005. [Google Scholar] [CrossRef]
  13. Bouvet, A.; Mermoz, S.; Ballère, M.; Koleck, T.; Le Toan, T. Use of the SAR Shadowing Effect for Deforestation Detection with Sentinel-1 Time Series. Remote Sens. 2018, 10, 1250. [Google Scholar] [CrossRef] [Green Version]
  14. Hirschmugl, M.; Deutscher, J.; Sobe, C.; Bouvet, A.; Mermoz, S.; Schardt, M. Use of SAR and Optical Time Series for Tropical Forest Disturbance Mapping. Remote Sens. 2020, 12, 727. [Google Scholar] [CrossRef] [Green Version]
  15. Ballère, M.; Bouvet, A.; Mermoz, S.; Le Toan, T.; Koleck, T.; Bedeau, C.; André, M.; Forestier, E.; Frison, P.-L.; Lardeux, C. SAR data for tropical forest disturbance alerts in French Guiana: Benefit over optical imagery. Remote Sens. Environ. 2021, 252, 112159. [Google Scholar] [CrossRef]
  16. Tanase, M.A.; Aponte, C.; Mermoz, S.; Bouvet, A.; Le Toan, T.; Heurich, M. Detection of windthrows and insect outbreaks by L-band SAR: A case study in the Bavarian Forest National Park. Remote Sens. Environ. 2018, 209, 700–711. [Google Scholar] [CrossRef]
  17. Olofsson, P.; Foody, G.M.; Herold, M.; Stehman, S.V.; Woodcock, C.E.; Wulder, M.A. Good practices for estimating area and assessing accuracy of land change. Remote Sens. Environ. 2014, 148, 42–57. [Google Scholar] [CrossRef]
  18. Olofsson, P.; Arévalo, P.; Espejo, A.B.; Green, C.; Lindquist, E.; McRoberts, R.E.; Sanz, M.J. Mitigating the effects of omission errors on area and area change estimates. Remote Sens. Environ. 2020, 236, 111492. [Google Scholar] [CrossRef]
  19. Afelt, A.; Frutos, R.; Devaux, C. Bats, Coronaviruses, and Deforestation: Toward the Emergence of Novel Infectious Diseases? Front. Microbiol. 2018, 9, 702. [Google Scholar] [CrossRef] [PubMed] [Green Version]
  20. Potapov, P.; Tyukavina, A.; Turubanova, S.; Talero, Y.; Hernandez-Serna, A.; Hansen, M.; Saah, D.; Tenneson, K.; Poortinga, A.; Aekakkararungroj, A.; et al. Annual continuous fields of woody vegetation structure in the Lower Mekong region from 2000–2017 Landsat time-series. Remote Sens. Environ. 2019, 232, 111278. [Google Scholar] [CrossRef]
  21. Hansen, M.C.; Potapov, P.V.; Moore, R.; Hancher, M.; Turubanova, S.A.; Tyukavina, A.; Thau, D.; Stehman, S.V.; Goetz, S.J.; Loveland, T.R.; et al. High-resolution global maps of 21st-century forest cover change. Science 2013, 342, 850–853. [Google Scholar] [CrossRef] [Green Version]
  22. Koleck, T.; Ballère, M.; Marie-Sainte, W. S1Tiling, A Multipurpose Open Source Processing Chain for Sentinel-1 Time Series. In Proceedings of the Living Planet Symposium, Milan, Italy, 13–17 May 2019. [Google Scholar]
  23. Inglada, J.; Christophe, E. The Orfeo Toolbox remote sensing image processing software. In Proceedings of the 2009 IEEE International Geoscience and Remote Sensing Symposium, Cape Town, South Africa, 12–17 July 2009; Volume 4, p. IV-733. [Google Scholar]
  24. Quegan, S.; Yu, J.J. Filtering of multichannel SAR images. IEEE Trans. Geosci. Remote Sens. 2001, 39, 2373–2379. [Google Scholar] [CrossRef]
  25. Mermoz, S.; Le Toan, T.; Villard, L.; Réjou-Méchain, M.; Seifert-Granzin, J. Biomass assessment in the Cameroon savanna using ALOS PALSAR data. Remote Sens. Environ. 2014, 155, 109–119. [Google Scholar] [CrossRef]
  26. Mermoz, S.; Le Toan, T. Forest Disturbances and Regrowth Assessment Using ALOS PALSAR Data from 2007 to 2010 in Vietnam, Cambodia and Lao PDR. Remote Sens. 2016, 8, 217. [Google Scholar] [CrossRef] [Green Version]
  27. Bruniquel, J.; Lopes, A. Multi-variate optimal speckle reduction in SAR imagery. Int. J. Remote Sens. 1997, 18, 603–627. [Google Scholar] [CrossRef]
  28. Pekel, J.-F.; Cottam, A.; Gorelick, N.; Belward, A.S. High-resolution mapping of global surface water and its long-term changes. Nature 2016, 540, 418–422. [Google Scholar] [CrossRef] [PubMed]
  29. Bunting, P.; Rosenqvist, A.; Lucas, R.; Rebelo, L.-M.; Hilarides, L.; Thomas, N.; Hardy, A.; Itoh, T.; Shimada, M.; Finlayson, C.M. The Global Mangrove Watch—A New 2010 Global Baseline of Mangrove Extent. Remote Sens. 2018, 10, 1669. [Google Scholar] [CrossRef] [Green Version]
  30. Google Earth. 2011. Available online: https://www.google.com/intl/fr/earth/ (accessed on 14 September 2021).
  31. Witness, G. Rubber Barons: How Vietnamese Companies and International Financiers Are Driving a Land Grabbing Crisis in Cambodia and Laos; Global Witness: London, UK, 2013. [Google Scholar]
  32. Xiao, C.; Li, P.; Feng, Z.; Liu, Y.; Zhang, X. Sentinel-2 red-edge spectral indices (RESI) suitability for mapping rubber boom in Luang Namtha Province, northern Lao PDR. Int. J. Appl. Earth Obs. Geoinf. 2020, 93, 102176. [Google Scholar] [CrossRef]
  33. Hurni, K.; Fox, J. The expansion of tree-based boom crops in mainland Southeast Asia: 2001 to 2014. J. Land Use Sci. 2018, 13, 198–219. [Google Scholar] [CrossRef]
  34. UNEP-WCMC and IUCN. Protected Planet: The World Database on Protected Areas (WDPA). On-Line, Downloaded in June 2021; UNEP-WCMC and IUCN: Cambridge, UK, 2021; Available online: www.protectedplanet.net (accessed on 5 July 2021).
Figure 1. Comparison between the tree cover maps from [20,21]. The map from Hansen is particularly affected by the failure of the Landsat-7 Scan Line Corrector in the Enhanced Thematic Mapper Plus (ETM+) instrument.
Remotesensing 13 04877 g001
Figure 2. Flowchart summarizing the method used to derive forest loss maps from Sentinel-1.
Remotesensing 13 04877 g002
Figure 3. Location of the 100 disturbance samples, 200 buffer samples (intact forest around disturbance), and 700 intact forest samples used for the validation. Light green areas represent the baseline forest map.
Remotesensing 13 04877 g003
Figure 4. Forest disturbances map made using Sentinel-1 data for Vietnam, Laos, and Cambodia from the end of 2017 to the beginning of 2021.
Remotesensing 13 04877 g004
Figure 5. Visual comparison of forest loss detection results, highlighting the various sizes and distributions of disturbed areas (113). Forest areas from [20] are in dark green, and the background image is taken from Google Earth. Forest was cut mostly for commodities in northwestern Laos (1). (3) shows infrastructure construction at the border between the north and center of Laos, whereas (5), in central Laos, shows cashew plantations. Pulp tree, sugarcane, coffee, and rubber plantations can be found in southern Laos (7). (8) shows a massive plantation of pulp trees. Logging roads are visible in (11), whereas timber and particularly rubber plantations can be seen in (9) and (11)–(13), while cashew plantations are evident in (10)–(13) [33]. In (13), it can be seen that many rubber plantations are square, with a 25 ha size.
Remotesensing 13 04877 g005
Figure 6. Map of forest loss and protected areas (hatched areas) made using the database from [34]. Approximately half of forest disturbances in Cambodia occur in protected areas.
Remotesensing 13 04877 g006
Figure 7. Monthly forest loss detection over Vietnam, Laos, and Cambodia from January 2018 to December 2020.
Remotesensing 13 04877 g007
Table 1. Forest area in 1990, 2000, 2010, and 2020; forest area proportion in 2020; and primary forest proportion in 2020 in Vietnam, Cambodia, and Laos according to the FAO (2020).
VietnamCambodiaLaos
Forest area 1990 (ha × 103)937611,00517,843
Forest area 2000 (ha × 103)11,78410,78117,425
Forest area 2010 (ha × 103)13,38810,58916,940
Forest area 2020 (ha × 103)14,643806816,595
Forest area % of land area 202047.245.771.9
Primary forest % of forest area 20200.54-
Table 2. Error matrix of sample counts.
Reference
DisturbancesIntactTotal
MapDisturbances965101
Intact buffer3194197
Intact 3693696
Total102892994
Table 3. Error matrix populated by estimated proportions of area used to report accuracy results.
Reference
DisturbancesIntactTotal (Wi)Am,i (km2)
MapDisturbances5.55%0.29%5.84%22,222
Intact buffer0.28%18.30%18.58%70,667
Intact0.33%75.25%75.58%287,462
Total6.16%93.84%100%380,351
Table 4. Surface areas of forest loss per year and country in hectares according to this study, Global Forest Watch [21], and GLAD [6].
This Study (ha)GFW (ha) [21]GFW Minus
This Study (%)
GLAD (ha) [6]
Vietnam 2018345,121422,30022-
Vietnam 2019445,977421,910−583,361
Vietnam 2020333,655397,0661982,174
Cambodia 2018200,400180,970−10-
Cambodia 2019281,335236,780−16119,042
Cambodia 2020262,448230,317−12105,963
Laos 2018327,152400,29022-
Laos 2019648,089498,830−23153,187
Laos 2020650,040477,299-26164,201
Publisher’s Note: MDPI stays neutral with regard to jurisdictional claims in published maps and institutional affiliations.

