Technical Note

What Is the Impact of Tectonic Plate Movement on Country Size? A Long-Term Forecast

by
Kamil Maciuk
1,2,
Michal Apollo
2,3,4,5,
Anita Kukulska-Kozieł
6 and
Paulina Lewińska
7,8,*
1
Department of Integrated Geodesy and Cartography, AGH University of Science and Technology, 30-059 Krakow, Poland
2
HNU-ASU Joint International Tourism College, Hainan University, Haikou 570228, China
3
Department of Tourism and Regional Studies, Institute of Geography, Pedagogical University of Cracow, 30-084 Krakow, Poland
4
Global Justice Program, Yale University, New Haven, CT 06520, USA
5
Center for Tourism Research, Wakayama University, Wakayama 640-8510, Japan
6
Department of Land Management and Landscape Architecture, University of Agriculture in Krakow, 30-149 Krakow, Poland
7
Department of Engineering Surveying and Civil Engineering, AGH University of Science and Technology, 30-059 Krakow, Poland
8
Department of Computer Science, University of York, Heslington, York YO10 5DD, UK
*
Author to whom correspondence should be addressed.
Remote Sens. 2021, 13(23), 4872; https://doi.org/10.3390/rs13234872
Submission received: 20 August 2021 / Revised: 10 November 2021 / Accepted: 17 November 2021 / Published: 30 November 2021
(This article belongs to the Special Issue Quantifying Landscape Evolution and Erosion by Remote Sensing)

Abstract

:
The Earth’s surface is under permanent alteration with the area of some nations growing or shrinking due to natural or man-made processes, for example sea level change. Here, based on the NUVEL 1A model, we forecast (in 10, 25, and 50 years) the changes in area for countries that are located on the border of the major tectonic plates. In the analysis we identify countries that are projected to gain or lose land due to the tectonic plate movement only. Over the next 50 years, the global balance of area gains (0.4 km2) and losses (12.7 km2) is negative. Thus, due to the movements of lithospheric plates, the land surface of the Earth will decrease by 12 km2 in 50 years. Overall, the changes are not that spectacular, as in the case of changes in sea/water levels, but in some smaller countries, projected losses exceed a few thousand square metres a year, e.g., in Nepal the losses exceed 10,000 m2 year−1. Methodologically, this paper finds itself between metric analysis and essay, trying to provoke useful academic discussion and incite educators’ interests to illustrate to students the tectonic movement and its force. Limitations of the used model have been discussed in the methodology section.

1. Introduction

Land worldwide is a critical and limited resource that is subject to a variety of natural and/or anthropogenic processes and phenomena that cause modifications in areal extent [1]. A recent analysis using the Aqua Monitor tool, determined that between 1985 and 2015, the Earth’s surface gained 115,000 km2 of water and 173,000 km2 of land, with coastal areas gaining 20,135 km2 of water and 33,700 km2 of land. Thus, during that 30-year period, the global net change of dry land was positive: 58,000 km2 globally; 13,565 km2 in coastal areas [2]. Important anthropogenic contributors to these changes were the creation of artificial islands, coastal reclamation, and the desiccation of natural water bodies (e.g., Aral Sea), all of which increased land area; increases in water were often associated with the building of large reservoirs or major shifts in large rivers.
With respect to natural processes, sea level change has been of one of the most significant determinants in land losses and gains over time. For example, at the peak of the last Ice Age (~20,000 years ago), sea level was 120–130 m lower than today, exposing vast tracts of land worldwide. Coastal low areas were then flooded as the climate warmed gradually, raising sea levels an average of ~1.2 cm per year for 10,000 years until it levelled off at the beginning of Holocene (104 years) ~10,000 years ago to the approximate current day height [3]. Of growing contemporary concern is the extent to which more land will be lost from sea level rise through ice cap melt and nonlinear thermal expansion of the oceans as a result of anthropogenic global warming, for example in the Netherlands and tropical islands [4,5]. Furthermore, isostatic adjustment occurring since the last ice age will continue to cause various land masses to rise or sink until equilibrium is achieved [6].
Tectonic activity, which refers to the movement of the lithospheric plates that comprise the Earth’s lithosphere, inherently results in changes in the land surface area [7,8,9,10]. The configuration of the continents, as well as the creation of most major landforms, is related to tectonic activity over geologic time. Most volcanoes occur at the boundaries of tectonic plates that are either converging or diverging; others occur over hotspots. Volcanism both creates new lands, but also many places formed in the past by volcanic activity lose surface area yearly through erosion [11] and/or during the formation of a caldera itself. Coastal erosion and accretion are two other natural processes with a profound effect on land areas [12]. Coastal processes are also often altered by human activity.
At a timescale related to management, tectonic plate movement has a marginal impact on the administrative borders in tectonically stable regions. Nevertheless, these small changes may still be noticeable. A pressing need is to understand the impacts in unstable areas where plate movements are substantial [13,14,15]. Overall, existing models of tectonic plate velocity is based on data from the globally distributed GNSS stations [16,17]. Furthermore, satellite techniques using GNSS observations allow for the determination of velocities at mm precision [18,19]. In this work, we use publicly available data to determine the influence of the tectonic plate movements on areal changes worldwide in the coming decades. This information augments the rate of change projections for sea level rise, volcanism, coastal erosion, and anthropogenic activity.

2. Methods and Limitations

To determine the impact of tectonics on country area we focused on the 15 large plates whose motion was described by the NUVEL-1A poles (Africa, Antarctica, Arabia, Australia, Caribbean, Cocos, Eurasia, India, Juan de Fuca, Nazca, North America, Pacific, Philippine Sea, South America), which are part of the digital model of plate boundaries presented by [20]. We use the plate motion calculator [13] to calculate rigid plate motions at specified locations on Earth using the NUVEL 1A plate motion model 1A [21,22,23] and the Eurostat (2020) administrative map of the globe [24]. Based on the literature, it should be assumed that the velocity determination error is 1 mm/year [25]. This is mainly due to the techniques used to determine the plates’ velocities (GNSS and VLBI). It should also be noted that this is currently the most accurate technique for observing this type of phenomena and provides as accurate as possible velocities. Our focus is on changes occurring at terrestrial border locations, now and in the future. Motion is either divergent (spreading), convergent (subduction), or transform (lateral sliding), as shown in Figure 1.
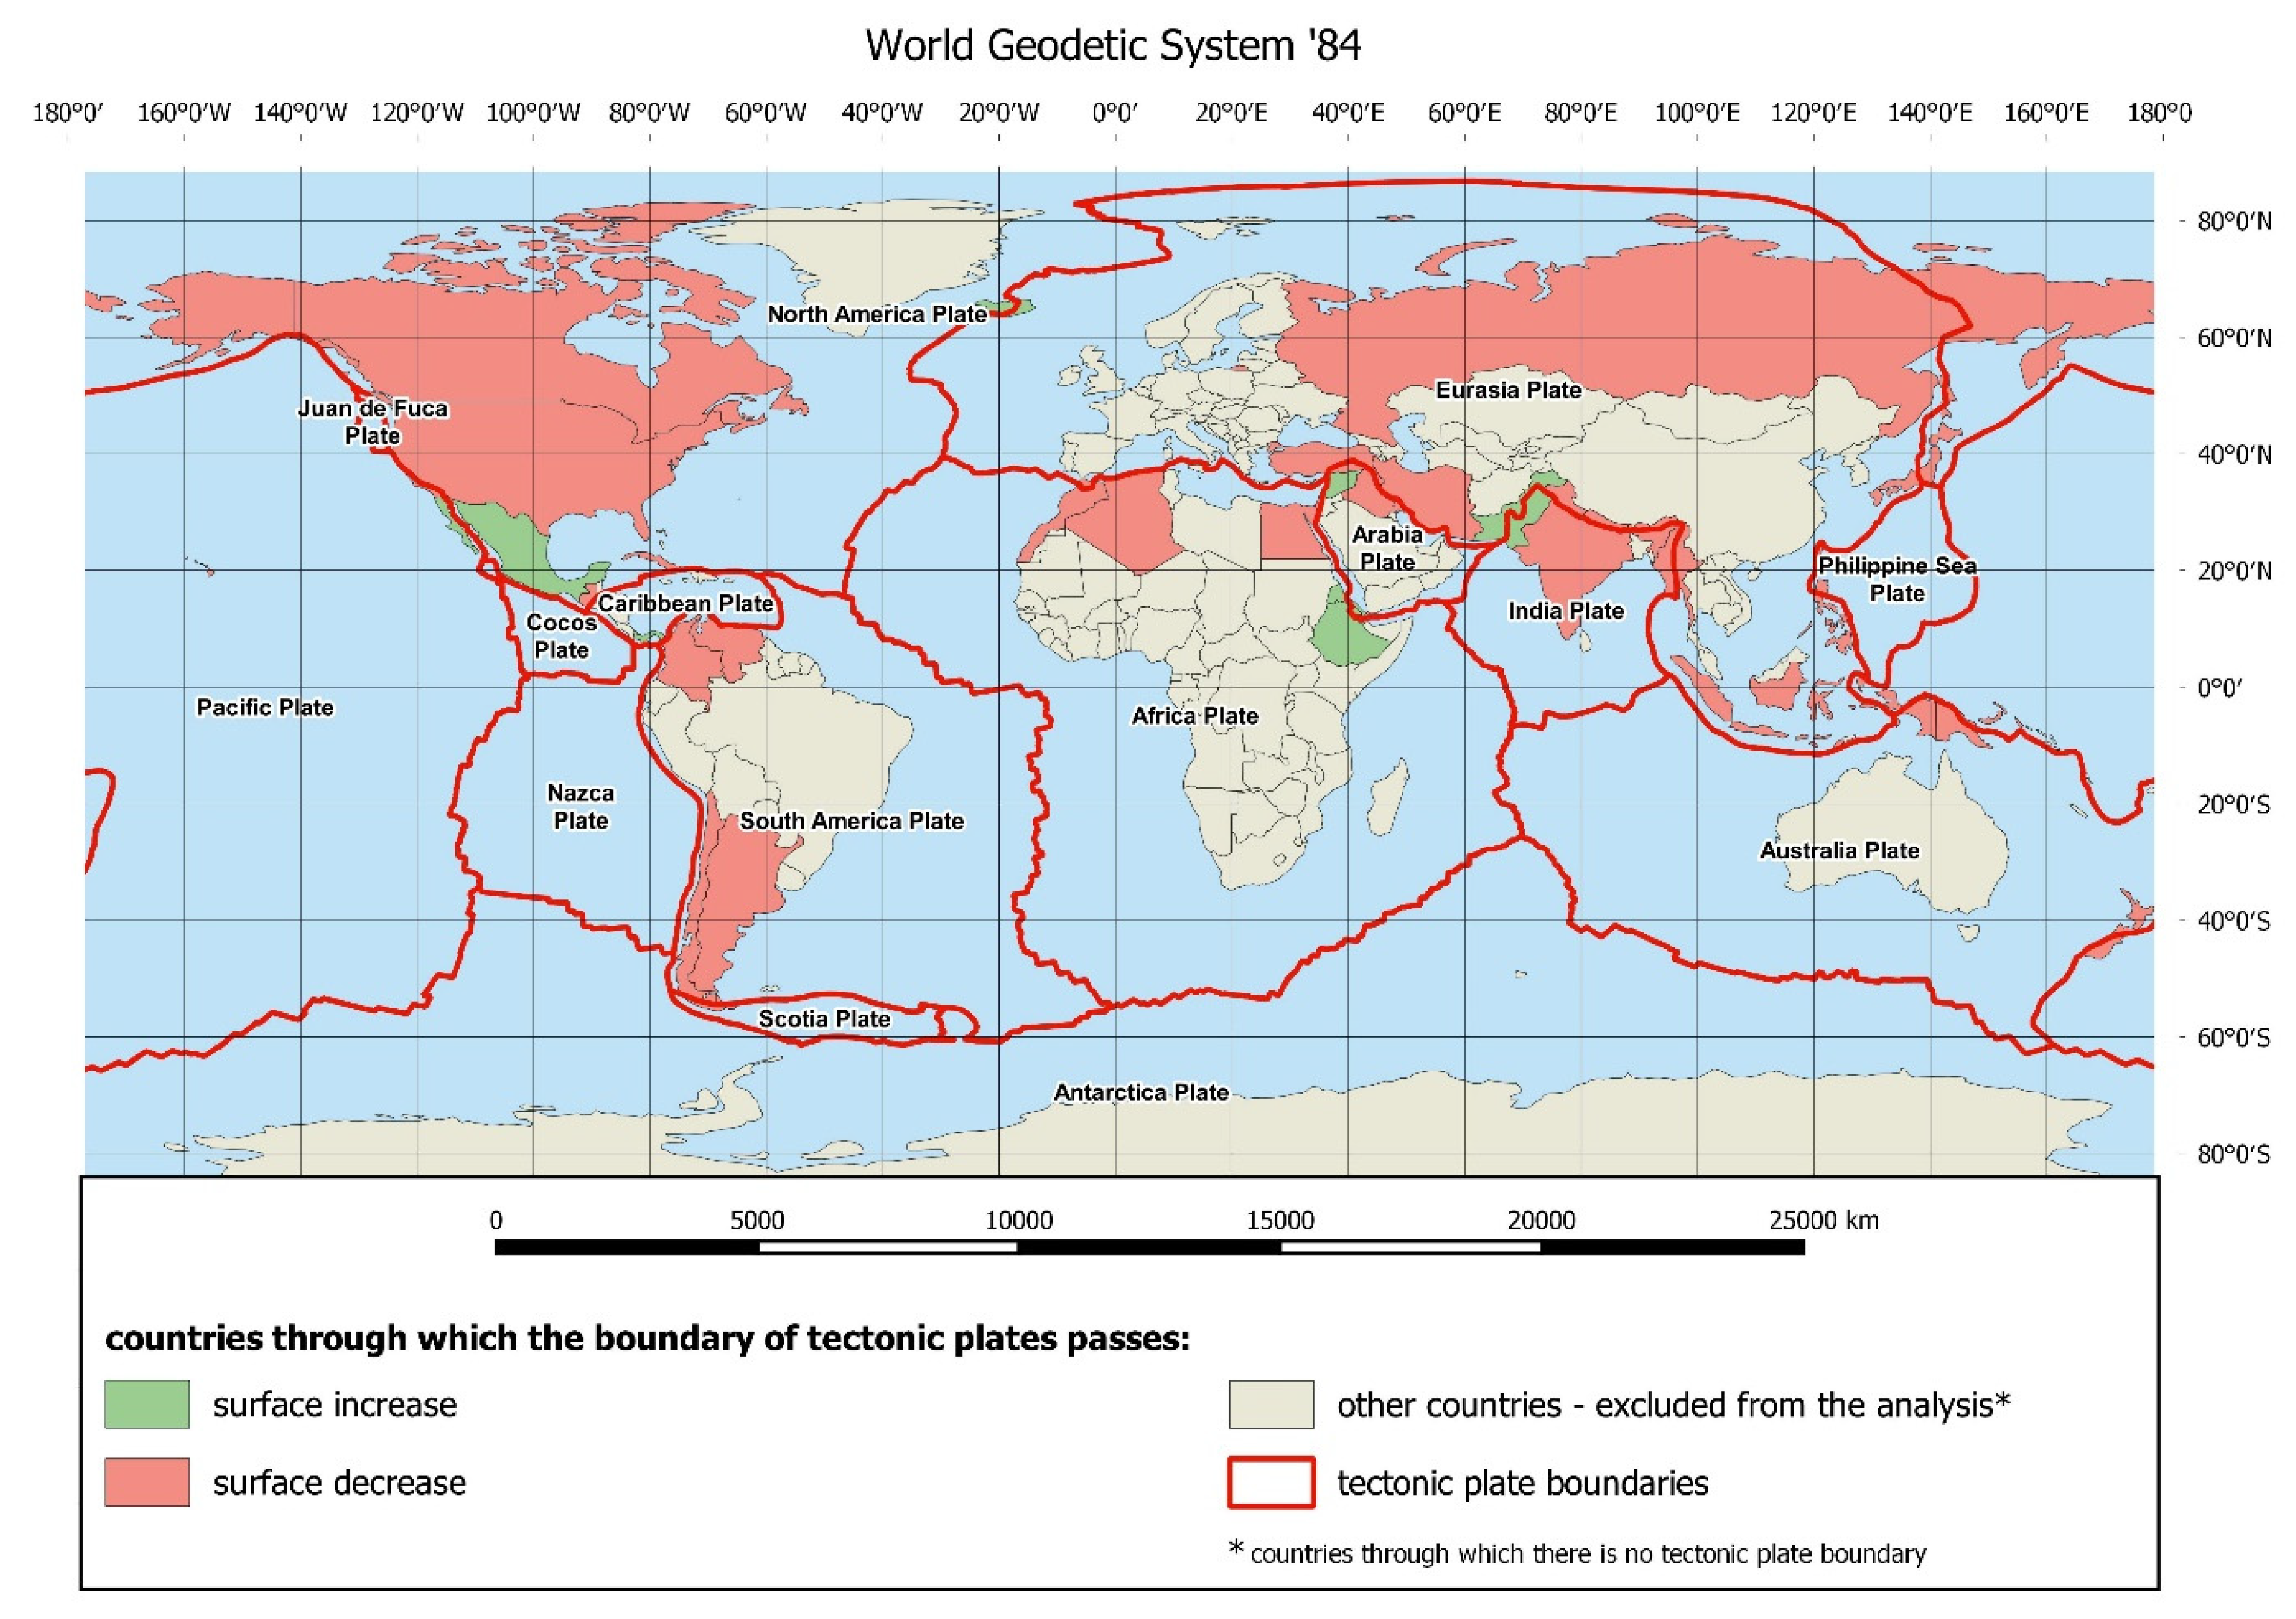
This research has several limitations. We calculated a yearly velocity at the intersection points of the tectonic plates and countries borders. We do not account for changes in sea level (Figure 2). The subject of this research was only to determine the impact of tectonic plate movement on the administrative area of countries. It is not the only factor that causes surface changes, other factors include, e.g., earthquakes, volcanic eruptions, melting glaciers, or even man-made phenomena. However, the influence of plate movement is a mathematical factor that can be precisely defined, while the remaining phenomena are stochastic—their impact is purely random and also might significantly affect the phenomenon of tectonic plate movement.
To show the phenomenon on a global scale the authors simplified the processes occurring at tectonic margins. For example, the subduction zone of Nepal is very much a grossly oversimplified representation if reflected by a single line. This tectonic zone spans thousands of kilometres and shows a stepwise movement of thrust faults to the south. These faults are still active and act differently in various places [26,27]. Furthermore, the movement along faults comes down to how much of the strain energy has been released. Not all faults result in a total release of the strain, for example in some areas a strong earthquake happened every few decades [28]. In subduction zones, an accretionary prism is observed, whereby the scraping of the upper surface of the downgoing plate accretes onto the overriding plate. This adds landmass to the overlying plate. For example, India subducting beneath Nepal should actually add landmass to Nepal, or at least to the foothills of the Himalayas. In addition, co-seismic movement exists (up, down, and laterally—often all three), then post-seismic movement occurs as plates reconfigure due to the weight of the plate edges with respect to the asthenosphere (see, e.g., [29,30]).
Moreover, more detailed studies (focusing on smaller areas) should use models that include the effects of earthquakes as new research found that GNSS velocities (of which plate motion models are calculated) include biases and need to be corrected for the effect of earthquakes (both co-seismic and post-seismic motions), so that more realistic crustal motions are obtained. Usually, for the large events, the post-seismic deformation equals or exceeds the co-seismic one [31]. The majority of earthquakes in the world (90% and 81% of the largest) occur within a 40,000 km horseshoe-shaped zone known as the Pacific Ring of Fire, which largely constrains the expansion of the Pacific Plate [32]. Massive earthquakes also happen along other plate boundaries, such as along the Himalayas [33]. Each of those places (and others as well) host a strong earthquake (see Gutenberg–Richter law). For example, in the case of large earthquakes (M > 8), Nepal will move towards India (the convergent boundary). This can happen within a few decades because of large seismic gaps along the Himalayas. The same can happen in California, New Zealand, or in Indonesia, and this dramatic change affects the areal calculations. Thus, this must be taken into consideration in further, detailed study.
In this study, the movement of plates is represented as an average movement along an individual fault line, but even along an individual fault zone, those rates vary depending on a host of factors, including rheology, orientation, and roughness. However, similarly to [2] this project uses several a priori assumptions.
In order to minimize errors (as much as possible), the following assumptions were made. A digital map of country borders (7710 points; 50–70 km average distance between consecutive points, minimum 10 km) was superimposed on the plate border map (6150 points; 50–70 km average distance between consecutive points, minimum 20 km). As a result of the intersection, 36 countries were selected, within which there were 4022 points. Within these countries, there were 608 points.
The areas of the analysed countries were calculated based on vector data models automatically generated within the GIS (geographical information systems) software-QGIS ver. 3.16.11 LTR Hannover, licence GNU GPL). The analyses were carried out in the WGS-84 coordinate system (World Geodetic System 1984), geographic coordinates, and ellipsoid surface. Based on Plate Motion Calculator, the coordinates of the intersection points between national borders and the tectonic plates after one year was calculated. Annual plate velocity for each country border point was calculated based on the Eurostat map [24], then the country areas were calculated before and after the NUVEL1A model application [21,22,23]. In a similar way, the coordinates of these intersection points after 10 years, 25 years, and 50 years were also calculated. The calculated coordinates were then imported into the QGIS software (version 3.10.0-A Co-ruña) and used to digitize the borders of the analysed countries, and then to calculate their area in the adopted time intervals. The speed of the point’s location change was calculated for each point separately.
Importantly, the adopted generalization scale (number of points) was chosen to show the scale of the phenomenon and not its accuracy. However, increasing the number of points (reducing the generalization) will only slightly change the results—it is not the number of points, but rather the speed between them that changes the phenomenon.

3. Results and Discussion

Increases (green) and decreases (red) in 36 countries associated with 15 major tectonic plates over the period 2020 to 2050 are shown in Table 1. Plate border length for the 36 countries varied from 80 km (Trinidad and Tobago) to 3600 km (Russia), depending on the country size and shape. Area gains/losses related to the projected tectonic movements depend on the direction and velocity amplitudes of the tectonic plate movement. Based on the motion estimates for the next 50 years, 10 countries will increase in area and 26 will reduce in area (Table 1).
The largest increases in area are for Mexico and Djibouti. Both these countries, after ten years, will increase their area by 13,000 and 9000 m2, respectively. After half a century, their area will increase by 65,000 and 45,000 m2. India, Nepal, and the USA are among the countries that will lose the most area due to plate movement. After just ten years, they will lose 575,000, 390,000, and 210,000 m2, respectively. In 50 years, they will decrease in area by almost 3 km2, 2 km2, and more than 1 km2, respectively. Collectively, the balance profits (0.4 km2) and losses (12.7 km2) are negative over the next 50 years.
Overall, it is easy to believe that the size of the Earth’s dry land is increasing due to plate movement (e.g., land elevation and new volcanoes emerging). It is easier to fathom the ‘increase’ in land than its ‘disappearance’. Supplementary Material shows interactive maps demonstrating the main types of plate motion, which include spreading (divergent), subduction (convergent), and lateral sliding (transform), and the change in size of land due to plate movement. For example, the North America Plate is moving west versus the Eurasian Plate, which is moving east. Thus, the distance between NYC and London is increasing slowly each year (approx. 25 mm year−1), and Iceland will increase in size by 280,000 m2 in the next 50 years (Table 1, Videos in Supplementary Files). An opposite situation can be noted in the subduction zone. For example, the India tectonic plate is moving towards Central Asia at a speed of 29–36 mm year−1 [20]—the reason for repeated earthquakes. The Himalayas are rising, but India (−2883,000 m2) and Nepal (−1961,000 m2) are shrinking (Table 1, Videos in Supplementary Files).

4. Conclusions

For the majority of the countries analysed, multiyear tectonic plate movement has a very small or even negligible impact on area size. However, when considered at small management scales, such as districts or states, etc., these changes are significant, for example, the San Andreas fault in California, USA (Videos in Supplementary Files) [35]. Even if the tectonic plate movement has a marginal impact on country area size, this small and insignificant impact on the changes of points in some areas is still noticeable—and potentially catastrophic. We have noted that due to the movements of lithospheric plates, the land surface of the Earth will decrease by 12 km2 in the next 50 years. The size of the change depends strongly on the length of the tectonic border as well as the plate velocity and movement direction that vary globally.

Supplementary Materials

The following are available online at https://www.mdpi.com/article/10.3390/rs13234872/s1, Video S1: California, Video S2: Iceland, Video S3: Nepal.

Author Contributions

Conceptualization, K.M.; methodology, K.M. & M.A.; validation, K.M.; formal analysis, A.K.-K.; investigation, K.M.; resources, K.M.; data curation, A.K.-K.; writing—original draft preparation, K.M., M.A., P.L.; writing—review and editing, K.M., M.A. & P.L.; visualization, A.K-K. & K.M.; supervision, K.M. & M.A.; project administration, K.M.; funding acquisition, K.M., A.K-K. & P.L. Authors contribution: K.M. 50%, M.A. 30%, A.K.-K. 15%, P.L. 5%. All authors have read and agreed to the published version of the manuscript.

Funding

This research was funded by the AGH University of Science and Technology, grant number 16.16.150.545. The APC was co-founded by the University of Agriculture in Krakow with funds from the Ministry of Education and Science for the discipline of civil engineering and transport.

Institutional Review Board Statement

Not applicable.

Informed Consent Statement

Not applicable.

Data Availability Statement

Not applicable.

Acknowledgments

This paper was produced under scientific activity and cooperation with the AGH University of Science and Technology (Krakow, Poland), the Pedagogical University of Cracow (Krakow, Poland), the University of Agriculture in Krakow (Krakow, Poland), and York University (York, England). The authors would like to express their gratitude to the editor and the anonymous reviewers for their thorough work with the manuscript and for providing constructive and insightful comments on this paper.

Conflicts of Interest

The authors declare no conflict of interest.

References

  1. Williamson, I.; Enemark, S.; Wallace, J.; Rajabifard, A. Land Administration for Sustainable Development; ESRI Press Academic: Redlands, CA, USA, 2010; ISBN 9781589480414. [Google Scholar]
  2. Donchyts, G.; Baart, F.; Winsemius, H.; Gorelick, N.; Kwadijk, J.; van de Giesen, N. Earth’s surface water change over the past 30 years. Nat. Clim. Chang. 2016, 6, 810–813. [Google Scholar] [CrossRef]
  3. Siegert, M. Sea Level Change; PM Cambridge University Press: London, UK, 2015; Available online: https://www.imperial.ac.uk/media/imperial-college/grantham-institute/public/publications/briefing-papers/Sea-level-change-Briefing-Note-1v2.pdf (accessed on 11 September 2021).
  4. Nerem, R.S.; Beckley, B.D.; Fasullo, J.T.; Hamlington, B.D.; Masters, D.; Mitchum, G.T. Climate-change–driven accelerated sea-level rise detected in the altimeter era. Proc. Natl. Acad. Sci. USA 2018, 115, 2022–2025. [Google Scholar] [CrossRef] [PubMed] [Green Version]
  5. Widlansky, M.J.; Long, X.; Schloesser, F. Increase in sea level variability with ocean warming associated with the nonlinear thermal expansion of seawater. Commun. Earth Environ. 2020, 1, 1–12. [Google Scholar] [CrossRef]
  6. Peltier, W. Chapter 4 Global glacial isostatic adjustment and modern instrumental records of relative sea level history. Int. Geophys. 2001, 75, 65–95. [Google Scholar] [CrossRef]
  7. Morgan, W.J.; Shagam, R.; Hargraves, R.B.; Van Houten, F.B.; Burk, C.A.; Holland, H.D.; Hollister, L.C. Plate Motions and Deep Mantle Convection. Mem. Geol. Soc. Am. 1972, 132, 7–22. [Google Scholar] [CrossRef]
  8. Harrison, C.G.A. The present-day number of tectonic plates. Earth Planets Space 2016, 68, 450. [Google Scholar] [CrossRef] [Green Version]
  9. Hejmanowski, R.; Malinowska, A.A.; Witkowski, W.T.; Guzy, A. An Analysis Applying InSAR of Subsidence Caused by Nearby Mining-Induced Earthquakes. Geosciences 2019, 9, 490. [Google Scholar] [CrossRef] [Green Version]
  10. Matwij, W.; Gruszczyński, W.; Puniach, E.; Ćwiąkała, P. Determination of underground mining-induced displacement field using multi-temporal TLS point cloud registration. Measurement 2021, 180, 109482. [Google Scholar] [CrossRef]
  11. Ramalho, R.S.; Quartau, R.; Trenhaile, A.S.; Mitchell, N.C.; Woodroffe, C.D.; Ávila, S.P. Coastal evolution on volcanic oceanic islands: A complex interplay between volcanism, erosion, sedimentation, sea-level change and biogenic production. Earth-Sci. Rev. 2013, 127, 140–170. [Google Scholar] [CrossRef] [Green Version]
  12. Mentaschi, L.; Vousdoukas, M.I.; Pekel, J.-F.; Voukouvalas, E.; Feyen, L. Global long-term observations of coastal erosion and accretion. Sci. Rep. 2018, 8, 12876. [Google Scholar] [CrossRef] [Green Version]
  13. UNAVCO. Plate Motion Calculator. Available online: https://www.unavco.org/software/geodetic-utilities/plate-motion-calculator/plate-motion-calculator.html#references (accessed on 11 September 2021).
  14. Wallace, R.E. The San Andreas Fault System; US Geological Survey, United States Government Printing Office: Washington, DC, USA, 1990; p. 1515.
  15. Thornton, J. Field Guide to New Zealand Geology: An Introduction to Rocks, Minerals and Fossils; Penguin Group New Zealand, Limited: Auckland, New Zealand, 1985; ISBN 10: 0790000253, ISBN 13: 9780790000251. [Google Scholar]
  16. Jagoda, M.; Rutkowska, M. An Analysis of the Eurasian Tectonic Plate Motion Parameters Based on GNSS Stations Positions in ITRF2014. Sensors 2020, 20, 6065. [Google Scholar] [CrossRef] [PubMed]
  17. Ampatzidis, D. Alternative methodology for classical geodetic reference system assessment using GNSS and recent tectonic plate model: Case of hellenic geodetic reference system of 1987. Surv. Rev. 2014, 47, 363–370. [Google Scholar] [CrossRef]
  18. Wang, G.; Kearns, T.J.; Yu, J.; Saenz, G. A stable reference frame for landslide monitoring using GPS in the Puerto Rico and Virgin Islands region. Landslides 2014, 11, 119–129. [Google Scholar] [CrossRef]
  19. Pospíšil, L.; Hefty, J.; Hipmanová, L. Risk and geodynamically active areas of the carpathian lithosphere on the base of geodetical and geophysical data. Acta Geod. Geophys. Hung. 2012, 47, 287–309. [Google Scholar] [CrossRef]
  20. Bird, P. An updated digital model of plate boundaries. Geochem. Geophys. Geosystems 2003, 4. [Google Scholar] [CrossRef]
  21. DeMets, C.; Gordon, R.G.; Argus, D.F.; Stein, S. Effect of recent revisions to the geomagnetic reversal time scale on estimates of current plate motions. Geophys. Res. Lett. 1994, 21, 2191–2194. [Google Scholar] [CrossRef]
  22. Argus, D.F.; Gordon, R.G.; Heflin, M.B.; Ma, C.; Eanes, R.J.; Willis, P.; Peltier, W.R.; Owen, S.E. The angular velocities of the plates and the velocity of Earth’s centre from space geodesy. Geophys. J. Int. 2010, 180, 913–960. [Google Scholar] [CrossRef]
  23. Argus, D.F.; Gordon, R.G.; DeMets, C. Geologically current motion of 56 plates relative to the no-net-rotation reference frame. Geochem. Geophys. Geosystems 2011, 12. [Google Scholar] [CrossRef] [Green Version]
  24. GISCO data distribution API, Eurostat Countries 2020. EN: © EuroGeographics for the Administrative Boundaries. Available online: https://ec.europa.eu/eurostat/web/gisco/geodata/reference-data/administrative-units-statistical-units/countries (accessed on 11 September 2021).
  25. Kostelecký, J.; Zeman, A. Horizontal and vertical displacements of the stations within the frame of the individual plates based on the ITRS 2000 reference system. Acta Geodyn. Geomater. 2004, 1, 133–143. [Google Scholar]
  26. Le Fort, P. Himalayas: The collided range. Present knowledge of the continental arc. Am. J. Sci. 1975, 275, 1–44. [Google Scholar]
  27. Beaumont, C.; Jamieson, R.A.; Nguyen, M.H.; Lee, B. Himalayan tectonics explained by extrusion of a low-viscosity crustal channel coupled to focused surface denudation. Nat. Cell Biol. 2001, 414, 738–742. [Google Scholar] [CrossRef] [PubMed]
  28. Sreejith, K.M.; Sunil, P.S.; Agrawal, R.; Saji, A.P.; Rajawat, A.S.; Ramesh, D.S. Audit of stored strain energy and extent of future earthquake rupture in central Himalaya. Sci. Rep. 2018, 8, 16697. [Google Scholar] [CrossRef] [PubMed]
  29. Valagussa, A.; Frattini, P.; Valbuzzi, E.; Crosta, G.B. Role of landslides on the volume balance of the Nepal 2015 earthquake sequence. Sci. Rep. 2021, 11, 1–12. [Google Scholar] [CrossRef]
  30. Watanabe, S.-I.; Ishikawa, T.; Yokota, Y. Non-volcanic crustal movements of the northernmost Philippine Sea plate detected by the GPS-acoustic seafloor positioning. Earth Planets Space 2015, 67, 119. [Google Scholar] [CrossRef] [Green Version]
  31. Briole, P.; Ganas, A.; Elias, P.; Dimitrov, D. The GPS velocity field of the Aegean. New observations, contribution of the earthquakes, crustal blocks model. Geophys. J. Int. 2021, 226, 468–492. [Google Scholar] [CrossRef]
  32. Kingston, A. Ring of fire: An encyclopedia of the Pacific Rim’s earthquakes, tsunamis, and volcanoes. Choice Rev. Online 2015, 53, 53. [Google Scholar] [CrossRef]
  33. Tary, J.B.; Herrera, R.H.; Van Der Baan, M. Analysis of time-varying signals using continuous wavelet and synchrosqueezed transforms. Philos. Trans. R. Soc. A Math. Phys. Eng. Sci. 2018, 376, 20170254. [Google Scholar] [CrossRef] [PubMed] [Green Version]
  34. Largest Countries in the World (by Area). Available online: https://www.worldometers.info/geography/largest-countries-in-the-world/ (accessed on 11 September 2021).
  35. Data.ca.gov. CA Geographic Boundaries. Available online: https://data.ca.gov/dataset/ca-geographic-boundaries (accessed on 11 September 2021).
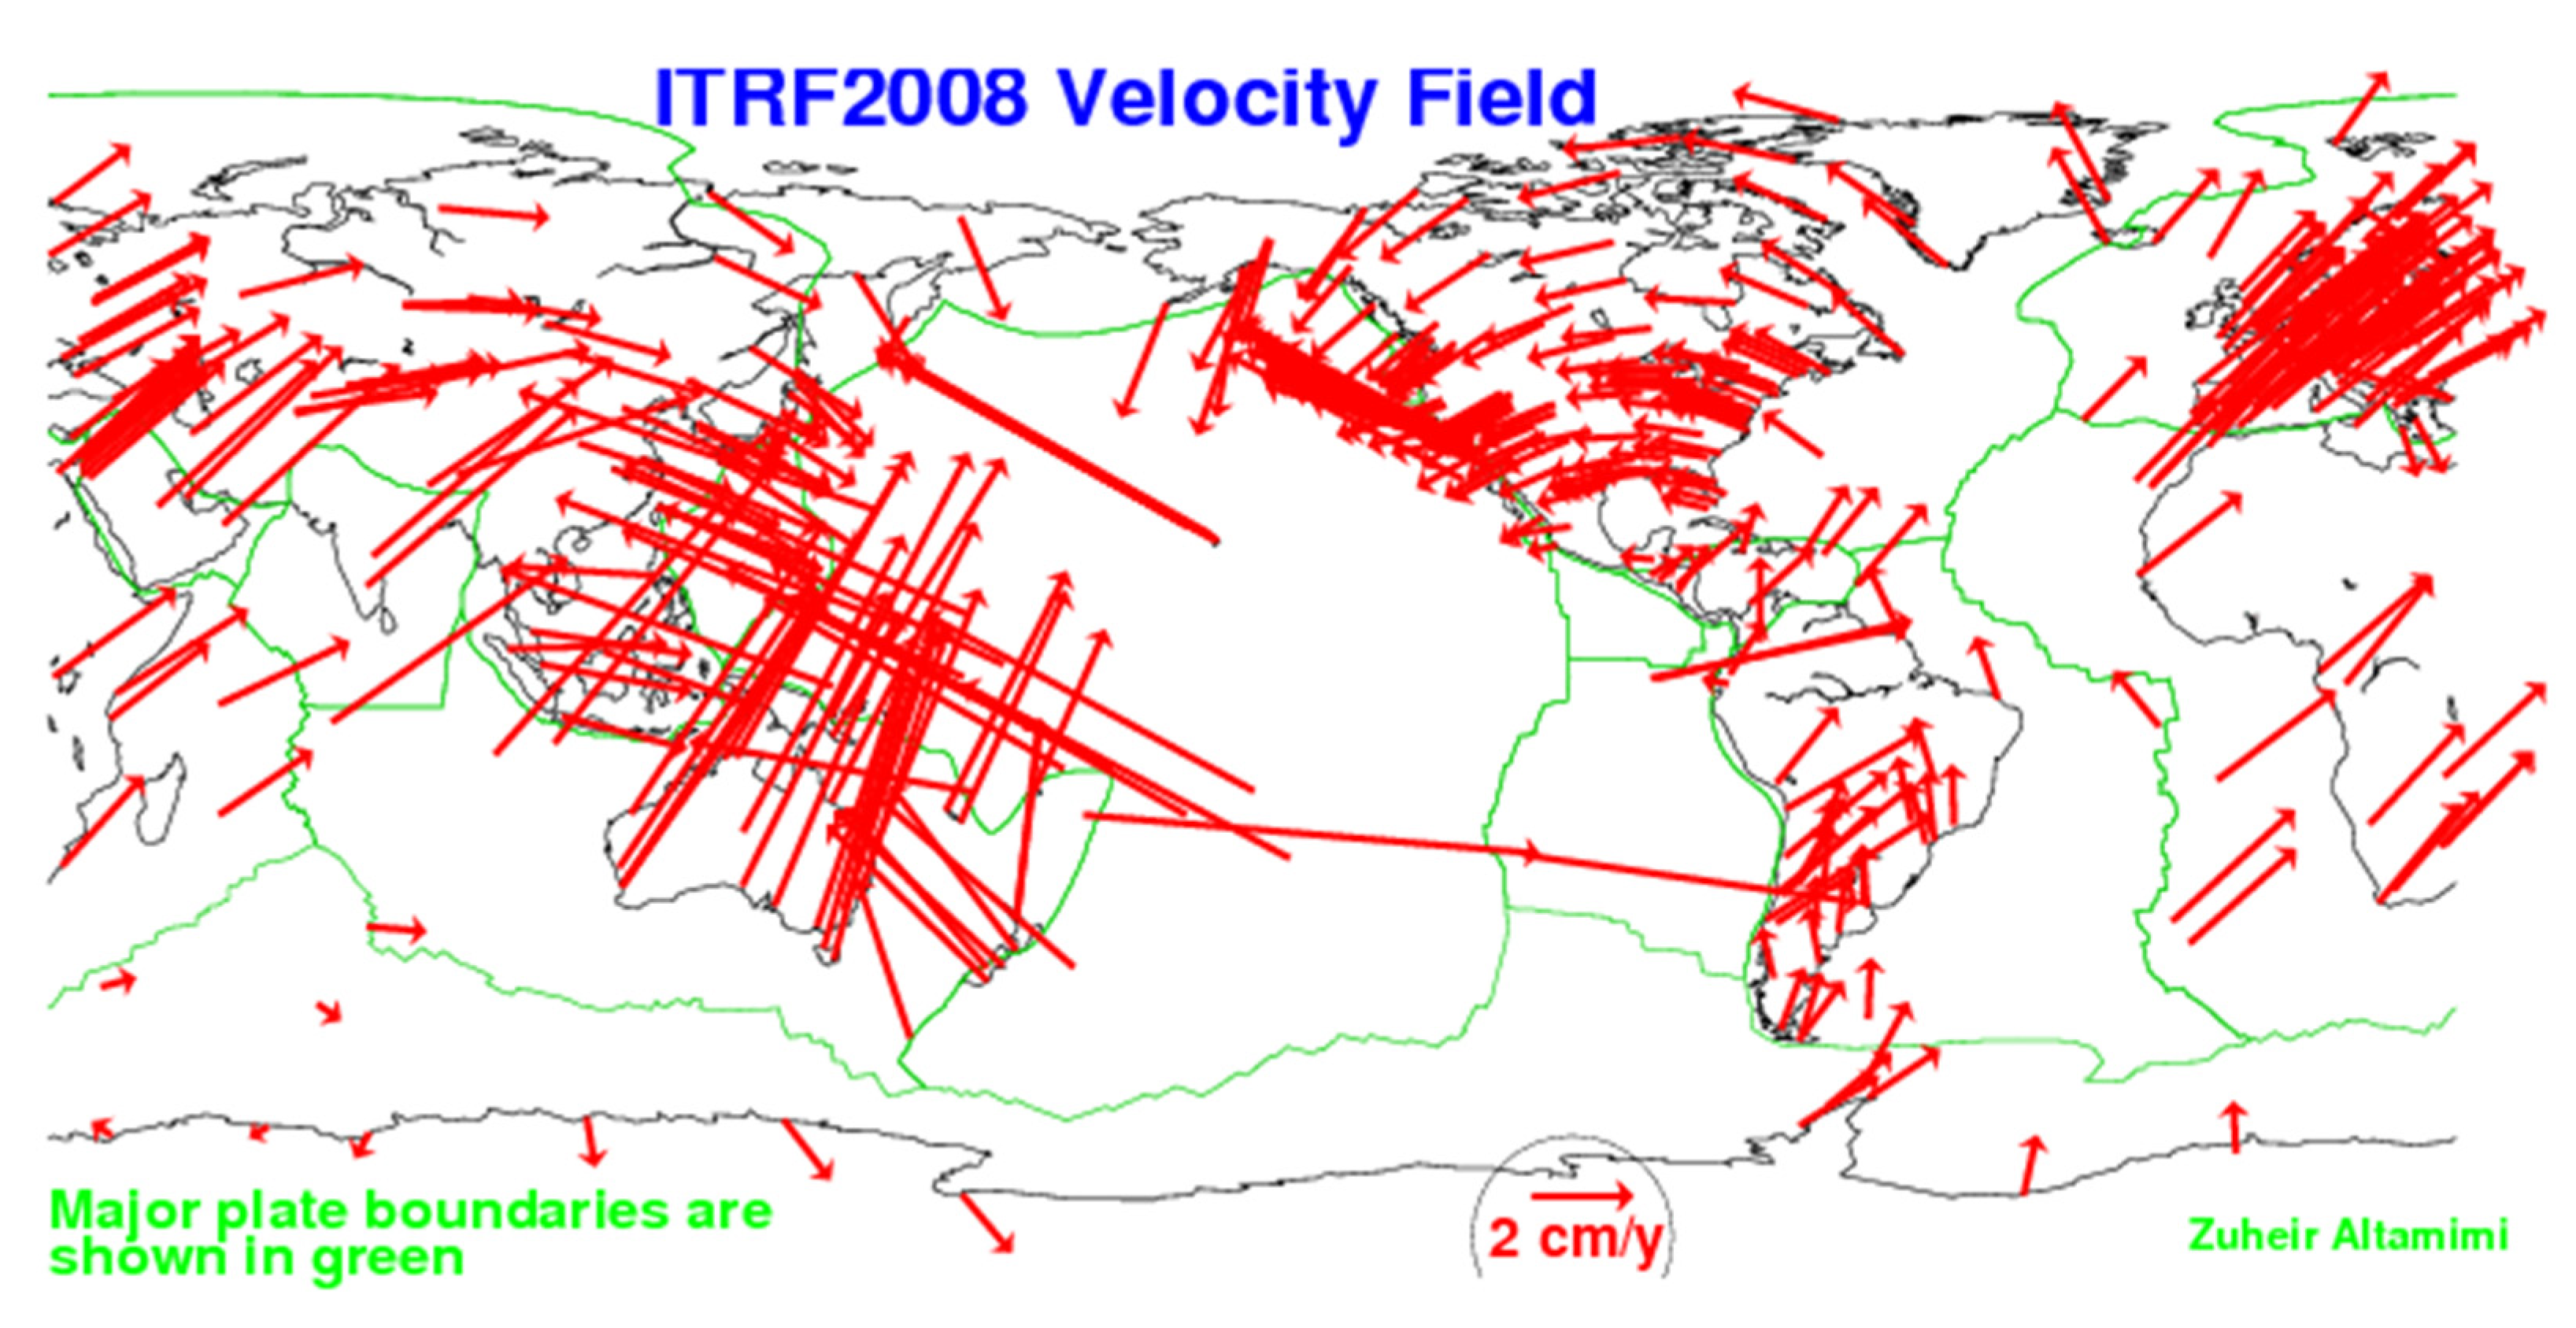
Figure 1. ITRF2008 velocity field, Mercator projection [https://itrf.ign.fr/ITRF_solutions/2008/ITRF2008.php, accessed date: 11 September 2021].
Remotesensing 13 04872 g001
Figure 2. Map showing which countries have gained (green) and lost (red) land. For detailed map showing direction of plate movement and average velocity see, e.g., [20], Licence: EN: © EuroGeographics for the administrative boundaries.
Remotesensing 13 04872 g002
Table 1. Forecast of country size changes in 10, 25, and 50 years.
#CountryArea * [km2]Plate Border Length [km]Area Change [m2]
After 10 YearsAfter 25 YearsAfter 50 Years
1Algeria2,381,740379−36,810−97,691−198,668
2Argentina2,736,690129−4948−4324−6211
3Bhutan38,117301−92,220−230,263−460,291
4Canada9,093,510213−15,299−27,806−51,226
5Chile743,532185−23,445−64,963−132,276
6Colombia1,109,500104−76,446−190,891−380,949
7Cuba106,440178−1421−1467−1776
8Djibouti23,180136908622,72545,720
9Egypt995,450136−22684356756
10Eritrea101,0001322502605311,909
11Ethiopia1,000,0004733779707612,951
12Guatemala107,160287−4940−12,459−24,680
13Iceland100,25047656,598140,186279,317
14India2,973,1901440−575,659−1,440,931−2,882,874
15Indonesia1,811,570494−30,600−75,692−157,201
16Iran1,628,5501547−140,679−353,301−707,640
17Iraq434,320396−15,813−37,491−72,812
18Israel21,640299−18,467−47,167−94,828
19Japan364,555335−67,176−161,376−310,598
20Lebanon10,230165−2520−6627−13,445
21Mexico1,943,95017213,26533,16764,839
22Morocco446,300425−1486−752565
23Myanmar653,2901375−55,878−147,914−299,340
24Nepal143,350878−391,615−979,922−1,960,880
25New Zealand263,310535−122,850−306,878−605,524
26Pakistan770,8801774−132,438−331,018−660,850
27Panama74,340180193831225527
28Papua New Guinea452,860488−115,344−295,920−594,725
29Philippines298,170152−121,255−303,453−607,910
30Russia16,376,870,592−31,186−96,717−213,285
31Syria183,630159106220574148
32Taiwan35,410382−2361712917
33Trinidad and Tobago513082−639−4964−12,244
34Turkey769,630904−181,182−454,212−908,848
35USA9,147,4201495−210,355−536,560−1,085,144
36Venezuela882,050227−46,416−117,708−237,105
* [34].
Publisher’s Note: MDPI stays neutral with regard to jurisdictional claims in published maps and institutional affiliations.