
Multi-Source Remote Sensing Image Fusion for Ship Target Detection and Recognition

Abstract
:
1. Introduction
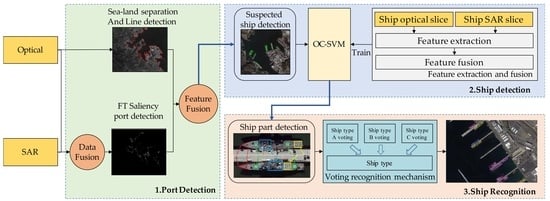
2. Methodology
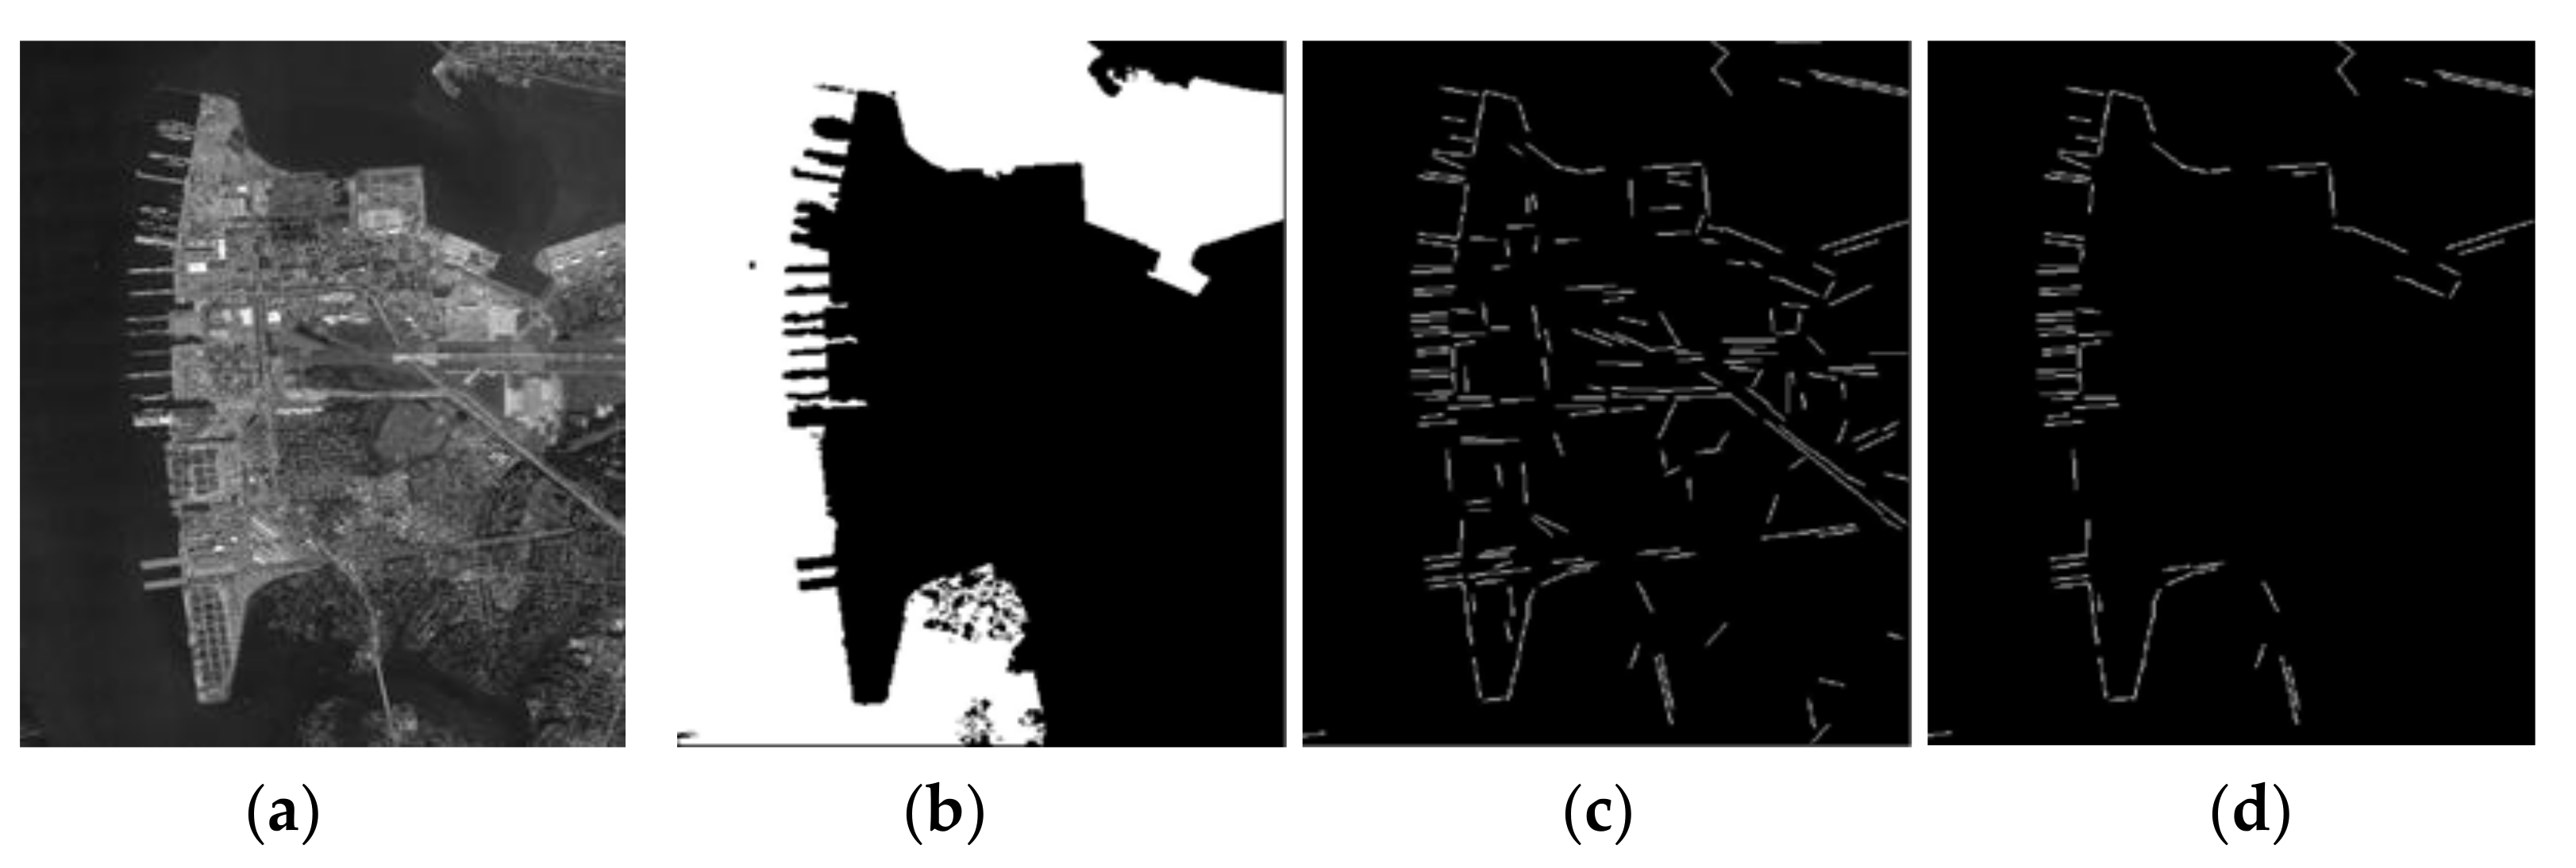
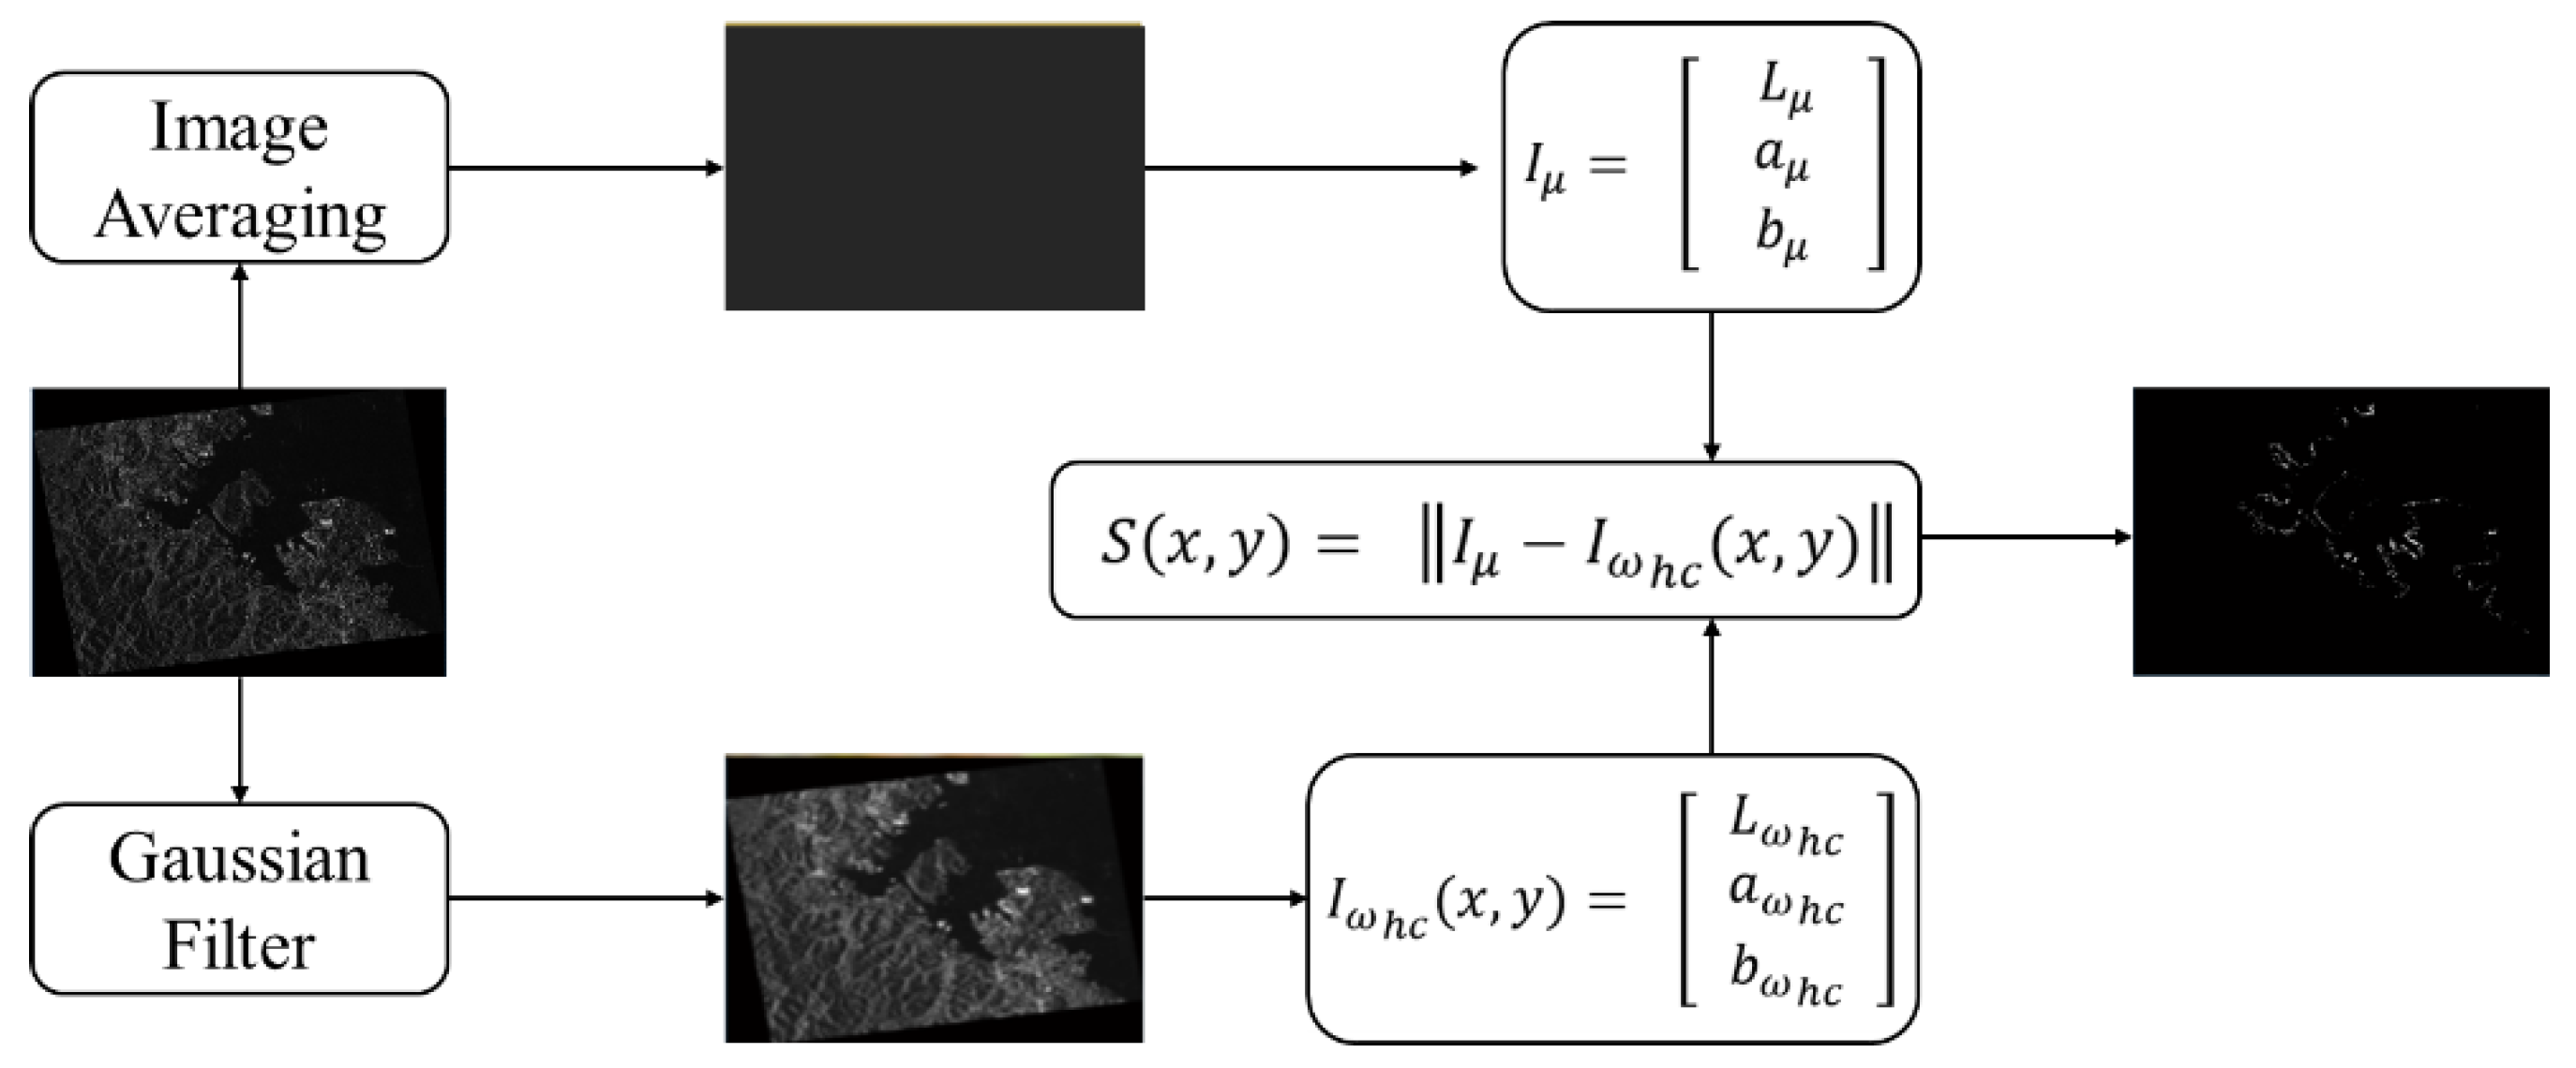
2.1. Port Area Detection Based on Multi-Source Remote Sensing Image
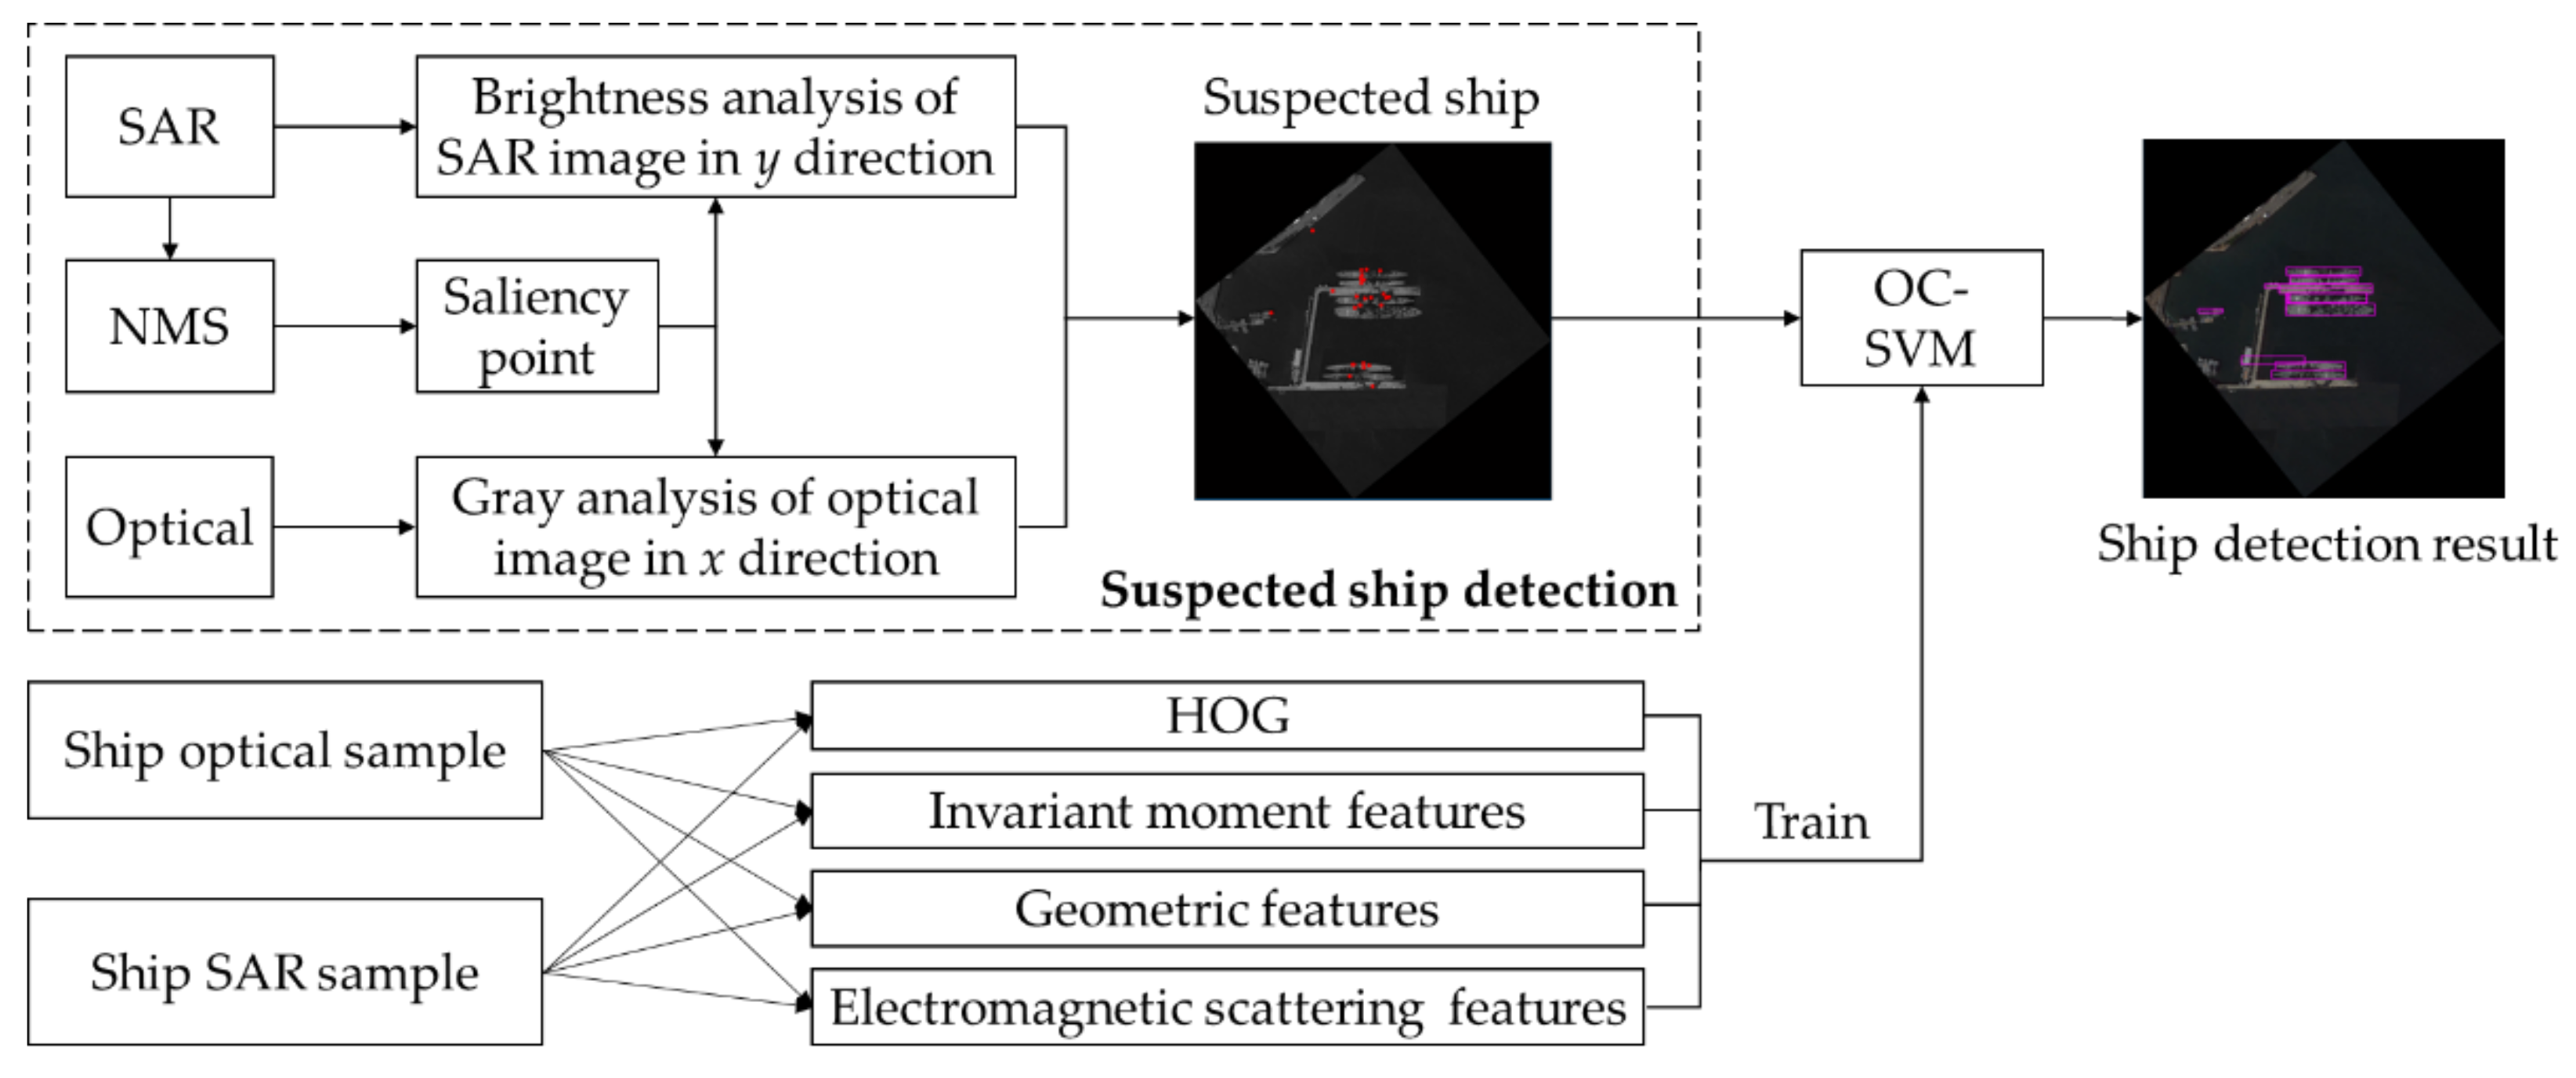
2.2. Ship Target Detection Based on Multi-Source Remote Sensing Image
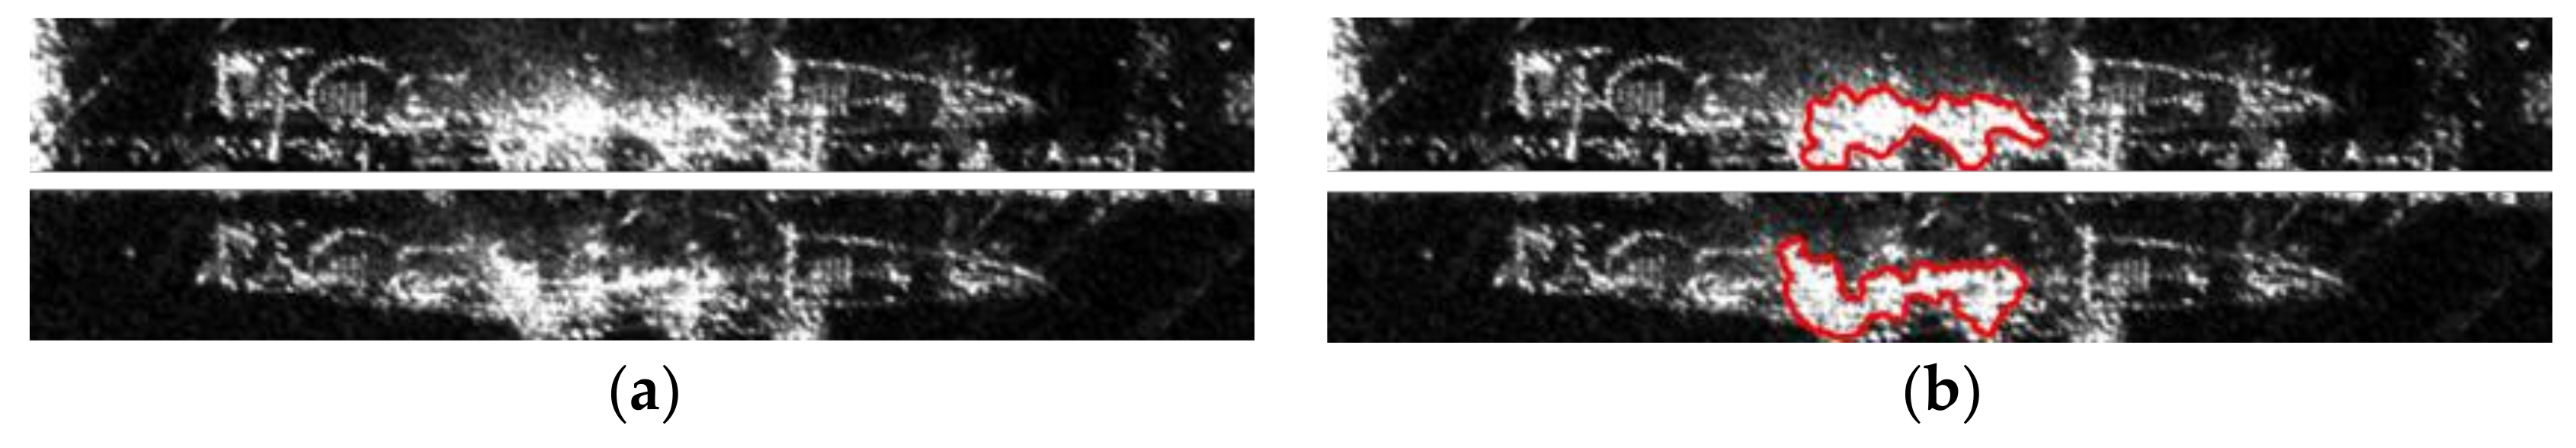
- (1)
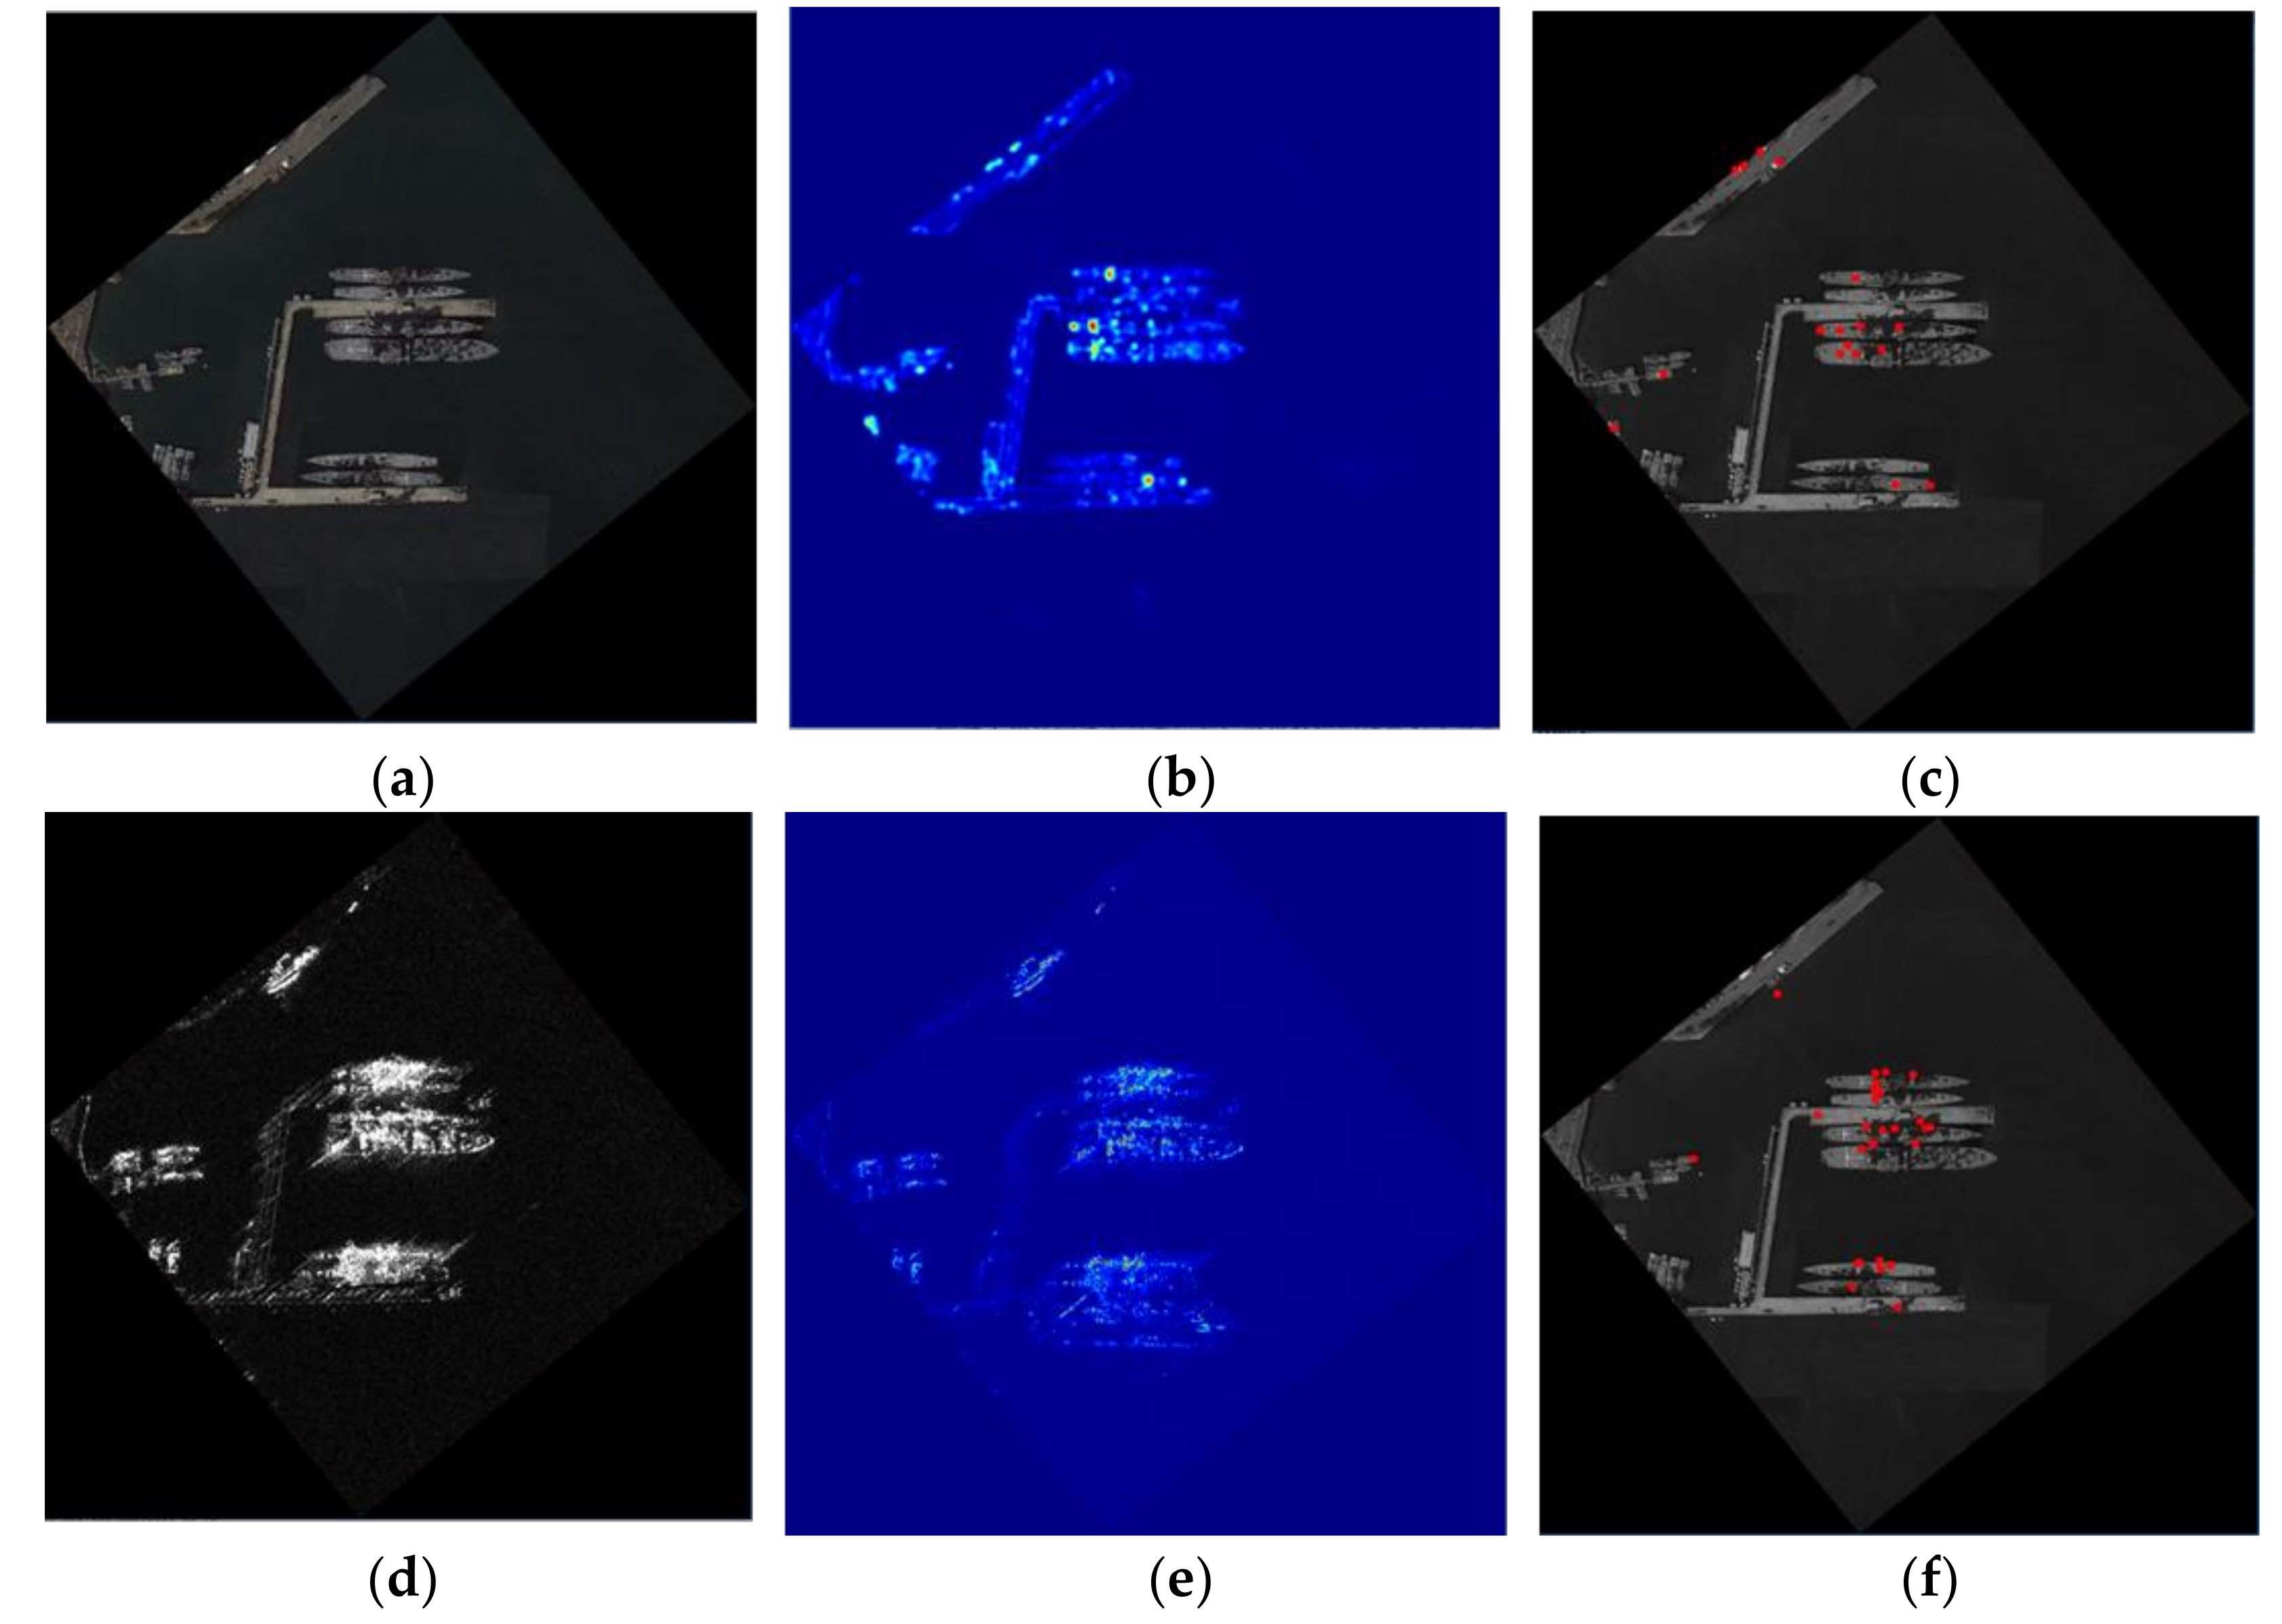
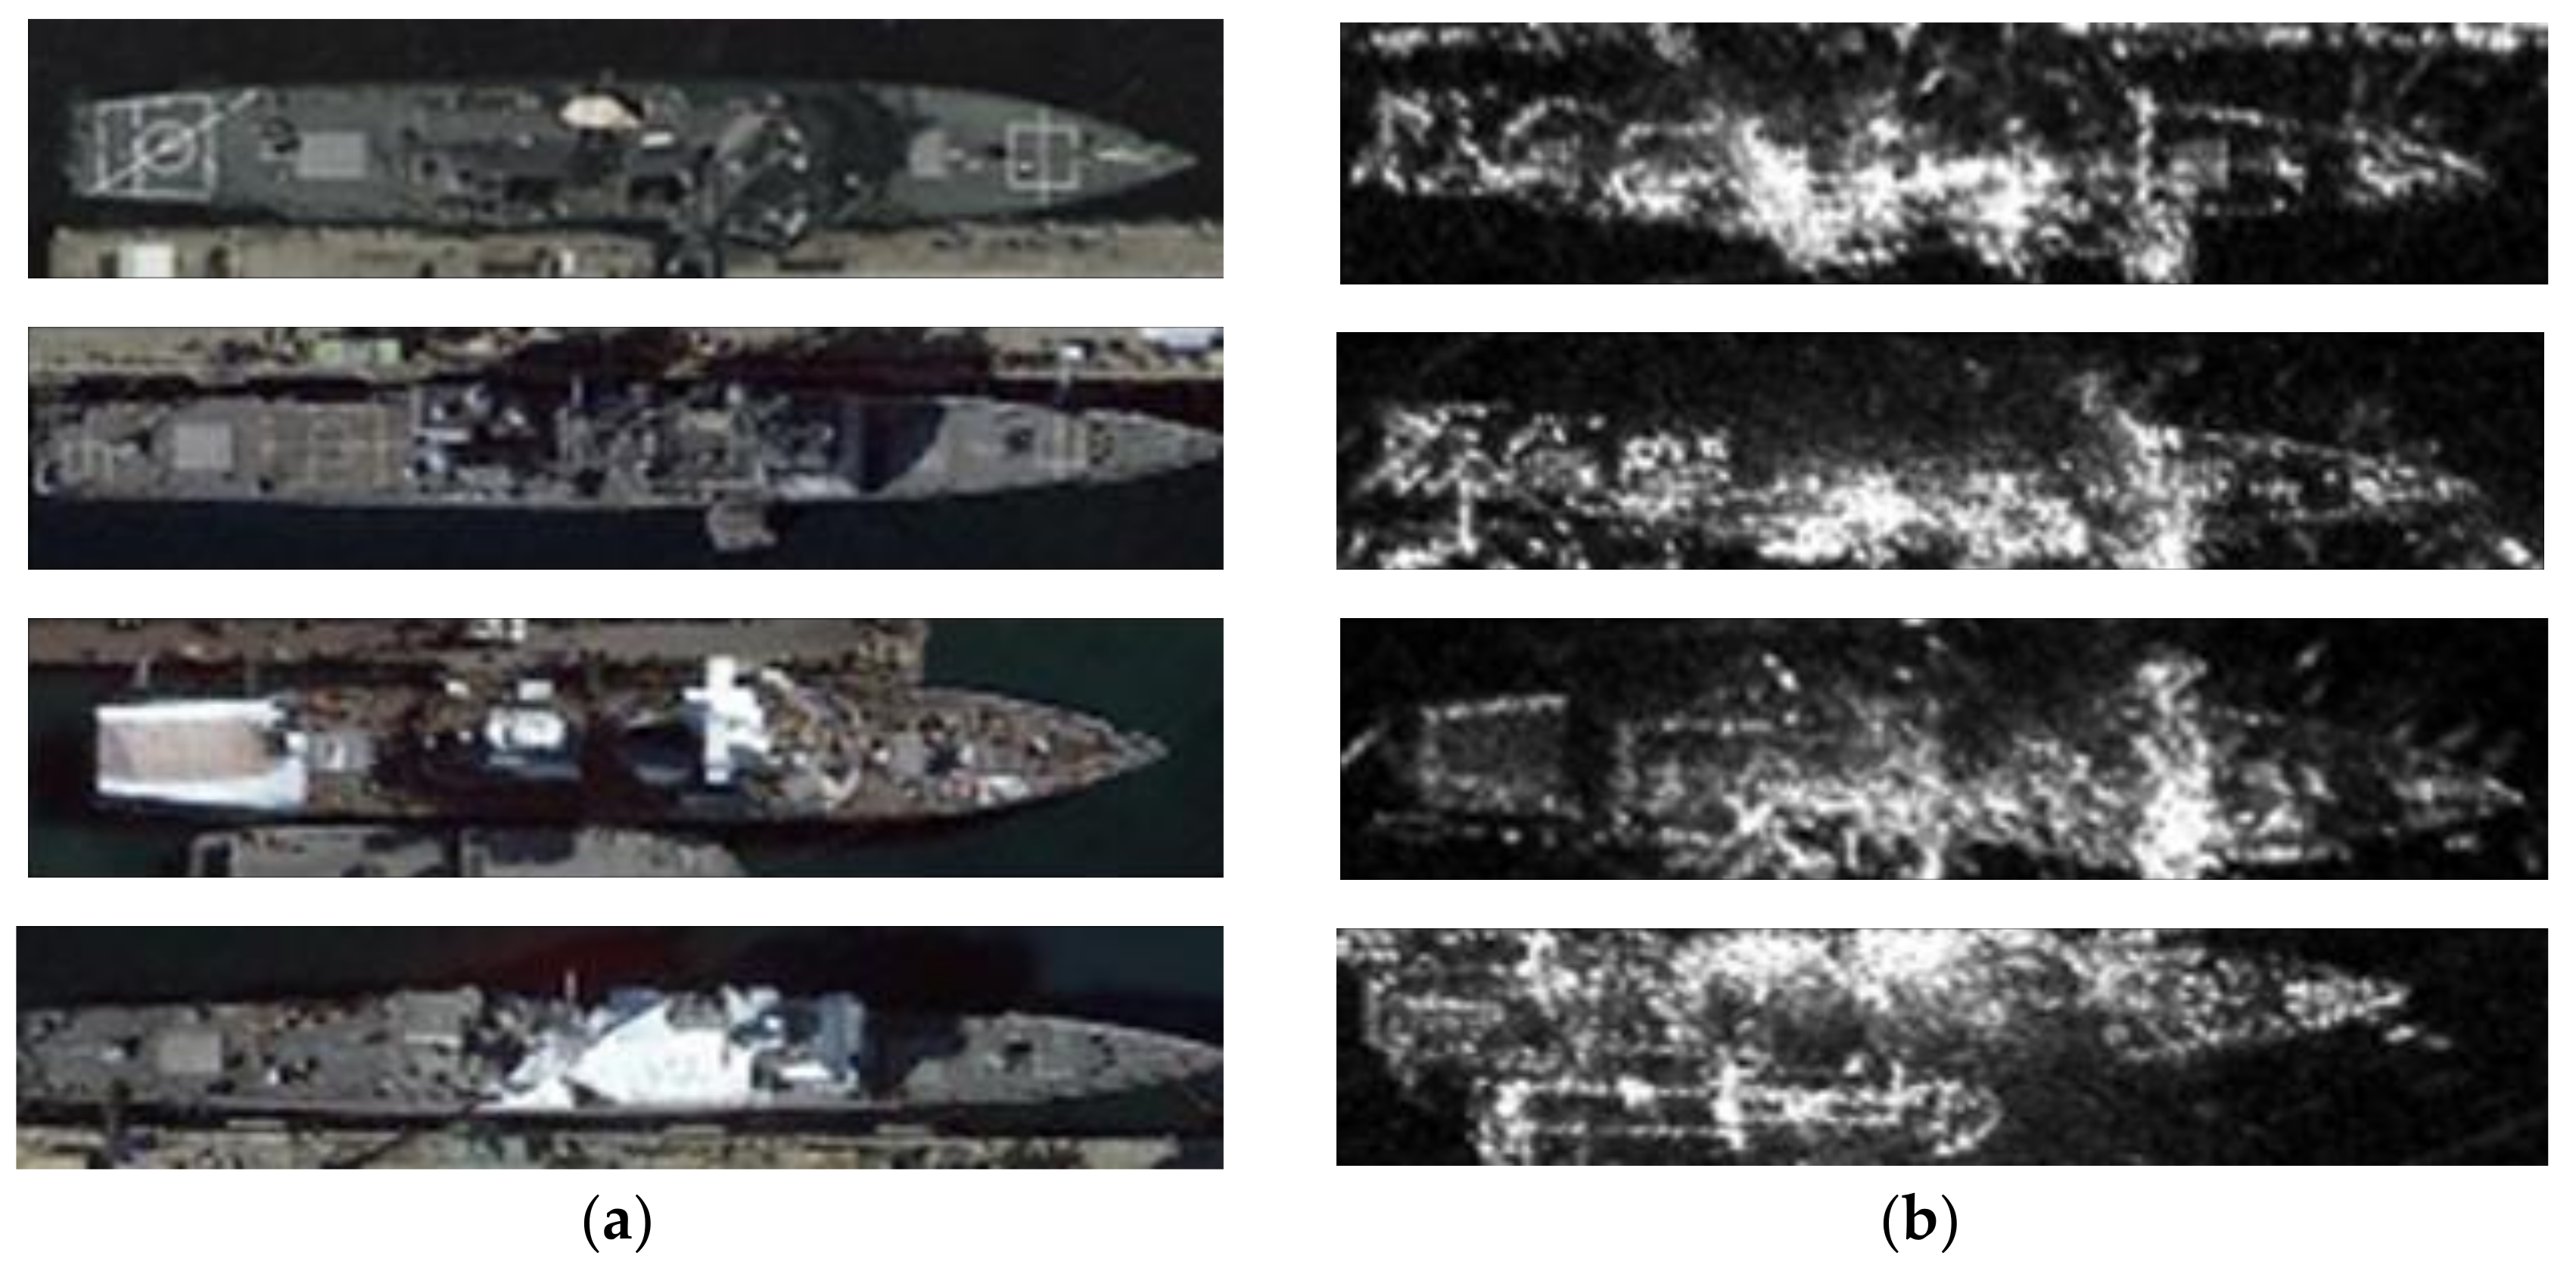
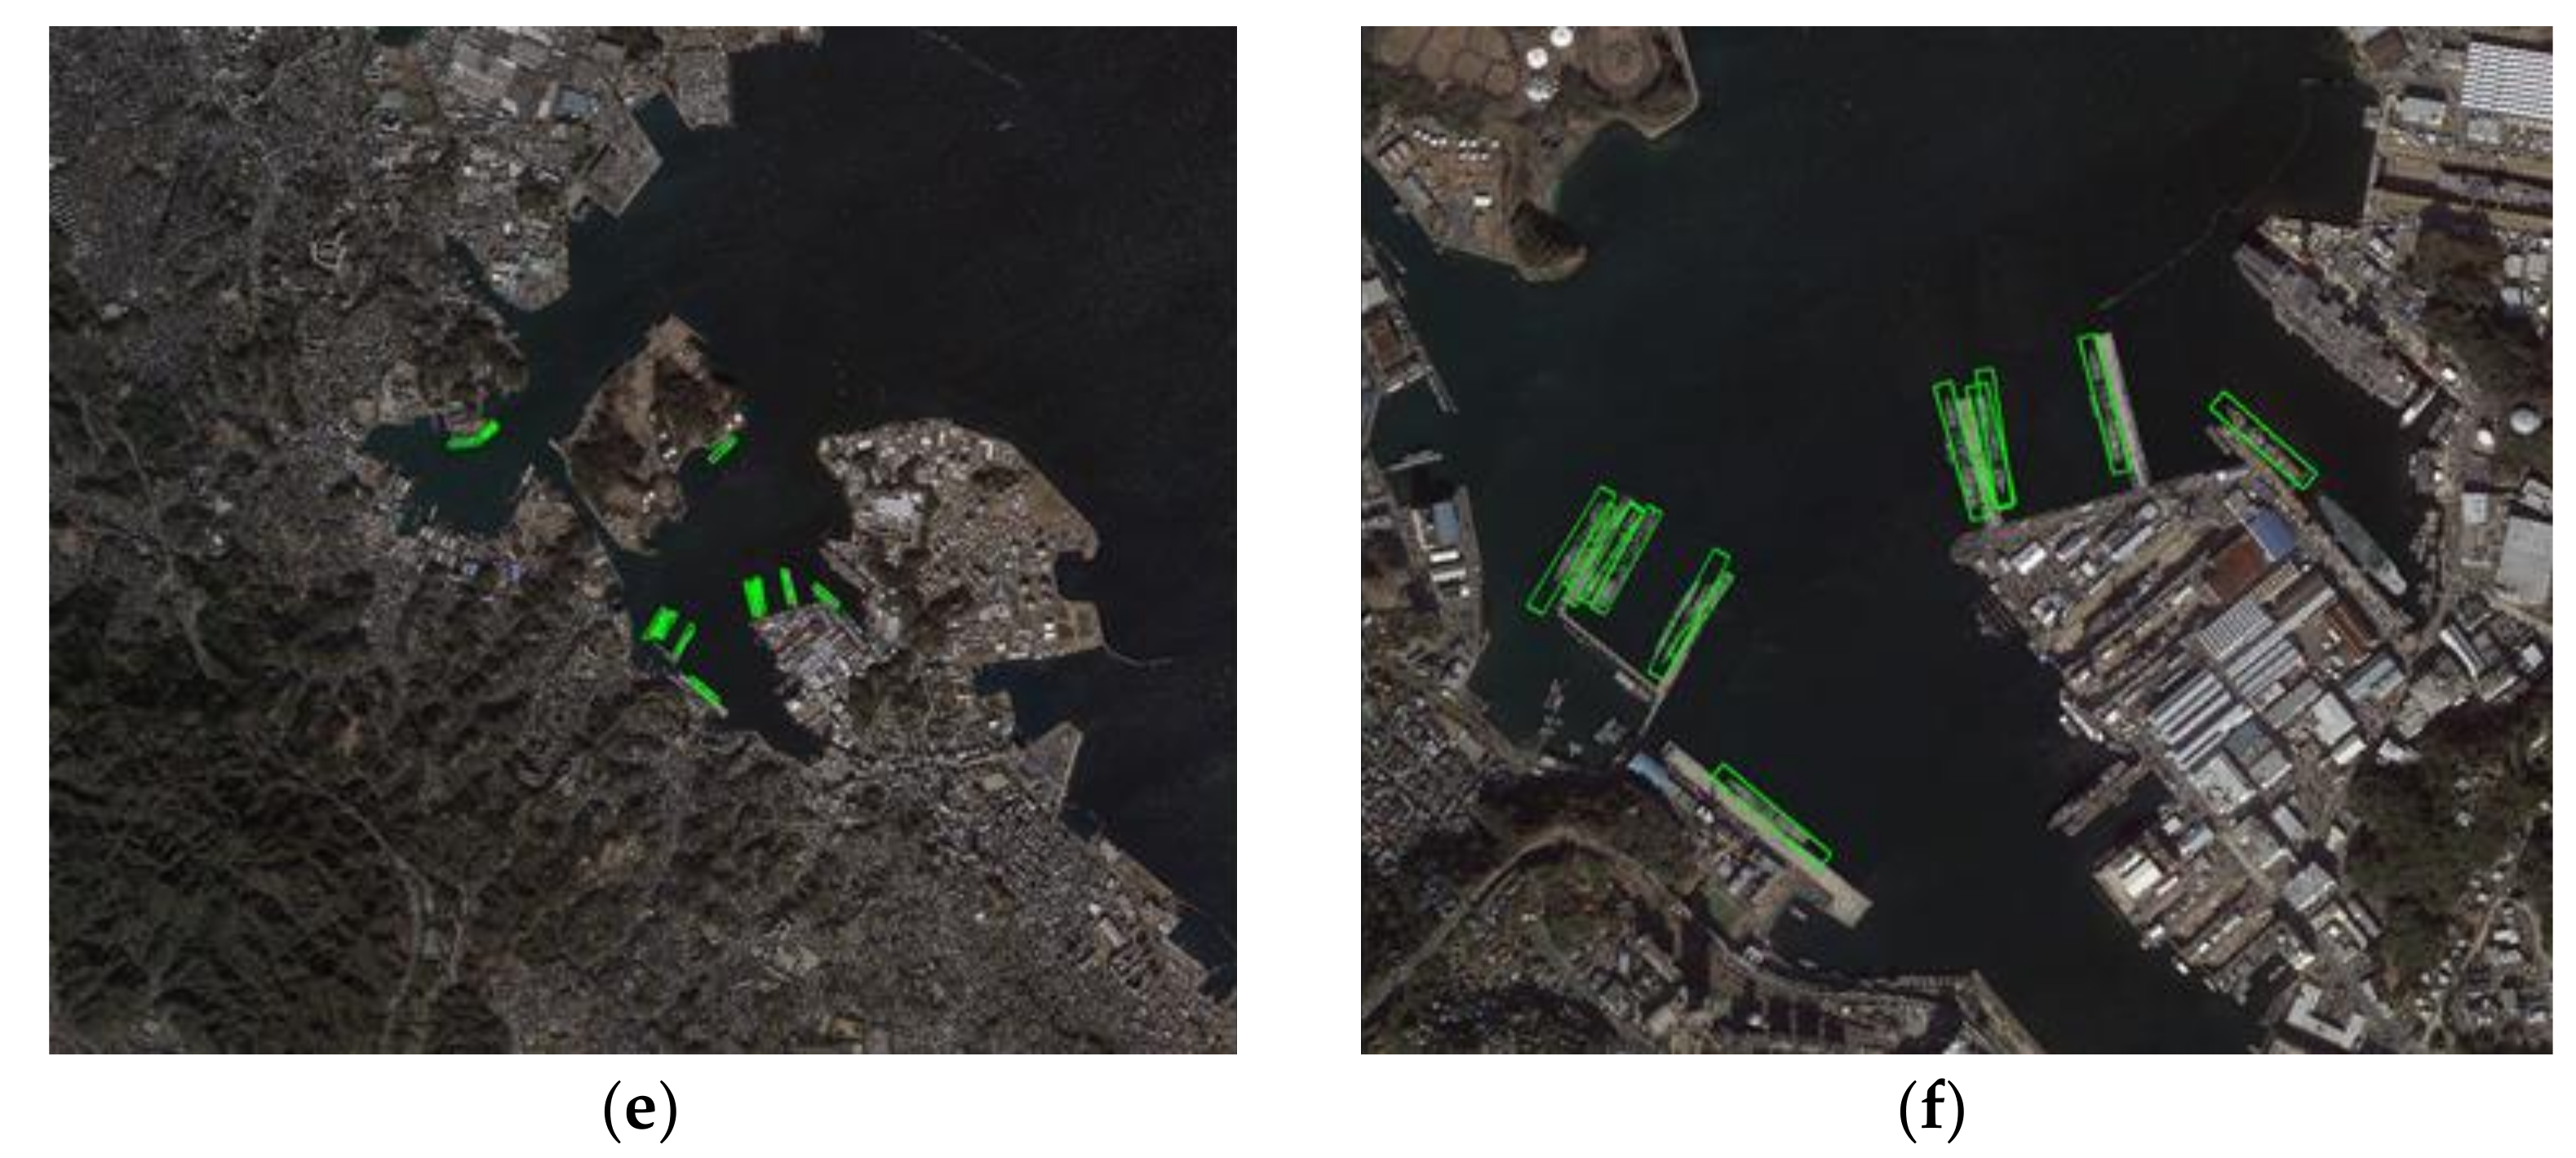
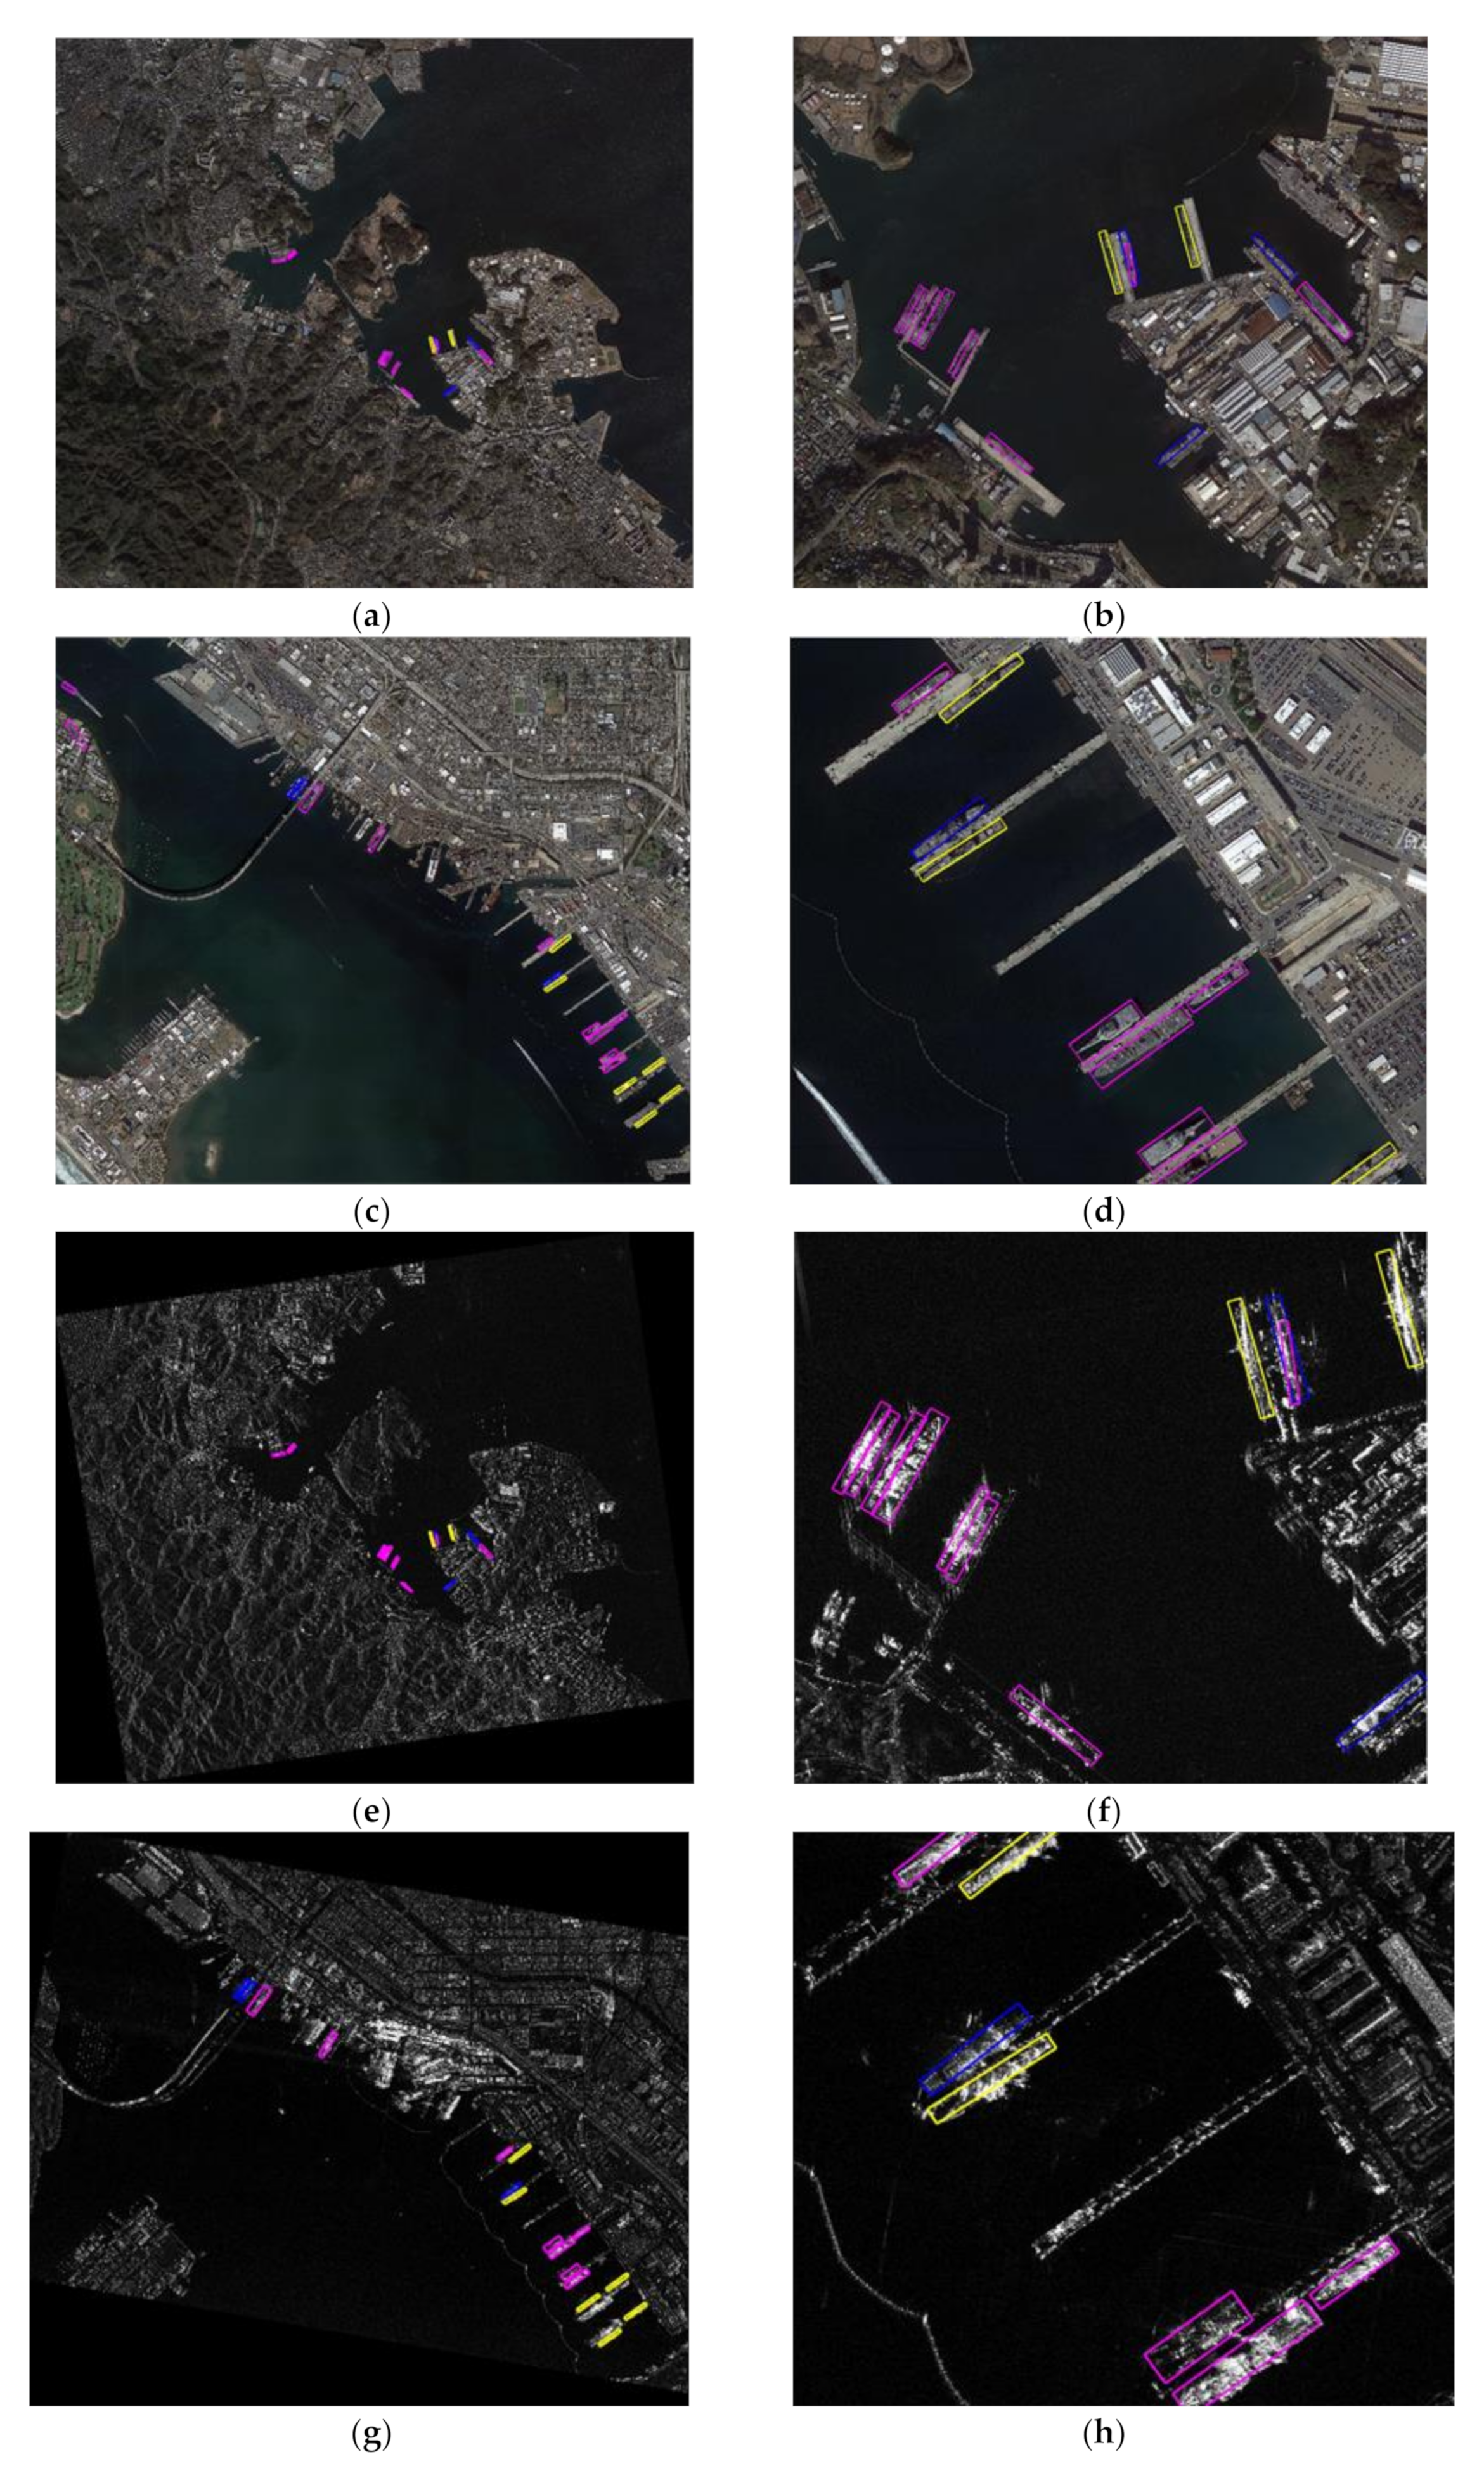
- Specifically, the bridge, turret and other parts of the ship target are made of metal and have rough surfaces, which have high backscattering characteristics and are shown as high brightness in SAR images (as shown in Figure 9b above). Compared with optical images (as shown in Figure 9a), SAR images can be used to locate ships better (as shown in Figure 9e). Therefore, non-maximum suppression is performed on SAR images directly, and the obtained local maximum is used to represent the metal objects with rough surfaces, such as the bridge and turret of the ship, so the significance points located inside the ship are obtained (as shown in Figure 9f).
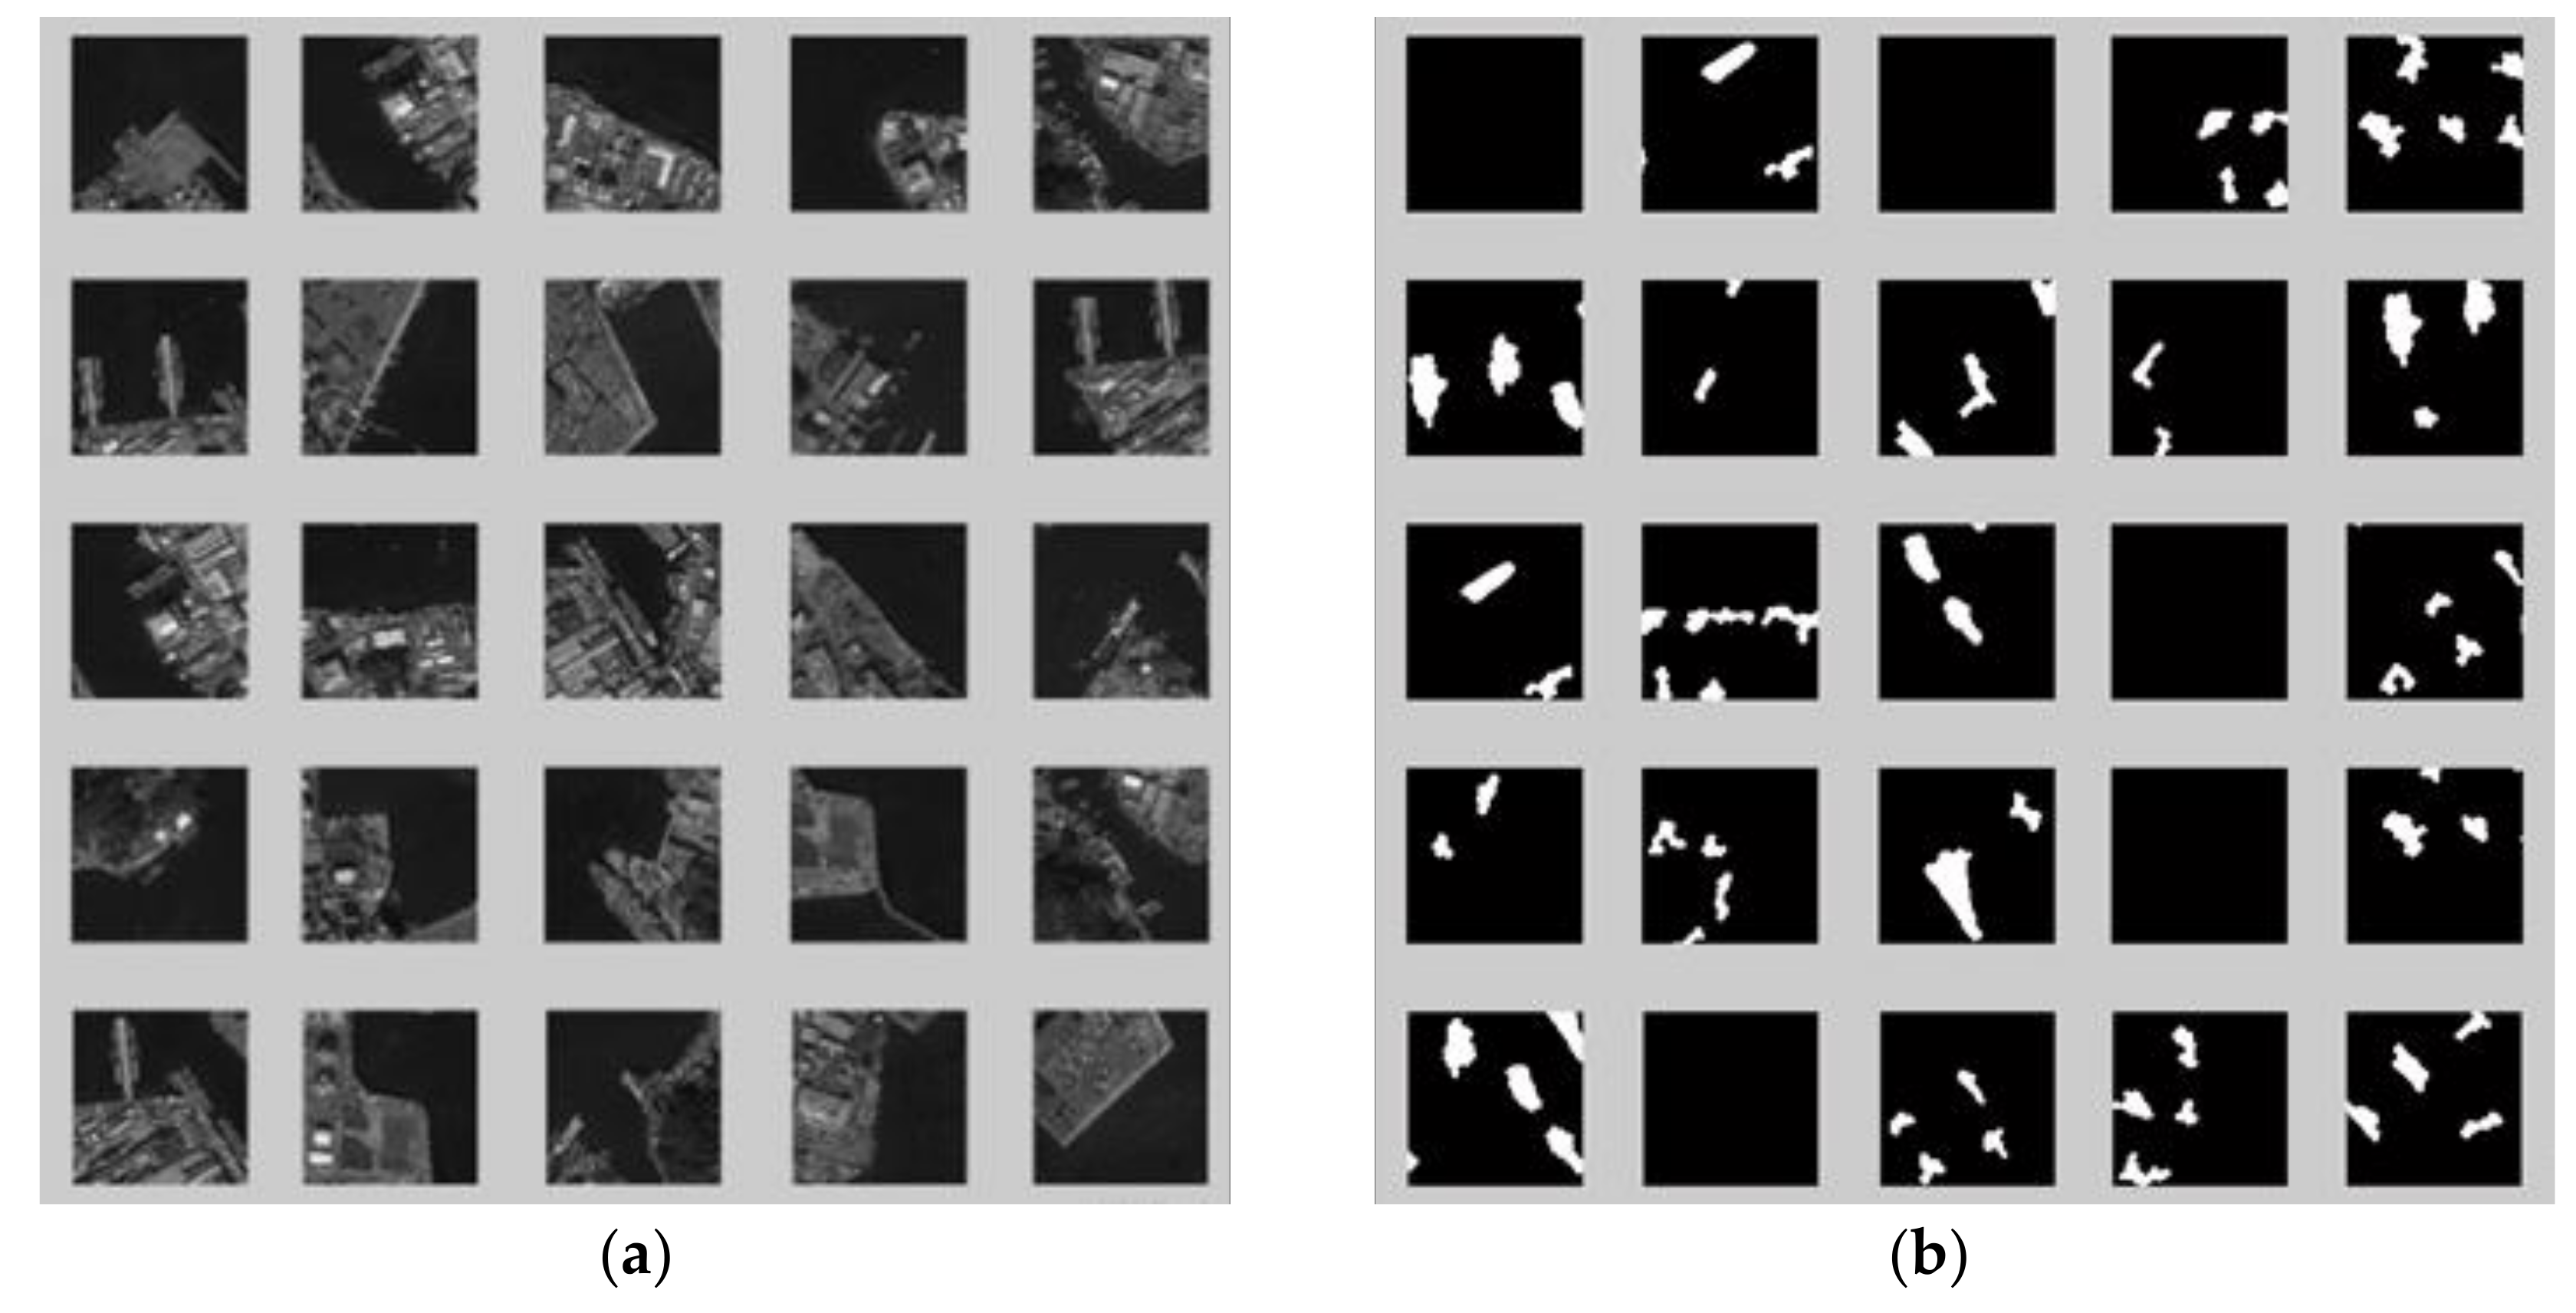
- (2)
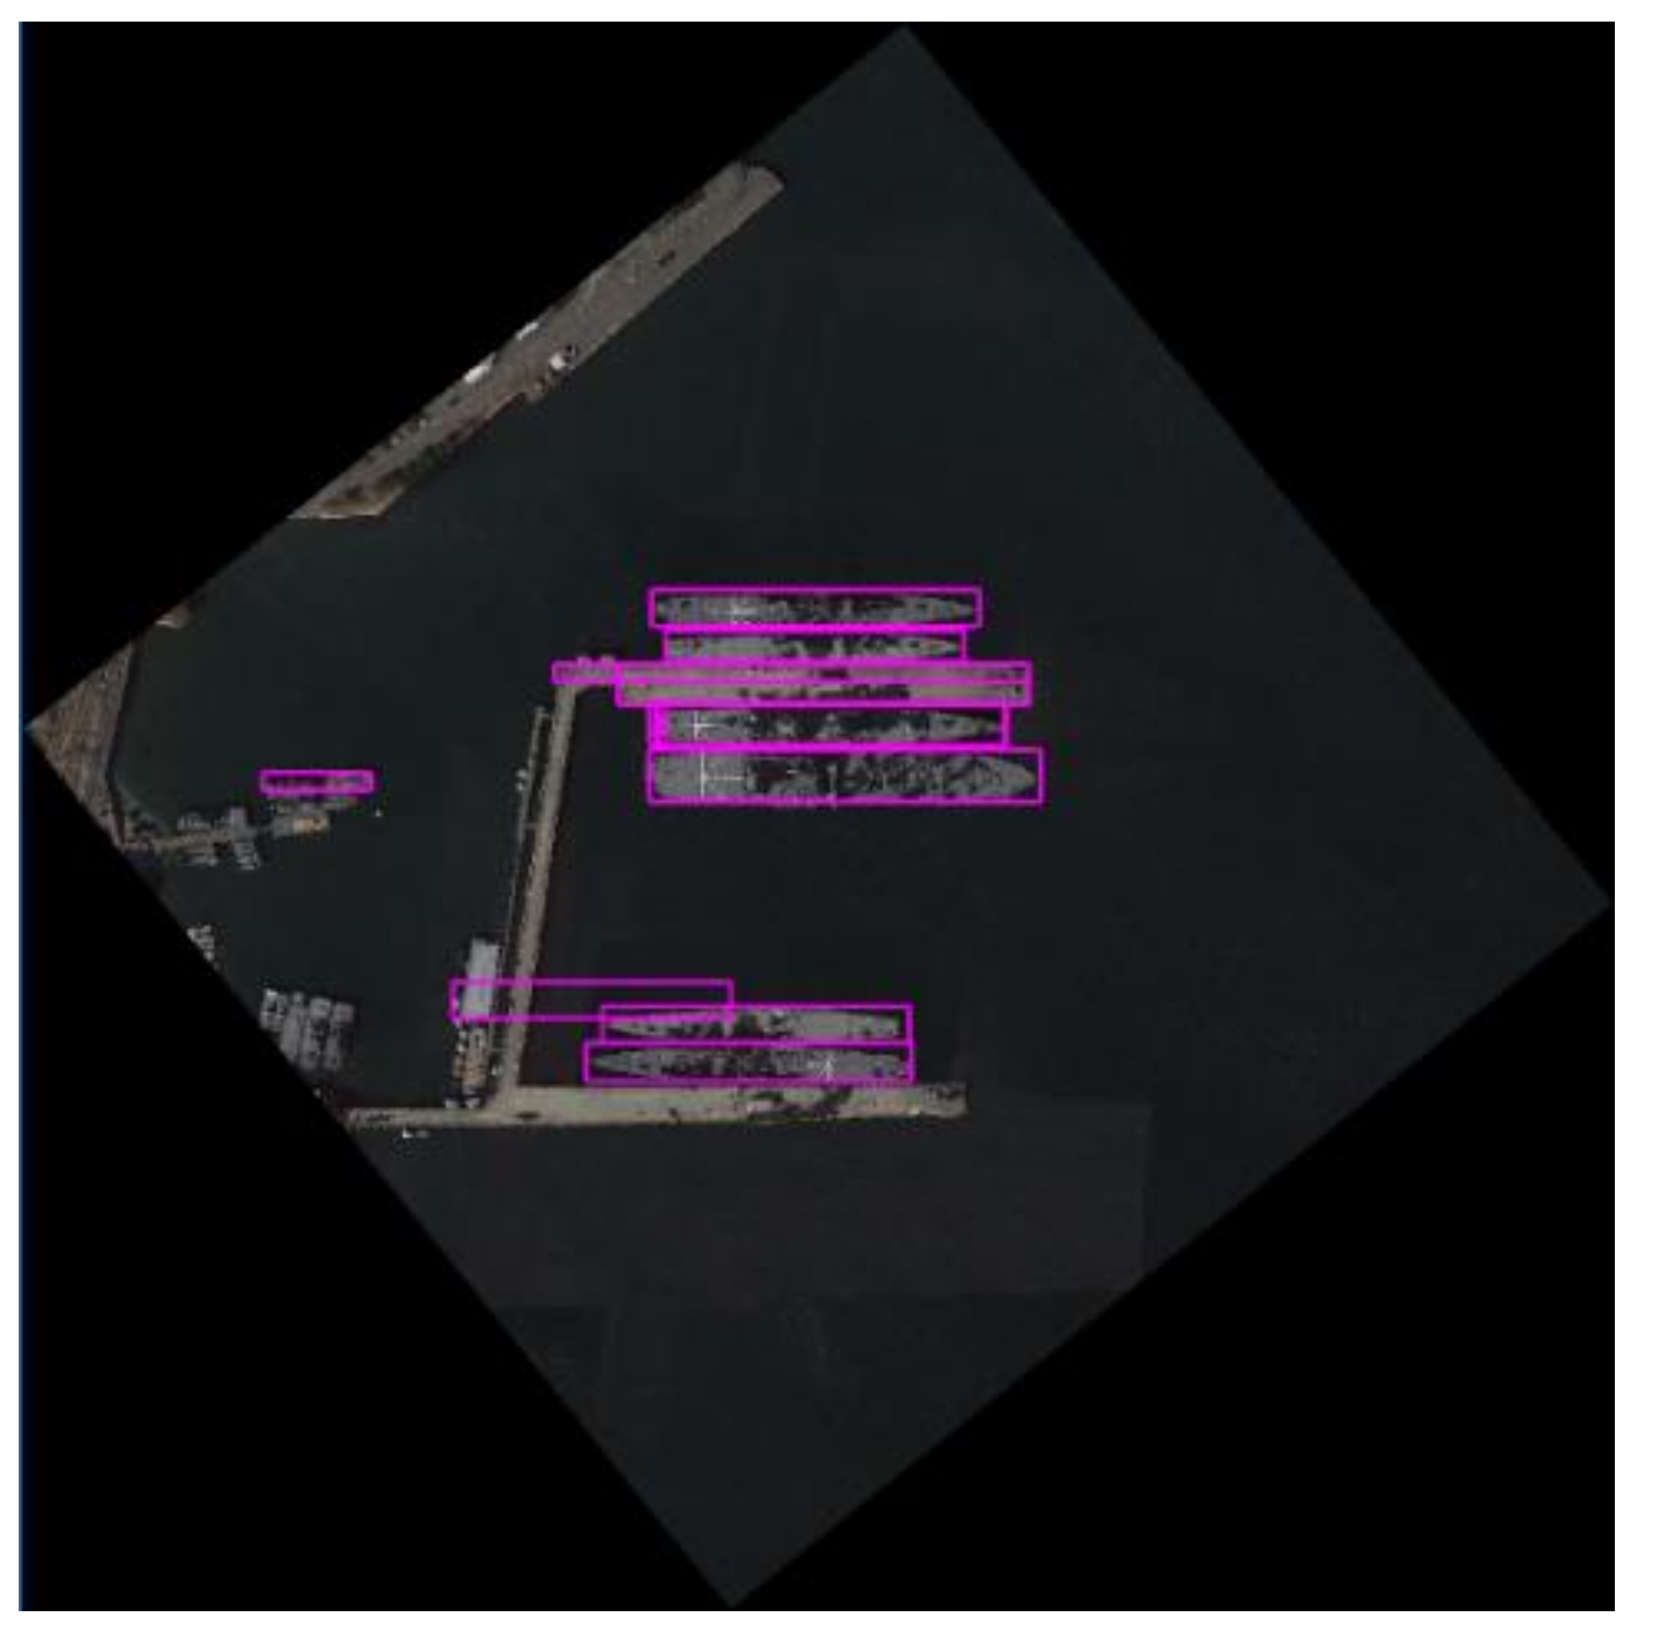
- The saliency points located inside the ships are used to determine the minimum bounding rectangle of each ship. Since the previous berthing area detection has rotated the regional image to the level of the ship target, it only needs to determine the length and width of the ship.
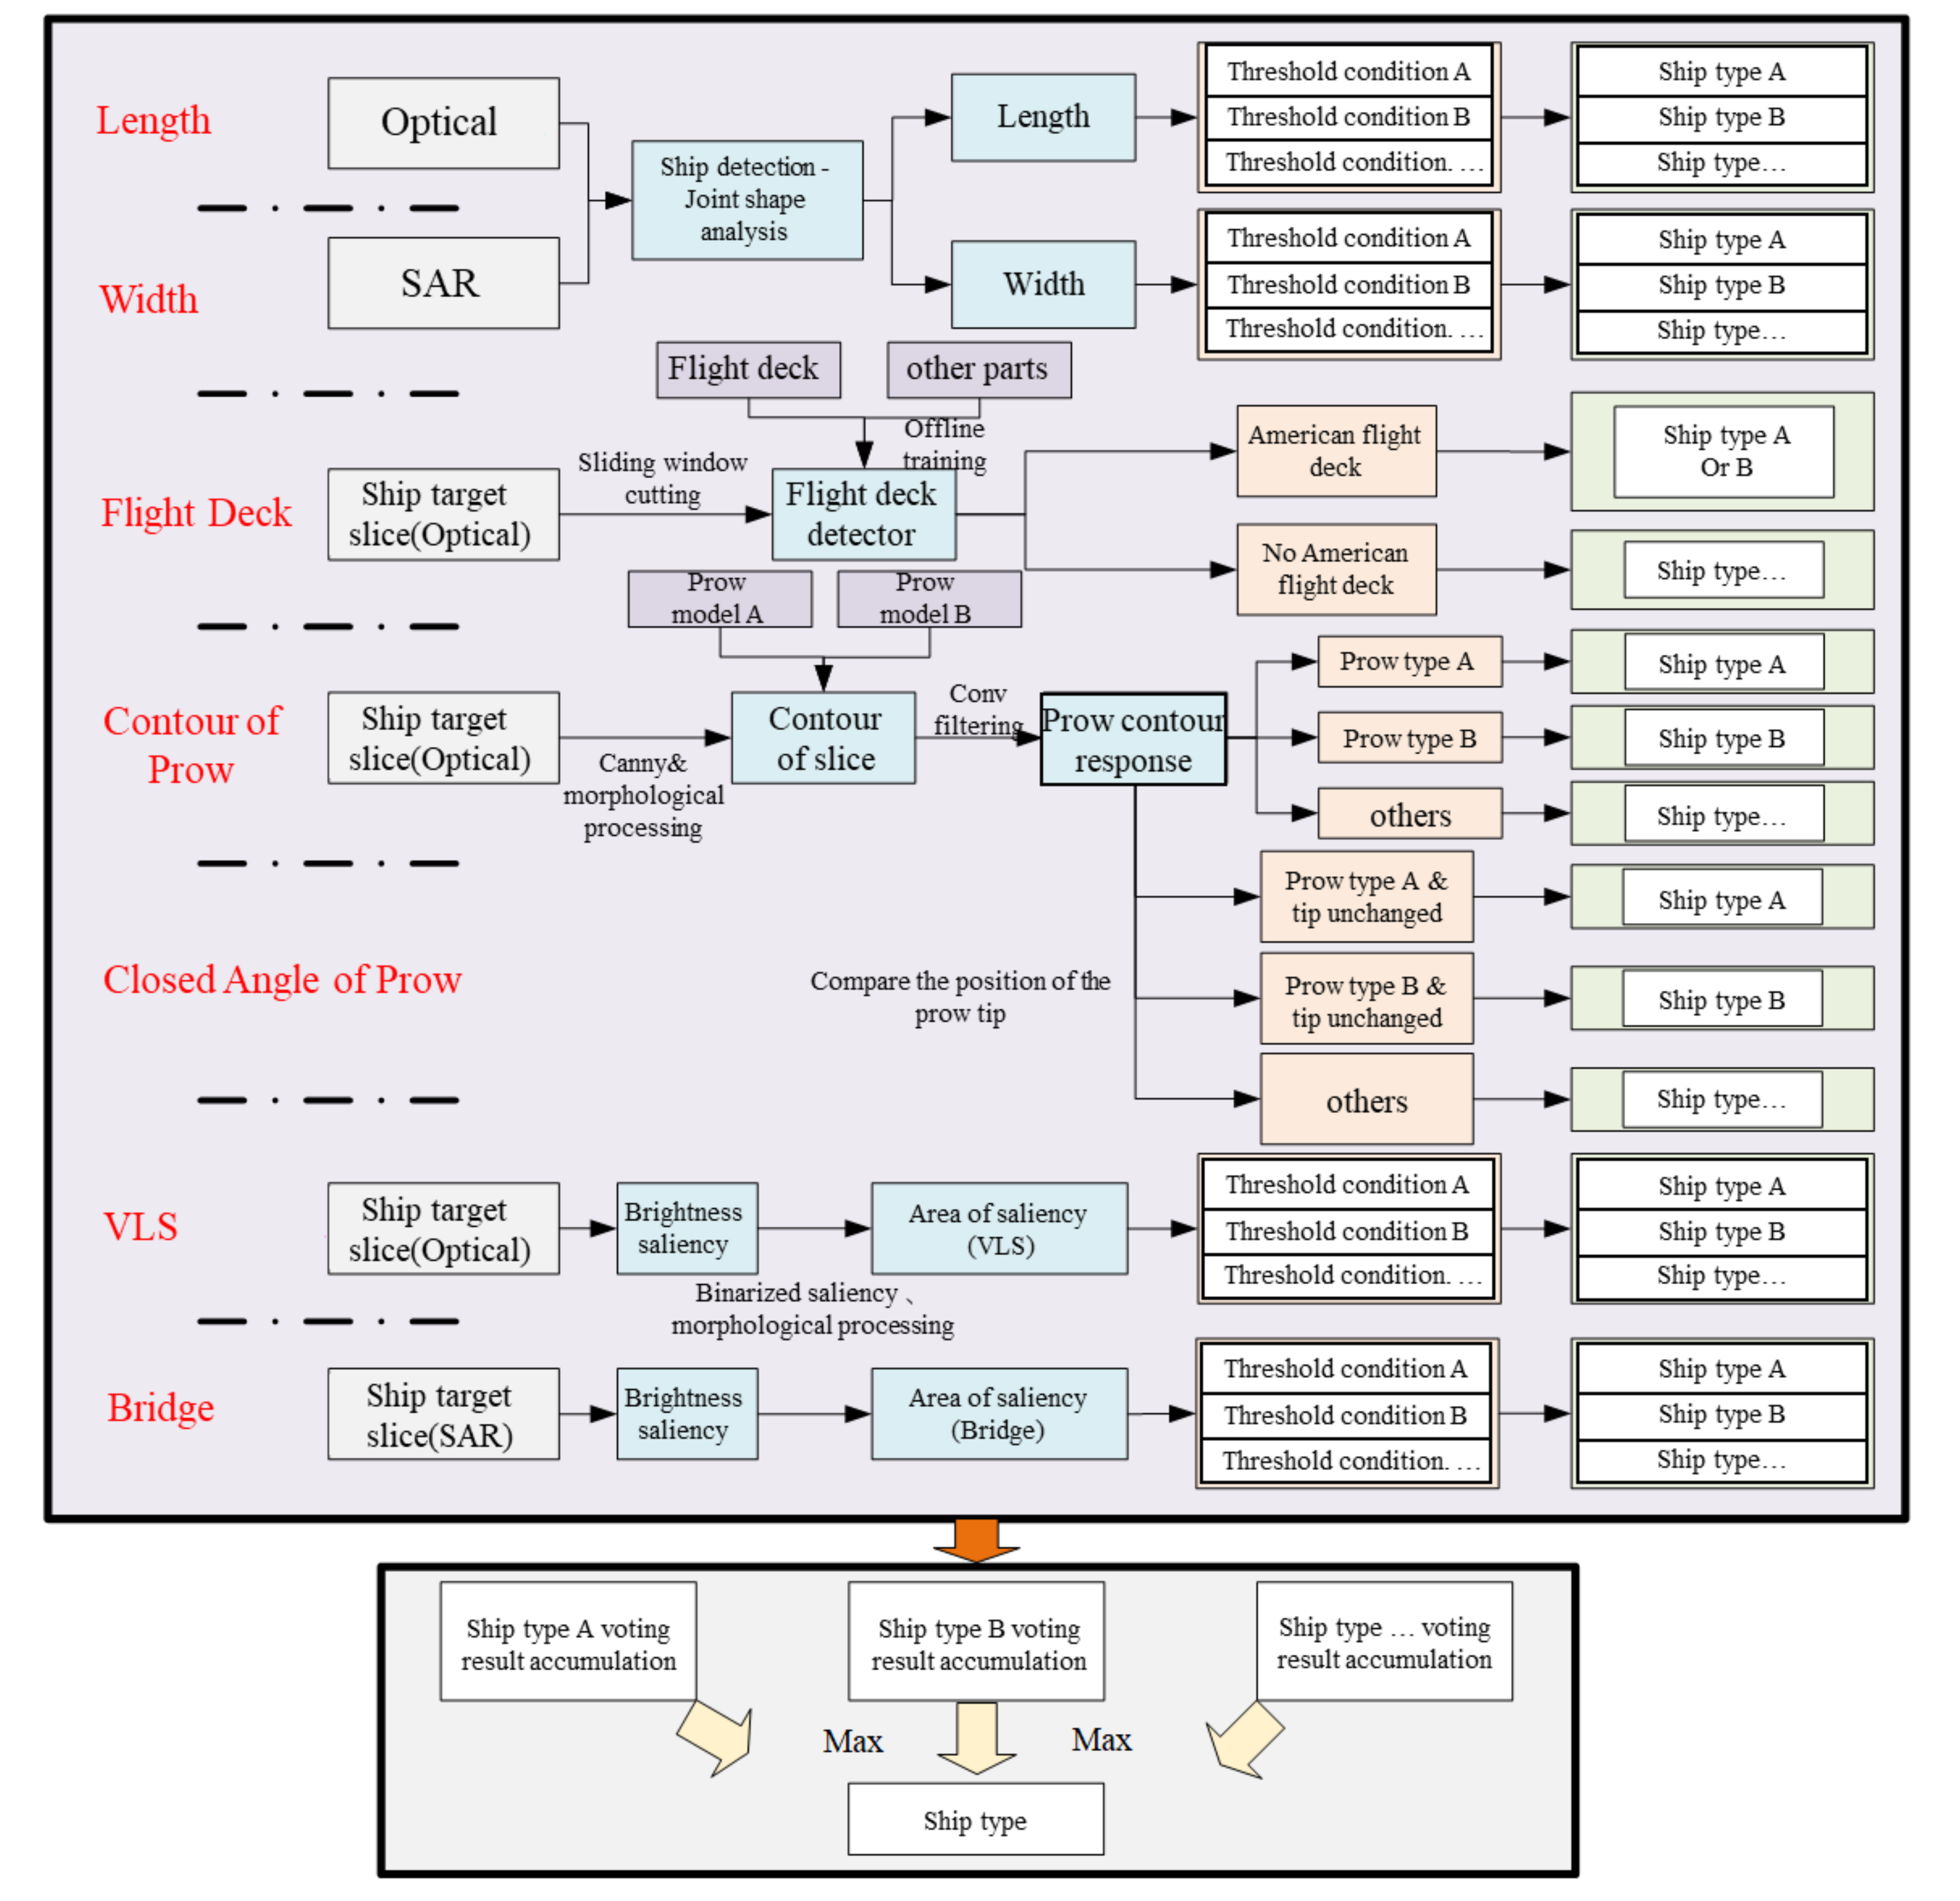
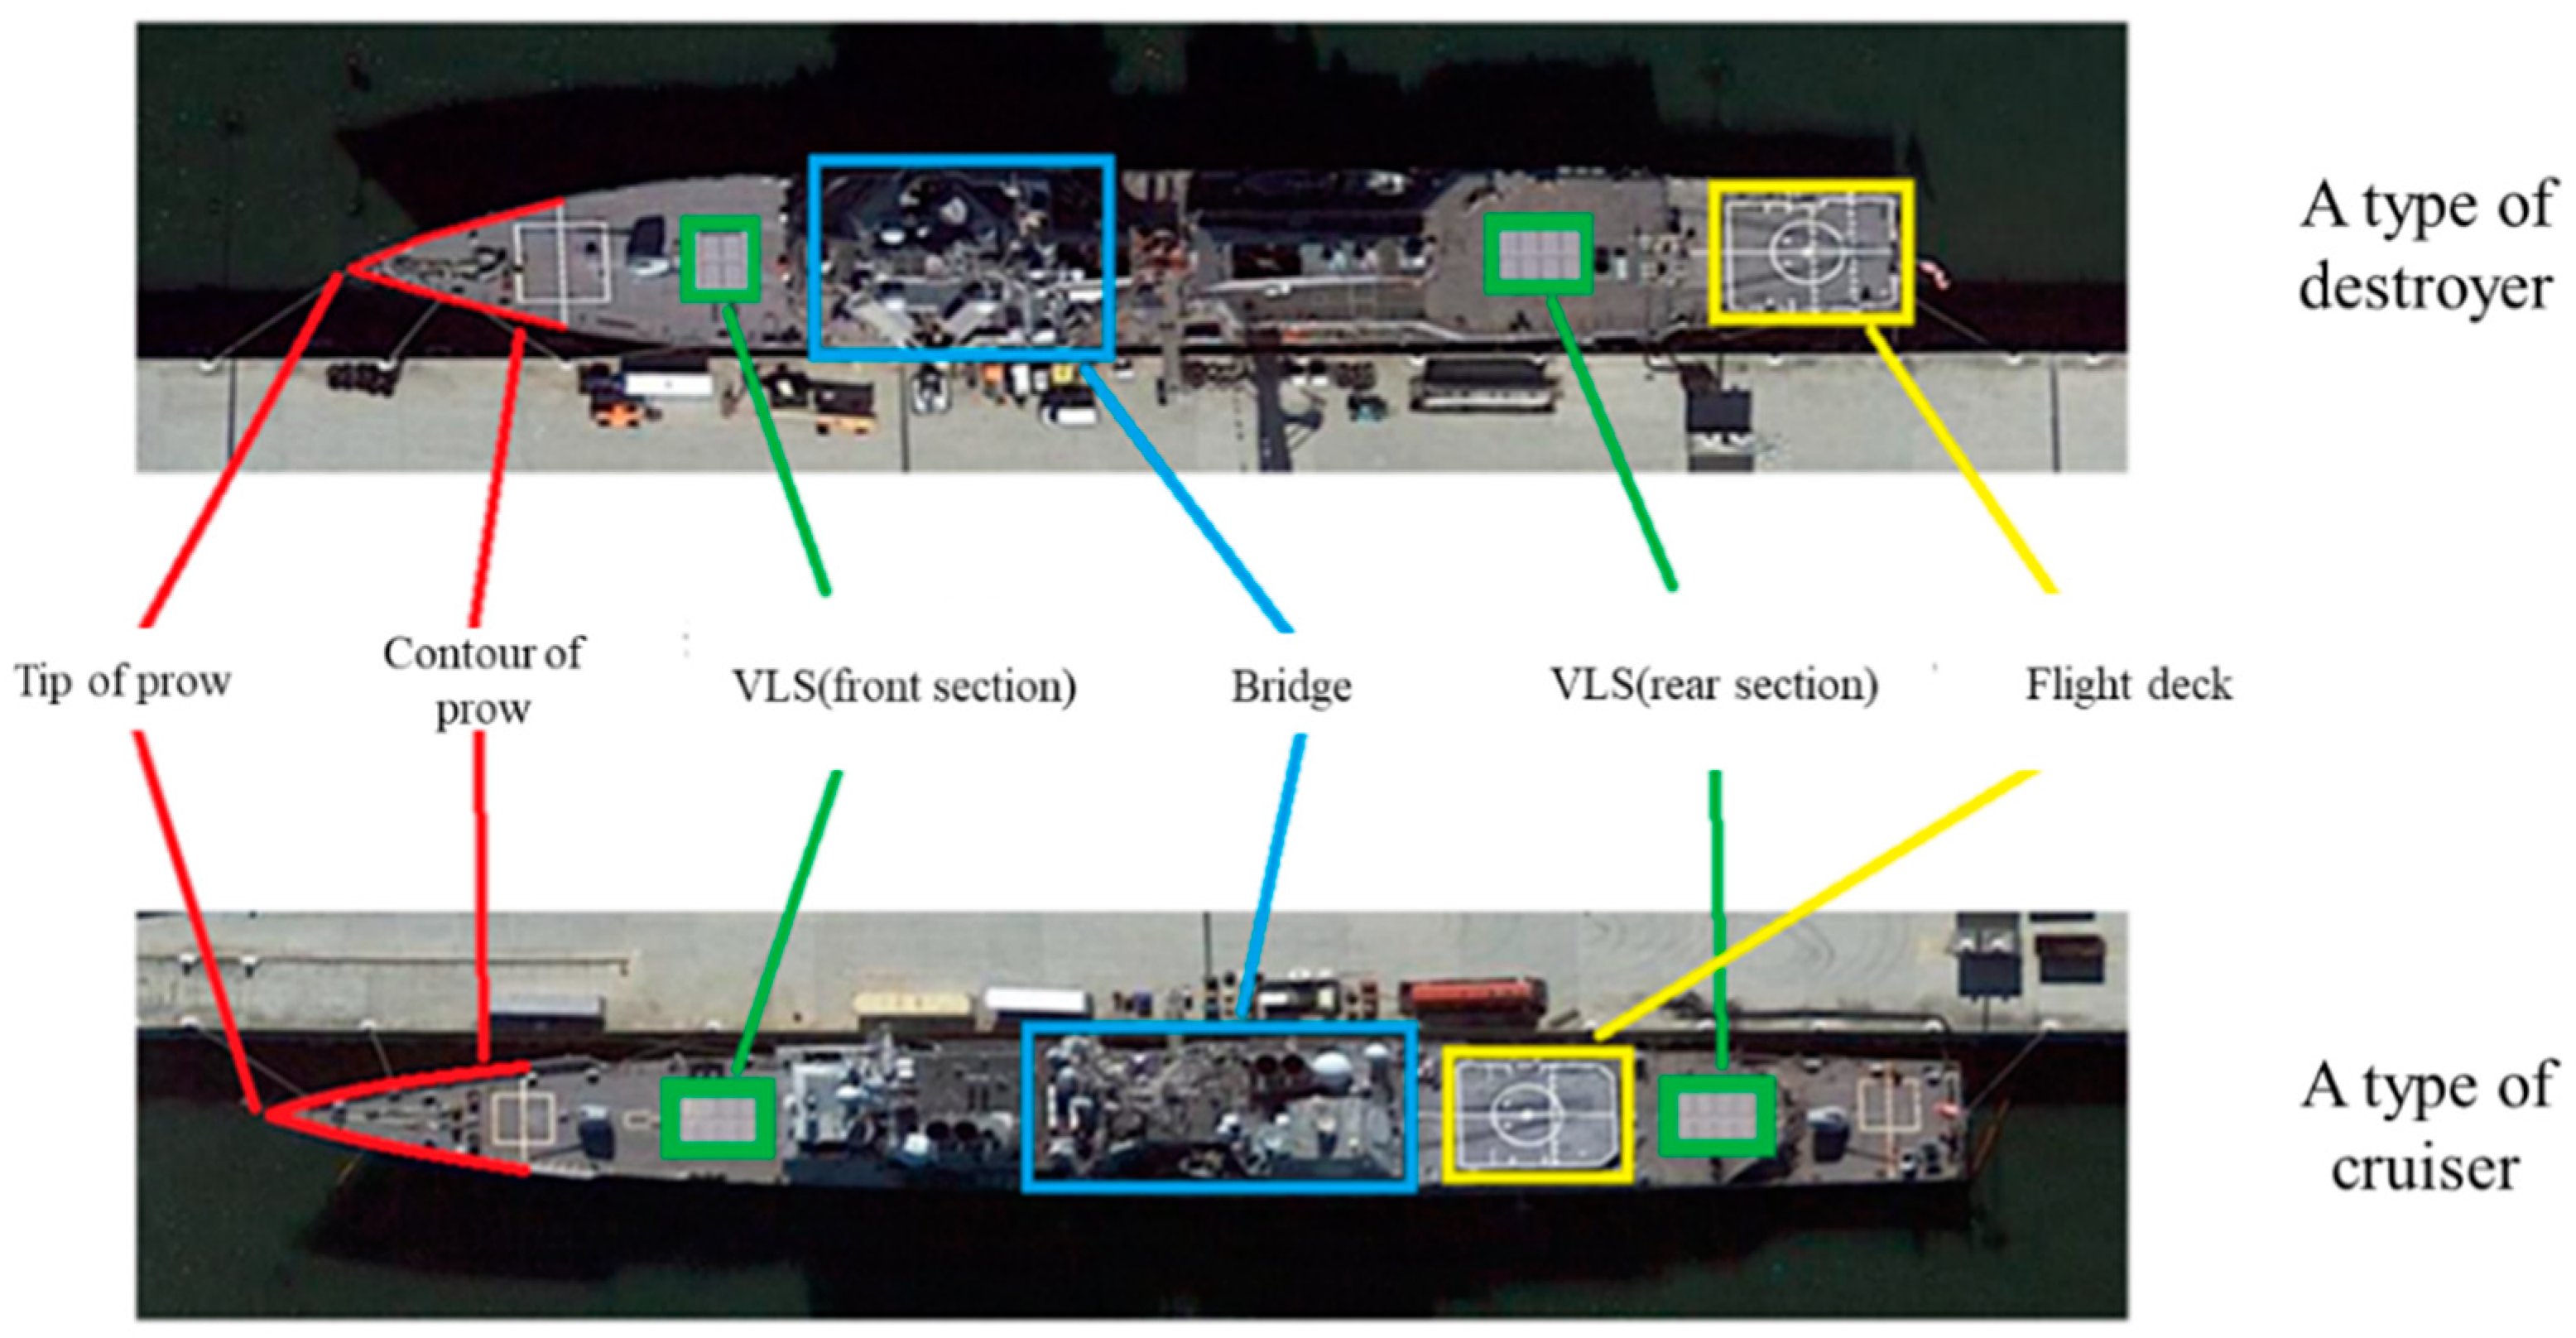
2.3. Ship Target Recognition Based on Multi-Source Remote Sensing Images
- (1)
- Ship part (flight deck) detection based on feature point matching.
- (2)
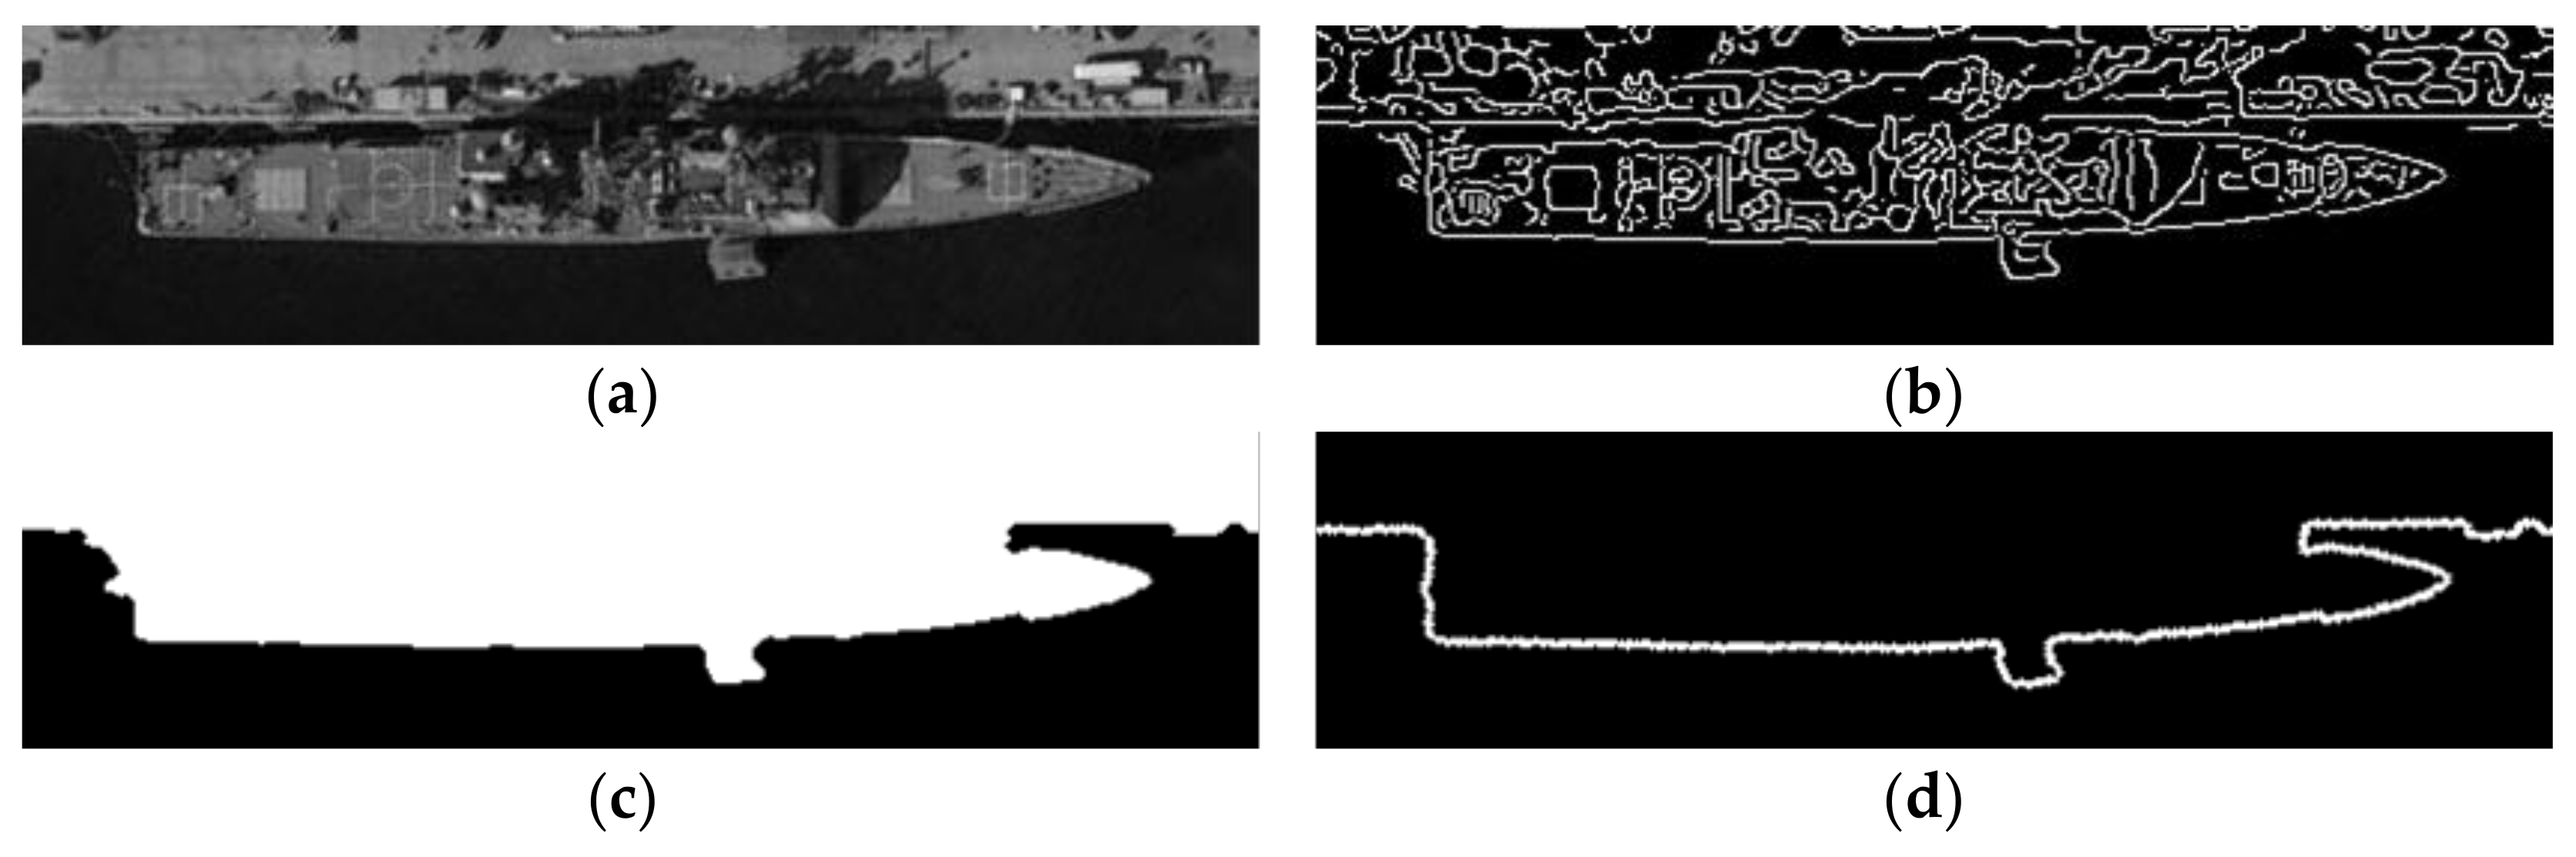
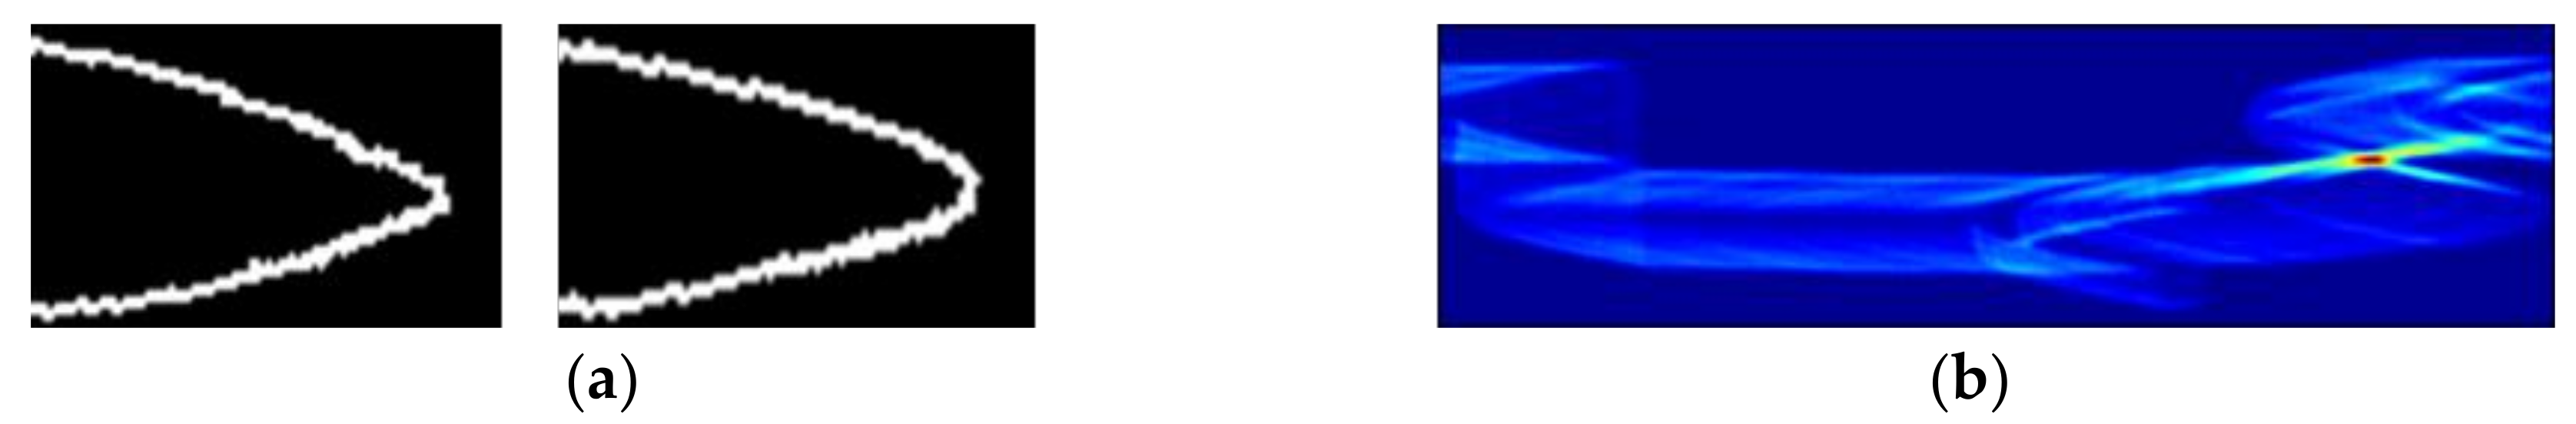
- Ship part (prow) detection based on contour extraction.
- (3)
- Ship part (bridge) detection based on brightness saliency.
- (4)
- Ship target model recognition based on position detection results voting.
3. Experimental Results and Analysis
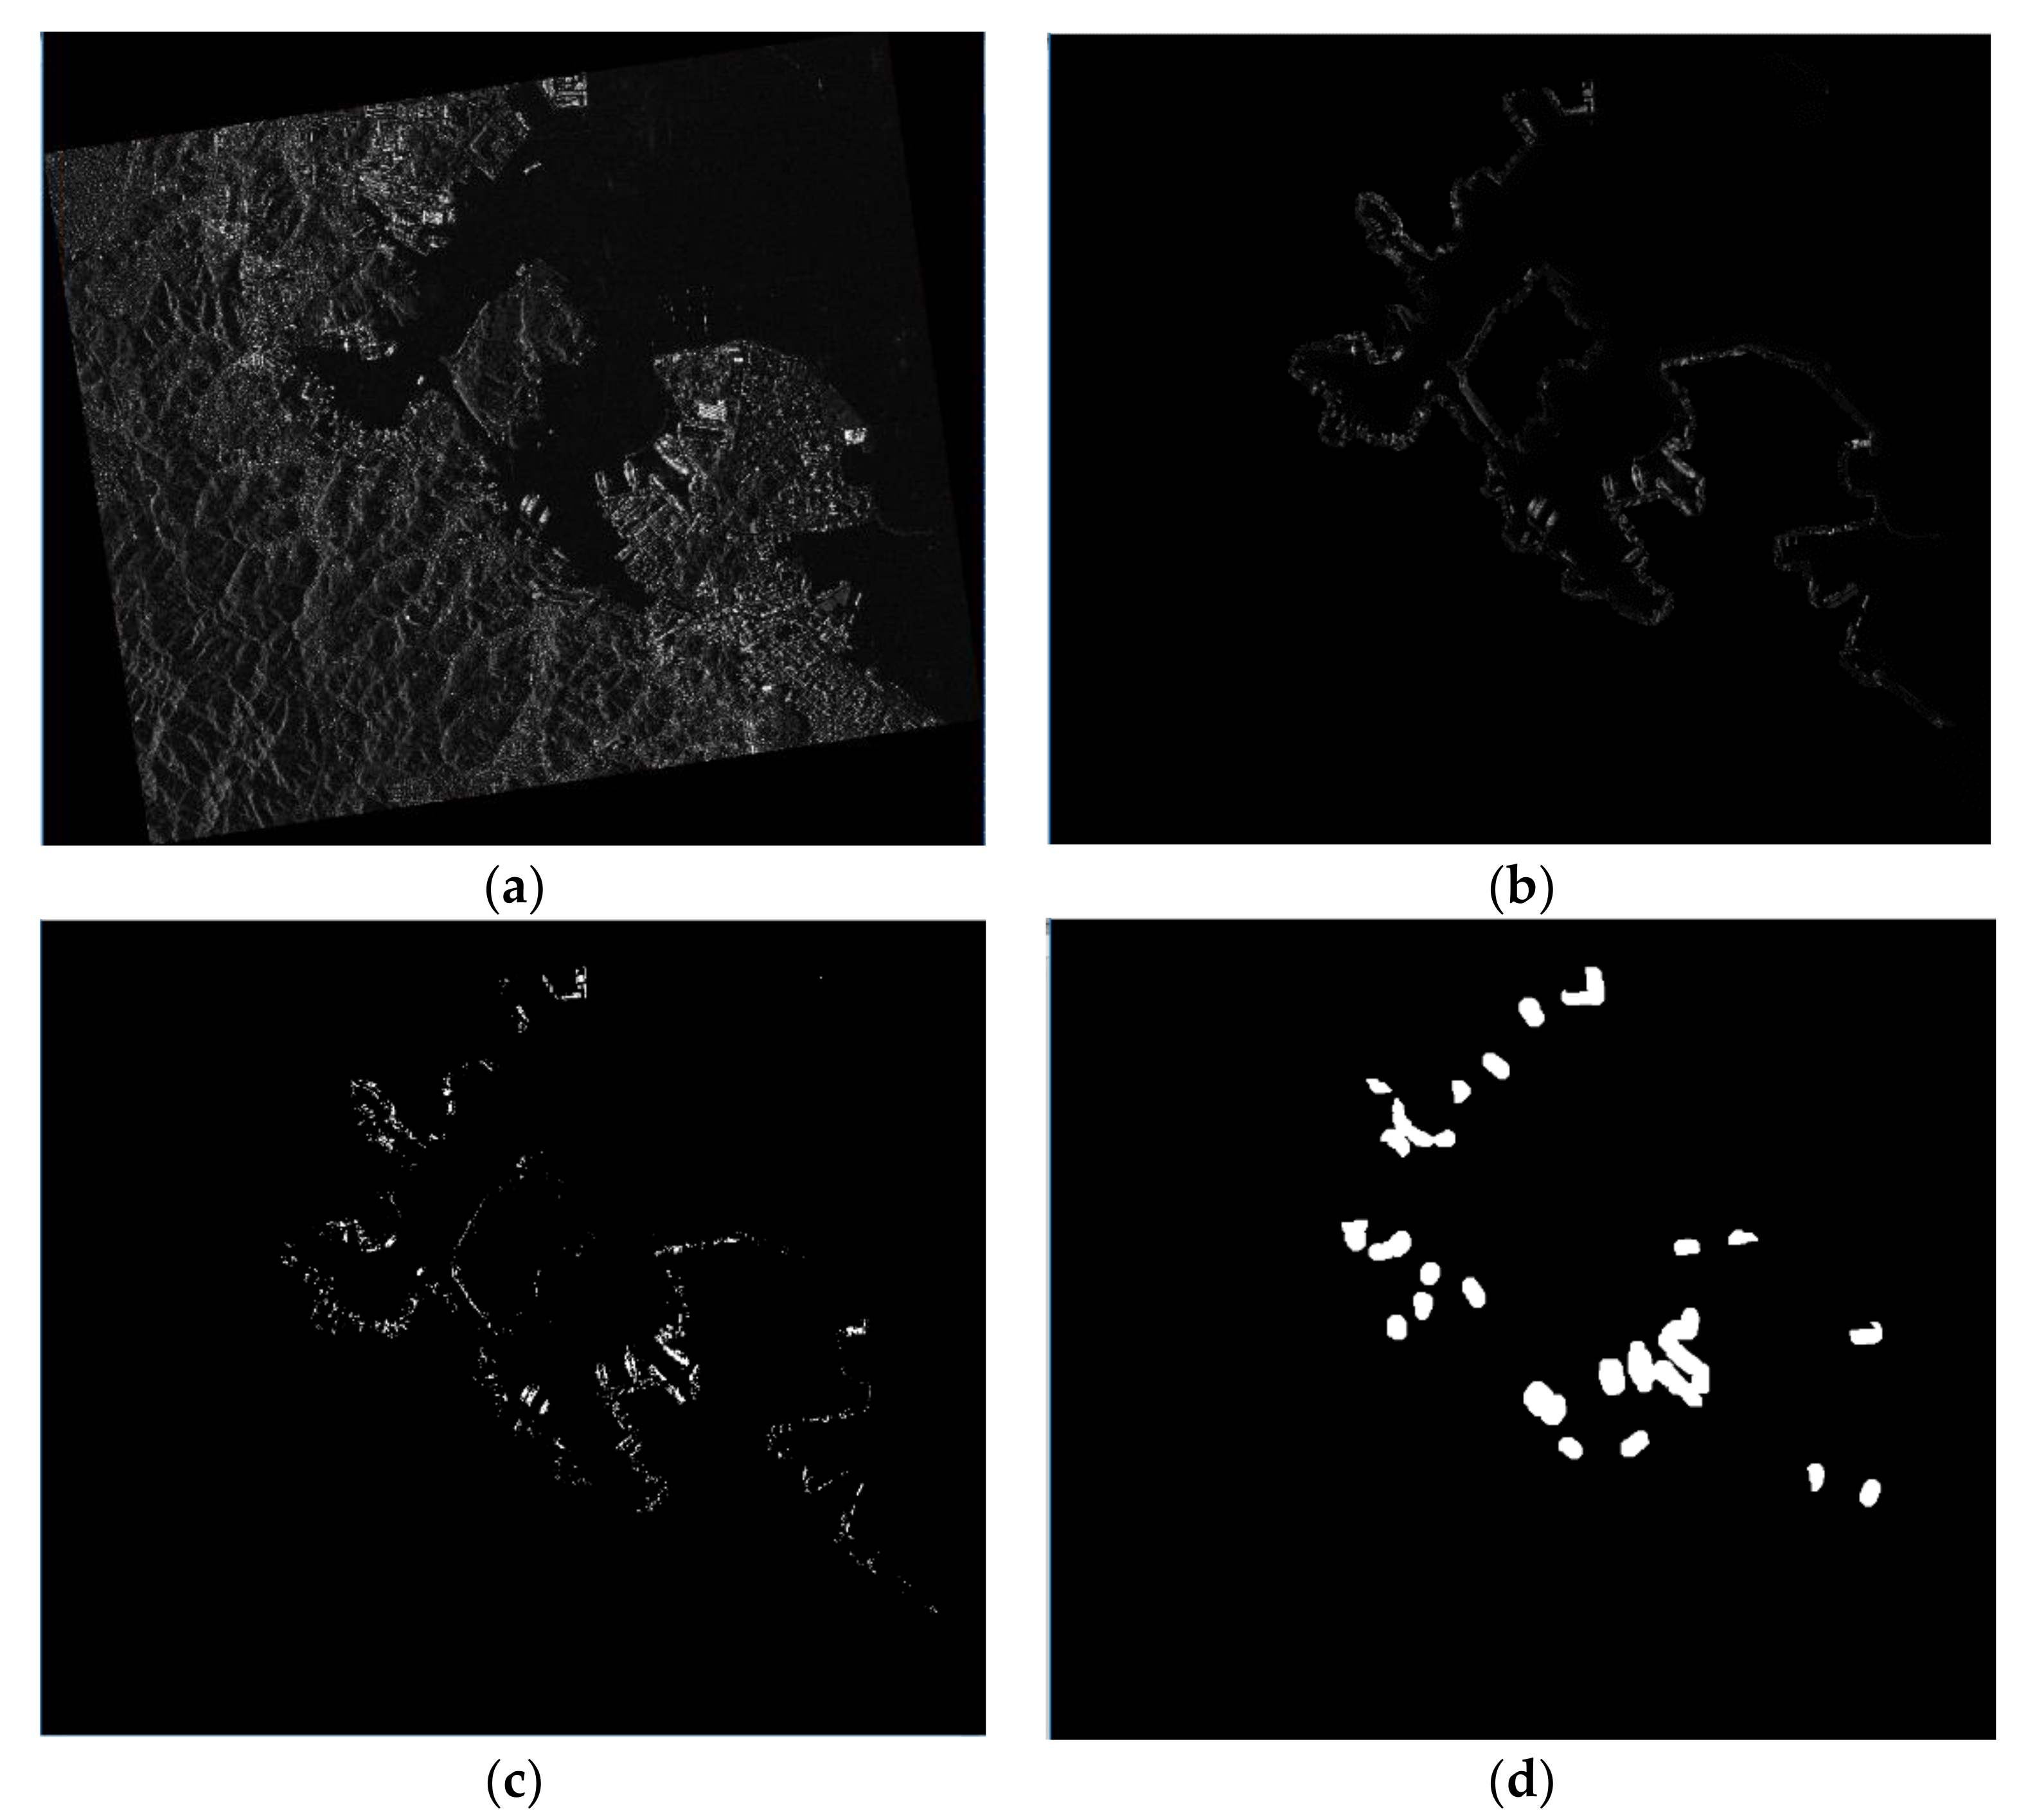
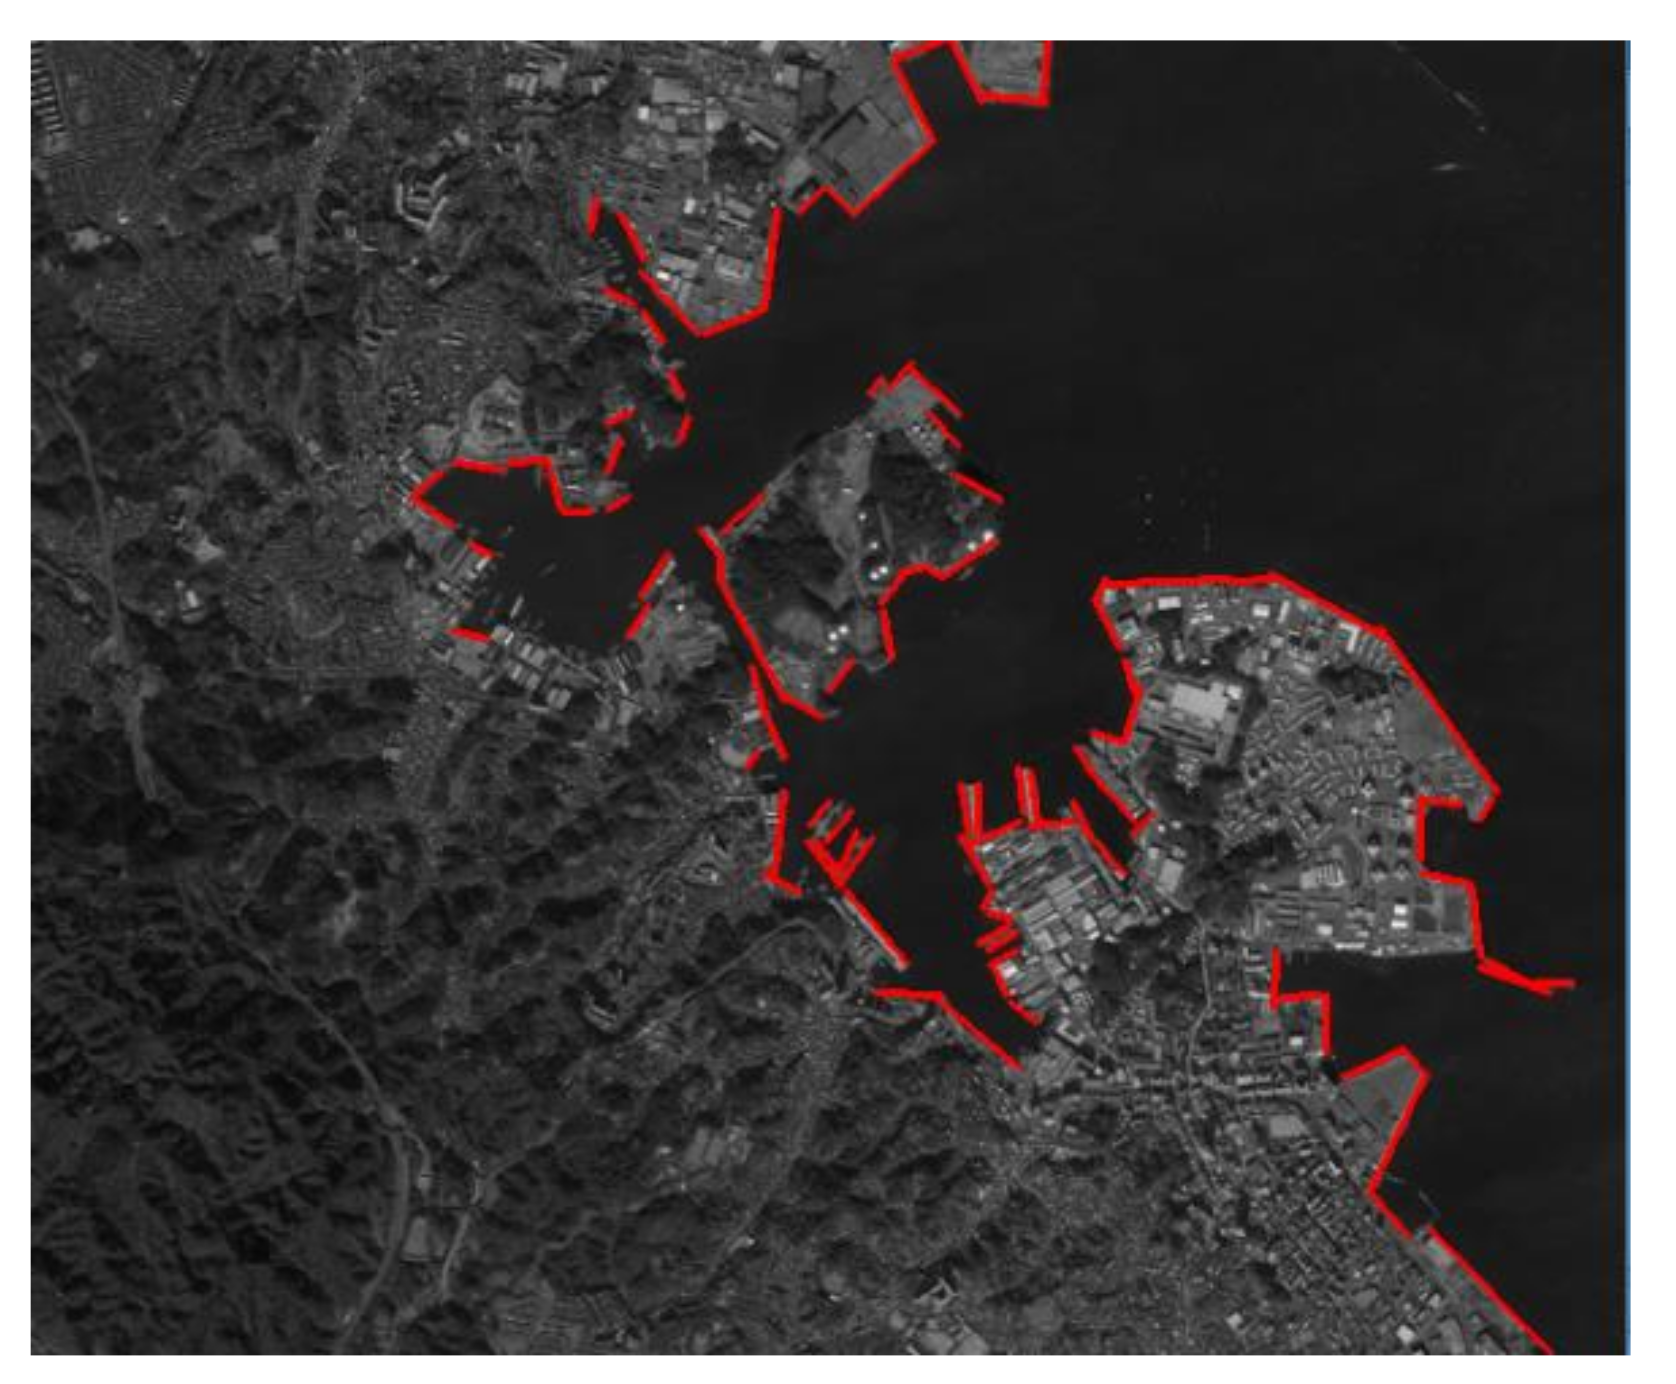
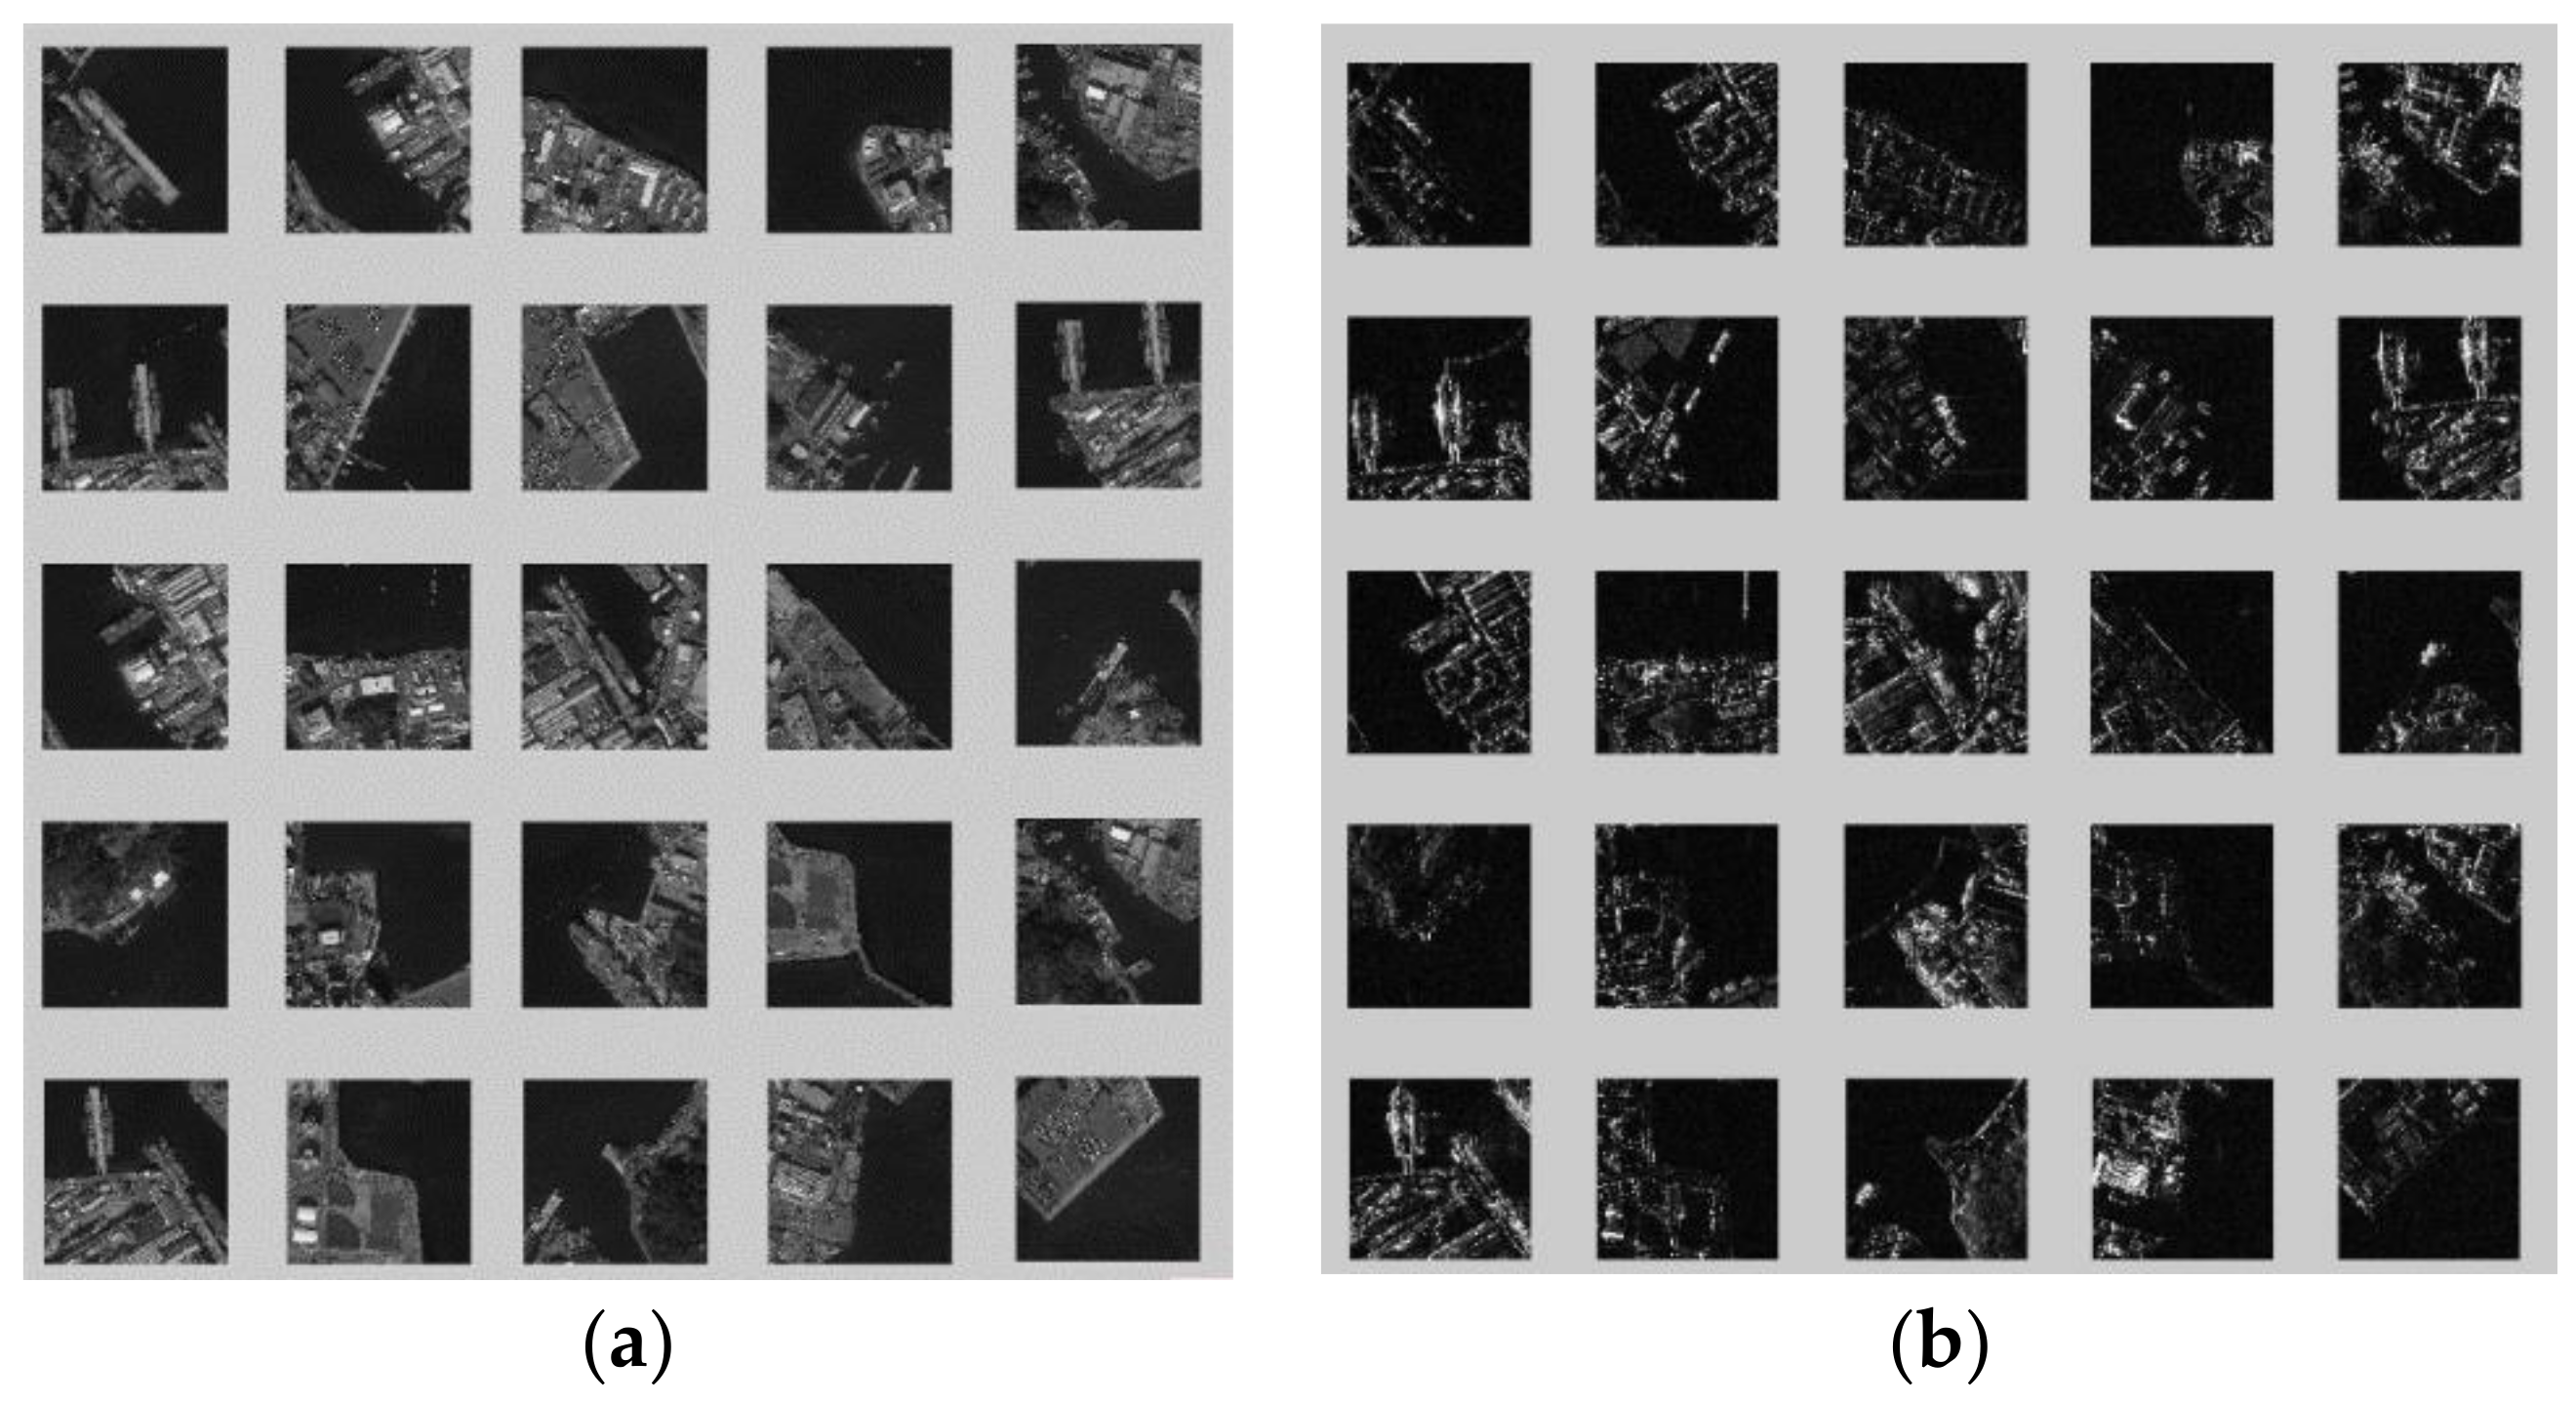
3.1. Port Area Detection Results Based on Optical and SAR Image Fusion
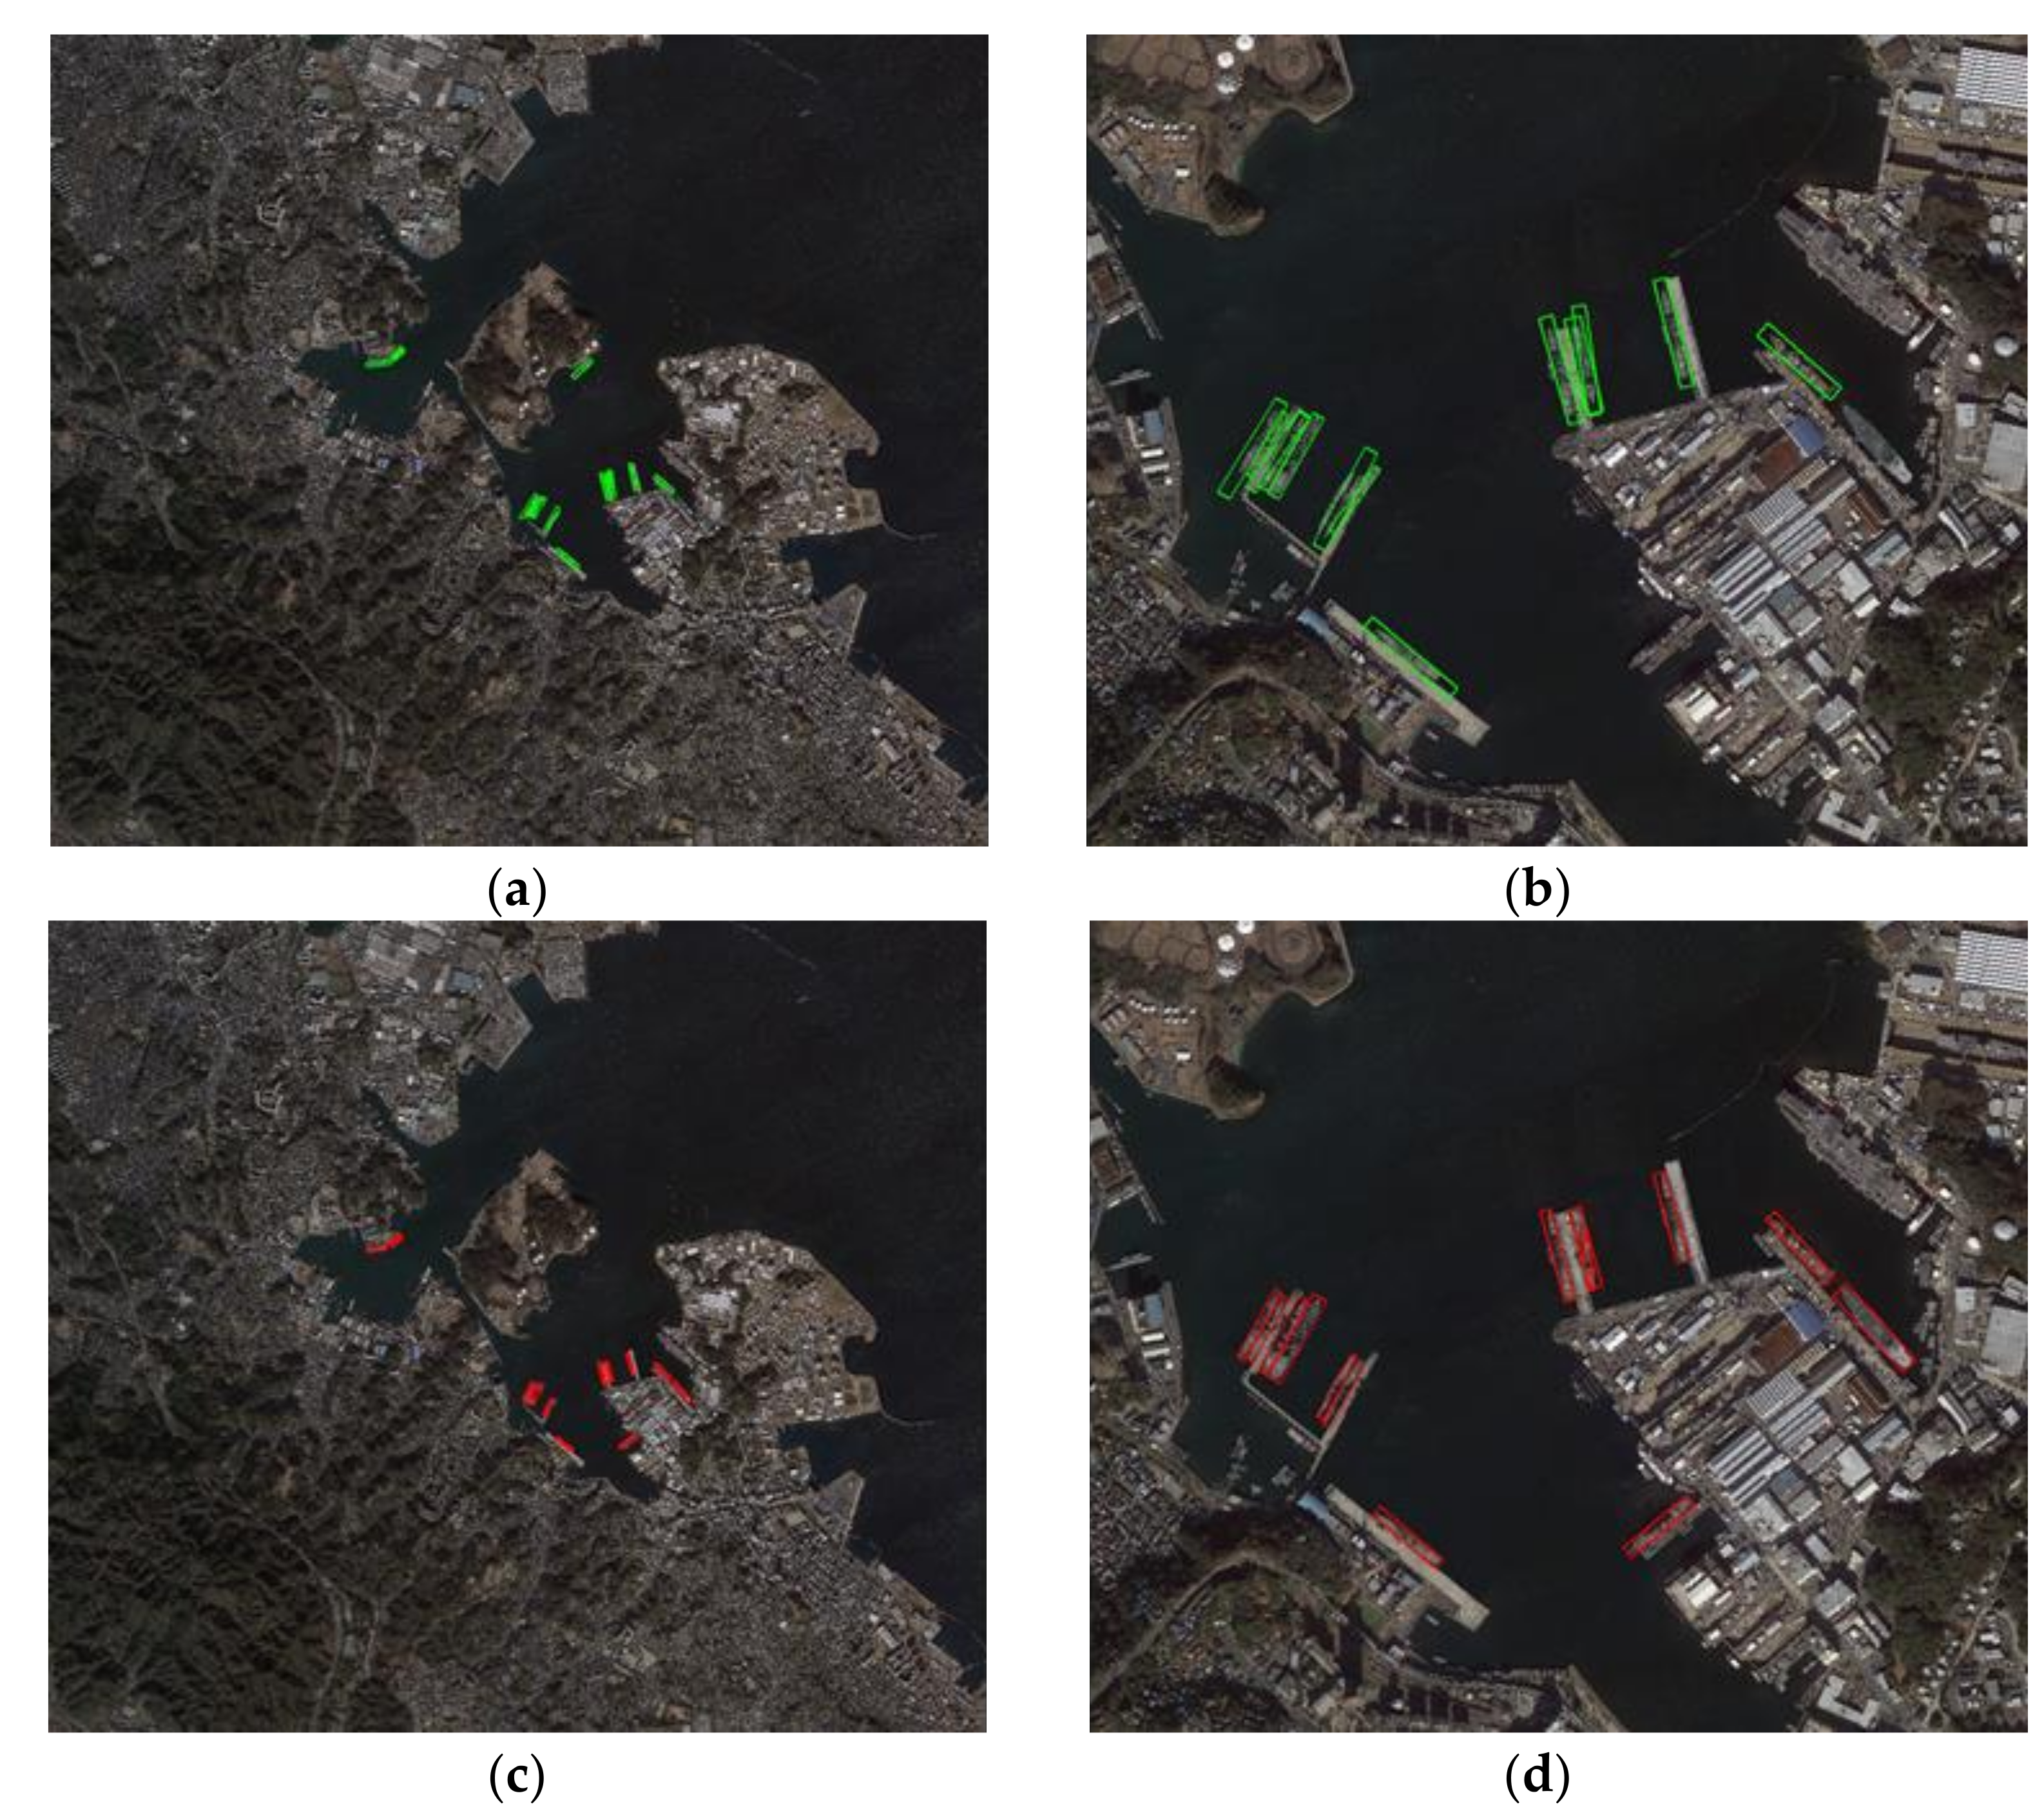
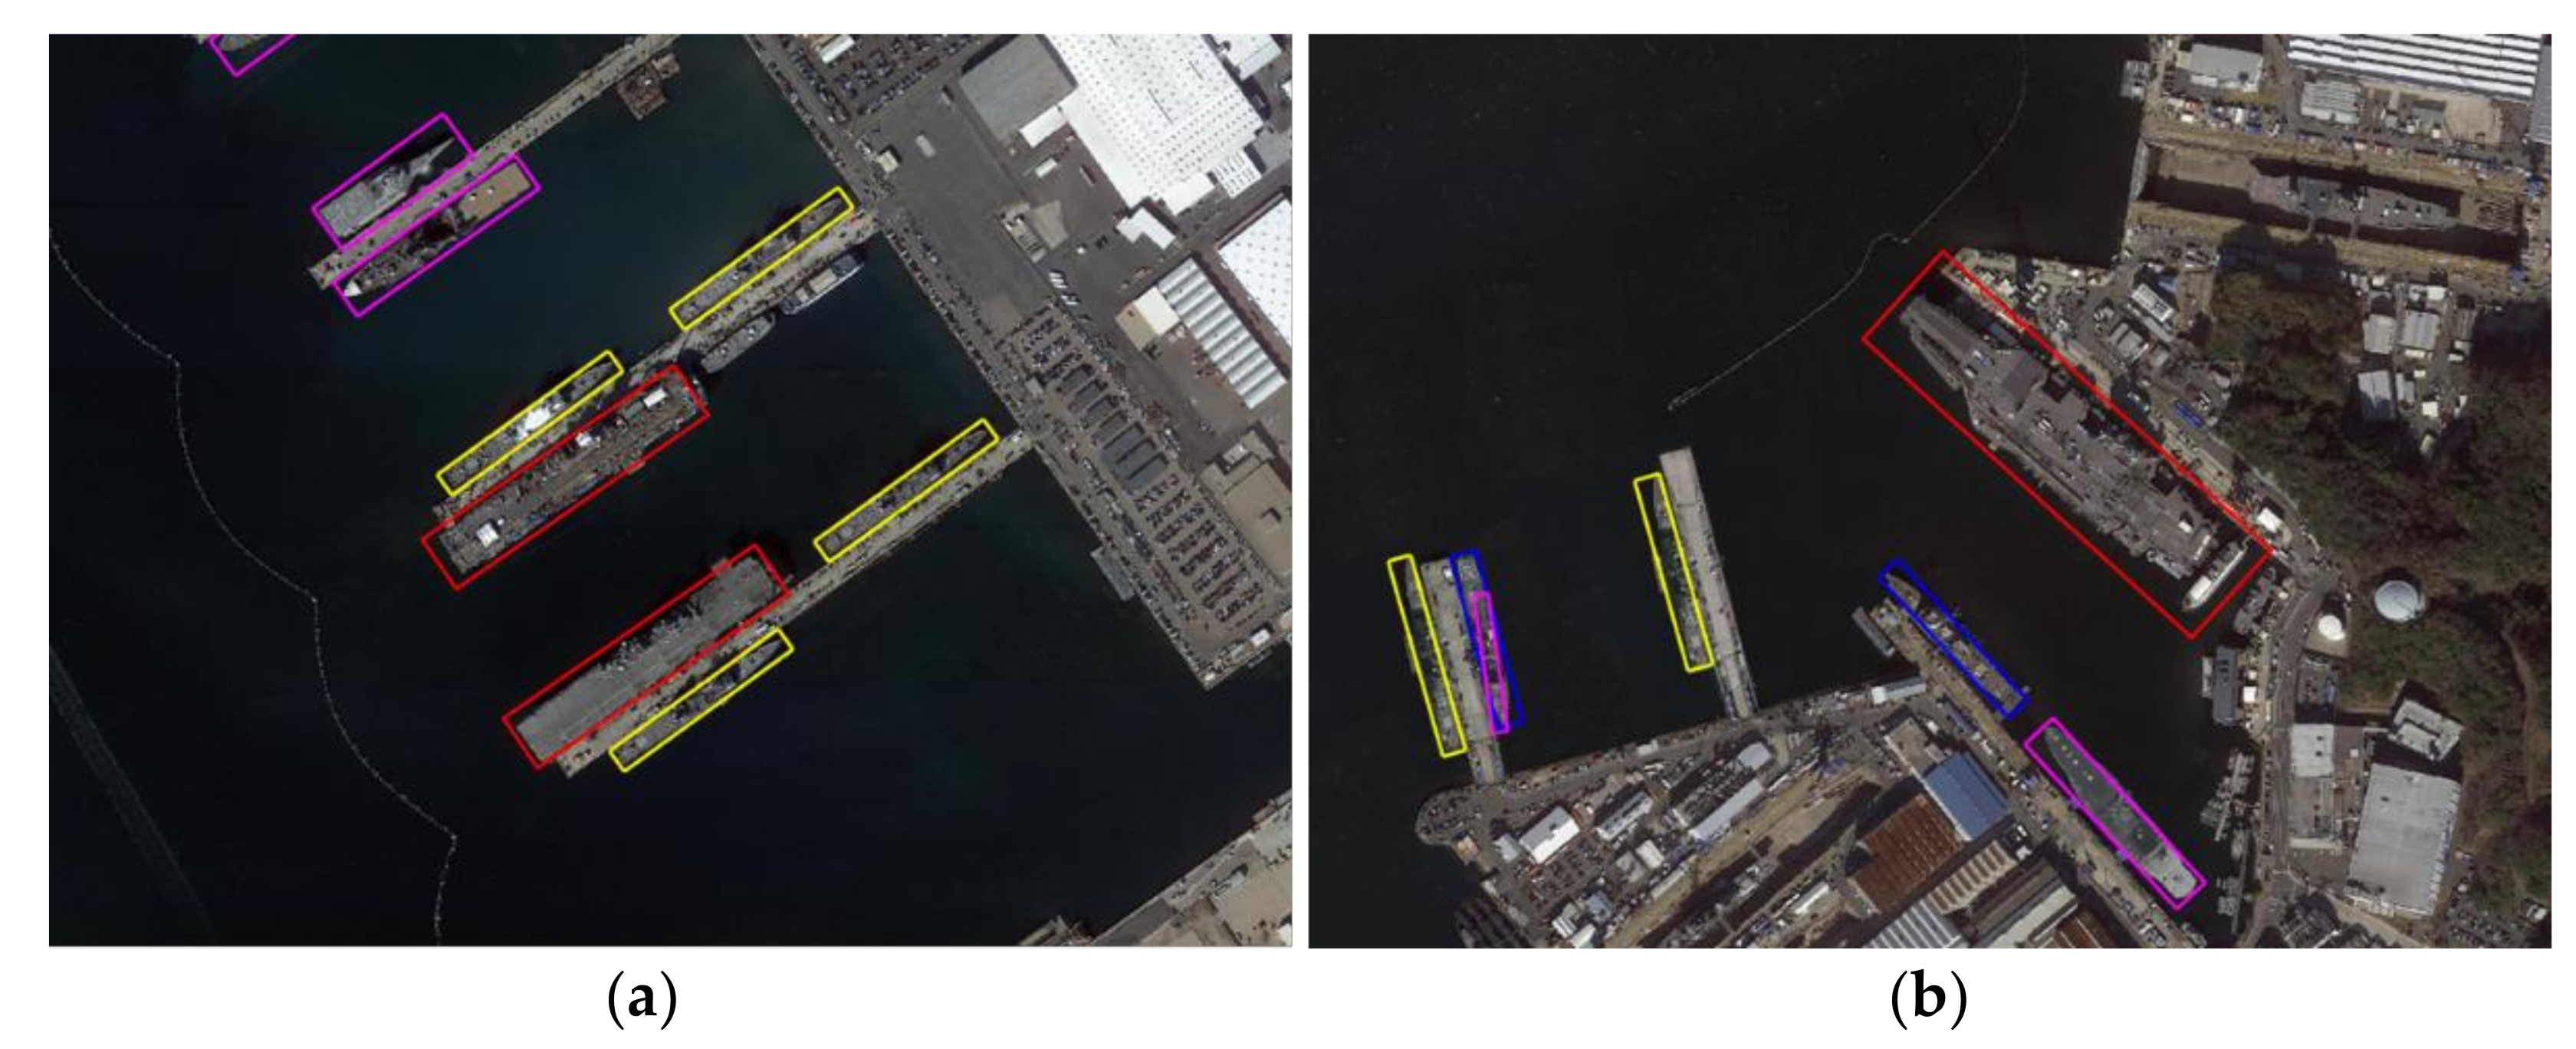
3.2. Ship Target Detection Results Based on Optical and SAR Remote Sensing Image Fusion
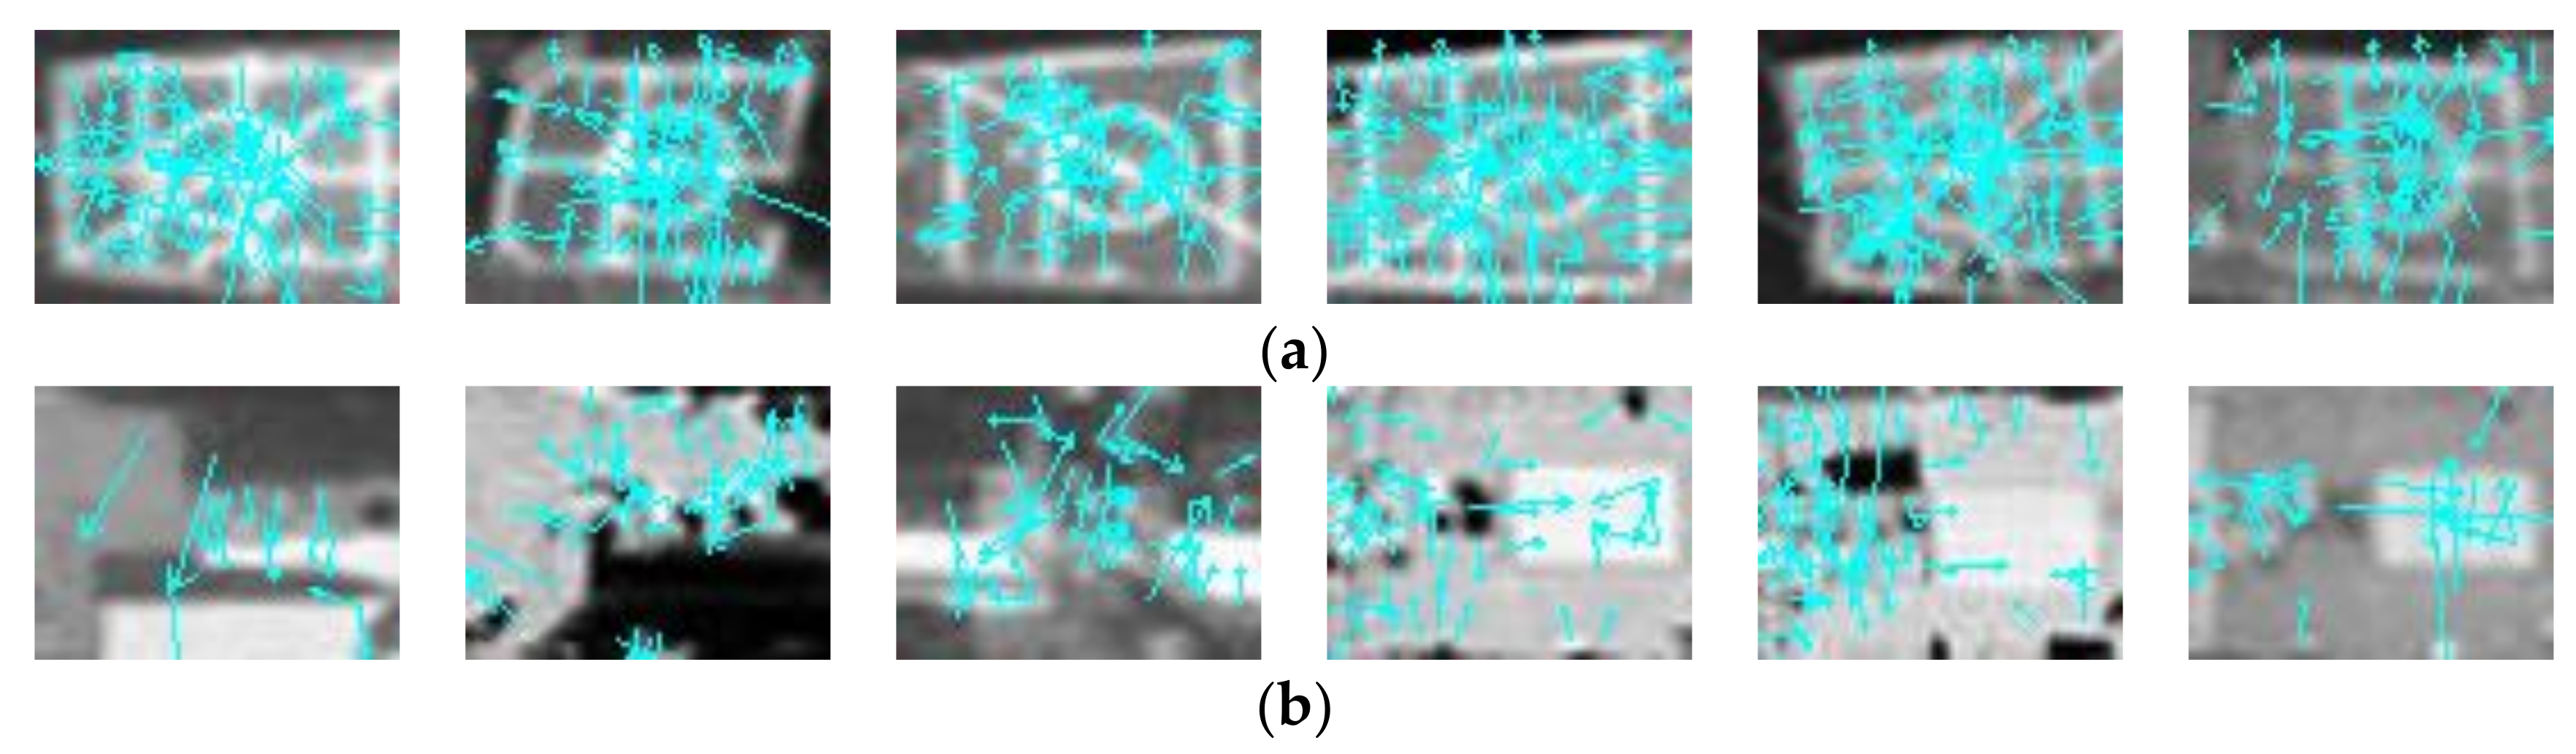
3.3. Ship Target Recognition Results Based on Multi-Source Remote Sensing Images
- (1)
- Ship part detection results based on feature point matching.
- (2)
- Ship part detection results based on brightness saliency.
- (3)
- Ship type recognition results based on voting results of part detection.
4. Discussion
5. Conclusions
Author Contributions
Funding
Institutional Review Board Statement
Informed Consent Statement
Data Availability Statement
Conflicts of Interest
References
- Xu, D. Reserch of High—Resolution SAR Images Feature Extraction and Pattern Retrieval. Master’s Thesis, University of Electronic Science and Technology of China, Chengdu, China, 2016. (In Chinese). [Google Scholar]
- Kayabol, K.; Zerubia, J. Unsupervised amplitude and texture classification of SAR images with multinomial latent model. IEEE Trans. Image Process. (TIP) 2013, 22, 561–572. [Google Scholar] [CrossRef] [PubMed]
- Zhou, C.; Luo, J. Geo—Computing of High Resolution Satellite Remote Sensing Images; Science Press: Beijing, China, 2009; pp. 1–3. (In Chinese) [Google Scholar]
- Long, T.; Zeng, T.; Hu, C. High resolution radar real—Time signal and information processing. China Commun. 2019, 16, 105–133. [Google Scholar]
- Pavlov, V.A.; Belov, A.A.; Tuzova, A.A. Implementation of Synthetic Aperture Radar Processing Algorithms on the Jetson TX1 Platform. In Proceedings of the 2019 IEEE International Conference on Electrical Engineering and Photonics (EExPolytech), St. Petersburg, Russia, 17–18 October 2019; pp. 90–93. [Google Scholar]
- Tomiyasu, K.; Pacelli, J.L. Synthetic Aperture Radar Imaging from an Inclined Geosynchronous Orbit. IEEE Trans. Geosci. Remote Sens. 1983, 21, 324–329. [Google Scholar] [CrossRef]
- Pour, A.B.; Hashim, M. The Application of ASTER Remote Sensing Data to Porphyry Copper and Epithermal Gold Deposits. Ore Geol. Rev. 2012, 44, 1–9. [Google Scholar] [CrossRef] [Green Version]
- Liu, L.; Bai, Y.; Li, Y. Locality-Aware Rotated Ship Detection in High-Resolution Remote Sensing Imagery Based on Multiscale Convolutional Network. IEEE Geosci. Remote Sens. Lett. 2021. [Google Scholar] [CrossRef]
- Han, X. Study on Key Technology of Typical Targets Recognition from Large-Field Optical Remote Sensing Images; Harbin Institute of Technology: Harbin, China, 2013. (In Chinese) [Google Scholar]
- Zhu, X.; Ma, C. The study of combined invariants optimization method on aircraft recognition. In Proceedings of the 2011 Symposium on Photonics and Optoelectronics (SOPO), Wuhan, China, 16–18 May 2011; pp. 1–4. [Google Scholar]
- Fang, Z.; Yao, G.; Zhang, Y. Target recognition of aircraft based on moment invariants and BP neural network. In Proceedings of the World Automation Congress (WAC), Puerto Vallarta, Mexico, 24–28 June 2012; pp. 1–5. [Google Scholar]
- Wang, Y.; Wang, C.; Zhang, H.; Dong, Y.; Wei, S. A SAR dataset of ship detection for deep learning under complex backgrounds. Remote Sens. 2019, 11, 765. [Google Scholar] [CrossRef] [Green Version]
- Li, T.; Liu, Z.; Xie, R. An Improved Superpixel-Level CFAR Detection Method for Ship Targets in High-Resolution SAR Images. IEEE J. Sel. Top. Appl. Earth Obs. Remote Sens. 2018, 99, 1–11. [Google Scholar] [CrossRef]
- Han, P.; Zhang, X.; Ge, P. Crashed airplane detection based on feature fusion in PolSAR image. In Proceedings of the 11th IEEE International Conference on Signal Processing, Beijing, China, 21–25 October 2012; pp. 2003–2006. [Google Scholar]
- Zhang, X.; Huo, C.; Xu, N.; Jiang, H.; Cao, Y.; Ni, L.; Pan, C. Multitask Learning for Ship Detection from Synthetic Aperture Radar Images. IEEE J. Sel. Top. Appl. Earth Obs. Remote Sens. (JSTAR) 2021, 14, 8048–8062. [Google Scholar] [CrossRef]
- Huang, L.; Chen, C. Study on image fusion algorithm of panoramic image stitching. J. Electron. Inf. Technol. 2014, 36, 1292–1298. (In Chinese) [Google Scholar]
- Bhalerao, M.; Chandaliya, N.; Poojary, T.; Rathod, M. Review on Automatic Image Homogenization for Panoramic Images. In Proceedings of the 2nd International Conference on Advances in Science & Technology (ICAST), Maharashtra, India, 9 April 2019; Available online: https://papers.ssrn.com/sol3/papers.cfm?abstract_id=3375324 (accessed on 19 October 2021).
- Li, M.; Dong, Y.; Wang, X. Pixel level image fusion based the wavelet transform. In Proceedings of the 2013 6th International Congress on Image and Signal Processing (CISP), Hangzhou, China, 16–18 December 2013; Volume 2, pp. 995–999. [Google Scholar]
- You, T.; Tang, Y. Visual saliency detection based on adaptive fusion of color and texture features. In Proceedings of the 2017 3rd IEEE International Conference on Computer and Communications (ICCC), Chengdu, China, 13–16 December 2017; pp. 2034–2039. [Google Scholar]
- Zhao, Y.; Yin, Y.; Fu, D. Decision-level fusion of infrared and visible images for face recognition. In Proceedings of the 2008 Chinese Control and Decision Conference, Yantai, China, 2–4 July 2008; pp. 2411–2414. [Google Scholar]
- Han, N.; Hu, J.; Zhang, W. Multi-spectral and SAR images fusion via Mallat and À trous avelet transform. In Proceedings of the 2010 18th International Conference on Geoinformatics, Beijing, China, 18–20 June 2010; pp. 1–4. [Google Scholar]
- Byun, Y.; Choi, J.; Han, Y. An Area-Based Image Fusion Scheme for the Integration of SAR and Optical Satellite Imagery. IEEE J. Sel. Top. Appl. Earth Obs. Remote Sens. 2013, 6, 2212–2220. [Google Scholar] [CrossRef]
- Spröhnle, K.; Fuchs, E.-M.; Pelizari, P.A. Object-Based Analysis and Fusion of Optical and SAR Satellite Data for Dwelling Detection in Refugee Camps. IEEE J. Sel. Top. Appl. Earth Obs. Remote Sens. 2017. [Google Scholar] [CrossRef] [Green Version]
- Rostami, M.; Kolouri, S.; Eaton, E.; Kim, K. SAR Image Classification Using Few-Shot Cross-Domain Transfer Learning. In Proceedings of the 2019 IEEE/CVF Conference on Computer Vision and Pattern Recognition Workshops (CVPRW), Long Beach, CA, USA, 16–20 June 2019; pp. 907–915. [Google Scholar]
- Park, K.A.; Park, J.J.; Jang, J.C.; Lee, J.H.; Oh, S.; Lee, M. Multi-spectral ship detection using optical, hyperspectral, and microwave SAR remote sensing data in coastal regions. Sustainability 2018, 10, 4064. [Google Scholar] [CrossRef] [Green Version]
- Hou, X.; Ao, W.; Xu, F. End-to-end Automatic Ship Detection and Recognition in High-Resolution Gaofen-3 Spaceborne SAR Images. In Proceedings of the IGARSS 2019—2019 IEEE International Geoscience and Remote Sensing Symposium, Yokohama, Japan, 28 July–2 August 2019; pp. 9486–9489. [Google Scholar]
- Qi, S.; Ma, J.; Lin, J.; Li, Y.; Tian, J. Unsupervised Ship Detection Based on Saliency and S-HOG Descriptor From Optical Satellite Images. IEEE Geosci. Remote Sens. Lett. 2015, 12, 1451–1455. [Google Scholar]
- Achanta, R.; Hemami, S.; Estrada, F.; Susstrunk, S. Frequency-tuned salient region detection. In Proceedings of the 2009 IEEE Conference on Computer Vision and Pattern Recognition (CVPR), Miami, FL, USA, 20–25 June 2009; pp. 1597–1604. [Google Scholar]
- Lowe, D. Distinctive image features from scale-invariant keypoints. Int. J. Comput. Vis. 2004, 60, 91–110. [Google Scholar] [CrossRef]
- Li, S.; Zhou, Z.; Wang, B.; Wu, F. A Novel Inshore Ship Detection via Ship Head Classification and Body Boundary Determination. IEEE Geosci. Remote Sens. Lett. 2016, 13, 1920–1924. [Google Scholar] [CrossRef]
- Gao, T.; Chen, H.; Chen, W. Adaptive Heterogeneous Support Tensor Machine: An Extended STM for Object Recognition Using an Arbitrary Combination of Multisource Heterogeneous Remote Sensing Data. IEEE Trans. Geosci. Remote Sens. 2021. [Google Scholar] [CrossRef]
- Koniusz, P.; Yan, F.; Gosselin, P.-H.; Mikolajczyk, K. Higher-Order Occurrence Pooling for Bags-of-Words: Visual Concept Detection. IEEE Trans. Pattern Anal. Mach. Intell. 2017, 39, 313–326. [Google Scholar] [CrossRef] [PubMed] [Green Version]
- Cortes, C.; Vapnik, V. Support-vector networks. Mach. Learn. 1995, 20, 273–297. [Google Scholar] [CrossRef]
- Schölkopf, B.; Smola, A.J.; Williamson, R.C.; Bartlett, P.L. New support vector algorithms. Neural Comput. 2000, 12, 1207–1245. [Google Scholar] [CrossRef] [PubMed]
- Tao, D.; Li, X.; Wu, X.; Hu, W.; Maybank, S.J. Supervised tensor learning. Knowl. Inf. Syst. 2007, 13, 1–42. [Google Scholar] [CrossRef]
- Li, J.; Tian, J.; Gao, P.; Li, L. Ship Detection and Fine-Grained Recognition in Large-Format Remote Sensing Images Based on Convolutional Neural Network. In Proceedings of the IGARSS 2020—2020 IEEE International Geoscience and Remote Sensing Symposium, Waikoloa, HI, USA, 26 September–2 October 2020; pp. 2859–2862. [Google Scholar]


| Destroyer | Cruiser | Other Ships | |
|---|---|---|---|
| Length | 285–325 (pixel) | 326–366 (pixel) | Other pixel lengths |
| Width | 38–45 (pixel) | 30–37 (pixel) | Other pixel lengths |
| Bridge | 115–160 (pixel) | 161–210 (pixel) | Other pixel lengths |
| VLS | Front: 60–80 (pixel) Backend: 205–265 (pixel) | Front: 81–100 (pixel) Back end: 266–325 (pixel) | Other pixel lengths |
| Prow contour | Destroyer type | Cruiser type | Other types |
| Prow tip | Destroyer type with the same tip | Cruiser type with the same tip | Other types |
| Flight deck | American flight deck | American flight deck | Other types |
| Optical | SAR | |
|---|---|---|
| Data acquisition time | 27 October 2009 | 28 October 2009 |
| Resolution ratio | 0.5 m | 1.1 m |
| Sensor | Google Earth | TerraSAR-X |
| SAR polarimetric | - | HH |
| Wavelength | - | 3.2 m |
| Orbit type | - | Sun-synchronous orbit |
| Optical | Proposed Method | HSTM | AHSTM | |
|---|---|---|---|---|
| Recall | 85.29% | 91.43% | 88.23% | 91.17% |
| Precision | 87.88% | 94.12% | 91.45% | 94.02% |
| Method | Proposed Method | HSTM | C-SVM | V-SVM | C-STM |
|---|---|---|---|---|---|
| Precision | 91.43% | 87.10% | 74.19% | 77.42% | 74.19% |
Publisher’s Note: MDPI stays neutral with regard to jurisdictional claims in published maps and institutional affiliations. |
© 2021 by the authors. Licensee MDPI, Basel, Switzerland. This article is an open access article distributed under the terms and conditions of the Creative Commons Attribution (CC BY) license (https://creativecommons.org/licenses/by/4.0/).
Share and Cite
Liu, J.; Chen, H.; Wang, Y. Multi-Source Remote Sensing Image Fusion for Ship Target Detection and Recognition. Remote Sens. 2021, 13, 4852. https://doi.org/10.3390/rs13234852
Liu J, Chen H, Wang Y. Multi-Source Remote Sensing Image Fusion for Ship Target Detection and Recognition. Remote Sensing. 2021; 13(23):4852. https://doi.org/10.3390/rs13234852
Chicago/Turabian StyleLiu, Jinming, Hao Chen, and Yu Wang. 2021. "Multi-Source Remote Sensing Image Fusion for Ship Target Detection and Recognition" Remote Sensing 13, no. 23: 4852. https://doi.org/10.3390/rs13234852
APA StyleLiu, J., Chen, H., & Wang, Y. (2021). Multi-Source Remote Sensing Image Fusion for Ship Target Detection and Recognition. Remote Sensing, 13(23), 4852. https://doi.org/10.3390/rs13234852