Article

Geospatial Approaches to Monitoring the Spread of Invasive Species of Solidago spp.

1
Department of Geography and Applied Geoinformatics, Faculty of Humanities and Natural Sciences, University of Prešov, 17. Novembra 1, 08001 Prešov, Slovakia
2
National Agricultural and Food Centre, Soil Science and Conservation Research Institute, Raymanova 1, 08001 Prešov, Slovakia
3
Department of Ecology, Faculty of Humanities and Natural Sciences, University of Prešov, 17. Novembra 1, 08001 Prešov, Slovakia
*
Author to whom correspondence should be addressed.
Remote Sens. 2021, 13(23), 4787; https://doi.org/10.3390/rs13234787
Submission received: 10 October 2021 / Revised: 8 November 2021 / Accepted: 23 November 2021 / Published: 26 November 2021

Abstract

:
Global climate change influences plant invasion which spreads all over the Europe. Invasive plants are predominantly manifest negative impacts, which require increased attention not only from ecologists. The research examines the possibilities offered by geospatial technologies in mapping the spatial spread of invasive plants of the genus Solidago. Invasive plant population was investigated at two localities, Malý Šariš and Chminianska Nová Ves in Slovakia, as well as the mapping of the area by multispectral imaging to determine the spectral reflectance curve of the monitored plant species. Using spatial analyses in the geographic information system, we evaluated changes in the plant density in the two localities. Based on the obtained results, we found that the number of individuals (ramets) in the Malý Šariš is significantly increasing, while in the examined area of Chminianska Nová Ves, there is a decrease in the number of Solidago spp. in the last monitored year. At the same time, we can state that in the areas with the highest increase in the number of ramets, the highest plant density per hectare was also recorded. We can also say that due to the spectral proximity of the surrounding vegetation, the spectral resolution in four spectral bands is insufficient for the classification of multispectral records in the case of Solidago spp. and cannot replace the advantages of high spectral resolution hyperspectral imaging, which significantly refines the feature space for Solidago spp. and the surrounding vegetation.

Graphical Abstract

1. Introduction

The ecological impact of invasive species has been observed in all types of ecosystems. Typically, invaders can change the niches of co-occurring species, alter the structure and function of ecosystems by degrading native communities and disrupt evolutionary processes through anthropogenic movement of species across physical and geographical barriers [1,2,3,4,5]. Recent invasion research ranges from developing testable hypotheses aimed at understanding the mechanisms of invasion to providing guidelines for the control and management of invasive species. Early detection and mapping of the extent of rapidly spreading invasive populations are critical for informing management priorities, including eradication efforts [6]. Conserving biodiversity, however, requires data. The ability to monitor the state of our natural resources and the impacts of human activity on these resources is fundamental to designing appropriate and optimized management strategies. The scientific community needs to be able to access global, long-term, reliable information on spatial temporal changes in the distribution of direct and indirect anthropogenic pressures to biological diversity; in the distribution, structure, composition, and functioning of ecosystems; as well as evidence of the effectiveness of various management actions [7]. Biodiversity monitoring experts necessitates them to work at the interface between ecology and remote sensing. Field surveys are costly in terms of time and manpower, and georeferenced records of most species are inadequate for distribution modelling [8]. The development of remote sensing technology has made it possible to map the distribution of plant species and aims to extract information about the condition and/or state of an object without requiring physical contact [9,10,11]. Understanding species distributions, and being able to predict their potential shifts, relies on being able to characterize the set of conditions that drive occupancy. Doing so requires information on species’ presence, and on the environmental conditions and resources available to the organisms of concern. Deriving maps detailing the bio-physical cover of the Earth’s surface from satellite remote sensing (SRS) is among the oldest applications of satellite data to inform applied ecology with, for instance, the first global land cover products produced in the 1990s [12,13]. New combinations of satellite remote sensing (SRS) data with methodologies such as support vector machines [14] and multisensory image fusion [15] are constantly tested for application, while investigations for developing new indices to monitor vegetation have been occurring for decades [16,17]. Although SRS is increasingly popular in applied ecology, the data are still underused. Detection of specific animal and plant individuals using information collected by satellites is still not commonly achieved, although successful examples have started to accumulate [7,18]. Moderate (<100 m ground sampling) resolution satellite images have for example been used to map the spatial extents of cheatgrass Bromus tectorum [19]. GeoEye-1 satellite imagery (spatial resolution of 1.65 m) was suitable for the detection of medium- to large-sized wildlife as well as informing population estimation exercises in open savanna [20]. Very high spatial resolution (pixel size <10 m2) commercial optical sensors have provided new opportunities for habitat mapping at a finer spatial scale than previously possible [21,22]. Most biodiversity researchers and conservation practitioners lack the financial resources to acquire large amounts of SRS data, especially if they need information over wide geographical extents or long periods of time [23]. There are many underused products and algorithms that could benefit environmental and wildlife management (e.g., fractional vegetation cover products, radar and hyperspectral imagery, differential interferometry algorithms). Most mapping studies are performed at the local scale (100s to 1000s of hectares), while distribution modelling is typically performed at global, continental, national, or regional scales [24]. Researchers and managers have embraced aerial photography [25,26,27,28,29,30,31] for mapping the distribution of invasive weeds. The potential for SRS to support natural resource management has never been greater; however, several issues limit this potential. First, although many satellite products are freely available, a significant proportion of products are not [32]. Further, SRS-based data analyses can be expensive given logistical requirements (i.e., hardware, software, qualified staff and training) for the processing and analysis of large data sets. Altogether, costs can be considerable and are hampering widespread application of satellite monitoring in applied ecology and management [23,32,33]. In addition to free SRS products, open source software solutions, such as R [34], QGIS [35] or GRASS GIS [36] are on the rise.
Present research considered equipment’s which are more available for the investigation of the invasive plants Solidago spp. spreading in low acreage localities. There were used precise positioning of plants by RTK GNSS equipment during four growing seasons and multispectral imaging using UAV in last monitored season for remote sensing.

2. Materials and Methods

2.1. Monitored Plant Species

Solidago canadensis and Solidago gigantea (Solidago spp.) are dangerous plant invaders in Europe, which suppress the indigenous flora. Both species originated from North America and were spread over the Europe and Asia as beautiful ornamental flowers. They are perennial herbs. Morphology of both species is very similar. Both reach heights about 1.5 to 2 m tall, sometimes spreading by means of underground rhizomes. Solidago spp. are clonal plants. Populations with clonal growth have difficult structure and it is important to recognize the genets and ramets. Ramete is a basic clonal unit and its synonym is individual plant. It was vegetative reproduced from the clone plant and is physiologically independent. Genete is a plant colony with the same genetic, where it is not possible to recognize mother plant. It is synonymous with a bunch of plants.
It often grows from genete with no leaves at the base but numerous leaves on the stem. At the top, each shoot produces a sizable array of many small yellow flower heads, sometimes several hundred. The seeds are dispersed by wind; within established stands, clonal growth of the species can form dense stands. It is possible to find them in a wide variety of natural habitats, although it is restricted to areas with at least seasonally moist soils.

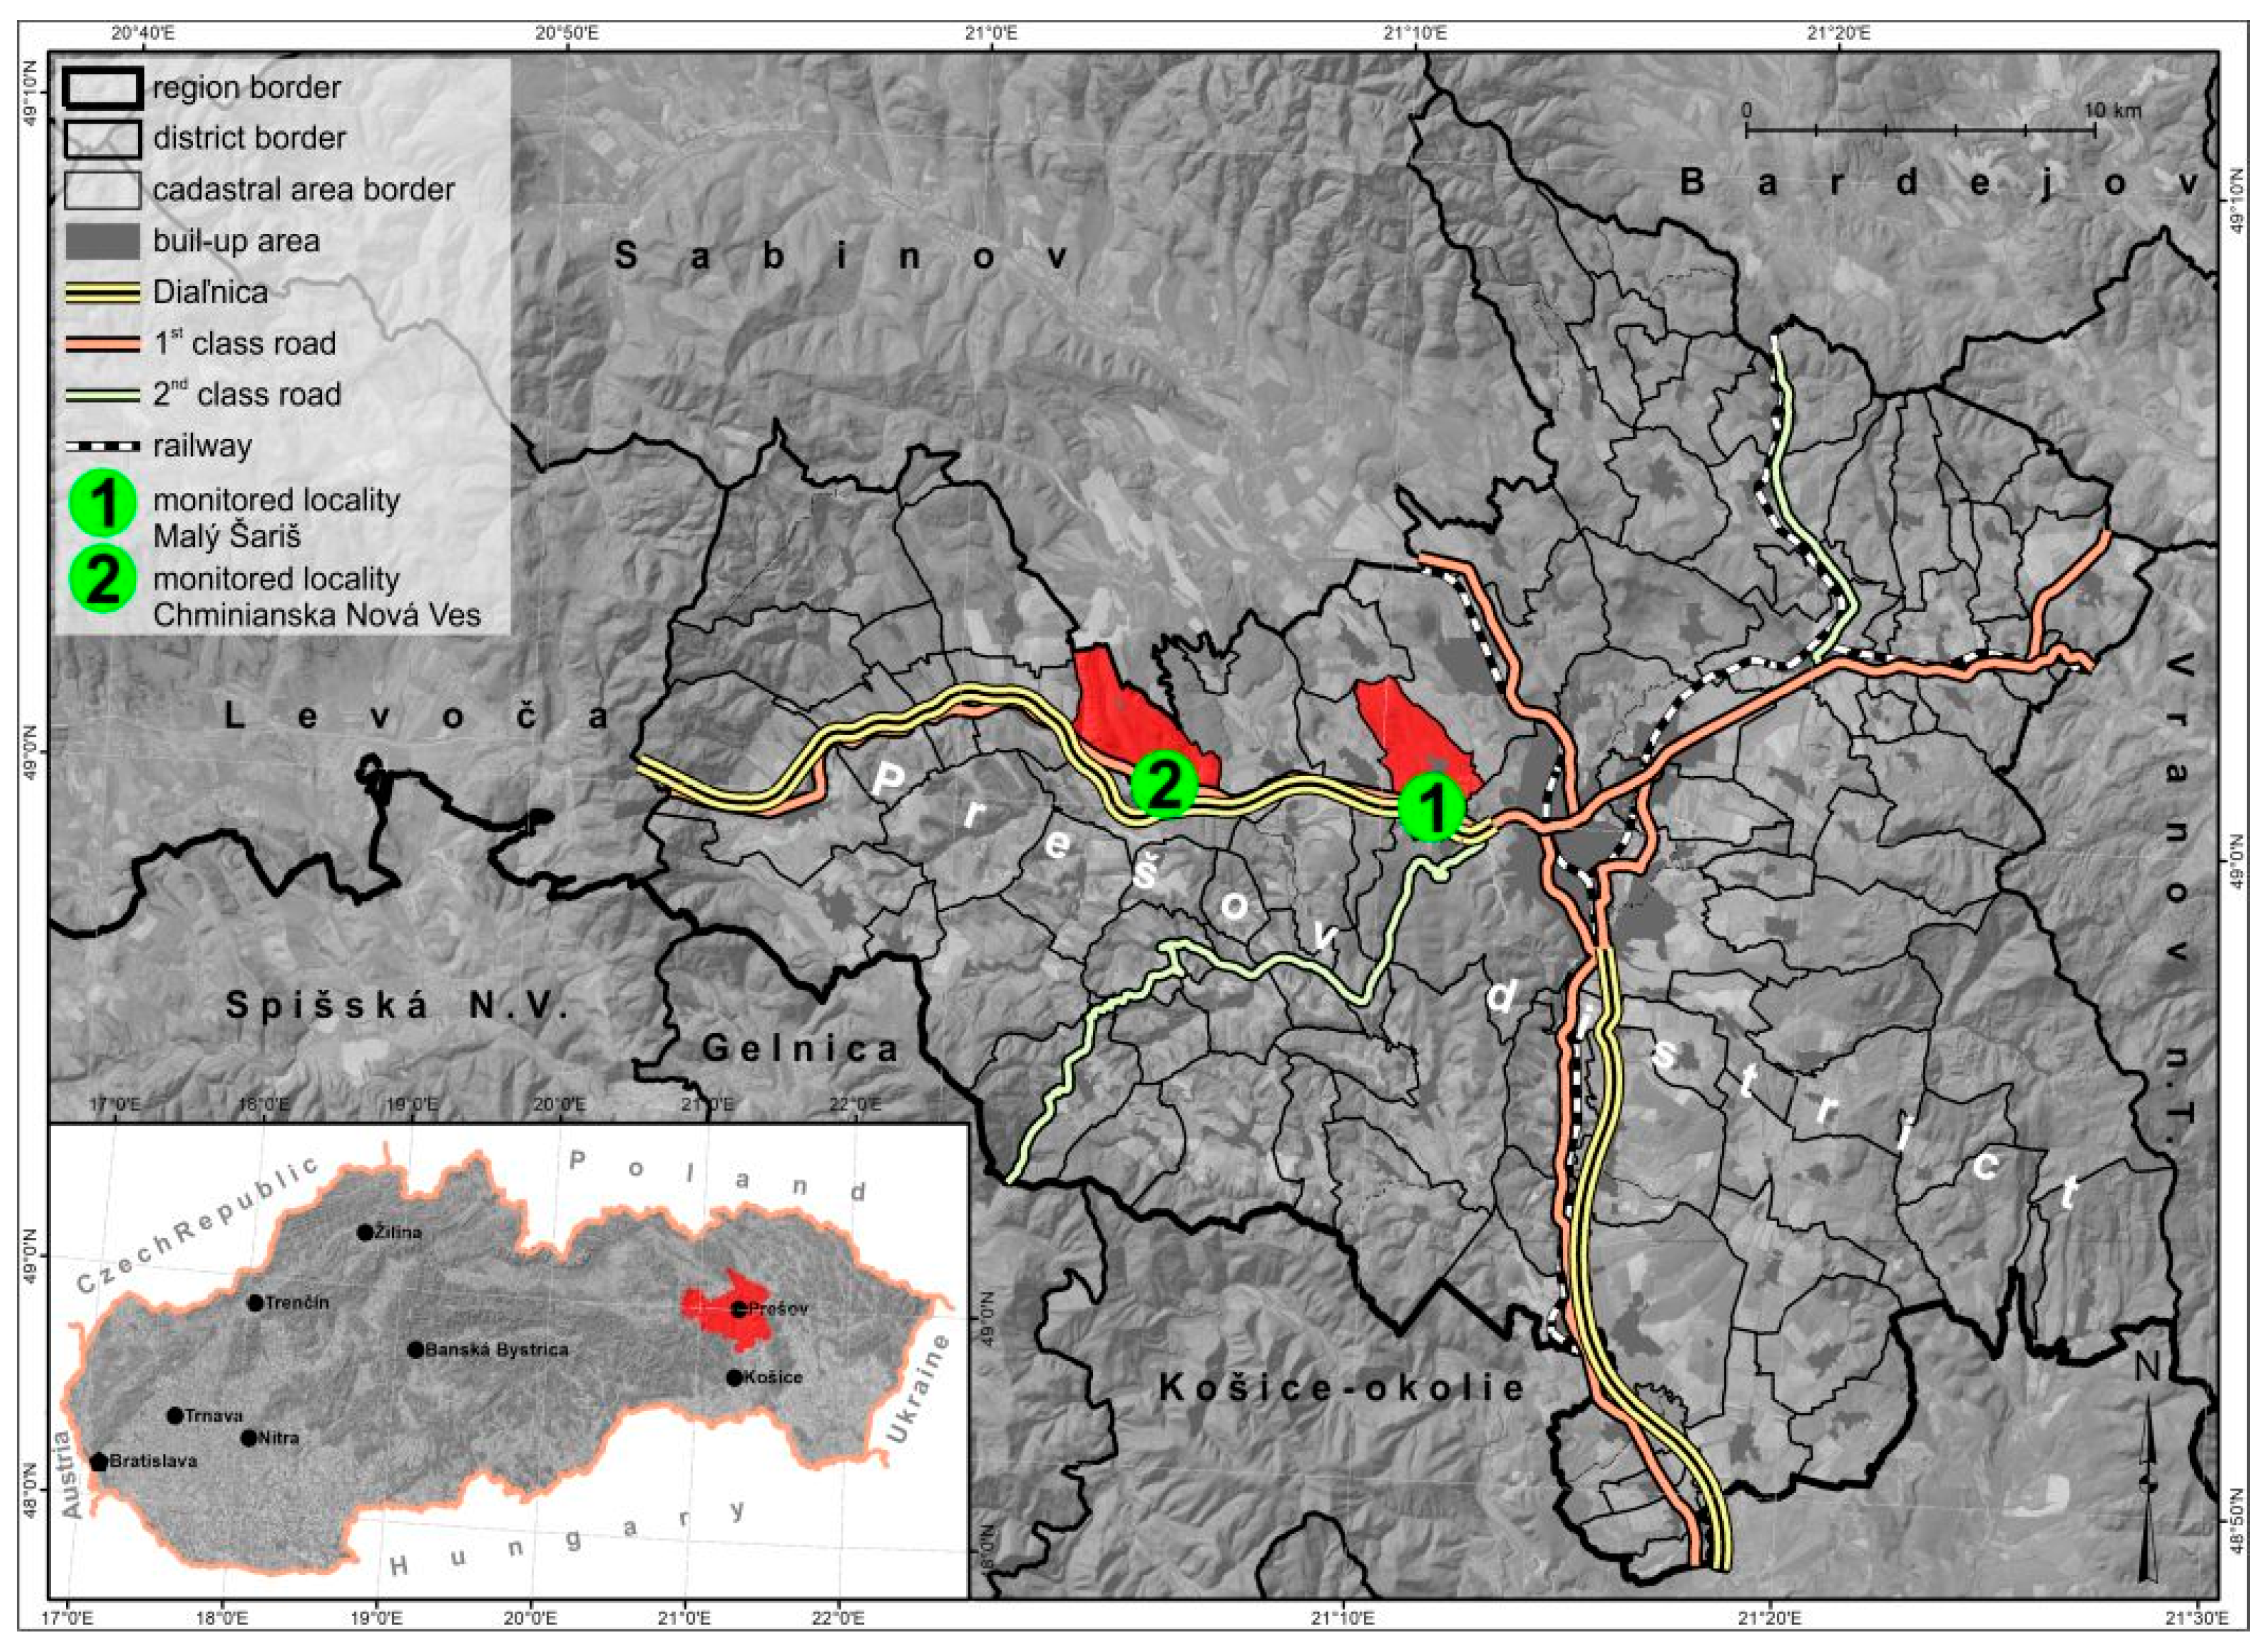
2.2. Monitored Localities

Localities were selected based on the following criteria: (1) locality which is freely accessible; (2) locality without management; (3) locality with appearance of Solidago spp. with potential to spread. There were four selected localities in the sub-urban area of Prešov (Slovakia), but after two years of observations, two of them were excluded based on unexpected management provided on them. The two remaining localities (Malý Šariš and Chminianska Nová Ves) are localized in the Western part of Prešov (Figure 1).

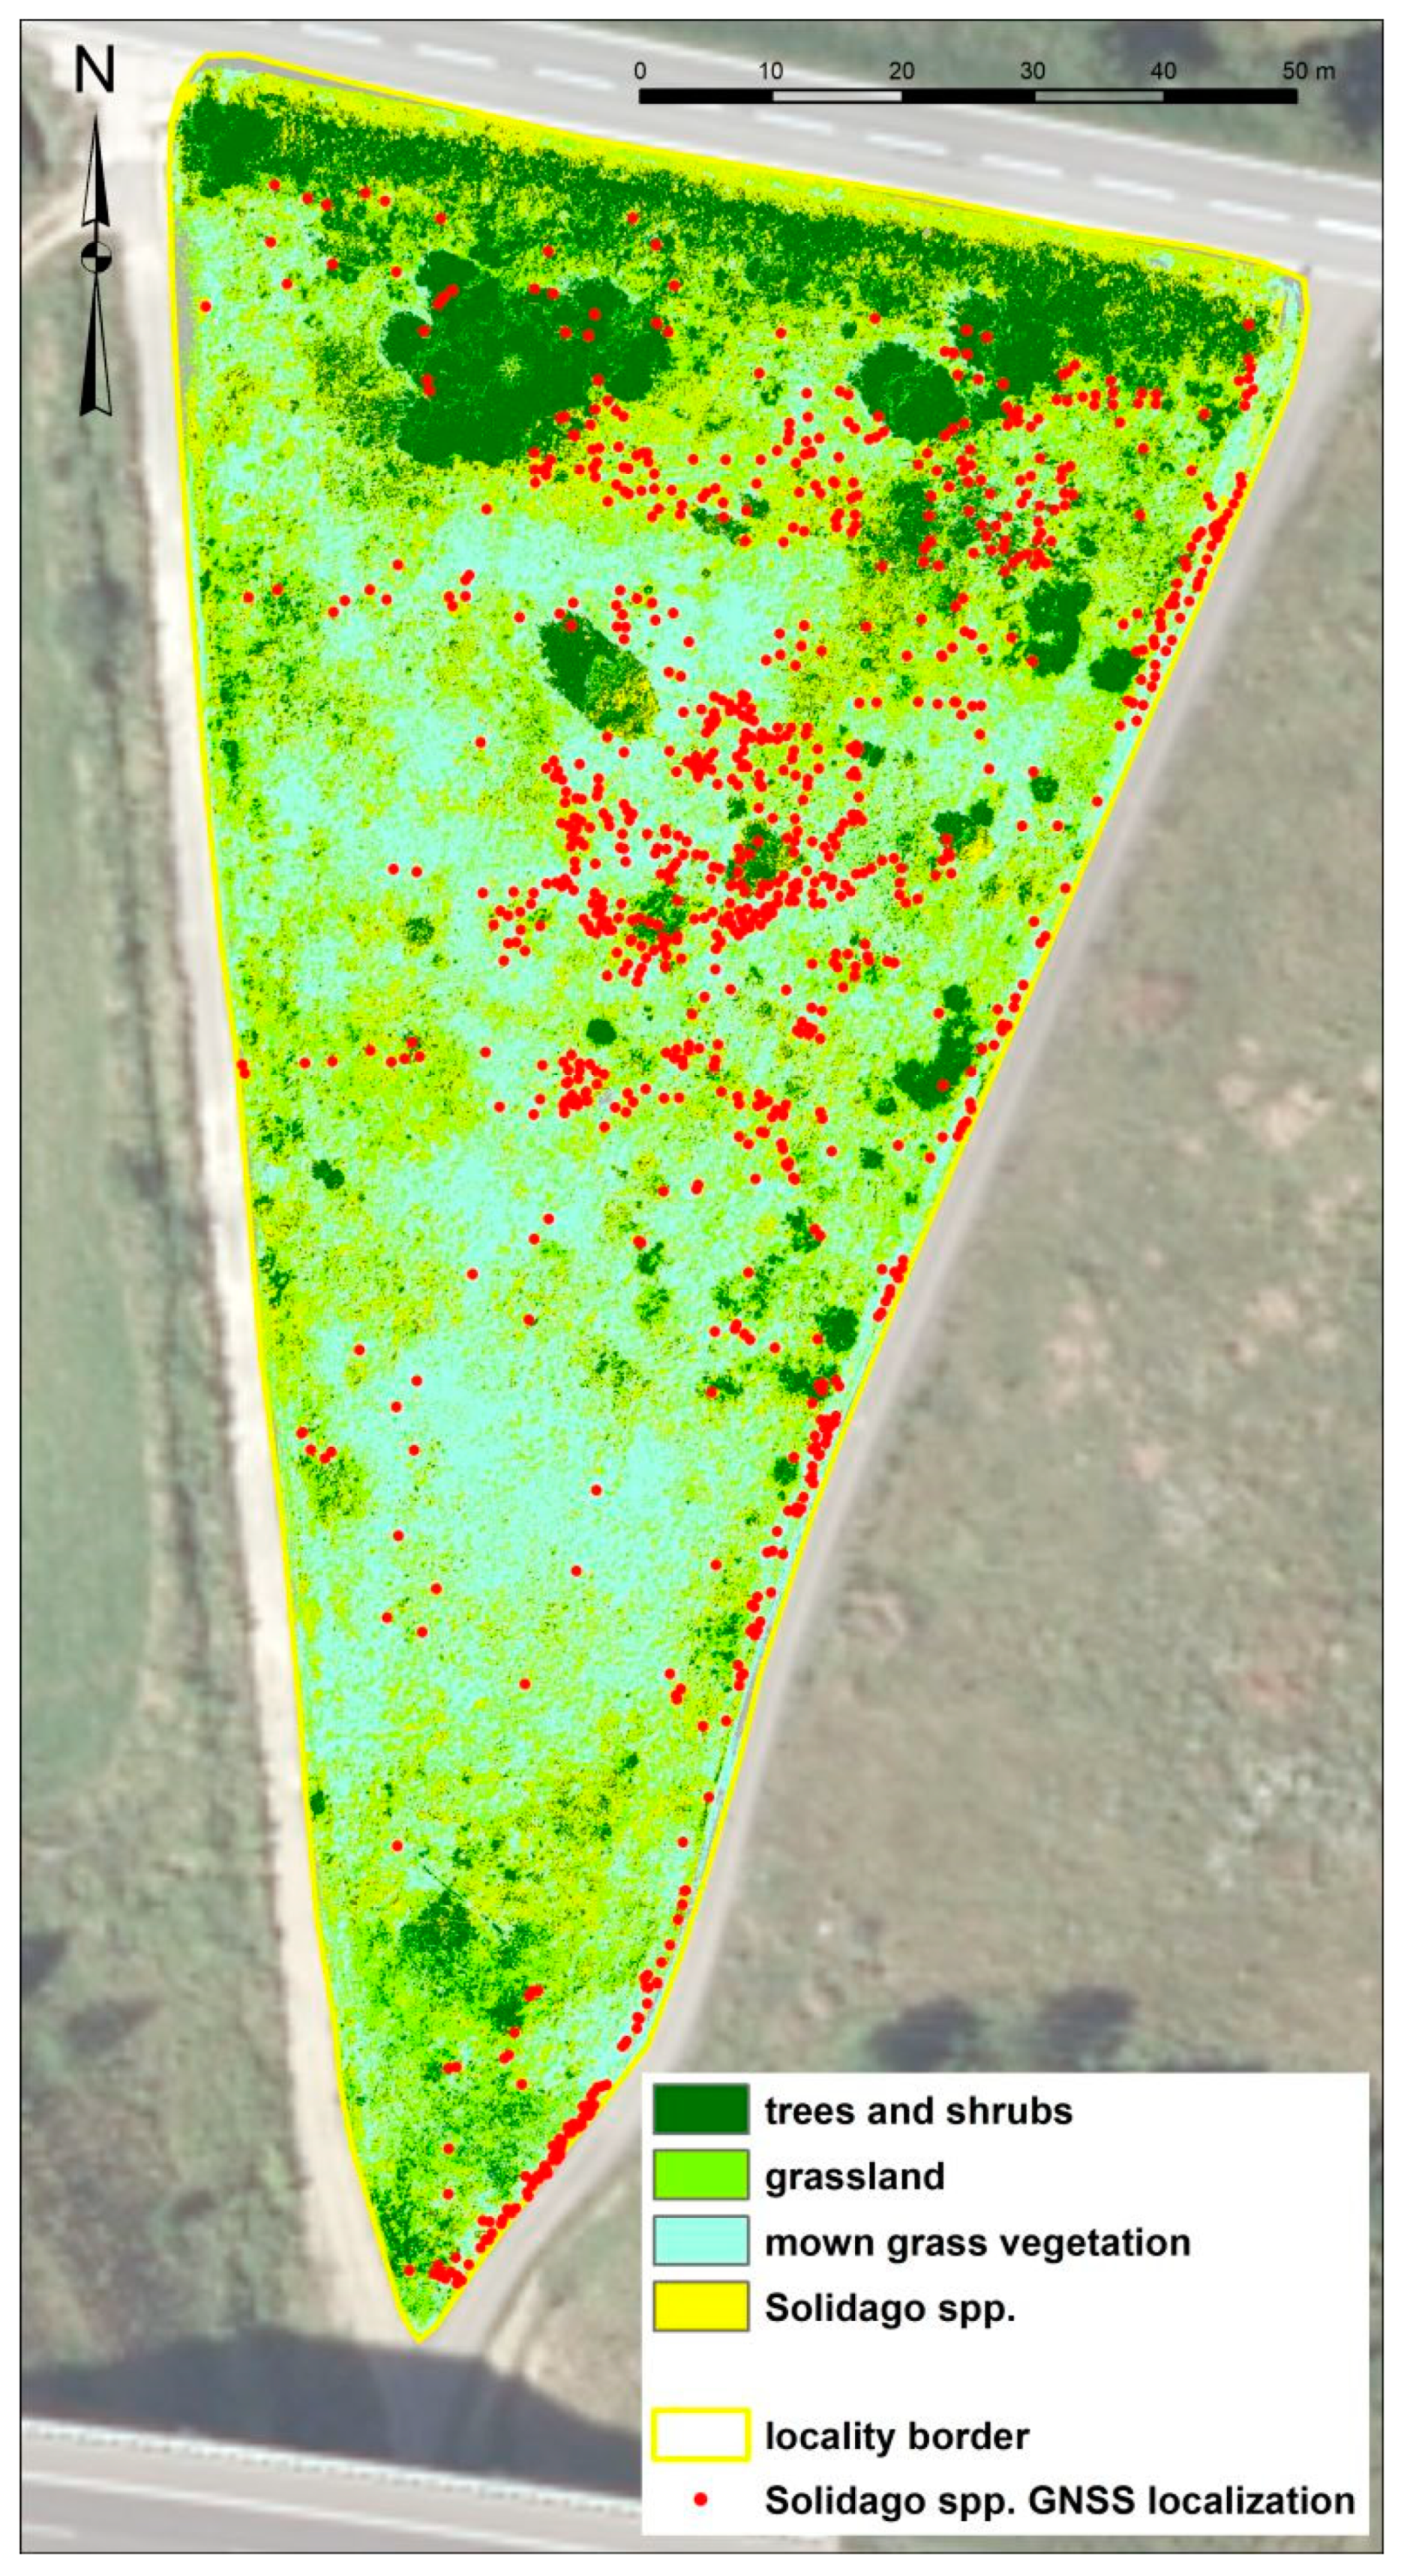
2.3. Locality of Malý Šariš

The monitored locality of Malý Šariš is situated 5 km west of Prešov and 289 m above sea level. The locality has a triangle shape with an area of 0.81 ha. Two sites (South-West and South-East) are bordered by field, while a third site (North) neighbors them with the road number E18. The research locality is oriented to the north, predominantly flat with a slight slope of up to 2°. The locality consists of diluvial sediments as well as claystone’s and sandstones. There are fluvisols and planosols occur in the research area.

2.4. Locality Chminianska Nová Ves

Monitored locality Chminianska Nová Ves is situated 11.7 km west of the Prešov in the 362 m a.s.l. The area of 2.84 ha has a western slope of 11°. The site has an irregular longitudinal shape in a west–east direction. It is bordered by the highway D1 in the south and dense banks with the vegetation of the Svinka river in the north. The locality is divided in the middle by a small section of dense shrub vegetation. The locality consists of medium- and coarse-grained sandstones but also a flysch, a sequence of sedimentary rock layers of claystone’s and sandstones. It is possible to find mainly cambisols and dystrict leptosols and, to a lesser extent, fluvisols around the Svinka watercourse.

2.5. Monitoring of the Solidago spp. Spreading by Using GNSS

Empirical research consists of recording the location of Solidago’s genets. Direct positions of the Solidago genets were recorded during the four-year period (2016–2019). Monitoring was provided in the period of plant flowering, when the yellow flowers of Solidago spp. Are easy to recognize (Table 1.). There was recorded position of the genets as well as the number of the shoots in the genets.
Plant location recording was performed via the Sygic mobile application, version 11.2.6, in the first monitoring year in 2016. In the next three years (2017–2019) we used RTK GNSS (Real-Time Kinematic Global Navigation Satellite System—a type of differential GNSS) instrument to locate the genets of Solidago spp., followed by using position corrections from the Slovak Spatial Observation Service (SKPOS). We were able to record the position of ramets and shoots with an accuracy of less than 2 cm. The coordinates of plants were recorded in a text document from where we imported them and processed as a point vector layer in the geographic information system QGIS 3. Each point of the vector layer that represented the genet also contained information on the number of shoots. There was plotted the occurrence and number of plants cartographically, in all mappings. The obtained data were divided into 6 categories using the cartogram method and each genet was marked with a different point size and color depending on the number of ramets.

2.6. Analysis of the Changes in Solidago spp. Spreading by Using Geospatial Analysis in GIS

We used spatial analysis of GIS to evaluate changes in the distribution of Solidago spp. during the three years—2017, 2018 and 2019—at both localities. For the first year (2016), analysis was omitted due to the fact that in that year was the position of individuals recorded by using the Sygic mobile application, which caused the measurement inaccuracy to reach several meters.

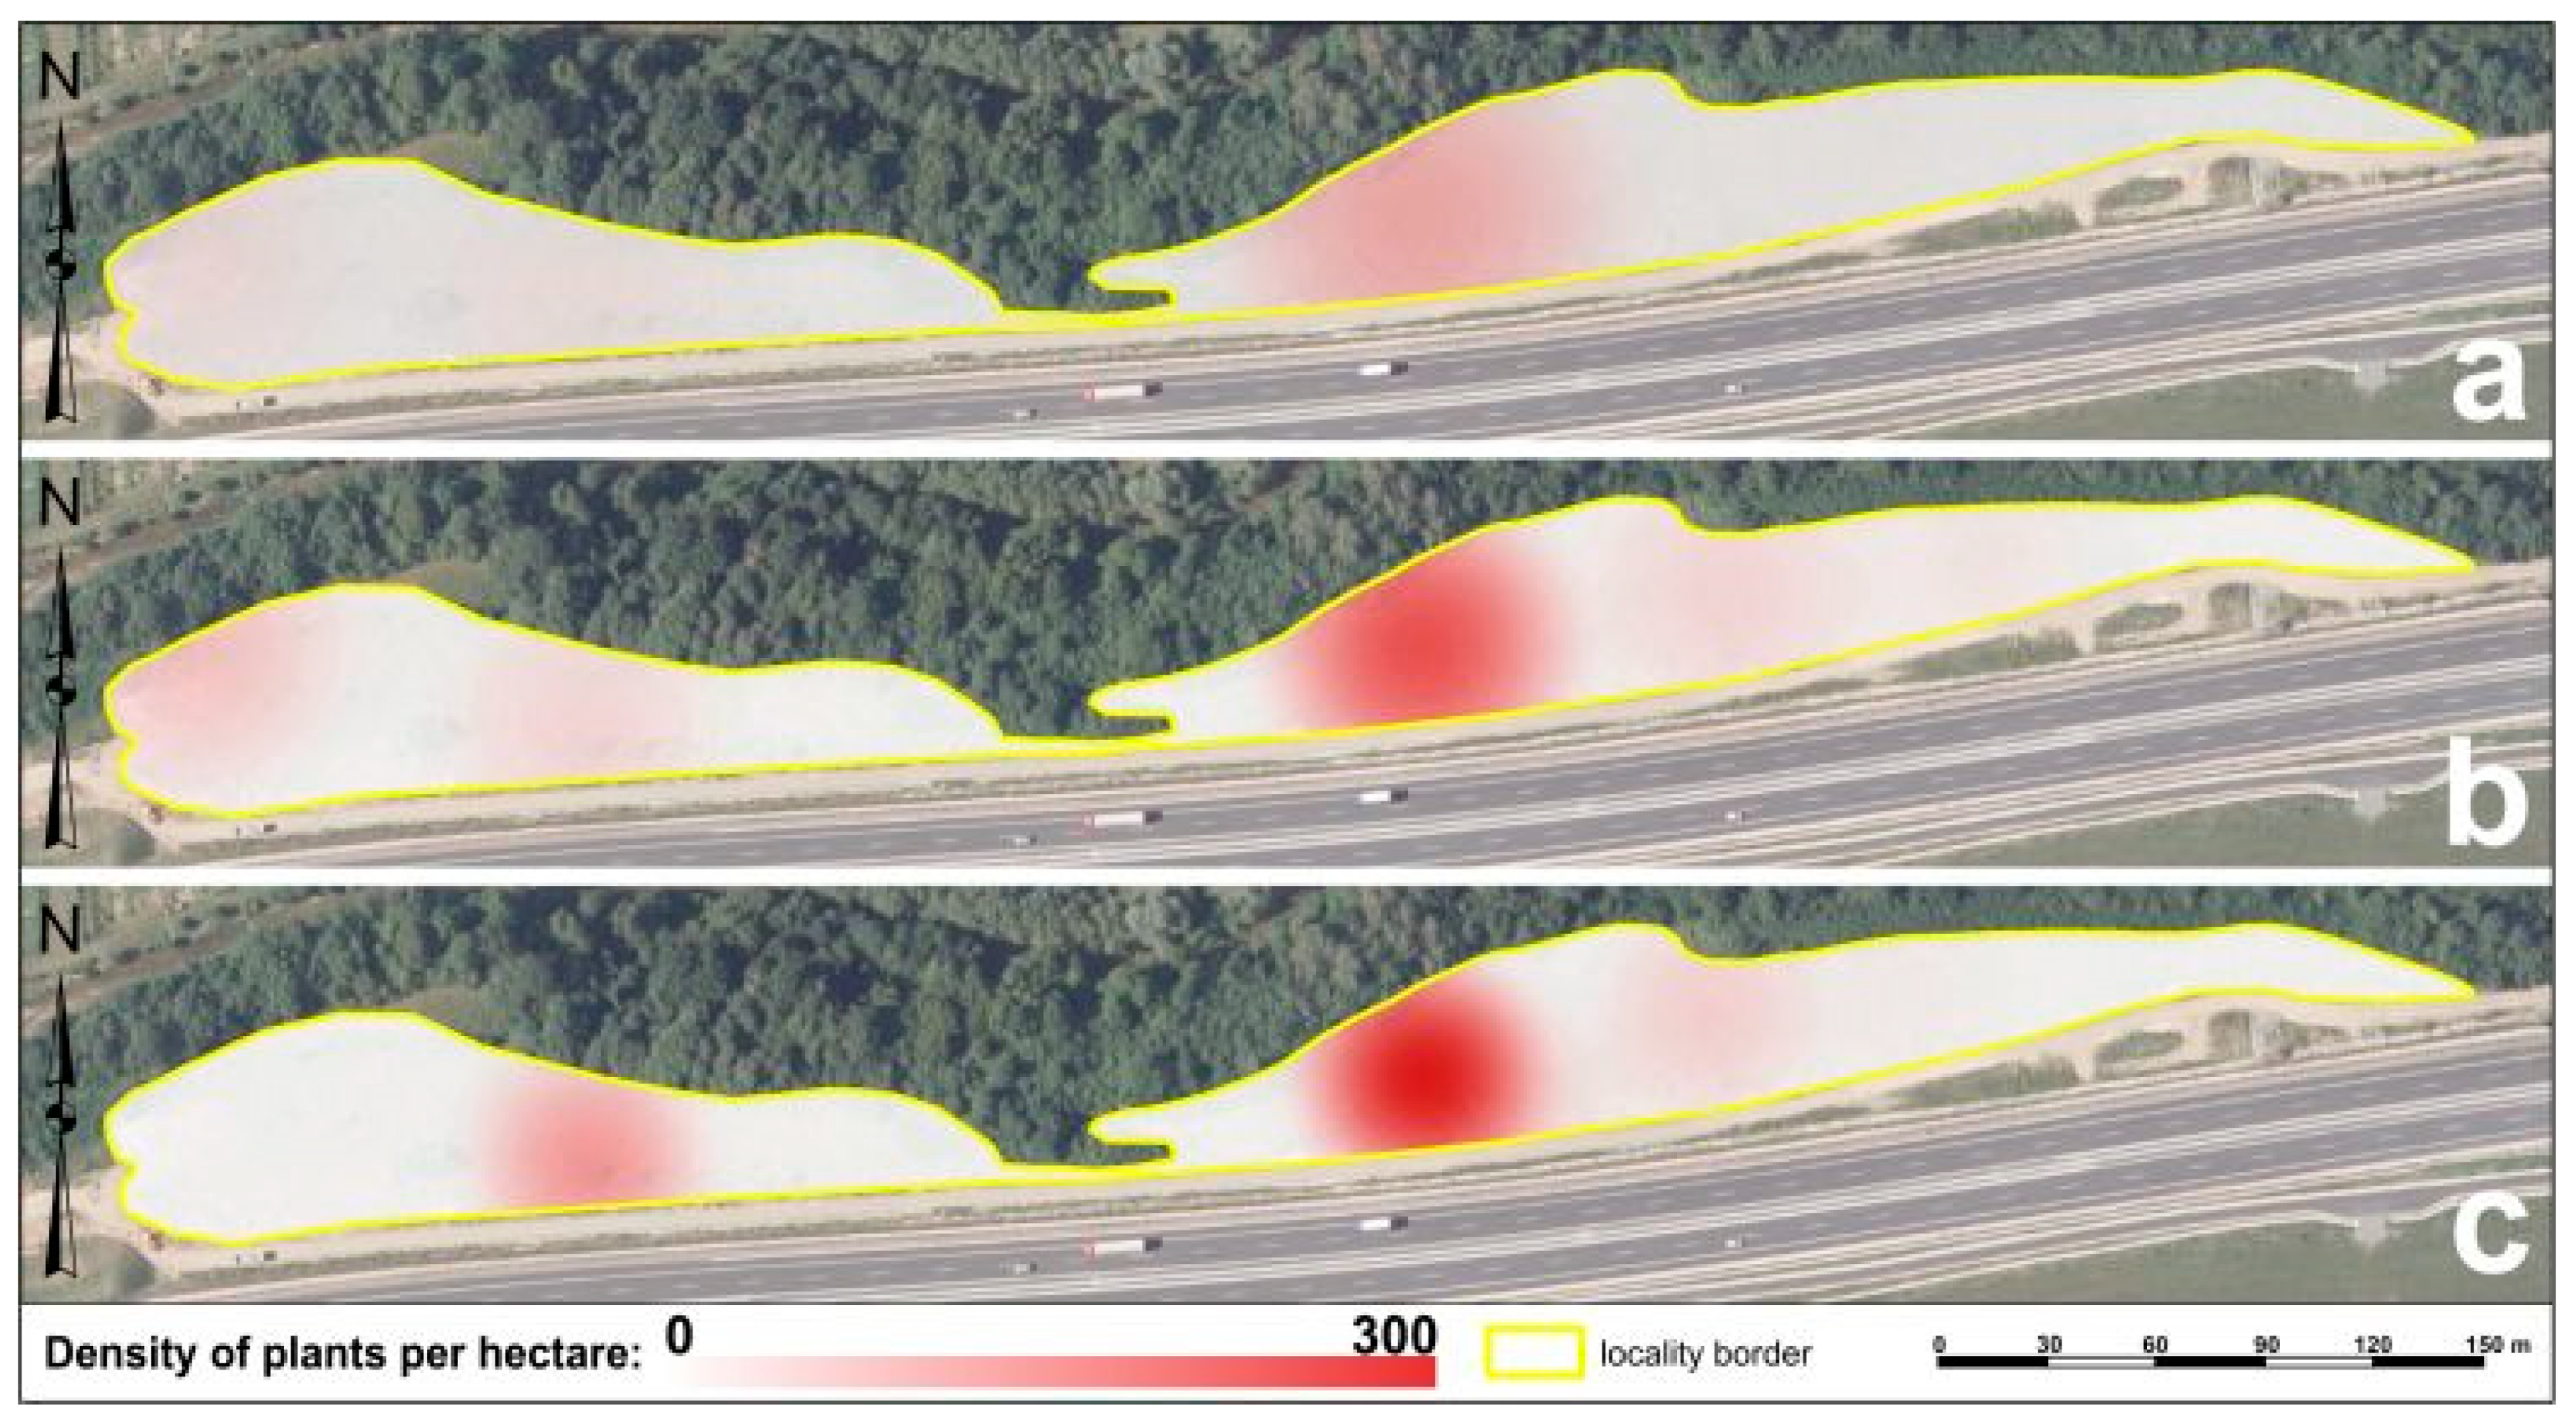
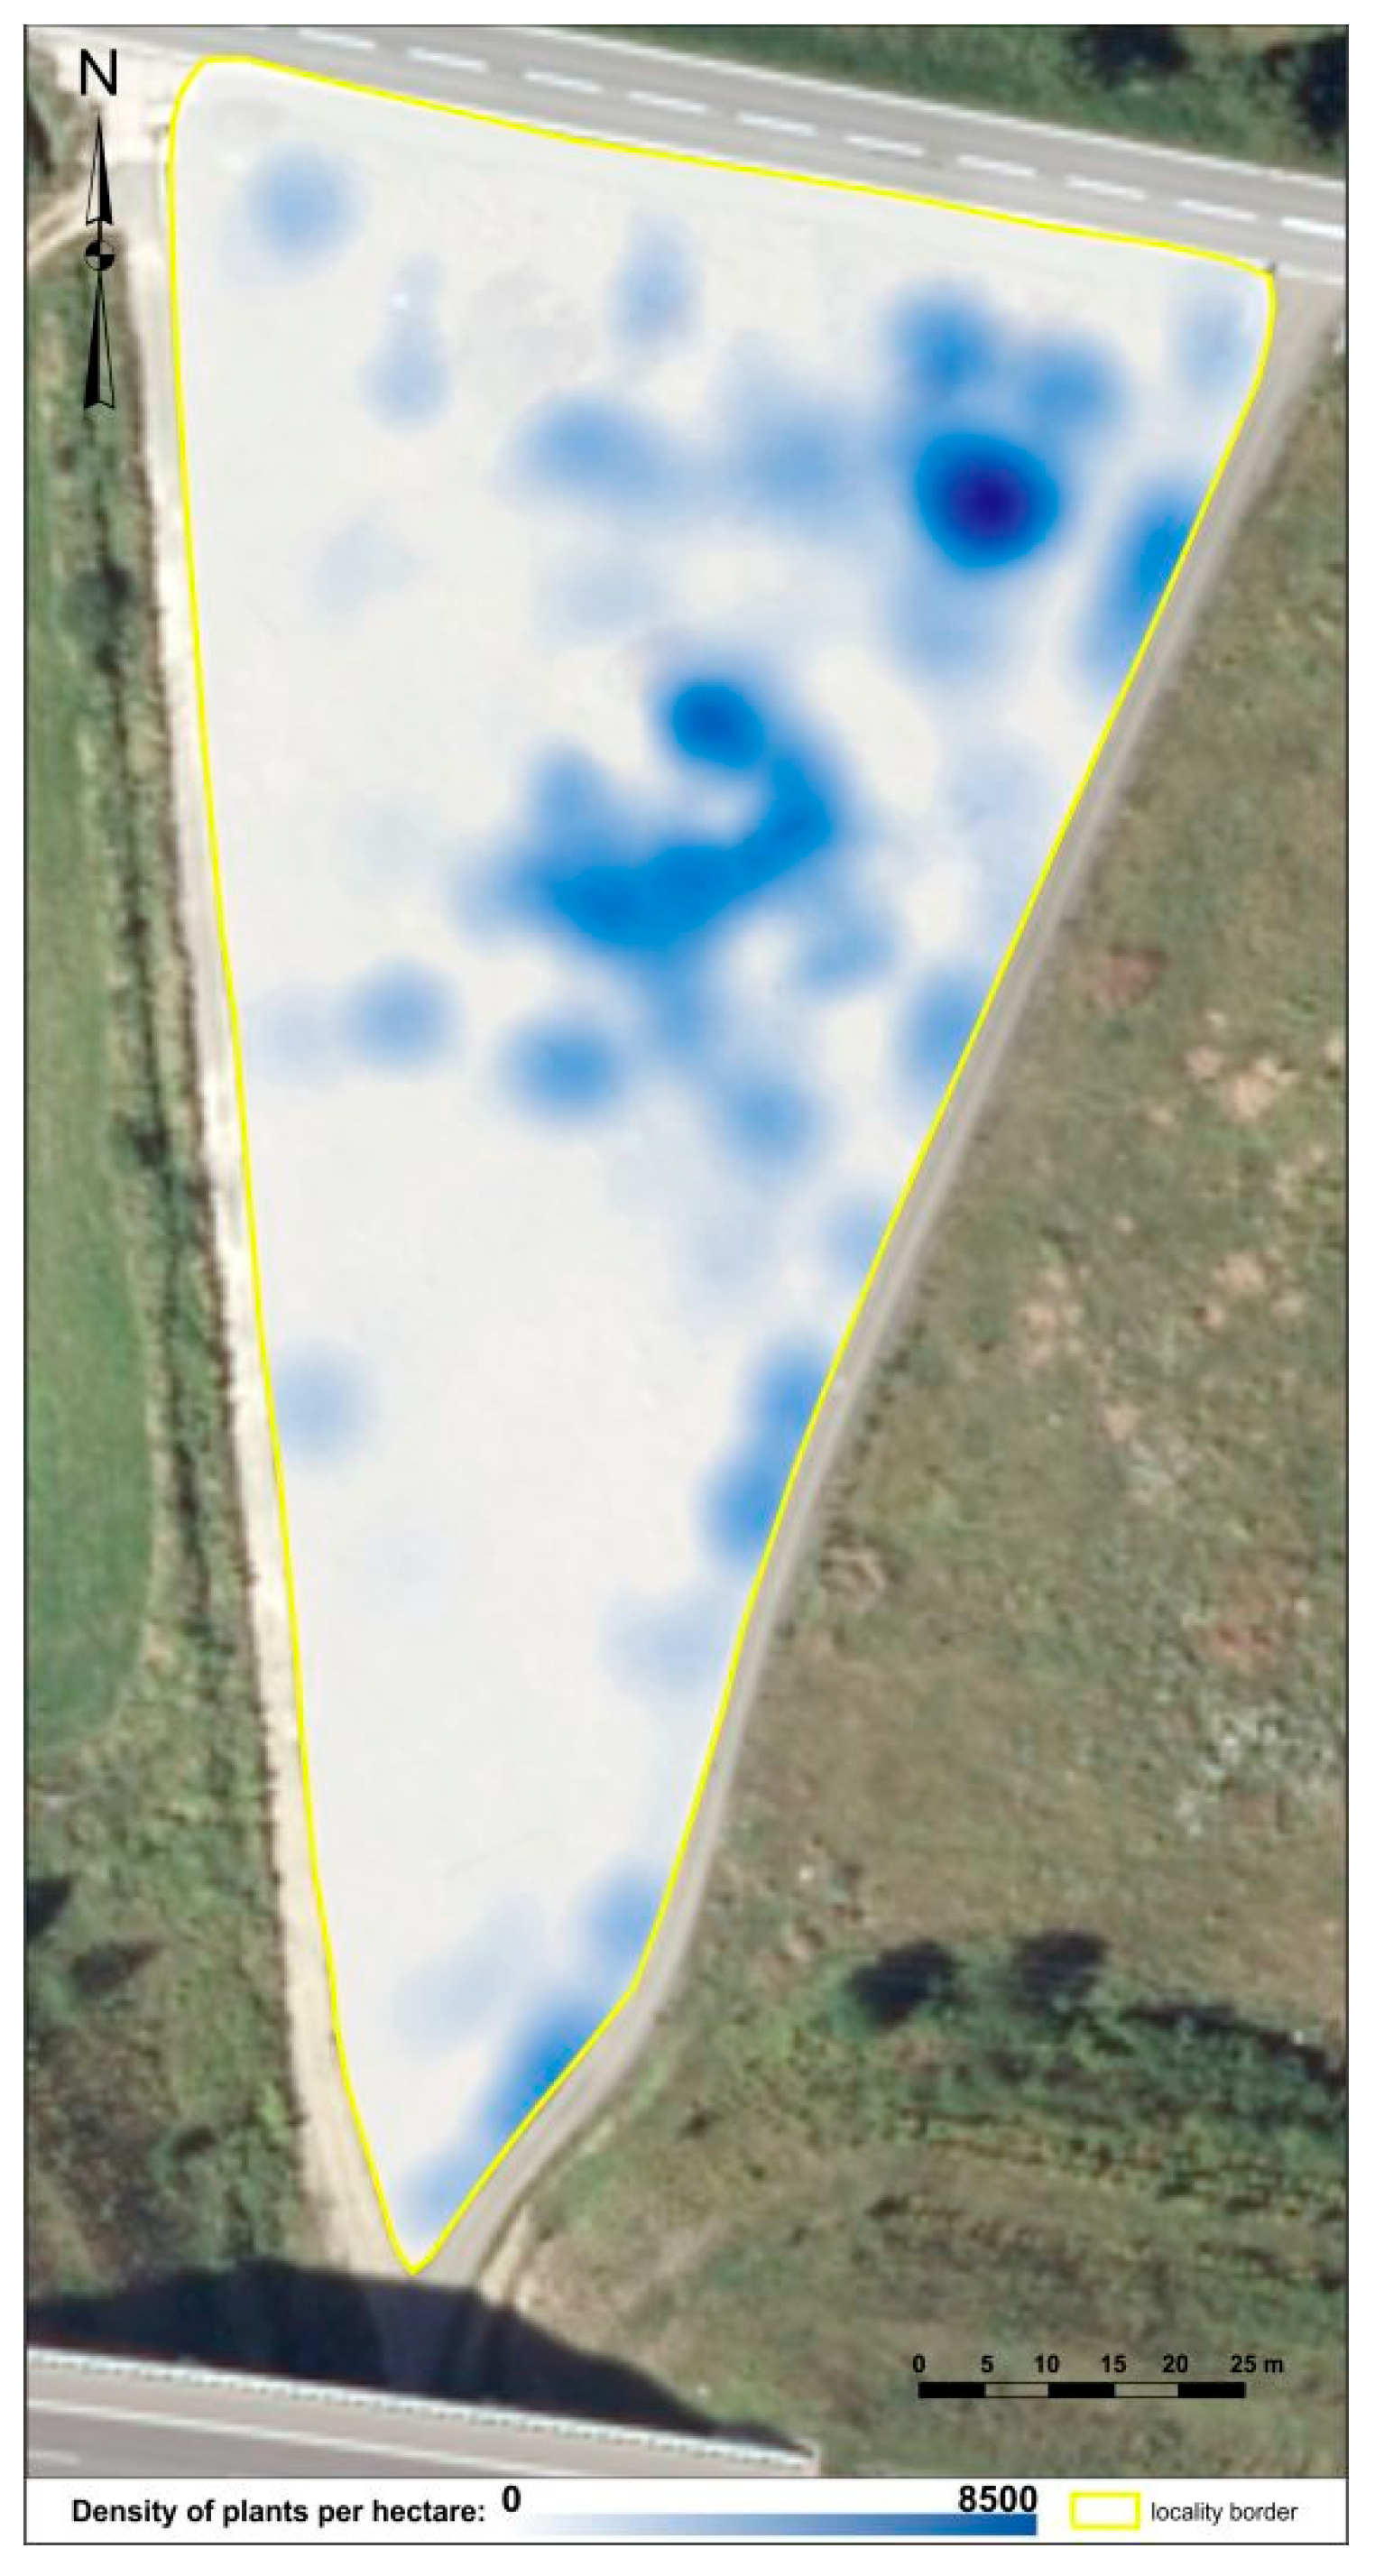
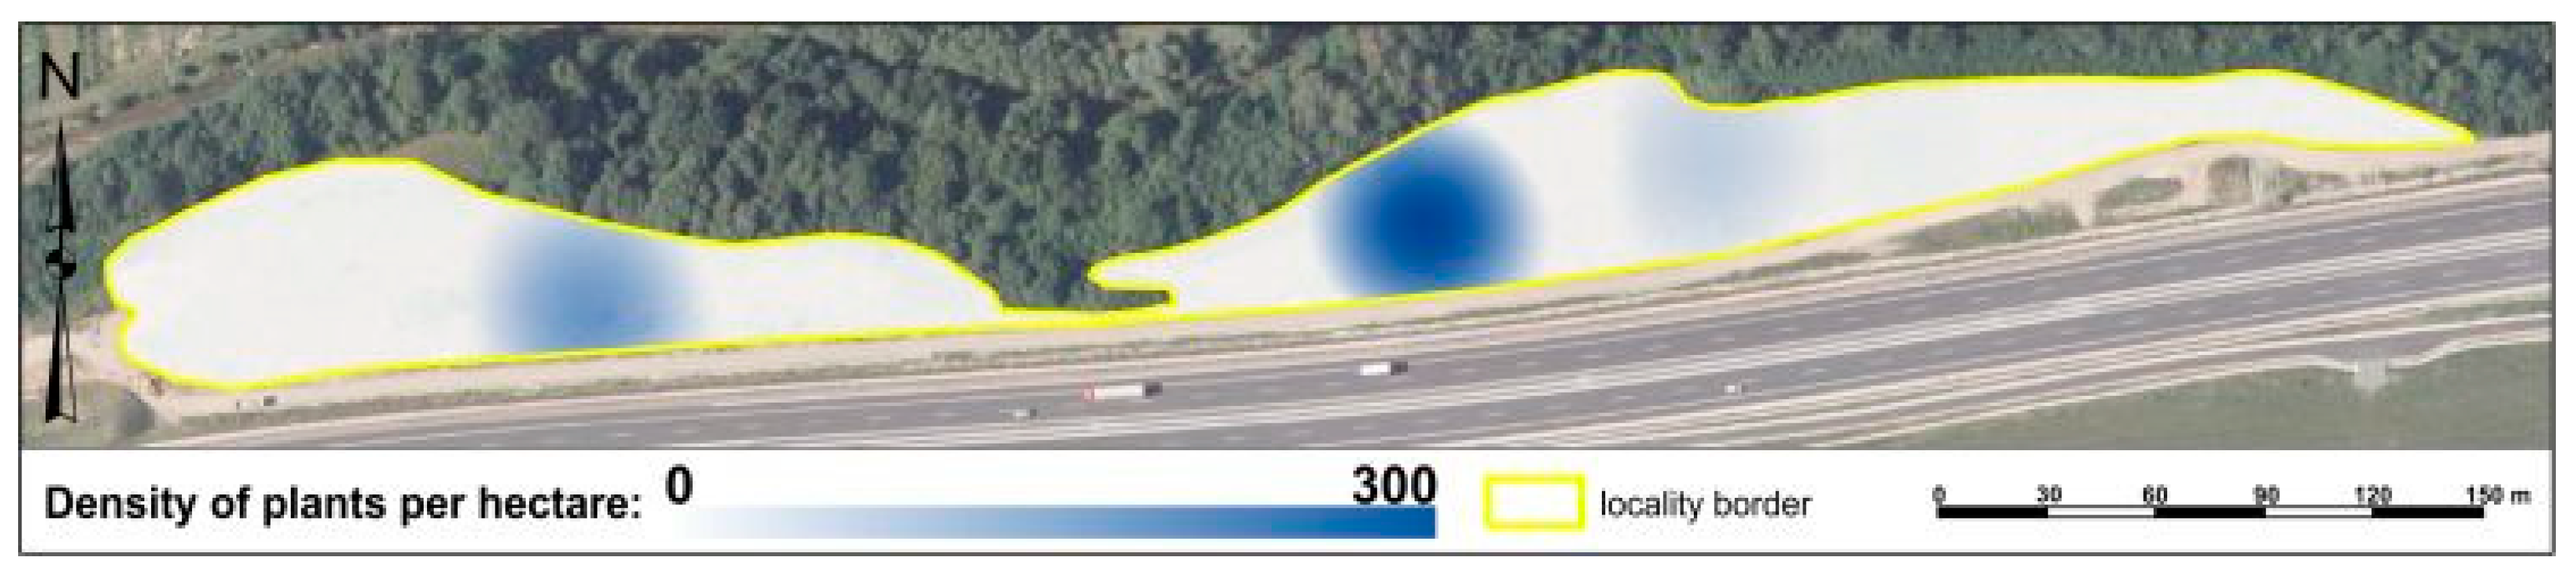
2.7. Kernel Analysis of Plant Density

The first step in the analysis was to calculate the standard distance for each layer with the function spatial point pattern analysis by tools of SAGA GIS software (System for Automated Geoscientific Analyses). Subsequently, we used the formula:
h   =   [ 2 3 n ] 1 / 4 σ
where (h) is used to calculate the radius based on the standard distance (σ) and the number of the noticed points (n) [37]. Reached radius was then used in the function Kernel density estimation. Plant density was then calculated based on focal map algebra with the using focal average, while the result was the density of plant shoots at squared meter. Using a raster calculator, which work on the principle of local map algebra, the value of each cell was converted to the number of plants per hectare. In this way, we determined the plant density for all three monitored years in both mentioned localities.

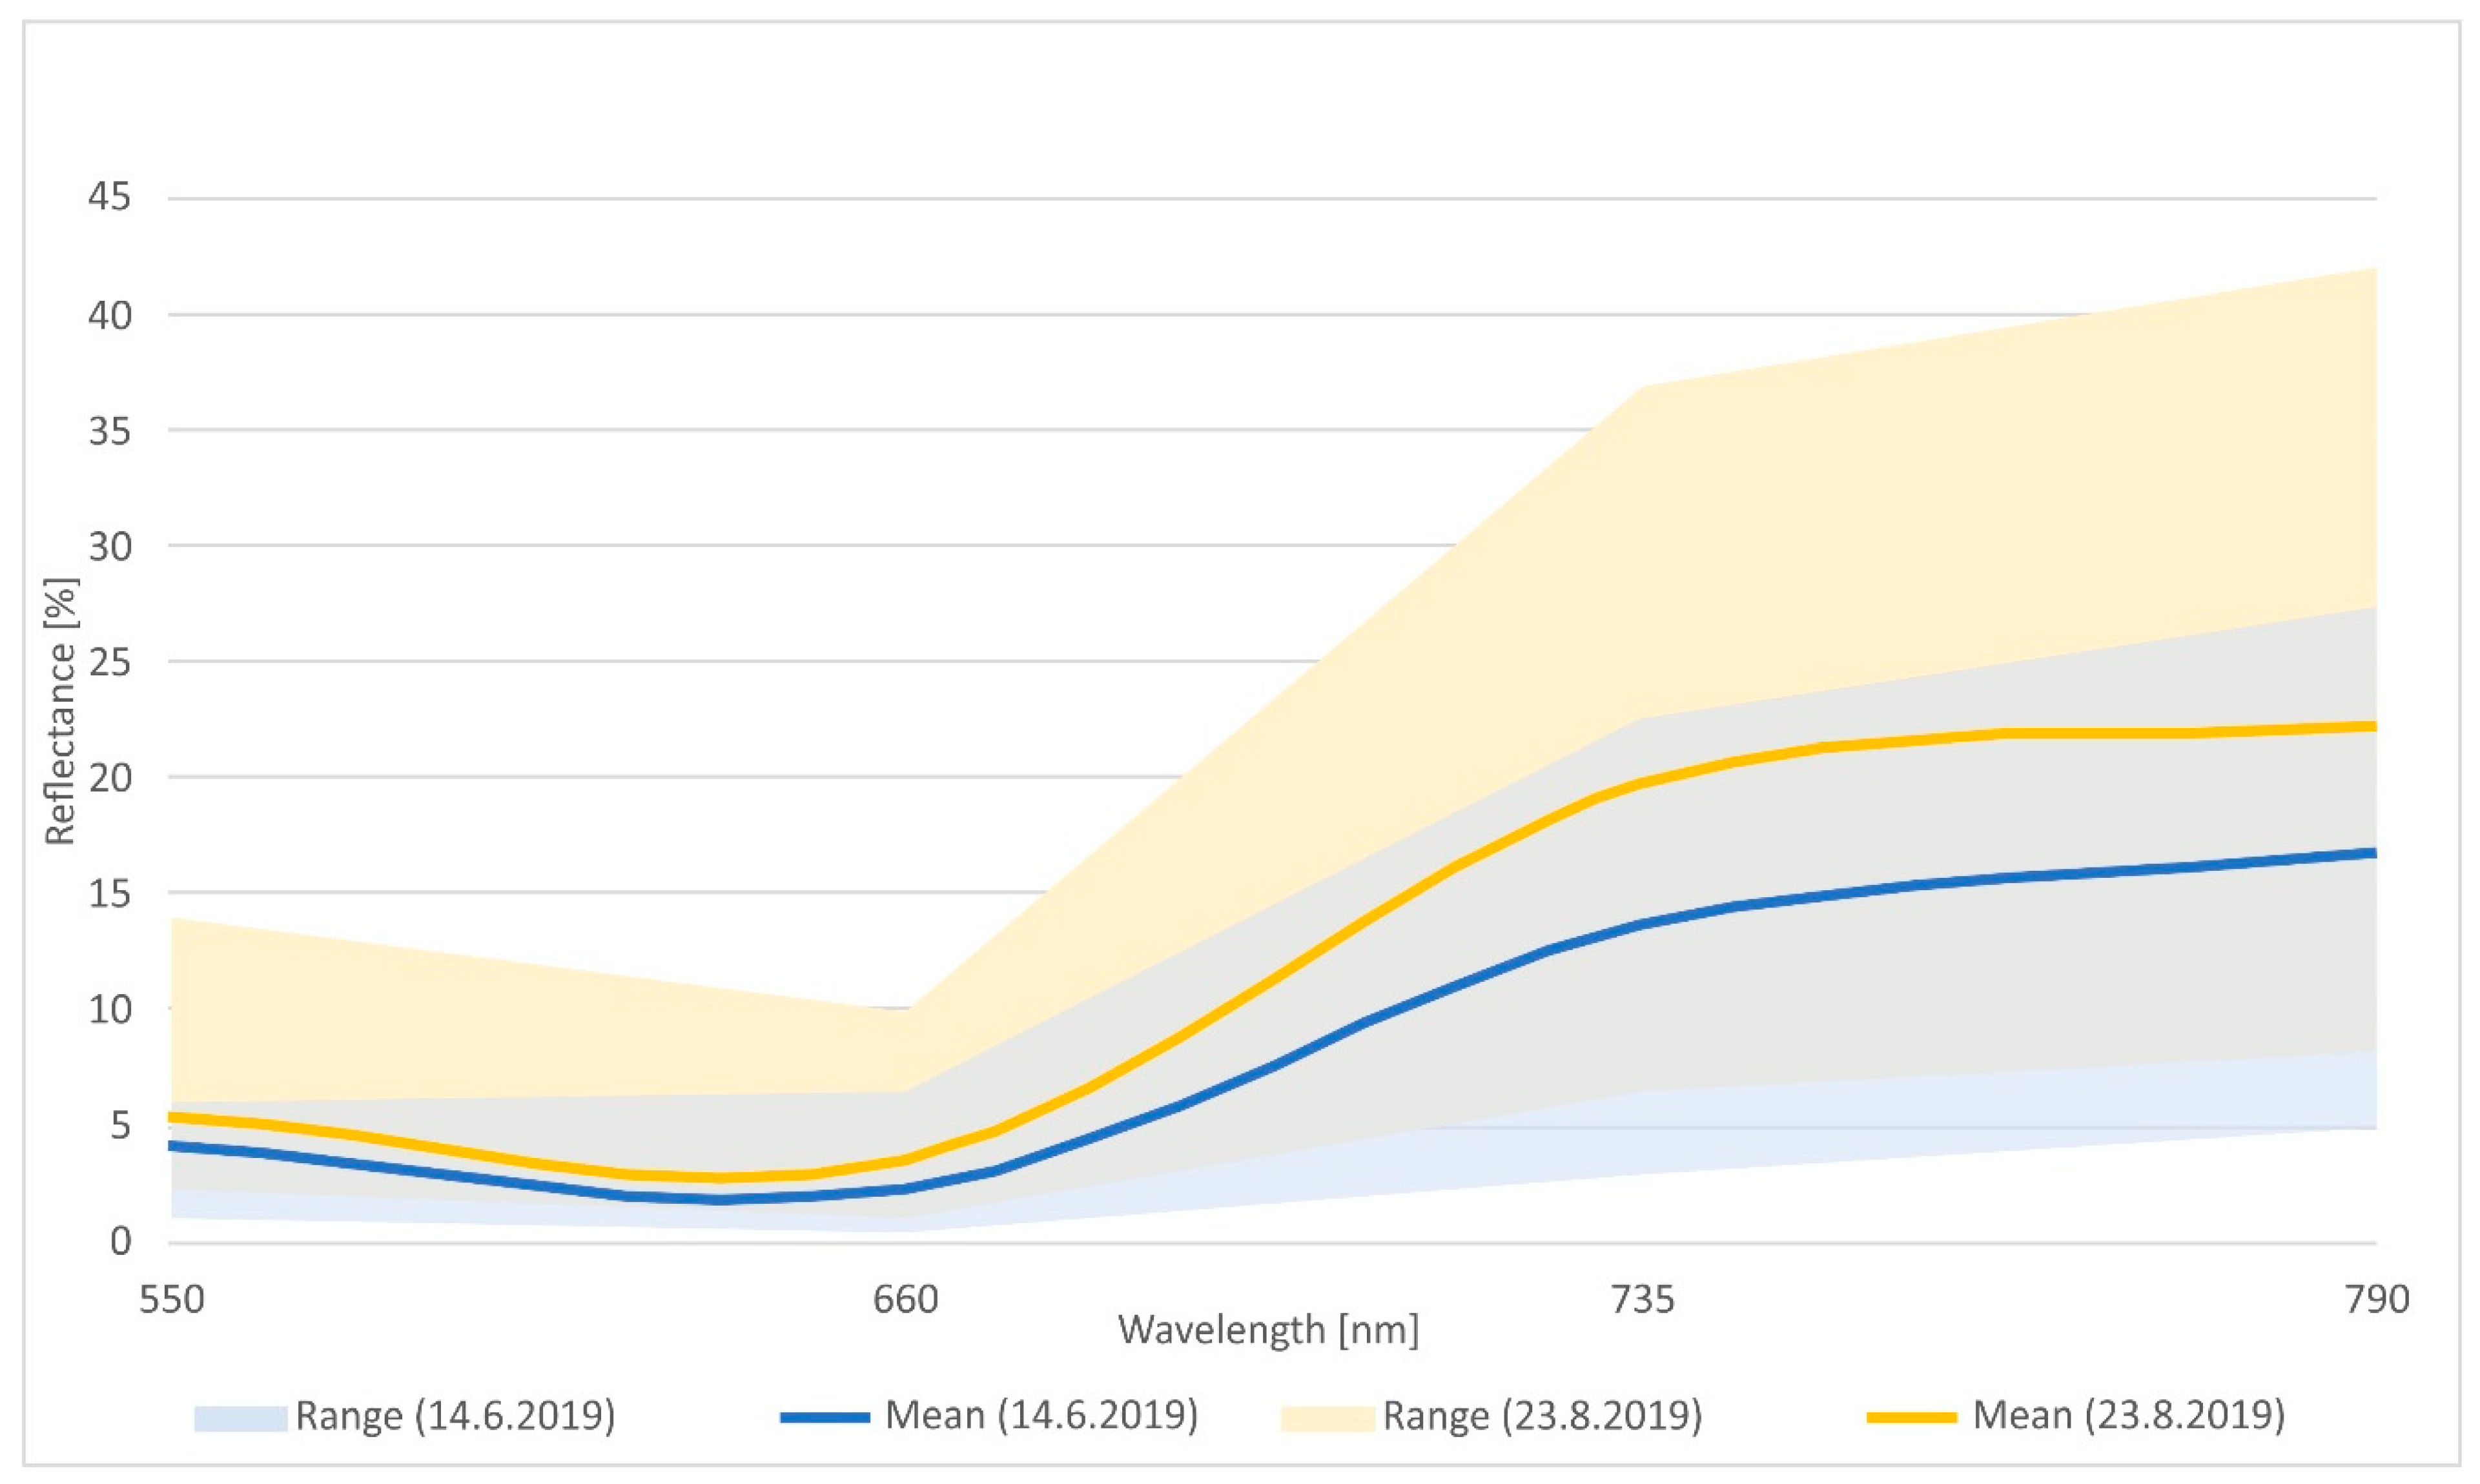
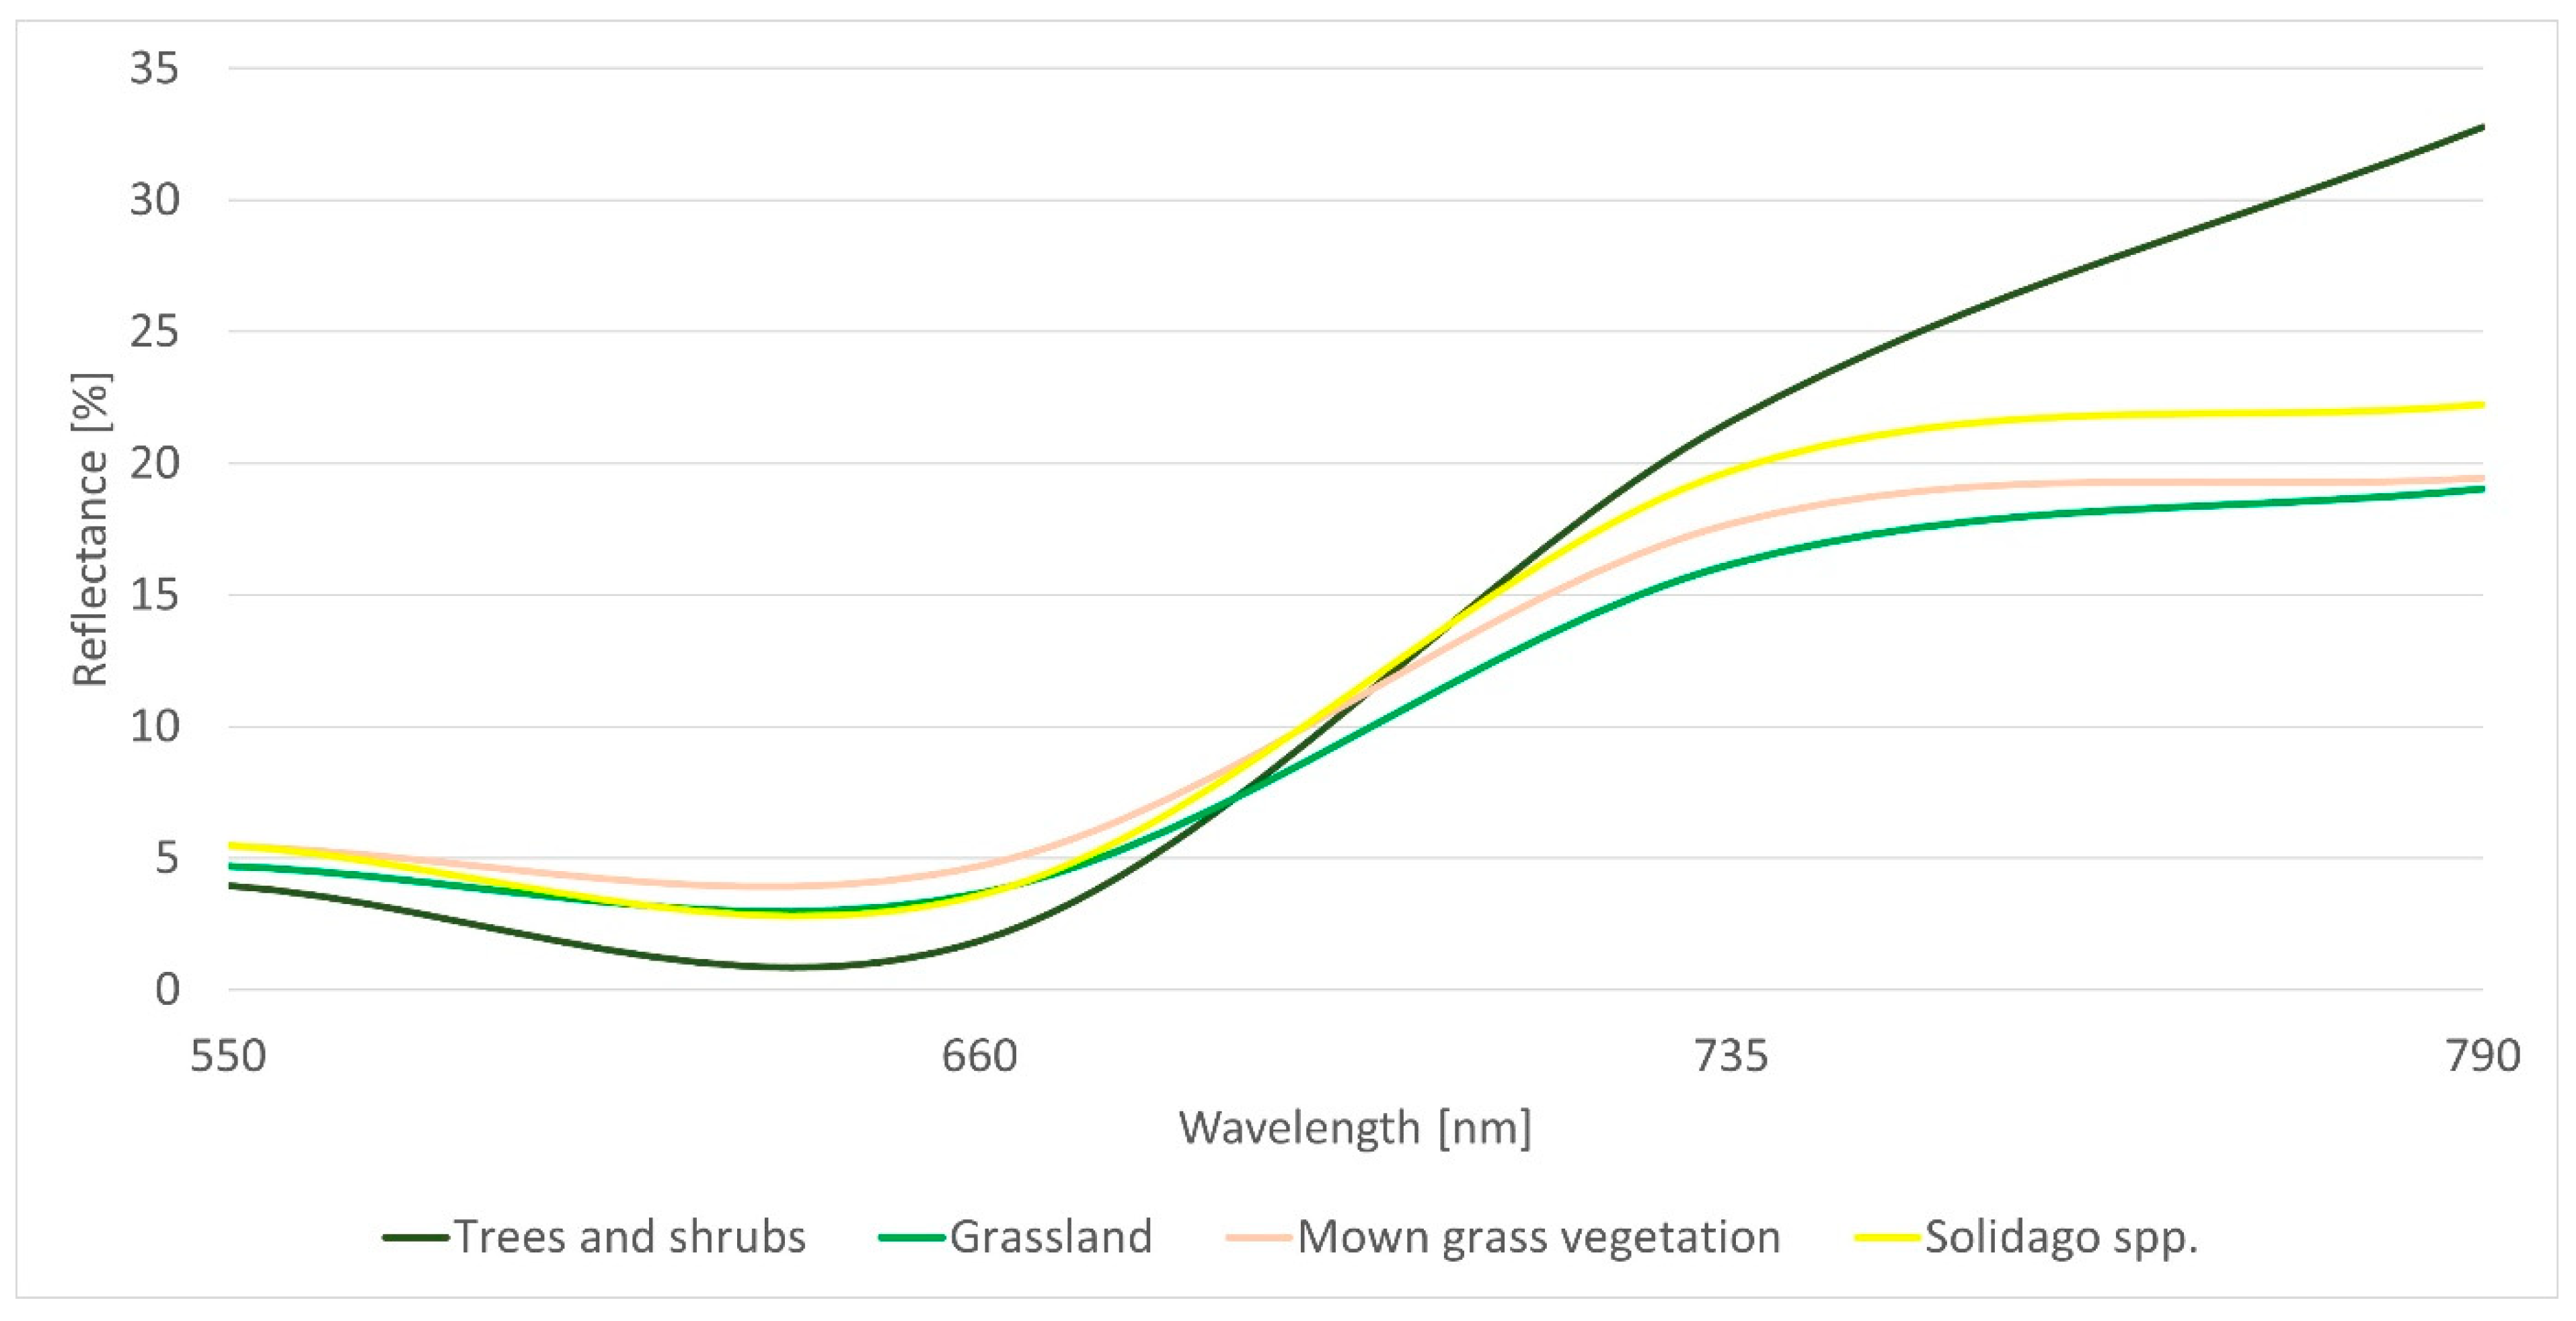
2.8. Evaluation of Spectral Reflectance of Selected Invasive Plants Using Multispectral Drone Imaging

We used methods and remote sensing tools for the monitoring at the locality of Malý Šariš within the vegetation season 2019. The aim of the approach was to investigate the possibilities of the mapping of invasive Solidago spp. Spreading by using multispectral image collection following by supervised classification. Due to the small size of the monitoring locality as well as the low penetration of Solidago spp. Spread, scanning with a sufficiently high spatial resolution of the resulting multispectral images was necessary. For this purpose, we used the configuration of the system of unmanned aerial vehicle DJI Matrice 200, which carried a Parrot Sequoia multispectral camera via a gyroscopic gymbal. This minimized sensing errors due to vibrations that occur during drone flight. The Parrot Sequoia camera is primarily intended for monitoring vegetation by scanning in four spectral bands (green—550 nm, red—660 nm, red edge—735 nm and near-infrared—790 nm), which are most suitable for the analysis of the reflective properties of vegetation. The camera also has a standard RGB camera, which allows for image collection in the visible spectrum of electromagnetic radiation and subsequent creation of orthophotos. The camera captured the locality of Malý Šariš according to a predefined image flight from a height of 30 m, which in the end resulted in final images with a spatial resolution of 3 cm. Taking pictures also required a series of ground measurements aimed at positioning artificially signaled ground control points via RTK GNSS device of the Topcon brand Hiper HR. Position information on plants was also used as part of the ground measurements of Solidago spp. from 2019. During the image flight, 350 images were created for each spectral band as well as images in the visible spectrum. These images were subsequently processed via Agisoft Photoscan software. This software uses the method Structure from Motion to derive a cloud of 3D points using central raw projection images and their mutual overlap defined when planning the parameters of the image flight. This point cloud software was used to interpolate the digital elevation model which used images of the area in the final orthorectification. In the process, multispectral images are radiometrically calibrated by means of a calibration scan of the target before the actual image collection, to eliminate the interfering effects of reflections from the surroundings of the scanned area, which distort the real reflectivity of the area of interest. Finally, multispectral images have a radiometric resolution of 16 bits, which allows us to split the values of reflected electromagnetic radiation up to 65536 levels. Scanning monitoring of the locality of Malý Šariš was performed in two time periods, 14 June 2019, i.e., at the beginning of the Solidago spp. growing season, and 23 August 2019, i.e., on its blooming phases. The above-mentioned time periods was chosen for the comparison of reflection properties of Solidago spp. in different stages of its vegetation cycle. To determine the spectral reflectance, a network of points was used to which the reflectance level values were taken electromagnetic radiation via the Add raster values to points functioning the environment of the geographic information system QGIS. In the case of the Solidago spp., it was an irregular network of points from location data aimed through RTK GNSS. In the case of other vegetation, we covered the area of the monitoring site with a regular network point with a spacing of 0.5 m. These points were divided into tree or shrub class vegetation, spontaneous grass vegetation and mown grass vegetation.

3. Results

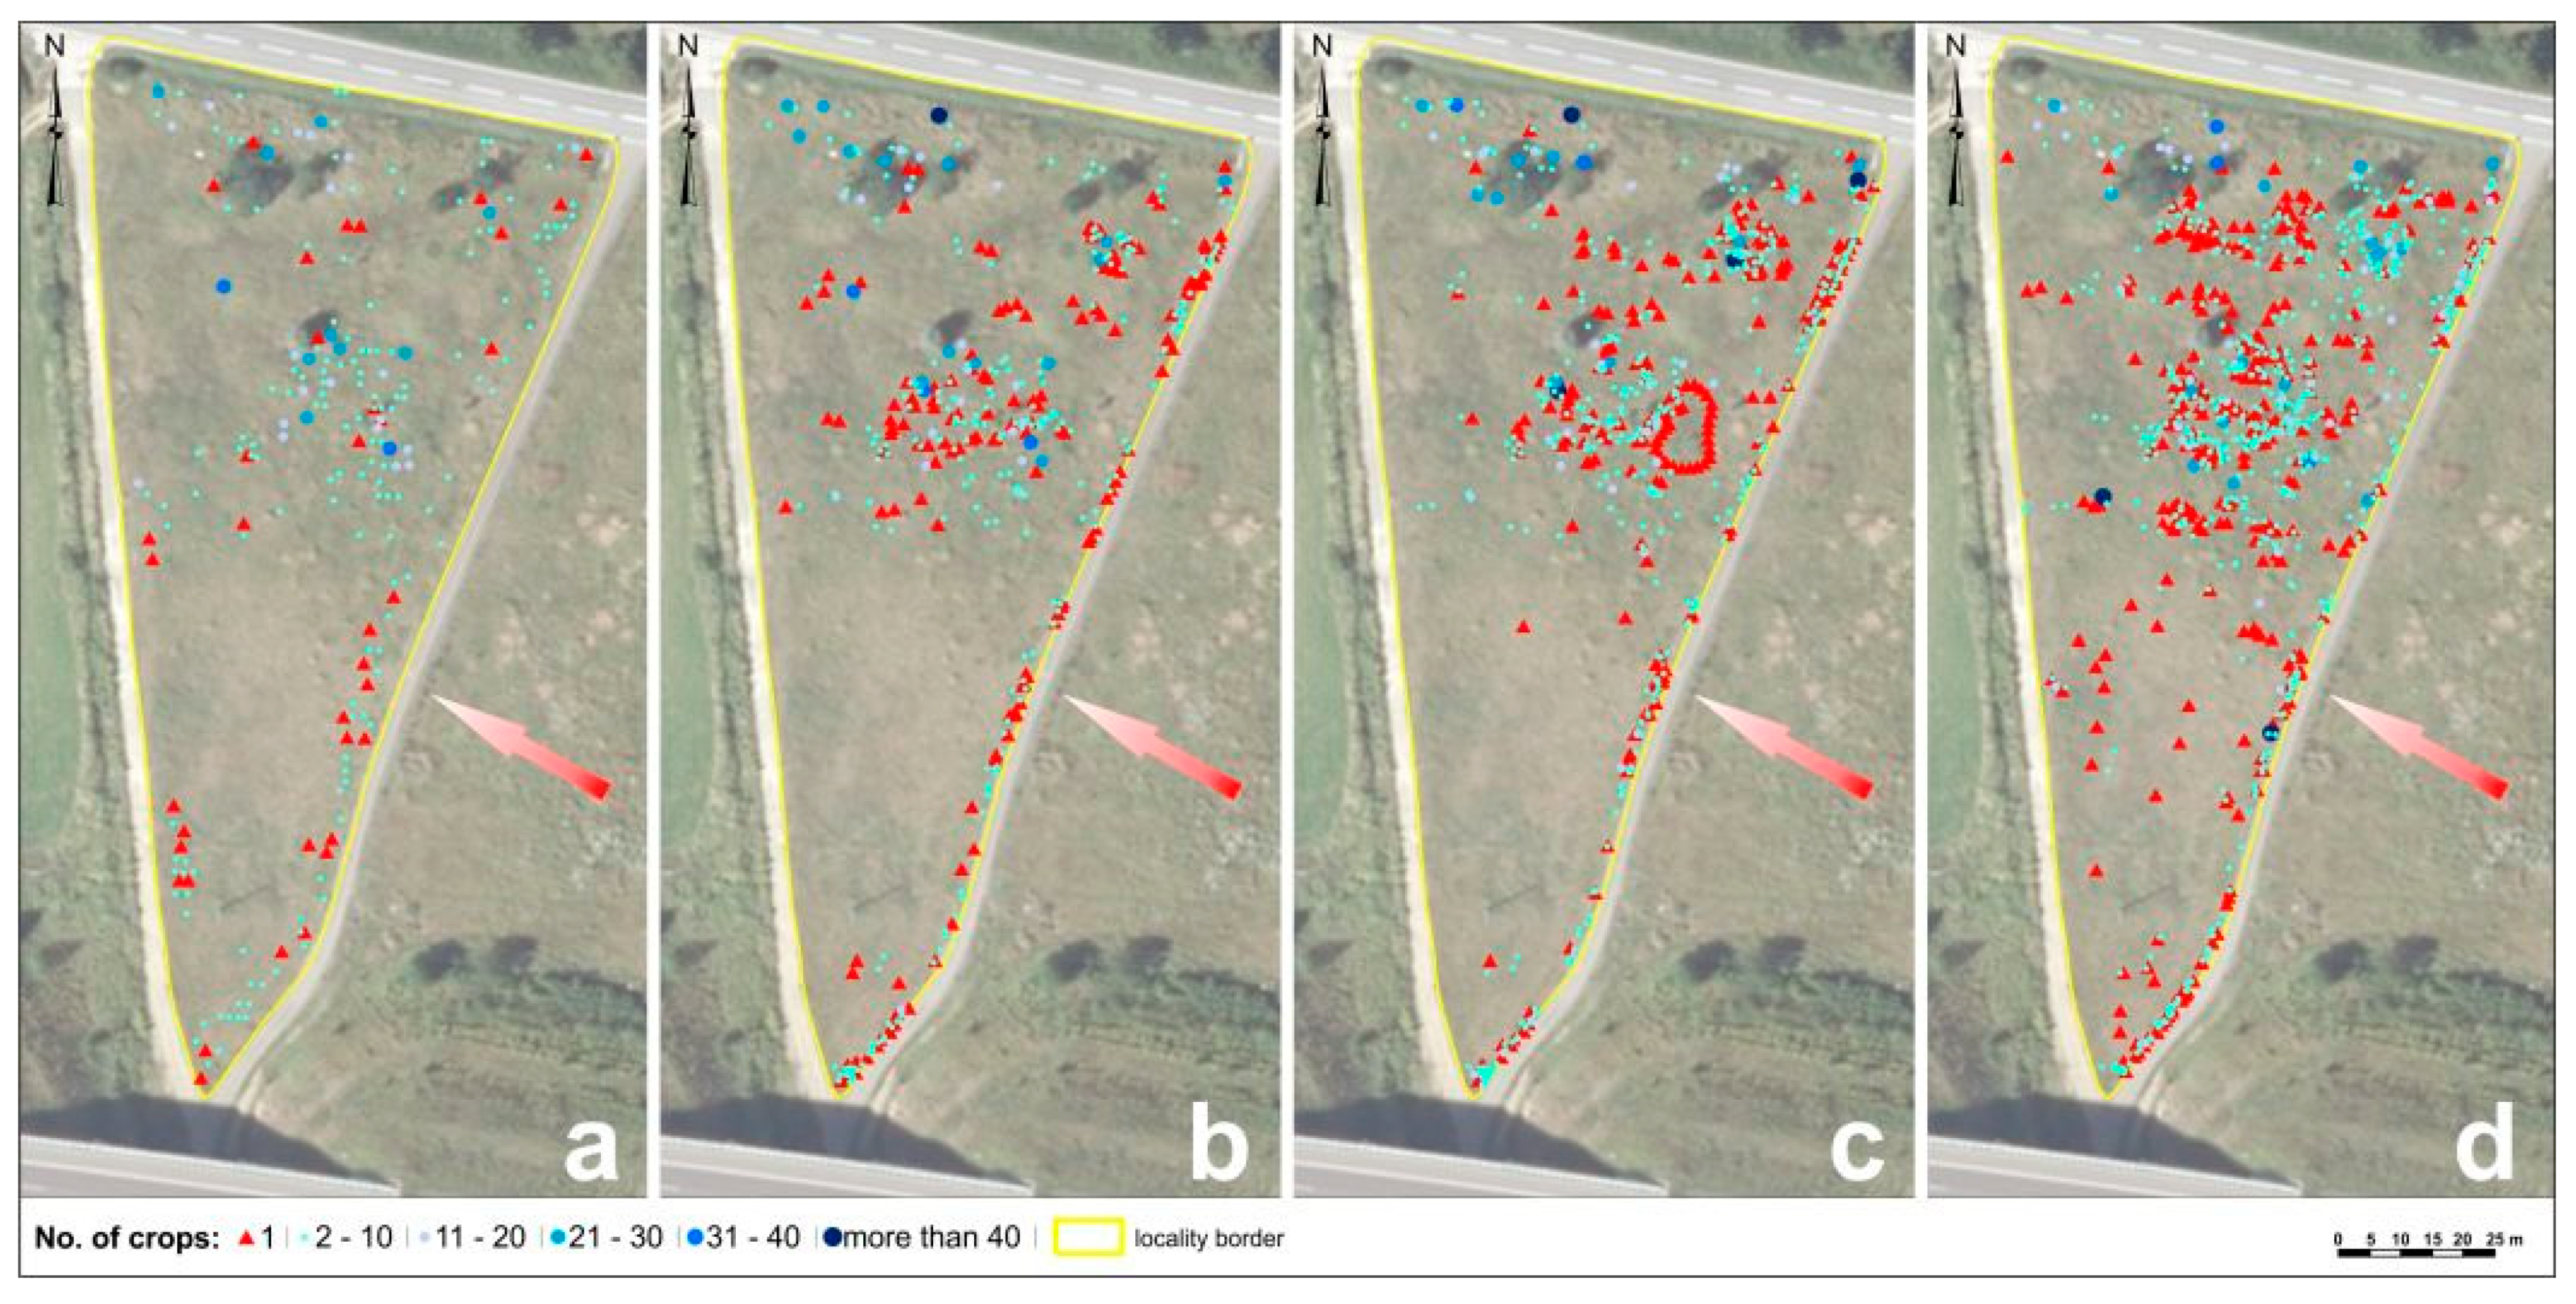
3.1. Mapping the Spread of Solidago spp. via GNSS at the Research Localities

3.1.1. Mapping the Spread of Solidago spp. via GNSS at the Locality of Malý Šariš

We monitored 1258 shoots of Solidago spp. in 2016 in Malý Šariš. After calculating, it was determined that there were 1553 shoots per hectare. Individual plants, called ramets, numbered 37 and the rest were unevenly placed in 221 genets, while the lowest number of shoots in genet was two and the highest number was 32 (Figure 2a). In the next year, 2017, we evaluated the increased number of Solidago spp. Shoots, which was 1865. From this number, there were 161 ramets and 265 genets. The highest number of shoots in genet was 48 and the lowest number was two. After calculating, there were 2331 shoots per hectare (Figure 2b) [38]. In the third monitoring year, 2018, we evaluated 2523 shoots. A total of 180 plants were noted as ramets, and 2343 plants were a part of 412 genets. The shoots are in genets distributed unevenly, while the lowest number of shoots in genet was two and the highest number was 50 (Figure 2c). In the year 2019, we evaluated 3934 shoots of Solidago spp., which presented 4856 shoots per hectare. We noticed 324 ramets and 661 genets with a different number of shoots. The minimum number of shoots in genet was two and the maximum was 42 (Figure 2d). After four-year monitoring of Solidago spp., we can notice the trifold number in the locality of Malý Šariš. This is very dangerous for the native flora. In the figures below, the monitored area is bordered by the yellow color, ramets are marked with the red triangle and genets based on the number of the shoots by different color. The arrow indicates the expected direction of distribution of the Solidago spp. population from the source site [39].

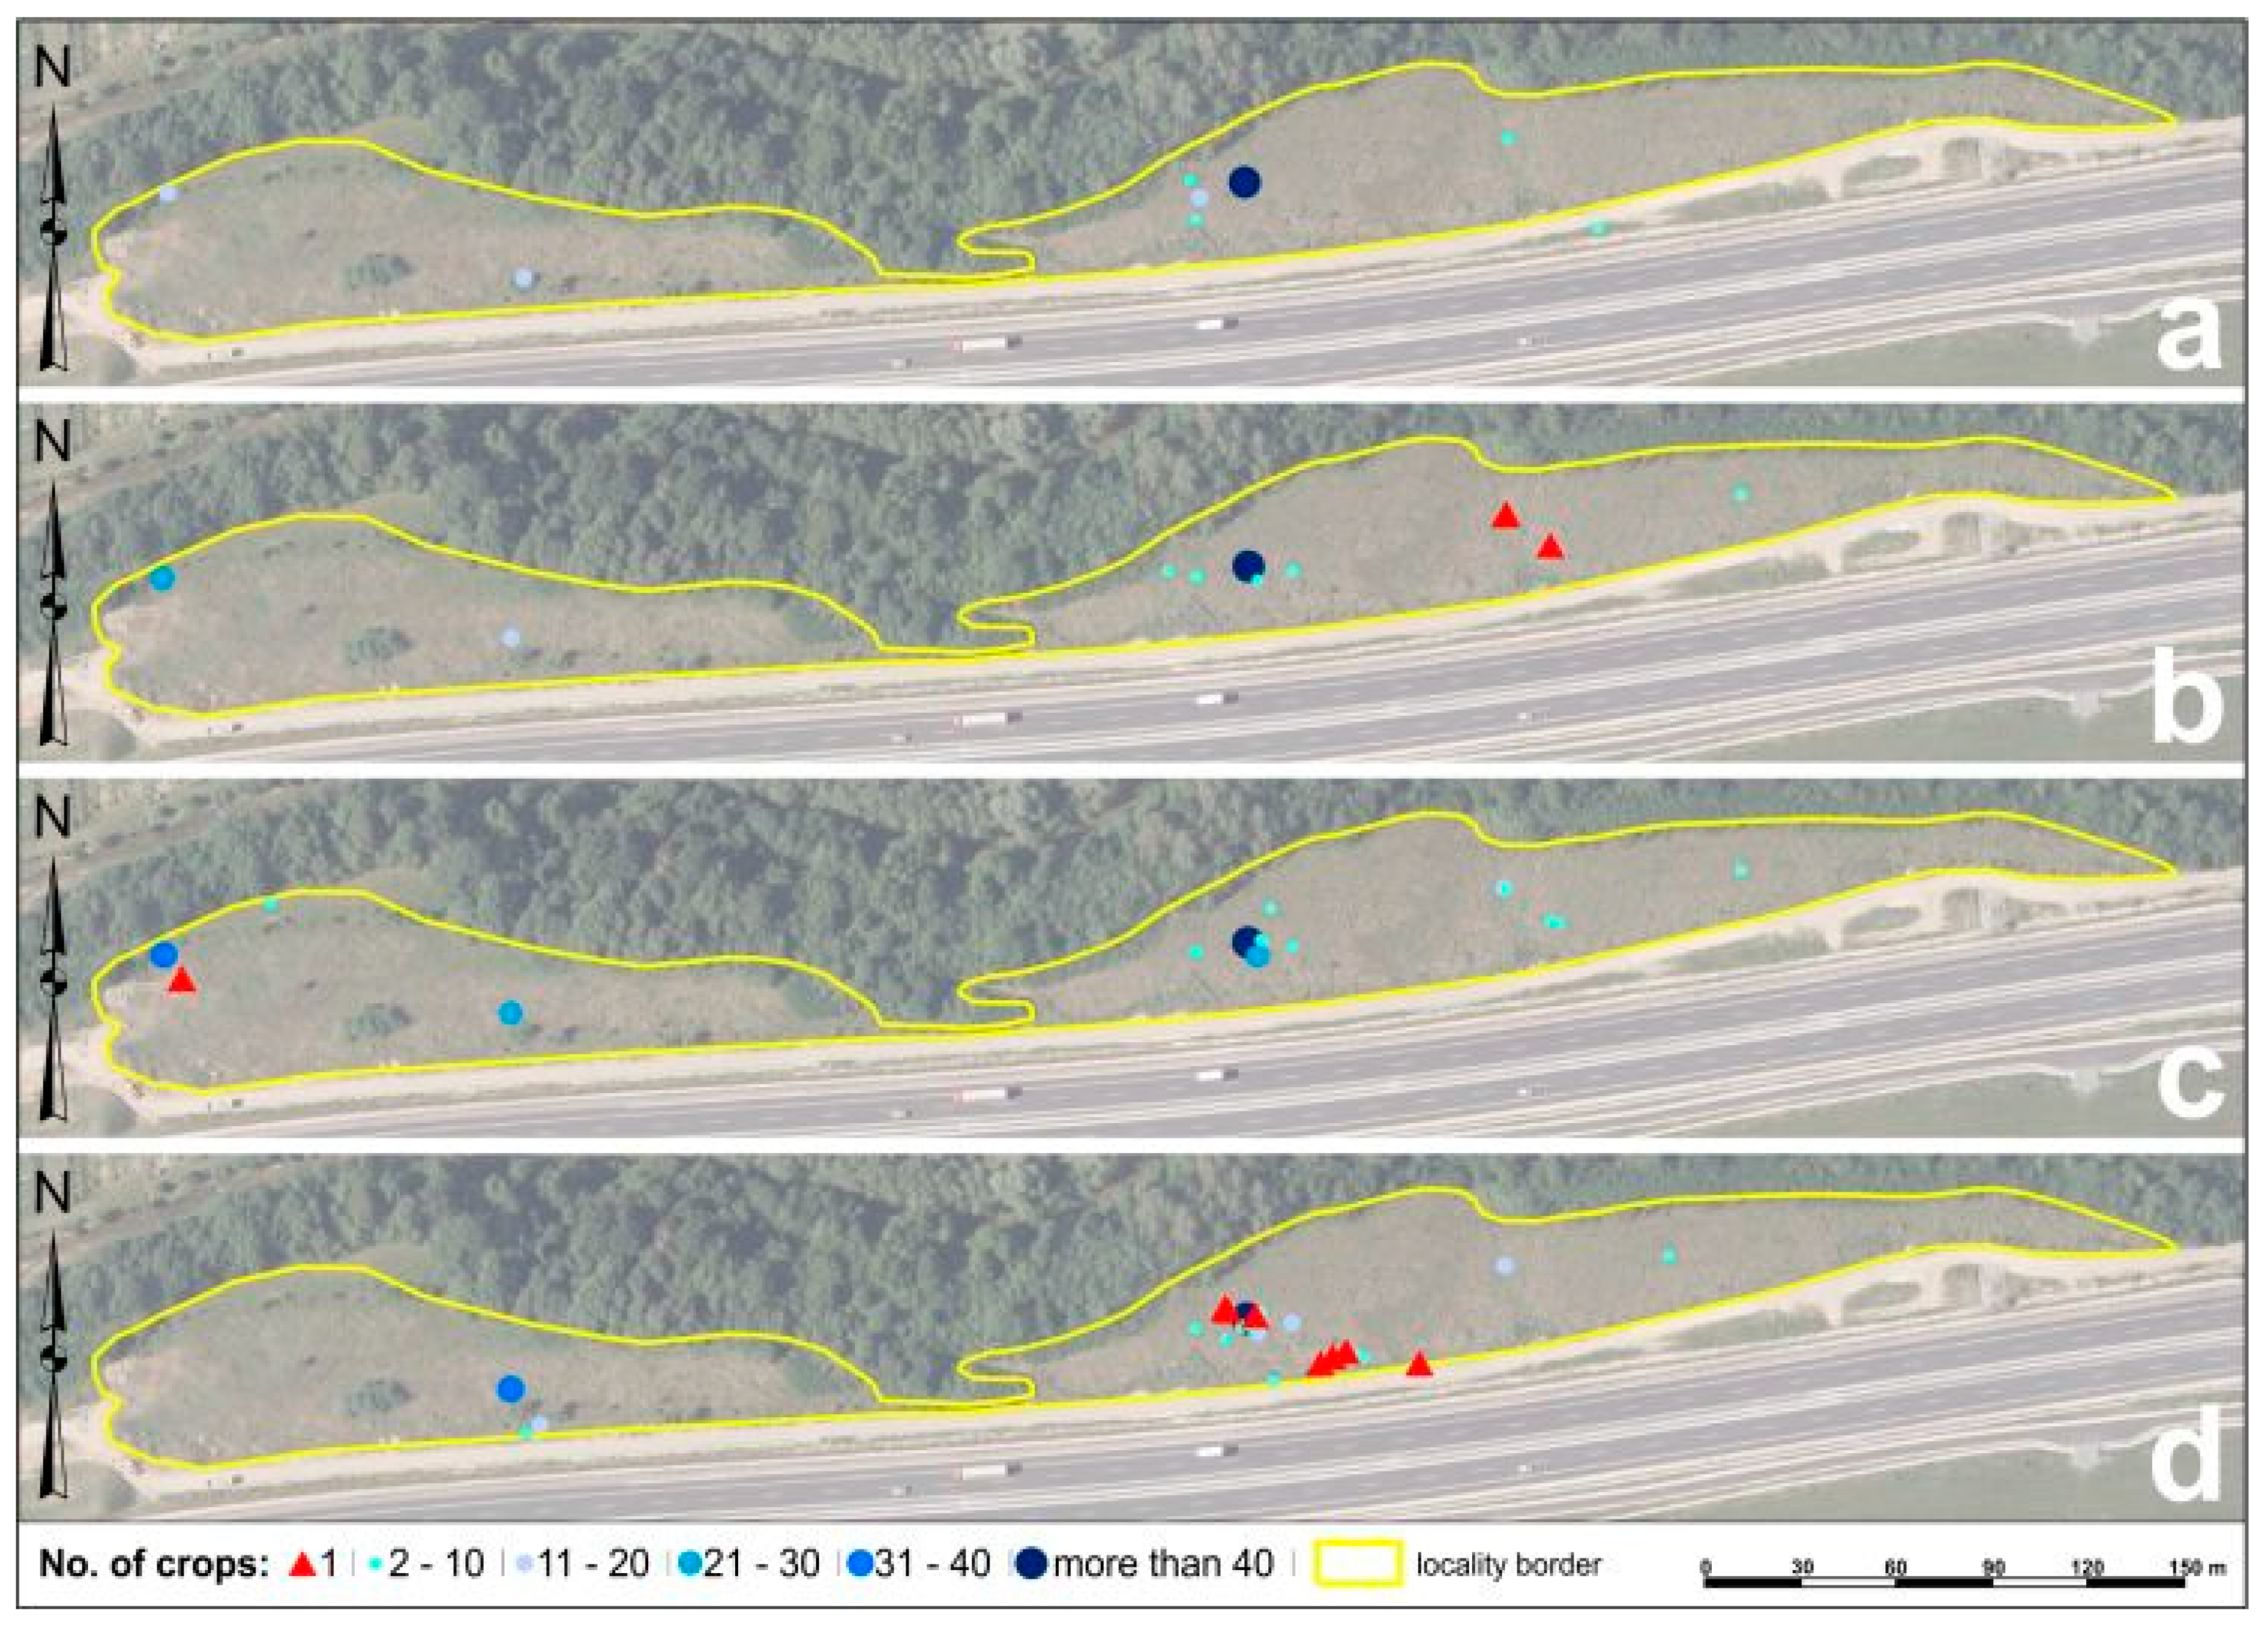
3.1.2. Mapping the Spread of Solidago spp. via GNSS at the Chminianska Nová Ves Locality

There were monitored 116 shoots of Solidago spp. in 2016 at the locality Chminianska Nová Ves. After calculation, it was determined that there were 41 shoots per hectare. We evaluated eight genets and no ramets (Figure 3a). The minimum number of shoots was two and maximum was 61. During the second monitoring year in 2017, we evaluated increased number of shoots 156. We noticed three ramets and 13 genets with minimum two shoots and maximum 85 shoots. This presents 54.9 shoots per hectare (Figure 3b). In August 2018, we evaluated 244 shoots of Solidago spp.; none were evaluated as ramet. Plants were in 17 genets, in which the minimum number of shoots was 2 and the maximum number of shoots was 100. The number of shoots that occurred in this locality after calculating increased by 85 per hectare (Figure 3c). In the last year of mapping, 2019, Solidago spp. spread was evaluated to be 209 shoots, from which, seven were ramets. The rest of the plants were distributed in the 24 genets with a maximum of 41 shoots (Figure 3d). In the figure below, the monitored area is bordered by the yellow color, while ramets and genets are marked with different colors depending on quantity.
Within the monitored localities, we learned several facts by comparison of data obtained by mapping during the years 2016 to 2019. The number of shoots increased by 48.3% at the monitored locality of Malý Šariš, between 2016 and 2017. As can be seen in Table 2, a rapid quadruple transmission was recorded in the numbers of ramets, but in comparison with the numbers of genets, an increase of only 19% was achieved [36]. A comparison of data from 2018 and 2019 showed an increase in the number of shoots by 80% from 180 to 324, but also an increase in the number of genets by 60%. During the four monitored years, we can observe that the number of all recorded shoots increases up to threefold. Within the Chminianska Nová Ves locality, a lower number of Solidago spp. shoots were recorded compared to the locality of Malý Šariš. During the first two monitored years, the total number of shoots increased by 34.5%. The highest plant growth was recorded in 2018, when the number of shoots increased by 56.4%. On the other hand, in 2019, we found that the number of shoots decreased by 14.3%.

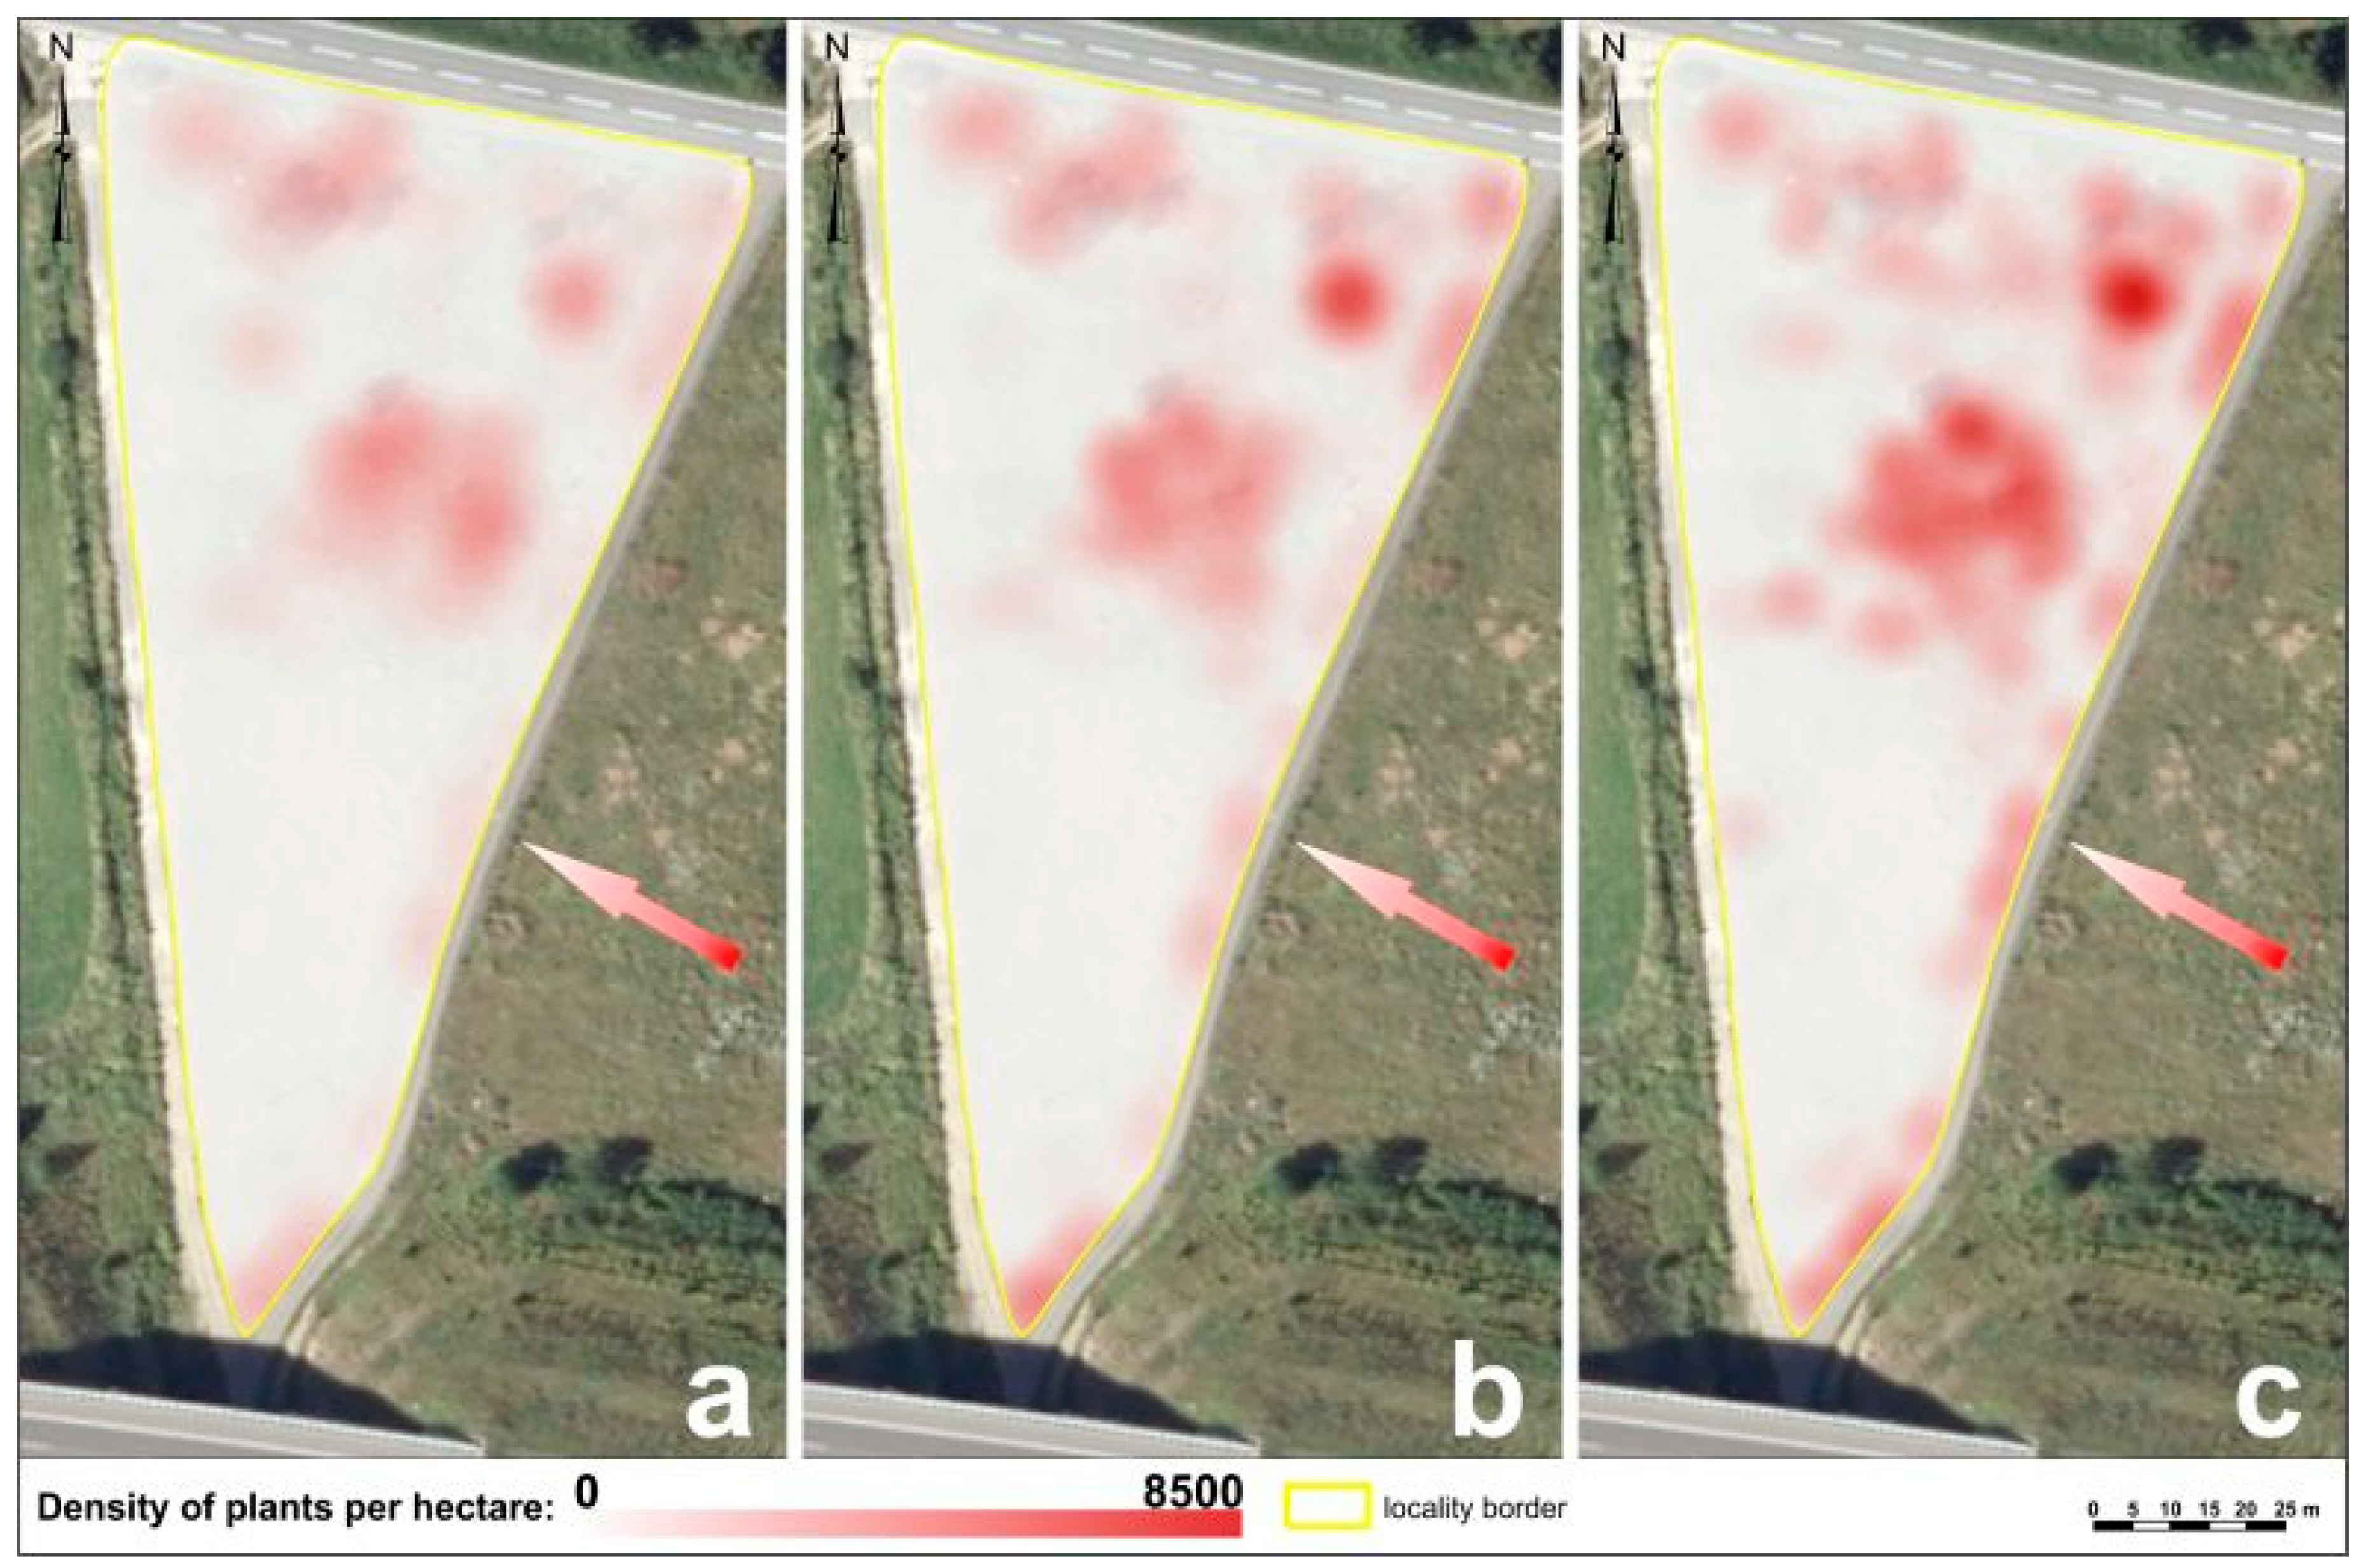
3.2. Analysis of Solidago spp. Changes in Propagation through Spatial Analyzes Using GIS in Research Localities

3.2.1. Analysis of Solidago spp. Changes in Propagation through Spatial Analyzes Using GIS in Malý Šariš

The highest density of the investigated plant species was in the range from 8500 to 9000 plants per hectare at the locality of Malý Šariš. In the year 2017, we evaluated the density of up to 500 plants per hectare. As seen in Figure 4a, the highest density was noticed in the Northern site close to trees vegetation. The following year, we evaluated increased plant density up to 1500 plants per hectare. In Figure 4b are visible areas with orange and red color, which represents the density of more than 3500 plants per hectare. The most visible changes in plant density were noticed in 2019 (Figure 4c) when we evaluated a decrease in the areas with lighter color and an increase in dark colors. The areas with plant density higher than 4500 plants per hectare increased, which are highlighted in red. We noticed areas in the South-West of the investigated locality with increased occurrence of the Solidago spp. in 2019. Before this year, the locality was affected by human activity and no invasive plants were spread. Plant density decreased in the North-East and in central area of the investigated locality, where the tree and shrub vegetation is located. We, therefore, assume that higher vegetation may represent a certain barrier to the transmission and spread of seeds by wind from the source site, as well as over dense of different plant species could be not impenetrable for the genets spreading. In this part of the investigated area, there is a greater capture of seeds, which are transmitted by cars passing on the adjacent road. Another area of increased density of Solidago spp. is located along the eastern boundary of the site, where there is a field road separating our research area from the so-called seed bank, i.e., the source site, which means that the released seeds do not have to overcome any significant obstacle to their spread.

3.2.2. Analysis of Solidago spp. Changes in Propagation through Spatial Analyzes by GIS in Chminianska Nová Ves

Due to the lower number of recorded shoots, a lower plant density was found in the Chminianska Nová Ves locality than in Malý Šariš. Plant density ranged between 1 and 305 plants per hectare. It is possible to see that the density shown mainly in light yellow color, from which we can conclude that the density of plants in 2017 was mostly in the range of up to 30 individuals per hectare, while the genets were distributed almost over the entire monitored area (Figure 5a). A year later, in 2018, there were only very slight changes in the density of individuals (Figure 5b). The most significant changes in the density of Solidago spp. in this locality occurred in 2019. As we can see in Figure 5c, the light-colored areas with low plant density decreased significantly and, on the contrary, the orange- to red-colored parts of the area were added, where the density ranges from 100 plants per hectare and more. This year, we recorded a lower number of shoots at the locality compared to previous years, which was also reflected in the density of plants. The number of genets decreased, which were in the peripheral parts of the territory and thus also at a greater distance from the area where a higher concentration of genets was recorded. There is no source (seed bank) locality identified near this area from which Solidago spp. seeds would spread and, at the same time, the whole locality is bordered by tree and shrub vegetation, which prevents the spread of seeds to a large extent. The investigated locality is not maintained, and the herbaceous vegetation reaches dimensions of more than half a meter and there is no space for the successful growth of new ramets, which may represent a barrier to the spread of invasive species. Therefore, the number of shoots increases only in small parts, where the most shoots were recorded during all monitored years, i.e., it is the area with the highest plant density per hectare. Although the locality is bordered by the motorway, we can say that it does not significantly contribute to the spreading of Solidago spp., as was the case in the locality of Malý Šariš.
In addition to the calculation and representation of plant density for all three years, we also determined the difference in plant density between 2019 and 2017 for both selected localities. The difference in density is also visualized in figures by a color scale from white, which represents the lowest differences in density, to a dark color, which in turn shows the highest differences in density. Furthermore, by classifying the rasters, we calculated their acreage, which we were able to quantify the growth levels of Solidago spp. in these localities, the largest differences in plant density were found in parts near trees and shrubs in the locality Malý Šariš, which we also see in Figure 6. As mentioned above, we believe that higher plant stands prevent the transfer of seeds and ramets, which thus remain in place in front of such a barrier. At the same time, these parts are near the source site, from where we assume that the invasive species is spreading. We also observed that the areas with the highest density difference are identical to the areas where the largest increase in the number of shoots was recorded during the monitored years. The largest area (5327.32 m2) is occupied by areas where the plant density ranges from 1000 shoots per hectare. Conversely, areas with a density of over 6000 plants per hectare, which are shown in Figure 6 a distinctive blue color, occupy only 13.251 m2 (Table 3).
The highest difference in plant density was recorded in areas where we located several genets in the Chminianska Nová Ves locality, from which the seeds do not spread over long distances but remain near these clumps (Figure 7). The reason for spreading over such short distances may also be the fact that the original vegetation has created a continuous dense stand, through which the seeds of Solidago spp. cannot penetrate the soil. We can, therefore, assume that during the following vegetation periods, the number of individuals will increase mainly in the vicinity of these genets and not in the rest of the territory. Areas with a density of up to 50 shoots per hectare occupy the largest part of the territory, specifically, 8144.4 m2 (Table 3). Interestingly, however, in the lowest area, the density ranges from 150 to 200 shoots per hectare, while the areas with the highest plant density (more than 2000 shoots /ha) occupy an area of 293.53 m2.

3.3. Spectral Analysis of Solidago spp. Stands in the Locality of Malý Šariš

The increase in reflectance is higher from 1.5% for visible spectra (green and red) to 6% for border red and near-infrared radiation in the case of Solidago spp. (Figure 8). Significant differences in the reflectivity of Solidago spp. beyond the visible spectrum are identical with the general course of the reflectivity of vegetation, which is manifested by a higher reflectivity in the infrared part of the spectrum. For this reason, this spectral region is used in the analysis of vegetation properties. On the other hand, a larger range in reflectivity represents a complication in the automated classification of multispectral images, which manifests itself in the form of a higher probability when the Solidago spp. spectral space overlaps with other species of surrounding vegetation.
By comparing the reflectivity of our classified vegetation classes in the monitored locality of Malý Šariš, we can state their relatively high spectral proximity (Figure 9). A more significant difference occurs only in the case of tree and shrub (or dense) vegetation.
This spectral proximity indicates complications in the automated process of classifying multispectral records, which was confirmed by using the method of supervised classification of the image from summer period. For these purposes, we used the Semi-Automatic Classification Plugin (SCP) extension in the QGIS geographic information system environment (https://fromgistors.blogspot.com/p/semi-automatic-classification-plugin.html, accessed on 23 November 2021). This is a robust extension with a wide range of tools for preprocessing and classifying multispectral records through guided classification. Defining the signatures of individual vegetation classes in the Malý Šariš locality was aimed at distinguishing Solidago spp. from other species of surrounding vegetation. For the Solidago spp. class, data from field measurements were imported as training areas. Other classes (tree and shrub vegetation, mowed and spontaneous grass vegetation) were defined manually in the SCP extension environment. As already indicated by the comparison of the spectral curves of the reflectivity of these classes, their spectral proximity caused complications in the unambiguous spectral definition of individual vegetation classes. The spectral ranges of these classes overlapped considerably over the entire spectral resolution of the image, and this shortcoming could not be significantly minimized even by the offered classification algorithms. The resulting classification of the image record (Figure 10) shows considerable inaccuracies when the primarily observed Solidago spp. class is classified to a greater extent than it actually is. Additionally, the class of tree and shrub vegetation is classified in places with significantly dense grass vegetation. On the other hand, sparse grass vegetation is often included in the class of mown grass. The overall accuracy of the classification is very low, reaching less than 28% (Table 4).

4. Discussion

Management of invasive plant species remains a major challenge globally. Some invasive species have the potential to establish and spread rapidly in new environments, and to alter native plant communities by outcompeting native taxa, thus reducing local biodiversity [40].
There is a need for cost-effective, easy to use, inclusive and repeatable approaches to map invasive alien plants [41]. A high-spatial-resolution multispectral image provides rich spectral and textural information [42,43,44]. Multispectral and hyperspectral images do not contain three-dimensional structural information, such as canopy height and vertical structures. LiDAR data, a collection of points, are a three-dimensional representation of an object. The features provided by different types of data contain a large amount of key information [11].
In the present study, the four-year monitoring of Solidago spp. in two selected localities was provided. Modeling of the potential influence of climate change predicts increased frequency and severity of heat stress and drought for Central Europe [45,46] The existing research focused on autumn phenological response to summer drought and heat, resulting in indications that the meteorological drought conditioned by lower total precipitation and higher evapotranspiration shifted phenological stages, causing them to occur earlier [47,48]. This may have resulted in a shift in timing of the Solidago spp. flowering by about one month during the four-year period of the present research. While, in 2016, we noticed flowering of Solidago spp. in late September (25, 27, 28), in 2017, flowering occurred in early September (8), and in 2018 and 2019, flowering was noticed in late August (23 and 27).
In connection with previous studies, an increasing number of shoots in the population was also noticed. Plant density in the monitored localities increased minimum three-fold over the four-year period of study. An eight-year study of the relative species Solidago altissima evaluated changes in demographic parameters of shoots over time [49]. The proportion of rhizomes producting shoots rose (from c. 50 % to more than 90 %) such that annual shoot density increased almost five-fold by the end of the study, when it had almost reached equilibrium. By the final year of the study, a density of more than 100 shoots per m2 was reached. Another study focused on the populations of S. gigantea. Comparable field survey between origin country (USA) and introduced country (Europe) was provided. The shoot density of the entire population was estimated from the mean of three randomly placed 1m2 plots; in very dense populations (more than 100 shoots per m2), the plot size was reduced to 0.25 m. Population varied considerably in their size and density. Population (patch) size varied from 2 to 50,000 m2 in Europe and from 1.5 to 15,000 m2 in North America. The mean shoot density was significantly higher in European populations, namely 78.5 ± 4.6 ramets per m2 compared to 35.6 ± 4.0 ramets per m2 in American populations [40].
In the present research, state-of-the-art geospatial technologies were used to monitor the spreading of invasive Solidago spp. The aim was to continue monitoring invasive plants population dispersion in selected localities, but mainly to approach the possibilities of using a geographic information system and remote sensing of the Earth in the study of this issue. Sentinel satellite time-series or unmanned aerial vehicle (UAV) data offer the opportunity to characterize vegetation classes at unprecedented spatio-temporal scales. Subsequently, combining data from different types of sensors, such as optical and synthetic-aperture radar (SAR), improves classification accuracy [50]. Multispectral sensors on UAVs can map invasive species and their data can be an effective alternative to field data for fitting and validating OCCs (one-class classifiers) based on satellite imagery. However, UAVs can currently cover only a few ha (1 ha equals 10,000 square meters), which reduces their usefulness for local monitoring [51,52,53].
Based on our findings, the multispectral record in four spectral bands (green—550 nm, red—660 nm, red edge—735 nm and near-infrared–790 nm) is insufficient. Vegetation as a whole shows higher values of reflectivity in the summer. On the other hand, a comparison of the spectral curve of Solidago spp. with other herbaceous vegetation shows similar spectral behavior. A transdisciplinary approach combining various remote sensing methods with field trips to provide an accurate and up-to-date understanding of the occurrence and density of invasive alien trees in a cape in South Africa at a 20 m resolution was provided [41]. The rich spectral information that they acquired demonstrated that the red edge and shortwave infrared parts of the spectrum were critical for alien tree discrimination, as the key traits distinguishing these alien trees from indigenous shrubland vegetation were differences in biomass and water usage. Discrimination between different types of alien trees and discriminating alien trees from native vegetation with high water use (e.g., wetlands and mountain forests) remains a challenge for the given spatial and spectral resolutions [41]. It is more appropriate to use hyperspectral imaging, where the spectral resolution ranges in the order of tens to hundreds of narrowly defined spectral bands, which would significantly refine the feature space Solidago spp., but also the surrounding vegetation, and allow for a clearer distinction of these feature spaces from each other [54]. On the other hand, different publications suggest that the use of remote sensing methods with a suitable system configuration (hyperspectral camera) represents an effective way to map the spread of invasive plants. Comparative studies have found that remote sensing variables can perform as well as field measurements [55]. It is expected that variations in spectral signatures (shape and the depth of the shape) should be found across environmental gradients or taxonomic lines [56,57]. One of the relatives, an invasive goldenrod, Solidago altissima, is abundant in urban environments of Japan and a threat to native biodiversity. There was a study conducted that investigated the ability to upscale the in situ hyperspectral reflectance signature obtained at crown level for landscape scale detection. The detection of S. altissima distribution at landscape scale by direct upscaling crown scale hyperspectral signature was possible using high resolution satellite image with availability of green (~480 nm) and yellow (~600 nm) spectrum bands at fine resolution (~5 m). The detection, however, was influenced by the phenology state of the flowering stages, community size and adjacent plant that possesses similar carotenoid characteristics [58]. Earlier study of relative species Solidago altissima was assessed by aerial hyperspectral imagery with high spatial (1.5 m) and spectral (8.9 nm) resolutions for detecting and mapping the early invasion of understory vegetation in moist tall grassland. Generalized linear models (GLMs) were constructed to predict S. altissima occurrence using 1.5 m pixels from hyperspectral data collected during the spring when understory vegetation was directly observable from above. The results suggest that the aerial hyperspectral images obtained during spring before the seasonal development of the grass canopy are useful for the early detection and mapping of S. altissima invading moist tall grassland [59]. For the world’s worst invasive alien species, Japanese knotweed (Fallopia japonica), a remote sensing method was proposed to detect local occurrences by low-cost digital orthophotos taken in early spring and summer by concurrently exploring its temporal, spectral, and spatial characteristics. Temporal characteristics of the species were quantified by a band ratio calculated from the green and red spectral channels of both images. The combination of all signatures resulted in a producer accuracy of 90.3% and a user accuracy of 98.1% for F. japonica when validation was based on independent regions of interest. A producer accuracy of 61.4% was obtained for F. japonica when comparing the classification result with all occurrences of F. japonica identified during a field validation campaign. The possibility to use orthophotos, which are commonly available and easily accessible in most municipalities, facilitates an immediate implementation of the approach in situations where intervention is urgent [60]. The invasive species Lepidium latifolium was monitored by the remote sensing for the more efficient management of this weed in San Francisco (USA). Advanced remote sensing datasets were shown to be sufficient for species distribution modelling. Remote sensing offers powerful tools that deserve wider use in ecological research and management [24]. We used the late fall Landsat TM near-infrared band to map the branches of a Eurasian riparian tree Tamarix ramosissima in Colorado, USA when the plants were leafless [61]. Despite these successes, in most cases, observing alien plants requires data collected from sensors pushing the limits of at least one type of resolution (spatial, temporal, or spectral resolution) since the profiles of these species may be quite similar to those of native plants from a remote sensing perspective [62]. Everitt and his colleagues conducted monitoring studies in the USA using aerial photographs taken during the flowering seasons of Eurasian Euphorbia esula and Asian Tamarix chinensis [63,64]. They found that the visible-wavelength (400–700 nm) reflectance of infested settings was significantly higher due to the bright-colored inflorescence. Color infrared (CIR) aerial photographs are also commonly employed, with resolutions ranging from a few centimeters (aerial videography) to ~2 m [65]. In the previous study, time-series panchromatic and CIR aerial photographs were used that were acquired during the onset of Heracleum mantegazzianum invasion (the largest central European forb native to the western Caucasus) in Czech Republic [30]. The brightness of H. mantegazzianum was much higher than the neighboring vegetation, not only during the flowering, but in the early fruiting season (June–August) due to its distinct structure of fruiting umbels. The timing of data acquisition is crucial for aerial photograph analysis [66]. Reviews suggest that alien plant invasions can be studied using remote sensing when the invader presents a novel structure, phenology, or biochemistry relative to neighboring native vegetation. A specific set of remotely sensed data and techniques can be utilized to study each type of invasion characteristic [67]. Aerial remote sensing approach would be useful for effective monitoring and management of the species. However, it is challenging for remote sensing techniques to detect a specific single plant species and population size in highly heterogeneous urban and suburban environments [58].

5. Conclusions

The four-year monitoring observed the density of Solidago spp. and its spreading in two low acreage localities in East Slovakia. The highest density and the highest number of ramets in the northern part of the locality of Malý Šariš were found near tree and shrub vegetation. This may represent a barrier to wind transmission or, worse, the penetration of growing roots, which subsequently accumulates plants in the part before the barrier. In the southern part, which has been affected by human activity, the incidence of Solidago spp. Has already increased. We can, therefore, assume that if there are no significant changes in this location in the coming years, the dispersion of Solidago spp. will increase. In any case, human activity of landscaping of permanent management of the areas (mowing) is needed, which will weaken the growth and vigor of the species under study of the part of the source site in recent months, which may lead to a reduction in seed transfer. However, the studied area of Chminianska Nová Ves has no source locality in its vicinity from which Solidago spp. would expand to a large extent, which is a signicant positive. During the last monitoring year, we noticed a decrease in the number of Solidago spp. The whole locality is covered with dense vegetation, thanks to which the seeds are not able to enter the soil and thus do not have sufficiently suitable conditions for their growth. We could, therefore, say that the original plant species in this case displace invasive plants, which have not found suitable conditions for their intensive spread. During the four-year monitoring, we noticed that the flowering of Solidago spp. is influenced by climate change, which was reflected in the earlier beginning of flowering each year. While, in 2016, flowered plants were recorded in mid-September, in 2019, this flowering was recorded in the second half of August. Through this research and subsequent analysis of the obtained data by state-of-the-art tools, we have proved that geography, with its methods and modern technologies, has enormous possibilities for use in other scientific disciplines. Based on this, we can say that in the coming years, the geographic information system will be an important and sought-after source data.

Author Contributions

Conceptualization, Š.K. and D.G.; methodology, Š.K. and D.G.; software, Š.K. and A.D.; investigation, Š.K., A.D. and D.G.; data curation, J.V., Š.K. and A.D.; writing—original draft preparation, Š.K. and D.G.; writing—review and editing, J.V.; visualization, Š.K. All authors have read and agreed to the published version of the manuscript.

Funding

This research was funded by the Ministry of Education, Science, Research and Sport of the Slovak Republic, VEGA 1/0059/19 and VEGA 1/0087/20.

Institutional Review Board Statement

Not applicable.

Informed Consent Statement

Not applicable.

Data Availability Statement

The data presented in this study are available on request from the corresponding author.

Conflicts of Interest

The authors declare no conflict of interest.

References

  1. D’Antonio, C.M.; Vitousek, P.M. Biological invasions by exotic grasses, the grass/fire cycle and global change. Annu. Rev. Ecol. Evol. Syst. 1992, 23, 63–87. [Google Scholar] [CrossRef]
  2. Mack, R.N.; Simberloff, D.; Lonsdale, W.M.; Evans, H.; Clout, M.; Bazzaz, F.A. Biotic invasions: Causes, epidemiology, global consequences, and control. Ecol. Appl. 2000, 10, 689–710. [Google Scholar] [CrossRef]
  3. Richardson, D.M.; Pyšek, P.; Rejmánek, M.; Barbour, M.G.; Panetta, F.D.; West, C.J. Naturalization and invasion of alien plants: Concepts and definitions. Divers. Distrib. 2000, 6, 93–107. [Google Scholar] [CrossRef]
  4. Levine, J.M.; Vila, M.; D’Antonio, C.M.; Dukes, J.S.; Grigulis, K.; Lavorel, S. Mechanisms underlying the impacts of exotic plant invasions. Proc. R. Soc. B 2003, 270, 775–781. [Google Scholar] [CrossRef]
  5. Vitousek, P.M.; D’Antonio, C.M.; Asner, G.P. Invasions and ecosystems: Vulnerabilities and the contribution of new technologies. In Fifty Years of Invasion Ecology: The Legacy of Charles Elton; Richardson, D.M., Ed.; Wiley Blackwell: Oxford, UK, 2011; pp. 277–288. [Google Scholar]
  6. He, K.S.; Rocchini, D.; Neteler, M.; Nagendra, H. Benefits of hyperspectral remote sensing for tracking plant invasions. Divers. Distrib. 2011, 17, 381–392. [Google Scholar] [CrossRef]
  7. Pettorelli, N.; Laurance, W.F.; O’Brien, T.G.; Wegmann, M.; Nagendra, H.; Turner, W. Satellite remote sensing for applied ecologists: Opportunities and challenges. J. Appl. Ecol. 2014, 51, 839–848. [Google Scholar] [CrossRef]
  8. Peterson, A.T.; Navarro-Sigüenza, A.G.; Benítez-Díaz, H. The need for continued scientific collecting; a geographic analysis of Mexican bird specimens. Ibis 1998, 140, 288–294. [Google Scholar] [CrossRef]
  9. Schott, J.R. Remote Sensing: The Image Chain Approach; Oxford University Press: New York, NY, USA, 1997. [Google Scholar]
  10. Asrar, G. Introduction. In Theory and Applications of Optical Remote Sensing; Asrar, G., Ed.; John Wiley & Sons: New York, NY, USA, 1989; p. 1. [Google Scholar]
  11. Wan, H.; Tang, Y.; Jing, L.; Li, H.; Qiu, F.; Wu, W. Tree Species Classification of Forest Stands Using Multisource Remote Sensing Data. Remote Sens. 2021, 13, 144. [Google Scholar] [CrossRef]
  12. DeFries, R.S.; Townshend, J.R.G. NDVI-derived land cover classifications at a global scale. Int. J. Remote Sens. 1994, 15, 3567–3586. [Google Scholar] [CrossRef]
  13. DeFries, R.S.; Hansen, M.C.; Townshend, J.R.G.; Sohlberg, R.S. Global landcover classifications at 8 km spatial resolution: The use of training data derived from Landsat imagery in decision tree classifiers. Int. J. Remote Sens. 1998, 19, 3141–3168. [Google Scholar] [CrossRef]
  14. Mountrakis, G.; Im, J.; Ogole, C. Support vector machines in remote sensing: A review. ISPRS J. Photogram. Remote Sens. 2011, 66, 247–259. [Google Scholar] [CrossRef]
  15. Stathaki, T. Image Fusion: Algorithms and Applications; Elsevier Ltd.: London, UK, 2008; 493p. [Google Scholar]
  16. Bannari, A.; Morin, D.; Bonn, F.; Huete, A.R. A review of vegetation indices. Remote Sens. Rev. 1995, 13, 95–120. [Google Scholar] [CrossRef]
  17. Pettorelli, N. The Normalized Differential Vegetation Index; Oxford University Press: Oxford, UK, 2013. [Google Scholar]
  18. Lukasová, V.; Bucha, T.; Škvareninová, J.; Škvarenina, J. Validation and application of European beech phenological metrics derived from MODIS data along an altitudinal gradient. Forests 2019, 10, 60. [Google Scholar] [CrossRef] [Green Version]
  19. Bradley, B.A.; Mustard, J.F. Characterizing the landscape dynamics of an invasive plant and risk of invasion using remote sensing. Ecol. Appl. 2006, 16, 1132–1147. [Google Scholar] [CrossRef] [Green Version]
  20. Zheng, Y. Evaluating High Resolution GeoEye-1 Satellite Imagery for Mapping Wildlife in Open Savannahs; International Institute for Geoinformation Science and Earth Observation: Enschede, The Netherlands, 2012; 52p. [Google Scholar]
  21. Clark, D.B.; Read, J.M.; Clark, M.L.; Murillo Cruz, A.; Fallas Dotti, M.; Clark, D.A. Application of 1-m and 4-m resolution satellite data to studies of tree demography, stand structure and land-use classification in tropical rain forest landscapes. Ecol. Appl. 2004, 14, 61–74. [Google Scholar] [CrossRef]
  22. Nagendra, H.; Lucas, R.; Honrado, J.P.; Jongman, R.H.G.; Tarantino, C.; Adamo, M.; Mairota, P. Remote sensing for conservation monitoring: Assessing protected areas, habitat extent, habitat condition, species diversity, and threats. Ecol. Indic. 2013, 33, 45–59. [Google Scholar] [CrossRef]
  23. Turner, W.; Rondinini, C.; Pettorelli, N.; Mora, B.; Leidner, A.K.; Szantoi, Z.; Buchanan, G.; Dech, S.; Dwyer, J.; Herold, M.; et al. Free and open-access satellite data are key to biodiversity conservation. Biol. Conserv. 2015, 182, 173–176. [Google Scholar] [CrossRef] [Green Version]
  24. Andrew, M.E.; Ustin, S.L. Habitat suitability modelling of an invasive plant with advanced remote sensing data. Divers. Distrib. 2009, 15, 627–640. [Google Scholar] [CrossRef]
  25. Everitt, J.H.; Deloach, C.J. Remote sensing of Chinese tamarisk (Tamarix chinensis) and associated vegetation. Weed Sci. 1990, 38, 273–278. [Google Scholar] [CrossRef]
  26. Frazier, B.E.; Moore, B.C. Some tests of film types for remote sensing of purple loosestrife, Lythrum salicaria, at low-densities. Wetlands 1993, 13, 145–152. [Google Scholar] [CrossRef]
  27. Cook, G.D.; Setterfield, S.A.; Maddison, J.P. Shrub invasion of a tropical wetland: Implications for weed management. Ecol. Appl. 1996, 6, 531–537. [Google Scholar] [CrossRef]
  28. Brown, J.R.; Carter, J. Spatial and temporal patterns of exotic shrub invasion in an Australian tropical grassland. Landsc. Ecol. 1998, 13, 93–102. [Google Scholar] [CrossRef]
  29. Maheu-Giroux, M.; De Blois, S. Mapping the invasive species Phragmites australis in linear wetland corridors. Aquat. Bot. 2005, 83, 310–320. [Google Scholar] [CrossRef]
  30. Müllerová, J.; Pyšek, P.; Jarošík, V.; Pergl, J. Aerial photographs as a tool for assessing the regional dynamics of the invasive plant species Heracleum mantegazzianum. J. Appl. Ecol. 2005, 42, 1042–1053. [Google Scholar] [CrossRef]
  31. Ge, S.K.; Carruthers, R.; Gong, P.; Herrera, A. Texture analysis for mapping Tamarix parviflora using aerial photographs along the Cache Creek, California. Environ. Monit. Assess. 2006, 114, 65–83. [Google Scholar] [CrossRef] [PubMed]
  32. Turner, W. Satellites: Make data freely accessible. Nature 2013, 498, 37. [Google Scholar] [CrossRef]
  33. Strand, H.; Höft, R.; Strittholt, J.; Miles, L.; Horning, N.; Fosnight, E.; Turner, W. Sourcebook on Remote Sensing and Biodiversity Indicators; Secretariat of the Convention on Biological Diversity: Montreal, QC, Canada, 2007; Volume 32, 203p. [Google Scholar]
  34. R Development Core Team. R: A Language and Environment for Statistical Computing; R Foundation for Statistical Computing: Vienna, Austria, 2013; Available online: http://www.r-project.org/ (accessed on 10 June 2021).
  35. QGIS. A Free and Open Source Geographic Information System. Available online: www.qgis.org (accessed on 13 July 2021).
  36. GRASS Development Team. Geographic Resources Analysis Support System. Open Source Geospatial Foundation, USA. Available online: http://grass.osgeo.org (accessed on 13 July 2021).
  37. Blackburn, J.K. Evaluating the Spatial Ecology of Anthrax in North America: Examining Epidemiological Components across Multiple Geographic Scales Using a Gis-Based Approach. Ph.D. Thesis, Louisiana State University, Baton Rouge, LA, USA, 2006. [Google Scholar]
  38. Gruľová, D.; Koco, Š.; Muľová, A. Medziročná dynamika invázneho rastlinného druhu Solidago canadensis na vybraných lokalitách Prešovského okresu (Year-on-year dynamics of invasive plant species Solidago canadensis in selected localities of the Prešov district). Acta Univ. Prešoviensis 2017, 9, 57. [Google Scholar]
  39. Muľová, A. Využitie Geopriestorových Technológií Pri Mapovaní Priestorového Šírenia Inváznych Rastlín (The Use of Geospatial Technologies in Mapping the Spatial Spread of Invasive Plants). Bachelor’s Thesis, Fakulta Humanitných a Prírodných Vied Prešovskej Univerzity v Prešove, Prešov, Slovakia, 2018. [Google Scholar]
  40. Jakobs, G.; Weber, E.; Edwards, P.J. Introduced plants of the invasive Solidago gigantea (Asteraceae) are larger and grow denser than conspecifics in the native range. Divers. Distrib. 2004, 10, 11–19. [Google Scholar] [CrossRef]
  41. Holden, P.B.; Rebelo, A.J.; New, M.G. Mapping invasive alien trees in water towers: A combined approach using satellite data fusion, drone technology and expert engagement. Remote. Sens. Appl. Soc. Environ. 2021, 21, 100448. [Google Scholar] [CrossRef]
  42. Karlson, M.; Ostwald, M.; Reese, H.; Bazié, H.R.; Tankoano, B. Assessing the potential of multi-seasonal WorldView-2 imagery for mapping West African agroforestry tree species. Int. J. Appl. Earth Obs. Geoinf. 2016, 50, 80–88. [Google Scholar] [CrossRef]
  43. Michez, A.; Piegay, H.; Lisein, J.; Claessens, H.; Lejeune, P. Classification of riparian forest species and health condition using multi-temporal and hyperspatial imagery from unmanned aerial system. Environ. Monit. Assess. 2016, 188, 146. [Google Scholar] [CrossRef] [Green Version]
  44. Ferreira, M.P.; Wagner, F.H.; Aragão, L.E.O.C.; Shimabukuro, Y.E.; de Souza Filho, C.R. Tree species classification in tropical forests using visible to shortwave infrared WorldView-3 images and texture analysis. ISPRS J. Photogramm. Remote Sens. 2019, 149, 119–131. [Google Scholar] [CrossRef]
  45. Teskey, R.; Wertin, T.; Bauweraerts, I.; Ameye, M.; McGuire, M.A.; Steppe, K. Responses of tree species to heat waves and extreme heat events. Plant Cell Environ. 2015, 38, 1699–1712. [Google Scholar] [CrossRef] [PubMed]
  46. Škvarenina, J.; Tomlain, J.; Hrvol’, J.; Škvareninová, J. Occurence of dry and wet periods in altitudinal vegetation stages of West Carpathians in Slovakia: Time-Series Analysis 1951–2005. In Bioclimatology and Natural Hazards; Strelcová, K., Matyas, C., Kleidon, A., Lapin, M., Matejka, F., Blazenec, M., Škvarenina, J., Holecy, J., Eds.; Springer: Amsterdam, The Netherlands, 2009; pp. 97–106. [Google Scholar] [CrossRef]
  47. Lukasová, V.; Vido, J.; Škvareninová, J.; Bičárová, S.; Hlavatá, H.; Borsányi, P.; Škvarenina, J. Autumn phenological response of European Beech to summer drought and heat. Water 2020, 12, 2610. [Google Scholar] [CrossRef]
  48. Babálová, D.; Škvareninová, J.; Fazekaš, J.; Vyskot, I. The dynamics of the phenological development of four woody species in south-west and central Slovakia. Sustainability 2018, 10, 1497. [Google Scholar] [CrossRef] [Green Version]
  49. Meyer, A.H.; Schmid, B. Experimental demography of the old-field perennial Solidago altissima: The dynamic of the shoot population. J. Ecol. 1999, 87, 17–27. [Google Scholar] [CrossRef]
  50. Schulte to Bühne, H.; Pettorelli, N. Better Together: Integrating and Fusing Multispectral and Radar Satellite Imagery to Inform Biodiversity Monitoring, Ecological Research and Conservation Science. Methods Ecol. Evol. 2018, 9, 849–865. [Google Scholar] [CrossRef]
  51. Rapinel, S.; Hubert-Moy, L. One-Class Classification of Natural Vegetation Using Remote Sensing: A Review. Remote Sens. 2021, 13, 1892. [Google Scholar] [CrossRef]
  52. Kattenborn, T.; Lopatin, J.; Förster, M.; Braun, A.C.; Fassnacht, F.E. UAV Data as Alternative to Field Sampling to Map Woody Invasive Species Based on Combined Sentinel-1 and Sentinel-2 Data. Remote Sens. Environ. 2019, 227, 61–73. [Google Scholar] [CrossRef]
  53. Alexandridis, T.K.; Tamouridou, A.A.; Pantazi, X.E.; Lagopodi, A.L.; Kashefi, J.; Ovakoglou, G.; Polychronos, V.; Moshou, D. Novelty Detection Classifiers in Weed Mapping: Silybum marianum Detection on UAV Multispectral Images. Sensors 2017, 17, 2007. [Google Scholar] [CrossRef] [PubMed] [Green Version]
  54. Sabat-Tomala, A.; Raczko, E.; Zagajewski, B. Comparison of Support Vector Machine and Random Forest Algorithms for Invasive and Expansive Species Classification using Airborne Hyperspectral Data. Remote Sens. 2020, 12, 516. [Google Scholar] [CrossRef] [Green Version]
  55. Davis, F.W.; Seo, C.; Zielinski, W.J. Regional variation in home-range-scale habitat models for fisher (Martes pennanti) in California. Ecol. Appl. 2007, 17, 2195–2213. [Google Scholar] [CrossRef] [PubMed] [Green Version]
  56. Kokaly, R.F.; Asner, G.P.; Ollinger, S.V.; Martin, M.E.; Wessman, C.A. Characterizing canopy biochemistry from imaging spectroscopy and its application to ecosystem studies. Remote Sens. Environ. 2009, 113, S78–S91. [Google Scholar] [CrossRef]
  57. Ustin, S.L.; Gitelson, A.A.; Jacquemoud, S.; Schaepman, M.; Asner, G.P.; Gamon, J.A.; Zarco-Tejada, P. Retrieval of foliar information about plant pigment systems from high resolution spectroscopy. Remote Sens. Environ. 2009, 113, S67–S77. [Google Scholar] [CrossRef] [Green Version]
  58. Mahmud, M.R.; Numata, S.; Hosaka, T. Mapping an invasive goldenrod of Solidago altissima in urban landscape of Japan using multi-scale remote sensing and knowledge-based classification. Ecol. Indic. 2020, 111, 105975. [Google Scholar] [CrossRef]
  59. Ishii, J.; Washitani, I. Early detection of the invasive alien plant Solidago altissima in moist tall grassland using hyperspectral imagery. Int. J. Remote Sens. 2013, 34, 5926–5936. [Google Scholar] [CrossRef]
  60. Dorigo, W.; Lucieer, A.; Podobnikar, T.; Čarni, A. Mapping invasive Fallopia japonica by combined spectral, spatial, and temporal analysis of digital orthophotos. Int. J. Appl. Earth Obs. Geoinf. 2012, 19, 185–195. [Google Scholar] [CrossRef]
  61. Groeneveld, D.P.; Watson, R.P. Near-infrared discrimination of leafless saltcedar in wintertime Landsat TM. Int. J. Remote Sens. 2008, 29, 3577–3588. [Google Scholar] [CrossRef]
  62. Asner, G.P. Hyperspectral remote sensing of canopy chemistry, physiology and diversity in tropical rainforests. In Hyperspectral Remote Sensing of Tropical and Subtropical Forests; Kalacska, M., Sanchez-Azofeifa, G.A., Eds.; Taylor and Francis Group: Oxon, UK, 2008; pp. 261–288. [Google Scholar]
  63. Everitt, J.H.; Anderson, G.L.; Escobar, D.E.; Davis, M.R.; Spencer, N.R.; Andrascik, R.J. Use of remote sensing for detecting and mapping leafy spurge (Euphorbia esula). Weed Technol. 1995, 9, 599–609. [Google Scholar] [CrossRef] [Green Version]
  64. Everitt, J.H.; Escobar, D.E.; Alaniz, M.A.; Davis, M.R.; Richerson, J.V. Using spatial information technologies to map Chinese tamarisk (Tamarix chinensis) infestations. Weed Sci. 1996, 44, 194–201. [Google Scholar] [CrossRef]
  65. US National Agriculture Imagery Program. Available online: http://www.fsa.usda.gov (accessed on 12 June 2021).
  66. Everitt, J.H.; Escobar, D.E.; Davis, M.R. Reflectance and image characteristics of selected noxious rangeland species. J. Range Manag. 2001, 54, A106–A120. [Google Scholar] [CrossRef]
  67. Huang, C.; Asner, G.P. Applications of Remote Sensing to Alien Invasive Plant Studies. Sensors 2009, 9, 4869–4889. [Google Scholar] [CrossRef] [PubMed] [Green Version]
Figure 1. Localization of monitored areas.
Remotesensing 13 04787 g001
Figure 2. Solidago spp. spreading in locality of Malý Šariš in 2016 (a), 2017 (b), 2018 (c) and 2019 (d).
Remotesensing 13 04787 g002
Figure 3. Solidago spp. spreading in locality of Chminianska Nová Ves in 2016 (a), 2017 (b), 2018 (c) and 2019 (d).
Remotesensing 13 04787 g003
Figure 4. Solidago spp. density in locality of Malý Šariš in 2017 (a), 2018 (b) and 2019 (c), red arrow shows the direction of the seeds spreading from seed bank.
Remotesensing 13 04787 g004
Figure 5. Solidago spp. density in locality Chminianska Nová Ves in 2017 (a), 2018 (b) and 2019 (c).
Remotesensing 13 04787 g005
Figure 6. Differences in Solidago spp. plant density in locality of Malý Šariš between 2019 and 2017.
Remotesensing 13 04787 g006
Figure 7. Differences in Solidago spp. plant density in locality of Chminianska Nová Ves between 2019 and 2017.
Remotesensing 13 04787 g007
Figure 8. The spectral reflectance curve of Solidago spp. at the beginning and culmination of growing season.
Remotesensing 13 04787 g008
Figure 9. The spectral reflectance curves of classified class of vegetation in the Malý Šariš locality.
Remotesensing 13 04787 g009
Figure 10. Classified multispectral image of the locality of Malý Šariš—captured 23rd august 2019.
Remotesensing 13 04787 g010
Table 1. Dates of monitoring of Solidago spp. In the 4-year period.
YearDateLocality
201627 and 28 SeptemberMalý Šariš
201625 SeptemberChmin. N. Ves
20178 SeptemberMalý Šariš
20178 SeptemberChmin. N. Ves
201827 AugustMalý Šariš
201827 AugustChmin. N. Ves
201923 AugustMalý Šariš
201923 AugustChmin. N. Ves
Table 2. Comparison of Solidago spp. dispersion at a selected localities during mapped period of four years.
localityMalý ŠarišChminianska Nová Ves
Year20162017201820192016201720182019
Total number of shoots1258186525233934116156244209
Number of genets2212654126618131724
Number of ramets371611803240307
Minimum number of plants in genet22222222
Maximum number plants in genet32485042618510041
Percentage of increase/decrease in shoots-48.30%35.30%55.90%-34.50%56.40%−14.30%
Table 3. Plant density at both monitored localities Chminianska Nová Ves and Malý Šariš.
Chminianska Nová Ves
DensityAcreage (m2)
(shoots numb./ha)
<508144.4
50–1001115.6
100–150432.3
150–200289.5
>200293.5
Malý Šariš
DensityAcreage (m2)
(shoots numb./ha)
<10005327.3
1000–20001182.4
2000–3000469.6
3000–4000177.8
4000–500031.8
5000–600018.3
>600013.3
Table 4. A confusion matrix of classified multispectral image of the locality of Malý Šariš.
Reference
ClassTrees and ShrubsGrasslandMown Grass VegetationSolidago spp.
ClassifiedTrees and Shrubs0.0660.0660.0330.017
Grassland0.0000.1070.0240.024
Mown Grass Vegetation0.0360.1250.0540.018
Solidago spp.0.0000.0680.0000.051
Total0.1020.3670.1100.109
Standard Error0.0370.0540.0390.038
Confidence Interval837.01224.0897.0862.0
95% CI Area1641.02400.01758.01690.0
Producer’s Accuracy [%]64.915.848.546.7
User’s Accuracy [%]36.469.223.142.9
Kappa hat0.290.040.140.36
Overall Accuracy [%]27.8004
Kappa hat Classification0.1381
Publisher’s Note: MDPI stays neutral with regard to jurisdictional claims in published maps and institutional affiliations.

