Article

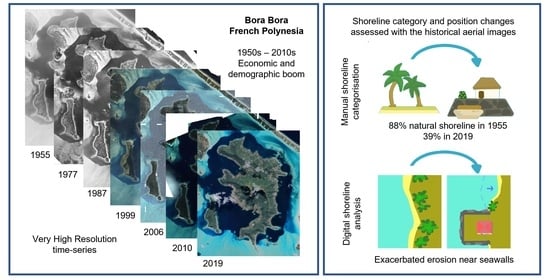
Spatiotemporal Trends of Bora Bora’s Shoreline Classification and Movement Using High-Resolution Imagery from 1955 to 2019

1
Section des Sciences de la Vie et de la Terre, EPHE-PSL University, CNRS LETG, 35800 Dinard, France
2
Département de Biologie, École Normale Supérieure, PSL University, 75005 Paris, France
3
Okinawa Institute of Science and Technology, 1919-1 Tancha, Onna-Son, Kunigami District 904-0495, Okinawa, Japan
4
LabEx CORAIL, 98729 Papetoai, French Polynesia, France
5
Association Ia Vai Ma Noa Bora-Bora, 98730 Bora-Bora, French Polynesia, France
6
Section Cadastre-Topographie de la Direction des Affaires Foncières (DAF), 98713 Papeete, French Polynesia, France
7
Laboratoire de Biologie des Organismes et Ecosystèmes Aquatiques (BOREA), Université des Antilles-MNHN-CNRS 8067-SU-IRD 207-UCN, 97275 Schoelcher, Martinique, France
8
ESPACE-DEV, Univ Montpellier, IRD, Univ Antilles, Univ Guyane, Univ Réunion, 34000 Montpellier, France
9
Département Lettres et Sciences Humaines, University Center of Mayotte CUFR, BP53 Dembeni, Mayotte, France
10
EPHE-PSL University, CRIOBE, BP 1013 Papetoai, French Polynesia, France
*
Author to whom correspondence should be addressed.
Remote Sens. 2021, 13(22), 4692; https://doi.org/10.3390/rs13224692
Submission received: 31 October 2021 / Revised: 15 November 2021 / Accepted: 17 November 2021 / Published: 20 November 2021

Abstract

:
Coastal urbanisation is a widespread phenomenon throughout the world and is often linked to increased erosion. Small Pacific islands are not spared from this issue, which is of great importance in the context of climate change. The French Polynesian island of Bora Bora was used as a case study to investigate the historical evolution of its coastline classification and position from 1955 to 2019. A time series of very high-resolution aerial imagery was processed to highlight the changes of the island’s coastline. The overall length of natural shores, including beaches, decreased by 46% from 1955 to 2019 while human-made shores such as seawalls increased by 476%, and as of 2019 represented 61% of the coastline. This evolution alters sedimentary processes: the time series of aerial images highlights increased erosion in the vicinity of seawalls and embankments, leading to the incremental need to construct additional walls. In addition, the gradual removal of natural shoreline types modifies landscapes and may negatively impact marine biodiversity. Through documenting coastal changes to Bora Bora over time, this study highlights the impacts of human-made structures on erosional processes and underscores the need for sustainable coastal management plans in French Polynesia.

Graphical Abstract

1. Introduction

Since the end of the 19th century, coastal areas have become increasingly sought-after worldwide, and are now largely urbanised [1]. Human populations have grown, with numerous urban centres and cities located along the shore. Infrastructures such as harbours, marinas, and seaside roads have been developed to support local development as well as global maritime trade and transport. This phenomenon is particularly widespread in Europe, Asia, Australia, and the USA, where up to 50% of coastlines are modified by engineering works [2]. However, the tropical Pacific Ocean, and the French Polynesian island of Bora Bora in particular, have not been spared. In French Polynesia, coastlines have been strongly modified for a range of reasons, mostly since the mid-1900s, from acquiring more land through infilling shallow reef areas to building walls to protect constructions from waves [3,4,5,6]. These modifications alter sediment transport processes. Along with the dredging of fringing reefs to open navigation channels, sea level rise, and background sediment transport, these modifications lead to changes in shoreline position [7].
These changes, beyond altering coastal landscapes, have impacts on local livelihoods as well as on economic activities. Many urban centres and residential areas are located along the coastline in French Polynesia, notably due to the lack of inland space, either due to steep topographies (e.g., for the volcanic Society islands such as Bora Bora) or simply to the limited size of the islands (e.g., in the case of the Tuamotu atolls). Furthermore, increased urbanisation and erosion pose a threat to beaches, which are a major resource for tourism activities. On Bora Bora, coastal erosion was already noted as a serious issue at the southern beach of Matira, a major tourism spot, in the 1990s [8]. Characterising coastal urbanisation and erosion in the coral reef islands of the tropical Pacific Ocean at a very high spatial resolution (VHR) can shed light on human impacts on sedimentary processes and provide key knowledge to better manage coastlines in the future, in the context of local urbanisation, global climate change-induced sea level rise, and more frequent and intense storm surges.
On Bora Bora, the availability of imagery from 1955 to 2019 enables long-term monitoring of changes through manual photointerpretation of VHR aerial and satellite imagery [9]. This article aims at addressing the issue of coastal modification and its impacts on the shoreline classification and position on Bora Bora from 1955 to 2019 through an original long-term and very high-resolution approach. This study adds to the growing awareness of the vulnerability of shorelines due to urbanisation and its effects in French Polynesia (e.g., [3]).

2. Materials and Methods
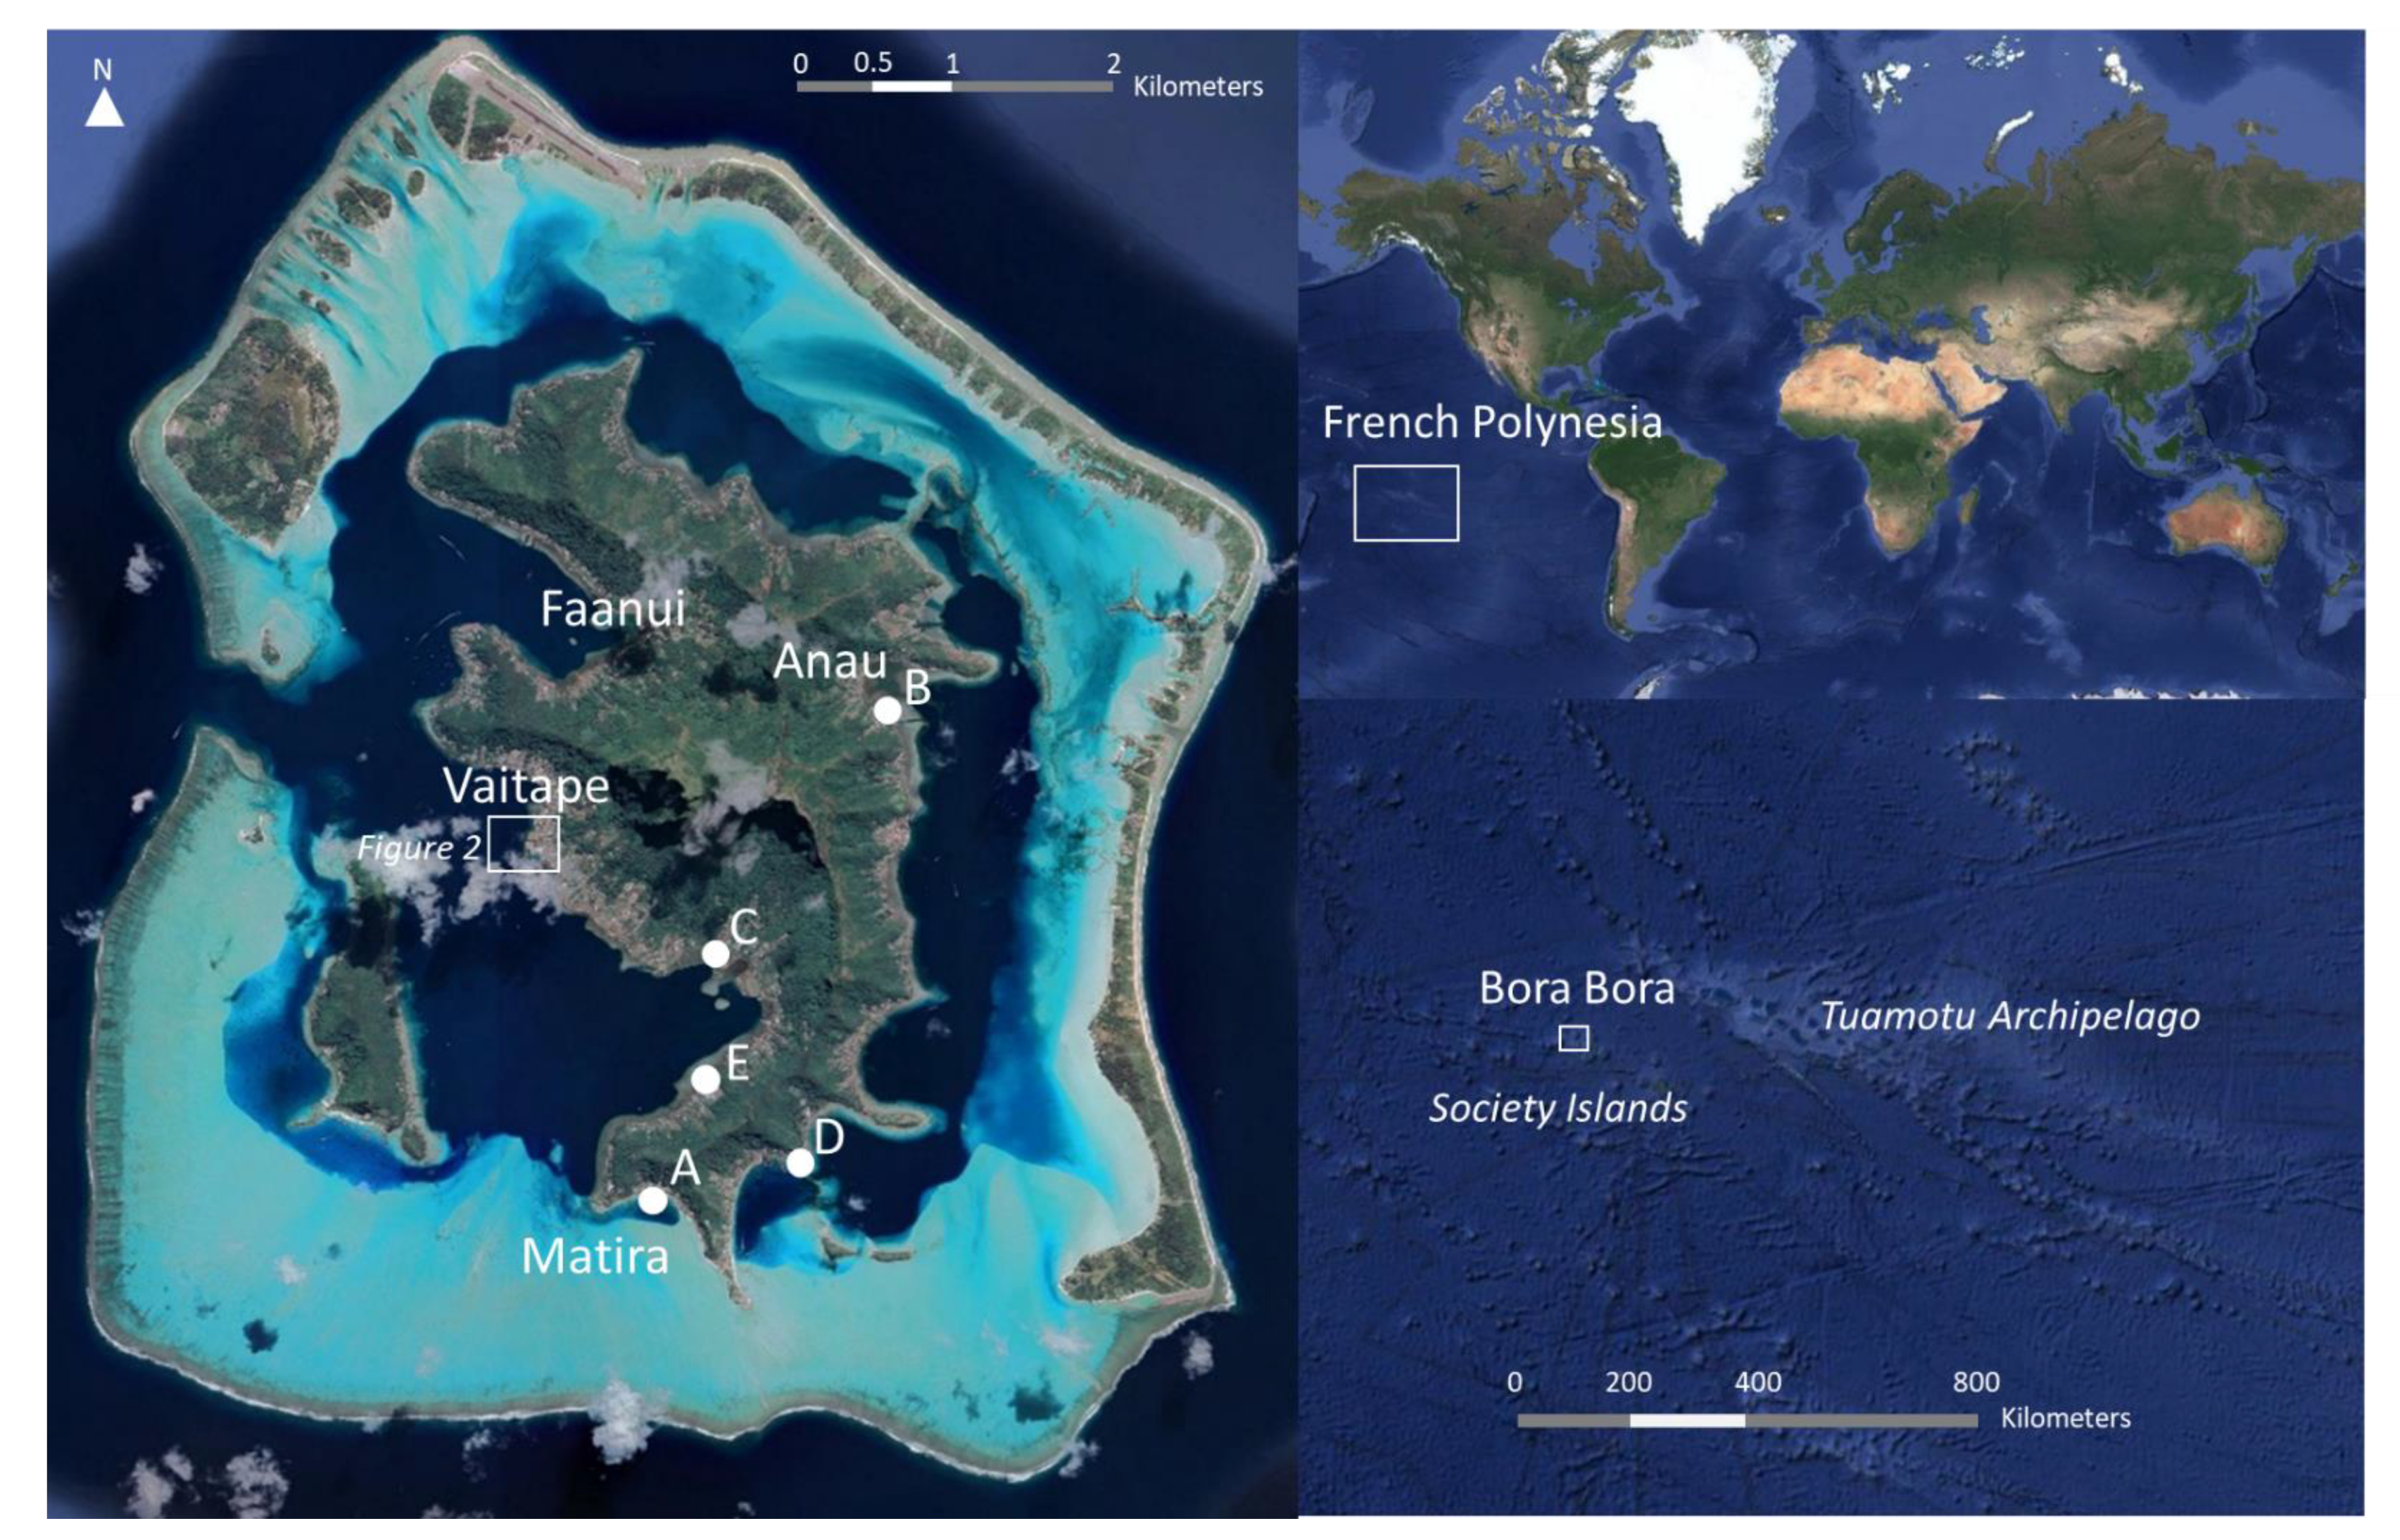
2.1. Study Site

2.1.1. Physical Setting

Bora Bora (16°29′ S, 151°44′ W, highest summit: 727 m) is a ~20 km2 tropical volcanic island circled by a 70 km2 barrier reef, in the Society archipelago of French Polynesia in the South Pacific (Figure 1). It has an approximately 40 km complex coastline forming numerous bays and peninsulas that are bordered by 50 to 150 m-wide fringing reefs [8]. There are multiple motu (sandy islands) on the reef margin around the island which hinder water circulation in and out of the lagoon as well as constrain sediment transport from the barrier reef crest and from lagoonal sand accumulations to the island [10]. There are a few shallow channels (hoa) through which oceanic water enters the lagoon. A 48 m deep pass connects the lagoon to the ocean to the west of the island [10]. The general water circulation in the lagoon is south to north [8] but depends on tides (spring tidal range: 0.4 m [11]), wind conditions, and temperature-related water column stratification [12]. The only available wave height data for Bora Bora is based on a record from a sensor located outside the lagoon near Bora Bora’s only pass on the western side of the island [13]. The main island is sheltered from the waves by the barrier reef and it is, hence, difficult to estimate its wave climate as well as the variability around the island; outside of the lagoon, the main wave direction is East to West, parallel to the trade wind direction [13].
Bora Bora’s lagoon is characterised by a majority of medium to coarse sediments in the shallow areas near the barrier reef (over 98% of the total fraction is >125 μm) and fringing reefs (30% of the total fraction > 125 μm), and a larger fraction of fine sediments at depth, below 22 m (>95% of fine grains of sizes < 125 μm). Most sediments are derived from the breakdown of skeletal fragments from reef organisms [10]; a fraction of sediments are modern cemented non-skeletal grains such as ooids that arise from the precipitation of calcium carbonate on the shallow areas between the motu and the lagoon where currents are weak and allow for carbonate super-saturation [10].
The absence of sustained riverine input of sediments (no permanent rivers on Bora Bora apart from a stream in the north-western Faanui bay) leads to a mostly carbonate sedimentology with few siliciclastic components (mostly clay) derived from the volcanic island [10].

2.1.2. Human Presence

Bora Bora’s first infrastructures were constructed during the 1940s, with an airport, roads, quays, embankments. Since then, Bora Bora has been the stage of an important demographic boom (2215 inhabitants in 1971, 10,549 in 2017 [14]; average population density in 2017: 350/km2) and economic development, most notably through tourism and recreational activities (over 80% of international tourists coming to French Polynesia visit the island [15]).
This demographic and economic development is associated with the rapid urbanisation of the coastline, as most of the inner island is constituted of steep cliffs and dense forest. Faanui and Vaitape (Figure 2), on the western side, house more than two thirds of the island’s population while Anau in the east has a population of around 2000. This urbanisation is accompanied by coastal modifications (dredging and removal of sand to build roads, authorised and unauthorised land fillings to extend gardens and houses over the fringing reef) and structures (roads, quays, embankments, seawalls).

2.2. Data Acquisition

The study is based on a time series of images of Bora Bora obtained through vertical aerial photographs taken from a plane, provided by the Urbanism service of French Polynesia (1955, 1977, 1987, and 1999) and satellite imagery extracted from Google Earth (2006, 2010, 2019), as detailed in Table 1. These dates were selected for their negligible or absent cloud cover. The satellite imagery was extracted at very high spatial resolution (<0.5 m) from Google Earth following the method from [16]; by adjusting the eye altitude to match the satellite spatial resolution, putting the nadir at 90°, and positioning the view northward, over 60 images of the island were saved at maximum resolution for each date, with an overlap of around 30% between each subsequent image; these images were then assembled into orthomosaics similarly to the aerial images taken from a plane (see Section 2.3.1. Image preparation). Furthermore, a ground-based survey of the coastal typology was performed in 2019 using a GPS, by walking and sailing around the island and recording the location of different coastal types (similar methodology to [3]).

2.3. Data Processing

2.3.1. Image Preparation

The images were assembled using Agisoft Metashape to obtain orthomosaics for each acquisition year. These were georeferenced with ArcGIS 10.8.1 using ground control points (geospatial reference: tefenua.gov.pf (accessed on 15 January 2021)) with either adjust or 2nd polynomial transformations. Fixed geomorphological features such as lagoon pinnacles were used along with anthropogenic features as ground control points (similarly to [17]).

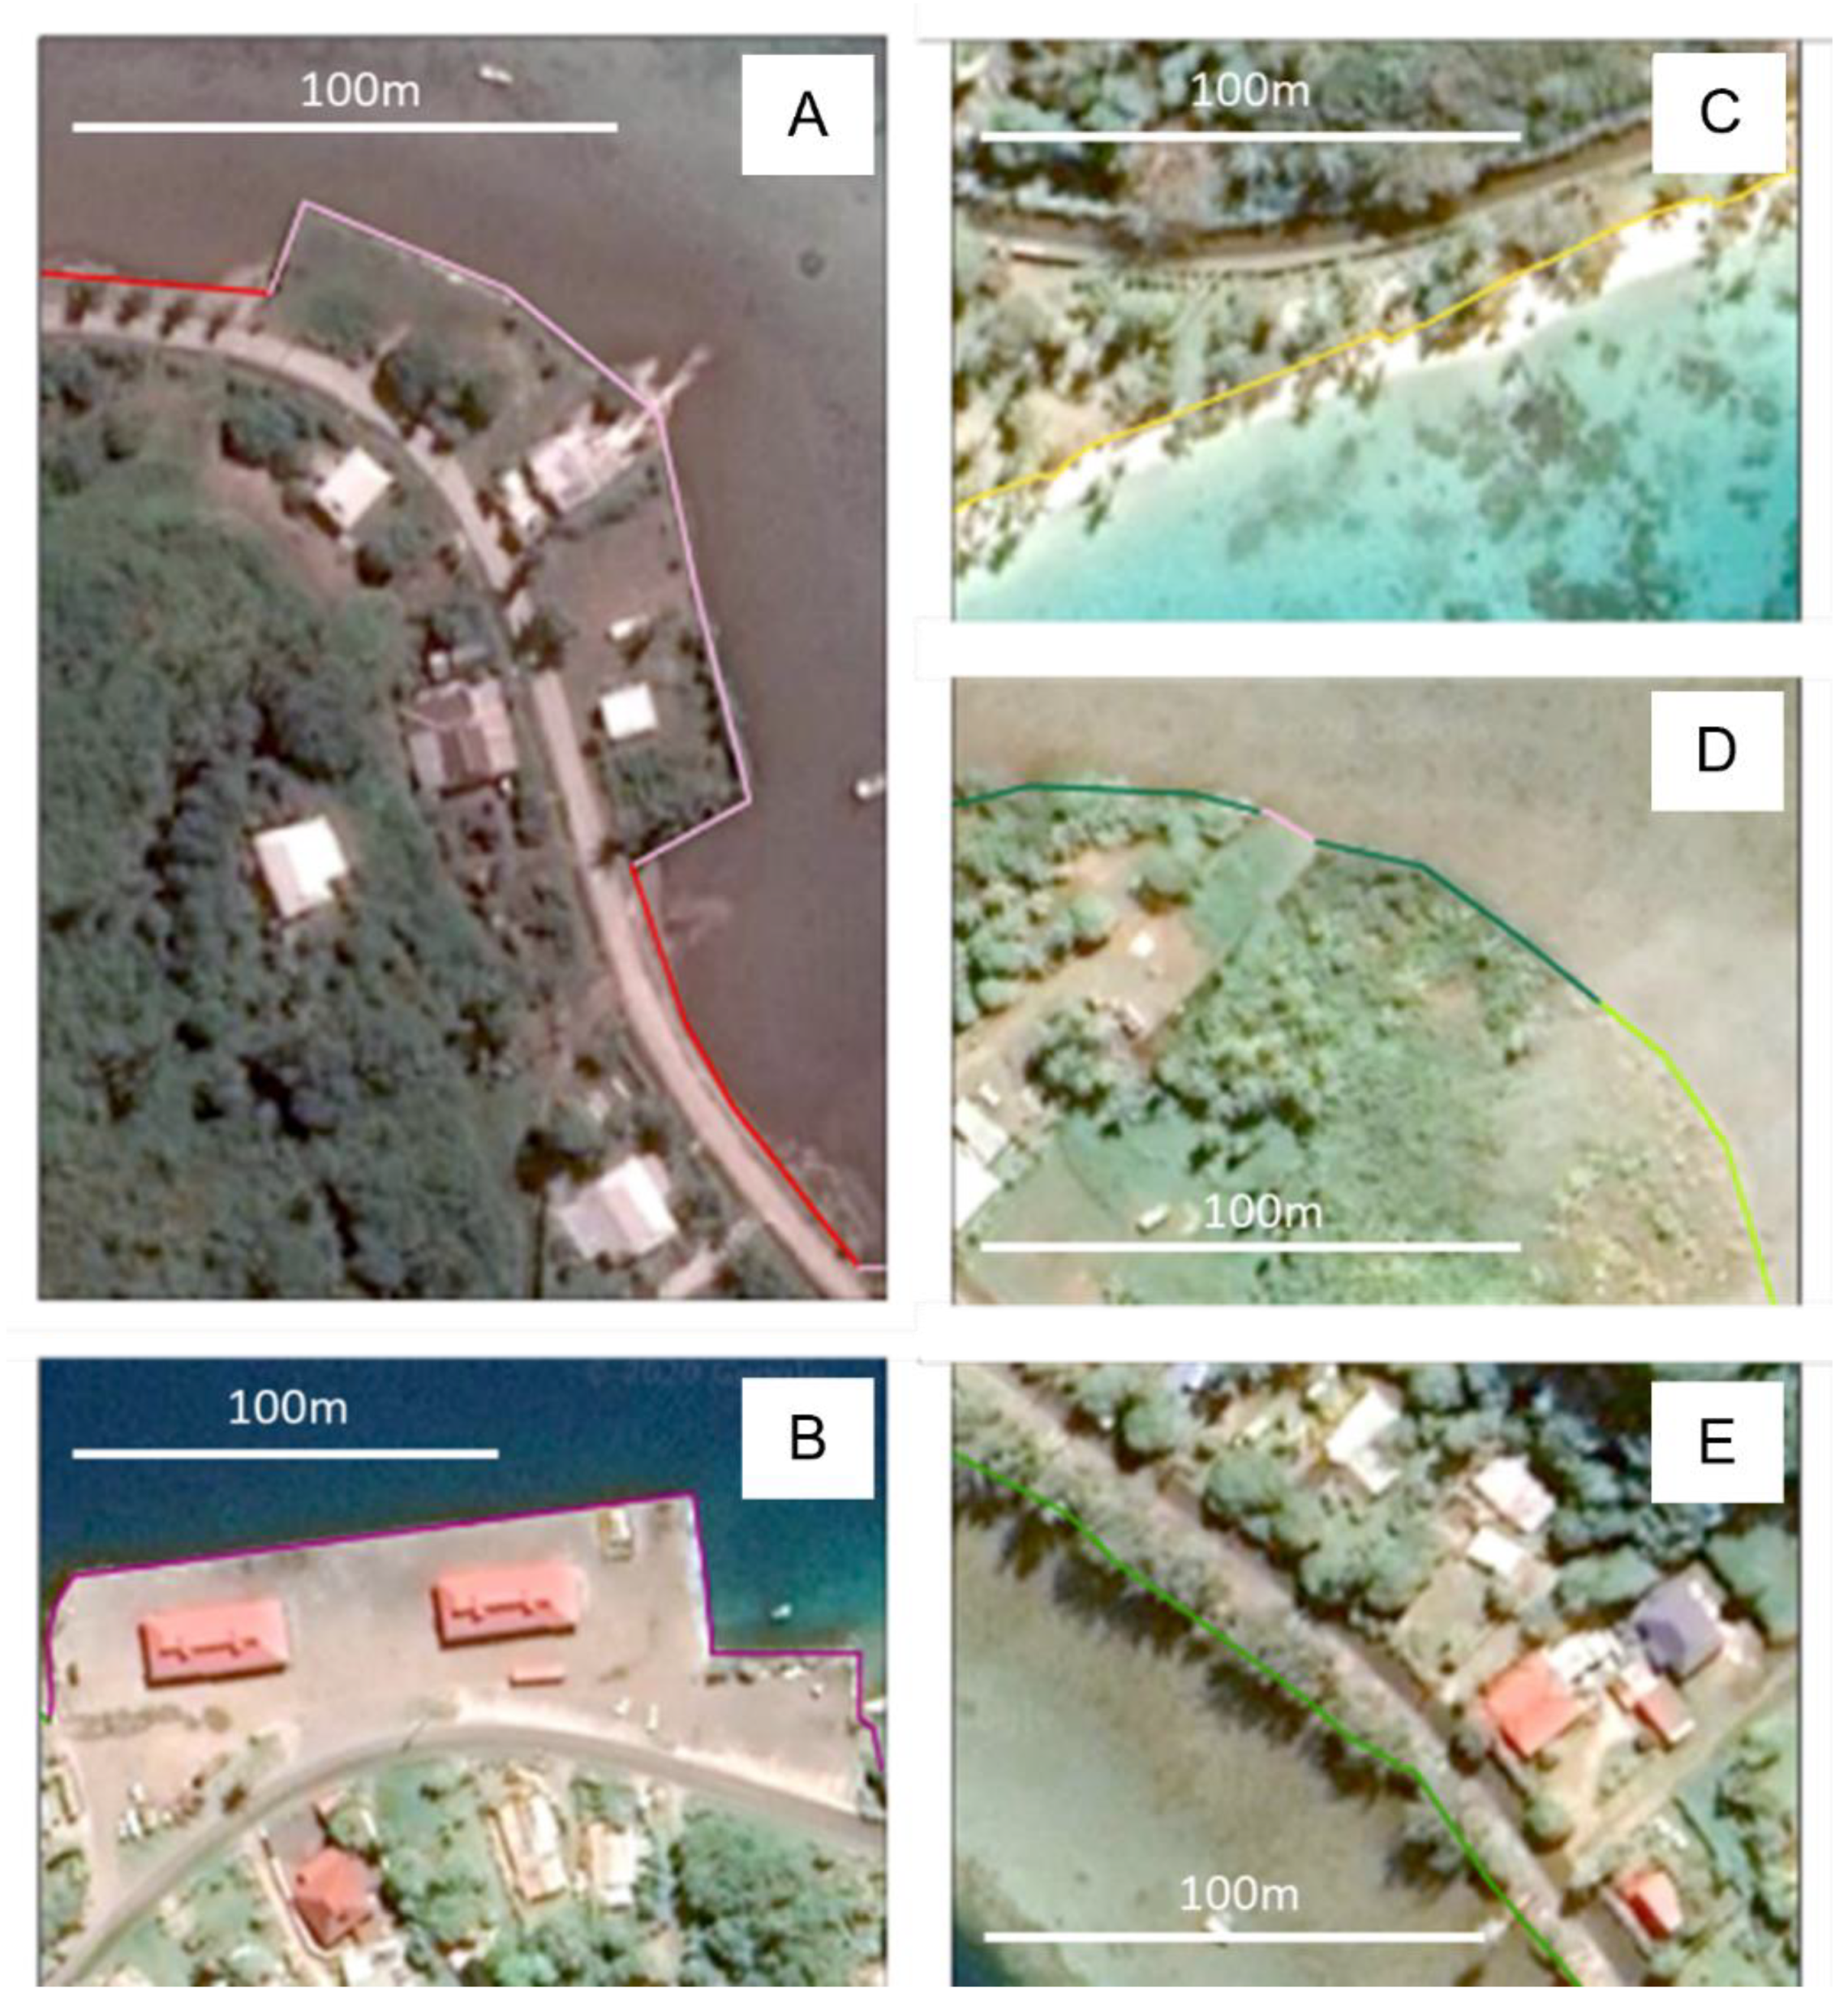
2.3.2. Shoreline Tracing

The shoreline was manually traced based on the sea-side edge of vegetation (including the sea-side edge of mangroves and grass/reed areas), as per previous publications (similarly to the stability line used in [17]), with the Editor tool on ArcGIS. When sparse coastal vegetation (i.e., spaced-out trees) had dense canopies, the middle of the canopy, in the alignment of non-vegetated areas with a clear shoreline position, was used to position the shoreline. For sandy beaches, the line of first vegetation was used and not the sea-sand boundary for two reasons:
  • The time of acquisition and, hence, tidal stage of the images is unknown; although the tidal range in the Society Islands is typically below 0.4 m [13], beaches tend to have shallow slopes and, hence, the sea-sand boundary may change by over 1 m throughout a daily tidal cycle.
  • The images are separated by multiple years—the position and extent of sand accumulations may be variable on daily to monthly timescales, which cannot be resolved with the dataset used in this article due to the lack of regular aerial imaging in the years before the start of satellite imagery.
Clouds were present over a few tens of meters of the coastline in 2019 in the urban area of Vaitape, in a zone with embankments and no natural shoreline. A ground survey confirmed the lack of further constructions or changes compared to the previous image of 2016. The shoreline was, hence, traced in the same position as for 2016. No other clouds were present over the coastline at any date.
The total error (Etot) of the shoreline positioning is taken as the square root of the sum of the squares (cf. [18]) of the three sources of error identified for this study: the spatial resolution (Eres), the georeferencing error (provided by the forward error of the ground control points on ArcGIS, Egeo) and the shoreline tracing inaccuracies (Etra) (Equation (1)).
E t o t   ( i n   m ) = E r e s 2 + E g e o 2 + E t r a 2
The shoreline error (total and yearly) is provided in Table 1 for each date.

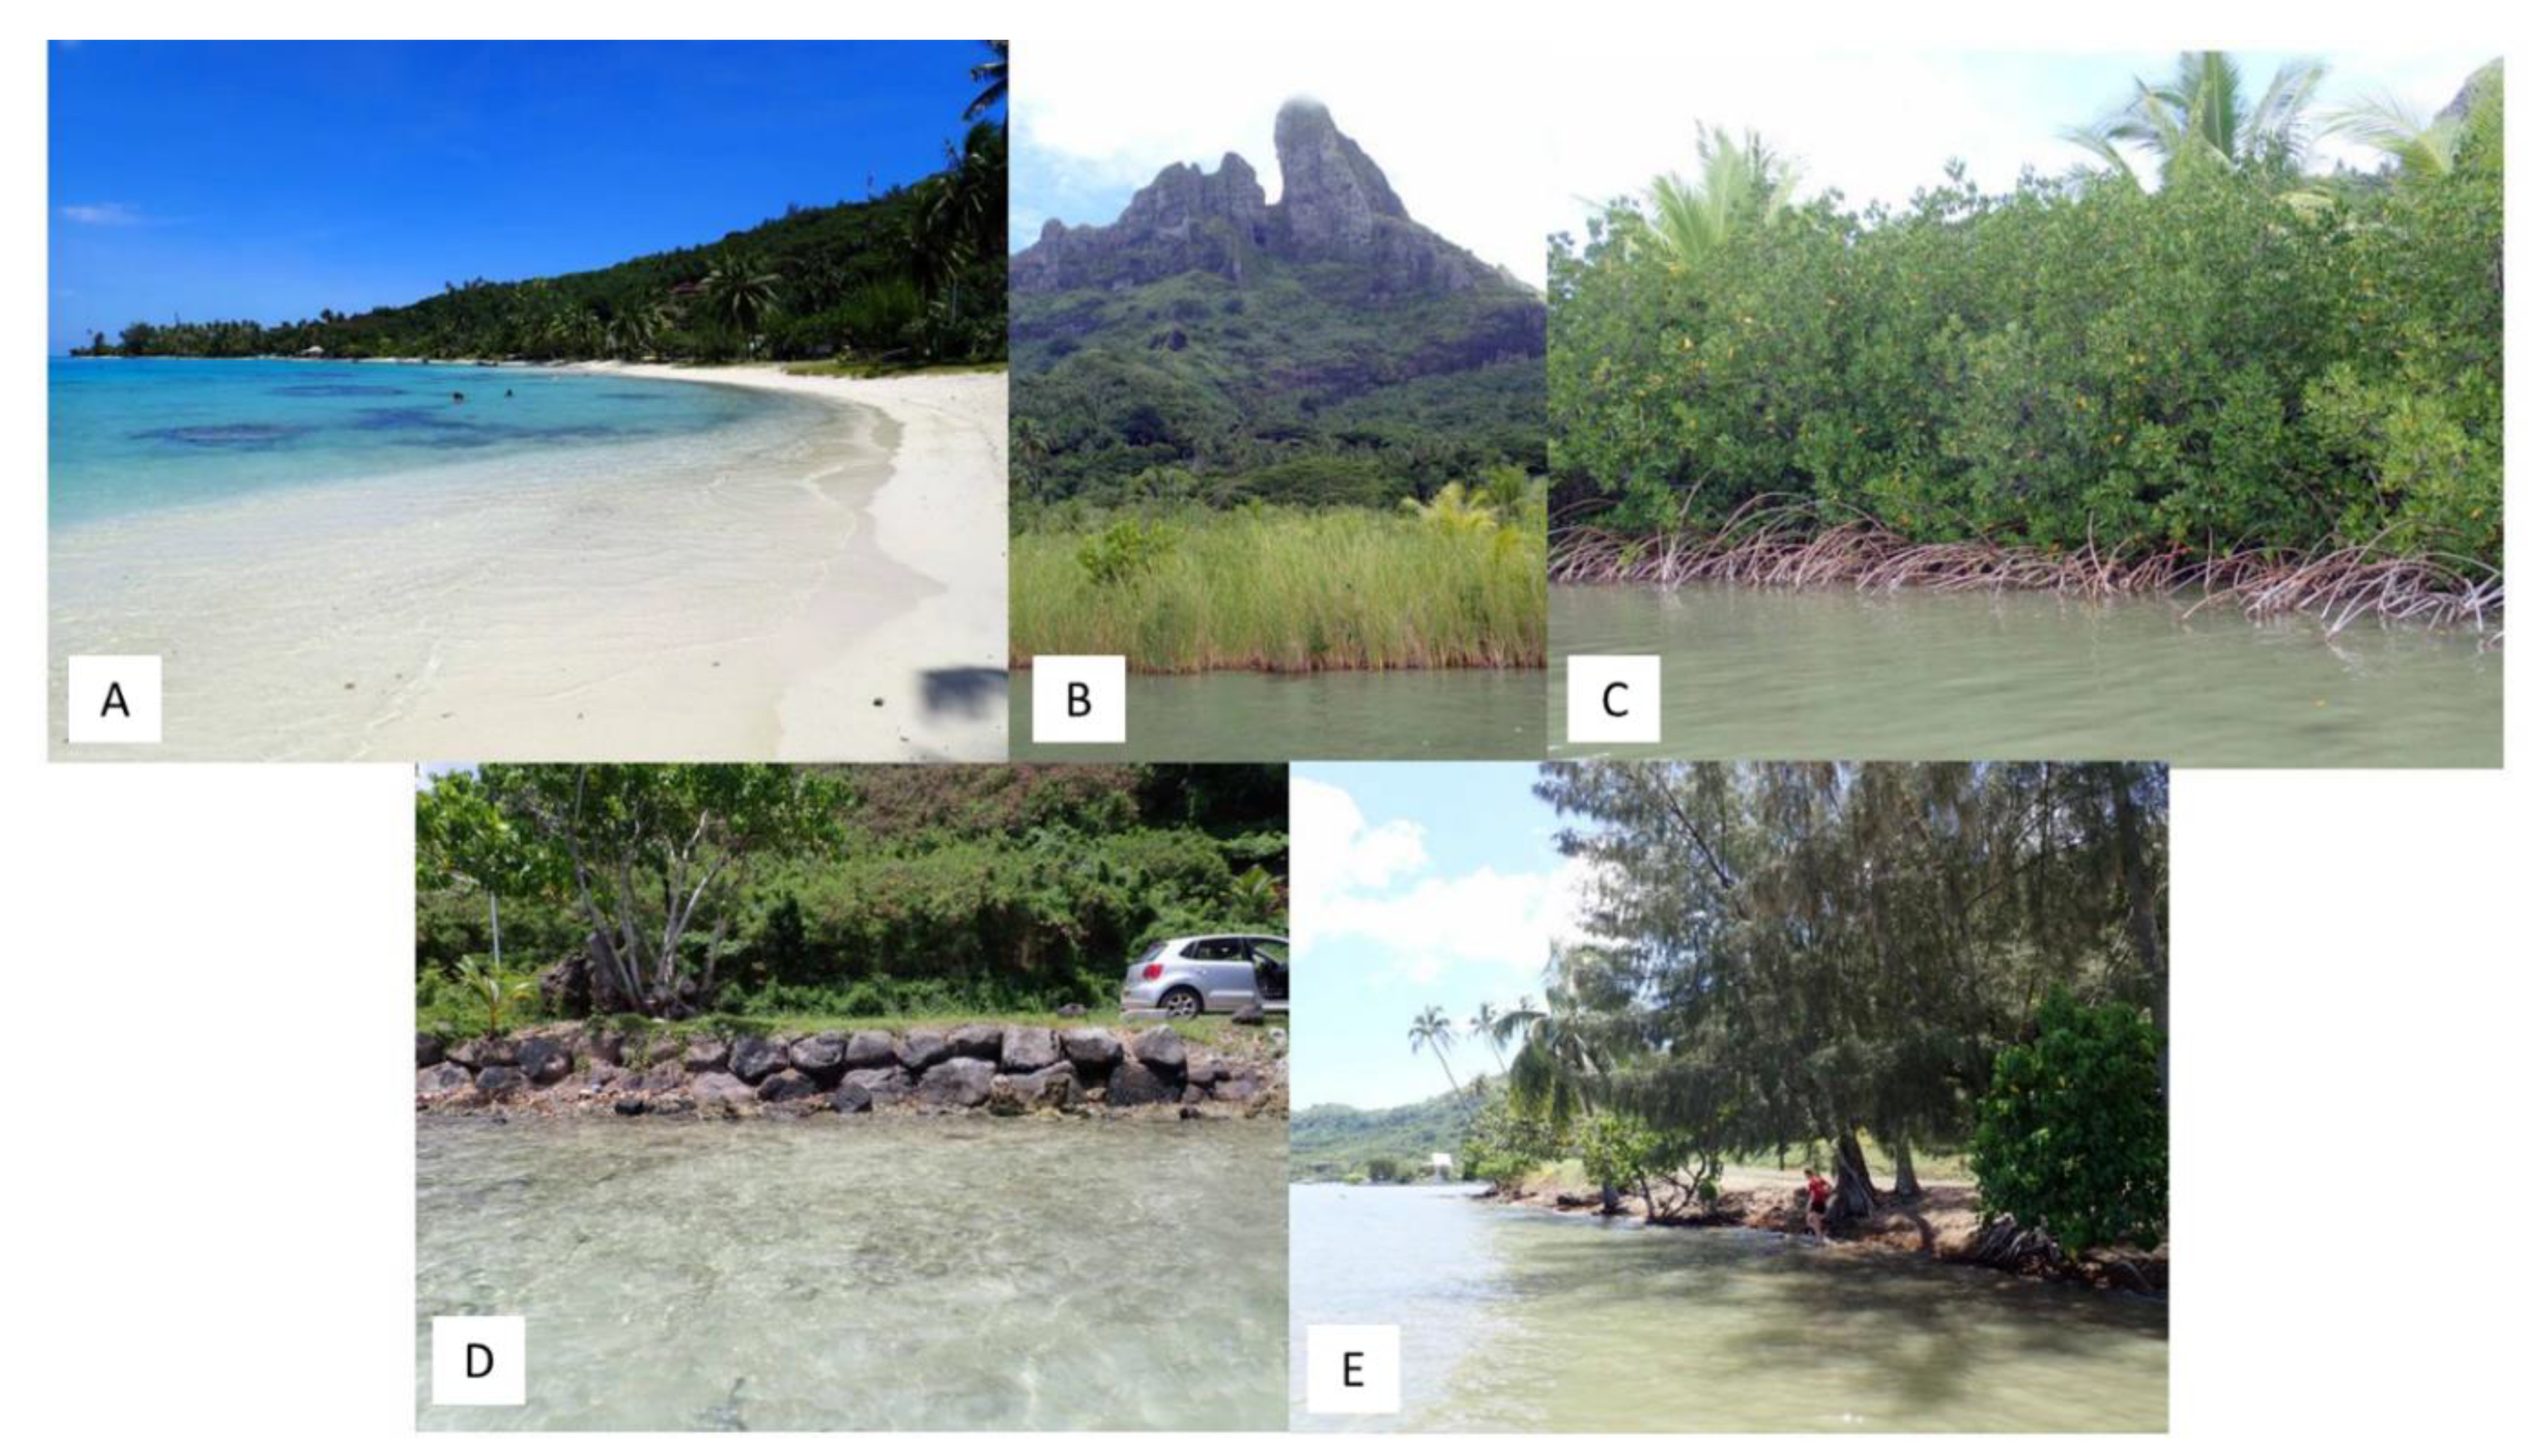
2.3.3. Shoreline Classification

The coastline was classified into the eight categories that were discernible on aerial images: sandy beaches, mangroves, trees (tall vegetation on a muddy substrate), grass (or reeds), natural rocky shores, road embankments (and seawalls, necessary for urbanisation purposes), private embankments (to consolidate lands), and quays (cf. Figure 3 and Figure 4; “method similar to [3]). The coastal classification for 2019 was performed first using the ground-based survey of the different coastal typologies to identify the bird-eye aspect of each category (Figure 3) and obtain a baseline from which to work backward in time and classify previous images through photointerpretation. The classification was performed by splitting the shoreline (Editor tool on ArcGIS). The length of each segment was calculated, and the percentage of the shoreline belonging to each category was extracted (cf. Figure 3 for examples of each category on aerial images).

2.3.4. Shoreline Position

The Digital Shoreline Analysis System (DSAS [19]) plug-in on ArcGIS was used to study erosion and accretion phenomena along the shoreline. The baseline was placed 25 m inland with respect to the innermost shoreline at any given position. Transects were cast every 5 m, with a maximum search distance from the baseline of 250 m and a smoothing distance of 200 m. The shorelines were set to have a default data uncertainty of 5 m (linked to the uncertainty of the determination of dark reef flat features vs. coastal bushes). Two parameters were calculated between each date and over the whole period (1955 to 2019) with the DSAS plug-in on ArcGIS, with a confidence interval of 95.5 (2σ): the Net Shoreline Movement (NSM)—total distance between the earliest and most recent shorelines for each transect, in meters—and the End Point Rate (EPR)—NSM divided by the number of years between the earliest and the most recent shorelines, in meters per year.
These statistics were studied in relation to the categories obtained beforehand to identify which categories were responsible for the most change in shoreline position around the island since the mid-1950s. For selected parts of the island, the average EPR was calculated for each 10° change in azimuth (i.e., average from 0 to 10°, 10 to 20°) and time interval. To identify temporal changes in sedimentary dynamics, linear correlation coefficients were calculated by comparing the average EPR at each 10° azimuth change between each pair of year intervals. For instance, a hypothetical net erosion of −1 m between 0 and 10° and accretion of 1 m between 10° and 20° for a given time interval, and net erosion of −0.5 m at 0–10° and accretion of 0.5m at 10–20° for another time interval would yield a linear correlation coefficient r of 1 between those two time intervals.

3. Results

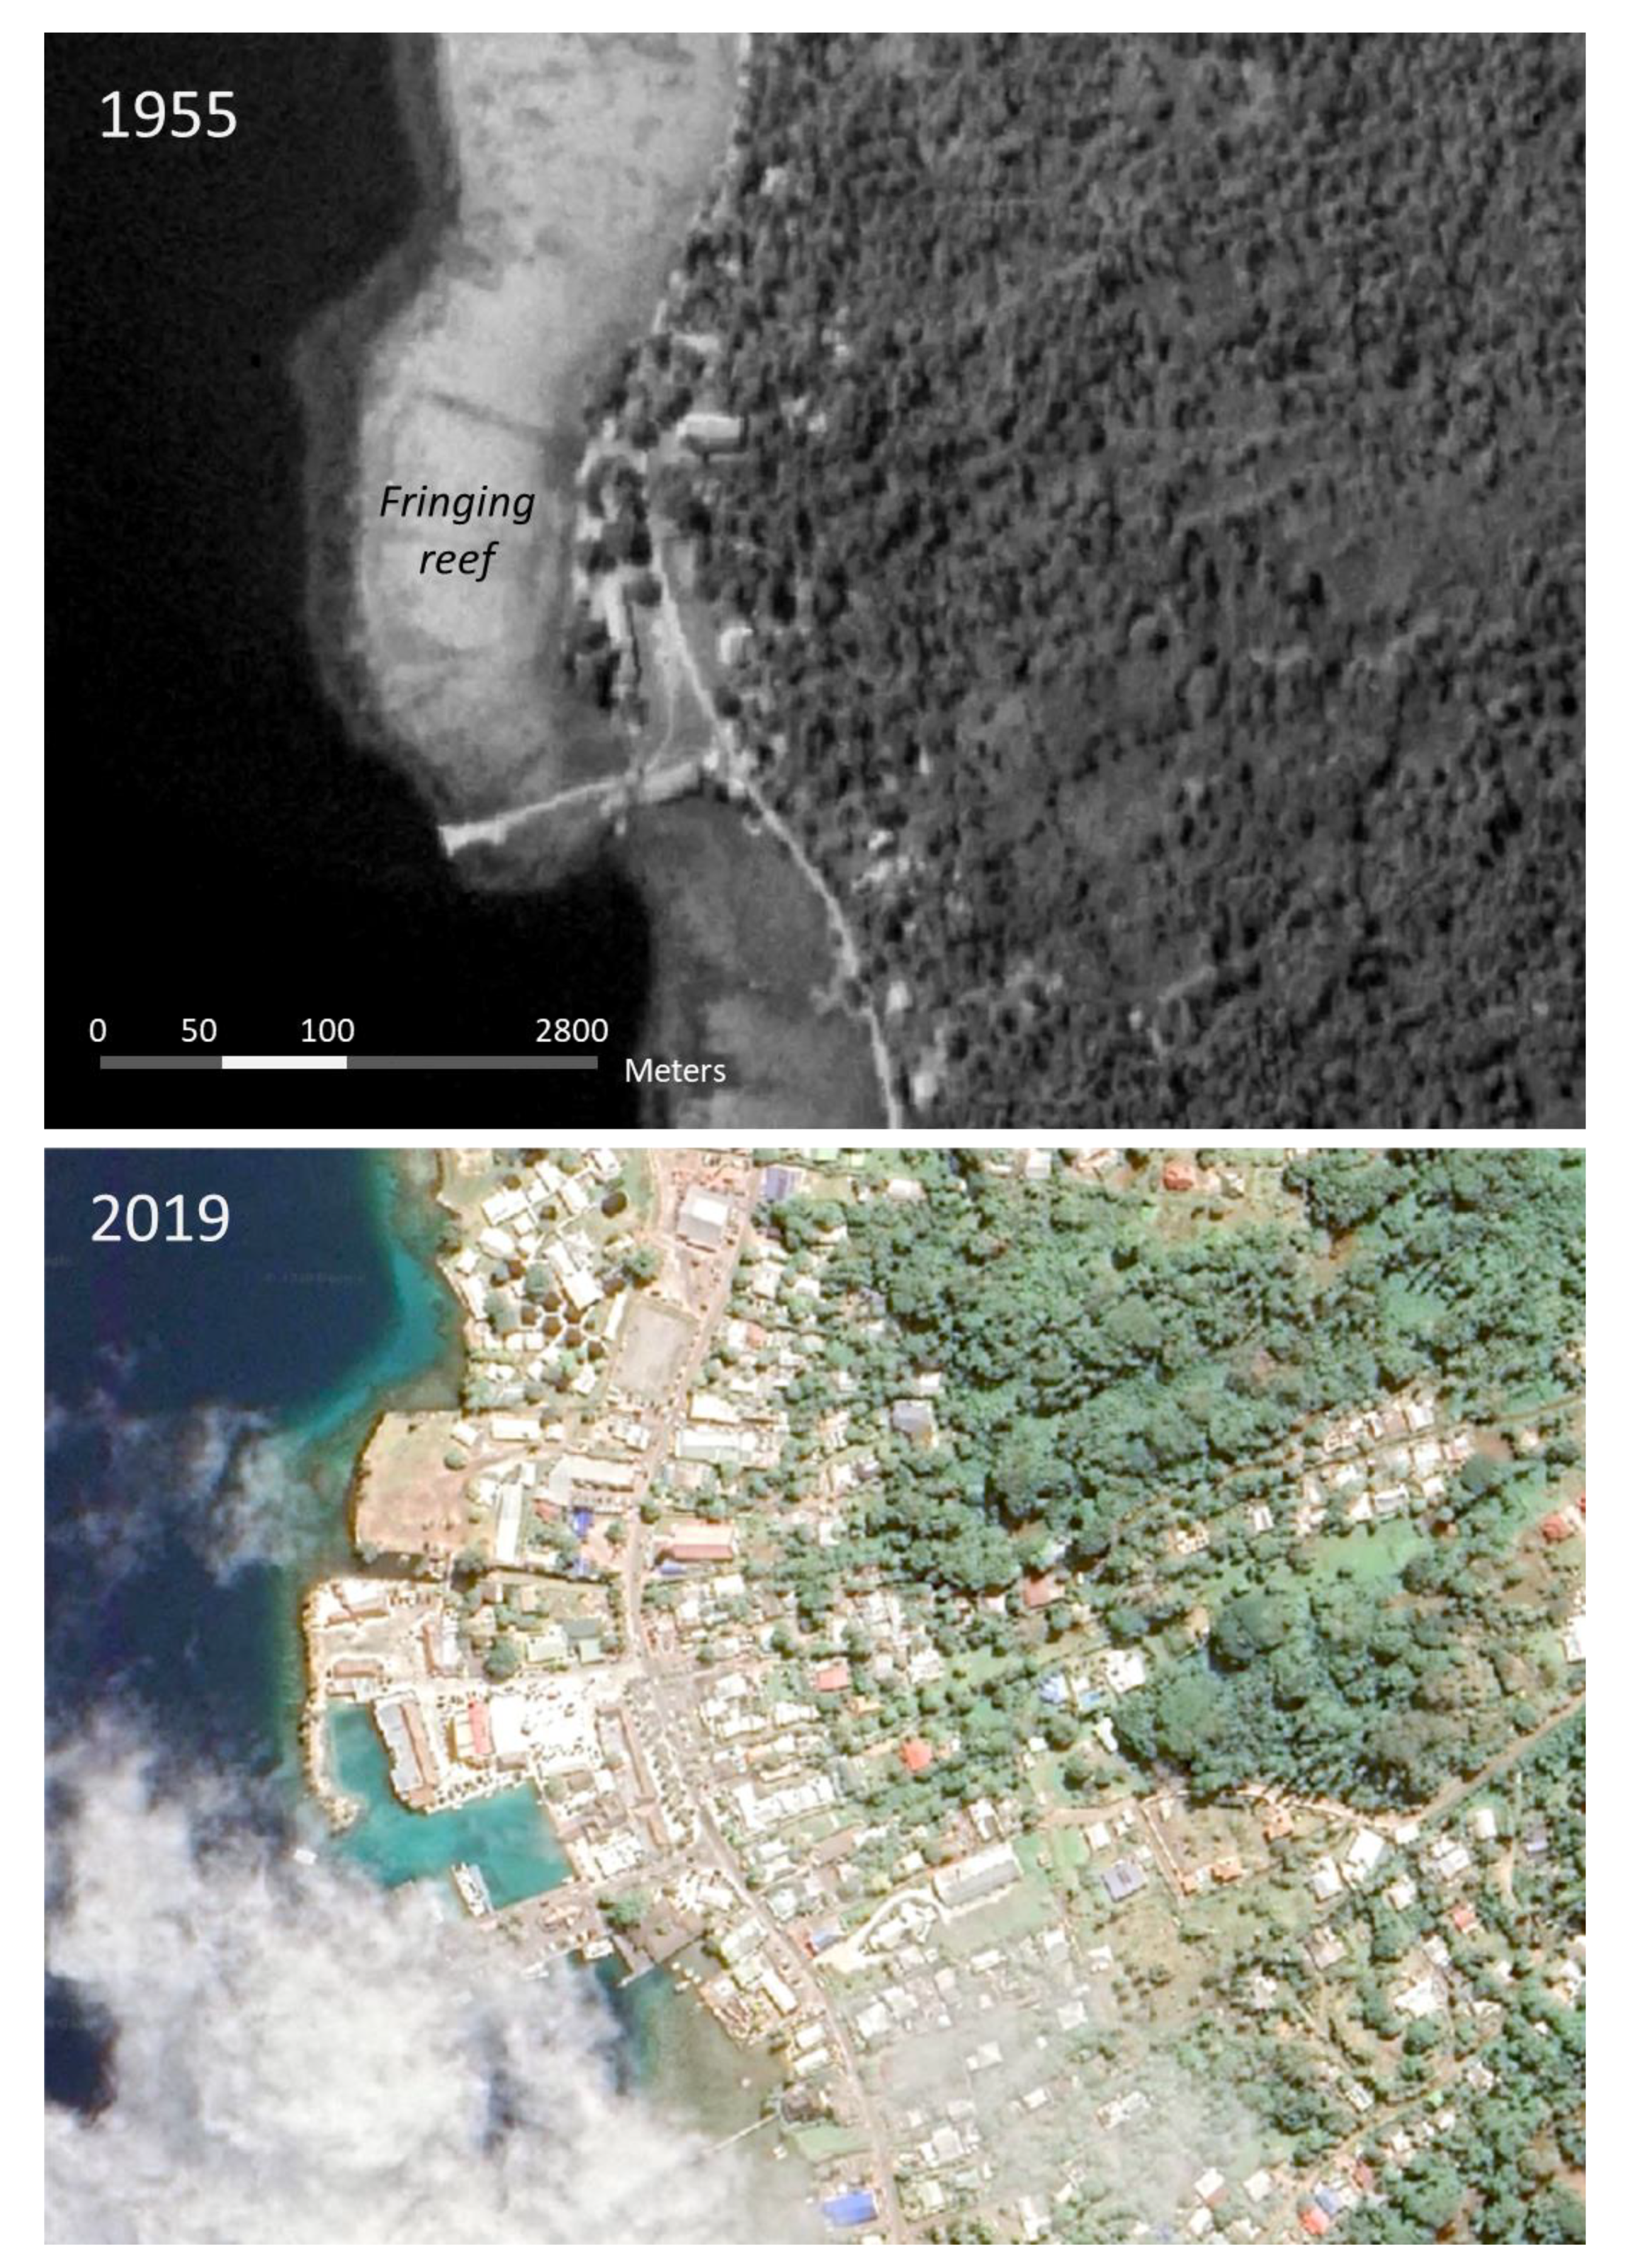
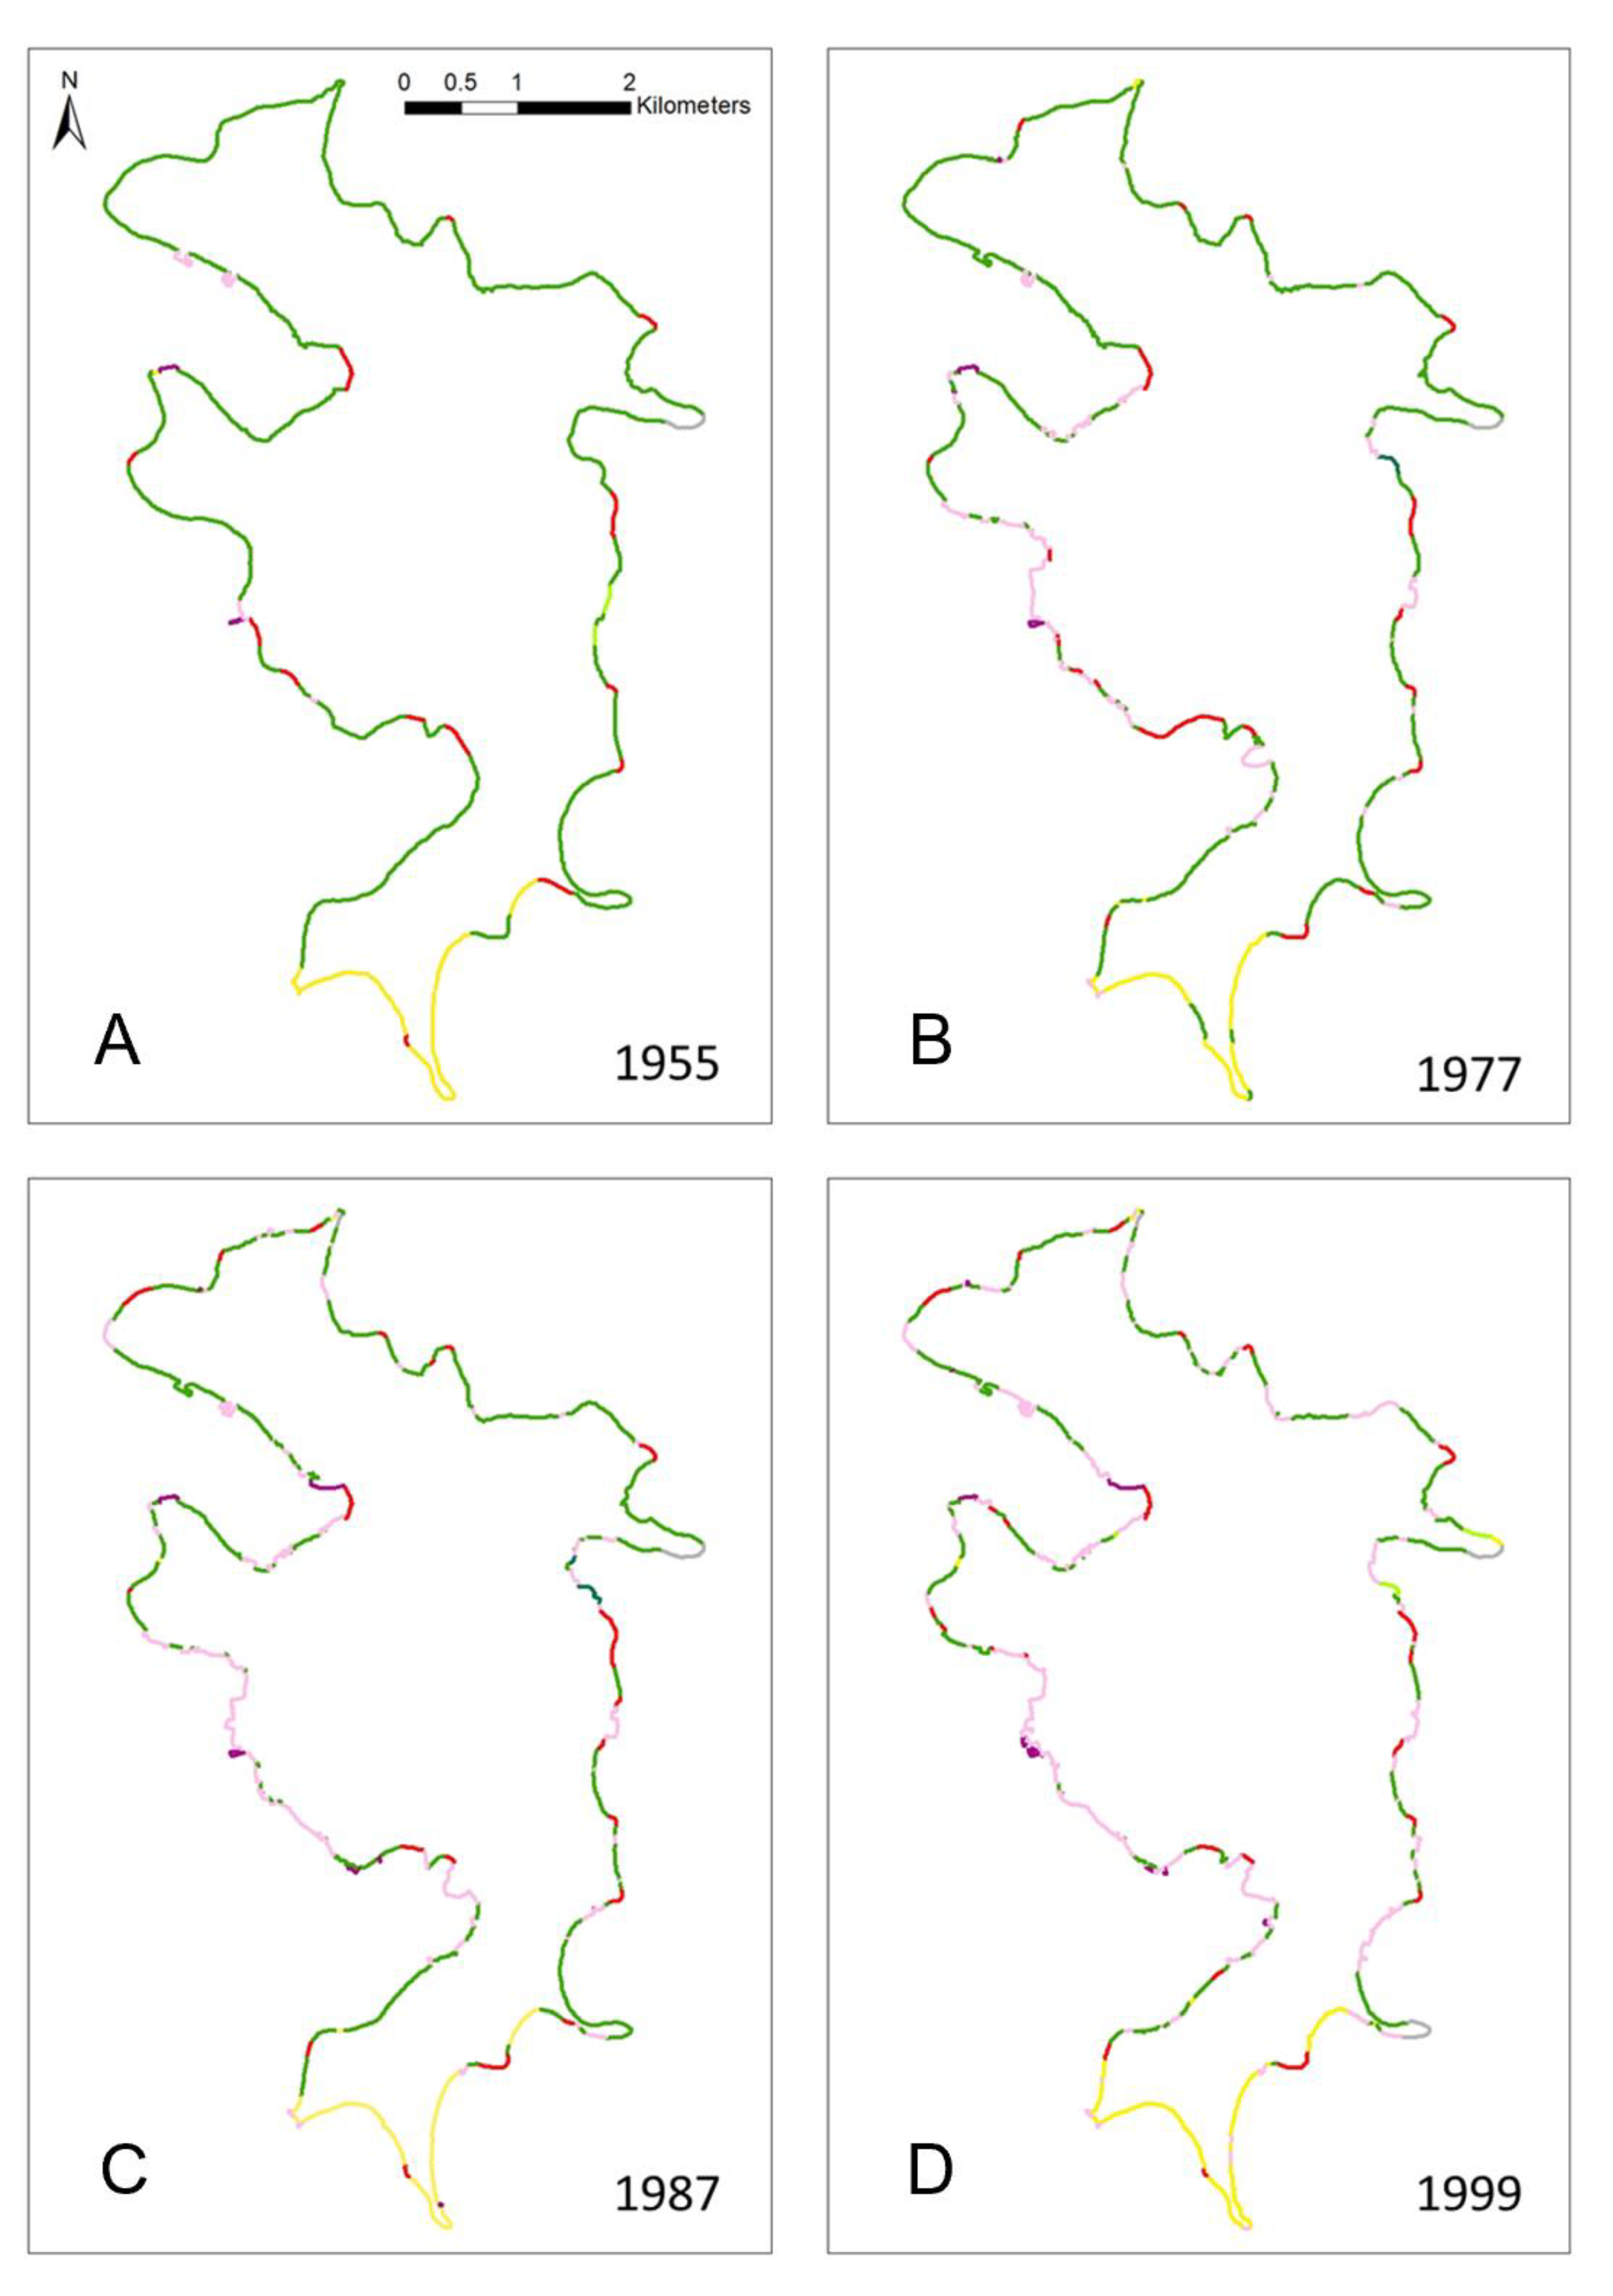
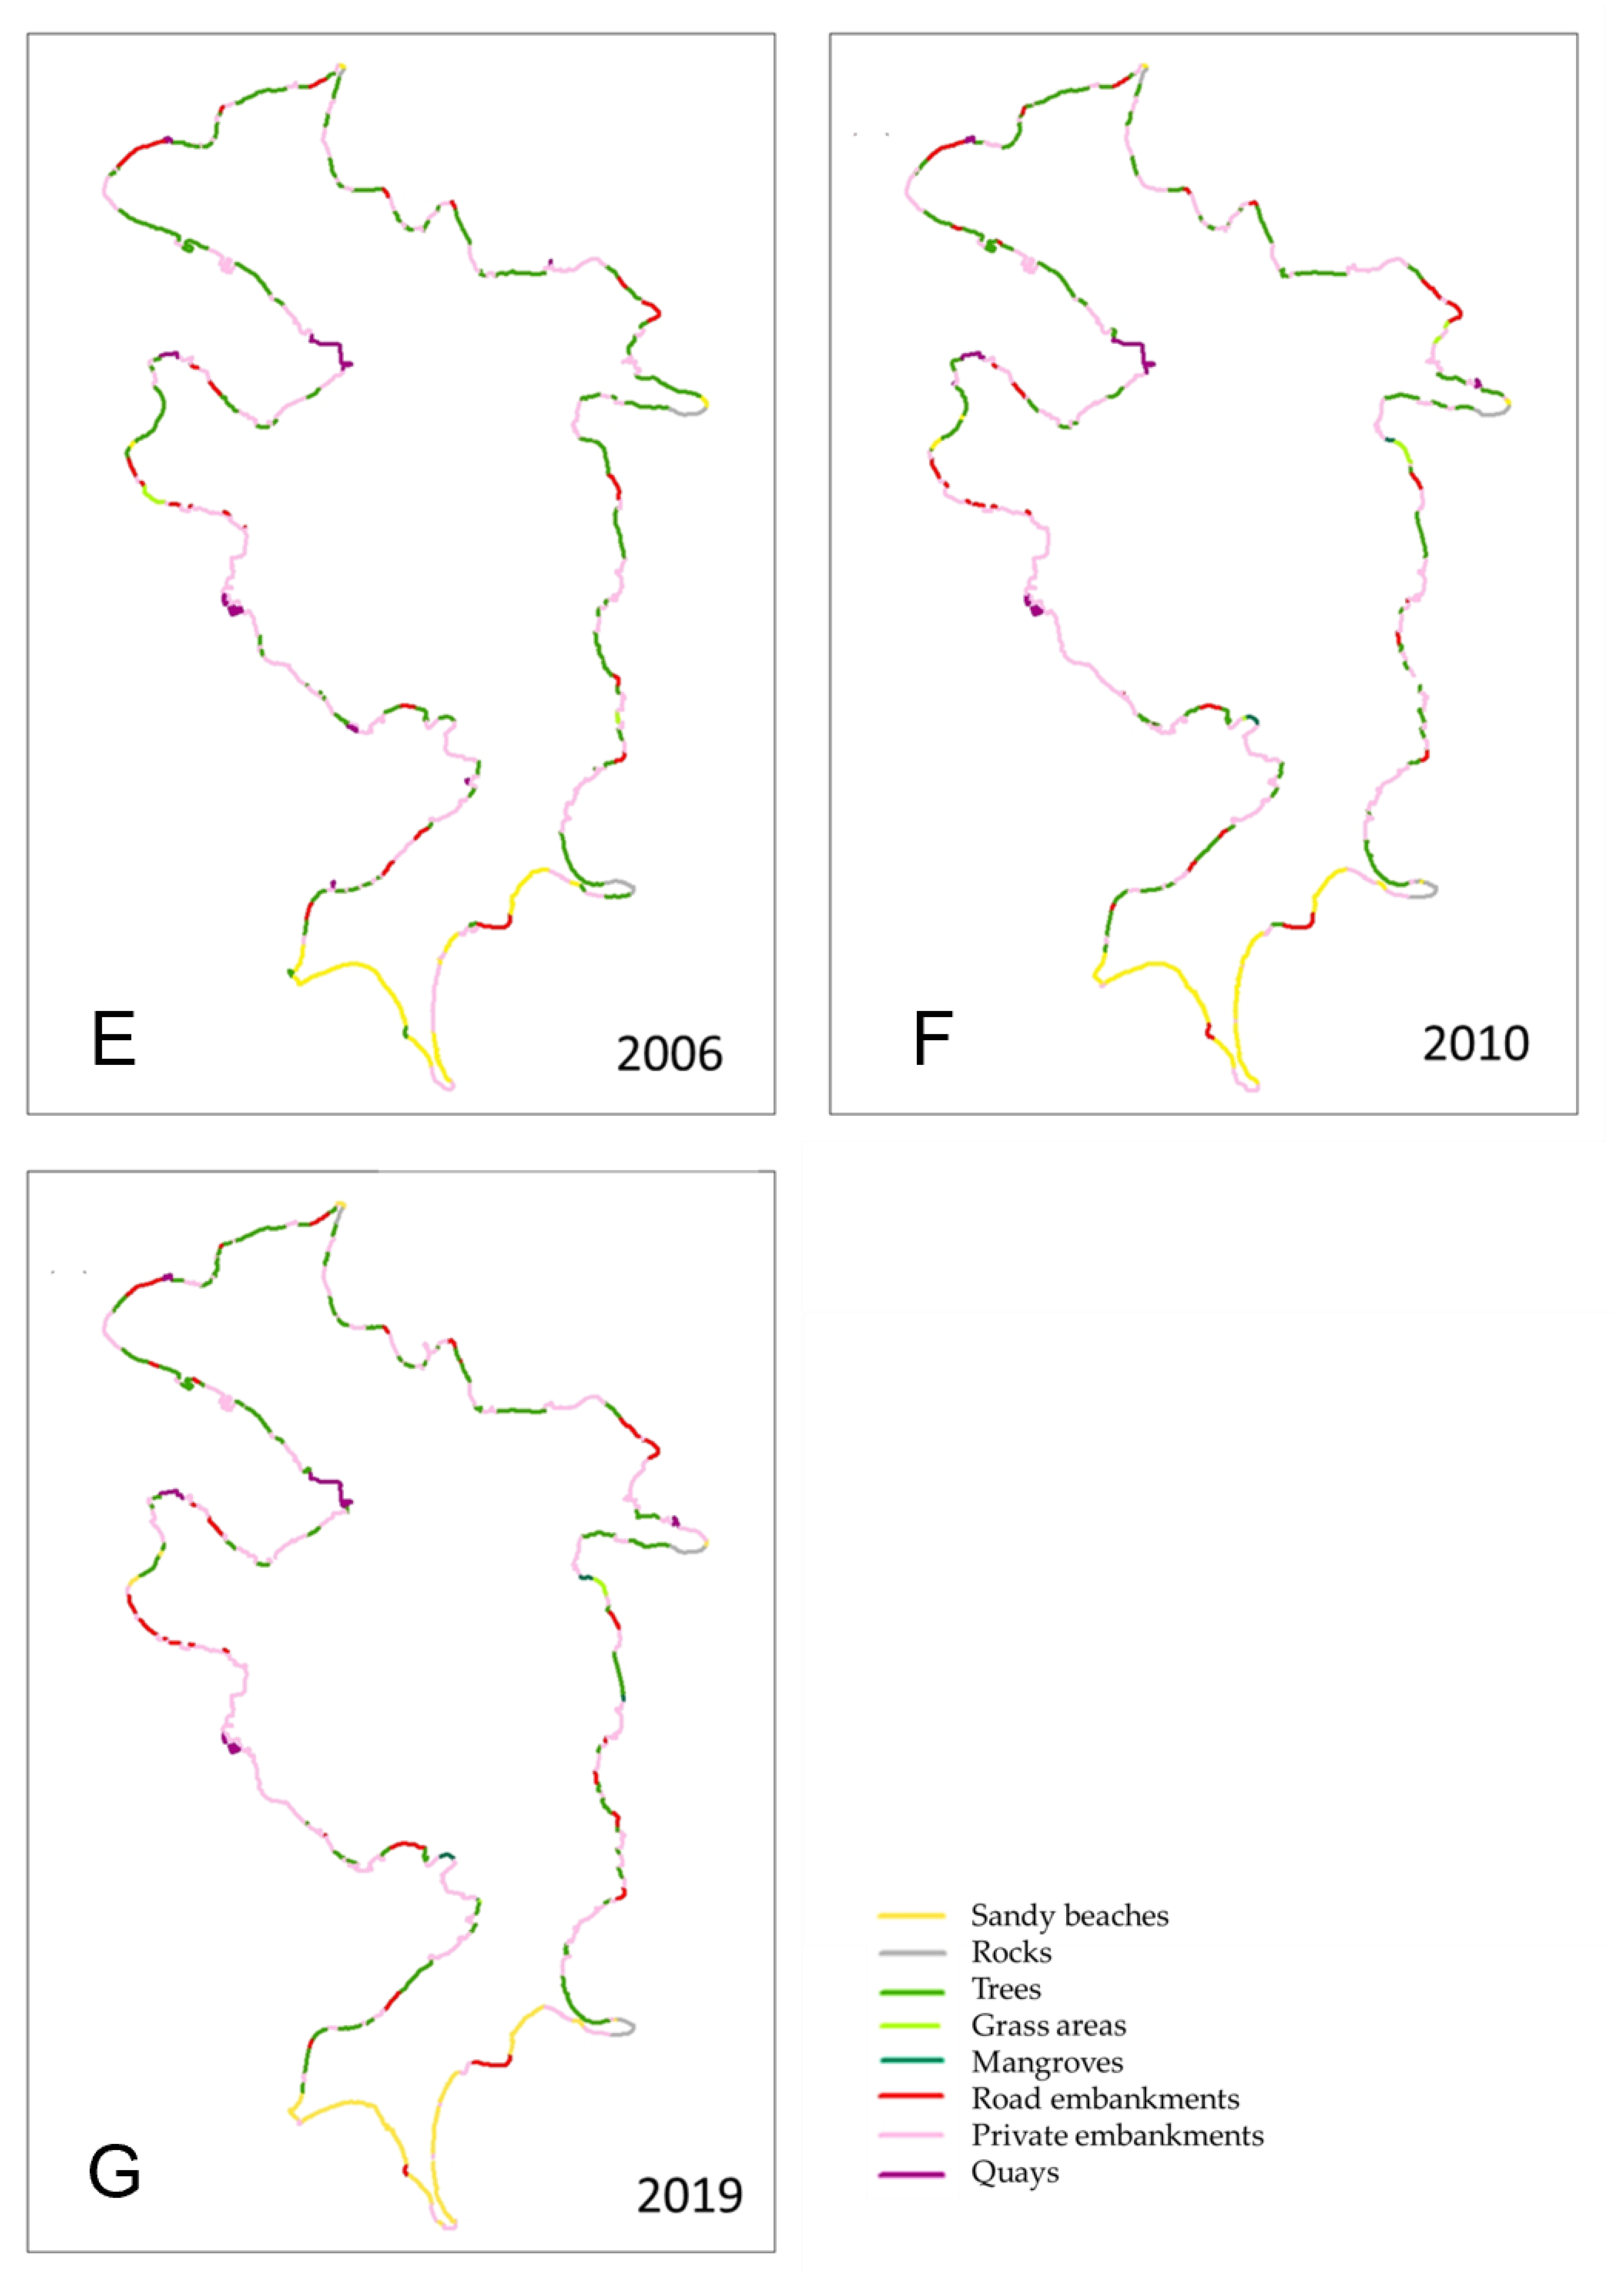
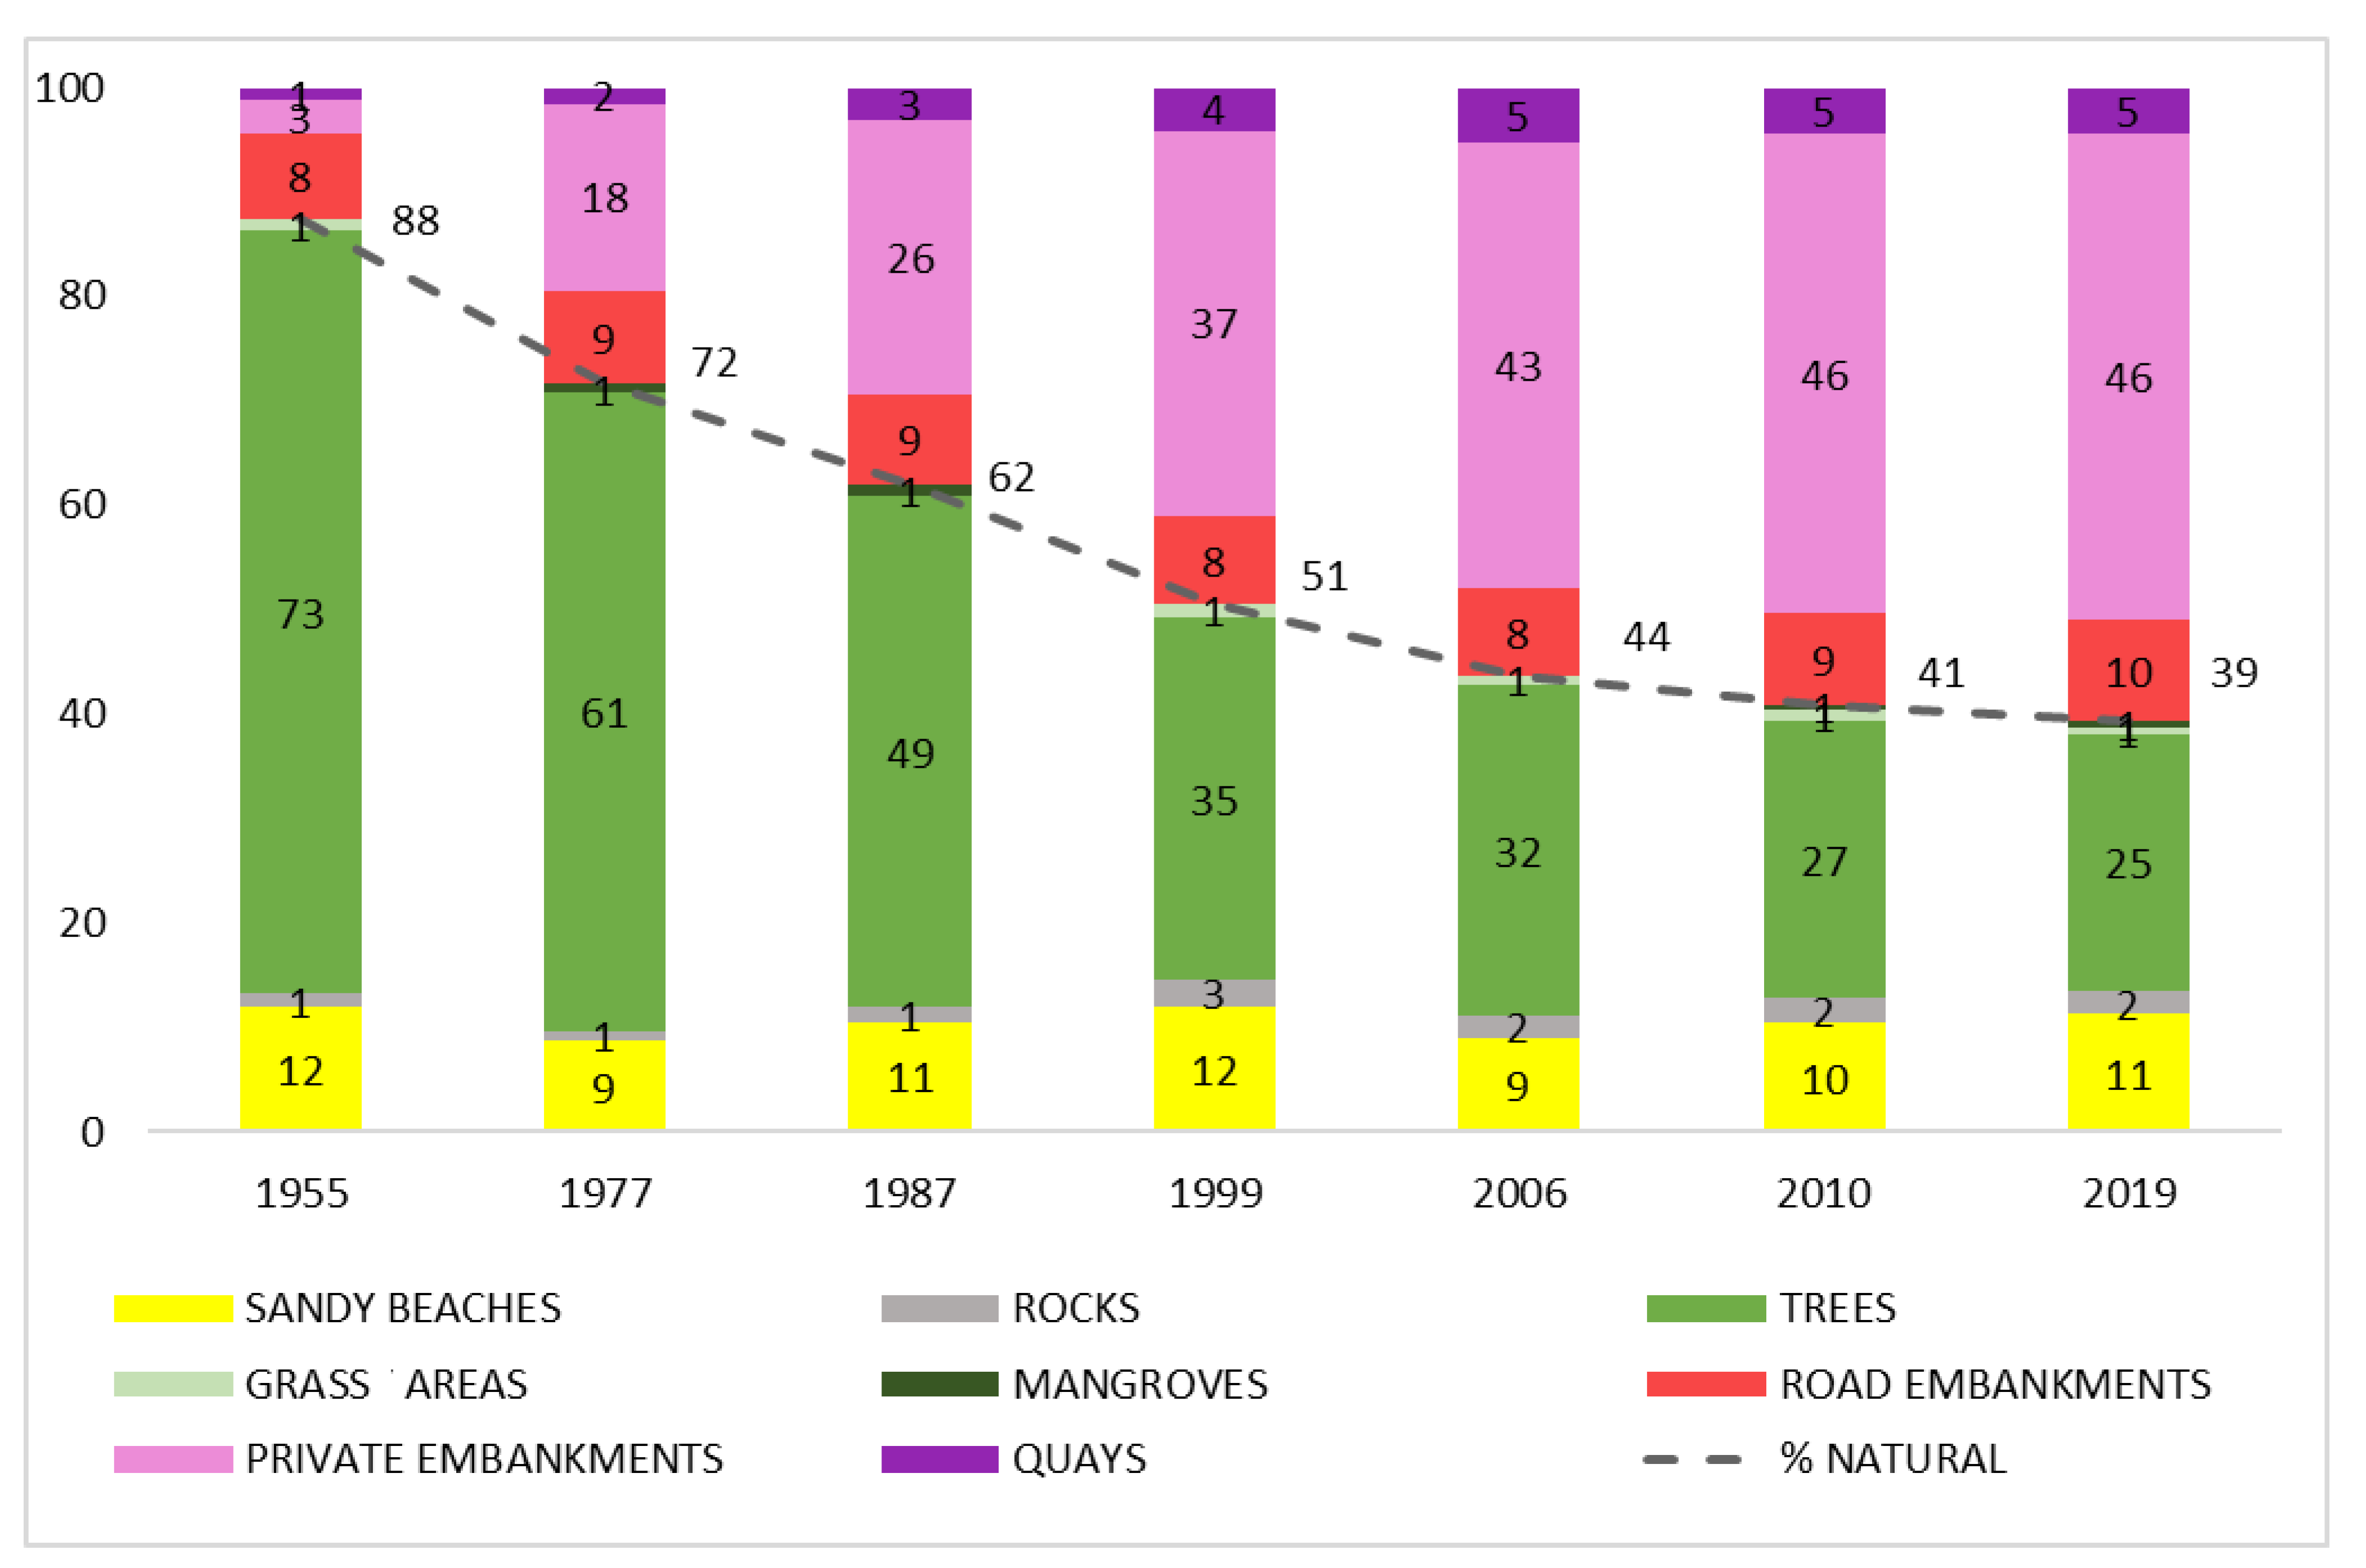
3.1. Evolution of the Shoreline Classification from 1955 to 2019

Using aerial images of Bora Bora, the maps below (Figure 5) were produced to display the evolution in coastal categories (sandy beaches, rocks, trees, grass, road embankments, private embankments, quays, cf. Figure 3 and Figure 4) from 1955 to 2019. Sandy beaches have remained constrained to the southern part of the island, but the southernmost tip was altered from a sandy beach to a private embankment in the 2000s. Along the rest of the island, the dominant coastal category has switched from trees to private embankments. Most changes occurred between the 1970s and 1990s, and the coastline classification has remained relatively similar since 2006.
In detail, the natural (sandy beaches, rocks, trees, grass areas, and mangroves) shoreline length has decreased by over 46% from 1955 to 2019, from 32.2 km to 17.2 km out of over 40 km of shoreline (varying length depending on the year and human-made changes; Figure 6). At the same time, the human-made shoreline length (quay, road embankment, and private embankment) has increased by 476%. The percentage of the shoreline transformed into embankments to stabilise public roads has remained relatively constant on Bora Bora, at 8–10% (total length: 2979 m in 1955, 4273 m in 2019), while the percentage of the shoreline as quays has increased slightly (1% to 5%). The extent of mangroves and grass areas have remained limited (<0.5 to 1% throughout). Overall, Bora Bora’s coastline has undergone strong changes, transitioning from natural to mostly human-made categories from 1955 to 2019.

3.2. Evolution of the Shoreline Position from 1955 to 2019

3.2.1. Shoreline Positioning Error

To investigate the relationship between shoreline classification and positioning in Bora Bora over time, the position of the shoreline was estimated manually using the available VHR imagery. The error of the shoreline position determined for each year is detailed by Table 2. The tracing error was estimated to be two meters for each date, notably due to uncertainties in the determination of the position of the shoreline in vegetated areas due to treetops, but also in the case of low spatial resolution leading to difficulties in distinguishing the land from the sea. The georeferencing error ranges from 0 (2019 is used as the reference) to 4.02 m (for 1955). The total error (Equation (1)) is maximum for 1955 (4.76 m) and minimum for 2019 (2.06 m), and is between 3.20 and 3.95 m for the other dates.

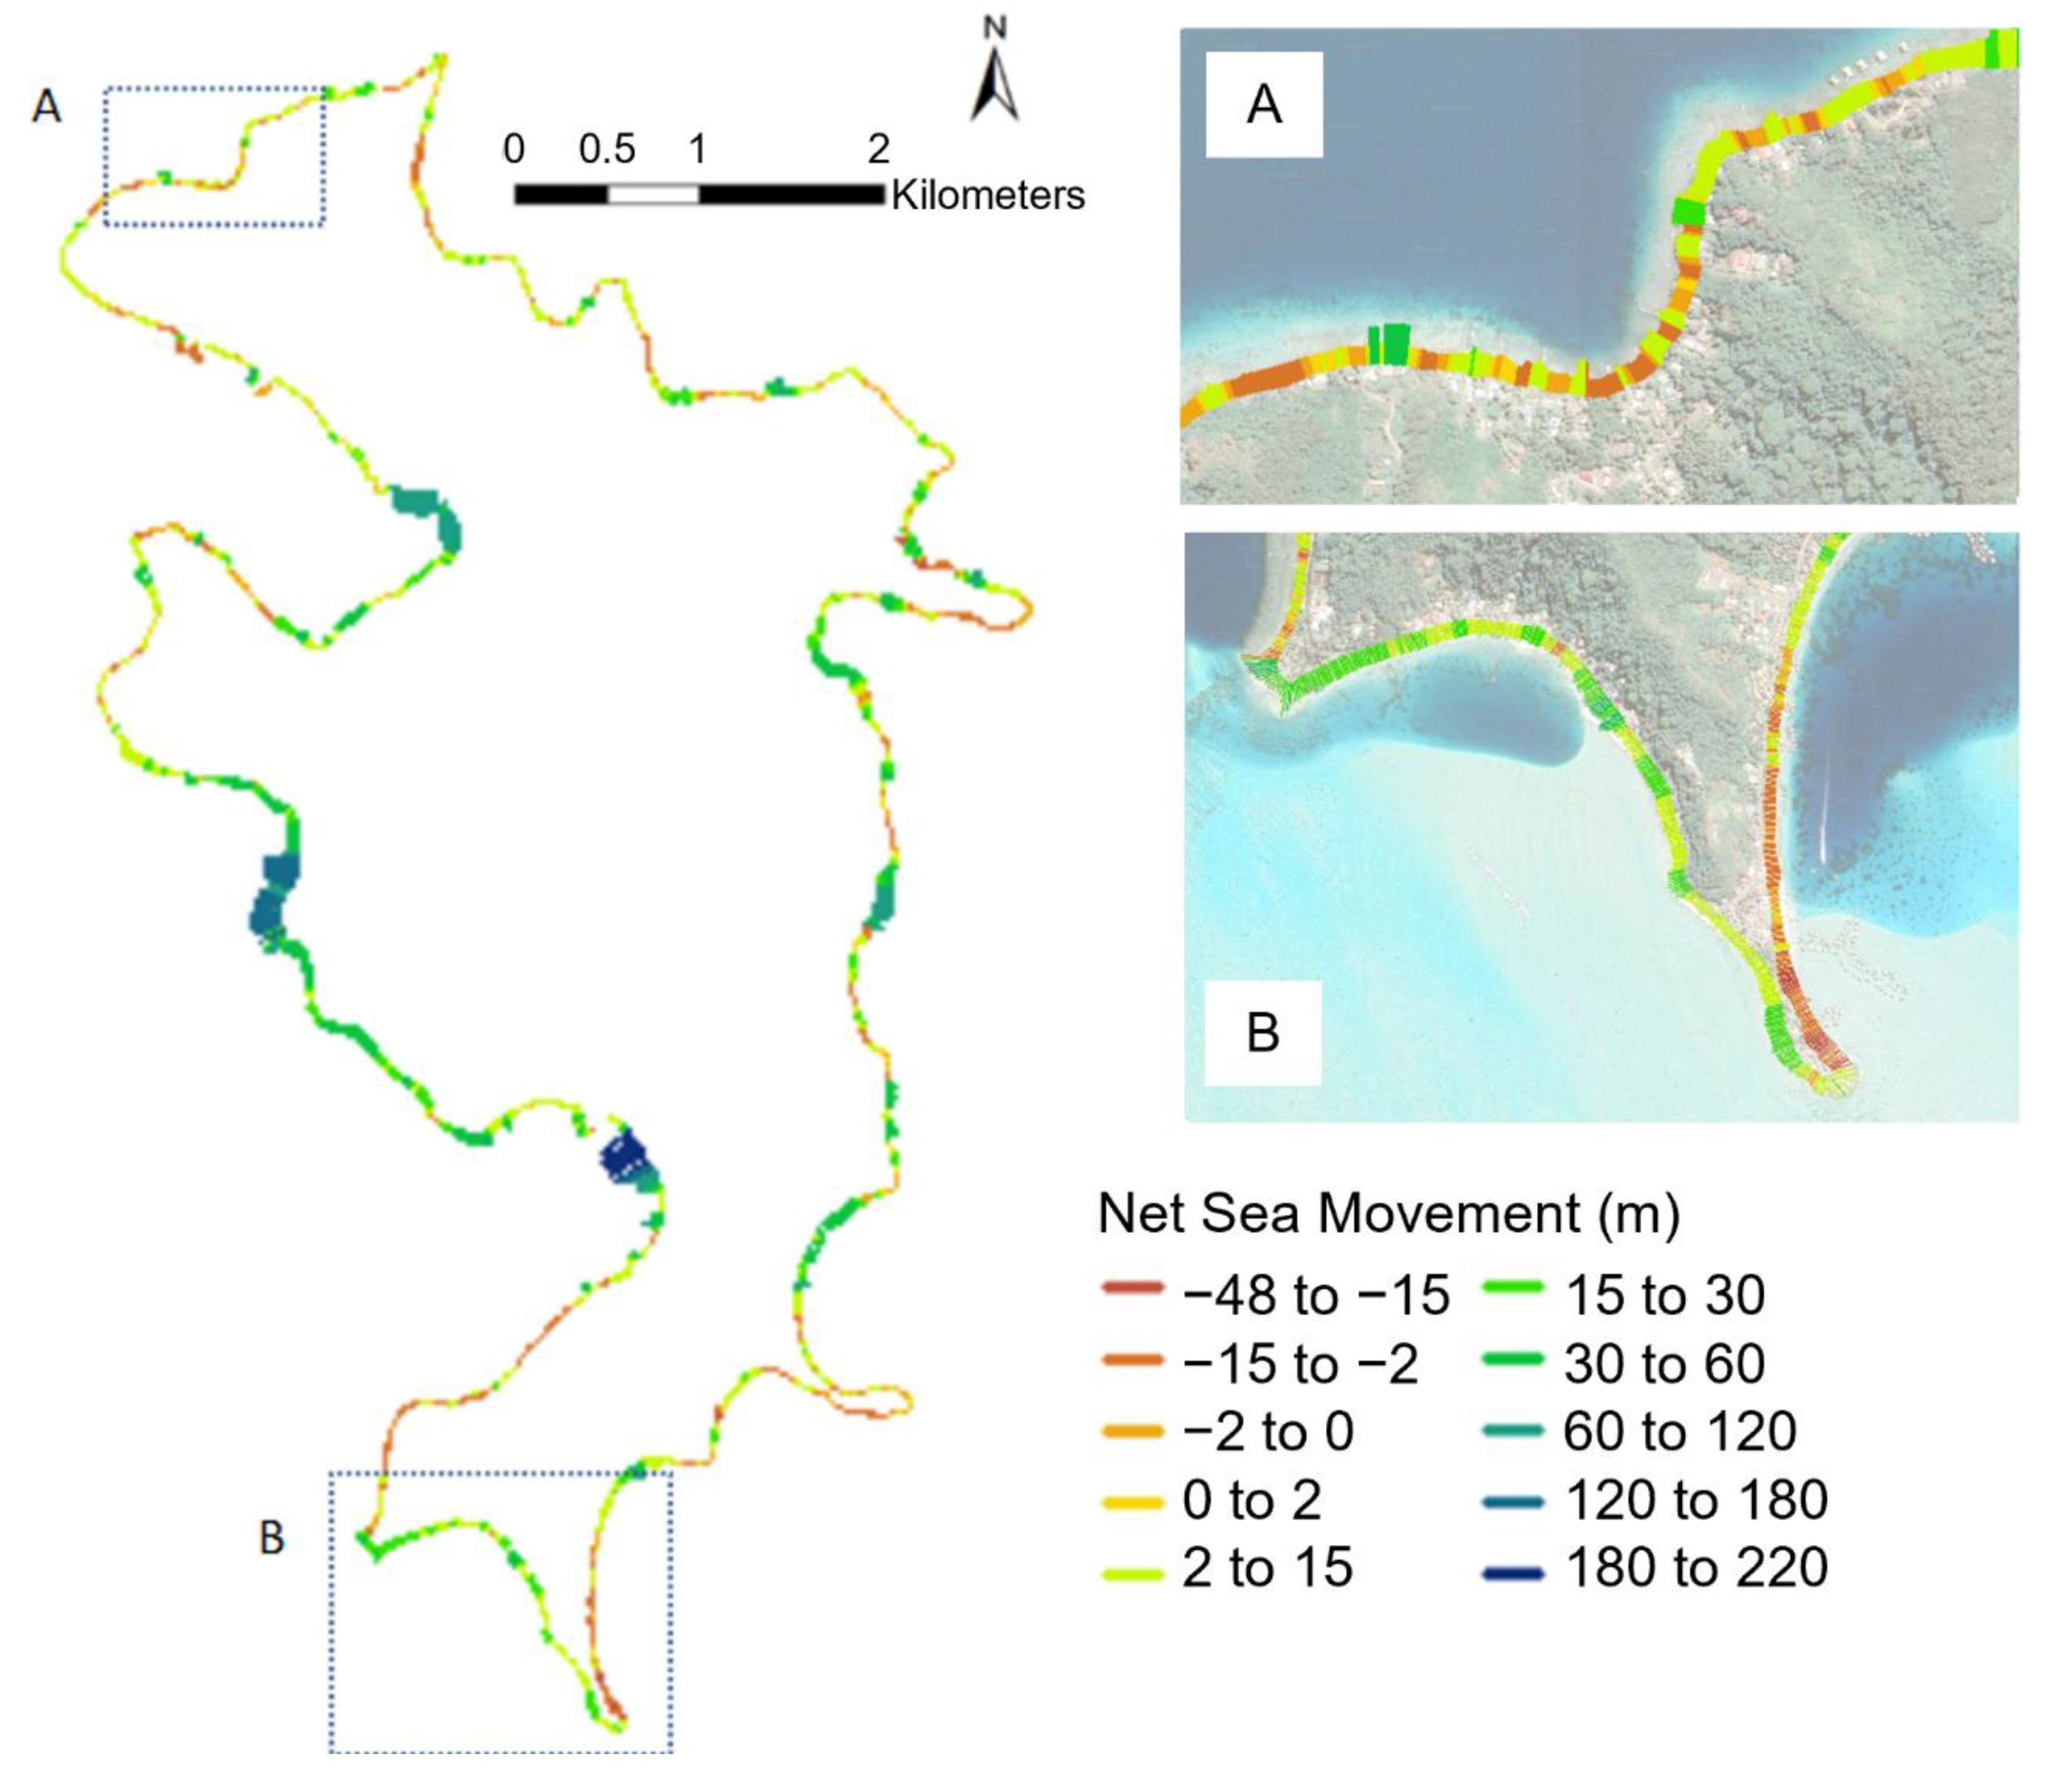
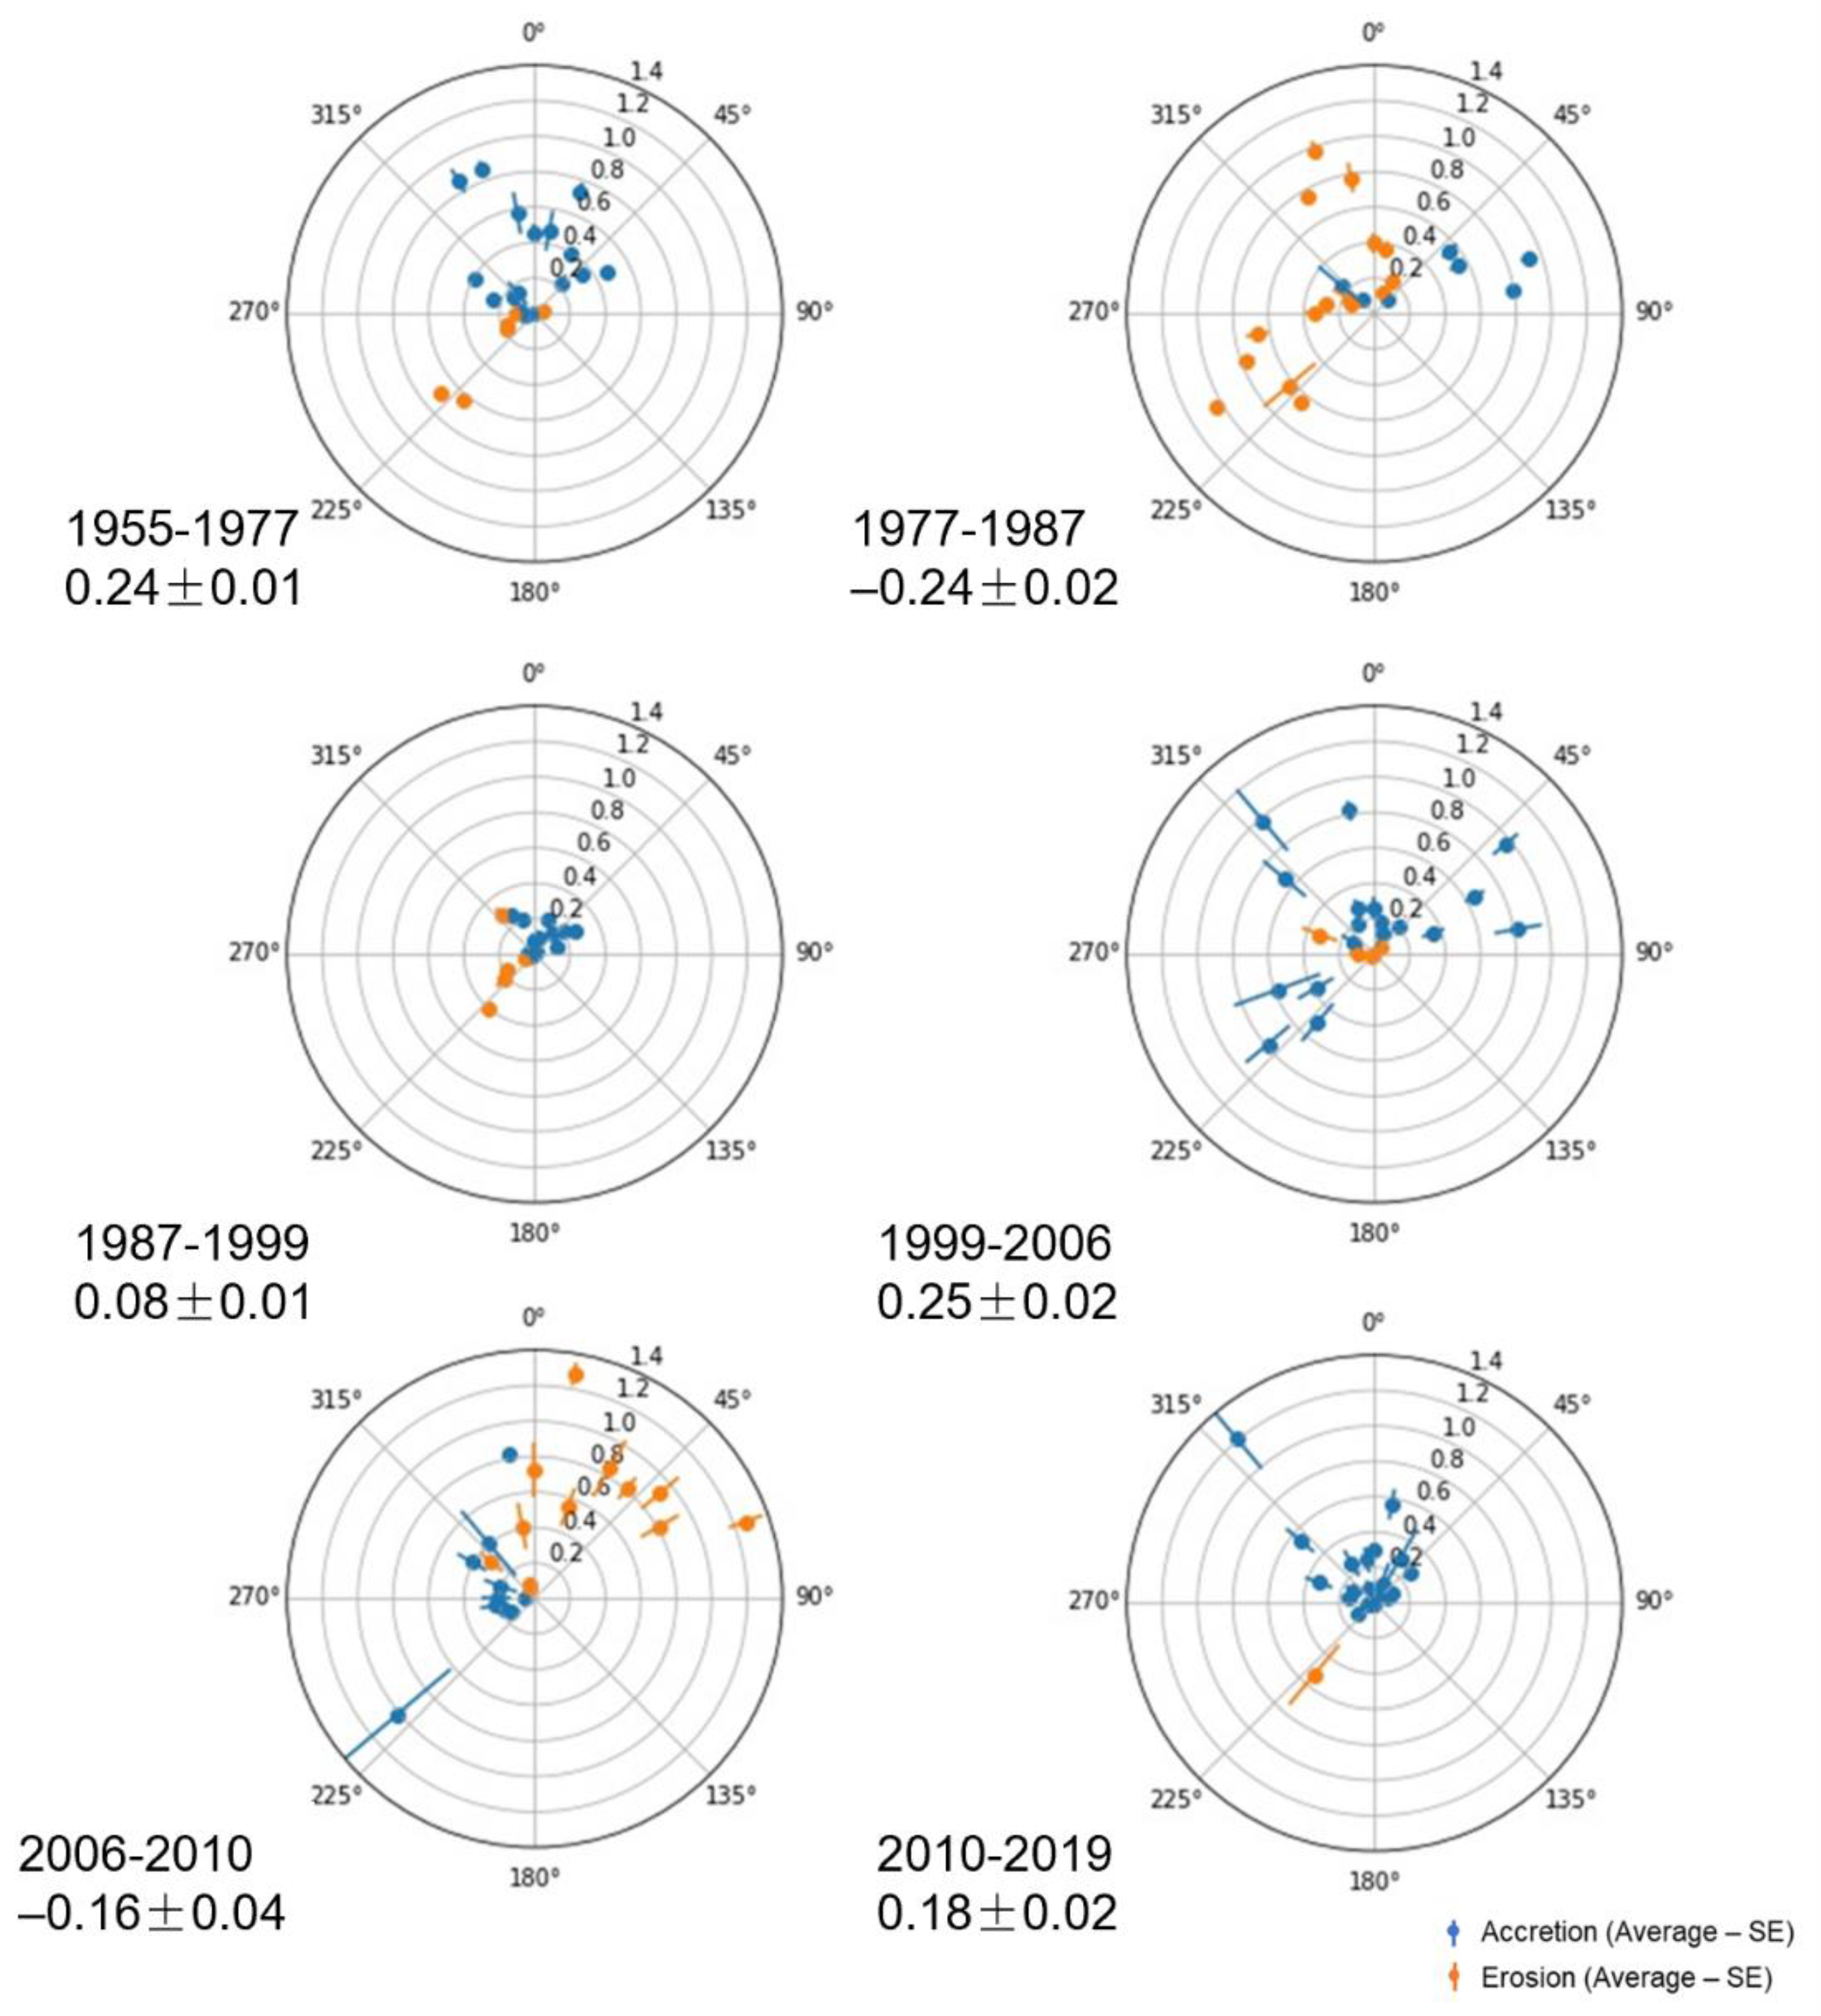
3.2.2. Overall Changes in Shoreline Position

The changes in shoreline position on Bora Bora between 1955 and 2019 (for transects every 5 m) have a median of 5.6 m (positive values correspond to net accretion) and an interquartile range of [−0.09, 19.5]: approximately 25% of the shoreline has undergone erosion, and 50% have experienced accretion of up to 19.5 m, while the remaining 25% have gained more than 19.5 m over the sea. In detail, the construction of embankments and quays has led to strong ‘artificial’ accretion in the most densely populated parts of the island (Vaitape, Faanui, and Anau; often over 15 m, and up to 220 m gained over the sea; Figure 7). Neighbouring natural sections (most often corresponding to the tree category, which is the most common natural category) have undergone erosion, most commonly of 2 to 5 m, from 1955 to 2019 (cf. the red erosion zones interspersed by green ‘artificial’ accretion zones on Figure 7A). On the southern beaches, the East-exposed portions have undergone erosion (over 2 m of landward net sea movement from 1955 to 2019) while the other portions have undergone accretion (Figure 7B), either naturally or due to the construction of embankments at the southernmost tip (Figure 5).
Overall, Bora Bora has, hence, increased in size due to the construction of embankments and quays; natural shoreline areas that persisted from 1955 to 2019 have mostly undergone erosion (e.g., natural zones with trees near embankments).

3.2.3. Changes in Shoreline Position on the Southern Beaches

Placing a focus on the southern beaches, End Point Rate values (change in shoreline position in meters per year) were averaged over 10° intervals. In detail, between 1955 and 1999, accretion mostly occurred on the south-west facing beaches (azimuths between 0 and 90°; Figure 8) and erosion on the east- and north-east facing beaches (azimuths between 220 and 0°). Between 1999 and 2006, there was limited erosion on the north-facing beaches and accretion was predominant on all other azimuths. In 2006–2010, erosion occurred on the south-west facing beaches with relatively important rates (up to 1.27 ± 0.10 m y−1 between 10 and 20°, the maximum rate across all azimuths and time periods) while accretion was limited (with one outlier at 1.02 ± 0.40 m y−1 corresponding to an additional seawall). Lastly, from 2010 to 2019, only one averaged azimuth experienced erosion (−0.53 ± 0.22 between 220 and 230°), while accretion was limited elsewhere (mostly below 0.5 m y−1).
There were significant contrasts between some years (Table 3). There notably are significant negative linear correlations between 2006–2010 (after the construction of the large-scale embankment) and each time range before 1999 (1955–1977, 1977–1987, 1987–1999). There is also a strong positive linear correlation (0.78) between 1955–1977 and 1987–1999, which may indicate a lack of sedimentary regime change between those dates. There are no significant differences between the other dates.

4. Discussion

4.1. Drivers of the Evolution of the Shoreline Classification and Potential Impacts on Sedimentary Processes on Bora Bora from 1955 to 2019

Throughout the second part of the 20th century, infillings to build public and private properties onto the fringing reef (notably on the densely populated western side of the island; Figure 2 and Figure 5) have been the prominent factor of shoreline category and position changes on Bora Bora. Trees and vegetation were removed and replaced by private embankments to consolidate infillings (from 3% or 1.2 km in 1955 to 46% or 20.3 km in 2019). Similar evolutions have been noted on other French Polynesian islands, notably an increase from 12% in 1977 to 57% in 2018 of embankments on the island of Moorea, which has similar geological, geomorphological, and socio-economical characteristics [3]. Through interviews with long-term Bora Bora residents performed in March 2021, it emerged that these embankments were initially linked to a drive to extend the island’s land surface outwards and construct houses on the highly sought-after seaside, notably until the 1990s. For instance, a large fraction of the houses as well as public infrastructure on the west side of Bora Bora, most notably in Vaitape, is constructed on infilled fringing reefs (Figure 2 and Figure 5). However, since the 2000s, the main reason for embankment construction (with or without building licences) has been the reinforcement of private land boundaries. This reinforcement is perceived as necessary in the face of continuous coastal erosion, linked to background swell, storms and cyclones (notably in reaction to the passage of cyclone Oli in 2010), and to anticipate future sea level changes (which are forecasted to be up to 0.76 m higher in 2080–2100 with respect to 1986–2005 for an intermediate global warming scenario [20]).
Modifying Bora Bora’s coastline may have had strong impacts on the island’s sedimentary regimes and, along with drainage canals and other land features altering sediment transport from the island to the sea, it may be a factor leading to heightened erosional effects [3]. Infillings and walls may reroute and strengthen currents and waves, leading neighbouring zones to experience stronger erosion [17] (Figure 7A). As visible on the aerial images and confirmed by interviews with residents, landowners in the vicinity of newly constructed coastal structures eventually have to build embankments as well to protect their gardens from erosion, leading to a ripple effect and a progressive artificialisation of the shoreline (Figure 5).
On a larger scale, a stark example of the impact of urbanisation on coastal sedimentation is the effect of a large protective embankment in Matira (southern tip of Bora Bora) on the neighbouring sandy beaches. This protective embankment to stabilise the shoreline position at the tip of the peninsula was first built on a small scale before 1999 and then extended to most of the peninsula between 2005 and 2006. It may have modified currents and sedimentary processes and altered the erosional regime in the area (Figure 8, Table 2), leading to enhanced erosion on previously stable sections of the beaches. Before the construction, the sandy beaches underwent net erosion on the northeast-facing side and accretion on the southwest-facing side. This movement corresponded to the average wind-driven surface currents (the main wind regime is West to East in Bora Bora [13]) and, hence, may have been mostly of natural causes. During the construction, the signal was blurred (1999 to 2006), and was then inversed after 2006. However, the development of hotels, seaside gardens, and planting of coconut trees has artificially led to a net accretion between 2010 and 2019 on the beaches due to the definition of the shoreline position used in this study (sea-side edge of vegetation). Overall, these erosional processes remain limited (generally under 1 m y−1) and may partly be noise due to the shoreline positioning error of this study (2.06 to 4.76 m).
The time series used here enables the assessment of overall long-term changes in coastal typology and position, which can be linked to human activities, as sea level rise was small (~2 cm) between 1955 and 2019 in Bora Bora. However, the temporal resolution of the time series used here (4 to 22-year gaps between each image) is too broad to assess changes due to most intense short-term events. An exception is the passage of Cyclone Oli in February 2010, two months before Bora Bora was imaged by satellite (Table 1). Although the island of Bora Bora is protected from strong swells by a barrier reef and circled by a wide lagoon, extreme weather events can have damaging impacts along the shoreline of the main island. The passage of this storm may notably have led to the strong erosion of the sandy beaches of Matira (Figure 8) and additional erosion in other natural sections of the coastline, although this cannot be certain in the absence of other images between 2006 and 2010.
The recent availability of data from satellites with daily and high spatial resolution imaging capacity (e.g., [21]) as well as the LiDAR campaign conducted on Bora Bora in 2015 [22] could be combined for future high-resolution 2D or 2.5D monitoring (see review by [9]) of the evolution of the coastline of the island and help to disentangle the individual effects of various factors (background waves, storms, constructions) on sedimentary processes.

4.2. Further Consequences of Coastal Urbanisation and Perspectives for Management

Beyond impacting coastal erosion, infillings and embankments are costly and can lead to economic and biological issues. Firstly, infillings and embankments are built over shallow fringing reef ecosystems, which typically house numerous juvenile fish and invertebrate organisms [23]. These constructions and the associated modified currents and sedimentology are, hence, accompanied with a removal and degradation of ecosystems. This could have wide-reaching impacts on marine communities throughout Bora Bora’s lagoon and, hence, impact local fisheries and livelihoods. Furthermore, requesting building permits is a lengthy administrative process, which nowadays most often results in a refusal. In addition, using adequate building materials, such as volcanic rocks, leads to additional expenses. As a result, many private infillings and embankments are built illegally [24] using tyres, construction rubble, or rusty metal spikes. Beyond altering seascapes on an island that is famous worldwide for its scenery, these may spread pollutants into the nearby marine ecosystems [25].
In addition to the numerous private embankments, public infrastructure, most notably roads and quays, are associated with seawalls. In particular, the main road of Bora Bora is a belt road which, in many areas, is located only a few meters away from the shoreline. This road is protected from the sea by embankments that represent approximately 10% of the island’s shoreline (Figure 5 and Figure 6). This road, hence, plays a non-negligible role in the artificialisation of the coastline, damage to coastal ecosystems, and changes in sedimentary regimes. In some areas, no wall has yet been constructed to protect the belt road, but there are projects to implement some (e.g., along the high school of Bora Bora located between Vaitape and Matira), notably because the road can be flooded during strong swell events. Instead of seeking to protect a belt road located close to the sea, building a new road further inland wherever possible, and restoring natural shoreline types by removing the walls, could be efficient solutions to mitigate the impact of urbanisation on Bora Bora’s shoreline.
Indeed, in opposition to human-made constructions enhancing erosion, natural shoreline types such as mangroves and grass have widely acknowledged ecological functions [26] and act as sediment accumulation zones on Bora Bora (Figure 5 and Figure 7). This is partially due to the geographical position of these areas: mangroves and grass areas are located within bays on Bora Bora and directly receive sediment-rich runoff from the surrounding land following rainfall. Net accretion is enabled by the presence of plant roots slowing down currents and leading to sediment deposition [27]. Coastal management and restoration projects on Bora Bora could aim at removing erosion-inducing walls and revegetating the shoreline to consolidate it. There are numerous plants that can stabilise the shoreline: low-lying vegetation (grass, bushes), strong-rooted trees (local varieties such as aito—Casuarina equisetifolia, purau—Hibiscus tiliaceus, miki miki—Pemphis acidula, or even coconut trees—Cocos nucifera, although they are less efficient at trapping sediments). In addition, promoting coral growth on the fringing reefs—leading to hard structures that attenuate wave energy—could also be a positive management solution [28]. Expanding mangroves (Rhizophora stylosa) due to their efficient sediment-trapping roots, however, is debatable in the context of French Polynesian islands. Indeed, mangroves were absent from French Polynesia until the 1930s and were only introduced in the 1930s to promote oyster and crab production [29]. They are often viewed negatively, as invasive species (notably taking over adjacent grass areas, cf. Figure 4), and are actively removed by local inhabitants. Nevertheless, there are numerous alternative nature-based solutions available to replace walls without compromising shoreline stability. However, although most residents that were interviewed were aware of and suggested natural methods to prevent coastal erosion, a strong majority was opposed to removing walls and planting trees on their private lands. This opposition was mostly due to the costs involved and uncertainty in the resulting shoreline stability. Performing experiments in various parts of the island by removing walls and monitoring shoreline stability, communicating with the public about the results, and financially contributing to coastal restoration could provide incentives to remove private embankments around the island.
The important impact of embankments and seawalls on shoreline stability throughout Bora Bora underscores the sensitivity of the island’s sedimentary regime to human-made structures. This type of human-induced shoreline destabilisation is common in French Polynesia (e.g., in the atolls of the Tuamotu Archipelago [17]; in Moorea, of similar geomorphology to Bora Bora [3]). The urbanisation of coastlines has profound impacts on physical processes around the islands, from modifying sedimentary processes to increasing vulnerability to coastal erosion, storm surges, and sea level rise [17]. Geologically younger volcanic islands such as Bora Bora [10] may be assessed as less vulnerable to coastal erosion than low-lying atolls such as in the Tuamotu Archipelago or even the motu dotted along the barrier reef of Bora Bora (Figure 1). However, shorelines with hard volcanic lithology, which are spared from erosion and accretion on decadal time scales, are rare on Bora Bora (rock category, under 3%, Figure 6). In addition, most seawalls and embankments on Bora Bora have a height of less than one meter. If the island’s coastal lifestyle continues in the future, in the absence of sustainable coastal management solutions, there will be a need to keep infilling land and elevate seawalls to cope with rising sea levels. As demonstrated by the imagery timeline used in this study, increasing the artificialisation of the coastline may lead to even more coastal erosion in a positive feedback loop, and is not a sustainable solution. Lastly, beyond the economic importance of preserving white sandy beaches on the tourist island of Bora Bora, the strong human density and rarity of inhabitable areas in the steep inner parts of the island make coastal erosion a major challenge on Bora Bora, especially in the context of increasing human populations on the island [14]. There is a need to adapt lifestyles and public infrastructures to the changing climate, sea level rise, and more frequent and intense storm surges and swell [20]. There must be incentives to encourage islanders to move further inland when possible and revegetate the shorelines rather than fight a losing fight against erosion and aggravate the problem. Communicating with the public, developing management plans, and stabilising the coastline with nature-based solutions are required to tackle the issue head-on in Bora Bora and in similar contexts worldwide.

5. Conclusions

High-resolution aerial images of Bora Bora obtained from 1955 to 2019 highlighted the extensive coastal urbanisation undergone by the island since the mid-20th century. While quays and embankments were scarce in the 1950s, they represent 61% of the shoreline nowadays. This transition away from natural shorelines is accompanied by modified sedimentary regimes, and results in enhanced coastal erosion. In the context of climate change and increasing demographic pressure, preserving shoreline stability on small Pacific islands, where most constructions are located within meters of the sea, is crucial for livelihoods. The long-term impact of coastal modifications on erosional processes on Bora Bora indicated by the aerial imagery series highlight the need for proactive local management, with the removal of embankments and restoration of natural shoreline types, notably of vegetation possessing robust root systems capable of stabilising sediments.

Author Contributions

Conceptualization, E.G., A.C., D.J. and D.L.; formal analysis, E.G.; funding acquisition, D.L.; investigation, E.G.; methodology, E.G., A.C., D.J. and F.D.; resources, T.M., Y.R. and L.L.; software, A.C. and D.J.; supervision, A.C., D.J. and D.L.; validation, A.C., D.J., T.M., Y.R., L.L. and D.L.; writing—original draft, E.G.; writing—review and editing, E.G., A.C., F.D., M.J. and D.L. All authors have read and agreed to the published version of the manuscript.

Funding

This work has received several grants: Fondation de France (2019-08602), Ministère de l’Economie verte et du domaine-Délégation à la recherche de Polynésie française (contrat N3622 MED-EPHE), Office Français de la Biodiversité (AFB/2019/385-OFB.20.0888), Polynésienne des Eaux, ANR-19-CE34-0006-Manini, ANR-19-CE14-0010-SENSO, the Rāhui Forum and Ressource Center supported by Bloomberg’s Philanthropy.

Institutional Review Board Statement

Not applicable.

Informed Consent Statement

Not applicable.

Data Availability Statement

The data presented in this study are openly available in FigShare at doi.org/10.6084/m9.figshare.17048672.

Acknowledgments

We would like to thank the staff of Section Cadastre-Topographie de la direction des affaires foncières (DAF) de Polynésie-Française for providing the satellite images, as well as the staff of ‘Polynésienne des Eaux’ and of the Mairie of Bora Bora for their help in the field. We also thank the Earth and Biodiversity Science Graduate Program of PSL Université Paris (PG EABIS).

Conflicts of Interest

The authors declare no conflict of interest.

References

  1. Cooper, J.A.G.; Jackson, D.W.T. Coasts in Peril? A Shoreline Health Perspective. Front. Earth Sci. 2019, 7, 260. [Google Scholar] [CrossRef] [Green Version]
  2. Dafforn, K.A.; Mayer-Pinto, M.; Morris, R.L.; Waltham, N.J. Application of management tools to integrate ecological principles with the design of marine infrastructure. J. Environ. Manag. 2015, 158, 61–73. [Google Scholar] [CrossRef] [PubMed]
  3. Madi Moussa, R.; Fogg, L.; Bertucci, F.; Calandra, M.; Collin, A.; Aubanel, A.; Polti, S.; Benet, A.; Salvat, B.; Galzin, R.; et al. Long-term coastline monitoring on a coral reef island (Moorea, French Polynesia). Ocean Coast. Manag. 2019, 180, 104928. [Google Scholar] [CrossRef]
  4. Collin, A.; Duvat, V.; Pillet, V.; Salvat, B.; James, D. Understanding Interactions between Shoreline Changes and Reef Outer Slope Morphometry on Takapoto Atoll (French Polynesia). J. Coast. Res. 2018, 85, 496–500. [Google Scholar] [CrossRef]
  5. Collin, A.; Calle, C.; James, D.; Costa, S.; Maquaire, O.; Davidson, R.; Trigo-Texeira, A. Modelling 2D Coastal Flooding at Fine-scale Over Vulnerable Lowlands using Satellite-derived Topobathymetry, Hydrodynamic and Overflow Simulations. J. Coast. Res. 2020, 95, 1052–1056. [Google Scholar] [CrossRef]
  6. Aubanel, A.; Marquet, N.; Colombani, J.-M.; Salvat, B. Modifications of the shore line in the Society islands (French Polynesia). Ocean Coast. Manag. 1999, 42, 419–438. [Google Scholar] [CrossRef]
  7. Gallop, S.L.; Kennedy, D.M.; Loureiro, C.; Naylor, L.A.; Muñoz-Pérez, J.J.; Jackson, D.W.T.; Fellowes, T.E. Geologically controlled sandy beaches: Their geomorphology, morphodynamics and classification. Sci. Total Environ. 2020, 731, 139123. [Google Scholar] [CrossRef] [PubMed]
  8. Gabrié, C.; Planes, S.; Baldwin, J.; Bonvallot, J.; Chauvet, C.; Vernaudon, Y.; Payri, C.; Galzin, R. Study of the coral reefs of Bora-Bora (society archipelago, French Polynesia) for the development of a conservation and management plan. Ocean Coast. Manag. 1994, 25, 189–216. [Google Scholar] [CrossRef]
  9. Mury, A.; Collin, A.; James, D. Morpho–Sedimentary Monitoring in a Coastal Area, from 1D to 2.5D, Using Airborne Drone Imagery. Drones 2019, 3, 62. [Google Scholar] [CrossRef] [Green Version]
  10. Gischler, E. Sedimentary Facies of Bora Bora, Darwin’s Type Barrier Reef (Society Islands, South Pacific): The Unexpected Occurrence of Non-Skeletal Grains. J. Sediment. Res. 2011, 81, 1–17. [Google Scholar] [CrossRef] [Green Version]
  11. Pirazzoli, P.; Brousse, R.; Delibrias, G.; Montaggioni, L.; Faure, G.; Salvat, B. Leeward islands, Maupiti, Tupai, Bora Bora, Huahine, Society archipelago. In Proceedings of the 5th International Coral Reef Congress, Tahiti, France, 27 May–1 June 1985; Volume 1. [Google Scholar]
  12. Lecchini, D.; Bertucci, F.; Brooker, R.M.; Berthe, C.; Gasc, J.; Jossinet, F.; Ellacott, S.; Zipper, E.; Blay, G.; Schneider, D.; et al. Rapid localized decline of a French Polynesian coral reef following a climatic irregularity. Estuar. Coast. Shelf Sci. 2020, 246, 107049. [Google Scholar] [CrossRef]
  13. Bosserelle, C.; Reddy, S.; Lal, D. WACOP Wave Climate Reports. French Polynesia. Bora Bora; Pacific Community Science Division: Nabua, Fiji 2015. [Google Scholar]
  14. INSEE/ISPF. Le Recensement de la Population en Polynésie Française en 2017; Institut de la statistique de la Polynésie française: Papeete, French Polynesia, France, 2017. [Google Scholar]
  15. Polynesia Tourism Department Polynesia Tourism Department. 2020. Available online: https://tahititourisme.fr/fr-fr/fr (accessed on 11 August 2021).
  16. Collin, A.; Nadaoka, K.; Nakamura, T. Mapping VHR water depth, seabed and land cover using google earth data. ISPRS Int. J. Geo-Inf. 2014, 3, 1157–1179. [Google Scholar] [CrossRef] [Green Version]
  17. Duvat, V.K.E.; Pillet, V. Shoreline changes in reef islands of the Central Pacific: Takapoto Atoll, Northern Tuamotu, French Polynesia. Geomorphology 2017, 282, 96–118. [Google Scholar] [CrossRef]
  18. Hapke, C.J.; Himmelstoss, E.A.; Kratzmann, M.G.; List, J.H.; Thieler, E. Historical Shoreline Change along the New England and Mid-Atlantic Coasts; United States Geological Survey: Woods Hole, MA, USA, 2011; Volume 1118. [Google Scholar]
  19. Oyedotun, T.D.T. Shoreline Geometry: DSAS as a Tool for Historical Trend Analysis. Geomorphol. Tech. Online Ed. 2014, 2, 1–12. [Google Scholar]
  20. IPCC Summary for Policymakers. Climate Change 2021: The Physical Science Basis. Contribution of Working Group I to the Sixth Assessment Report of the Intergovernmental Panel on Climate Change; Masson-Delmotte, V., Zhai, P., Pirani, A., Connors, S.L., Péan, C., Berger, S., Caud, N., Chen, Y., Goldfarb, L., Gomis, M.I., et al., Eds.; Cambridge University Press: Cambridge, UK, 2021. [Google Scholar]
  21. Planet Team. Planet Application Program Interface: In Space for Life on Earth. 2017. Available online: https://www.planet.com/ (accessed on 8 September 2021).
  22. Shom-SAU LiDAR Polynésie française 2015. Available online: https://diffusion.shom.fr/pro/risques/lidar-polynesie-francaise-borabora-2015.html (accessed on 15 February 2021).
  23. Adams, A.J.; Dahlgren, C.P.; Kellison, G.T.; Kendall, M.S.; Layman, C.A.; Ley, J.A.; Nagelkerken, I.; Serafy, J.E. Nursery function of tropical back-reef systems. Mar. Ecol. Prog. Ser. 2006, 318, 287–301. [Google Scholar] [CrossRef]
  24. Calandra, M.; Wencélius, J.; Moussa, R.M.; Gache, C.; Berthe, C.; Waqalevu, V.; Ung, P.; Lerouvreur, F.; Bambridge, T.; Galzin, R.; et al. Local perceptions of socio-ecological drivers and effects of coastal armoring: The case of Moorea, French Polynesia. Popul. Environ. 2021, 1–21. [Google Scholar] [CrossRef]
  25. Mohajerani, A.; Burnett, L.; Smith, J.V.; Markovski, S.; Rodwell, G.; Rahman, M.T.; Kurmus, H.; Mirzababaei, M.; Arulrajah, A.; Horpibulsuk, S.; et al. Recycling waste rubber tyres in construction materials and associated environmental considerations: A review. Resour. Conserv. Recycl. 2020, 155, 104679. [Google Scholar] [CrossRef]
  26. Harborne, A.R.; Mumby, P.J.; Micheli, F.; Perry, C.T.; Dahlgren, C.P.; Holmes, K.E.; Brumbaugh, D.R. The Functional Value of Caribbean Coral Reef, Seagrass and Mangrove Habitats to Ecosystem Processes. Adv. Mar. Biol. 2006, 50, 57–189. [Google Scholar] [CrossRef] [PubMed]
  27. Reed, D.; van Wesenbeeck, B.; Herman, P.M.J.; Meselhe, E. Tidal flat-wetland systems as flood defenses: Understanding biogeomorphic controls. Estuar. Coast. Shelf Sci. 2018, 213, 269–282. [Google Scholar] [CrossRef]
  28. Gracia, A.; Rangel-Buitrago, N.; Oakley, J.A.; Williams, A.T. Use of ecosystems in coastal erosion management. Ocean Coast. Manag. 2018, 156, 277–289. [Google Scholar] [CrossRef]
  29. Cavaloc, E. Palétuviers Moorea: Colonisation des Rhizophora Récemment Introduits à Moorea (Société, Polynésie française). Bilan de Répartition et Conséquences Écologiques; Rapport 111; EPHE-CRIOBE-Naturalia et Biologia: Moorea, Polynésie Française, France, 1988; 44p. [Google Scholar]
Figure 1. Geographical location of Bora Bora in French Polynesia and satellite imagery of Bora Bora (image from 20 July 2019) highlighting the main topological locations discussed in the article. The white rectangle on the image of Bora Bora above Vaitape corresponds to the location of the images of Figure 2. Letters A–E indicate the location of the coastal habitats featured in Figure 3. Imagery from CNES/Airbus 2019 and Google Earth 2021.
Remotesensing 13 04692 g001
Figure 2. Very high-resolution imagery of the same location at the centre of Vaitape in 1955 (aerial photograph) and 2019 (CNES/Airbus imagery), highlighting the infilling of fringing reefs for constructions and urban development of the area.
Remotesensing 13 04692 g002
Figure 3. Examples of ground view of coastal classes. (A) sandy beach, (B) grass, (C) mangrove, (D) road embankment, (E) trees.
Remotesensing 13 04692 g003
Figure 4. Examples of aerial view of coastal classes. (A) road embankment (red) and private embankment (pink); (B) quay; (C) sandy beach; (D) mangrove (dark green), grass (clear green), private embankment (pink); (E) trees.
Remotesensing 13 04692 g004
Figure 5. Map of the coastline classification (sandy beaches, rocks, trees, grass areas, mangroves, road embankments, private embankments, quays) of the main island of Bora Bora for (A) 1955, (B) 1977, (C) 1987, (D) 1999, (E) 2006, (F) 2010, and (G) 2019.
Remotesensing 13 04692 g005aRemotesensing 13 04692 g005b
Figure 6. Percentage of the coastline as sandy beaches, rocks, trees, grass areas, mangroves, road embankments, private embankments, and quays, as well as overall percentage of natural (sandy beach, rocks, grass areas, and mangrove) for 1955, 1977, 1987, 1999, 2006, 2010, and 2019 on the main island of Bora Bora. A conservative error on these percentages, caused by coastline tracing subjectivity and classification uncertainty for older images, may be estimated as approximately 10% of their value (i.e., 46 ± 5% of the coastline is a private embankment and 1 ± 0.1% is a mangrove on Bora Bora in 2019).
Remotesensing 13 04692 g006
Figure 7. Map of the Net Sea Movement between 1955 and 2019 extracted from the DSAS module on ArcGIS 10.8.1. (A) mostly urbanised section in Faanui, with alternating accretion (linked to the construction of seawalls) and erosion (in the nearby natural areas); (B) sandy beach zone of Matira.
Remotesensing 13 04692 g007
Figure 8. Radar plot of the average (dot) and standard error (whiskers) of the End Point Rate (in meters per year, from 0 to 1.4 m y−1 on the plot) for 10°—averaged azimuths on the southern beaches of Bora Bora. Blue colours indicate accretion (positive EPR) and orange colours indicate erosion (negative EPR). An azimuth of 0° corresponds to a south-facing beach (land on the north side, sea on the south side of the shoreline). The values below the date intervals correspond to the overall average and standard error of the End Point Rate across the beaches.
Remotesensing 13 04692 g008
Table 1. Year, type of image, and spatial resolution of the time series of images of Bora Bora.
YearAcquisition MethodSourceImage TypeSpatial Resolution (m)
1955PlaneAerial photographsSingleband grey1.58
1977PlaneAerial photographsSingleband grey0.64
1987PlaneAerial photographsSingleband grey0.52
1999PlaneAerial photographsMultiband colour0.41
2006SatelliteMaxar TechnologiesMultiband colour0.48
2010SatelliteMaxar TechnologiesMultiband colour0.50
2019SatelliteCNES/AirbusMultiband colour0.48
Table 2. Spatial resolution, georeferencing error, tracing error, and total error (based on Equation (1)) of the shoreline position for each date.
YearSpatial Resolution (m)Georeferencing Error (m)Tracing Error (m)Total Error (m)
19551.584.0224.76
19770.643.2623.88
19870.523.3723.95
19990.412.4623.20
20060.482.5823.30
20100.502.8523.52
20190.48022.06
Table 3. Linear correlation coefficients r for the 10° average End Point Rate values calculated for Bora Bora’s southern beaches of Matira.
Year Interval1977–19871987–19991999–20062006–20102010–2019
1955–19770.060.78−0.19−0.450.36
1977–1987 0.270.19−0.520.27
1987–1999 −0.24−0.640.03
1999–2006 0.000.24
2006–2010 −0.04
Threshold for 5% significance: r = ±0.43.
Publisher’s Note: MDPI stays neutral with regard to jurisdictional claims in published maps and institutional affiliations.

