Article

A Machine Learning Based Downscaling Approach to Produce High Spatio-Temporal Resolution Land Surface Temperature of the Antarctic Dry Valleys from MODIS Data

by
Lilian-Maite Lezama Valdes
1,*,
Marwan Katurji
2 and
Hanna Meyer
1
1
Institute of Landscape Ecology, Westfälische Wilhelms-Universität Münster, Heisenbergstr. 2, 48149 Münster, Germany
2
Centre for Atmospheric Research, School of Earth and Environment, University of Canterbury, Arts Road, Ilam, Christchurch 8140, New Zealand
*
Author to whom correspondence should be addressed.
Remote Sens. 2021, 13(22), 4673; https://doi.org/10.3390/rs13224673
Submission received: 8 October 2021 / Revised: 10 November 2021 / Accepted: 15 November 2021 / Published: 19 November 2021
(This article belongs to the Special Issue Remote Sensing of Polar Regions)

Abstract

:
To monitor environmental and biological processes, Land Surface Temperature (LST) is a central variable, which is highly variable in space and time. This particularly applies to the Antarctic Dry Valleys, which host an ecosystem highly adapted to the extreme conditions in this cold desert. To predict possible climate induced changes on the Dry Valley ecosystem, high spatial and temporal resolution environmental variables are needed. Thus we enhanced the spatial resolution of the MODIS satellite LST product that is sensed sub-daily at a 1 km spatial resolution to a 30 m spatial resolution. We employed machine learning models that are trained using Landsat 8 thermal infrared data from 2013 to 2019 as a reference to predict LST at 30 m resolution. For the downscaling procedure, terrain derived variables and information on the soil type as well as the solar insolation were used as potential predictors in addition to MODIS LST. The trained model can be applied to all available MODIS scenes from 1999 onward to develop a 30 m resolution LST product of the Antarctic Dry Valleys. A spatio-temporal validation revealed an R 2 of 0.78 and a RMSE of 3.32 C. The downscaled LST will provide a valuable surface climate data set for various research applications, such as species distribution modeling, climate model evaluation, and the basis for the development of further relevant environmental information such as the surface moisture distribution.

1. Introduction

Land Surface Temperature (LST) is one of the central variables for many research endeavors related to Earth System Science. Especially so in areas subject to extreme solar radiation variability, such as the McMurdo Dry Valleys (MDV) of Antarctica. LST is the Earth’s radiative skin temperature [1] and can be derived from remotely sensed thermal infrared data [2,3]. It drives the exchange of turbulent heat fluxes and long-wave radiation at the interface of land surface and atmosphere [4] and is thus a good indicator for the earth surface energy balance [5]. LST is highly variable in space and time, depending on the light regime and atmospheric column and weather condition, position within the terrain, surface moisture [6] and physio-chemical and reflective properties of the surface [4].
The MDV are one of Antarctica’s few ice-free areas. A terrestrial ecosystem highly adapted to low temperatures, soil dryness and salinity can be found in this cold desert. It is an environment predominantly inhabited by microorganisms and few metazoan consumers and is threatened to be (further) impacted by climate change [7,8,9,10,11]. LST data can help in understanding and monitoring ecological patterns in the MDV [12]. To be able to gain a valuable insight into current species distribution in this environment and to monitor ecosystem change, MDV hydrology as well as weather and climate parameters that are linked to the surface energy balance, the LST data set must present certain properties. These are predetermined by the high spatio-temporal variability LST presents itself, by the small-scale physical properties of niche defining factors for the present organisms as well as the fact that long term changes in polar ecosystems may be caused by short term climatic perturbations [13]. Thus, a high spatio-temporal resolution Land Surface Temperature (LST) data set is needed, which is currently not available.
While Unoccupied Aerial Vehicles (UAVs) are very useful to acquire high spatial resolution LST data [14], they have limitations in view to a spatio-temporal monitoring: First, the high temporal resolution needed to cover diurnal and seasonal LST dynamics can’t be provided by UAVs, especially not in such remote environments. In the MDV, field missions are only feasible during the austral summer months December and January for logistic and climatic reasons. Second, although UAV-based thermal sensors generate spatially continuous data sets, the spatial footprint is usually limited and not sufficient to provide valley-wide data. This makes satellite-based systems the only option for acquiring suitable spatio-temporal LST data.
Thermal data is acquired by multiple non-commercial satellite sensors, such as Landsat, ASTER (on Terra), AVHRR (on NOAA and MetOp satellites) and MODIS (on Terra and Aqua). To none of them, however, is it technically feasible to present both, a relatively high spatial and temporal resolution at the same time. The best temporal resolution is provided by MODIS on board the polar orbiting satellites Terra and Aqua which capture the MDV at a sub-daily resolution but 1 km 2 spatial resolution. The most suitable high spatial resolution LST data source is Landsat 8, whose Thermal Infrared Sensor (TIRS) gathers thermal data at 100 m resolution, which is resampled via cubic convolution and distributed at 30 m resolution [15]. To fulfill the requirement of both, high spatial and temporal resolution, data from both sensors has to be combined. To generate this high spatio-temporal resolution LST product, a specifically designed downscaling routine is needed.
Downscaling of satellite data can be performed in two fundamentally different ways, either process driven, i.e., based on known physical relations between the environment and LST (also “dynamic downscaling”) [16] or statistically, where high spatial or temporal resolution data is gained from lower resolution data by employing high resolution predictor variables [17]. The latter data-driven form is especially promising here as there is an abundant availability of satellite-based Earth observation data. Therefore, the complex interaction between environmental factors that shape the LST expression can be handled adequately by statistical models without having to rely on possibly limited knowledge about relevant LST influencing factors and processes in this unique research area.
Multiple statistical approaches for the disaggregation of thermal satellite information have been developed, referred to as downscaling LST, thermal sharpening, subpixel temperature estimation, temperature unmixing, among others [17]. Their central assumption is, that the predictors are associated with high resolution LST in a similar manner in the low and high resolution domain [18], so that a statistical model is able to link low resolution LST and high resolution predictors to a reference (i.e., high spatial resolution LST data e.g., from Landsat 8).
The predictive performance of such a model highly depends on the availability and adequate choice of suitable high resolution predictors. As described above, the elevation [19], solar insolation [20], albedo [21] and surface moisture [22] drive LST spatio-temporal patterns. Thus, aside from the evident predictor elevation, following high resolution predictors must be considered in the environmental context of the MDV: The influence of solar insolation can be accounted for using data on the solar incidence angle, topographic solar shading [23] and terrain-derived aspect. Land cover types (i.e., open soil vs. snow and ice) can be used to account for the albedo’s influence on LST. Potential accumulations of surface moisture can be approached via slope information and Topographic Wetness Indices (TWI) [24], which derive hydrologic flow paths from the terrain. Moreover, spatial information on the soil type can help in reflecting different water retention capacities of the surface [25] and potential differences in the albedo.
To link the predictors to the high resolution LST, machine learning algorithms are a promising tool since they are designed to take into account linear and non-linear interactions of predictor and response variables and the relationships between the environmental variables and LST can be assumed to be complex. Machine learning algorithms have already been successfully used to downscale single LST scenes [26] and have also been shown to outperform simple regression-based thermal downscaling approaches [27,28].
In this study a machine learning-based high spatio-temporal resolution LST product for the MDV is developed, which combines the strengths concerning spatial and temporal resolution of MODIS aboard Terra and Aqua and TIRS on board Landsat 8.
The aim of this approach is to not only build a model that is able to generate high resolution LST imagery for one specific scene as in [28,29,30,31], but to provide spatio-temporal estimates, i.e high resolution LST maps continuously and ongoing for all available MODIS scenes. To do so, the model is trained with a time series of data and its performance is assessed using spatial, temporal and spatio-temporal external validation data sets.

2. Research Area

The MDV are located in Victoria Land, west of the McMurdo sound. The cold desert of the valley floors features exposed bedrock and arid soils that are interspersed with perennially ice-covered lakes and ephemeral streams that transport alpine glacier melt water in the austral summer months [32]. The valley floors are ice-free because the Transantarctic Mountains block the glacial flow from the East Antarctic Ice Sheet and there is hardly any precipitation, only about 100 mm per year water equivalent in snow [33]. The temperature and light regime variation is large [33] due to the complex terrain and proximity to the pole.
The valley floors consist of very dry (<2% mass water content) desert pavements, i.e., pebbles protecting finer grained substrate [34]. The substrate consists of glacial tills (granites, sandstones, basalts, metamorphic rocks) [33] and lacustrine stands (in the Taylor Valley) [34]. The soil structure features polygons resulting from freeze-thaw cycles, that sort the substrate [35], and present micro climatic habitats for the organisms populating the MDV. In general, the ecosystem is relatively simple, apart from mosses, no vascular plants are present [36] and although the abundance of soil microorganisms is higher and more diverse than assumed before, the communities are comprised of only few trophic levels and invertebrate taxa [33].
The definition of the extent of the MDV used in this study follows the outline for the greater MDV documented in [37] with a total of about 22,700 km 2 and an ice-free area of 4500 km 2 (Figure 1).
There is reason to believe that climate change will affect the area of interest: Doran [38] report a net cooling of the MDV from 1966 to 2000. This finding is reevaluated by Bertler [39], who show that the regional cooling is due to a change in atmospheric circulation, which results in ENSO warming events having this cooling effect on the MDV in the short term, but not in the long run. In any case, the MDV are especially vulnerable to climate change because they are influenced by three adjacent climate systems: The Ross Sea; the East Antarctic Ice Sheet and the Ross Ice Shelf system. Thus the probability of overall change is high [39] and the expected changes in LST in the context of climate change and its effect on the ecosystem call for a high resolution monitoring of the temperature in the MDV.

3. Material and Methods

The study aims at developing a high spatio-temporal resolution and spatially continuous LST product of the MDV. This is achieved by training a machine learning model, which is based on MODIS LST as well as auxiliary data as predictor variables and Landsat 8 derived LST as the response variable. The trained model can be applied to a time series of the MODIS LST product to predict sub-daily LST in 30 m resolution from December 1999 on for MODIS data stemming from the Terra satellite, and from May 2002 on for data stemming from Aqua. All processing steps were performed in R version 4.0.2 [40] if not mentioned otherwise. The workflow is available on GitHub under https://github.com/MLezamaValdes/downscaling_LST_MDV, accessed on 21 October 2021.

3.1. Data and Pre-Processing

The satellite data used in this analysis come from sensors on three satellites, Terra and Aqua (MODIS) and Landsat 8, all sun-synchronous, polar-orbiting satellites, which results in many overpasses close to the poles in comparison to the equator. Due to the difference in swath width (Landsat 8 TIRS: 185 km, MODIS: 2330 km) and the fact that MODIS is based on two satellites, there is much more MODIS imagery available than from Landsat 8. As Landsat 8 passes over the research area at about the same time every day, with this data set alone no diurnal variation in LST could be depicted. The trade-off between spatial resolution and spatial coverage was balanced here by using both, MODIS with a good temporal and Landsat 8 with a good spatial resolution in a downscaling approach.

3.1.1. Landsat LST

The Landsat 8 LST scenes used as a reference in model training are prepared based on the Top of Atmosphere Brightness Temperature product from Landsat 8. Suitable scenes were selected via the R package getSpatialData [41], ordered from the USGS’ EROS Science Processing Architecture On Demand Interface and downloaded via the espa_tools R package [42]. Data for the MDV and each day from September to March 2013 to 2019 are queried. During the austral winter months no scenes were available as a 5 sun elevation angle limits the Landsat 8 acquisition (personal communication with Landsat Science Team). Suitable scenes were selected based on >30% overlap with the research area and less than 20% cloud cover. Cloud pixels were removed based on the Pixel Quality Band and only scenes covering more than 10,000 km 2 of actual land area were retained (n = 68).
LST has been retrieved from Brightness Temperature using a single-channel algorithm for band 10 as recommended by USGS [43] following a well established procedure explained e.g., by [3]: first, the Landsat Brightness Temperature (BT) product was converted from Digital Number to Kelvin temperature range and subsequently to C (BTC) via the following Equation (1).
B T C = ( B T 0.1 ) 273.15
To derive LST from BTC, the emissivity of the surfaces has to be considered. There is no emissivity product for the MDV at Landsat 8 spatial resolution, thus the most suitable emissivity parameters per surface type from the MODIS LST calculation [44] were used here. As open soil in the MDV consist mostly of granite and basalt [45], the most appropriate categories in the MODIS document’s emissivity look-up table used for the generalized split-window algorithm for MODIS LST are fresh rough basalt, desert vanish coated basalt and igneous granite and basalt. According to [44], they possess an emissivity of 0.92 to 0.96 for MODIS channel 31 (whose wavelength lies between 11.2 and 11.28 μ m, which is comparable to the L8 channel 10 with 10.6 to 11.19 μ m). The mean ( ε = 0.94) was used here as an estimate for open soil surfaces. For snow and ice, a value of ε = 0.97 was used as determined via IR thermometer by [46]. Ref. [47] warn of LST misestimations when disregarding soil moisture content and its impact on emissivity, but as the general soil moisture content in the MDV is extremely low, this was not considered here. Hence, LST was calculated as in Equation (2).
L S T = B T C / ( 1 + ( 0.0010895 B T C / 0.01438 ) l o g ( ϵ ) )
where ε is the emissivity, the factor to be multiplied with BTC is the average of the limiting wavelength and the divisor being calculated from the Boltzmann and Planck’s constants and the velocity of light adapted from [3].

3.1.2. MODIS LST

Scenes from the MODIS Aqua and Terra LST Product (“MOD11_L2”, “MYD11_L2”), Version 6 were selected via the getSpatialData package [41] and downloaded from the ‘Level 1 and Atmosphere Archive and Distribution System’ (LAADS DAAC). The LST retrieval in a MODIS swath is constrained to pixels that are on land or inland water and have been gathered in clear-sky conditions according to the MODIS cloud mask product (MOD35_L2) [48].
The MODIS Swath files were converted to raster format using the gdalUtils package [49] using a thin plate spline transformer based on available Ground Control Points and setting the target resolution to match 1000 × 1000 m with a nearest neighbour resampling. Rasters were then projected to EPSG 3031 WGS 84/Antarctic Polar Stereographic and processed according to [48]: values were cropped to the valid range of 7500–65,535 DN and a scale factor of 0.02 was applied to convert to the unit Kelvin, which was then converted to C.
To ensure comparability between sensors, only MODIS scenes with a time difference of less than 36 min to the Landsat scenes were retained. This is due to the fact, that the temporally closest scenes stemming from the MODIS sensor based on Terra are always between 30 and 36 min apart from the Landsat scenes, while the temporal match with data stemming from Aqua is better with 11 to 14 min of difference. It was assumed that no significant changes in LST occurred within this time. The time difference between selected MODIS and Landsat LST scenes is on average 23 min (13 for Aqua scenes and 33 for Terra scenes).

3.1.3. High Resolution Predictors for LST

Apart from the low resolution LST from MODIS, further potential predictor variables that were used here are the elevation, the solar incidence angle and topographic hill shading, slope, aspect, the land surface type, a soil type map, the Topographic Wetness Index (TWI) as well as an indicator whether MODIS data stem from the Terra or Aqua satellite (Table 1).
The temporal dynamic of LST in the MDV is provided by the low resolution LST from MODIS prepared as reported in Section 3.1.2.
The 8 m resolution Reference Elevation Model of Antarctica (REMA) [52] is the basis for the terrain-derived auxiliary data. Invalid values below −100 m were set to NA. To reduce noise a 3 × 3 mean filter was applied and the 200 m resolution Radarsat Antarctic Mapping Project Digital Elevation Model (RAMP) [53] was used to fill areas where data was missing in the REMA DEM.
The most evident driver of LST, the energy received from the sun, depends on the terrain and the sun’s position, i.e., elevation (altitude in relation to the horizon in degrees) and azimuth (position relative to N in degrees). Those parameters have been calculated for the MODIS scene capturing time using the oce package [55]. The incidence angle represents the angle between the surface normal and the sun ray, which determines the expected energy reception of the pixel. It was calculated using the solrad package [56]. Topographic hillshading, i.e., the intensity of terrain-derived illumination, was chosen as a further proxy for illumination and calculated via the raster package [57] under consideration of the sun’s position as described above and based on slope and aspect (in degrees). The MDV features two land cover classes with massively distinct albedos (open soil and snow/ice). To include them as potential predictors for the downscaling model, the rock outcrop layer provided by the Antarctic Digital Database [45] is used. The spatial distribution of snow and ice vs. open soil is assumed to be sufficiently static in the MDV as to be constant for the whole modeling period. The soil type map [54] was provided by Landcare Research (NZ) and the TWI was calculated as a proxy for potential soil moisture in order to account for the influence soil moisture has on LST. The index represents the terrain based probability of moisture accumulation and was calculated from the filled 8m DEM using the SAGA Topographic Wetness Index function with 1/cell size area conversion and the topmodel method [58]. Finally, a variable indicating whether the MODIS LST scene comes from the Terra or Aqua satellite was incorporated because the difference in acquisition time between the Landsat 8 reference LST data and MODIS LST is greater when stemming from Terra than from Aqua. All predictor variables were resampled to match the model spatial resolution (30 m) of the response variable from Landsat 8.

3.2. Compilation of the Training and Validation Data Sets

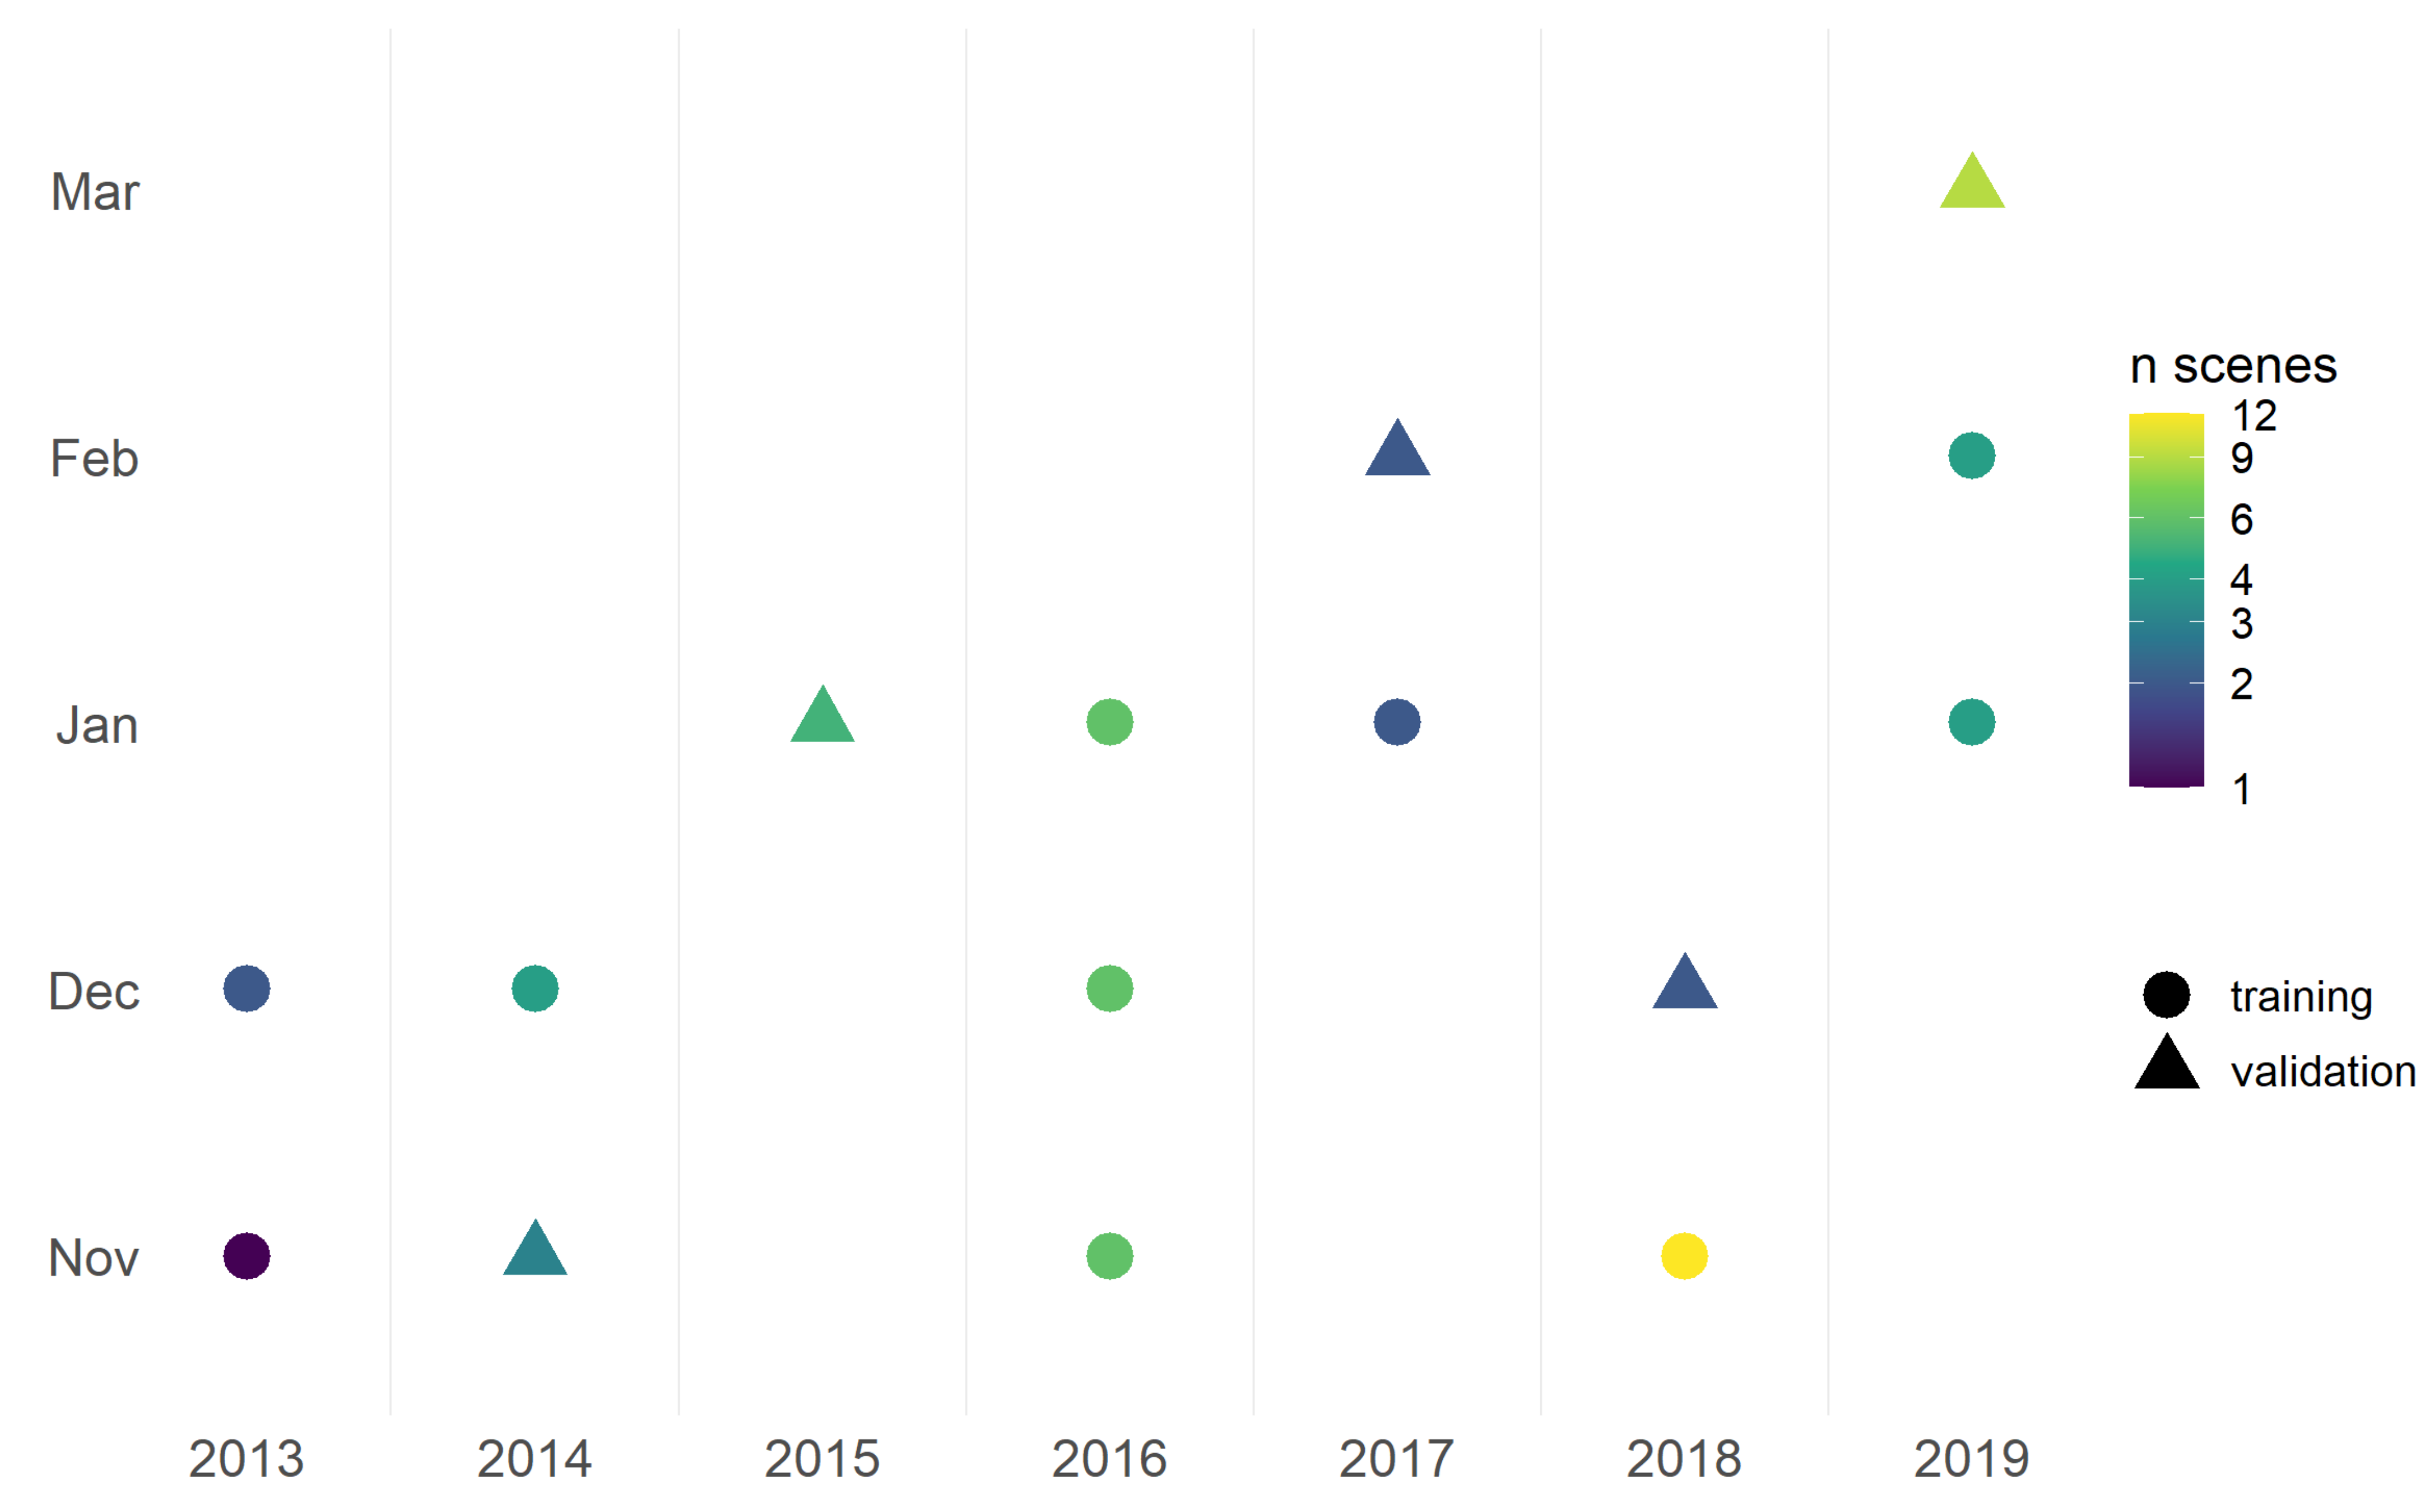
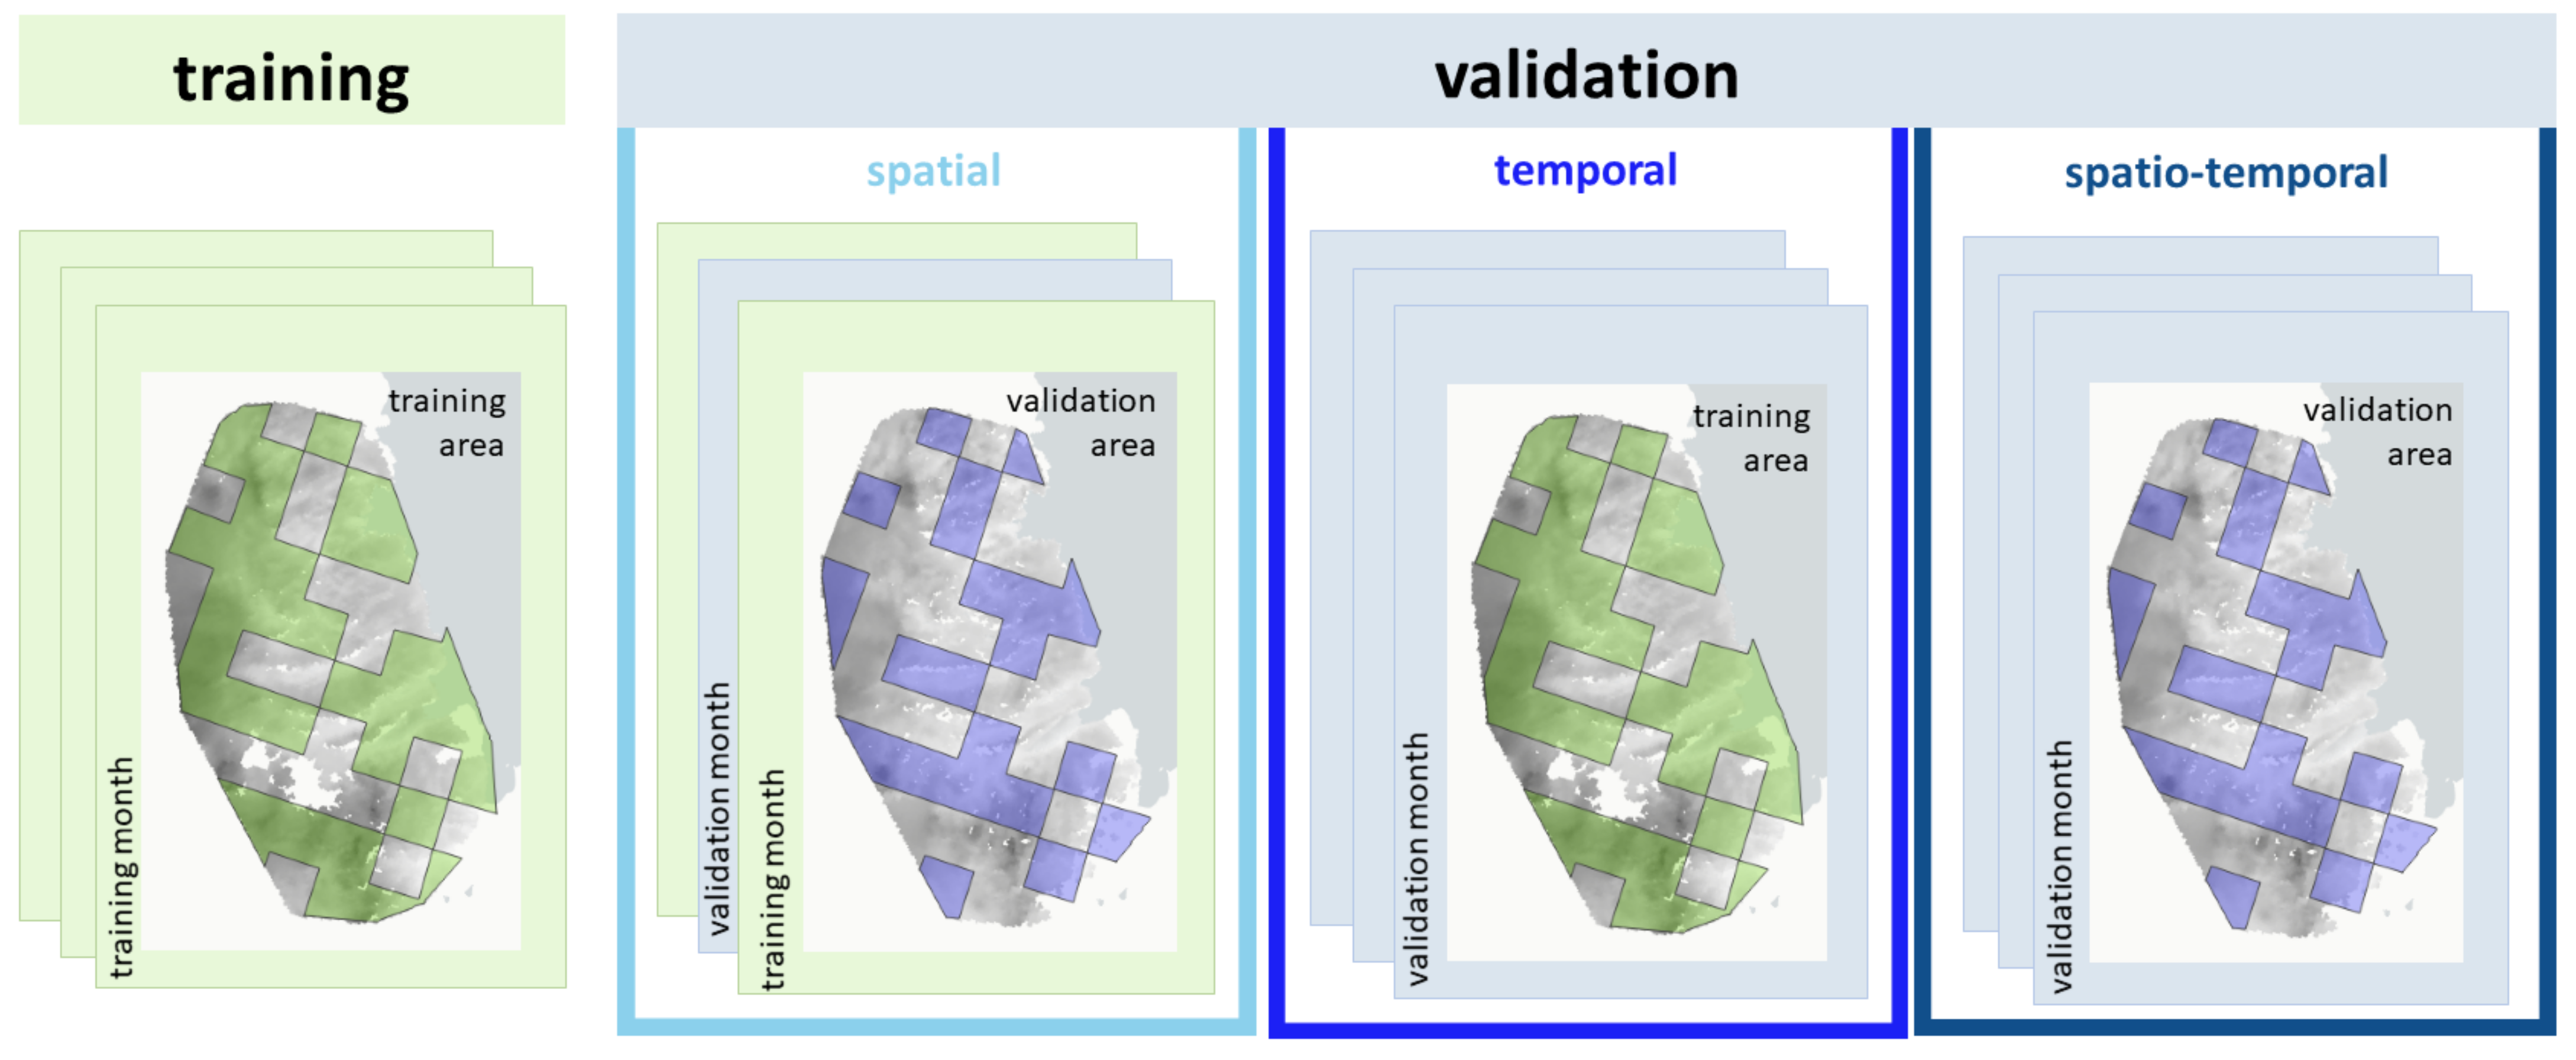
The downscaling model is intended to be applicable to the entire research area and for the whole time series of MODIS LST. To provide an estimate of the model’s prediction capacity on unseen data, validation data was excluded from model training. Three different validation sets were prepared. To test for spatial transferability of the model, 40% of 6520 km 2 spatial blocks distributed over the extent of the research area are randomly designated as external validation sites (Figure 1b). This validation set is referred to as ‘spatial validation set’ in the following. To further check for temporal transferability, a third of available months are randomly selected as validation time steps: November 2014, January 2015, February 2017, December 2018 and March 2019 n = 5). This validation set is referred to as ‘temporal validation set’ in the following. Figure 2 shows which months were selected for validation as well as the amount of available scenes per month. Finally, to provide external data that can be used to test the ability of the model to make predictions for unseen spatial and temporal domains simultaneously, data from the spatial and temporal external validation areas and time frames is pulled together. This validation set is referred to as ‘spatio-temporal validation set’ in the following. This is schematically represented in Figure 3.
The remaining areas and months (November and December 2013, December 2014, January, November and December 2016, January 2017, November 2018 and January and February 2019 (n = 10)) remained available for training and comprised an amount of 358,849,290 samples. This is too large to be handled in common machine learning models but at the same time, all relevant information needs to be supplied to guarantee that the model is later applicable to the entire spatio-temporal domain [59]. Thus, the feature space (composed of space, time step, predictor and response variables) should be covered as exhaustively as necessary to allow the model to learn all relevant statistical relations that arise in the combination of those features. Here we decided on a target training sample size of 150,000. To handle the requirement of complete predictor properties, initially three million samples per each of the 15 months were randomly chosen. Subsequently, for each month, the following sample selection was performed, which is targeted at representing each time step’s feature space in the most exhaustive way while maintaining the data distribution structure: first, 150,000 samples are randomly selected. Afterwards, the dissimilarity index [59] is calculated for the remaining potential training samples in comparison to the 150,000 samples already selected as training data via the package CAST [60]. In an iterative process the most dissimilar samples in the pool of potential training samples are added to the training data set until there are no samples left outside the “Area of Applicability” (AOA) [59]. The AOA defines a multidimensional feature space where the model was enabled to learn about statistical relationships based on the training data. It is delimited by a threshold which is the outlier-removed maximum dissimilarity present in the training data—which means the samples already selected to be part of the training data set during the training data compilation.
For reasons of computational speed, the amount of samples added to the training data set in each iteration (z) was determined as in Formula (3), where k is the amount of samples that in this iteration still remain outside of the AOA based upon the samples already selected for training (i.e., 150,000 in the first iteration, 150,000 + z in the second and so forth).
z = l o g ( k ) 3.5
This procedure resulted in a training set of 1,803,831 samples, which were reduced to the target sample size of 150,000 using a Latin Hypercube Sampling [61] via R package clhs [62]. To compile the final validation sets, 150,000 random samples for each of the spatial, temporal and spatio-temporal validation were selected from all samples available in the three categories described above (229,536,200, 906,052 and 75,826,099, respectively).
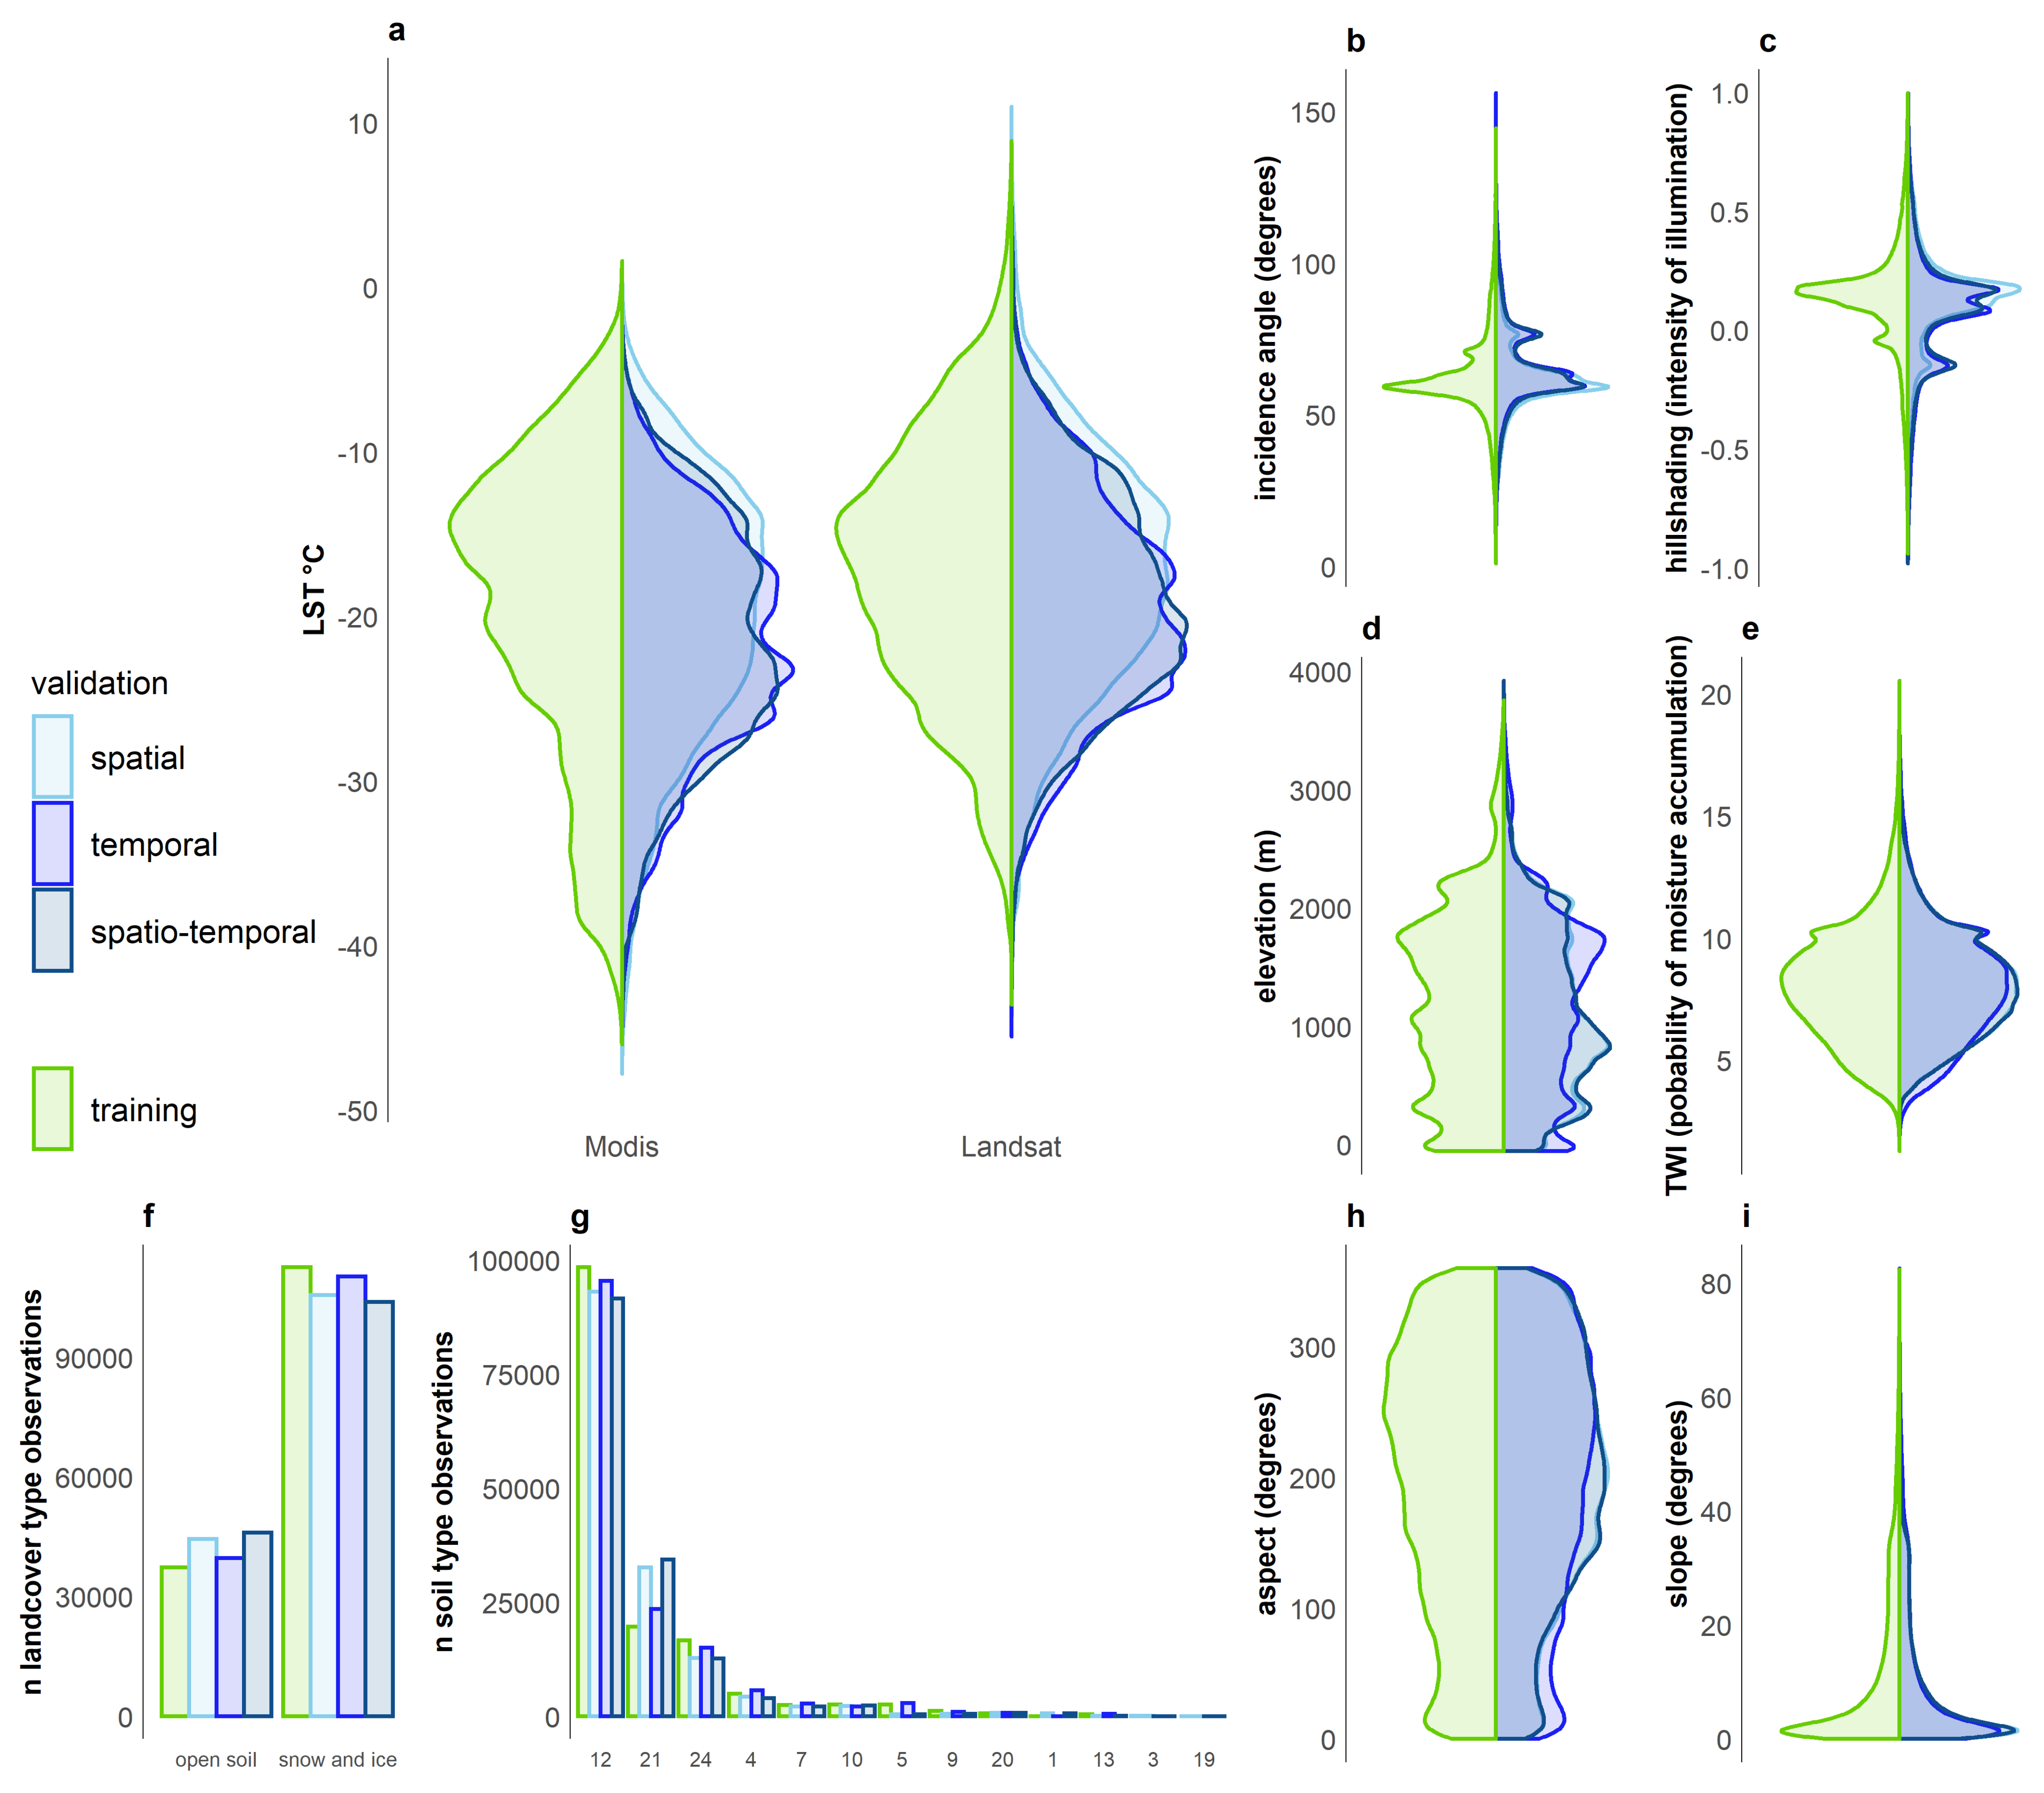
The LST and predictor data distribution of samples selected for training and validation sets shows that training and validation data sets generally feature a comparable distribution (Figure 4) and cover the same range of predictor properties, although it is clear that with increased difference to the training data (spatial to temporal to spatio-temporal) the distributions differ more (Figure 4), especially in case of LST (a) and elevation (d).

3.3. Training and Validation

Three different machine learning algorithms were tested for their suitability for this modelling task. The algorithms Random Forest (RF), Gradient Boosting (GBM) and Artificial Neural Net (NN) were chosen because they showed good results in similar studies [27,63]. The implementations of the following packages were used: randomForest [64], gbm [65], nnet [66]. The R package caret [67] was used for the implementation and the models were trained in parallel on the Palma II HPC system available at the University of Münster.
To account for different requirements of the algorithms, for RF, categorical variables were converted to factors, for GBM and NN they were One-Hot encoded and metric data scaled from 0 to 1 using the minimum and maximum values from training and validation data sets.
Geographic data is characterized by a high spatio-temporal autocorrelation, which often results in model overfitting and error underestimation due to a lack of independence between training and validation data [68,69]. To prevent overfitting, suitable hyperparameters and variables were selected via a 3-fold spatio-temporal cross-validation (CV). Predictor variables were selected using a forward feature selection (FFS) to reduce the number of predictor variables to the relevant ones: those that are best suitable for the model to make predictions beyond locations and time steps used for model training. After variable selection, a final model is trained for each tested algorithm with extensive hyperparameter tuning (Table 2) using the predictors selected by the FFS with a 10-fold spatio-temporal CV. To identify optimal model hyperparameters, the models were repeatedly trained based on different hyperparameter values and the performance was accessed using the spatio-temporal CV results.
To select the best performing model, the final model’s prediction accuracy of all used algorithms was accessed on the three external validation sets, i.e., data spatially, temporally and spatio-temporally unknown to the model. The choice of the final model to be used for downscaling was made according to the best performance in space, time and space-time considering the Root-Mean-Square-Error (RMSE) and R 2 . The selected final downscaling model was then applied to all training and validation samples to assess performance differences in time and per land cover class. Moreover, the AOA was calculated to check for the ability of the model to make predictions over the whole range of expected feature expressions.

4. Results

4.1. Model Selection and Evaluation

The external validation of the final RF, GBM and NN models revealed a relatively similar performance, with RF slightly outperforming the other two algorithms on each validation task (Table 3). For this reason, the RF model was chosen for downscaling MODIS LST for the MDV.
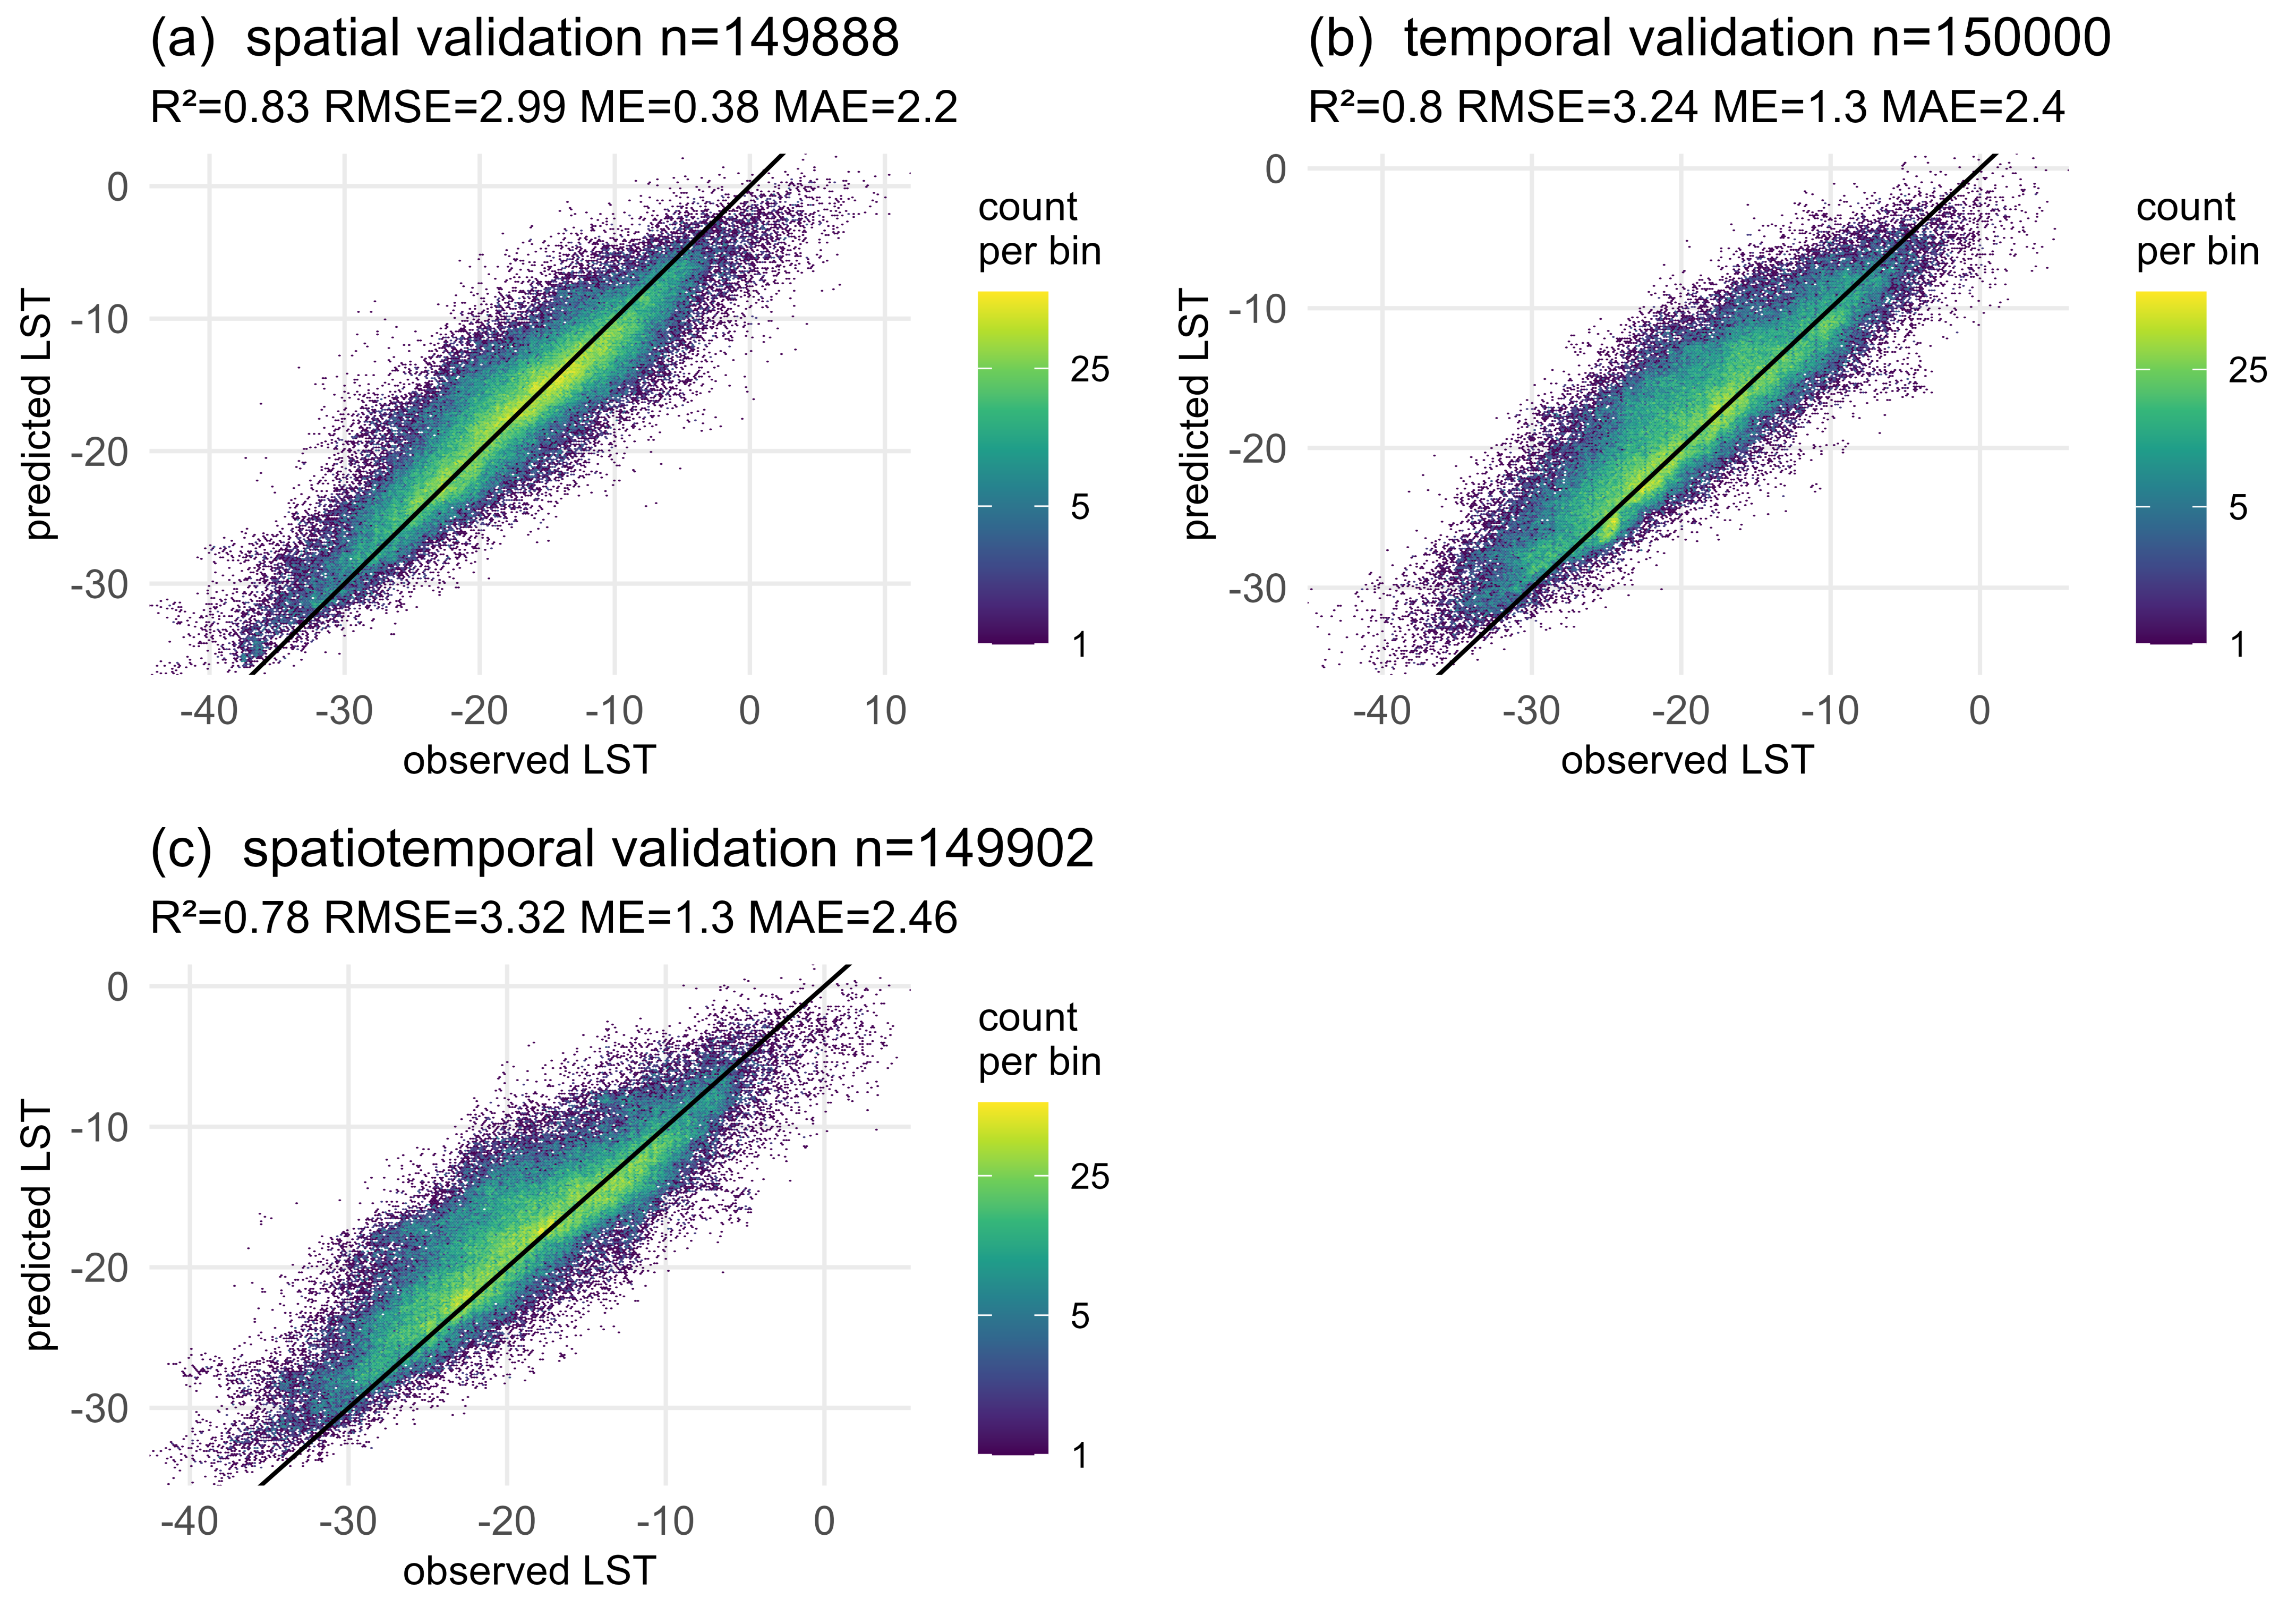
Figure 5 shows that most of the observed 30 m LST samples within the three external model validation data sets can be predicted well by the final RF model, while the temporal and spatio-temporal validation shows a tendency to LST overestimation that can not witnessed in the spatial validation data set.
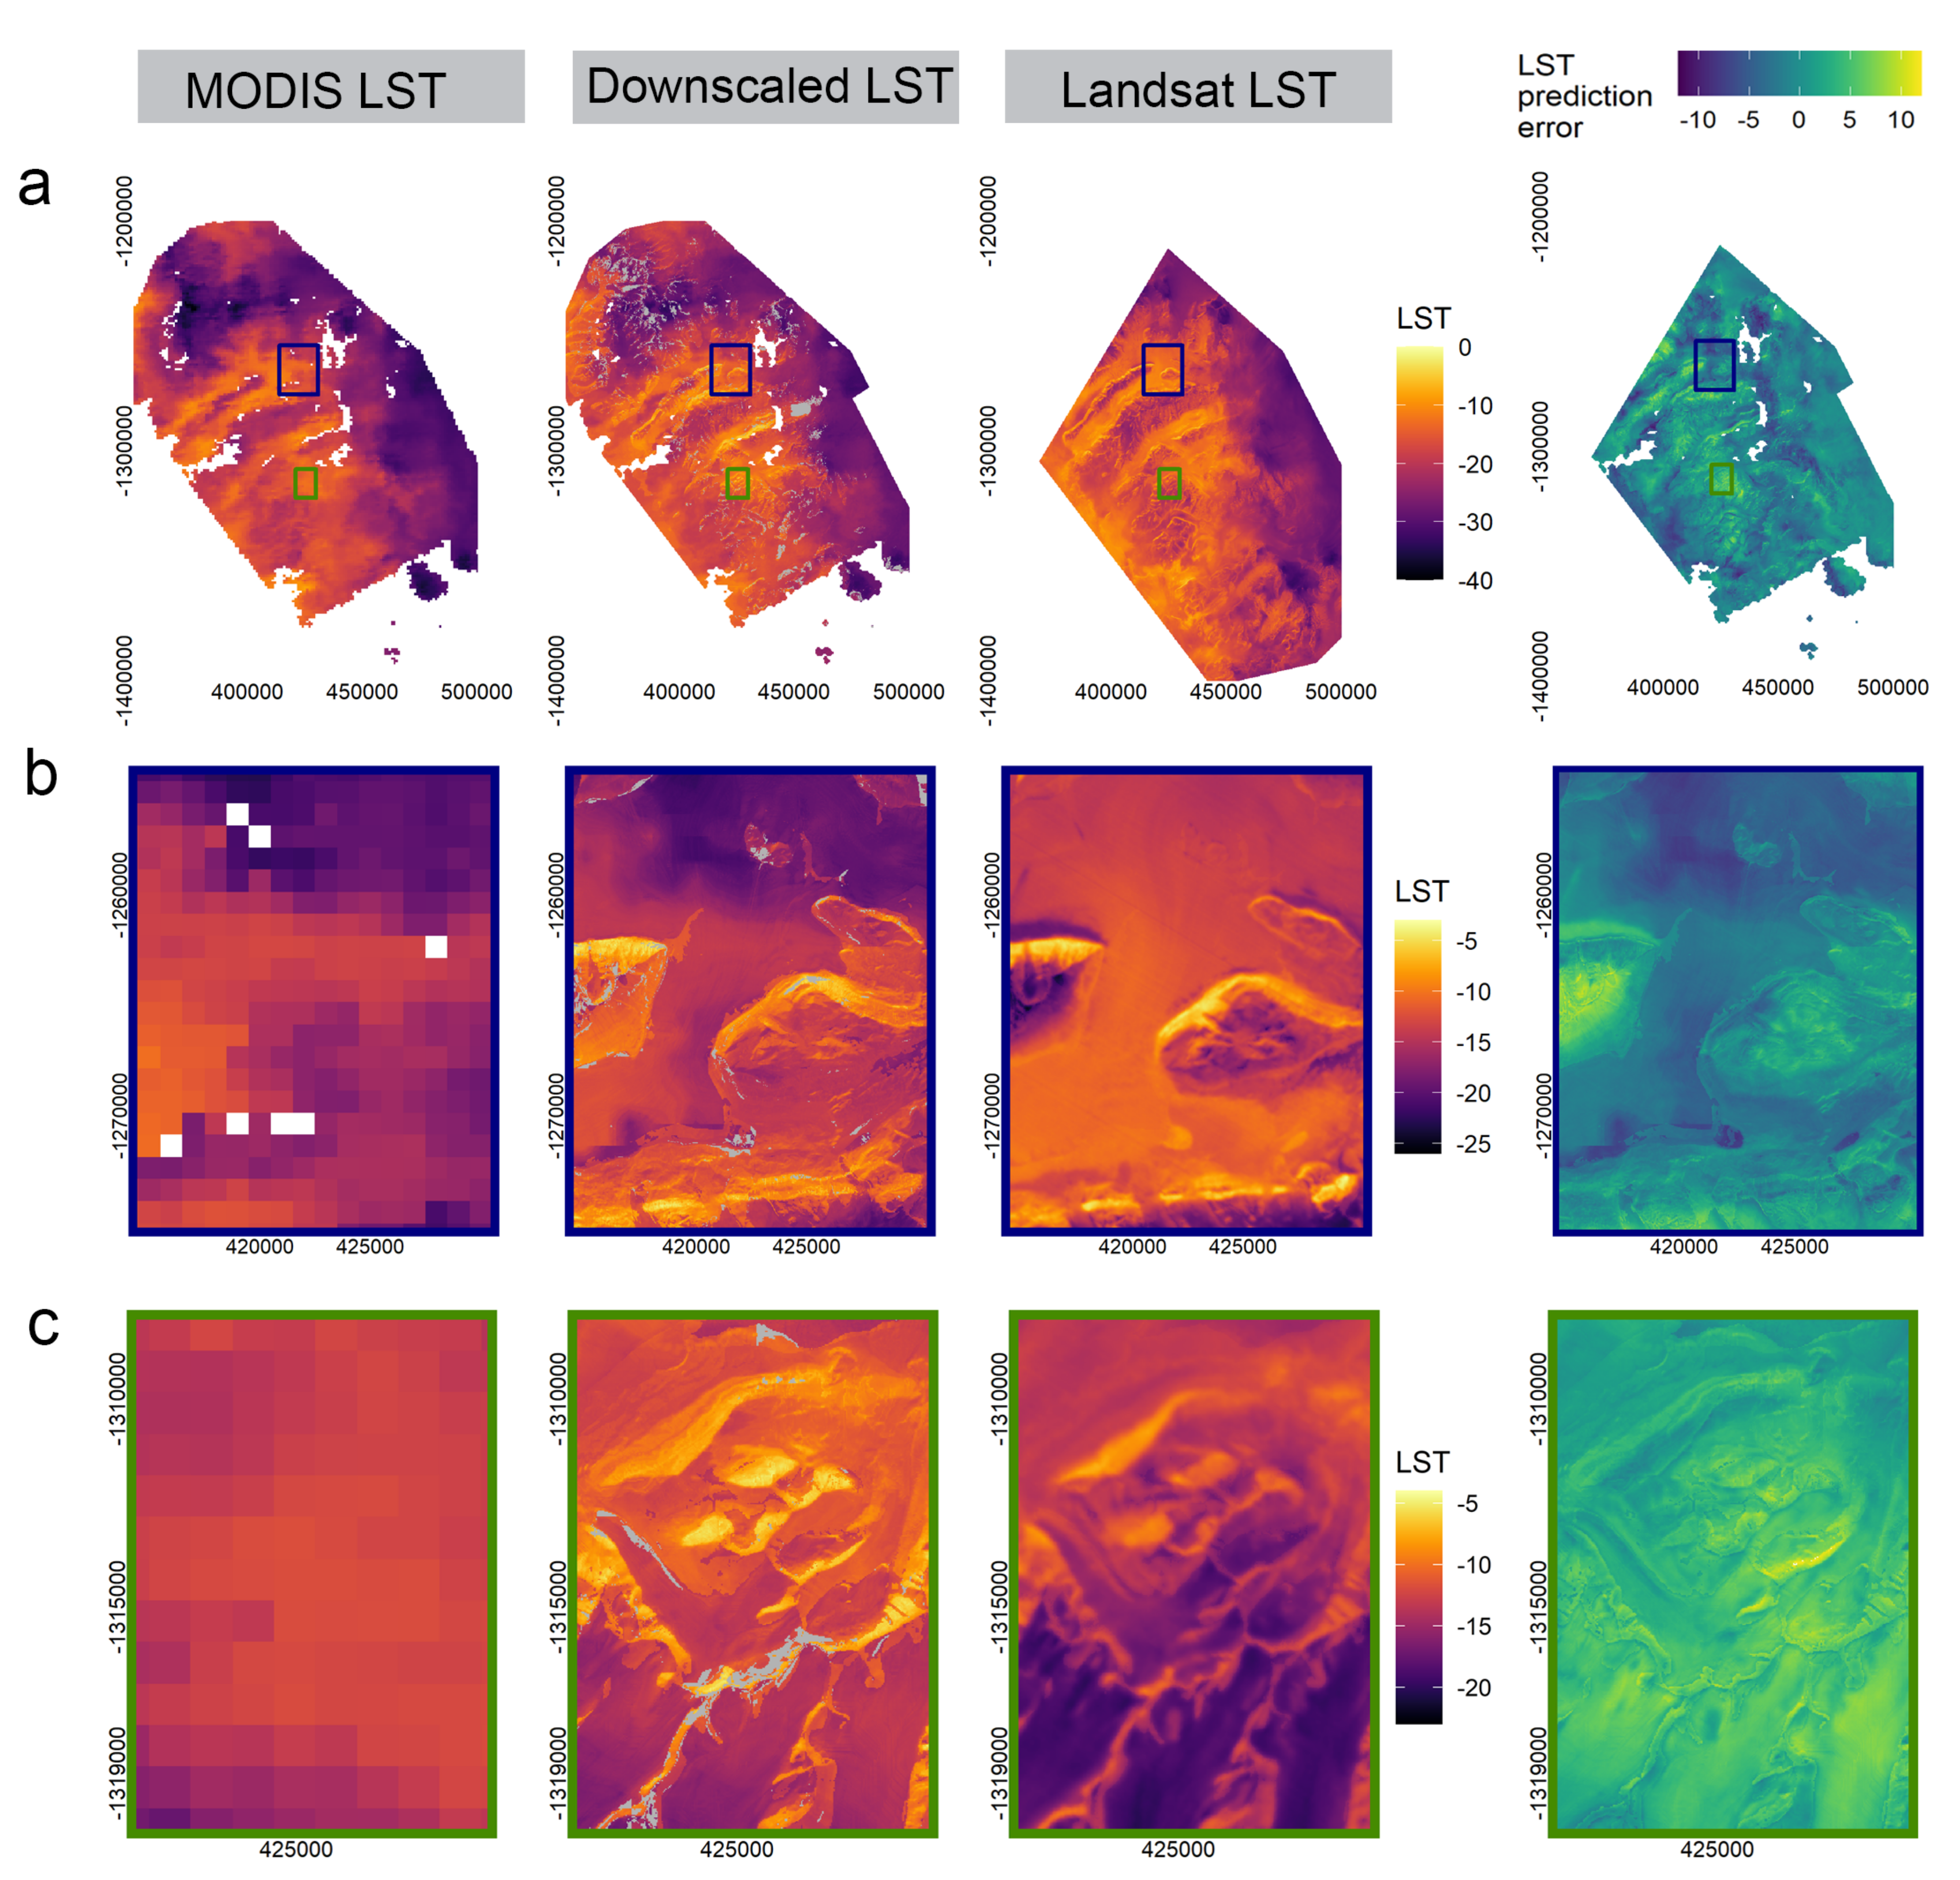
Figure 6 shows both a clear improvement of the downscaled LST product over the MODIS LST product in terms of spatial resolution and a high agreement with the high resolution LST reference variable measured by Landsat 8. Small spatial extents in Figure 6b,c show that environmentally driven patterns of LST, that are not recognisable in the 1 km resolution MODIS product, are clearly represented in the downscaled MODIS product.

4.2. Selected Features

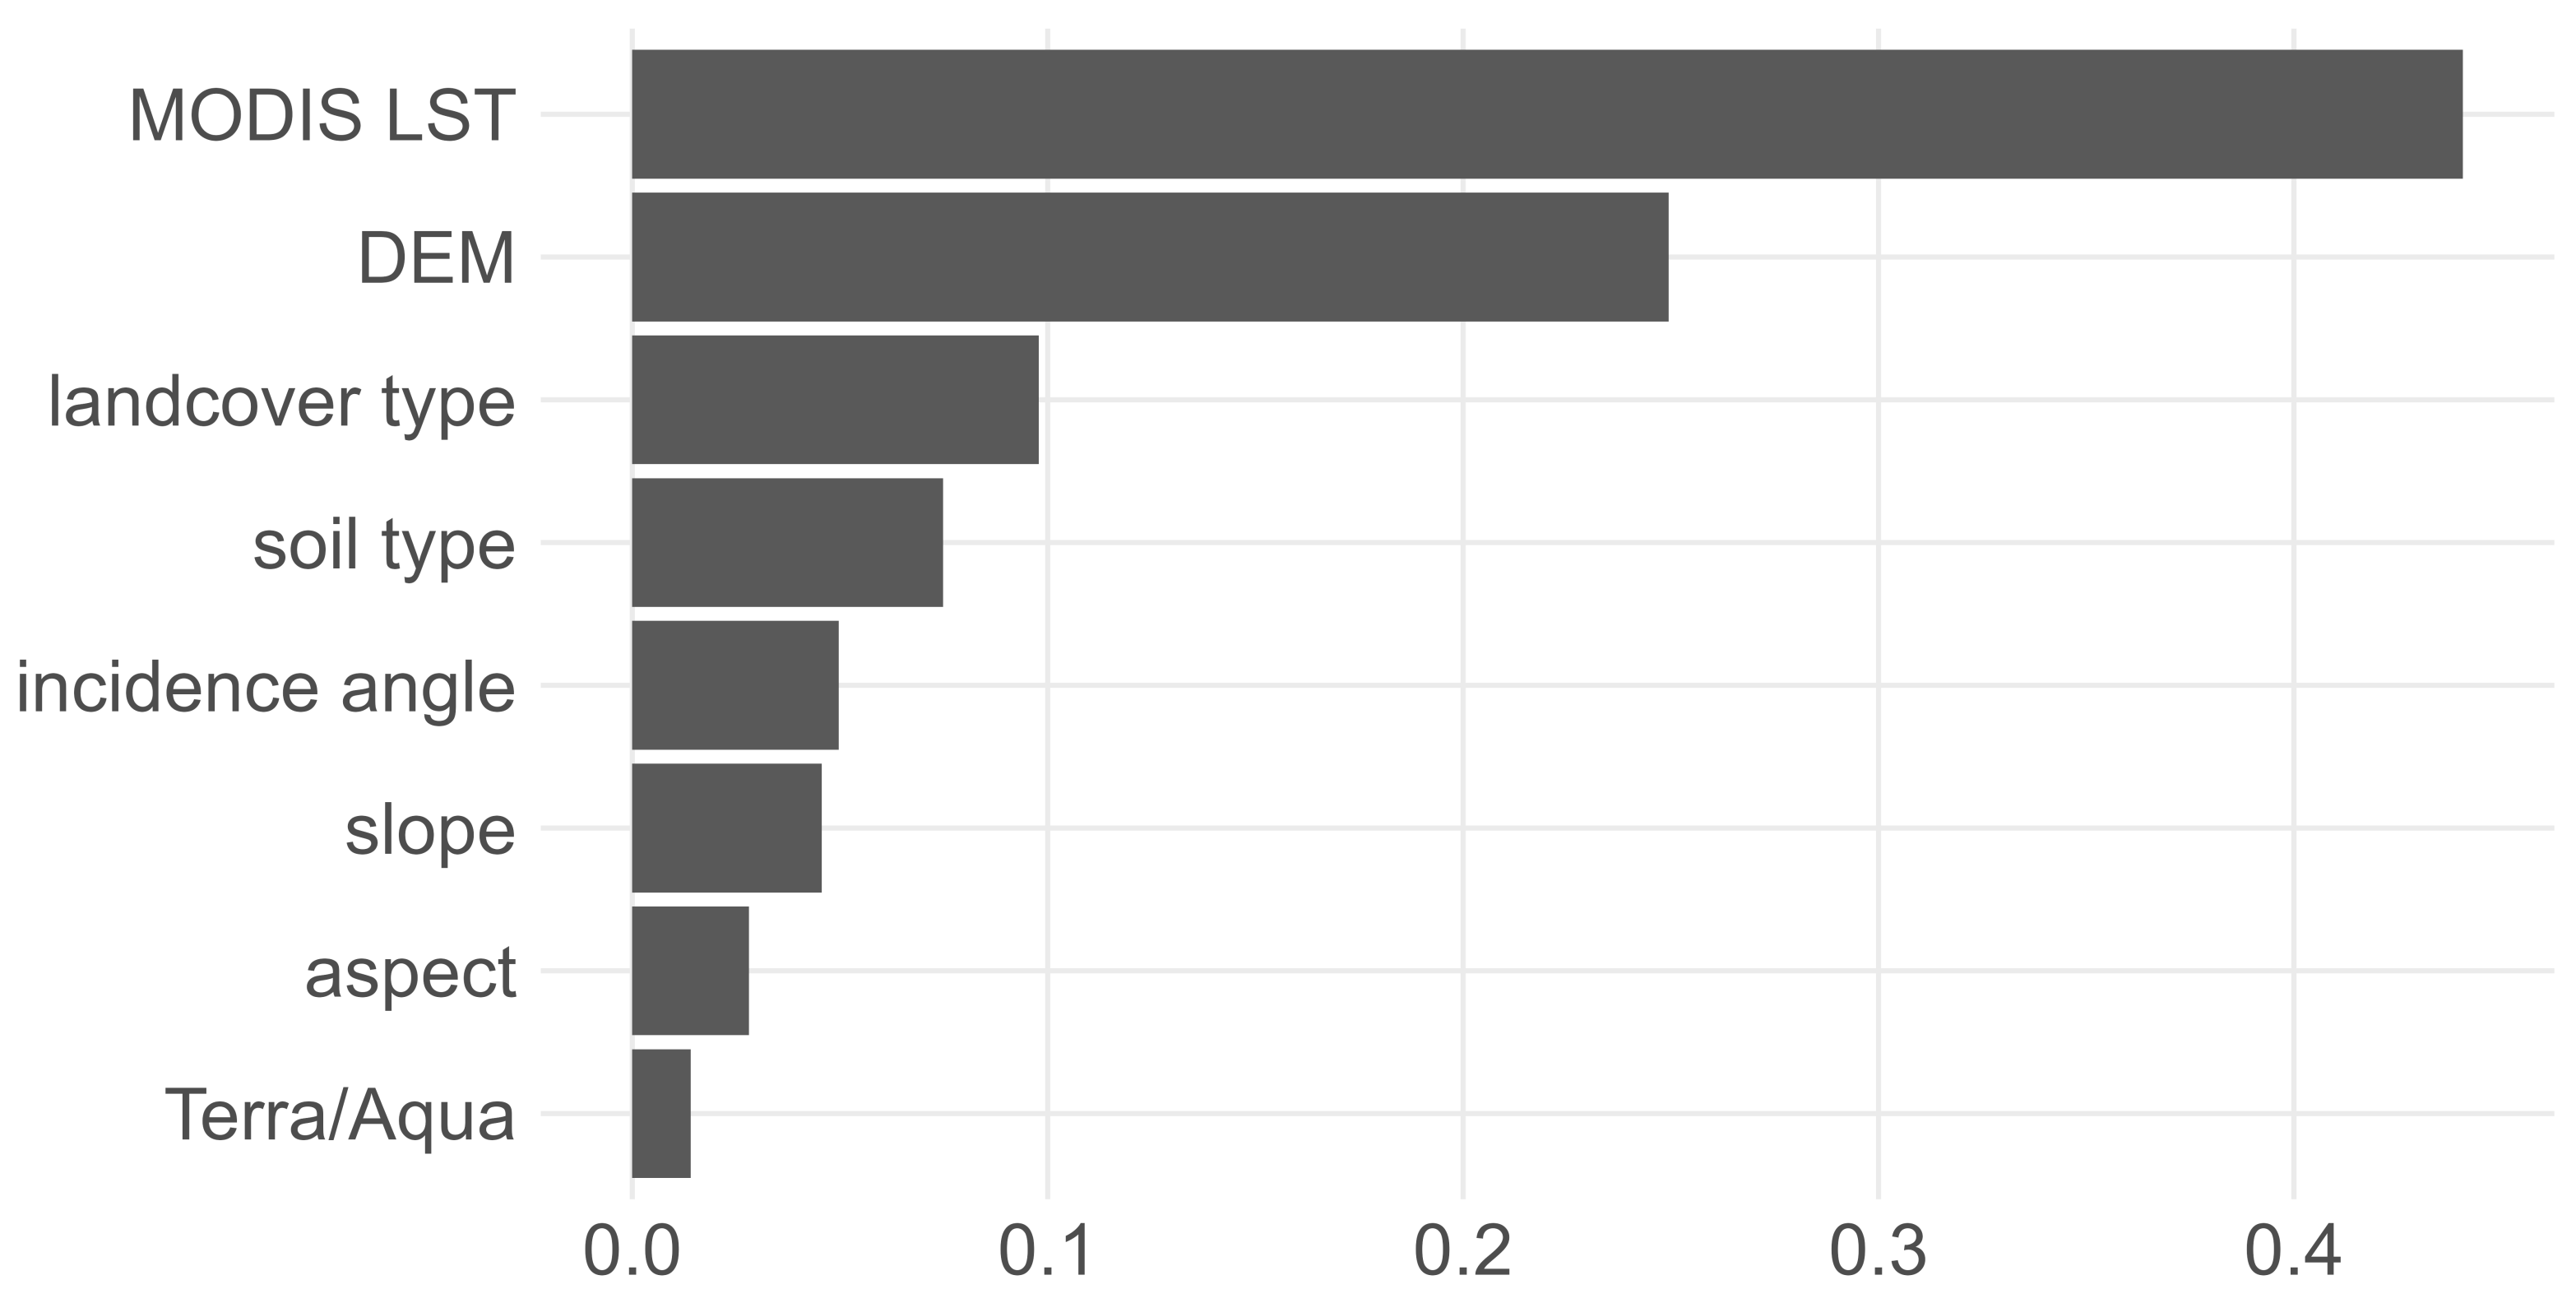
Figure 7 shows the most relevant variables for the final RF LST downscaling model determined by the FFS to be MODIS LST, followed by the elevation, the distinction between snow and ice, the soil type, the incidence angle, slope, aspect and the indicator of the MODIS scene stemming from Terra or Aqua.

4.3. Area of Applicability

The AOA was calculated for the three validation data sets and also for the exemplary scene from 12 November 2018 shown in Figure 6. 7.8% of samples in the spatial validation data set were outside of the boundaries of the final model’s AOA, while about 13% of the temporal and spatio-temporal validation sets were determined to be outside of the model’s area of applicability. For the exemplary scene from the 12th of November 2018, only 3.4% of samples remained outside of the model scope.

4.4. Performance over Time and Land Cover Types

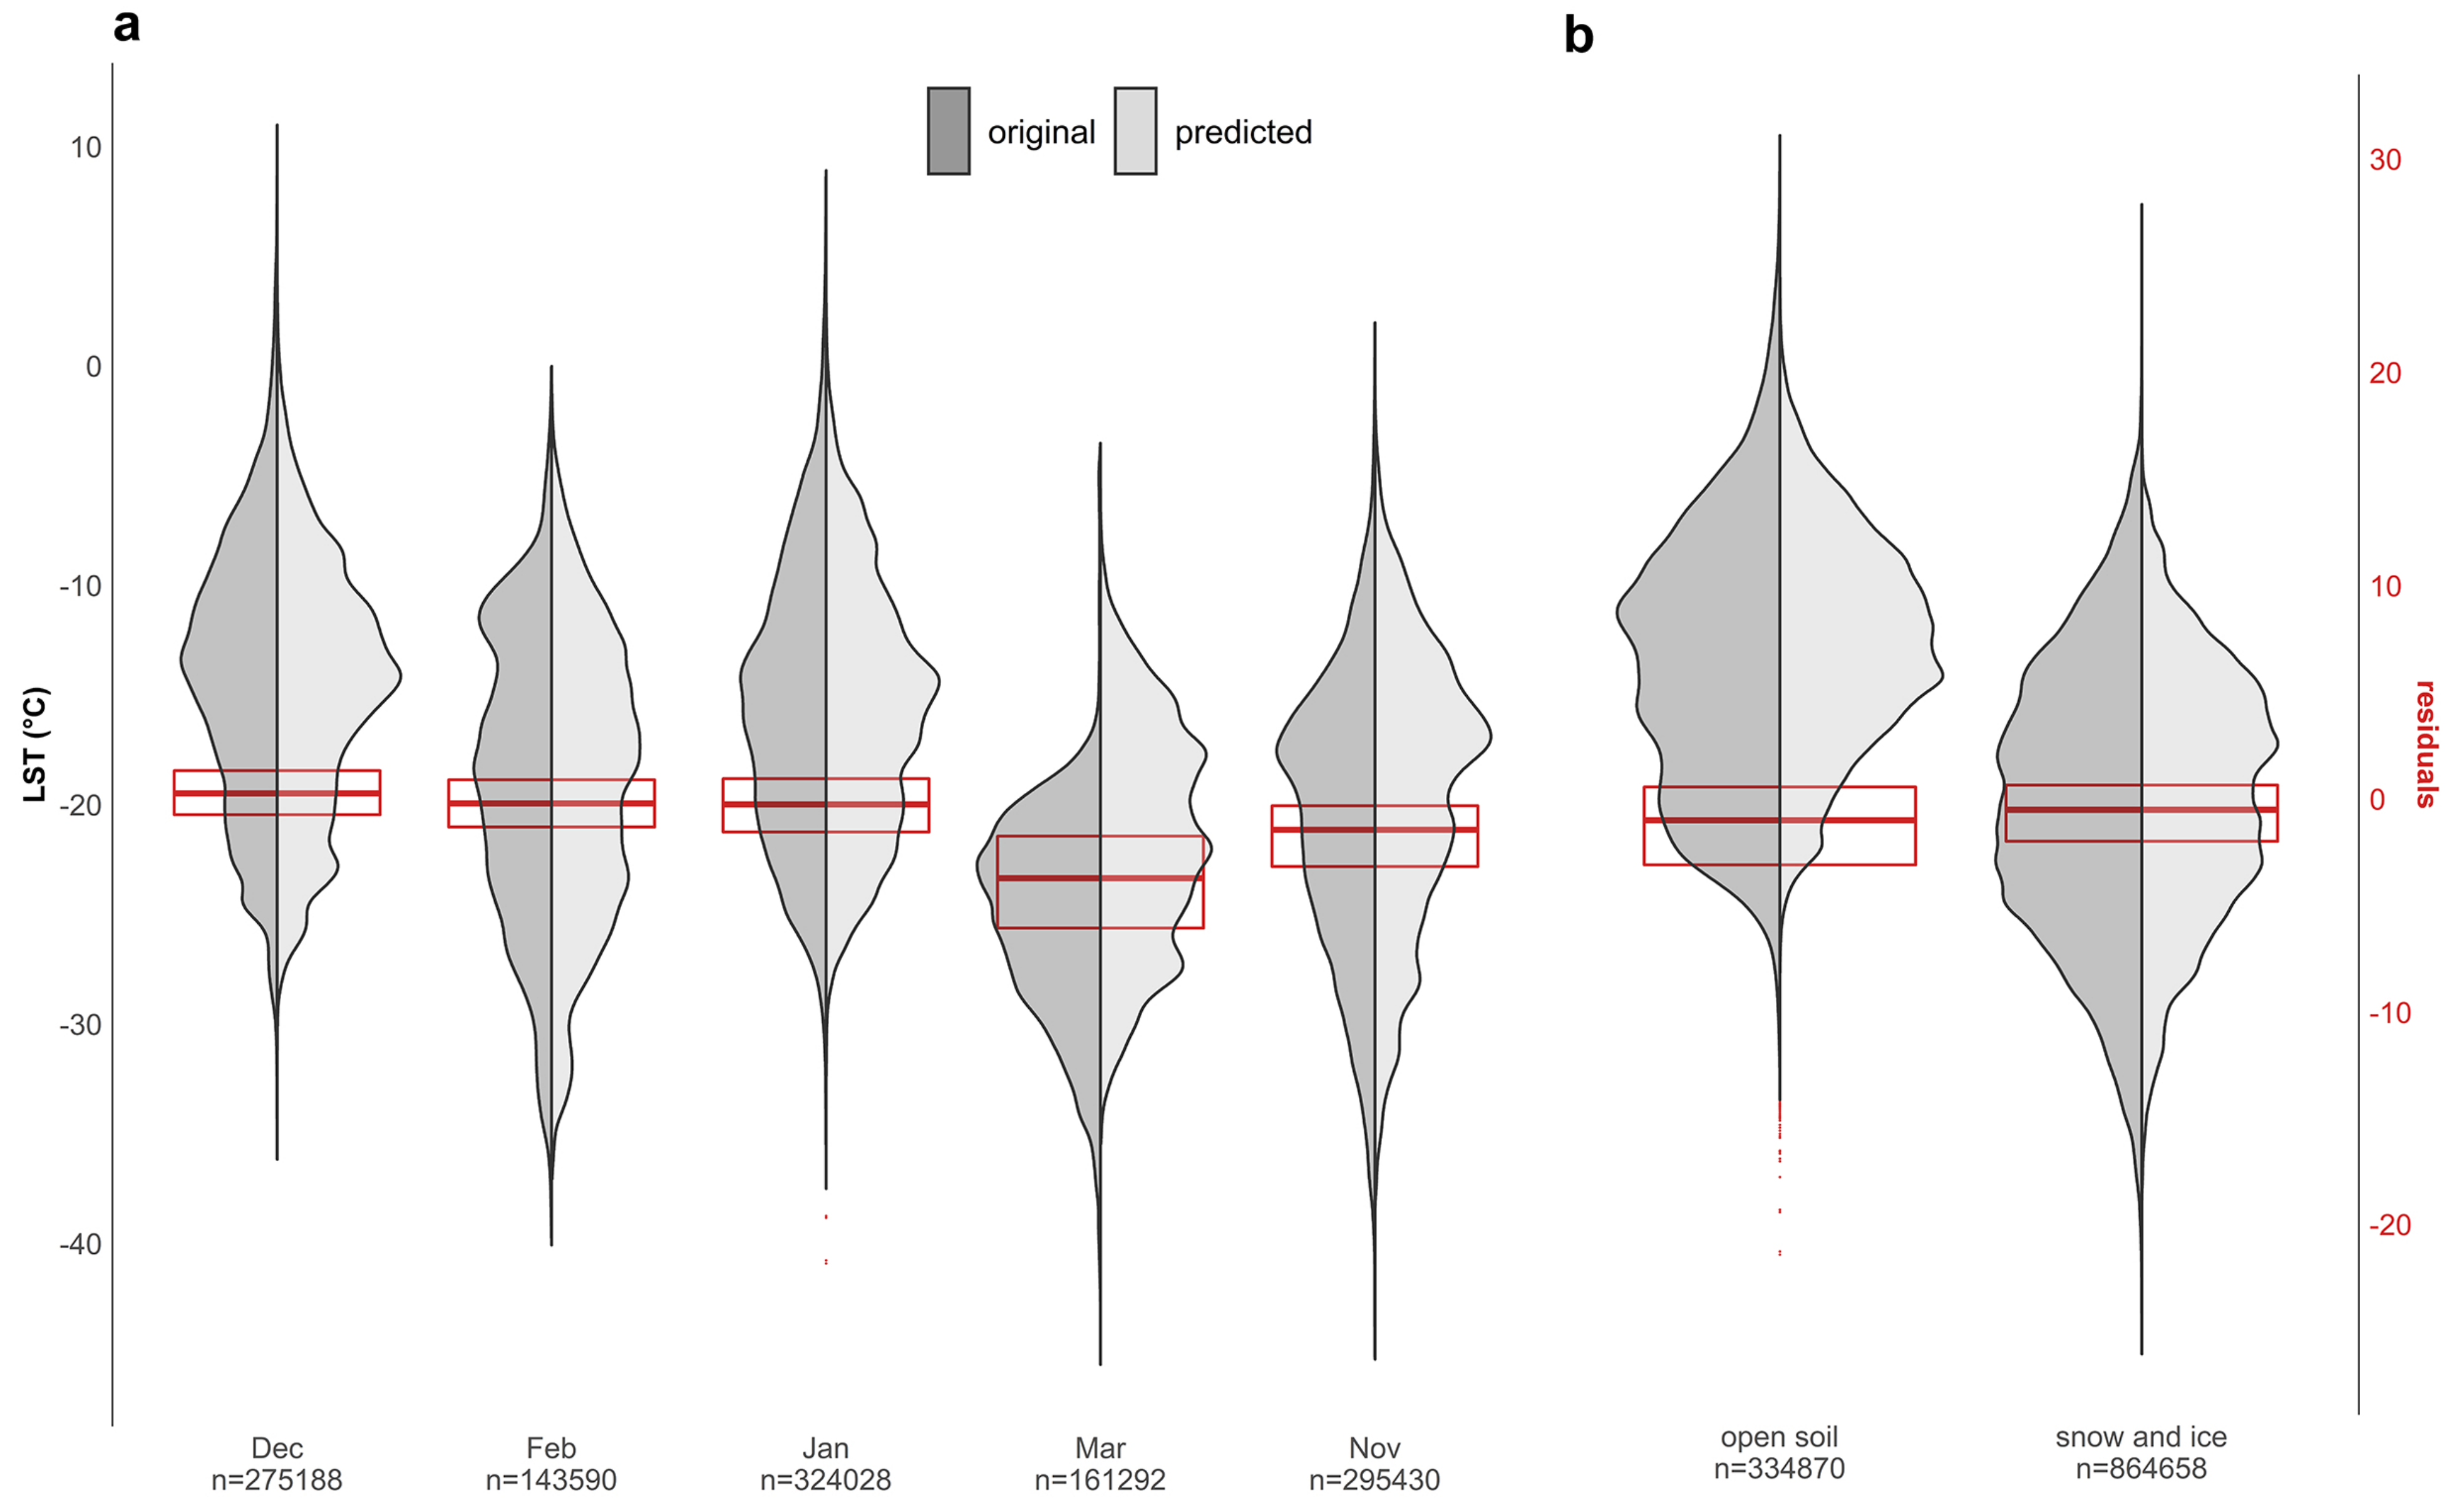
The downscaling model was applied to all training and validation data sets to assess performance differences seasonally and per land cover class. Figure 8 shows the middle 50% of residuals to be relatively close to 0. Estimates for the months December, February and January are more accurate than November and March. The model predicts better on snow and ice data points than on open soil.

5. Discussion

Downscaling of the MODIS Aqua and Terra LST Products (“MOD11_L2”, “MYD11_L2”) to 30 m was achieved for the entire MDV for daylight scenes during the austral summer months (November through February), anticipating the model determined error.

5.1. Variable Selection

The downscaling was based on the predictors MODIS LST, elevation, land cover type, the soil type, incidence angle, slope, aspect and an indication whether the MODIS scene stems from the Terra or Aqua satellite. The variable selection by the spatio-temporal FFS follows the theoretical expectations about relevant predictor variables very closely: the variable that carries information on the momentary condition of LST on a low spatial resolution was selected to be most important for the high resolution prediction. The model secondly identified the meteorological lapse, i.e., the negative relation between elevation and temperature to be relevant, which is a prominent phenomenon over the large elevational gradient in the Transantarctic Mountains. Third, the difference between open soil and snow and ice temperature is used, prior to further differentiation by soil type, which points to the importance of albedo for LST behaviour. The following three selected variables, incidence angle, slope and aspect potentially all together represent the solar insolation during the time of acquisition: due to the low rising sun during a large portion of the Antarctic summer, the solar irradiance is much dependent on the inclination of the terrain in combination with the orientation of the surface, which influences the high resolution LST profile.

5.2. Model Evaluation

The external model evaluation shows good prediction capacities in space and time. Escalating intricacy from spatial to temporal and spatio-temporal validation does not show vast decreases in performance (R 2 : 0.83, 0.8 and 0.78 and RMSE: 2.99, 3.24 and 3.32, respectively), which speaks for a model that does not overfit and can be applied over the expected range of data. For the scope that the model is designed for, i.e., to predict LST for temporally unknown scenes within the area the model was trained for, the expected model fit is R 2 0.78 with an RMSE of 3.32 C, with a tendency to LST overestimation (ME = 1.3) as shown in Figure 5 and Figure 6. Considering a temperature range of 46.25 C in the MODIS LST data, the error is relatively low.
The overestimation can be attributed to two factors: First, it stems mostly from samples from November and March, which show colder temperatures than the rest of the data. As an ideal opportunity to test the transferability in time, all available data from March were included only in the external validation data, i.e., the model had never received any samples from this month. Figure 8 shows that the prediction accuracy does worsen considerably for the model application in March compared to predictions on months that were incorporated in the model. Thus a restriction of the model application to November to February seems best. Second, overestimation predominantly happens for high elevations. The prediction error (the difference between the downscaled and the reference scene shown in the last column of Figure 6) is moderately related (r = 0.27) to a predictor that was not considered in the model, the wind effect, which is calculated based on the wind speed, wind direction and topography. Including the wind effect as predictor might improve the model accuracy and should thus be tested in future modelling efforts.

5.3. Scope of Applicability

As a result of the relatively stable temporal offset between Aqua, Terra and Landsat overpasses, only a short time window of a day could be covered in model training and validation (the matching scenes all lie within 2 to 4 pm local time). Thus, only a limited sun azimuth and altitude range is covered (mean 50% of distribution 165 to 177 and 1 to 11 , respectively). Nevertheless, as the model does not learn the translation of solar position into LST with absolute time information, but rather via the solar incidence angle, which considerably varies in this mountainous terrain even at a single point in time, the model can be expected to learn the relevant relations between the supplied predictor variables and high resolution LST. Therefore, the downscaling model should be applicable to all scenes during the daylight period and the summer months identified to be safe for application, i.e., November through February. The better performance of sample predictions, which belong to the surface type snow and ice in comparison to open soil samples could be first due to the larger amount of samples in the former category. There is also less potential for complex LST behaviour e.g., due to soil type and surface moisture differences for the snow and ice samples.
It might seem unexpected that up to 13% of spatio-temporal and 7.8% of spatial validation samples were determined to be outside of the AOA, considering that the model was trained on a data set that was composed to cover the most dissimilarity in available training pixels. Still, the external evaluation data sets are designed to be the most difficult case the model could encounter (i.e., a different rather than known location and time frame with potentially different temperature ranges). That this is the case can be seen by the greatly reduced share of samples, which are expected to not be covered by the model’s applicability (3.4%) when considering the prediction of a randomly chosen exemplary scene such as the one shown in Figure 6.

5.4. Comparison to Other Studies

A direct comparison of the result of this approach with other studies is difficult for multiple reasons. First, the study areas of the LST downscaling studies are in all cases located in the mid-latitudes, thus include vegetation as a central predictor and many are applied to urban areas, which does not compare to the MDV study area. Second, the aim of many studies [28,29,30,31], was to perform a spatial downscaling of single scenes instead of developing a spatio-temporal downscaling model. Although different points in time were considered in [27], modeling was performed for all points in time separately, which is not an approach that allows for temporal generalization. Where spatio-temporal downscaling was performed, the LST sensors and thus spatial resolutions of input LST, target spatial resolution and downscaling factors (input 4 km, target 1 km and downscaling factor 4 in [70]) differ considerably from this study (input 1 km, target 30 m and downcaling factor 33). And most importantly, the validation methods differ considerably: None of the machine learning based studies employed external test data sets or performed spatial or spatio-temporal validation. e.g., [26,27,28] used random 10-fold CV only. Without spatio-temporal validation the results tend to appear better, but they don’t provide information about the generalizability of the model [69].

5.5. Current Limitations and Future Perspectives of the Downscaled Data Set

In terms of future perspective for an improved version of the downscaled LST product, a nested LST logger network is scheduled for installation in the MDV, which might provide a baseline for training an even finer spatial resolution LST product and also for a calibration of the LST product presented here to ground measurements. Moreover, the mentioned limitation that the model could only be trained on summer scenes might be overcome in the future since the Landsat Science Team just recently approved total darkness acquisitions for this research area. Thus, in following stages, the downscaling model could be extended to also cover the austral winter months and nighttime as well.
There are multiple ways of building upon the results presented here. The impact of weather events such as Foehn winds [71,72] on the MDV environment can be investigated in more detail than previously available data sets allowed. Surface climatology and event based analysis from this data set can assist in understanding intra-valley atmospheric boundary layer dynamics from UAV-based measurements [73] and evaluate mesoscale atmospheric models used in meteorological connectivity for biological applications [74]. Also further crucial environmental variables that are related to the surface energy balance, such as hydrological routing and surface moisture can potentially be derived from this product. These data sets promise to be most relevant for species distribution models for the research area. The 30 m spatial resolution achieved here does of course not provide a directly proportional match for the spatial resolution microorganism species operate on. But as shown in Figure 6, important spatial LST patterns can be rendered at a 30 m resolution, that were previously undetected in high temporal resolution LST data.

6. Conclusions

A methodology to downscale MODIS LST data to arrive at a 30 m data set was presented. The downscaling model is rigorously validated and the expected R 2 of a downscaled scene is 0.78 with a RMSE is 3.32 C. The applicability of the model to the intended spatial and temporal extent under the assumption of the reported performance measures was confirmed. All available MODIS scenes acquired during the austral summer months November to February and daylight conditions from December 1999 (Terra) and May 2002 (Aqua) on can be downscaled using the R package downscaleLST.MDV available on GitHub under https://github.com/MLezamaValdes/downscaleLST.MDV, accessed on 21 October 2021.

Author Contributions

L.-M.L.V. and H.M. conceptualized and designed the research, L.-M.L.V. has carried out the methodology and led the writing with contributions of H.M. and M.K. All authors have read and agreed to the published version of the manuscript.

Funding

This research was partially supported by the New Zealand Antarctic Science Platform (ANTA1801, program: Projecting Ross Sea Region Ecosystem Changes in a Warming World).

Data Availability Statement

Training and validation data generated in this study can be found under DOI 10.17605/OSF.IO/5MH6X.

Acknowledgments

Part of the computations were carried out on the high-performance computing system PALMA II of the University of Münster. We acknowledge support from the Open Access Publication Fund of the University of Münster.

Conflicts of Interest

The authors declare no conflict of interest.

Abbreviations

The following abbreviations are used in this manuscript:
LSTLand Surface Temperature
RFRandom Forest
GBMGradient Boosting Machine
NNNeural Net
CVCross Validation
MDVMcMurdo Dry Valleys
TWITopographic Wetness Index
REMAReference Elevation Model of Antarctica
RAMPRadarsat Antarctic Mapping Project Digital Elevation Model
RMSERoot Mean Square Error
AOAArea of Applicability
FFSForward Feature Selection

References

  1. Zhao, W.; Duan, S.B.; Li, A.; Yin, G. A practical method for reducing terrain effect on land surface temperature using random forest regression. Remote Sens. Environ. 2019, 221, 635–649. [Google Scholar] [CrossRef]
  2. Yu, Y.; Liu, Y.; Yu, P. Land Surface Temperature Product Development for JPSS and GOES-R Missions. In Comprehensive Remote Sensing; Liang, S., Ed.; Elsevier: Amsterdam, The Netherlands, 2018; pp. 284–303. [Google Scholar] [CrossRef]
  3. Avdan, U.; Jovanovska, G. Algorithm for Automated Mapping of Land Surface Temperature Using LANDSAT 8 Satellite Data. J. Sens. 2016, 2016, 1480307. [Google Scholar] [CrossRef] [Green Version]
  4. Li, Z.L.; Tang, B.H.; Wu, H.; Ren, H.; Yan, G.; Wan, Z.; Trigo, I.F.; Sobrino, J.A. Satellite-derived land surface temperature: Current status and perspectives. Remote Sens. Environ. 2013, 131, 14–37. [Google Scholar] [CrossRef] [Green Version]
  5. Dash, P. Land Surface Temperature and Emissivity Retrieval from Satellite Measurements. Ph.D. Thesis, Universität Karlsruhe, Karlsruhe, Germany, 2004. [Google Scholar]
  6. Cammalleri, C.; Vogt, J. On the Role of Land Surface Temperature as Proxy of Soil Moisture Status for Drought Monitoring in Europe. Remote Sens. 2015, 7, 16849–16864. [Google Scholar] [CrossRef] [Green Version]
  7. Lee, J.R.; Raymond, B.; Bracegirdle, T.J.; Chadès, I.; Fuller, R.A.; Shaw, J.D.; Terauds, A. Climate change drives expansion of Antarctic ice-free habitat. Nature 2017, 547, 49. [Google Scholar] [CrossRef] [PubMed]
  8. Chown, S.L.; Clarke, A.; Fraser, C.I.; Cary, S.C.; Moon, K.L.; McGeoch, M.A. The changing form of Antarctic biodiversity. Nature 2015, 522, 431. [Google Scholar] [CrossRef] [PubMed]
  9. Fraser, C.I.; Morrison, A.K.; Hogg, A.M.; Macaya, E.C.; van Sebille, E.; Ryan, P.G.; Padovan, A.; Jack, C.; Valdivia, N.; Waters, J.M. Antarctica’s ecological isolation will be broken by storm-driven dispersal and warming. Nat. Clim. Chang. 2018, 8, 704. [Google Scholar] [CrossRef] [Green Version]
  10. Pattyn, F.; Ritz, C.; Hanna, E.; Asay-Davis, X.; DeConto, R.; Durand, G.; Favier, L.; Fettweis, X.; Goelzer, H.; Golledge, N.R.; et al. The Greenland and Antarctic ice sheets under 1.5 C global warming. Nat. Clim. Chang. 2018, 8, 1053–1061. [Google Scholar] [CrossRef] [Green Version]
  11. Andriuzzi, W.S.; Adams, B.J.; Barrett, J.E.; Virginia, R.A.; Wall, D.H. Observed trends of soil fauna in the Antarctic Dry Valleys: Early signs of shifts predicted under climate change. Ecology 2018, 99, 312–321. [Google Scholar] [CrossRef]
  12. Lee, J.E.; Le Roux, P.C.; Meiklejohn, K.I.; Chown, S.L. Species distribution modelling in low-interaction environments: Insights from a terrestrial Antarctic system. Austral Ecol. 2013, 38, 279–288. [Google Scholar] [CrossRef]
  13. Gooseff, M.N.; Barrett, J.E.; Adams, B.J.; Doran, P.T.; Fountain, A.G.; Lyons, W.B.; McKnight, D.M.; Priscu, J.C.; Sokol, E.R.; Takacs-Vesbach, C.; et al. Decadal ecosystem response to an anomalous melt season in a polar desert in Antarctica. Nat. Ecol. Evol. 2017, 1, 1334–1338. [Google Scholar] [CrossRef]
  14. Kraaijenbrink, P.D.A.; Shea, J.M.; Litt, M.; Steiner, J.F.; Treichler, D.; Koch, I.; Immerzeel, W.W. Mapping Surface Temperatures on a Debris-Covered Glacier With an Unmanned Aerial Vehicle. Front. Earth Sci. 2018, 6, 64. [Google Scholar] [CrossRef] [Green Version]
  15. EROS. Collection-1 Landsat 8 OLI (Operational Land Imager) and TIRS (Thermal Infrared Sensor) Data Products. Available online: https://www.usgs.gov/centers/eros/science/usgs-eros-archive-landsat-archives-landsat-8-oli-operational-land-imager-and?qt-science_center_objects=0#qt-science_center_objects (accessed on 17 November 2021). [CrossRef]
  16. Tang, B.H.; Wang, J. A Physics-Based Method to Retrieve Land Surface Temperature From MODIS Daytime Midinfrared Data. IEEE Trans. Geosci. Remote Sens. 2016, 54, 4672–4679. [Google Scholar] [CrossRef]
  17. Zhan, W.; Chen, Y.; Zhou, J.; Wang, J.; Liu, W.; Voogt, J.; Zhu, X.; Quan, J.; Li, J. Disaggregation of remotely sensed land surface temperature: Literature survey, taxonomy, issues, and caveats. Remote Sens. Environ. 2013, 131, 119–139. [Google Scholar] [CrossRef]
  18. Agam, N.; Kustas, W.P.; Anderson, M.C.; Li, F.; Colaizzi, P.D. Utility of thermal sharpening over Texas high plains irrigated agricultural fields. J. Geophys. Res. 2007, 112, 1–10. [Google Scholar] [CrossRef] [Green Version]
  19. Khandelwal, S.; Goyal, R.; Kaul, N.; Mathew, A. Assessment of land surface temperature variation due to change in elevation of area surrounding Jaipur, India. Egypt. J. Remote Sens. Space Sci. 2018, 21, 87–94. [Google Scholar] [CrossRef]
  20. Stephen, H.; Ahmad, S.; Piechota, T.C. Land Surface Brightness Temperature Modeling Using Solar Insolation. IEEE Trans. Geosci. Remote Sens. 2010, 48, 491–498. [Google Scholar] [CrossRef]
  21. Zakšek, K.; Oštir, K.; Kokalj, Ž. Sky-View Factor as a Relief Visualization Technique. Remote Sens. 2011, 3, 398–415. [Google Scholar] [CrossRef] [Green Version]
  22. Pratt, D.A.; Ellyett, C.D. The thermal inertia approach to mapping of soil moisture and geology. Remote Sens. Environ. 1979, 8, 151–168. [Google Scholar] [CrossRef]
  23. Katurji, M.; Zawar-Reza, P.; Zhong, S. Surface layer response to topographic solar shading in Antarctica’s dry valleys. J. Geophys. Res. Atmos. 2013, 118, 12332–12344. [Google Scholar] [CrossRef]
  24. Stichbury, G.; Brabyn, L.; Allan Green, T.G.; Cary, C. Spatial modelling of wetness for the Antarctic Dry Valleys. Polar Res. 2011, 30, 6330. [Google Scholar] [CrossRef]
  25. Deardorff, J.W. Efficient prediction of ground surface temperature and moisture, with inclusion of a layer of vegetation. J. Geophys. Res. 1978, 83, 1889. [Google Scholar] [CrossRef] [Green Version]
  26. Keramitsoglou, I.; Kiranoudis, C.T.; Weng, Q. Downscaling Geostationary Land Surface Temperature Imagery for Urban Analysis. IEEE Geosci. Remote Sens. Lett. 2013, 10, 1253–1257. [Google Scholar] [CrossRef]
  27. Ebrahimy, H.; Azadbakht, M. Downscaling MODIS land surface temperature over a heterogeneous area: An investigation of machine learning techniques, feature selection, and impacts of mixed pixels. Comput. Geosci. 2019, 124, 93–102. [Google Scholar] [CrossRef]
  28. Hutengs, C.; Vohland, M. Downscaling land surface temperatures at regional scales with random forest regression. Remote Sens. Environ. 2016, 178, 127–141. [Google Scholar] [CrossRef]
  29. Zakšek, K.; Oštir, K. Downscaling land surface temperature for urban heat island diurnal cycle analysis. Remote Sens. Environ. 2012, 117, 114–124. [Google Scholar] [CrossRef]
  30. Stathopoulou, M.; Cartalis, C. Downscaling AVHRR land surface temperatures for improved surface urban heat island intensity estimation. Remote Sens. Environ. 2009, 113, 2592–2605. [Google Scholar] [CrossRef]
  31. Bechtel, B.; Zakšek, K.; Hoshyaripour, G. Downscaling Land Surface Temperature in an Urban Area: A Case Study for Hamburg, Germany. Remote Sens. 2012, 4, 3184–3200. [Google Scholar] [CrossRef] [Green Version]
  32. Doran, P.T.; Priscu, J.C.; Lyons, W.B.; Walsh, J.E.; Fountain, A.G.; McKnight, D.M.; Moorhead, D.L.; Virginia, R.A.; Wall, D.H.; Clow, G.D.; et al. Antarctic climate cooling and terrestrial ecosystem response. Nature 2002, 415, 517. [Google Scholar] [CrossRef]
  33. Cary, C.; Cowan, D.A.; Mcdonald, I. On the rocks: The microbiology of Antarctic dry valley soils. Nat. Rev. Microbiol. 2010, 8, 129–138. [Google Scholar] [CrossRef]
  34. Burkins, M.B.; Virginia, R.A.; Chamberlain, C.P.; Wall, D.H. Origin and distribution of soil organic matter in taylor valley, antarctica. Ecology 2000, 81, 2377–2391. [Google Scholar] [CrossRef]
  35. Virginia, R.A.; Wall, D.H. How Soils Structure Communities in the Antarctic Dry Valleys. BioScience 1999, 49, 973–983. [Google Scholar] [CrossRef]
  36. Yung, C.C.M.; Chan, Y.; Lacap, D.C.; Pérez-Ortega, S.; de Los Rios-Murillo, A.; Lee, C.K.; Cary, S.C.; Pointing, S.B. Characterization of chasmoendolithic community in Miers Valley, McMurdo Dry Valleys, Antarctica. Microb. Ecol. 2014, 68, 351–359. [Google Scholar] [CrossRef] [PubMed]
  37. Levy, J. How big are the McMurdo Dry Valleys? Estimating ice-free area using Landsat image data. Antarct. Sci. 2013, 25, 119–120. [Google Scholar] [CrossRef]
  38. Doran, P.T. Valley floor climate observations from the McMurdo dry valleys, Antarctica, 1986–2000. J. Geophys. Res. 2002, 107, 177. [Google Scholar] [CrossRef] [Green Version]
  39. Bertler, N.A.N. El Niño suppresses Antarctic warming. Geophys. Res. Lett. 2004, 31, 1–4. [Google Scholar] [CrossRef] [Green Version]
  40. R Core Team. R: A Language and Environment for Statistical Computing; R Core Team: Vienna, Austria, 2020. [Google Scholar]
  41. Schwalb-Willmann, J.; Fisser, H. getSpatialData: Get Different Kinds of Freely Available Spatial Datasets. R Package Version 0.1.1. 2020. Available online: http://www.github.com/16eagle/getSpatialData/ (accessed on 21 October 2021).
  42. Greenberg, J.A.; USGS ESPA. Espa.Tools: Wrappers for the USGS ESPA APIs and Earth Explorer; R Package Version 0.65/r35. 2018. Available online: https://R-Forge.R-project.org/projects/espa-tools/ (accessed on 21 October 2021).
  43. USGS. Landsat 8 OLI and TIRS Calibration Notices. 2017. Available online: https://www.usgs.gov/core-science-systems/nli/landsat/landsat-8-oli-and-tirs-calibration-notices (accessed on 17 November 2021).
  44. Wan, Z. MODIS Land-Surface Temperature Algorithm Theoretical Basis Document: Version 3.3. Ph.D. Thesis, Institute for Computational Earth System Science, University of California, Santa Barbara, USA, 1999. [Google Scholar]
  45. Burton-Johnson, A.; Black, M.; Fretwell, P.T.; Kaluza-Gilbert, J. An automated methodology for differentiating rock from snow, clouds and sea in Antarctica from Landsat 8 imagery: A new rock outcrop map and area estimation for the entire Antarctic continent. Cryosphere 2016, 10, 1665–1677. [Google Scholar] [CrossRef] [Green Version]
  46. Kondo, J.; Yamazawa, H. Measurement of snow surface emissivity. Bound.-Layer Meteorol. 1986, 34, 415–416. [Google Scholar] [CrossRef]
  47. Mira, M.; Valor, E.; Boluda, R.; Caselles, V.; Coll, C. Influence of soil water content on the thermal infrared emissivity of bare soils: Implication for land surface temperature determination. J. Geophys. Res. 2007, 112. [Google Scholar] [CrossRef] [Green Version]
  48. Wan, Z. MODIS Land Surface Temperature Products User’s Guide. Available online: https://lpdaac.usgs.gov/documents/118/MOD11_User_Guide_V6.pdf (accessed on 17 November 2021).
  49. Greenberg, J.; Mattiuzzi, M. gdalUtils: Wrappers for the Geospatial Data Abstraction Library (GDAL) Utilities. R Package Version 2.0.3.2. 2020. Available online: https://CRAN.R-project.org/package=gdalUtils (accessed on 21 October 2021).
  50. Wan, Z.; Hook, S.; Hulley, G. MOD11_L2 MODIS/Terra Land Surface Temperature/Emissivity 5-Min L2 Swath 1 km V006. Available online: https://lpdaac.usgs.gov/products/mod11_l2v006/ (accessed on 17 November 2021). [CrossRef]
  51. Wan, Z.; Hoo, S.; Hulley, G. MYD11_L2 MODIS/Aqua Land Surface Temperature/Emissivity 5-Min L2 Swath 1 km V006. Available online: https://lpdaac.usgs.gov/products/myd11_l2v006/ (accessed on 17 November 2021). [CrossRef]
  52. Howat, I.M.; Porter, C.; Smith, B.E.; Noh, M.J.; Morin, P. The Reference Elevation Model of Antarctica. Cryosphere 2019, 13, 665–674. [Google Scholar] [CrossRef] [Green Version]
  53. Liu, H.; Jezek, K.C.; Li, B.; Zhao, Z.; Liu, H. Radarsat Antarctic Mapping Project Digital Elevation Model; Version 2. 2015. Available online: https://nsidc.org/data/NSIDC-0082/versions/2 (accessed on 17 November 2021). [CrossRef]
  54. Bockheim, J.G.; McLeod, M. Soil distribution in the McMurdo Dry Valleys, Antarctica. Geoderma 2008, 144, 43–49. [Google Scholar] [CrossRef]
  55. Kelley, D.; Richards, C. Oce: Analysis of Oceanographic Data. R Package Version 1.2-0. 2020. Available online: https://CRAN.R-project.org/package=oce (accessed on 21 October 2021).
  56. Seyednasrollah, B. Solrad: To Calculate Solar Radiation and Related Variables Based on Location, Time and Topographical Conditions. R Package Version 1.0.0. 2018. Available online: http://doi.org/10.5281/zenodo.1006383 (accessed on 21 October 2021). [CrossRef]
  57. Hijmans, R.J. Raster: Geographic Data Analysis and Modeling. R Package Version 3.4-13. 2020. Available online: https://CRAN.R-project.org/package=raster (accessed on 21 October 2021).
  58. Böhner, J.; Selige, T. Spatial Prediction of Soil Attributes Using Terrain Analysis and Climate Regionalisation. In SAGA—Analysis and Modelling Applications; Böhner, J., McCloy, K.R., Strobl, J., Eds.; Verlag Erich Goltze GmbH: Göttingen, Germany, 2006; Volume 115, pp. 13–27. [Google Scholar]
  59. Meyer, H.; Pebesma, E. Predicting into unknown space? Estimating the area of applicability of spatial prediction models. Methods Ecol. Evol. 2021, 12, 1620–1633. [Google Scholar] [CrossRef]
  60. Meyer, H. CAST: ‘caret’ Applications for Spatial-Temporal Models. R Package Version 0.5.1. 2020. Available online: https://CRAN.R-project.org/package=CAST (accessed on 21 October 2021).
  61. Minasny, B.; McBratney, A.B. A conditioned Latin hypercube method for sampling in the presence of ancillary information. Comput. Geosci. 2006, 32, 1378–1388. [Google Scholar] [CrossRef]
  62. Roudier, P. Clhs: A R Package for Conditioned Latin Hypercube Sampling. R Package. 2011. Available online: https://github.com/pierreroudier/clhs/ (accessed on 21 October 2021).
  63. Meyer, H.; Katurji, M.; Appelhans, T.; Müller, M.; Nauss, T.; Roudier, P.; Zawar-Reza, P. Mapping Daily Air Temperature for Antarctica Based on MODIS LST. Remote Sens. 2016, 8, 732. [Google Scholar] [CrossRef] [Green Version]
  64. Liaw, A.; Wiener, M. Classification and Regression by randomForest. 2002. Available online: https://cran.r-project.org/doc/Rnews/Rnews_2002-3.pdf (accessed on 17 November 2021).
  65. Greenwell, B.; Boehmke, B.; Cunningham, J.; GBM Developers. Gbm: Generalized Boosted Regression Models. R Package Version 2.1.8. 2020. Available online: https://CRAN.R-project.org/package=gbm (accessed on 21 October 2021).
  66. Venables, W.N.; Ripley, B.D. Modern Applied Statistics with S, 4th ed.; Springer: New York, NY, USA, 2002. [Google Scholar]
  67. Kuhn, M. Caret: Classification and Regression Training. R Package Version 6.0-86. 2020. Available online: https://CRAN.R-project.org/package=caret (accessed on 21 October 2021).
  68. Ploton, P.; Mortier, F.; Réjou-Méchain, M.; Barbier, N.; Picard, N.; Rossi, V.; Dormann, C.; Cornu, G.; Viennois, G.; Bayol, N.; et al. Spatial validation reveals poor predictive performance of large-scale ecological mapping models. Nat. Commun. 2020, 11, 4540. [Google Scholar] [CrossRef] [PubMed]
  69. Meyer, H.; Reudenbach, C.; Hengl, T.; Katurji, M.; Nauss, T. Improving performance of spatio-temporal machine learning models using forward feature selection and target-oriented validation. Environ. Model. Softw. 2018, 101, 1–9. [Google Scholar] [CrossRef]
  70. Sismanidis, P.; Keramitsoglou, I.; Bechtel, B.; Kiranoudis, C. Improving the Downscaling of Diurnal Land Surface Temperatures Using the Annual Cycle Parameters as Disaggregation Kernels. Remote Sens. 2017, 9, 23. [Google Scholar] [CrossRef] [Green Version]
  71. Speirs, J.C.; Steinhoff, D.F.; McGowan, H.A.; Bromwich, D.H.; Monaghan, A.J. Foehn Winds in the McMurdo Dry Valleys, Antarctica: The Origin of Extreme Warming Events. J. Clim. 2010, 23, 3577–3598. [Google Scholar] [CrossRef] [Green Version]
  72. Zawar-Reza, P.; Katurji, M.; Soltanzadeh, I.; Dallafior, T.; Zhong, S.; Steinhoff, D.; Storey, B.; Cary, S.C. Pseudovertical Temperature Profiles Give Insight into Winter Evolution of the Atmospheric Boundary Layer over the McMurdo Dry Valleys of Antarctica. J. Appl. Meteorol. Climatol. 2013, 52, 1664–1669. [Google Scholar] [CrossRef] [Green Version]
  73. Cassano, J.J.; Nigro, M.A.; Seefeldt, M.W.; Katurji, M.; Guinn, K.; Williams, G.; DuVivier, A. Antarctic atmospheric boundary layer observations with the Small Unmanned Meteorological Observer (SUMO): Preprint. Earth Syst. Sci. Data 2020, 13, 969–982. [Google Scholar] [CrossRef]
  74. Katurji, M.; Khan, B.; Sprenger, M.; Datta, R.; Joy, K.; Zawar-Reza, P.; Hawes, I. Meteorological Connectivity from Regions of High Biodiversity within the McMurdo Dry Valleys of Antarctica. J. Appl. Meteorol. Climatol. 2019, 58, 2437–2452. [Google Scholar] [CrossRef]
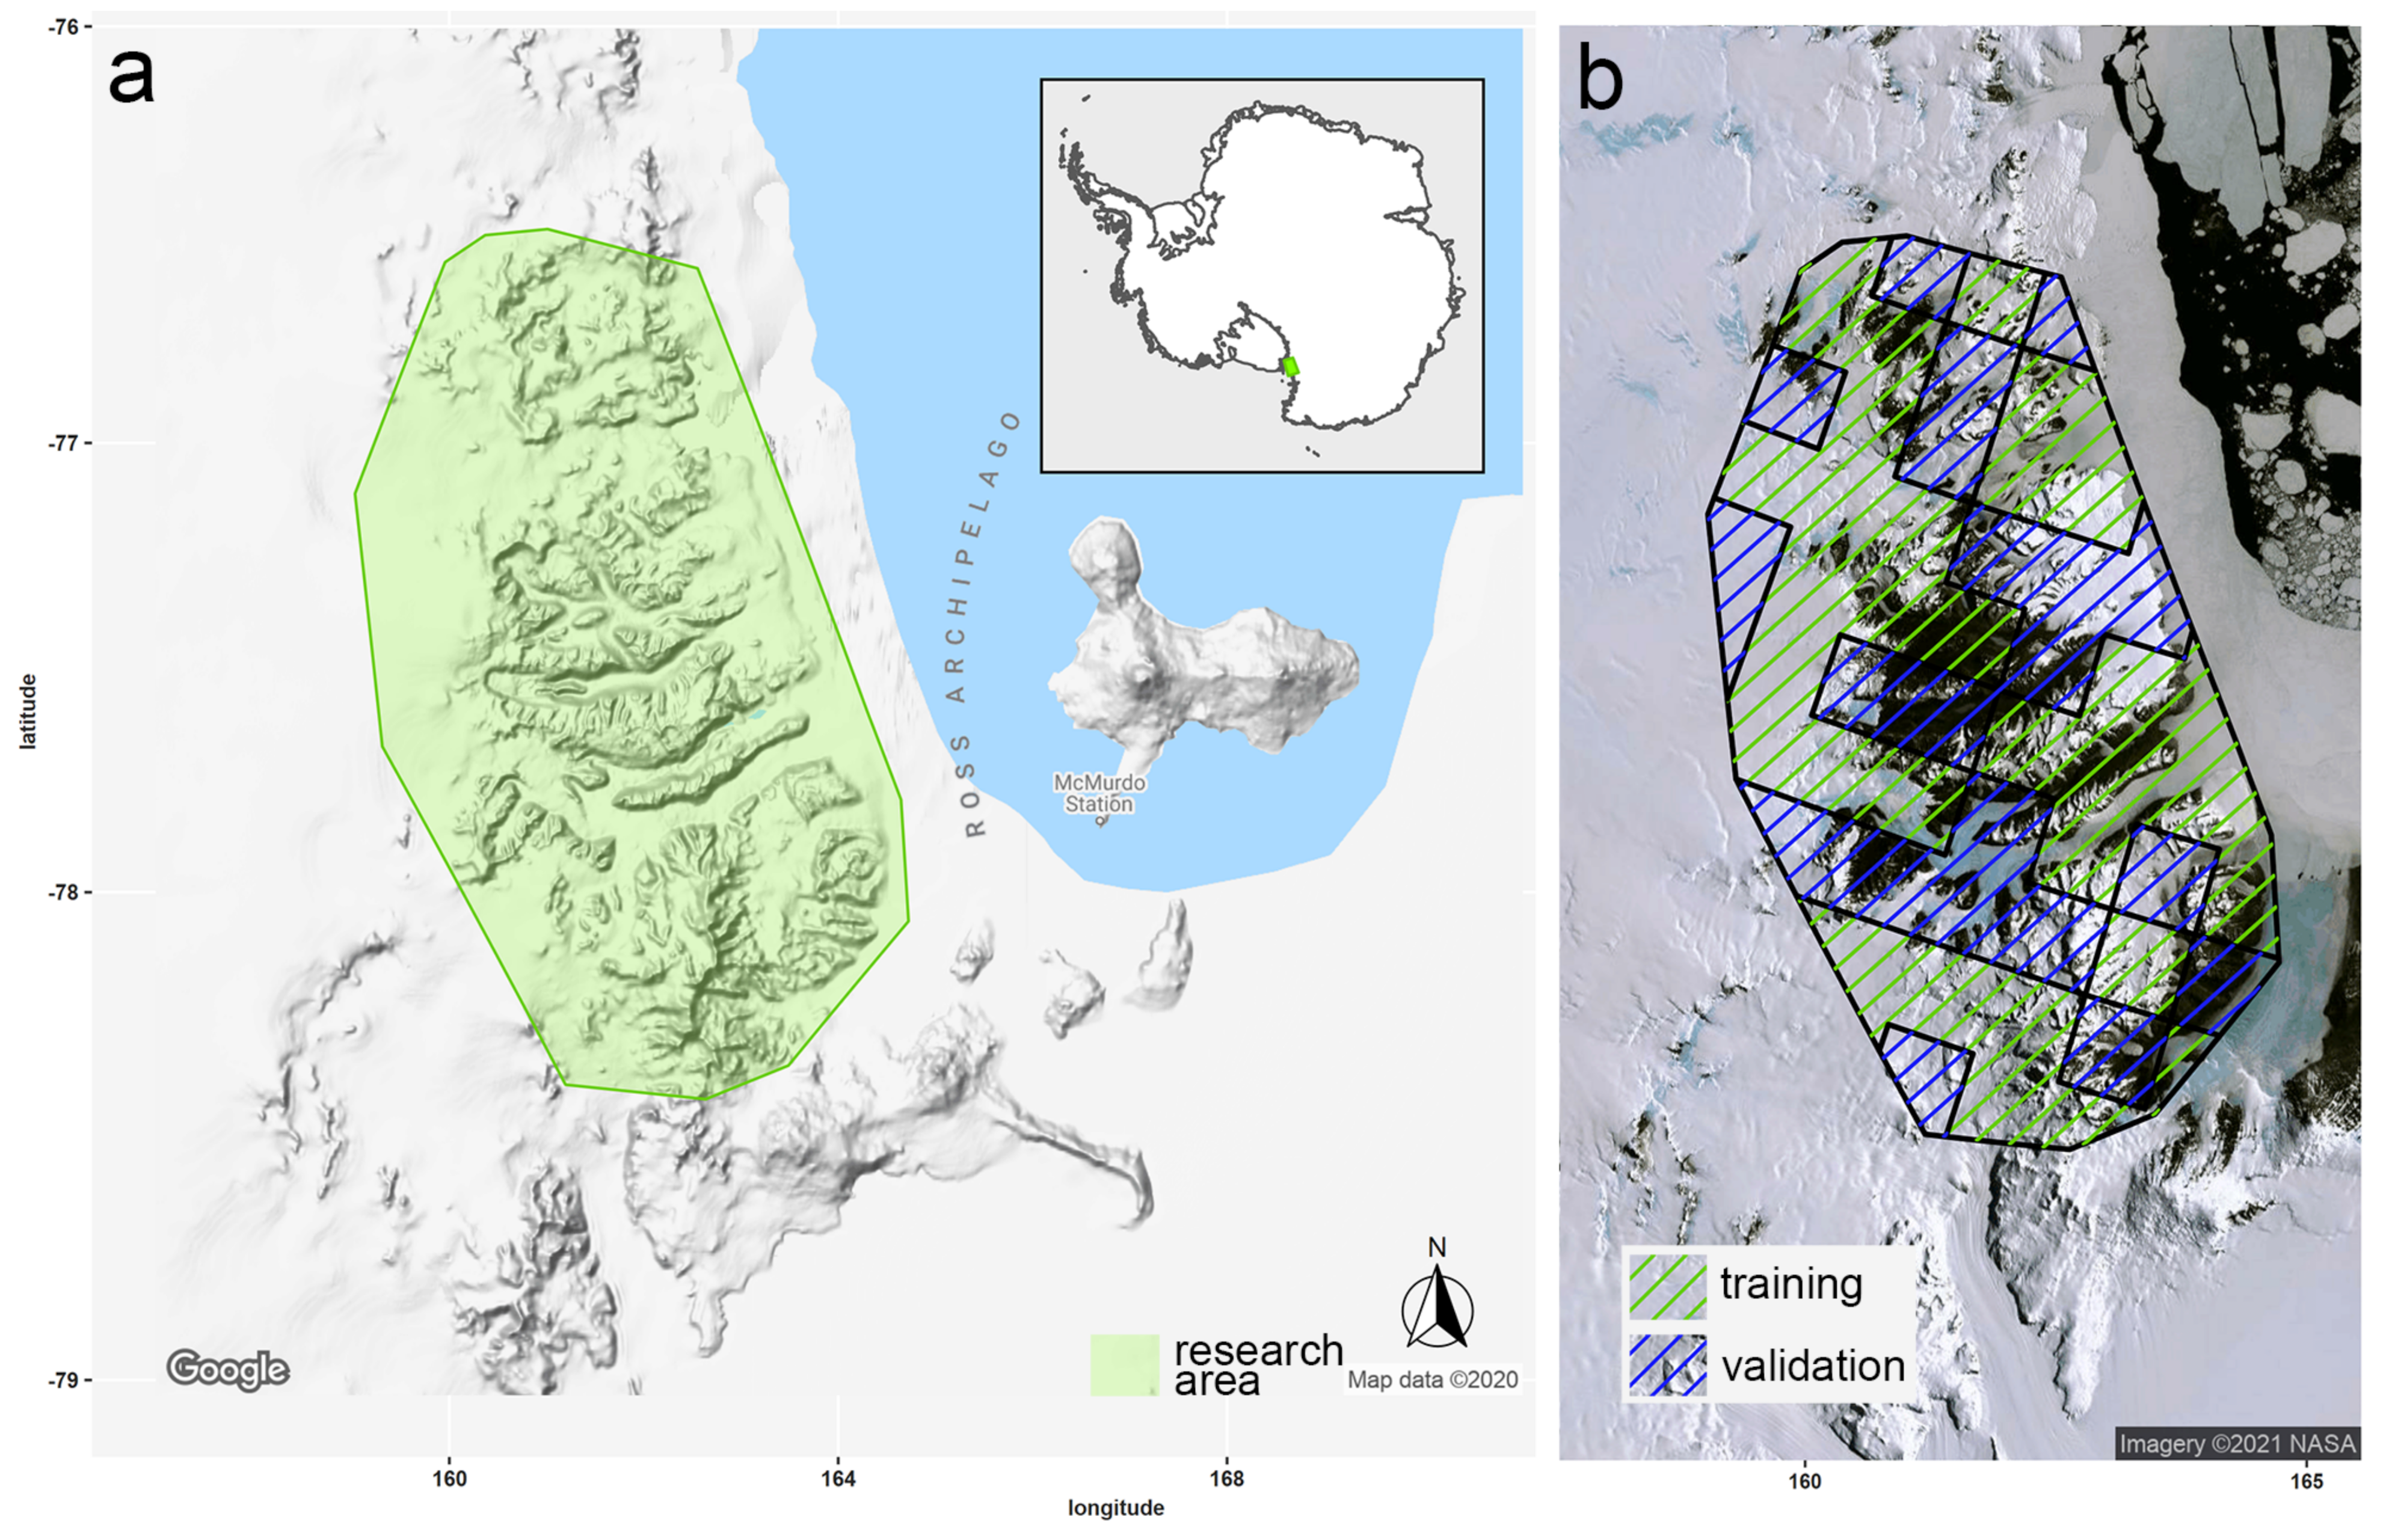
Figure 1. Location of the research Area McMurdo Dry Valleys (a) in Antarctica and (b) areas used to train (green polygon) and validate (blue polygon) the downscaling model.
Remotesensing 13 04673 g001
Figure 2. Amount of closely matching MODIS and Landsat 8 scenes by month as well as months selected for training vs. temporal external validation. Training months n = 10, validation months n = 5.
Remotesensing 13 04673 g002
Figure 3. Schematic representation of training and validation data sets. Green boxes indicate months that went into training, blue boxes indicate months that were used for temporal external validation. The green and blue areas within the map represent the training and validation areas, respectively.
Remotesensing 13 04673 g003
Figure 4. Variable distribution of training and validation data sets for (a) to be downscaled MODIS and response variable Landsat LST and predictor variables (b) incidence angle, (c) hillshading, (d) elevation, (e) TWI, (f) landcover type, (g) soil type as documented in [54], (h) aspect and (i) slope.
Remotesensing 13 04673 g004
Figure 5. External model evaluation for the selected final model using (a) spatially unknown data, (b) temporally unknown data and (c) spatio-temporally unknown data. The scale shows the count of data points per bin (size = 300). Sample sizes are less than 150,000 for validations (a,c) because rare soil types 3 and 19 were not present in the training area.
Remotesensing 13 04673 g005
Figure 6. Comparison of original MODIS LST, downscaled LST and high resolution reference LST data from Landsat 8 (in C) and the LST prediction error, i.e., the difference between the downscaled and the reference scene (in the columns from left to right) in a MODIS scene from Aqua from the 12 November 2018, 13:50 UTC, 2:50 am NZDT with a solar altitude of 29.99 and azimuth of 4.98 . The corresponding Landsat scene was captured 11 min after MODIS at 14:01 UTC. (a) full area of interest and the extents of figures (b,c) as blue (b) and green boxes (c). White areas indicate that data was not available and grey areas indicate that the sample was outside of the AOA.
Remotesensing 13 04673 g006
Figure 7. Variable importance of the downscaling model, in percent.
Remotesensing 13 04673 g007
Figure 8. Observed and predicted LST in dark and light grey violin plots for all training and validation samples. Residuals (observed-predicted LST values) in red boxplots (a) by month and (b) by land cover type.
Remotesensing 13 04673 g008
Table 1. Overview of the predictor variables.
Predictor VariableConnection to
High Resolution LST
Original Spatial
Resolution (m)
Temporal
Resolution
Source
MODIS LSTvariable to be downscaled1000subdaily[50,51]
DEMmeteorological lapse8 (200 for filling NA)staticREMA [52] & RAMP [53]
incidence anglesolar insolation8subdailyDEM + MODIS capturing time
hillshadingdirect or diffuse solar insolation8subdailyDEM + MODIS capturing time
slopepossibility for water accumulation8staticDEM
aspectdirect or diffuse insolation for different periods of time per day8staticDEM
land surface typealbedo30staticLandsat classification [45]
soil mapwater retention capacity of soil types and albedofrom vectorstaticLandcare Research [54]
TWIwater content affects LST, TWI proxi for hydrologic routing8staticDEM via SAGA TWI algorithm
Terra/AquaAcquisitions from Terra are temporally further apart from the response variablewhole scenespatial constant per sceneMODIS filename
Table 2. Algorithms and tuning.
Algorithm
(Caret Method)
HyperparameterTested Value Final ModelOptimal Value Final Model
Random Forest
(rf)
mtry2 to 4 with increment 12
Gradient Boosting
(gbm)
number of trees
max depth of interactions
shrinkage
min observations in terminal nodes
100 to 500 with increment 100
3 to 14 with increment 2
0.01, 0.05, 0.1
10
500
3
0.01
10
Artificial Neural Net
(nnet)
size
decay
1, 2, 3, 5, 10, 20
0.5, 0.1, 1 × 10 2 bis 1 × 10 7
20
0.0001
Table 3. Performance of the final models as R 2 and RMSE for each of the three algorithms RF, NN and GBM with respect to the three external validation sets.
SpatialTemporalSpatio-Temporal
R 2 RMSER 2 RMSER 2 RMSE
RF0.832.990.803.240.783.32
NN0.83.260.753.690.733.74
GBM0.733.680.723.700.73.58
Publisher’s Note: MDPI stays neutral with regard to jurisdictional claims in published maps and institutional affiliations.