Article

Improved Oriented Object Detection in Remote Sensing Images Based on a Three-Point Regression Method

1
SNARS Laboratory, School of Instrumentation and Optoelectronic Engineering, Beihang University, Beijing 100191, China
2
Beijing System Design Institute of Electro-Mechanic Engineering, Beijing 100811, China
3
Qian Xuesen Laboratory of Space Technology, Beijing 100094, China
*
Author to whom correspondence should be addressed.
Remote Sens. 2021, 13(22), 4517; https://doi.org/10.3390/rs13224517
Submission received: 20 September 2021 / Revised: 2 November 2021 / Accepted: 8 November 2021 / Published: 10 November 2021

Abstract

:
Object detection in remote sensing images plays an important role in both military and civilian remote sensing applications. Objects in remote sensing images are different from those in natural images. They have the characteristics of scale diversity, arbitrary directivity, and dense arrangement, which causes difficulties in object detection. For objects with a large aspect ratio and that are oblique and densely arranged, using an oriented bounding box can help to avoid deleting some correct detection bounding boxes by mistake. The classic rotational region convolutional neural network (R2CNN) has advantages for text detection. However, R2CNN has poor performance in the detection of slender objects with arbitrary directivity in remote sensing images, and its fault tolerance rate is low. In order to solve this problem, this paper proposes an improved R2CNN based on a double detection head structure and a three-point regression method, namely, TPR-R2CNN. The proposed network modifies the original R2CNN network structure by applying a double fully connected (2-fc) detection head and classification fusion. One detection head is for classification and horizontal bounding box regression, the other is for classification and oriented bounding box regression. The three-point regression method (TPR) is proposed for oriented bounding box regression, which determines the positions of the oriented bounding box by regressing the coordinates of the center point and the first two vertices. The proposed network was validated on the DOTA-v1.5 and HRSC2016 datasets, and it achieved a mean average precision (mAP) of 3.90% and 15.27%, respectively, from feature pyramid network (FPN) baselines with a ResNet-50 backbone.

1. Introduction

Object detection of remote sensing images plays an important role in military and national defense. With object detection techniques, the categories and positions of military objects can be obtained, and the battlefield situation and environment can be evaluated. Since the 1990s, remote sensing image object detection has also played an important role in civilian fields, such as the detection of vehicles and buildings, serving urban road planning, parking lot site selection, and traffic management.
Convolutional neural networks have moved object detection to a new level. Since traditional object detection methods perform badly both in detection precision and rate, researchers have begun to study object detection methods based on deep learning. The core of deep learning-based object detection methods is the convolutional neural network. Compared with traditional feature extraction methods, convolutional neural networks have unique characteristics of weight sharing, local connection, and down-sampling. These decrease the number of parameters and perform well in feature extraction. Commonly used feature extraction networks include VGG-16 [1], GoogleNet [2], and AlexNet [3]. With the advent of the residual block, deeper convolutional networks have emerged, such as ResNet [4] and DenseNet [5]. Deep networks can extract features with more semantic information, and ResNet is well known in the object detection field.
The network used in the object detection method based on deep learning can be divided into a single-stage detection method and two-stage detection method, according to different implementation methods. The two-stage detection method, which is based on area recommendation, first extracts some regions of interest (RoIs) that may contain objects, and then classifies and regresses bounding boxes. The precision is higher than that of the single-stage method, but the detection rate is lower. The first proposed two-stage detection network was the Region-based Convolutional Neural Network (R-CNN) [6]. Based on R-CNN, more typical area-based object detection networks have been proposed, including Fast R-CNN [7], Faster R-CNN [8], R-FCN [9], Mask R-CNN [10], and Cascade R-CNN [11].
The single-stage methods are based on regression and classification. They generate a series of bounding boxes at various positions on the image, and predict and classify them, without generating RoIs in advance [12,13,14]. Typical regression-based object detection networks mainly include YOLO (You Only Look Once) [15], SSD (Single Shot Multi-Box Detector) [16], and RetinaNet [17]. Based on the YOLO network, the extended object detection networks include YOLOv2 [18] and YOLOv3 [19]. The improved networks based on SSD are DSOD [20], RFBNet [21], ASSD [22], etc. In addition, G-CNN [23] and AttentionNet [24] are also commonly used single-stage object detection networks.
However, compared to objects of natural images, objects of remote sensing images have greater scale diversity, arbitrary directivity, and dense arrangement. In response to these problems, predecessors used methods of feature fusion, extracting rotation invariant features, using oriented detection bounding boxes, designing double detection heads, and so on, to reconstruct the prior network model.
To detect scale diversity objects, in 2016, Lin et al. proposed the classic feature pyramid network (FPN) [25]. An FPN provides more feature maps for objects with various scales by feature fusion. Based on the FPN, more networks were proposed by reconstruction. In 2019, Chen et al. proposed the scene-contextual feature pyramid network (SCFPN), which detected objects by fusing the whole image’s feature map with the proposal box’s feature [26]. In 2020, Qian et al. proposed a remote sensing image object detection method based on multilevel feature fusion [27].
For the arbitrary directivity problem, some researchers tried to design rotated anchors in a region proposal network (RPN) and extract rotation invariant features. In 2018, Li et al. proposed a contextual feature fusion network with rotation invariance [28]. By generating multiscale anchor frames based on RPN, multiangle anchor frames were added to detect oriented objects. In 2020, Zhang et al. proposed a double network [29], which contained multiple CNN channels, where each channel was responsible for a specific rotation direction. However, designed anchors cannot involve all angles, and many anchors need too much calculation, which leads to a low detection rate. Other researchers began to improve the method by changing the regression method or turning the regression problem into a classification problem. In 2019, Ding et al. proposed an RoI converter to achieve oriented object detection [30]. By converting the horizontal region of interest (HRoI) into a rotated region of interest (RRoI), based on the RRoIs, a rotational position-sensitive RoI Align module was proposed. It was used to extract rotation-invariant features. In August 2019, Yang et al. proposed a novel multiclass oriented detector SCRDet (small, cluttered, and rotated detector) [31], which was suitable for detection of small, dense, and rotating objects. In 2020, Fu et al. built a fused framework based on a two-stage convolutional neural network for arbitrary directions and multiscale object detection in remote sensing images [32]. In this paper, a rotation-aware object detector is constructed, which uses an oriented frame to locate objects in remote sensing images. In 2021, Xu et al. proposed a simple and effective framework to detect directional objects [33]. The network used Faster R-CNN as the backbone network and realized oriented bounding box detection by regressing four sliding offsets and a tilt factor. In 2021, Yang et al. proposed an end-to-end refined single-stage rotation detector, R3Det [34], to quickly and accurately locate objects. In the text detection field, the rotational region convolutional neural network (R2CNN) is an effective and simple network [35].
Previous studies have found that the features of interest are different for classification tasks and localization tasks. Therefore, predecessors solved this problem by assigning different detection heads to the different tasks. In 2020, Wu et al. proposed a double head structure [36], which used a fully connected head for the classification task and a convolutional head for the localization task. The convolutional head was made of one residual block, some bottleneck blocks [4], and the same number of nonlocal blocks [37]. In this paper, the authors also fused the classification scores from double heads. Song et al. proposed a simple operator called task-aware spatial disentanglement (TSD) [38]. TSD decouples classification and regression from the spatial dimension by generating two disentangled proposals for them, which are estimated by the shared proposal.
In our experiments, we validated that the R2CNN network cannot perform well for slender objects with arbitrary directivity. Furthermore, the convolutional head requires calculation and leads to a low detection rate. Moreover, it is difficult to train. Therefore, this paper proposes a simple and effective network for oriented object detection in remote sensing images, namely TPR-R2CNN, which is based on a double fully connected head structure and a three-point regression method. The proposed TPR-R2CNN network applies a double fully connected head for classification and localization. One head is followed by a classification layer and a horizontal bounding box regression layer, and the other is followed by a classification layer and an oriented bounding box regression layer. The three-point regression method is used in the oriented bounding box regression layer, which is a fully connected layer, to regress the center point’s coordinate and two vertices’ coordinates of the bounding box. The main contributions of this paper are as follows:
(1)
The paper applies a double fully connected head with classification fusion, one for classification and horizontal bounding box regression tasks, the other for classification and oriented bounding box regression tasks. The outputs of the two classification layers are fused as the final classification score.
(2)
The paper proposes a three-point regression method (TPR) to enhance the detection precision for remote sensing objects, which are slender and have arbitrary directions. The new regression method increases the fault tolerance rate of the detection network.
We performed comparative experiments to validate the proposed method. Extensive experimental results from the DOTA-v1.5 and HRSC2016 datasets showed better performance of our detector than the regression method of the R2CNN network. The paper is organized as follows.
In Section 2, we detail the proposed method, including the backbone, the basic algorithm of TPR, the structure of the double detection head, and the new loss function based on TPR. In Section 3, we detail the experiments, including the introduction and preprocessing of the DOTA-v1.5 and HRSC2016 datasets, the evaluation metrics, and the parameter settings in the training process. Section 4 presents the results of our method compared to R2CNN and analyzes the results on two datasets. Finally, we discuss the limitations of the proposed method and suggest future research directions. Section 5 concludes the paper.

2. Proposed Method

The basic network structure diagram of the proposed TPR-R2CNN is shown in Figure 1. An oriented box regression layer was set parallel to the classification layer and the horizontal box regression layer. A double head structure was used in the detection stage. The double fully connected head was made of two single fully connected heads, one of which was followed by a classification layer and the horizontal bounding box regression layer, while the other was followed by a classification layer and oriented box regression layer. The outputs of these classification layers were added together as the final result, which was then put into the Softmax function to calculate the scores. The structures of different detection heads will be explained in detail in Section 2.3.
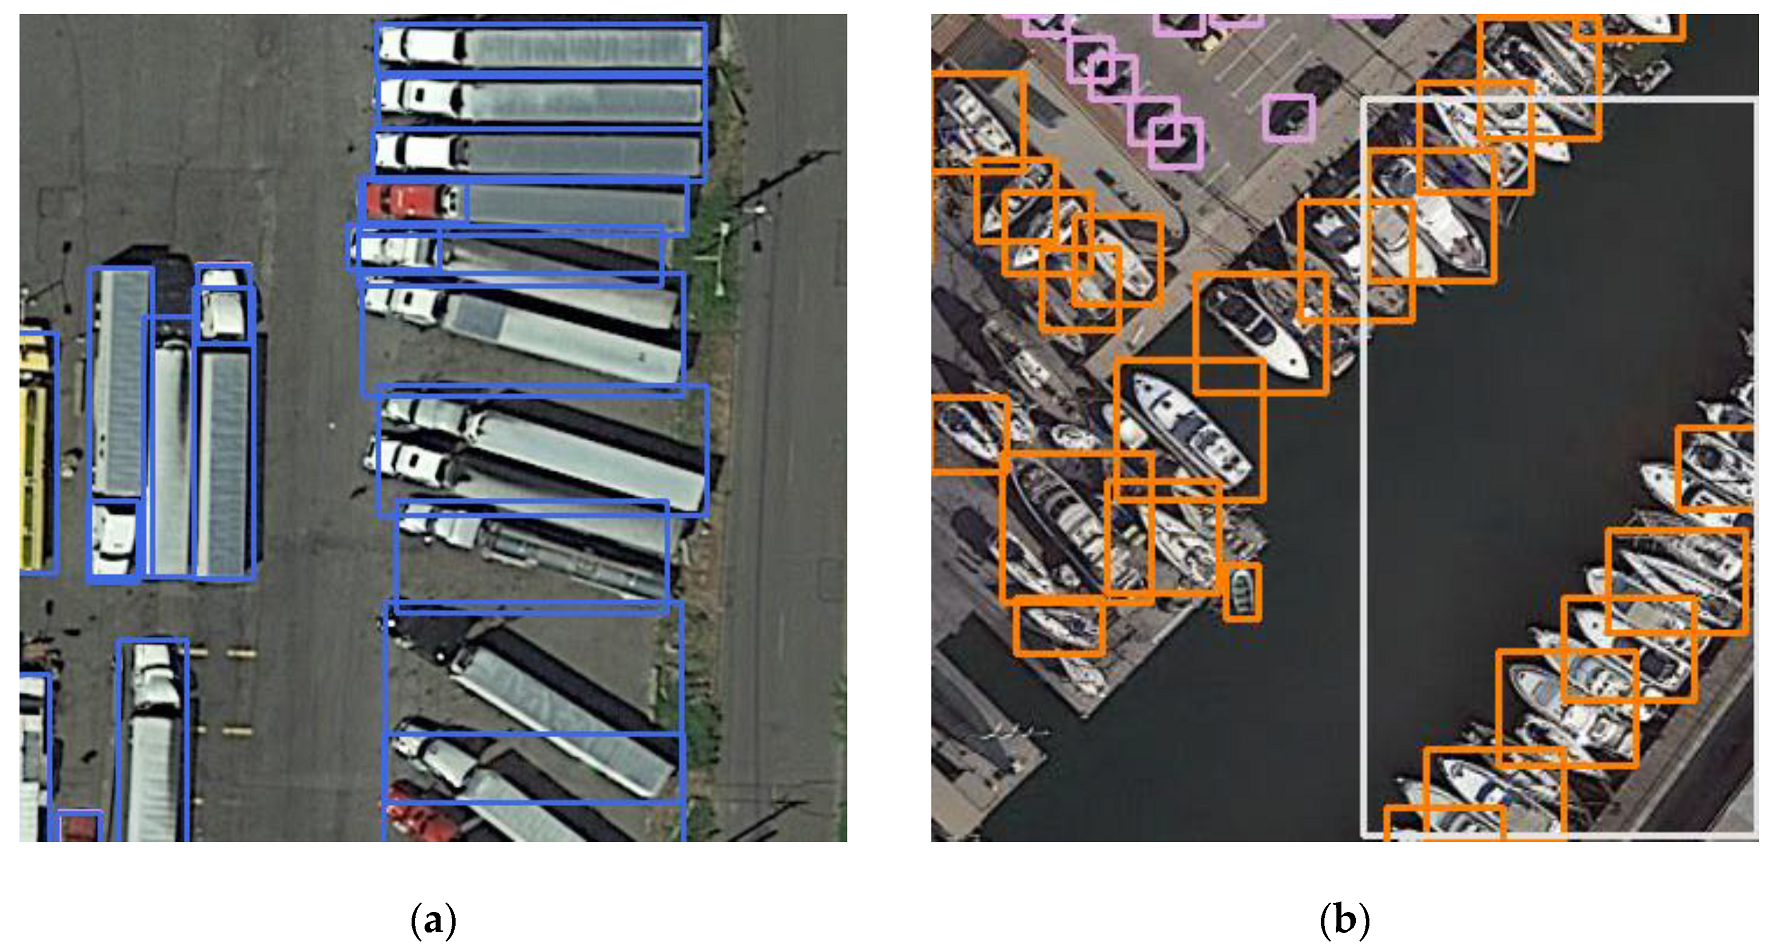
We proposed this detection method because using a horizontal box for detection has certain drawbacks. A horizontal box contains some redundant information for oblique objects, and it cannot accurately represent the position of all kinds of objects. In the final non-maximum suppression (NMS) stage, for slender and densely arranged objects with arbitrary directivity, such as vehicles and ships, the correct bounding boxes may be deleted by mistake. This will result in a decrease in detection precision. As shown in Figure 2, due to the influence of non-maximum suppression, the detection results miss some correct objects. Using an oriented bounding box for detection is an effective way to solve the problem.
In order to realize object detection with an oriented bounding box, researchers added some rotated anchor frames in the RPN stage. However, a large number of anchor frames caused a sharp increase in the amount of calculation and introduced difficulties in training and detecting. Then, researchers began to use the regression method for oriented object detection with oriented bounding boxes. R2CNN [35] is an effective network for text detection. However, the regression method cannot perform very well in remote sensing object detection, especially for slender objects with arbitrary directions. Through our experiments, we showed that the problem was mainly caused by the original regression method, which is explained in detail in Section 2.2.

2.1. Backbone

The oriented object detection network frame was based on the Faster R-CNN network. The backbone used in this research was ResNet-50 [4] with FPN [25]. The focus of the ResNet network is to propose a residual module, which can solve the problems of gradient disappearance and gradient explosion in ultra-deep networks. In addition, the ResNet network uses batch normalization (BN) instead of dropout, which speeds up the network training process.
As remote sensing objects have the characteristics of scale diversity, FPN was used in the network. Figure 3 shows the basic structure of the FPN network, which mainly included three parts: a bottom-up feature extraction network, a top-down reconstruction of the feature pyramid path, and a horizontal feature connection path.
The bottom-up network produced feature maps of different sizes and levels. The low-level feature maps had higher resolution but contained low-level semantic information, and the high-level feature maps contained more abstract high-level features but lost resolution. The top-down path reconstructed larger feature maps by up-sampling. In the horizontal connection stage, the original feature map was operated by a 1×1 convolution layer, which could unify the number of feature map channels. Then, the feature map was added by element with the previous fused feature map, and the new fused feature map was obtained.
In this way, the fused feature maps P 0 , P 1 , P 2 , P 3 both had high resolution and deep semantic information to a certain extent. In the anchor setting, P 0 , P 1 , P 2 , P 3 correspond to the anchor scales of 32 2 , 64 2 , 128 2 , 256 2 , respectively. The corresponding level of feature map k is calculated by Equation (1):
k   =   k 0   +   log 2 w h / 224 ,
where k 0 is 4 and w and h are the width and height of the proposal, respectively.

2.2. Three-Point Regression

Based on the original Faster R-CNN network structure, this paper added an oriented bounding box regression layer in parallel to the final prediction layers. This oriented bounding box regression layer predicted the position offset information of the proposed horizontal boxes. The proposed network contained the regression layer of the horizontal box, because the authors of R2CNN [35] pointed out that the existence of the horizontal bounding box regression layer can help improve detection precision. In the detection stage, the horizontal bounding box NMS processing was changed to oriented bounding box NMS processing, and the IoU threshold was set to 0.3.
Specifically, in the oriented bounding box regression stage, the R2CNN network predicted the coordinate offsets of the first two points (upper left corner and upper right corner) and the height of the oriented bounding box. This was effective for text detection with a small angle of tilt. However, objects of remote sensing images are often accompanied by large rotation angles, and the directions are arbitrary. For these objects, this method of regression had a low error tolerance rate in the detection stage.
On the one hand, even if the predicted two vertices were only slightly different from the vertices of the ground truth, the other two points’ coordinates could be quite different from the true value. That is because they rely on the rotated angle of the oriented box, the predicted vertices’ coordinates, and the height of the object. When the object has a large aspect ratio in shape, the greater height and a small angle deviation will cause a large deviation to the other two vertices. Hence, the predicted bounding box would probably be deleted. Table 1 shows the IoUs of frames with different aspect ratios under various angles. When the aspect ratio reaches 4:1, the predicted bounding box will be deleted if the angle deviation is more than 10 degrees. As the aspect ratio increases, there are higher requirements for the positioning precision of the first two vertices.
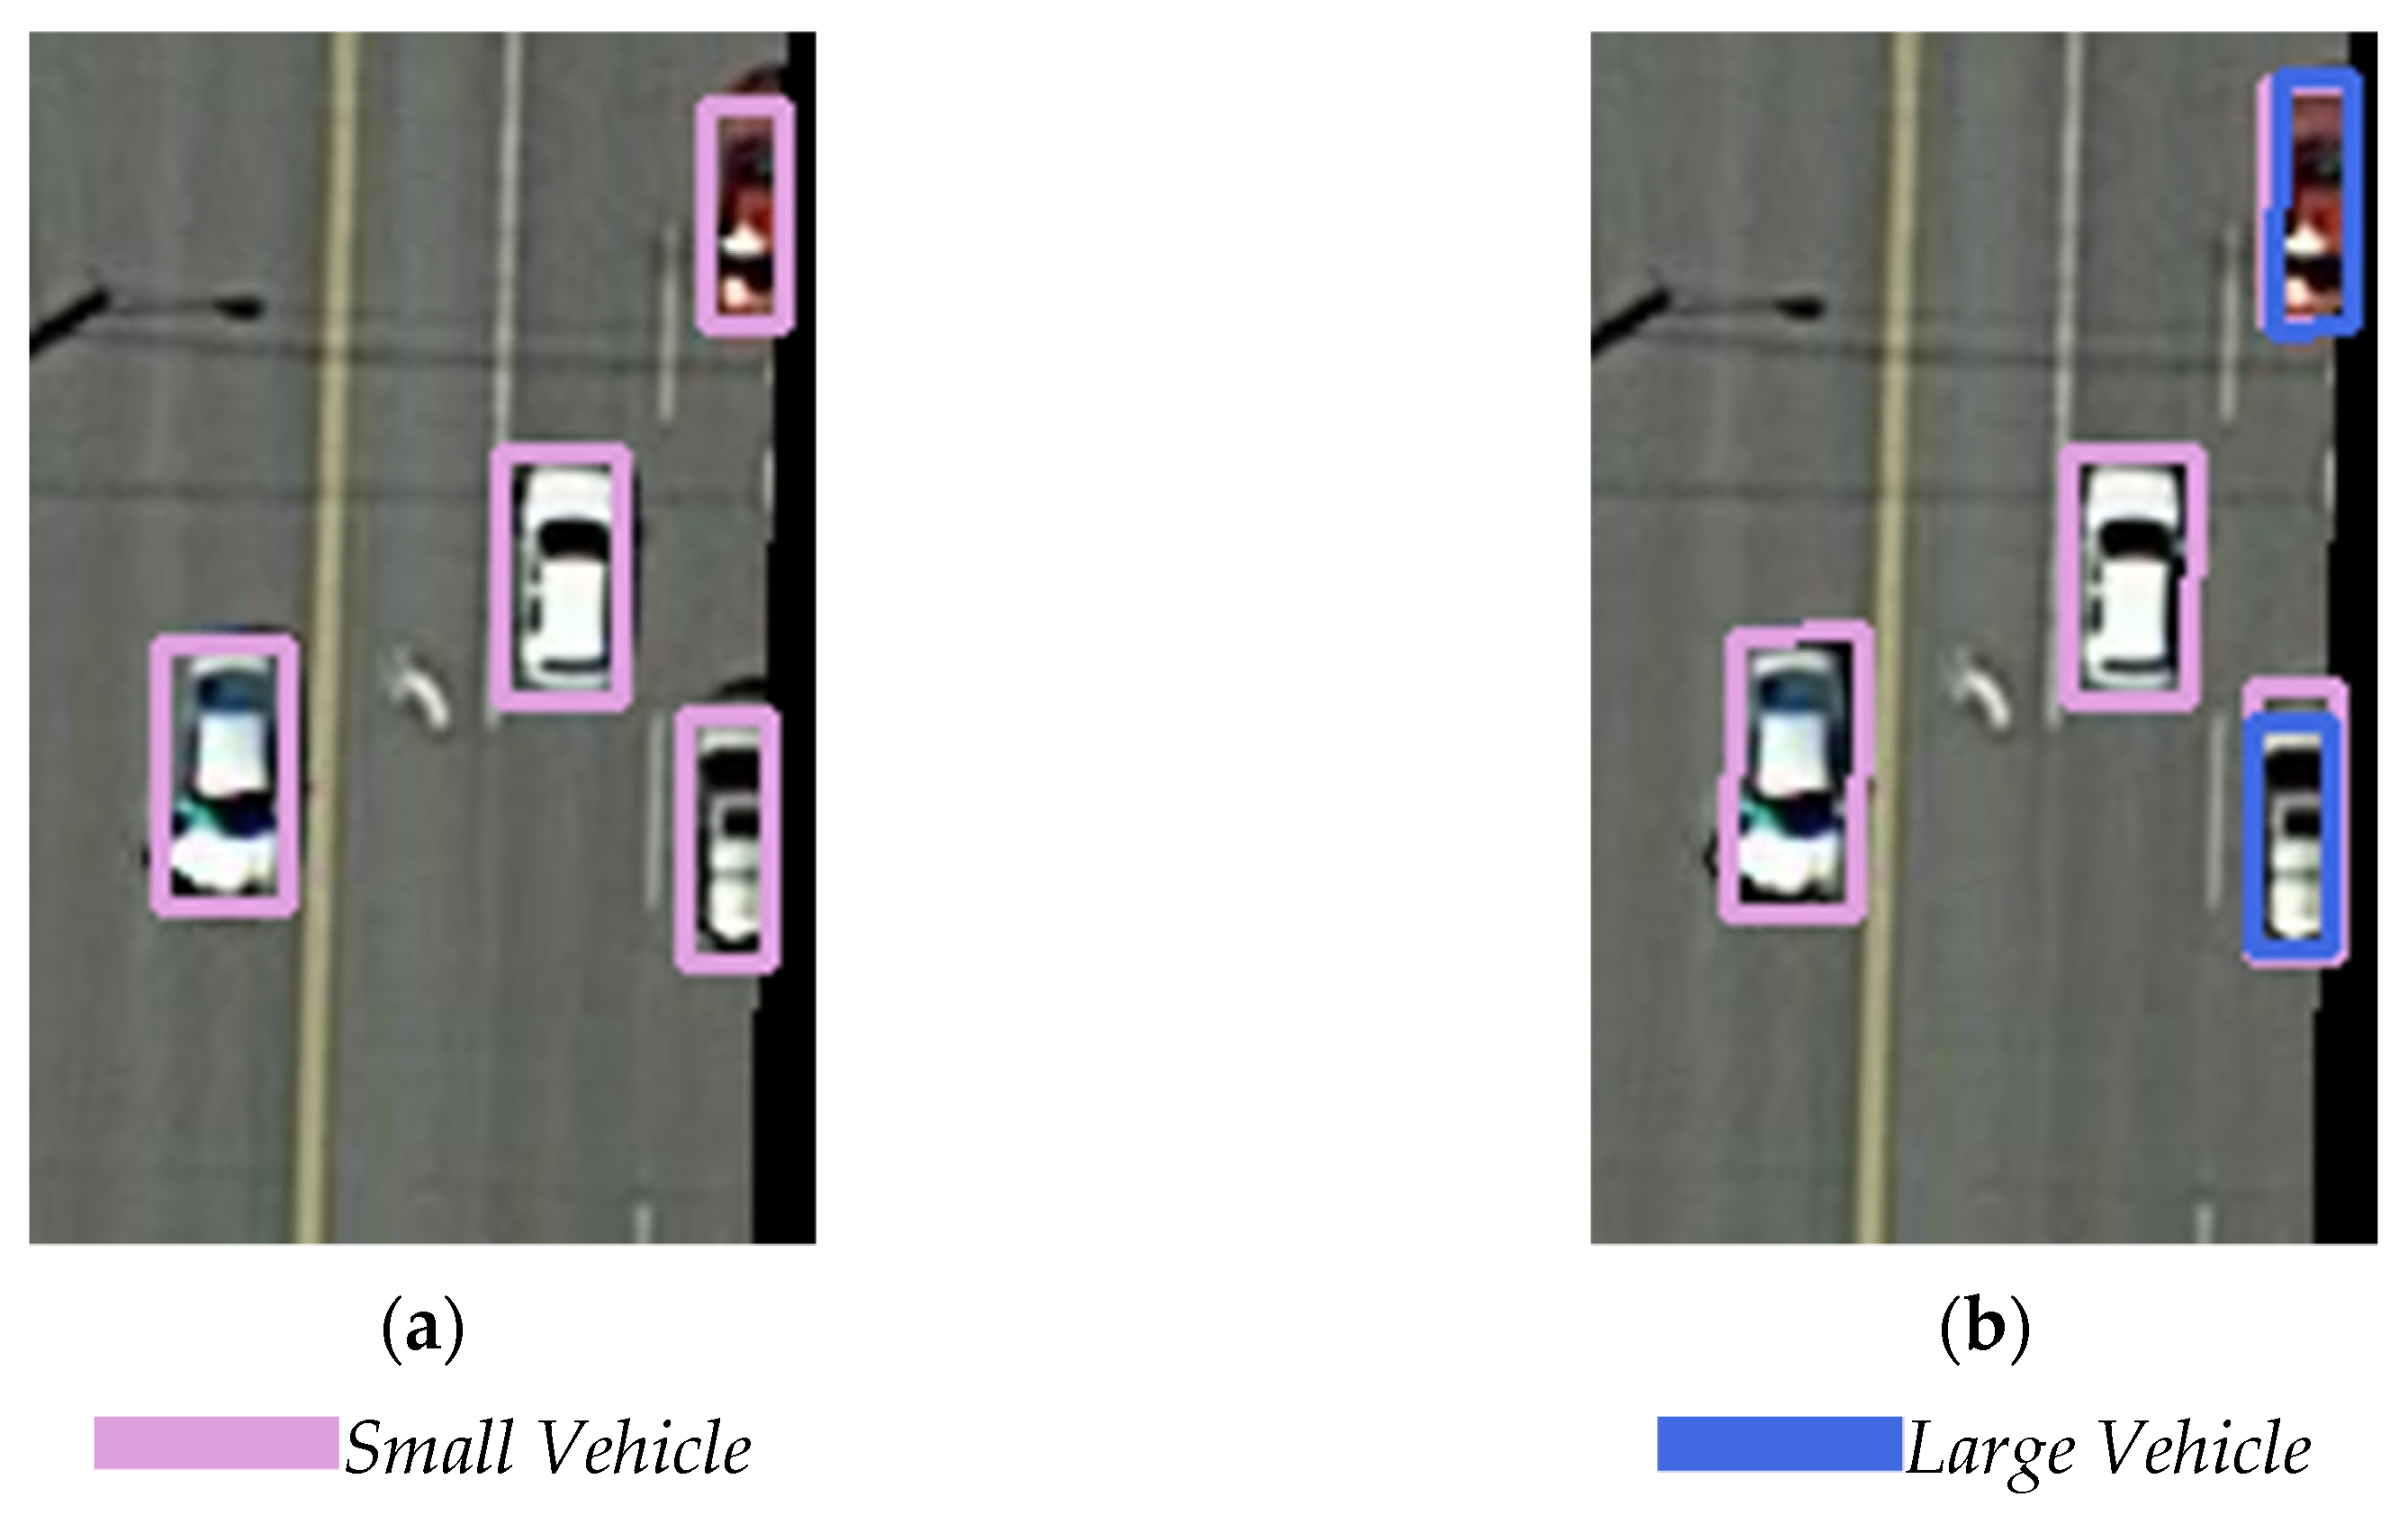
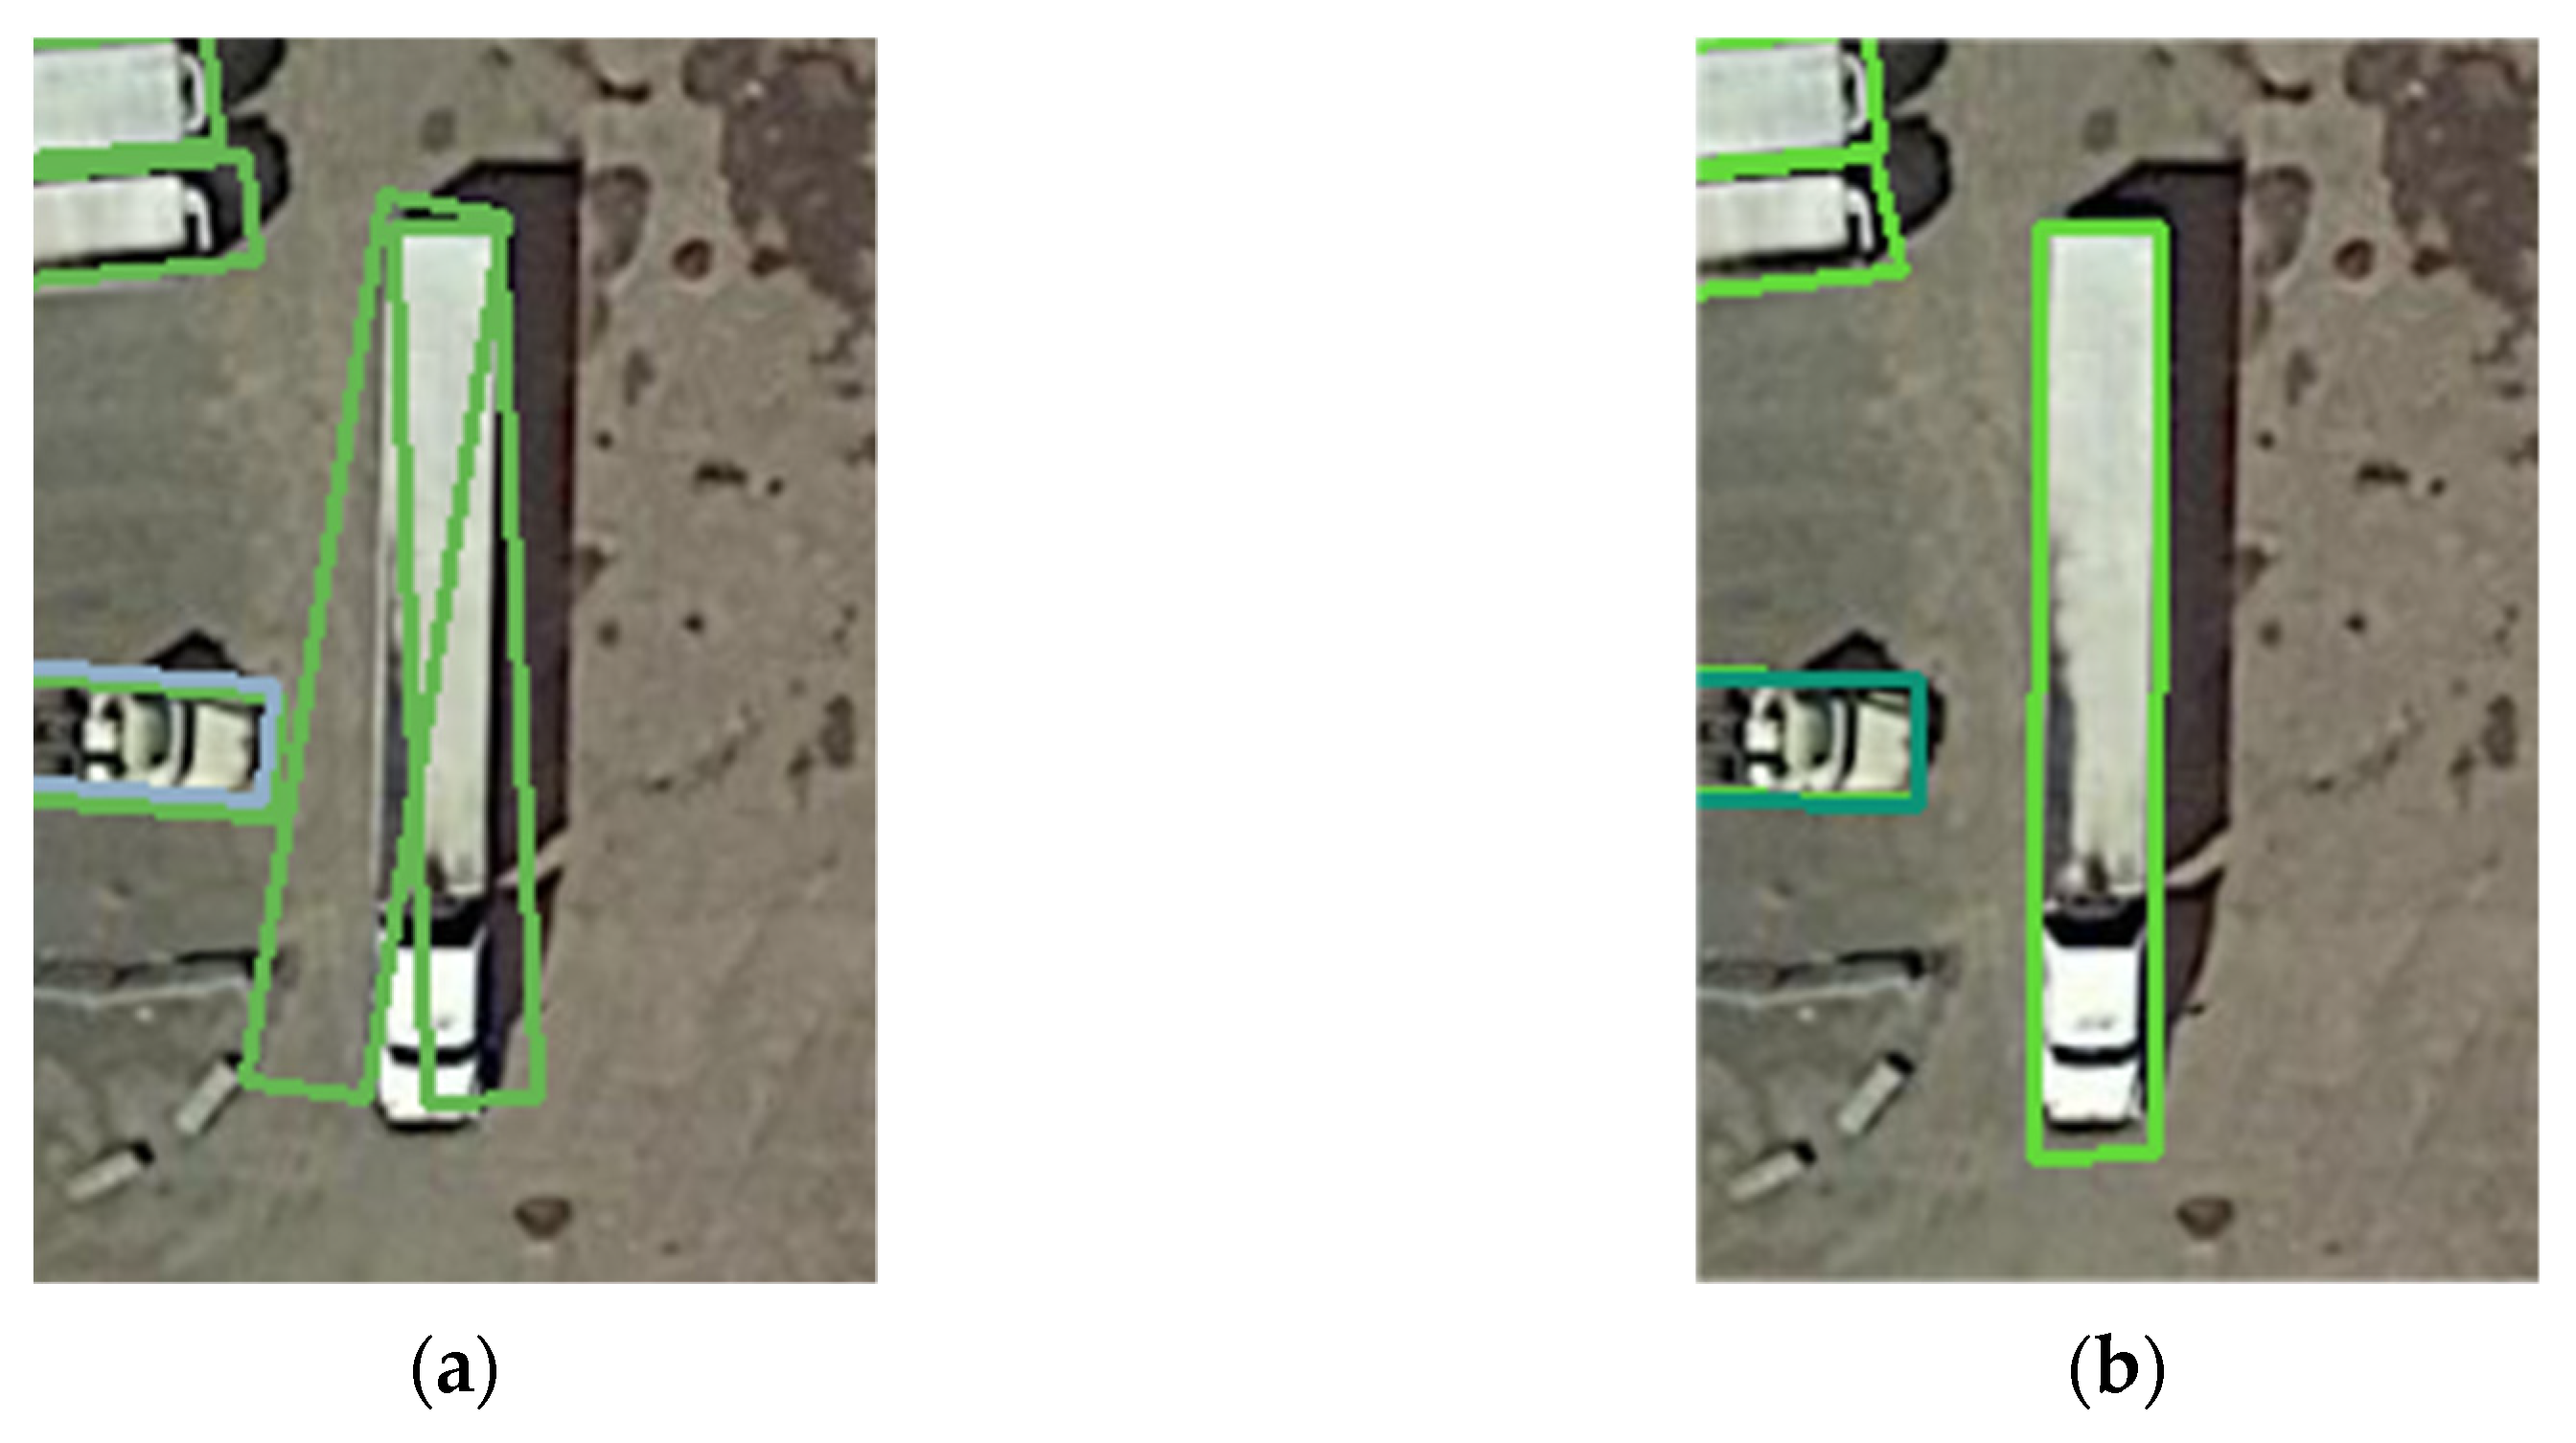
On the other hand, in some cases, the network may generate several predicted bounding boxes at various directions for one ground truth. The IoUs between them and the ground truth all reached 0.5, while the IoU values between some of them could not reach the 0.3 threshold, and then there was not one predicted bounding box generated for one object, thus decreasing the detection precision. This situation is shown in Figure 4. Figure 4a shows the detection result of R2CNN. For the same large vehicle object, two detection bounding boxes were generated, one of which was closer to the ground truth. The IoU value did not reach the threshold of 0.3, so the relatively incorrect predicted bounding box was not deleted.
In order to resolve this problem, we modified the original regression method by regressing the coordinates of the first two vertices and the coordinates of the center points. The coordinates of the other two vertices could be calculated from these three points. Once the coordinates of the center point were located, a small deviation of the vertices would not influence the location of the entire bounding box, and the fault tolerance was improved. Although the predicted bounding box might not be a standard rectangle, the precision of the position can be guaranteed to a certain extent, and the wrong boxes can be deleted easily through NMS processing. This regression method is named the three-point regression method (TPR). Figure 4b shows an example of the detection result with TPR-R2CNN. Compared with R2CNN, the predicted position of this large vehicle was more precise.

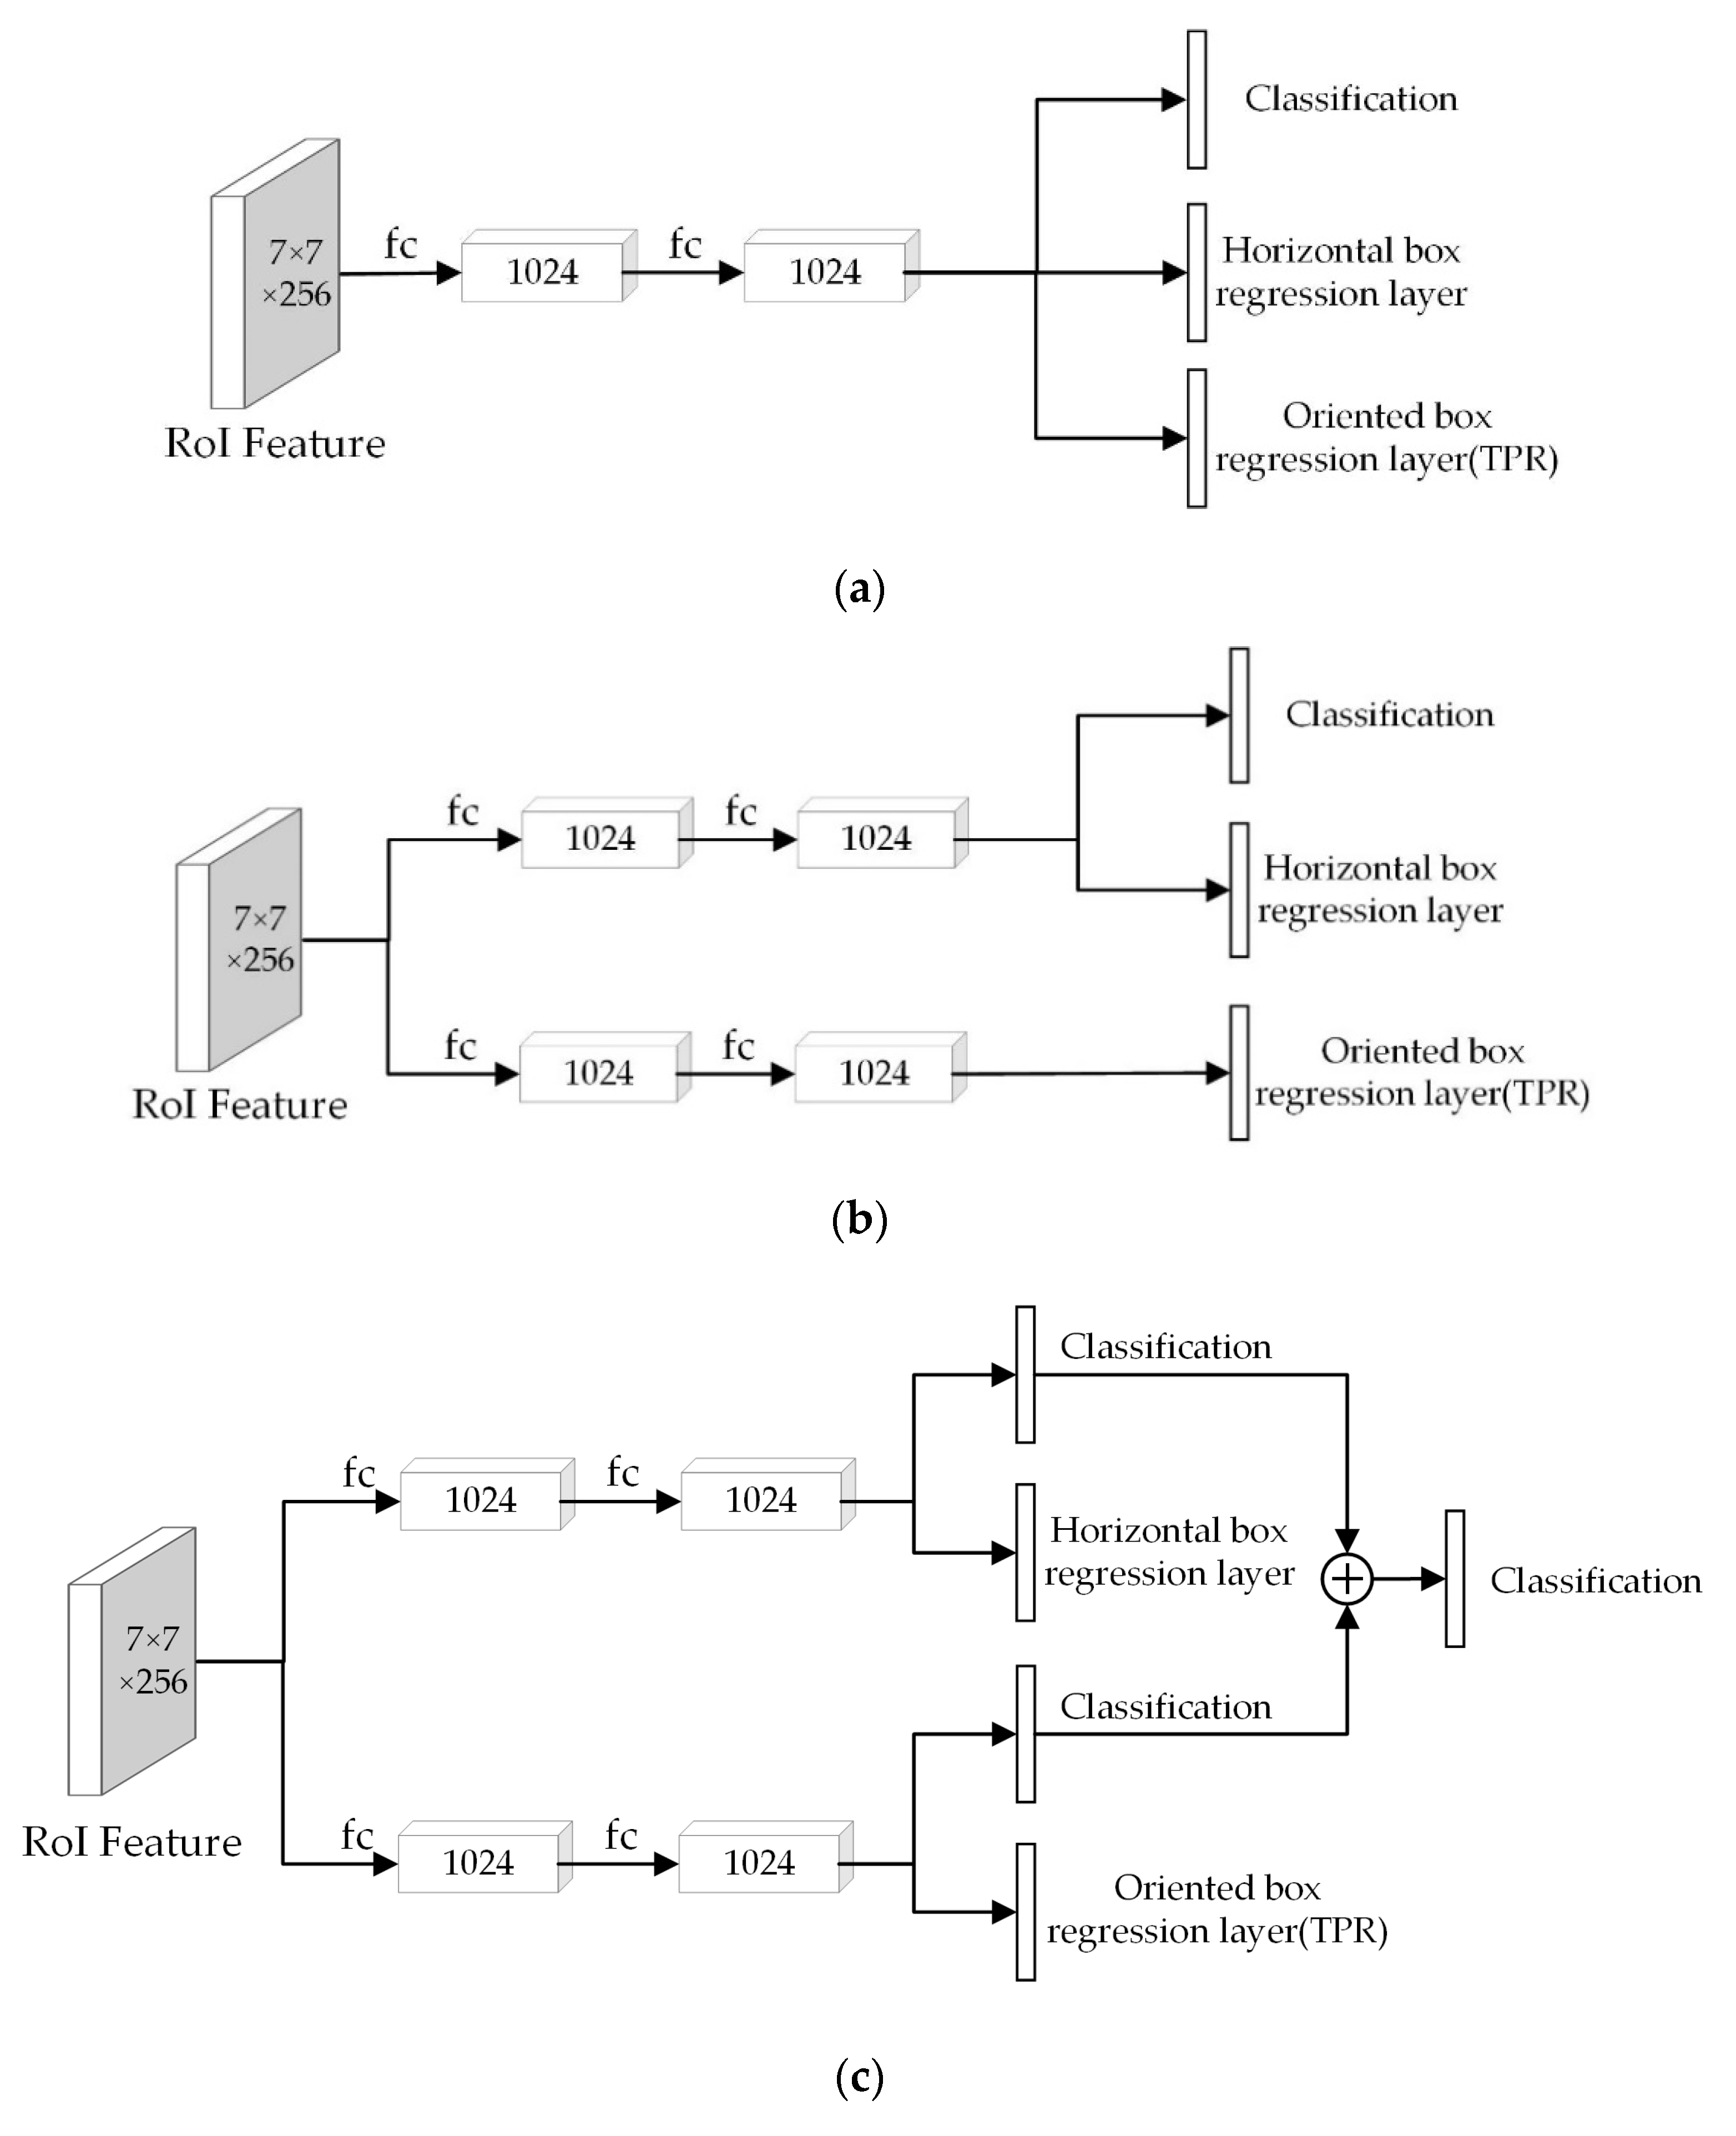
2.3. Double Detection Head

Figure 5 shows the structures of three different detection heads. Figure 5a is the single fully connected head, which is made of two fully connected layers, with the size of 12,544 × 1024 and 1024 × 1024, respectively. In the single fully connected head structure, the classification layer, horizontal box regression layer, and oriented box regression layer share the one head. Figure 5b shows the structure of the double fully connected head. It is made of two single fully connected heads, one of which is used for the oriented box regression task.
Based on the double fully connected head, Figure 5c shows a new double fully connected head, which contains two classification layers. For each predicted bounding box, the outputs of the two classification layers were added element-wise to obtain a new output vector. The Softmax function was applied to the new vector to obtain the final classification score vector.

2.4. Loss Function

In this paper, the loss function is shown as in Equation (2). The total loss function consists of three parts: the first is the object classification loss, which uses the cross-entropy loss; the second is the horizontal box regression loss, which includes the regression loss of the center point coordinates and the width and height of the box; and the third is the newly added oriented box regression loss, including the regression loss of center point coordinates and the first two vertices’ coordinates. λ 0 , λ 1 , and λ 2 were set to 2, 1, and 1, respectively.
L p , t , u   =   λ 0 1 N p r o p o s a l i L c l s p i , p i *   +   λ 1 1 N p r o p o s a l i L r e g t i , t i *   +   λ 2 1 N p r o p o s a l i L r e g u i , u i *
Here, L p , t , u is the total loss function; L c l s p i , p i * , L r e g t i , t i * , and L r e g u i , u i * are the loss functions of classification, horizontal bounding box regression, and oriented bounding box regression; and N p r o p o s a l is the number of proposals.
p i   =   exp a i 1 k exp a i k k   =   1 , 2 , , N c   +   1 ,
L c l s   =   i p i * log p i ,
Here, a i k is the kth element of the classification vector obtained by the classification layer, p i is the final classification score vector of the ith proposal, p i * is the actual classification score vector, and N c is the number of categories. t i and u i are the predicted regression values of the ith proposal.
Specifically, the classification loss was calculated by Equations (3) and (4). Both the horizontal box and the oriented box regression loss were calculated using Smooth L1 Loss. The formulas for calculating the regression value of the oriented bounding box are shown in Equations (5) and (6):
u x 1   =   x 1     x p 1 / w p       u y 1   =   y 1     y p 1 / h p u x 2   =   x 2     x p 2 / w p       u y 2   =   y 2     y p 2 / h p u x c   =   x c     x p c / w p       u y c   =   y c     y p c / h p
s m o o t h L l x   =   0.5 x 2 i f   x   <   1 9 x     0.5 o t h e r w i s e
where w p and h p are the width and height of the proposal and ( x 1 , y 1 ), ( x 2 , y 2 ), and ( x c , y c ) are the predicted coordinates of the first vertices and center point. ( x p 1 , y p 1 ), ( x p 2 , y p 2 ), and ( x p c , y p c ) are the coordinates of proposed bounding box.
In the calculation of the oriented bounding box regression loss, the weights of the six offsets in Equation (5) were set to 5, 5, 5, 5, 10, and 10. For the horizontal bounding box regression loss, the weights were set to 10, 10, 5, and 5.

3. Experiment

To evaluate the performance of the proposed method, we performed experiments on two publicly available and challenging datasets: the DOTA-v1.5 dataset [12] and the HRSC2016 [39] dataset. The dataset preprocessing, evaluation metrics, and training details are described in this section.

3.1. Dataset and Preprocessing

For the experiments, two datasets were chosen, DOTA-v1.5 and HRSC2016, for oriented bounding box object detection in aerial images.

3.1.1. DOTA-v1.5

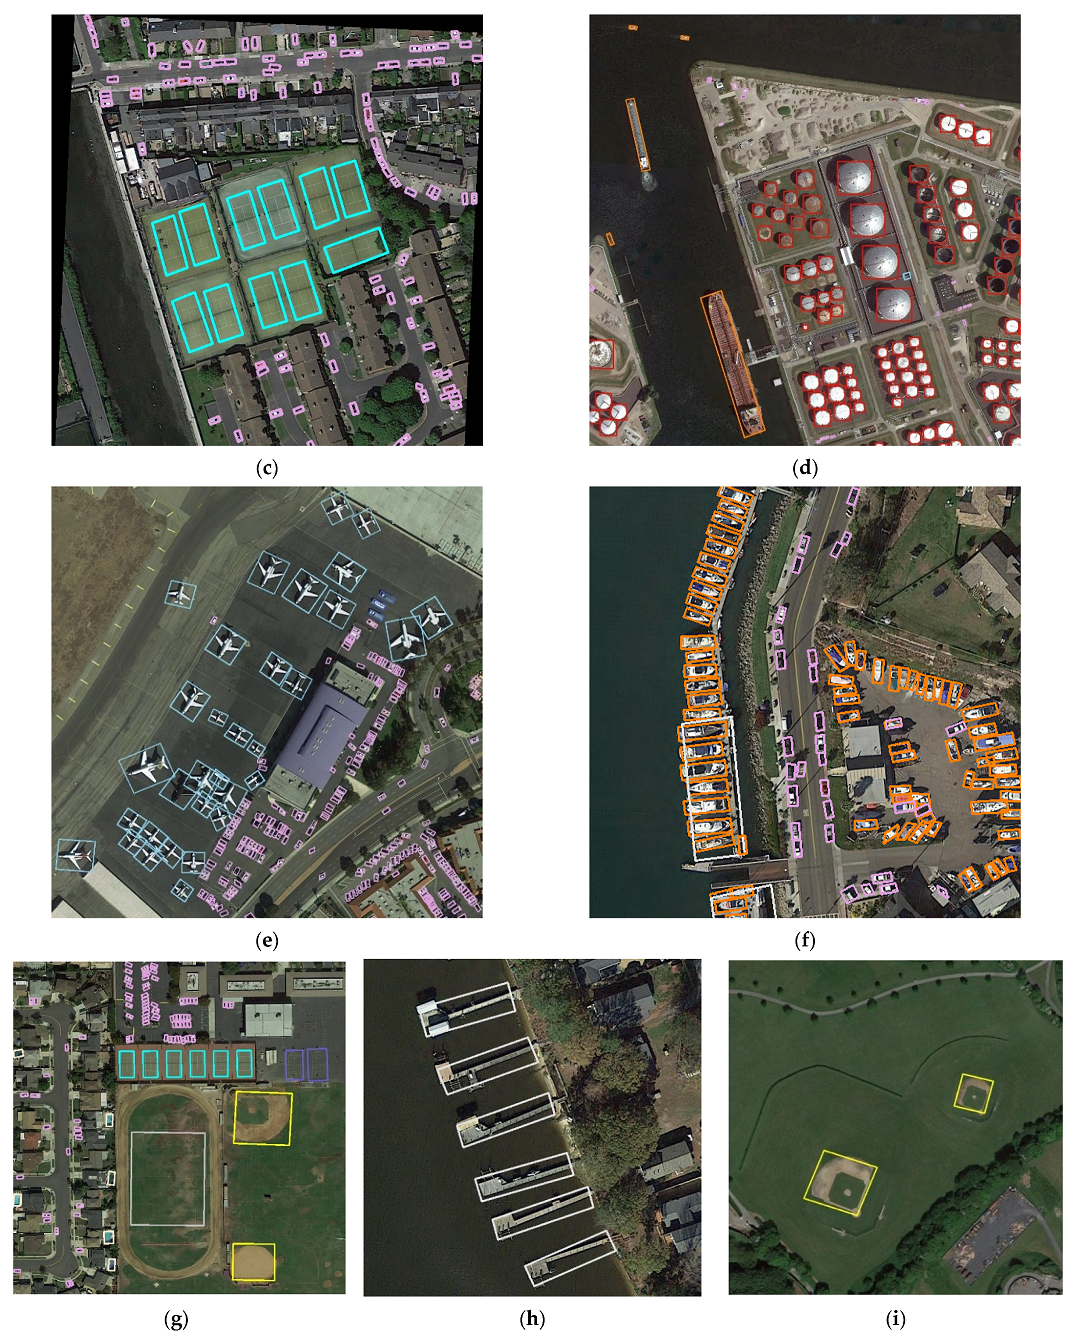
The DOTA-v1.5 dataset contains 2806 remote sensing images and 403,318 instances, covering 16 categories: airplane, ship, storage tank, baseball diamond, tennis court, basketball court, ground track field, harbor, bridge, small vehicle, large vehicle, helicopter, roundabout, football field, swimming pool, and container crane. DOTA-v1.5 is an updated version of DOTA-v1.0. Both of them use the same aerial images but DOTA-v1.5 has revised and updated the annotation of objects, where many small object instances about or below 10 pixels that were missed in DOTA-v1.0 have been additionally annotated. In addition, DOTA-v1.5 added the category of container crane. Consistent with DOTA-v.1.0, the images in DOTA-v1.5 mainly came from China’s resource satellites Jilin-1, Gaofen-2, and Google Earth. The width and height of the DOTA-v1.5 images range from 800 to 4000 pixels, and the spatial resolution is 0.1 m to 4.5 m. It is divided into a training set, validation set, and test set, according to the ratios of 1/2, 1/6, and 1/3, respectively.
In the dataset, the position of each instance is represented by a quadrilateral bounding box. The bounding box can be expressed as “x1, y1, x2, y2, x3, y3, x4, y4”. The vertices are arranged in clockwise order. For the horizontal box, the starting point is the upper left vertex, and for the oriented box, the starting point is the front left vertex in the physical sense of the object. Through experiments, we found this method of labeling was hard to train. Therefore, in our experiments, we set the point that was the nearest to the upper left vertex of the horizontal bounding box as the starting point, and the vertices were arranged in clockwise order.
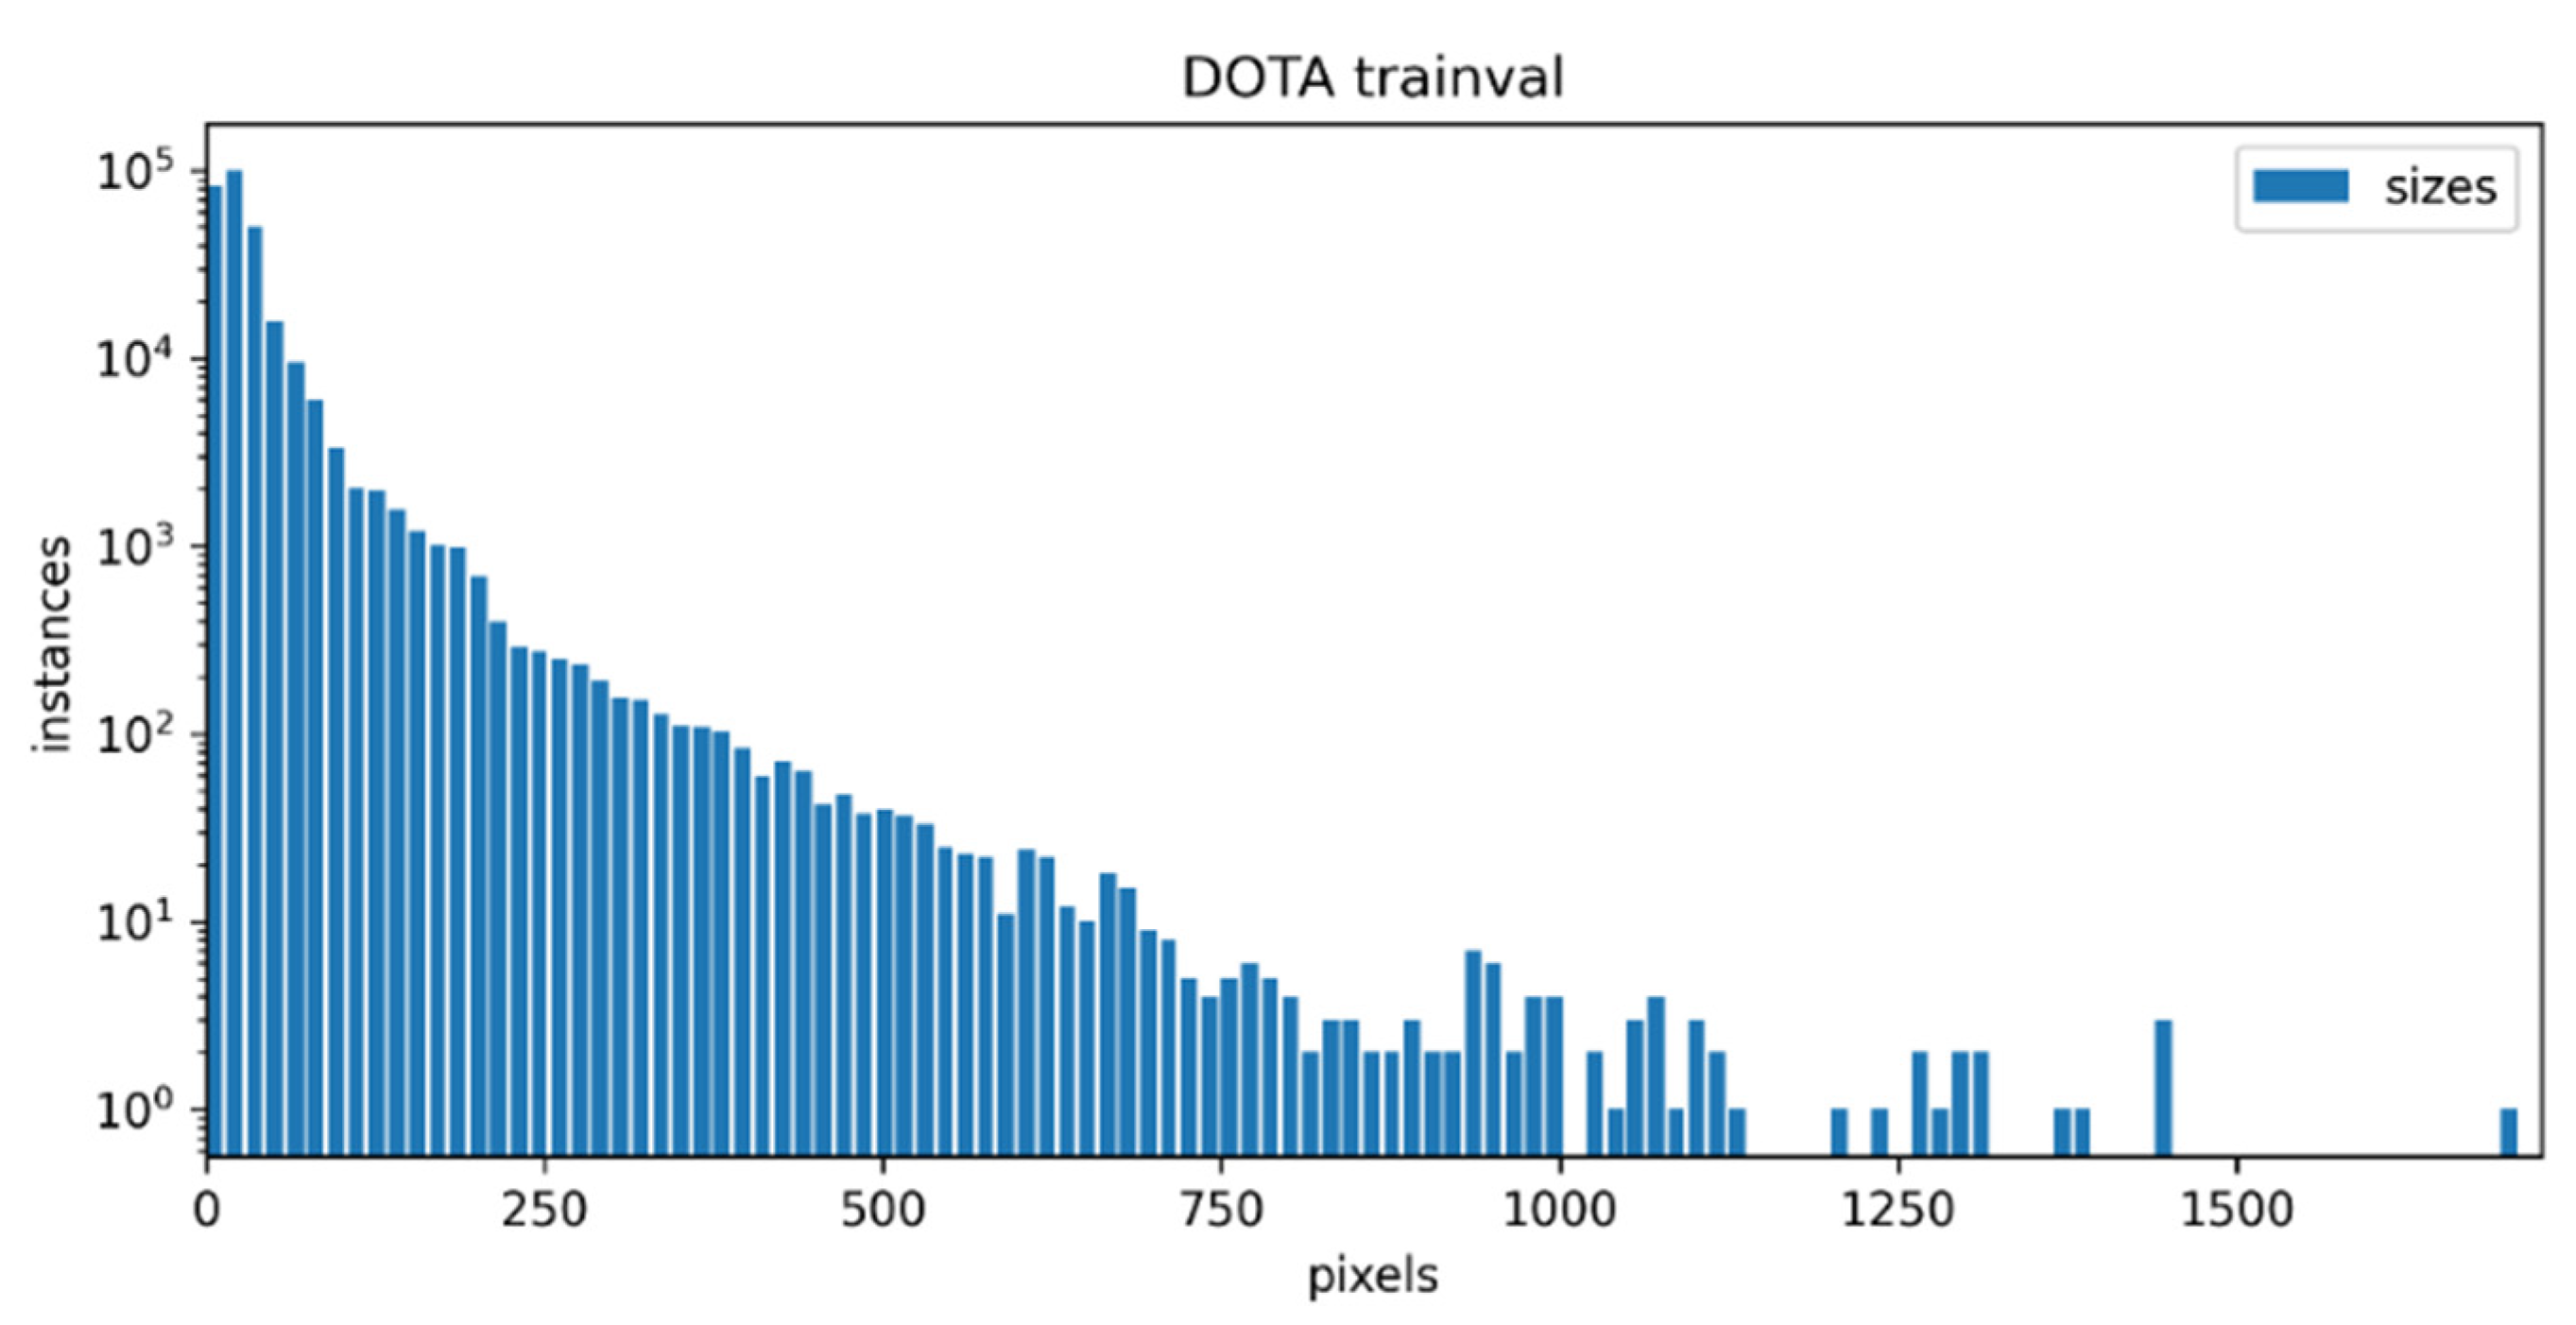
We used the training set in the dataset for training and the validation set for testing and evaluating the network. We separately counted the size information of all objects in the training set and validation set, according to the horizontal bounding boxes. As shown in Figure 6, the object sizes of the training set and validation set of DOTA-v1.5 were concentrated within 200 pixels, the number of small targets was large, and the proportion was high. There were nearly 100,000 small objects within 15 pixels of DOTA-v1.5, and the smallest object area was only 8 square pixels.
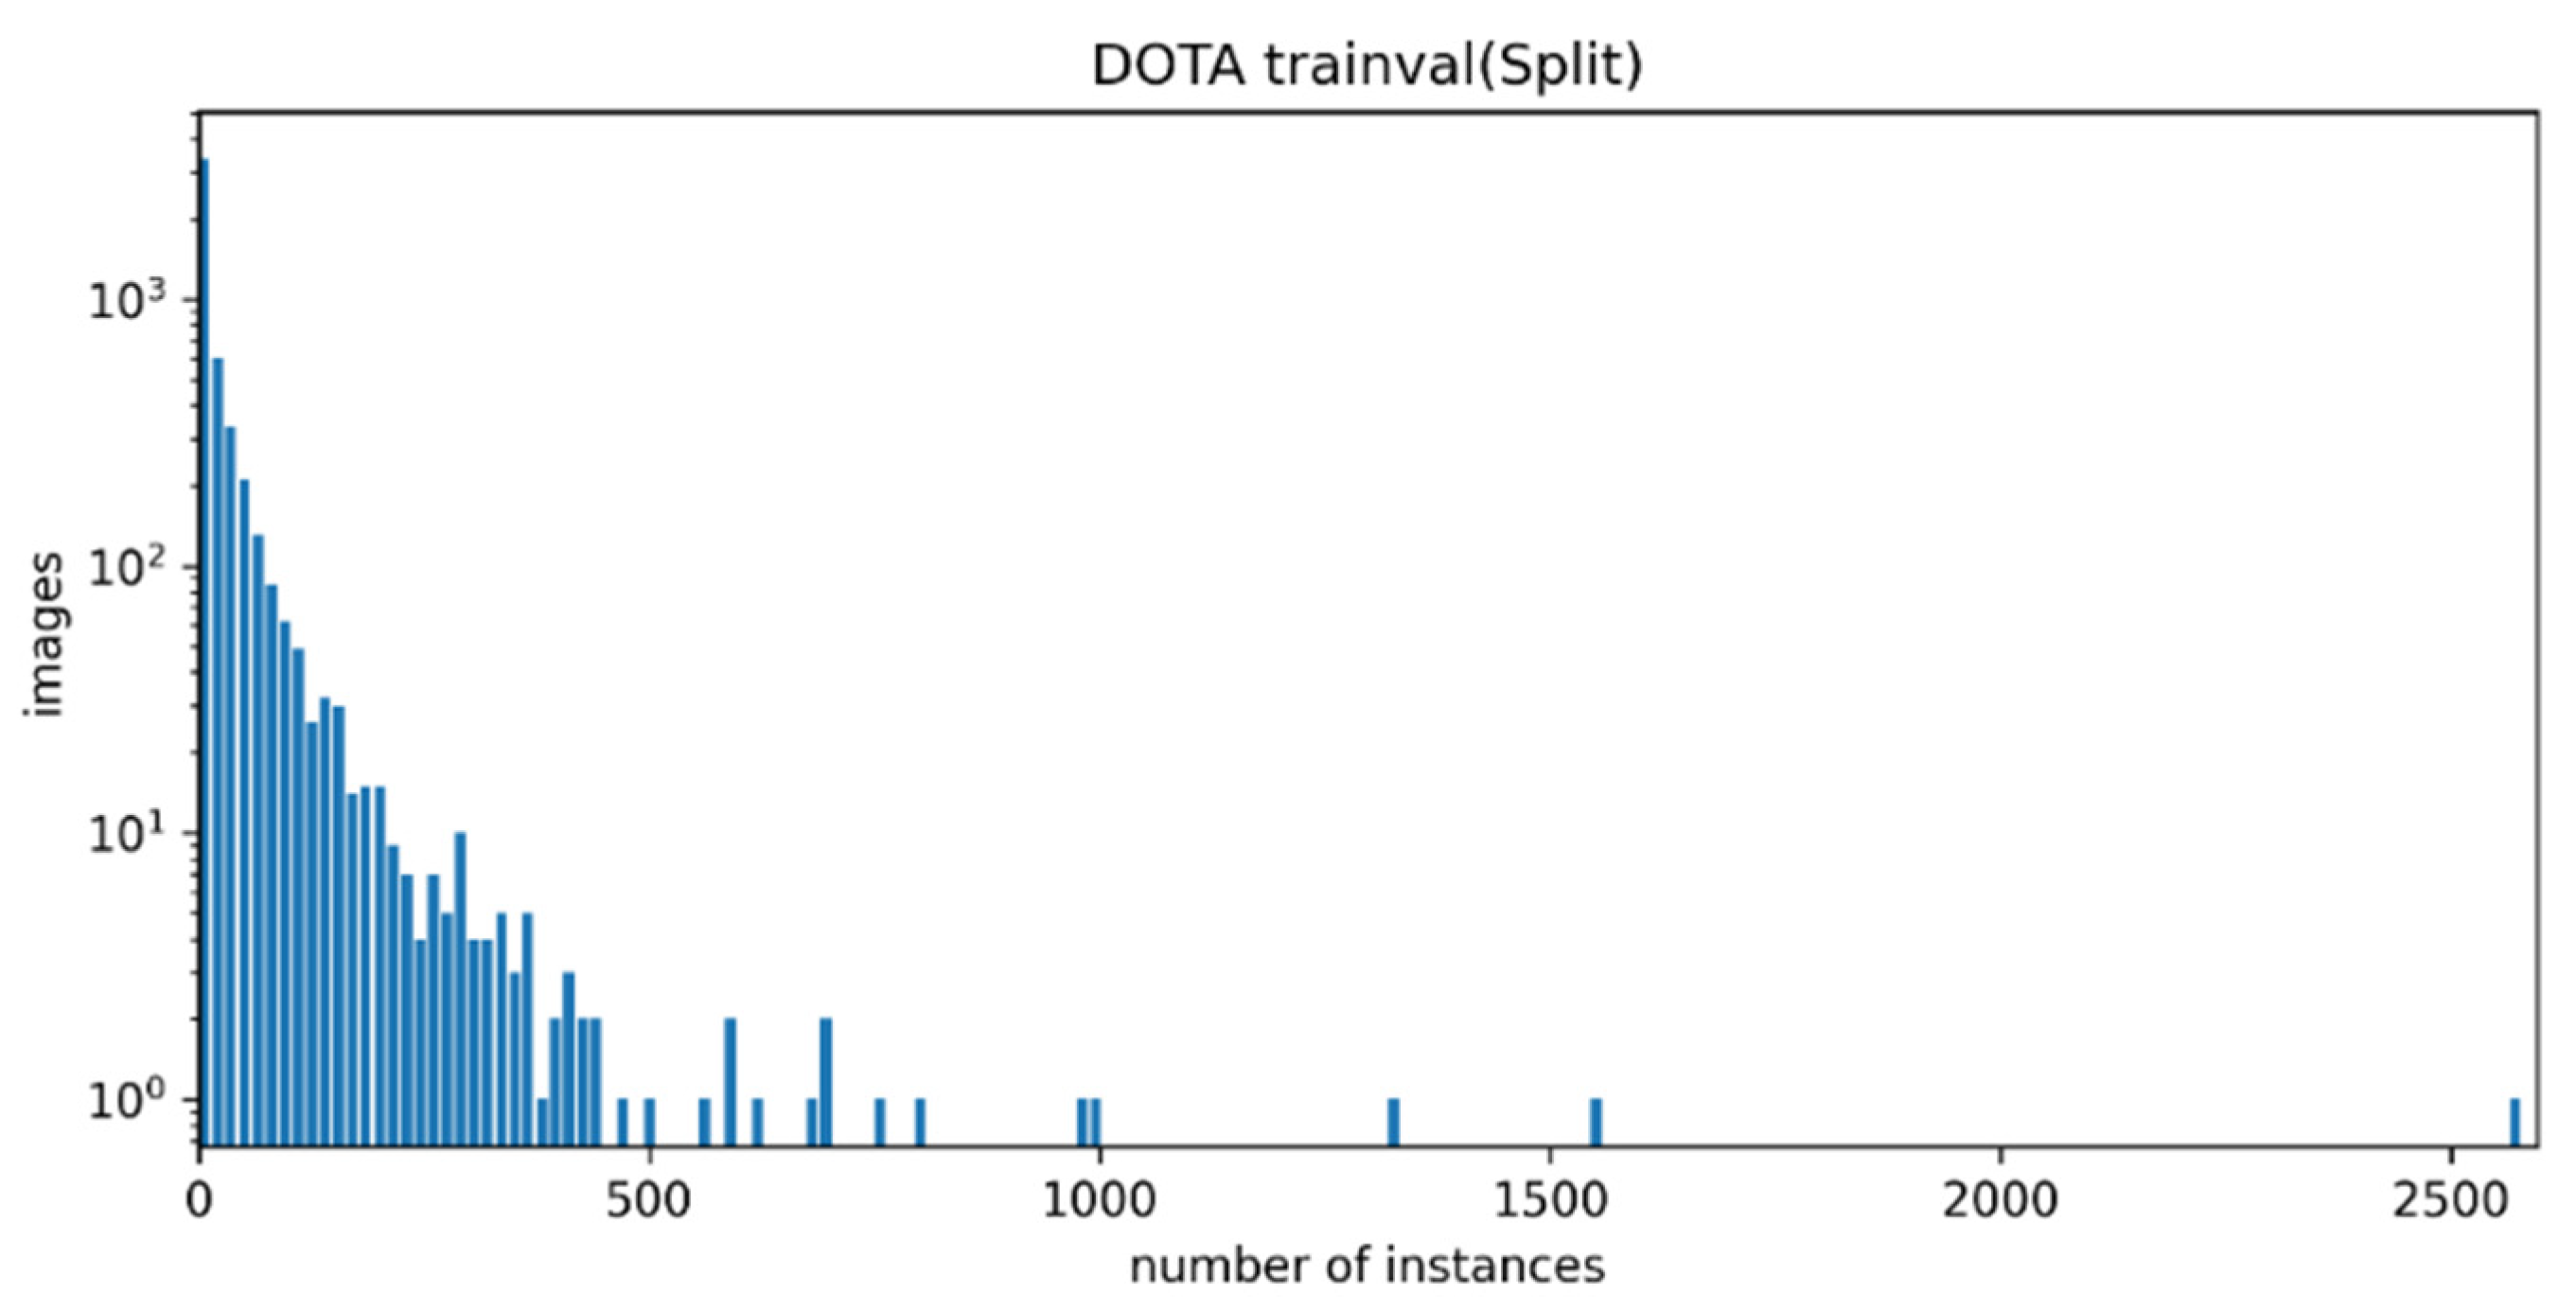
For the DOTA-v1.5 dataset, the sizes of most images were too large. Considering the problem of memory occupation, the original images were split into 800 × 800 patches with a stride of 640. Because both the horizontal and the oriented boxes’ information of objects needed to be used, we comprehensively considered the selection criteria of the cropped horizontal boxes and the oriented boxes. We ensured that the horizontal boxes of the objects in the cropped images corresponded to the label information of the oriented boxes one by one, and we contained the cropped objects with areas more than 90% of the original total area. The number of images after splitting was 20,287, among which there were 15,340 images in the training set and 4947 images in the validation set, respectively.
In the horizontal box and directed box labeling information, the incorrect labeling information with an area of 0 was uniformly eliminated. Then, the annotation format of the picture was converted to Pascal VOC format, which contained the information on the horizontal frame and the directed frame. The horizontal annotations were expressed in the form of “(xmin, ymin), (xmax, ymax)”, and the oriented annotations were expressed in the form of “x1, y1, x2, y2, x3, y3, x4, y4”, which was different from DOTA-v1.5. In the original labeling method of the data set, the coordinates of the starting point here were unified as the coordinates of the top-left vertex, rather than the “top-left corner” in the physical sense. Similarly, the DOTA-v1.5 data set images were also standardized before being sent to the model. During the training process, half of the training images were also randomly flipped for data augmentation.
After the preprocessing of the DOTA-v1.5 dataset, the number of objects contained was counted in each image of the dataset, as shown in Figure 7. The abscissa was the number of objects in each image, the interval was 15, and the ordinate was the number of images.

3.1.2. HRSC2016

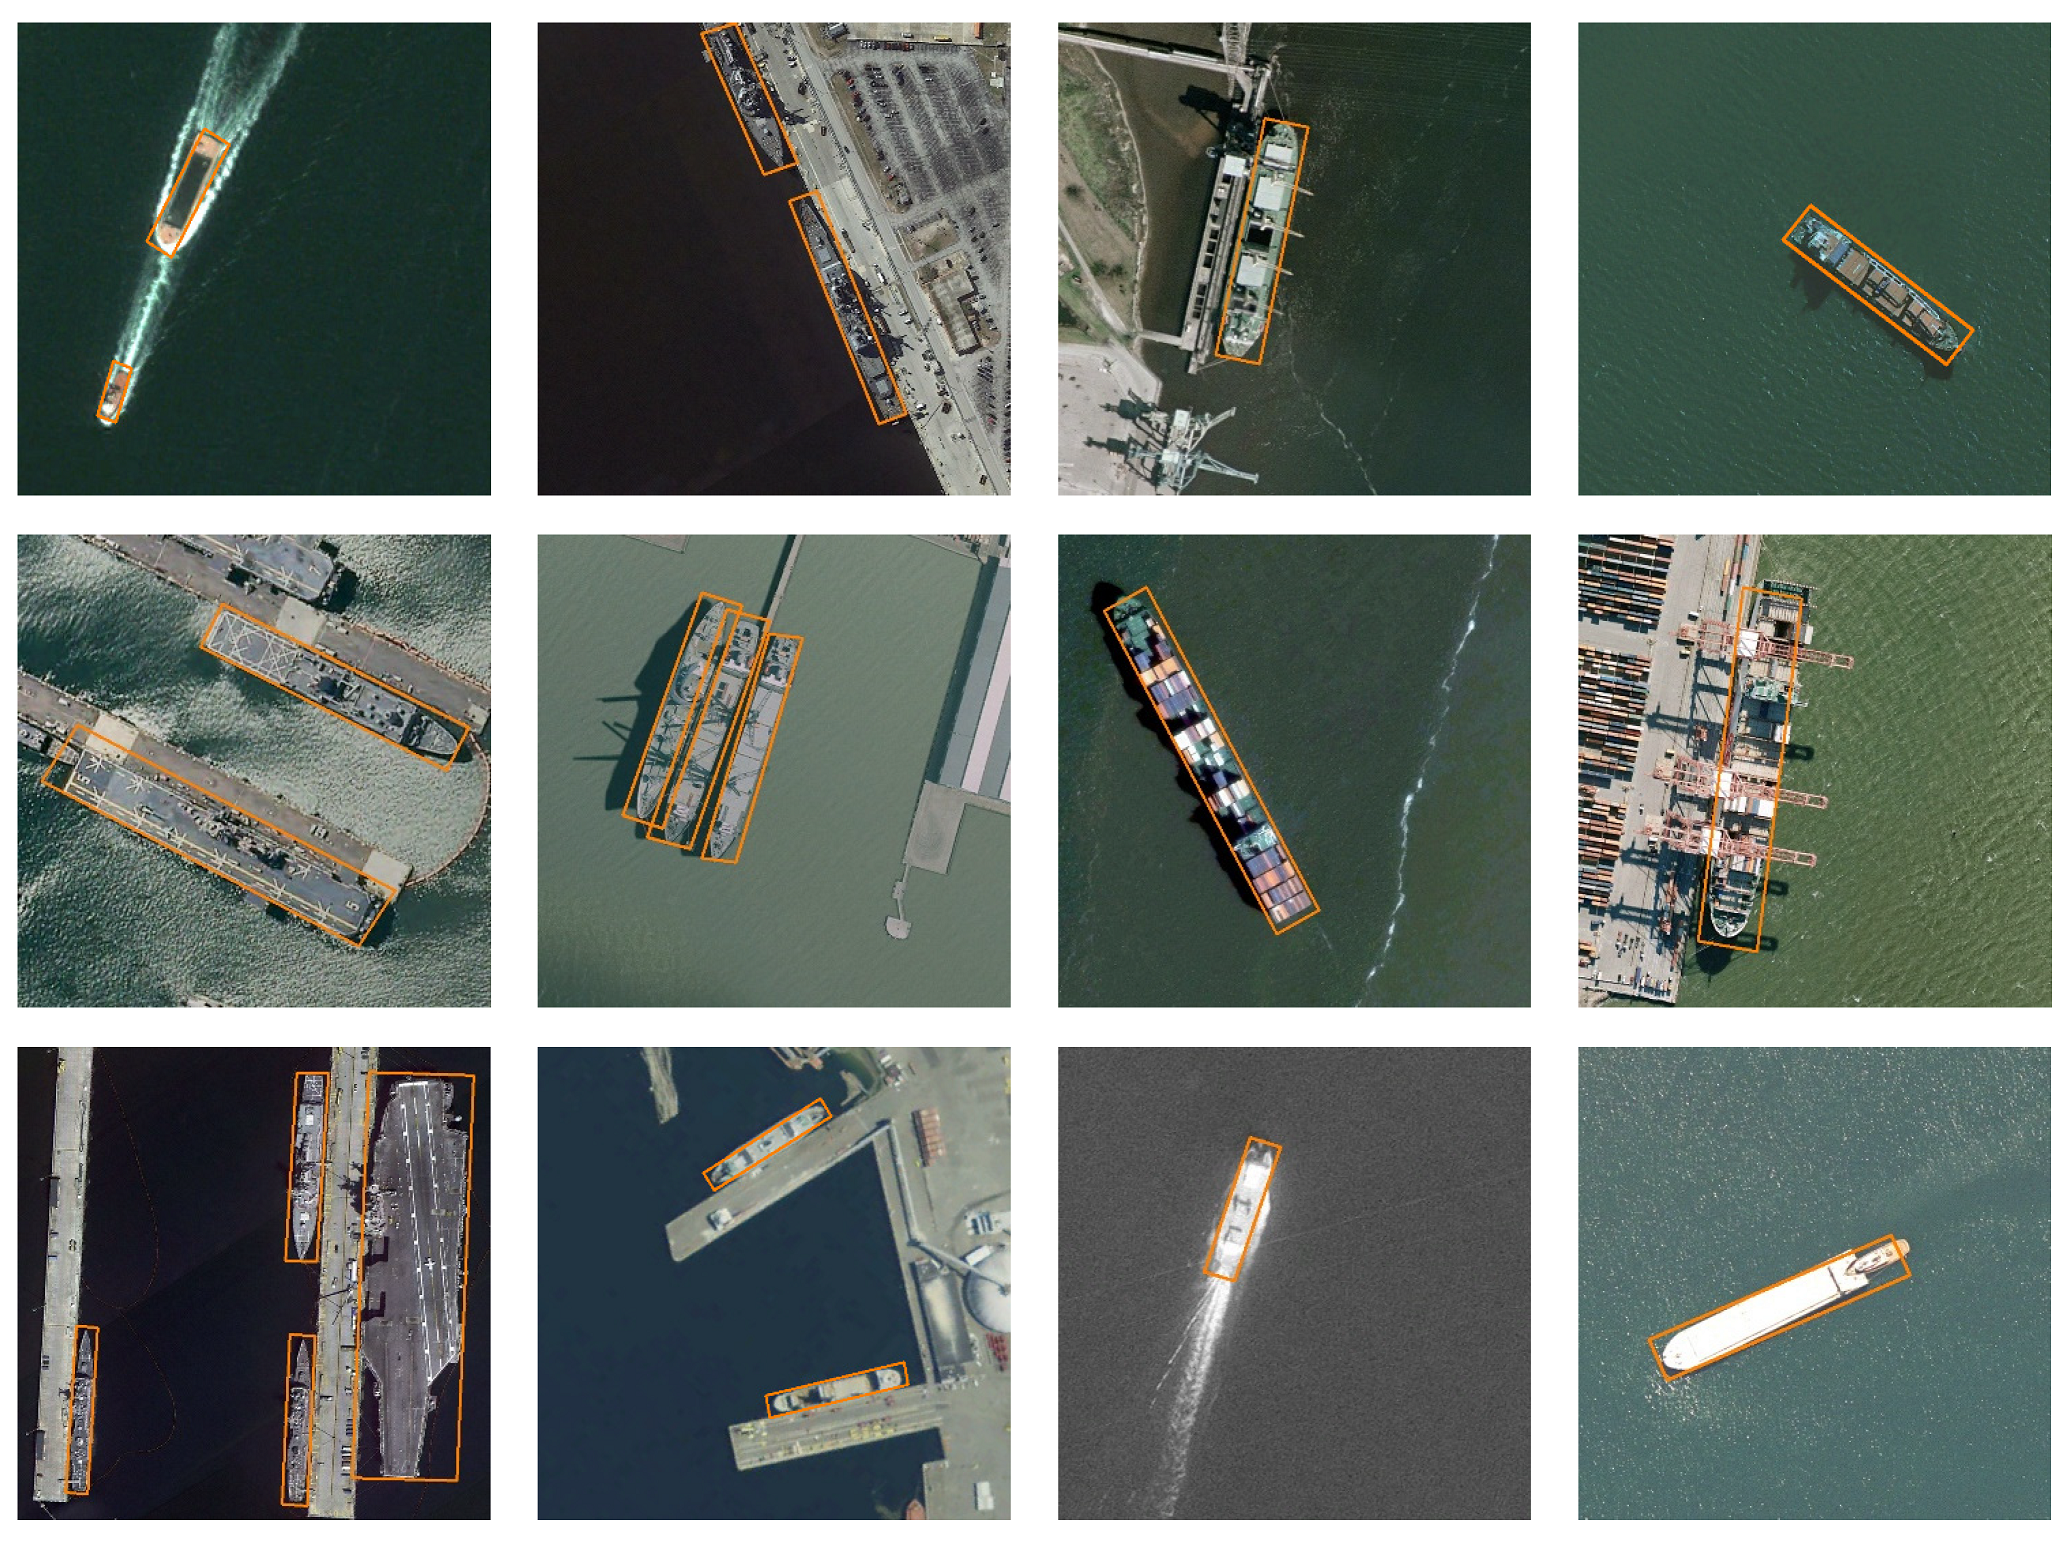
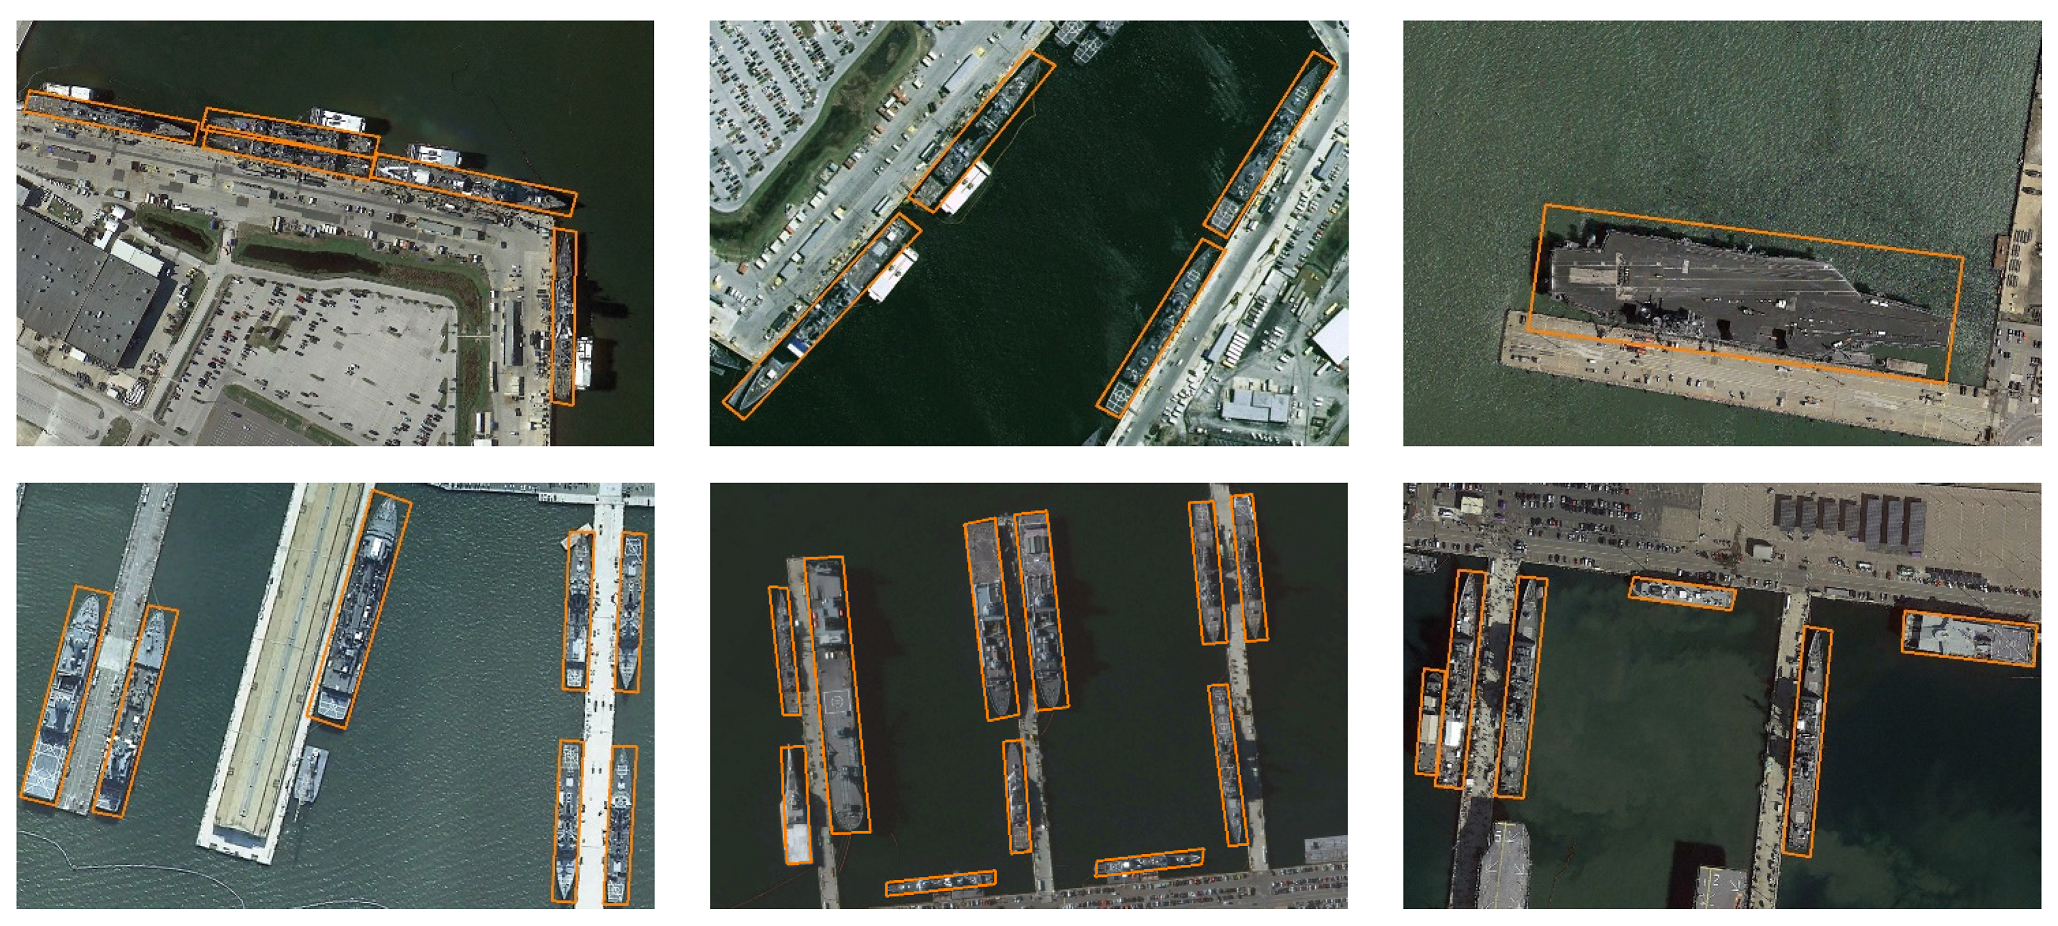
The HRSC2016 dataset contains images from two scenarios, including ships at sea and ships inshore. The images were collected from Google Earth. The images sizes range from 300 × 300 to 1500 × 900, and most of them are larger than 1000 × 600. There are more than 25 types of ships with large varieties in scale, position, rotation, shape, and appearance. The training and validation datasets in our experiments contained 617 images and 438 images, respectively. For data augmentation, we adopted horizontal flipping. The images were resized to (512, 800), where 512 represents the length of the short side and 800 the maximum length of an image.

3.2. Evaluation Metrics

Object detection accuracy evaluation indicators include the missing alarm rate (MAR), false alarm rate (FAR), average precision (AP), and mean average precision (mAP) for all categories. These metrics are related to each other.
The precision reflects the number of positive samples that are found and correct, and the recall reflects how many positive samples are found. By setting different confidence thresholds, multiple sets of precision and recall can be obtained, which can be calculated from Table 2 and Equation (7).
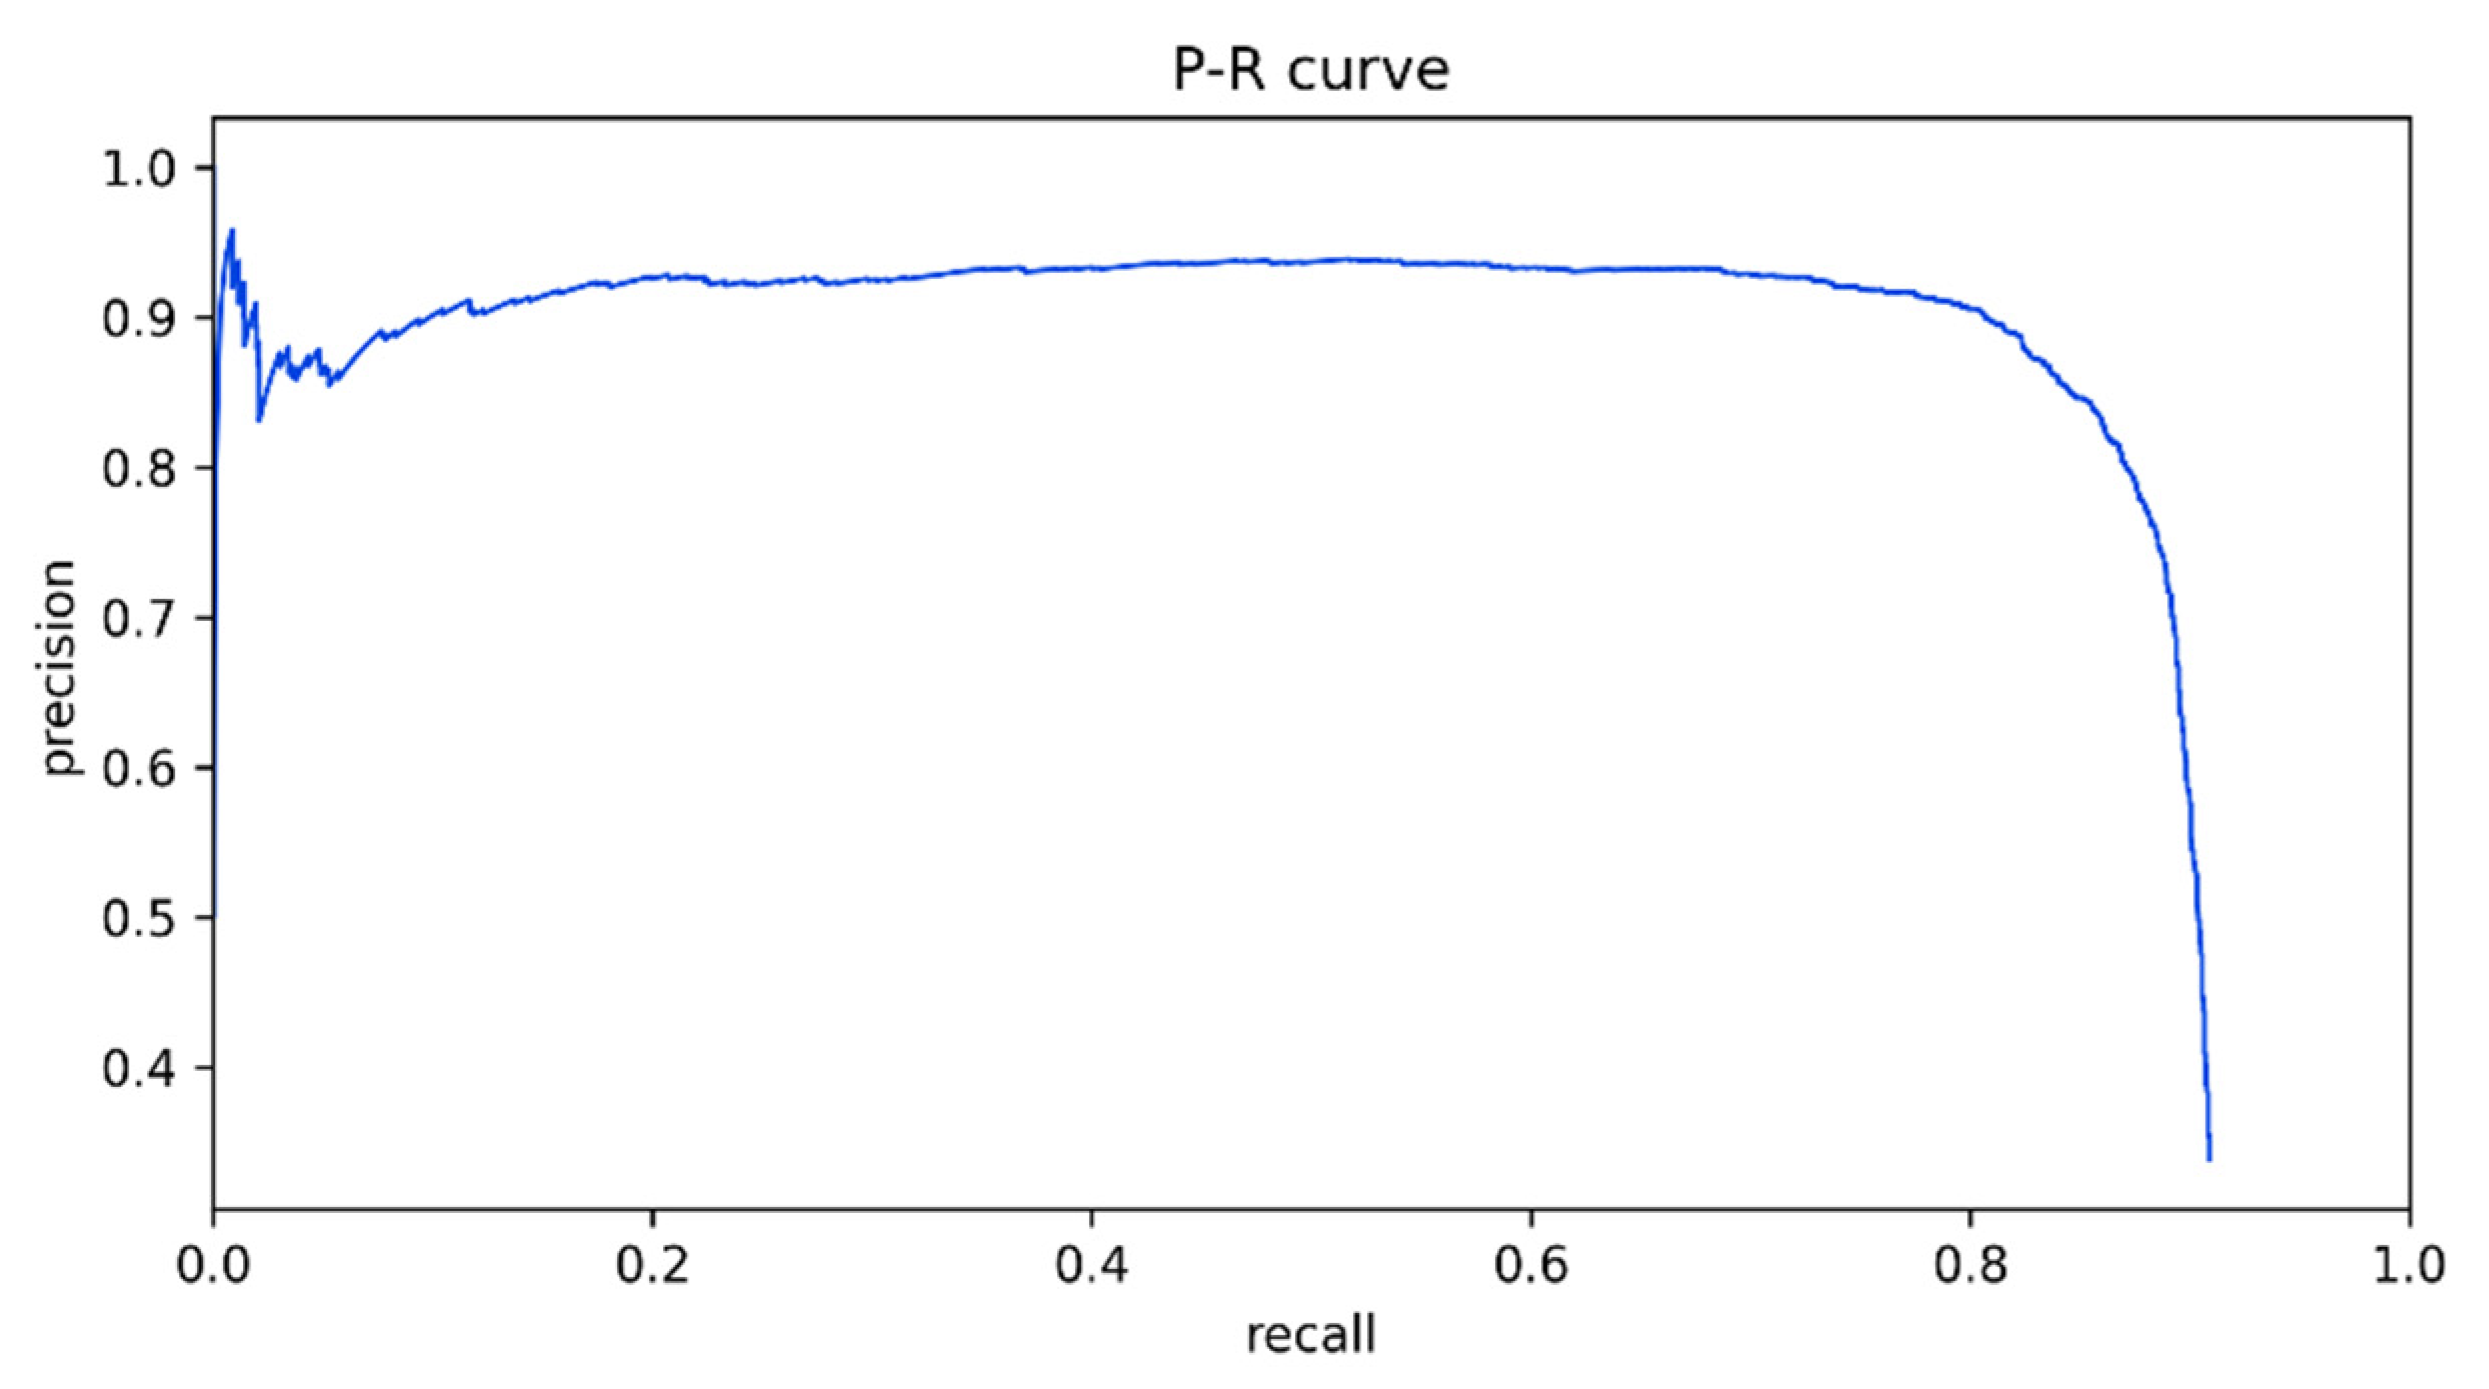
The P–R (precision–recall) curve was composed of recall values, which formed the horizontal axis, and precision values, which formed the vertical axis, as shown by Figure 8. Integrating the P–R curve, the average precision (AP) value was calculated. However, in practical applications, integrating the P–R curve is not commonly used; smoothing the P–R curve is more common. Specifically, for each point on the P–R curve, the value of precision takes the value of the greatest precision on the right side of the point, as shown in Equation (8). mAP is the average of the average precisions of all categories.
The evaluation metrics used in this paper were AP and mAP. The classification standard for positive and negative samples is whether the IoU value reaches 0.5. If the IoU value between the predicted box and any ground truth is greater than 0.5, the predicted box is classified as a positive sample; otherwise, it is a negative sample.
In this research, the object detection speed evaluation metrics were the number of images detected per second (FPS, frames per second), which was calculated on a graphics card. Specifically, the model time was used to evaluate the detection effectiveness of this model.
r e c a l l   =   T P T P   +   F N p r e c i s i o n   =   T P T P   +   F P
A P   =   0 1 p r d r P smooth r   =   m a x r > = r P r
where p r is the P–R curve and AP is the average precision.

3.3. Training Details

The experiments in this paper were trained on a server, which had an RTX3090 GPU with 24 GB RAM. This research used the pretrained weights, which were trained on ImageNet. In the training processing, the low-level weights conv1 and conv2_x in ResNet-50 were frozen, and only the high-level weights were trained.
During the training process, the batch size (the number of images input to the network each time) was set to 8 and 16 for the DOTA-v1.5 dataset and HRSC2016 dataset, respectively, and the batch size of RPN was set to 256. The optimizer was the stochastic gradient descent method with momentum, and the momentum was set as 0.9, which is commonly used; the initial learning rate was set to 0.005. When the validation loss was stable or over-fitting occurred, the learning rate was reduced to 1/3 of the original. After the mAP value stabilized, the training was stopped. In the validation stage, the objects with confidence above 0.05 were contained.
For the DOTA-v1.5 dataset, there were 8000 RoIs from RPN before NMS and 2000 RoIs after NMS processing. We used 3 aspect ratios 1 / 2 , 1 , 2 for anchors. After oriented bounding box NMS (IoU threshold = 0.3), the maximum number of detection boxes retained per image in the DOTA-v1.5 dataset was 2000. For HRSC2016, there were 8000 RoIs from PRN before NMS and 1000 RoIs after NMS. The aspect ratios of anchors were set to 1 / 4 , 1 / 3 , 1 / 2 , 1 , 2 , 3 , 4 , because there were more aspect ratio variations in HRSC2016. For the DOTA-v1.5 and HRSC2016 datasets, the maximum numbers of detection boxes retained per image were 2000 and 100.

4. Results and Discussion

4.1. Results

This paper compared the detection results of the two regression methods, which were regressing coordinates of two vertices and height and regressing coordinates of two vertices and the center point. This paper also compared them with the network with a double detection head and classification fusion. We reproduced the R2CNN network based on our deep learning frame, so that the R2CNN in Table 3, Table 4 and Table 5 only had one difference of regression method with TPR-R2CNN (without double detection head and classification fusion). The other parameters were all the same, as control variable experiments are more convincing.
The IoU threshold for detection bounding boxes was set to 0.5, and the results of the DOTA-v1.5 dataset are shown in Table 4 and Table 5. The detection rate and mAP of the HRSC2016 dataset are represented in Table 3. The detection rates were obtained by test experiments on GPU. Figure 9 and Figure 10 show the visual detection results of the proposed TPR-R2CNN network (containing the double detection head and classification fusion) in the HRSC2016 and DOTA-v1.5 datasets, respectively. Plane, baseball diamond, bridge, ground track field, small vehicle, large vehicle, ship, tennis court, basketball court, storage tank, football field, roundabout, harbor, swimming pool, helicopter, and container crane are denoted by sky blue, yellow, emerald green, purple, rose red, crystal blue, orange, cyan blue, slate blue, cadmium red, grey, dark green, white, almond white, red, and blue, respectively.
Table 3 shows that, compared with the regression method of R2CNN, the detection rate of the proposed network was slightly reduced from 48.6 to 45.8. The adoption of TPR had a large increase in the mAP, which was 14.05%. With the double detection head and classification fusion, the mAP reached 89.38%, even better than methods with larger backbones. As Figure 9 shows, ships with various sizes and directions were detected correctly and accurately. The ships which were obscured were also detected.
Table 4 and Table 5 show that, with the change in the oriented bounding box regression method, the detection rate of the network was slightly reduced from 28.7 to 27.2. In addition, the application of the double fully connected head and double classification layers did not influence the detection rate.
Compared with the regression method of the original R2CNN, the average accuracy of the 16 categories of TPR-R2CNN increased from 54.52% to 56.68%, an increase of 2.16%. Among them, the average precision of 11 categories increased: plane, baseball diamond, bridge, small vehicle, large vehicle, ship, tennis court, soccer field, roundabout, harbor, and swimming pool. In particular, for the bridge, large vehicle, ship, tennis court, and harbor, the AP was greatly improved. They had increases of 5.64%, 7.22%, 3.43%, 11.55%, and 8%, respectively. These categories of objects have some common characteristics; they have a large aspect ratio and arbitrary directions. As shown in Figure 10, objects with various sizes and directions were detected correctly. Some small objects such as small vehicles were also detected accurately.
The comparative experiments verified that the regression method of TPR-R2CNN performed better than R2CNN in remote sensing image object detection tasks.
Figure 11 shows the visualization results of R2CNN and TPR-R2CNN. We chose ship, large vehicle, and harbor objects for comparison. The locations of objects with large aspect ratios were more precisely located. The majority of the wrong detection bounding boxes could be deleted after the NMS process.
TPR-R2CNN with a double fully connected head offered an increase of 1.47%; the mAP was 58.15%. Compared with the single fully connected head, this detection head provided a single head for the oriented bounding box regression task, and this method improved the AP of 12 categories of objects. The basketball court AP had the largest increase of 7.82%. Based on the double detection head structure, the application of two classification layers’ fusion increased the mAP by 0.27%. The proposed network classified plane and helicopter objects more accurately, and the AP of helicopter increased by 3.90%. More helicopters were distinguished from planes.
As shown in Figure 10, the proposed detection network detected objects of different categories and various sizes. Even some small vehicle objects less than 20 pixels were detected accurately, which are marked in pinks frame in the above images. For densely arranged objects with arbitrary directions, this network could also accurately detect the locations of the objects and marked them with oriented bounding boxes.
We also chose some images which contained slender and densely arranged objects. By using horizontal boxes and oriented boxes to detect objects, we obtained the results shown in Figure 12. Figure 12a,b,e,f shows the detection result of vehicles and Figure 12c,d compares the detection result of ships. The detection result with oriented bounding boxes performed better than that with horizontal bounding boxes. The proposed network improved the influence of NMS and more objects were detected.
We compared the proposed method with the state-of-the-art methods on HRSC2016. Table 6 shows the comparisons between them, and the detection rate was tested on the CPU.
From Table 6, it is shown that with a smaller backbone of ResNet-50, the proposed method achieved a better detection result on the HRSC2016 dataset. We believe that if we use a larger backbone, the mAP could be even higher. The detection rate was lower than other state-of-the-art methods. The reason may be that the object detection frame we used was Faster R-CNN, a double-stage detection method. Furthermore, the adoption of both the horizontal and oriented bounding box regression method introduced more parameters for this model. In our future research, we will examine some single-stage detection methods such as RetinaNet, and reduce some model parameters.

4.2. Discussion

By comparing and analyzing the groups of experiments, the validity of the proposed method was verified.TPR-R2CNN with a double fully connected head and classification fusion offered superior performance to slender and high-density objects with arbitrary directions. However, container cranes were barely detected because the number of container cranes for training was only 47, and the number of images was only 7. The sample size of the container cranes was too small, while some other categories of objects reached more than 10,000. The large difference in the number of different object categories caused the network parameters to change in the direction of the categories with a large number during the network training process. However, a small number of crane objects were difficult to detect. In future research work, we will increase the sample size of these under-numbered object categories by rotating and flipping the images. By controlling the number of different categories in a relatively balanced range, it is possible to achieve better training results.
Furthermore, it can be seen from Figure 13 that the TPR-R2CNN network structure affected the classification effect during the training process. Although there was also a misdetection between similar object classes in the horizontal bounding box detection, the problem was obviously more serious in TPR-R2CNN. We increased the weight of the class branch, but the improvement was not significant. This is a problem to be solved in future experiments.

5. Conclusions

This paper proposed an improved oriented object detection in remote sensing images based on a three-point regression method. The proposed method has the following novel features: (1) a double fully connected head with classification fusion to further improve the detection precision and (2) the three-point regression method (TPR), which can enhance the detection precision for remote sensing objects which are slender and arranged densely. The experimental results on the two public and challenging datasets and the comparisons with the R2CNN network demonstrate the effectiveness and good performance of the proposed method. However, despite demonstrating better performance, the proposed method increased the misdetection rate due to inaccurate classification between similar categories. Furthermore, the detection rate was lower than the state-of-the-art methods due to the basic detection frame and a large number of parameters. Thus, our future work will focus on increasing the classification precision and reducing the calculation amount.

Author Contributions

Conceptualization, F.W. and J.H.; methodology, J.H.; software, J.H. and G.Z.; validation, J.H. and H.L.; investigation, J.H., G.Z. and H.L.; writing—original draft preparation, J.H.; writing—review and editing, Y.L. and X.S.; visualization, Y.L.; supervision, F.W. and X.S.; funding acquisition, F.W. All authors have read and agreed to the published version of the manuscript.

Funding

This research received no external funding. The APC was funded by Beihang University.

Institutional Review Board Statement

Not applicable.

Informed Consent Statement

Not applicable.

Data Availability Statement

DOTA-v1.5 dataset was analyzed in this study. This data can be found here: https://captain-whu.github.io/DOTA/dataset.html (accessed on 20 September 2021). The HRSC2016 dataset was obtained from Kaggle website and is available from the site (https://www.kaggle.com/guofeng/hrsc2016 (accessed on 20 September 2021)).

Acknowledgments

We acknowledge the use of the DOTA dataset and HRSC2016 dataset, which was acquired from the DOTA website (https://captain-whu.github.io/DOTA/dataset.html (accessed on 20 September 2021)) and the Kaggle website (https://www.kaggle.com/guofeng/hrsc2016 (accessed on 20 September 2021)). We are also very grateful for the contributions and comments of peer reviewers.

Conflicts of Interest

The authors declare no conflict of interest.

References

  1. Simonyan, K.; Zisserman, A. Very deep convolutional networks for large-scale image recognition. arXiv 2014, arXiv:1409.1556. [Google Scholar]
  2. Szegedy, C.; Liu, W.; Jia, Y.; Sermanet, P.; Reed, S.; Anguelov, D.; Erhan, D.; Vanhoucke, V.; Rabinovich, A. Going Deeper with Convolutions. arXiv 2014, arXiv:1409.4842. [Google Scholar]
  3. Krizhevsky, A.; Sutskever, I.; Hinton, G.E. ImageNet classification with deep convolutional neural networks. Adv. Neural Inf. Process. Syst. 2012, 25, 1097–1105. [Google Scholar] [CrossRef]
  4. He, K.M.; Zhang, X.Y.; Ren, S.Q.; Sun, J. Deep Residual Learning for Image Recognition. In Proceedings of the IEEE Conference on Computer Vision and Pattern Recognition (CVPR), Las Vegas, NV, USA, 27–30 June 2016; pp. 770–778. [Google Scholar] [CrossRef] [Green Version]
  5. Huang, G.; Liu, Z.; van der Maaten, L.; Weinberger, K.Q. Densely Connected Convolutional Networks. In Proceedings of the 30th IEEE/CVF Conference on Computer Vision and Pattern Recognition (CVPR), Honolulu, HI, USA, 21–26 July 2017; pp. 2261–2269. [Google Scholar]
  6. Girshick, R.; Donahue, J.; Darrell, T.; Malik, J. Rich feature hierarchies for accurate object detection and semantic segmentation. In Proceedings of the IEEE Conference on Computer Vision and Pattern Recognition, Columbus, OH, USA, 23–28 June 2014; pp. 580–587. [Google Scholar] [CrossRef] [Green Version]
  7. Girshick, R. Fast R-CNN. In Proceedings of the 2015 IEEE International Conference on Computer Vision (ICCV), Santiago, Chile, 7–13 December 2015; pp. 1440–1448. [Google Scholar] [CrossRef]
  8. Ren, S.; He, K.; Girshick, R.; Sun, J. Faster R-CNN: Towards Real-Time Object Detection with Region Proposal Networks. IEEE Trans. Pattern Anal. Mach. Intell. 2017, 39, 1137–1149. [Google Scholar] [CrossRef] [PubMed] [Green Version]
  9. Dai, J.F.; Li, Y.; He, K.M.; Sun, J. R-FCN: Object Detection via Region-based Fully Convolutional Networks. In Proceedings of the 30th Conference on Neural Information Processing Systems (NIPS), Barcelona, Spain, 5–10 December 2016. [Google Scholar]
  10. He, K.M.; Gkioxari, G.; Dollar, P.; Girshick, R. Mask R-CNN. In Proceedings of the 16th IEEE International Conference on Computer Vision (ICCV), Venice, Italy, 22–29 October 2017; pp. 2980–2988. [Google Scholar]
  11. Cai, Z.; Vasconcelos, N. Cascade R-CNN: Delving Into High Quality Object Detection. In Proceedings of the 2018 IEEE/CVF Conference on Computer Vision and Pattern Recognition, Salt Lake City, UT, USA, 18–23 June 2018; pp. 6154–6162. [Google Scholar]
  12. Cheng, G.; Han, J.W. A survey on object detection in optical remote sensing images. ISPRS J. Photogramm. Remote Sens. 2016, 117, 11–28. [Google Scholar] [CrossRef] [Green Version]
  13. Zhao, Z.-Q.; Zheng, P.; Xu, S.-T.; Wu, X. Object Detection With Deep Learning: A Review. IEEE Trans. Neural Netw. Learn. Syst. 2019, 30, 3212–3232. [Google Scholar] [CrossRef] [PubMed] [Green Version]
  14. Li, K.; Wan, G.; Cheng, G.; Meng, L.; Han, J. Object detection in optical remote sensing images: A survey and a new benchmark. ISPRS J. Photogramm. Remote Sens. 2020, 159, 296–307. [Google Scholar] [CrossRef]
  15. Redmon, J.; Divvala, S.; Girshick, R.; Farhadi, A. You Only Look Once: Unified, Real-Time Object Detection. In Proceedings of the IEEE Conference on Computer Vision and Pattern Recognition (CVPR), Las Vegas, NV, USA, 27–30 June 2016; pp. 779–788. [Google Scholar] [CrossRef] [Green Version]
  16. Liu, W.; Anguelov, D.; Erhan, D.; Szegedy, C.; Reed, S.; Fu, C.Y.; Berg, A.C. SSD: Single Shot MultiBox Detector. In Proceedings of the 14th European Conference on Computer Vision (ECCV), Amsterdam, The Netherlands, 8–16 October 2016; pp. 21–37. [Google Scholar]
  17. Lin, T.Y.; Goyal, P.; Girshick, R.; He, K.M.; Dollar, P. Focal Loss for Dense Object Detection. IEEE Trans. Pattern Anal. Mach. Intell. 2020, 42, 318–327. [Google Scholar] [CrossRef] [PubMed] [Green Version]
  18. Redmon, J.; Farhadi, A. YOLO9000: Better, Faster, Stronger. In Proceedings of the IEEE Conference on Computer Vision and Pattern Recognition, Honolulu, HI, USA, 21–26 July 2017; pp. 6517–6525. [Google Scholar] [CrossRef] [Green Version]
  19. Farhadi, A.; Redmon, J. Yolov3: An incremental improvement. arXiv 2018, arXiv:1804.02767. [Google Scholar]
  20. Erhan, D.; Szegedy, C.; Toshev, A.; Anguelov, D. Scalable Object Detection using Deep Neural Networks. In Proceedings of the 27th IEEE Conference on Computer Vision and Pattern Recognition (CVPR), Columbus, OH, USA, 23–28 June 2014; pp. 2155–2162. [Google Scholar]
  21. Liu, S.; Huang, D.; Wang, Y. Receptive Field Block Net for Accurate and Fast Object Detection. In Proceedings of the European Conference on Computer Vision (ECCV), Munich, Germany, 8–14 September 2018; pp. 404–419. [Google Scholar]
  22. Yi, J.; Wu, P.; Metaxas, D.N. ASSD: Attentive single shot multibox detector. Comput. Vis Image Underst. 2019, 189, 102827. [Google Scholar] [CrossRef] [Green Version]
  23. Najibi, M.; Rastegari, M.; Davis, L.S. G-CNN: An Iterative Grid Based Object Detector. In Proceedings of the 2016 IEEE Conference on Computer Vision and Pattern Recognition (CVPR), Seattle, WA, USA, 27–30 June 2016; Institute of Electrical and Electronics Engineers (IEEE): Piscataway Township, NJ, USA; pp. 2369–2377. [Google Scholar]
  24. Yoo, D.; Park, S.; Lee, J.Y.; Paek, A.S.; Kweon, I.S. AttentionNet: AggregatingWeak Directions for Accurate Object Detection. In Proceedings of the IEEE International Conference on Computer Vision, Santiago, Chile, 11–18 December 2015; pp. 2659–2667. [Google Scholar]
  25. Lin, T.Y.; Dollár, P.; Girshick, R.; He, K.; Hariharan, B.; Belongie, S. Feature pyramid networks for object detection. In Proceedings of the IEEE Conference on Computer Vision and Pattern Recognition, Honolulu, HI, USA, 21–26 July 2017; pp. 2117–2125. [Google Scholar] [CrossRef] [Green Version]
  26. Chen, C.; Gong, W.; Chen, Y.; Li, W. Object Detection in Remote Sensing Images Based on a Scene-Contextual Feature Pyramid Network. Remote Sens. 2019, 11, 339. [Google Scholar] [CrossRef] [Green Version]
  27. Qian, X.; Lin, S.; Cheng, G.; Yao, X.; Ren, H.; Wang, W. Object Detection in Remote Sensing Images Based on Improved Bounding Box Regression and Multi-Level Features Fusion. Remote Sens. 2020, 12, 143. [Google Scholar] [CrossRef] [Green Version]
  28. Li, K.; Cheng, G.; Bu, S.; You, X. Rotation-Insensitive and Context-Augmented Object Detection in Remote Sensing Images. IEEE Trans. Geosci. Remote Sens. 2018, 56, 2337–2348. [Google Scholar] [CrossRef]
  29. Zhang, Z.; Jiang, R.; Mei, S.; Zhang, S.; Zhang, Y. Rotation-Invariant Feature Learning for Object Detection in VHR Optical Remote Sensing Images by Double-Net. IEEE Access 2019, 8, 20818–20827. [Google Scholar] [CrossRef]
  30. Ding, J.; Xue, N.; Long, Y.; Xia, G.-S.; Lu, Q. Learning RoI Transformer for Oriented Object Detection in Aerial Images. In Proceedings of the 2019 IEEE/CVF Conference on Computer Vision and Pattern Recognition (CVPR), Wuhan University, Wuhan, China, 15–20 June 2019; pp. 2844–2853. [Google Scholar]
  31. Yang, X.; Yang, J.; Yan, J.; Zhang, Y.; Zhang, T.; Guo, Z.; Sun, X.; Fu, K. SCRDet: Towards More Robust Detection for Small, Cluttered and Rotated Objects. In Proceedings of the IEEE/CVF International Conference on Computer Vision (ICCV), Seoul, Korea, 27 October–2 November 2019; pp. 8231–8240. [Google Scholar] [CrossRef] [Green Version]
  32. Fu, K.; Chang, Z.; Zhang, Y.; Xu, G.; Zhang, K.; Sun, X. Rotation-aware and multi-scale convolutional neural network for object detection in remote sensing images. ISPRS J. Photogramm. Remote Sens. 2020, 161, 294–308. [Google Scholar] [CrossRef]
  33. Xu, Y.; Fu, M.; Wang, Q.; Wang, Y.; Chen, K.; Xia, G.-S.; Bai, X. Gliding Vertex on the Horizontal Bounding Box for Multi-Oriented Object Detection. IEEE Trans. Pattern Anal. Mach. Intell. 2021, 43, 1452–1459. [Google Scholar] [CrossRef] [PubMed] [Green Version]
  34. Yang, X.; Yan, J.C.; Feng, Z.M.; He, T. R3Det: Refined Single-Stage Detector with Feature Refinement for Rotating Object. In Proceedings of the 35th AAAI Conference on Artificial Intelligence, online, 2–9 February 2021; pp. 3163–3171. [Google Scholar]
  35. Jiang, Y.Y.; Zhu, X.Y.; Wang, X.B.; Yang, S.L.; Li, W.; Wang, H.; Fu, P.; Luo, Z.B. (RCNN)-C-2: Rotational Region CNN for Arbitrarily-Oriented Scene Text Detection. In Proceedings of the 24th International Conference on Pattern Recognition (ICPR), Beijing, China, 20–24 August 2018; pp. 3610–3615. [Google Scholar]
  36. Wu, Y.; Chen, Y.; Yuan, L.; Liu, Z.; Wang, L.; Li, H.; Fu, Y. Rethinking Classification and Localization for Object Detection. In Proceedings of the 2020 IEEE/CVF Conference on Computer Vision and Pattern Recognition (CVPR), Seattle, WA, USA, 13–19 June 2020; pp. 10183–10192. [Google Scholar]
  37. Wang, X.; Girshick, R.; Gupta, A.; He, K. Non-local Neural Networks. In Proceedings of the IEEE/CVF Conference on Computer Vision and Pattern Recognition (CVPR), Salt Lake City, UT, USA, 18–22 June 2018; pp. 7794–7803. [Google Scholar] [CrossRef] [Green Version]
  38. Song, G.; Liu, Y.; Wang, X. Revisiting the Sibling Head in Object Detector. In Proceedings of the 2020 IEEE/CVF Conference on Computer Vision and Pattern Recognition (CVPR), Seattle, WA, USA, 13–19 June 2020; pp. 11560–11569. [Google Scholar]
  39. Liu, Z.; Wang, H.; Weng, L.; Yang, Y. Ship Rotated Bounding Box Space for Ship Extraction from High-Resolution Optical Satellite Images with Complex Backgrounds. IEEE Geosci. Remote Sens. Lett. 2016, 13, 1074–1078. [Google Scholar] [CrossRef]
Figure 1. The object detection network structure diagram of the proposed TPR-R2CNN.
Remotesensing 13 04517 g001
Figure 2. The detection results of slender and densely arranged objects with horizontal bounding boxes: (a) large vehicle and (b) ship, small vehicle.
Remotesensing 13 04517 g002
Figure 3. The FPN network structure diagram.
Remotesensing 13 04517 g003
Figure 4. Examples of detection results with different regression methods: (a) detection result with R2CNN and (b) detection result with TPR-R2CNN.
Remotesensing 13 04517 g004
Figure 5. Comparison of different detection heads: (a) single fully connected (2-fc) head; (b) double fully connected head; and (c) double fully connected head with classification fusion.
Remotesensing 13 04517 g005
Figure 6. Object size in the DOTA-v1.5 dataset.
Remotesensing 13 04517 g006
Figure 7. Object number in the DOTA-v1.5 dataset.
Remotesensing 13 04517 g007
Figure 8. An example of a P–R curve.
Remotesensing 13 04517 g008
Figure 9. Some visual results of detection with TPR-R2CNN (double head with classification fusion) network (the threshold score is 0.5) for the HRSC2016 dataset.
Remotesensing 13 04517 g009aRemotesensing 13 04517 g009b
Figure 10. Some visual results of detection with TPR-R2CNN (double head with classification fusion) network (the threshold score is 0.5) for the DOTA-v1.5 dataset: (a) large vehicle, small vehicle; (b) roundabout, small vehicle; (c) tennis court, small vehicle; (d) oil tank, ship, and small vehicle; (e) plane, large vehicle, and small vehicle; (f) ship, small vehicle; (g) football field, tennis court, small vehicle, baseball diamond, basketball field, and swimming pool; (h) harbor; (i) baseball diamond; (j) football field, ground-track-field, and large vehicle; (k) bridge; (l) helicopter; and (m) plane, large vehicle, and small vehicle.
Remotesensing 13 04517 g010aRemotesensing 13 04517 g010bRemotesensing 13 04517 g010c
Figure 11. Comparison of R2CNN and TPR-R2CNN detection result (the threshold of score is 0.5). (a,b) ship, storage tank; (c,d) large vehicle; and (e,f) harbor.
Remotesensing 13 04517 g011
Figure 12. Comparison of horizontal box and oriented box detection result (the threshold score is 0.5). (a,b) Large vehicle; (c,d) ship; and (e,f) large vehicle, small vehicle.
Remotesensing 13 04517 g012
Figure 13. An example of R2CNN and TPR-R2CNN detection results: (a) the detection result of R2CNN and (b) the detection result of TPR-R2CNN (the score threshold is 0.05).
Remotesensing 13 04517 g013
Table 1. IoUs of frames with different aspect ratios under various angles.
Angle (Degree)2468101214161820
Aspect Ratio
2:10.920.840.780.720.660.610.560.520.480.44
3:10.890.800.710.630.560.500.440.390.340.30
4:10.860.740.640.550.470.400.330.270.220.17
5:10.830.700.580.480.380.310.240.170.110.06
6:10.810.650.520.400.310.220.150.080.020.00
Table 2. Confusion matrix. P: Positive; N: negative; TP: true positive; FP: false positive; FN: false negative; TN: true negative.
Actual ValuePredicted Value
YN
YTPFN
NFPTN
Table 3. Comparison of detection rate and mAP on HRSC2016 dataset. TPR: Three-point regression; DH: double detection head; CF: classification fusion.
Detection NetworkTPRDHCFDetection Rate (fps)mAP (%)
R2CNN 48.674.11
TPR-R2CNN (Proposed) 48.288.16
TPR-R2CNN (Proposed) 46.688.61
TPR-R2CNN (Proposed)45.889.38
Table 4. Comparison of detection rate (fps) on DOTA-v1.5 dataset. TPR: Three-point regression; DH: double detection head; CF: classification fusion.
Detection NetworkTPRDHCFDetection Rate (fps)
R2CNN 28.7
TPR-R2CNN (Proposed) 27.2
TPR-R2CNN (Proposed) 27.3
TPR-R2CNN (Proposed)27.2
Table 5. Comparison of the AP (%) of each class for the DOTA-v1.5 dataset. DH: Double detection head; CF: classification fusion.
ClassR2CNNTPR-R2CNNTPR-R2CNN
(DH)
TPR-R2CNN
(DH + CF)
Increment
Plane87.7487.8587.8088.791.05
Baseball diamond60.8460.9762.6060.30−0.54
Bridge43.1648.8048.0649.656.49
Ground and field64.8762.0363.0165.240.37
Small vehicle45.7547.7548.6448.192.44
Large vehicle48.3955.6156.5555.967.57
Ship69.8573.2874.0275.375.52
Tennis court56.1967.7464.6568.5612.37
Basketball court54.7849.9757.7956.151.37
Storage tank71.0670.9871.3071.03−0.03
Soccer field50.5952.2858.2150.680.09
Roundabout64.0364.4066.7766.482.45
Harbor54.0062.0064.4664.2510.25
Swimming pool53.4356.1958.0857.303.87
Helicopter47.6547.0946.6656.618.96
Container crane0.000.000.020.260.26
mAP (%)54.5256.6858.1558.423.90
Table 6. Comparisons with the state-of-the-art methods on HRSC2016.
Detection NetworkBackboneDetection Rate (fps)mAP (%)
R2CNNResNet50374.11
Gliding VertexResNet1011088.20
RoI TransformerResNet101686.20
R3DetResNet1011289.26
TPR-R2CNN (Proposed)ResNet502.989.38
Publisher’s Note: MDPI stays neutral with regard to jurisdictional claims in published maps and institutional affiliations.

