Abstract
Recent advances in autonomy of unmanned aerial vehicles (UAVs) have increased their use in remote sensing applications, such as precision agriculture, biosecurity, disaster monitoring, and surveillance. However, onboard UAV cognition capabilities for understanding and interacting in environments with imprecise or partial observations, for objects of interest within complex scenes, are limited, and have not yet been fully investigated. This limitation of onboard decision-making under uncertainty has delegated the motion planning strategy in complex environments to human pilots, which rely on communication subsystems and real-time telemetry from ground control stations. This paper presents a UAV-based autonomous motion planning and object finding system under uncertainty and partial observability in outdoor environments. The proposed system architecture follows a modular design, which allocates most of the computationally intensive tasks to a companion computer onboard the UAV to achieve high-fidelity results in simulated environments. We demonstrate the system with a search and rescue (SAR) case study, where a lost person (victim) in bushland needs to be found using a sub-2 kg quadrotor UAV. The navigation problem is mathematically formulated as a partially observable Markov decision process (POMDP). A motion strategy (or policy) is obtained once a POMDP is solved mid-flight and in real time using augmented belief trees (ABT) and the TAPIR toolkit. The system’s performance was assessed using three flight modes: (1) mission mode, which follows a survey plan and used here as the baseline motion planner; (2) offboard mode, which runs the POMDP-based planner across the flying area; and (3) hybrid mode, which combines mission and offboard modes for improved coverage in outdoor scenarios. Results suggest the increased cognitive power added by the proposed motion planner and flight modes allow UAVs to collect more accurate victim coordinates compared to the baseline planner. Adding the proposed system to UAVs results in improved robustness against potential false positive readings of detected objects caused by data noise, inaccurate detections, and elevated complexity to navigate in time-critical applications, such as SAR.
1. Introduction
The elevated number of stranded people and human loss caused by natural disasters, weather events, crime, and military conflicts is an ever-present issue [1]. According to the Australian Institute of Criminology, an average of 38,000 people are reported missing per year in Australia [2]. Unfortunately, around 2% of them (or 720 persons) are never found, and 2600 are reported (long-term) missing for more than three months. Thus, it is beneficial to improve search and rescue (SAR) efforts by developing technology that cooperates with first responders to locate as many victims as soon as an emergency situation is declared.
Recent advances in autonomy of unmanned aerial vehicles (UAVs)—or drones—have increased their adoption in time-critical applications, such as disaster monitoring, surveillance, and SAR [3,4,5,6]. Compared to manned aircraft, UAVs offer high versatility to scout areas due to their reduced size and cost, extensive payload adaptability, and ease of piloting by incorporating automated tasks, including waypoint navigation, obstacle avoidance, and autonomous take-off and landing [7,8,9]. In time-critical applications, such as SAR, real-time camera streaming is critical for UAV operators to understand the situation context and manoeuvre the aircraft during the mission [10]. However, this strong reliance in the communication system compromises the usability of UAVs if such systems fail [11]. Furthermore, operators are susceptible to fatigue in the long run by controlling the UAV and photo-interpreting streamed camera frames to find victims [12]. As a result, developing decision-making algorithms onboard UAVs could further expand their applicability in civilian and time-critical applications. UAVs enriched with autonomous onboard object detection for real-time decision making eliminate the dependency of UAV pilots to photo-interpret streamed frames, and in their communication systems to control the aircraft.
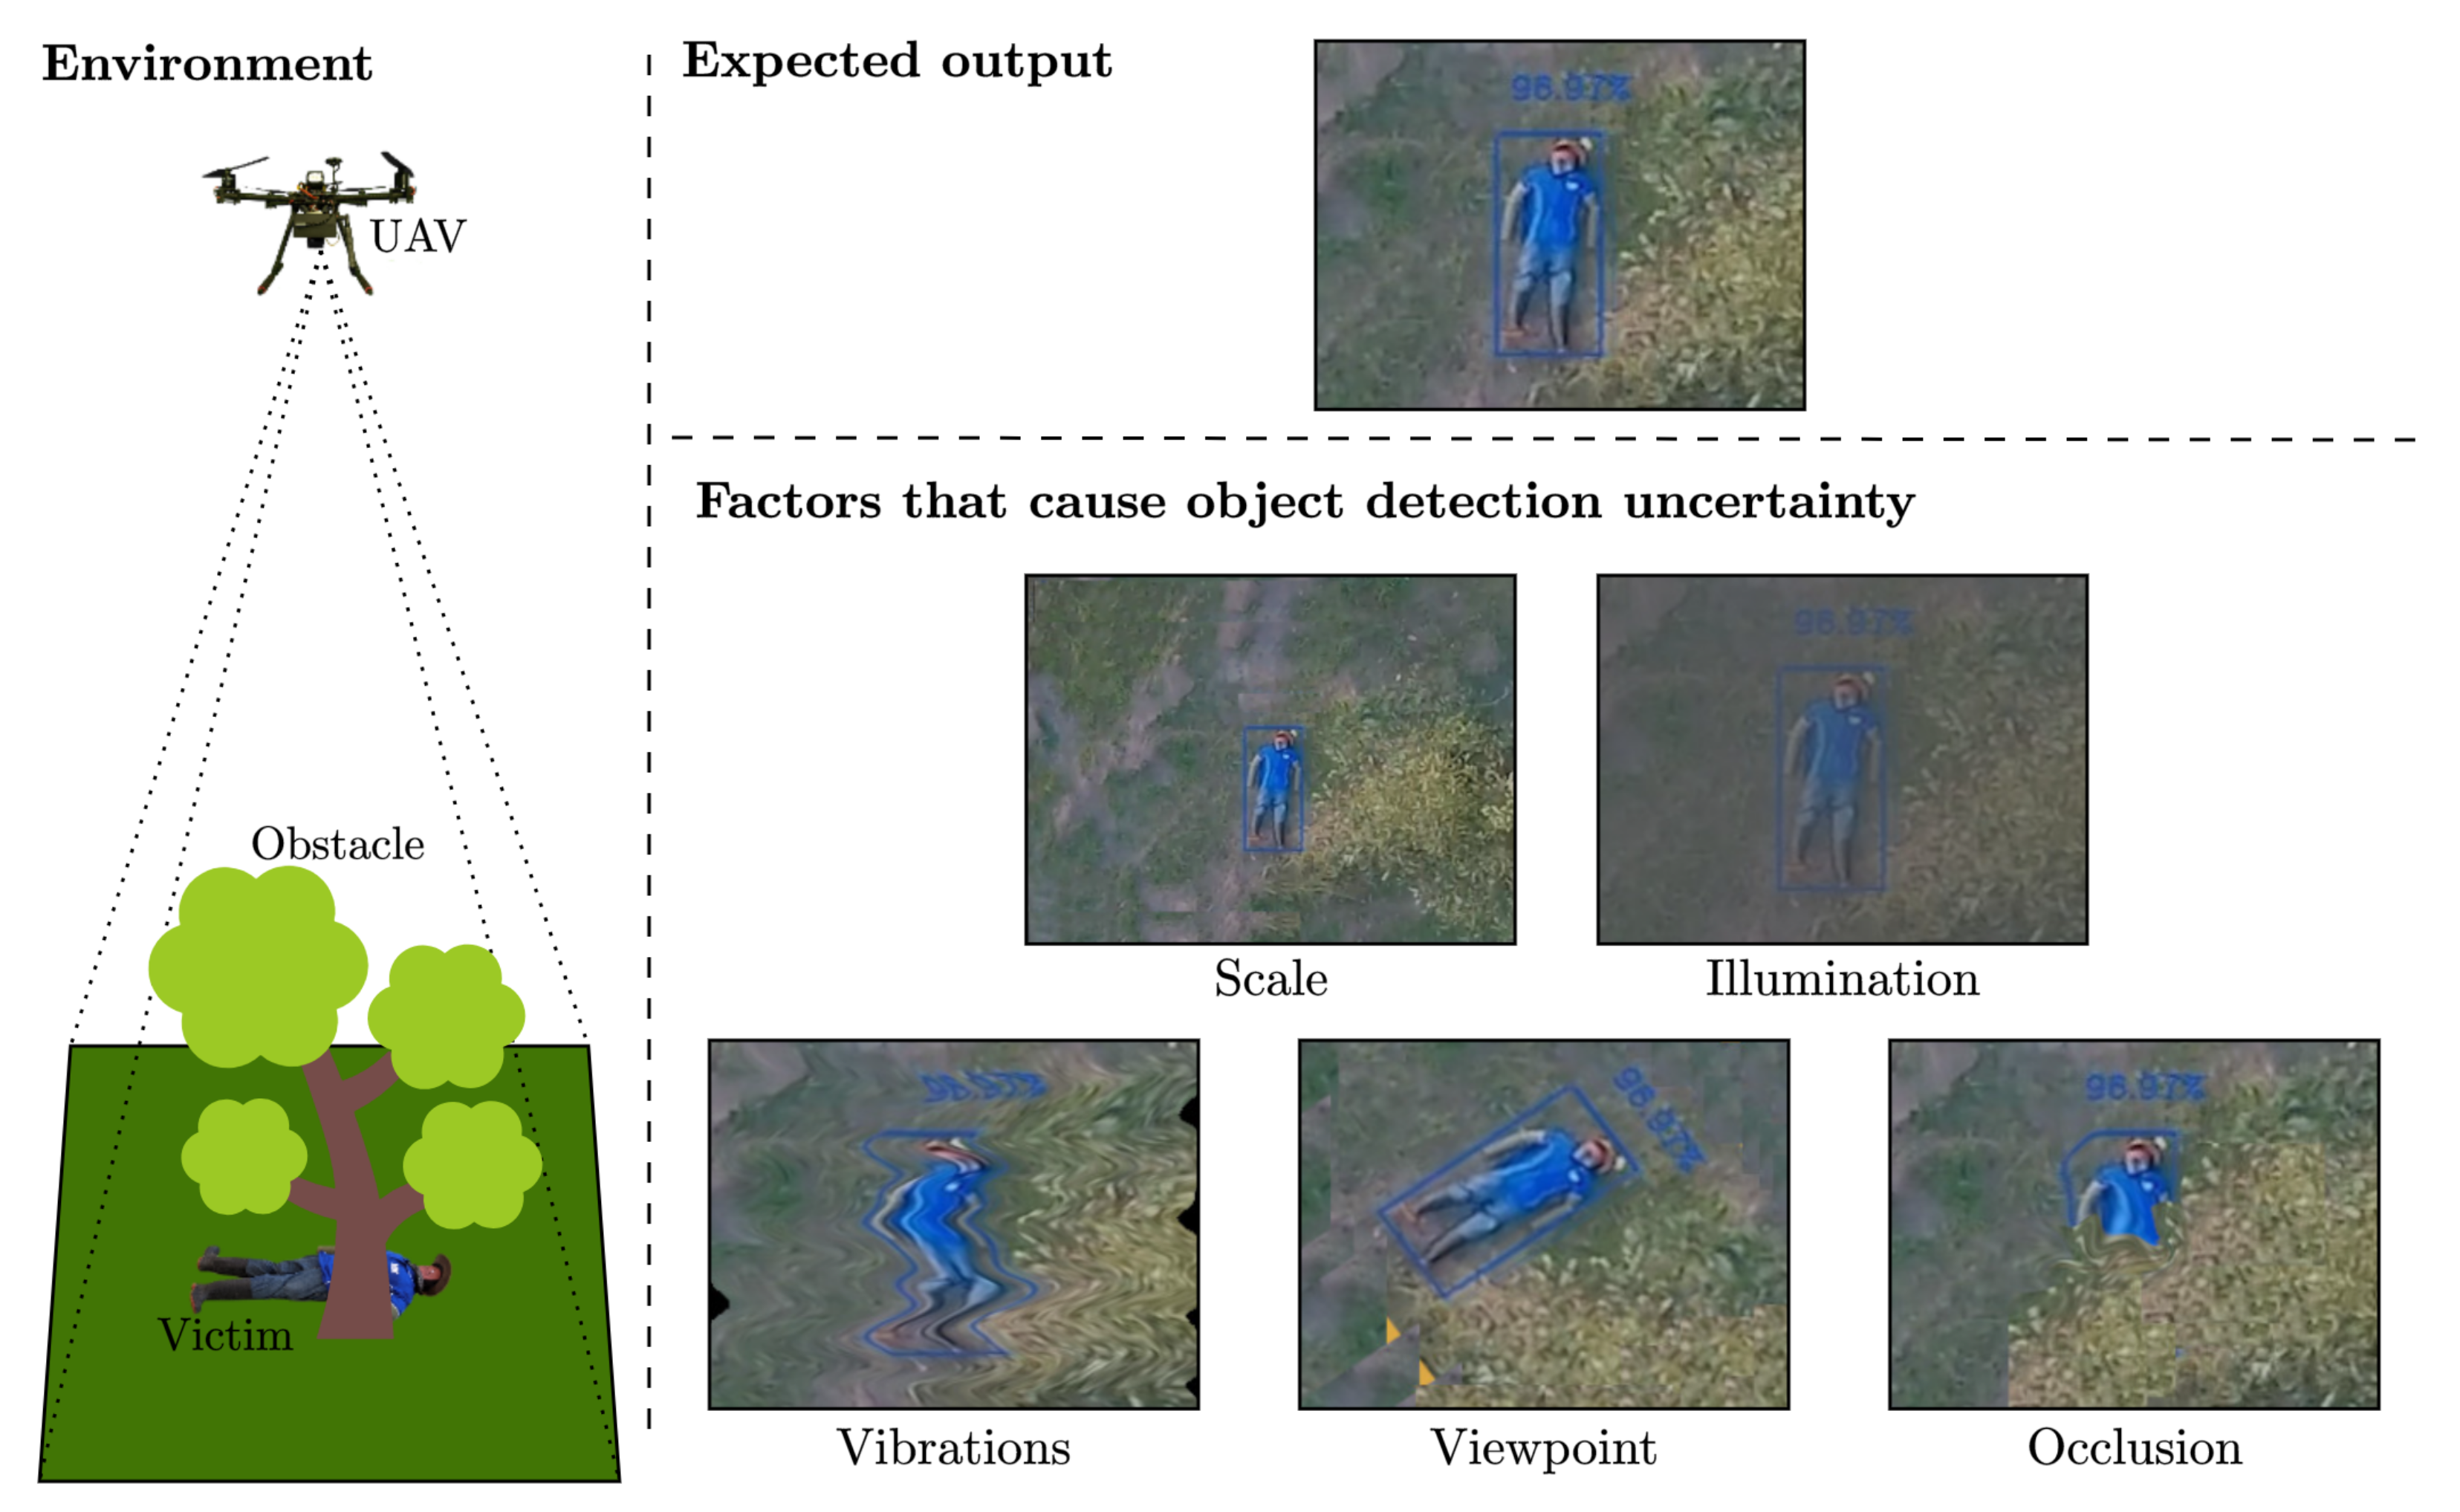
Real-world and time-critical UAV applications are full of uncertainties. As shown in Figure 1, uncertainty comes from uncontrolled external factors, such as unknown environment conditions, strong wind gusts, dynamic obstacles, suboptimal survey altitude, and partial observability. Research has demonstrated that applied theory on decision making using partially observable Markov decision processes (POMDPs) can increase cognition capabilities in UAVs for autonomous path planning under uncertainty [13,14,15]. UAV frameworks for real-time target finding and tracking in cluttered indoor environments under uncertainty [16,17] have been developed by using augmented belief trees (ABT) [18], an online POMDP solver that computes and updates motion policies in real time. Similarly, POMDPs have also been used to solve multi-objective UAV tasks, such as collision avoidance, path planning, and multiple target tracking [19,20]. In the SAR domain, autonomous navigation in humanitarian relief operations have also been tested using POMDPs, with most of the implementations achieving experimental results only in simulation [21,22]. A recent research work towards real-world tests shows a UAV motion planner implementation using the SARSOP POMDP solver [23] onboard a small UAV (UAVs with a maximum take-off weight (MTOW) of 13.5 kg [24]). However, the system was only validated using trivial targets and not with humanoid-shaped mannequins [25].
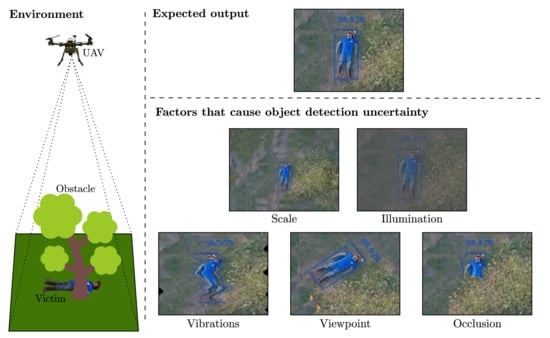
Figure 1.
Factors that can cause object detection uncertainty and partial observability during UAV surveys. Incorporating algorithms in decision-making under uncertainty onboard UAVs increase their reliability to explore complex and time-critical environments, such as search and rescue.
Uncertainty in time-critical UAV operations is not limited to external factors. Internal UAV systems, which also generate uncertainty include noisy camera frames during streaming, low image resolution, suboptimal camera settings, and inaccurate detection outputs from vision-based object detectors. Research works on onboard decision-making in small UAVs for autonomous navigation under object detection uncertainty from Convolutional Neural Network (CNN) models are scarce. Some of the closest approaches are the studies from Sandino et al. [26,27], which describe a framework and POMDP problem formulation for a SAR application in a global navigation satellite system (GNSS)-denied environment using a sub-2 kg UAV. The framework was tested in simulation and with real flight tests indoors, simulating a collapsed building scenario. Another study presented by Chanel et al. [28] shows an autonomous multiple-car detector using a UAV and a POMDP optimised mid-flight. However, there are limitations with reproducibility; relevant experimental details are not disclosed, such as the UAV frame, companion computer, payload, and computer vision algorithms.
This paper presents an autonomous drone motion planning and object finding system under object detection uncertainty for outdoor environments. The UAV exploration and object inspection tasks are mathematically formulated using a POMDP, which models uncertainty with probabilistic distributions. A case study inspired by SAR is illustrated below, where a small UAV is deployed to locate a missing person (victim) in a bushland region. Two victim locations across a simulated flight area were evaluated to test the system at various levels of occlusion.
This work evaluates the performance of the proposed motion planner by operating the UAV with the following flight modes: (1) mission mode (baseline motion planner), which uses a traditional survey flight plan to explore the area of interest; (2) offboard mode, where the POMDP-based motion planner fully controls the behaviour of the UAV for exploration and inspection of areas from detections of potential victims; and (3) hybrid mode, which uses mission mode to explore the area of interest and triggers offboard mode to inspect dedicated regions from past detections of potential victims. The proposed UAV system design uses hardware in the loop (HIL) to integrate a physical companion computer into the simulation environment. By using HIL to run the decision-making and vision algorithms, it is possible to obtain performance results comparable with those obtained with real flight tests.
2. System Architecture
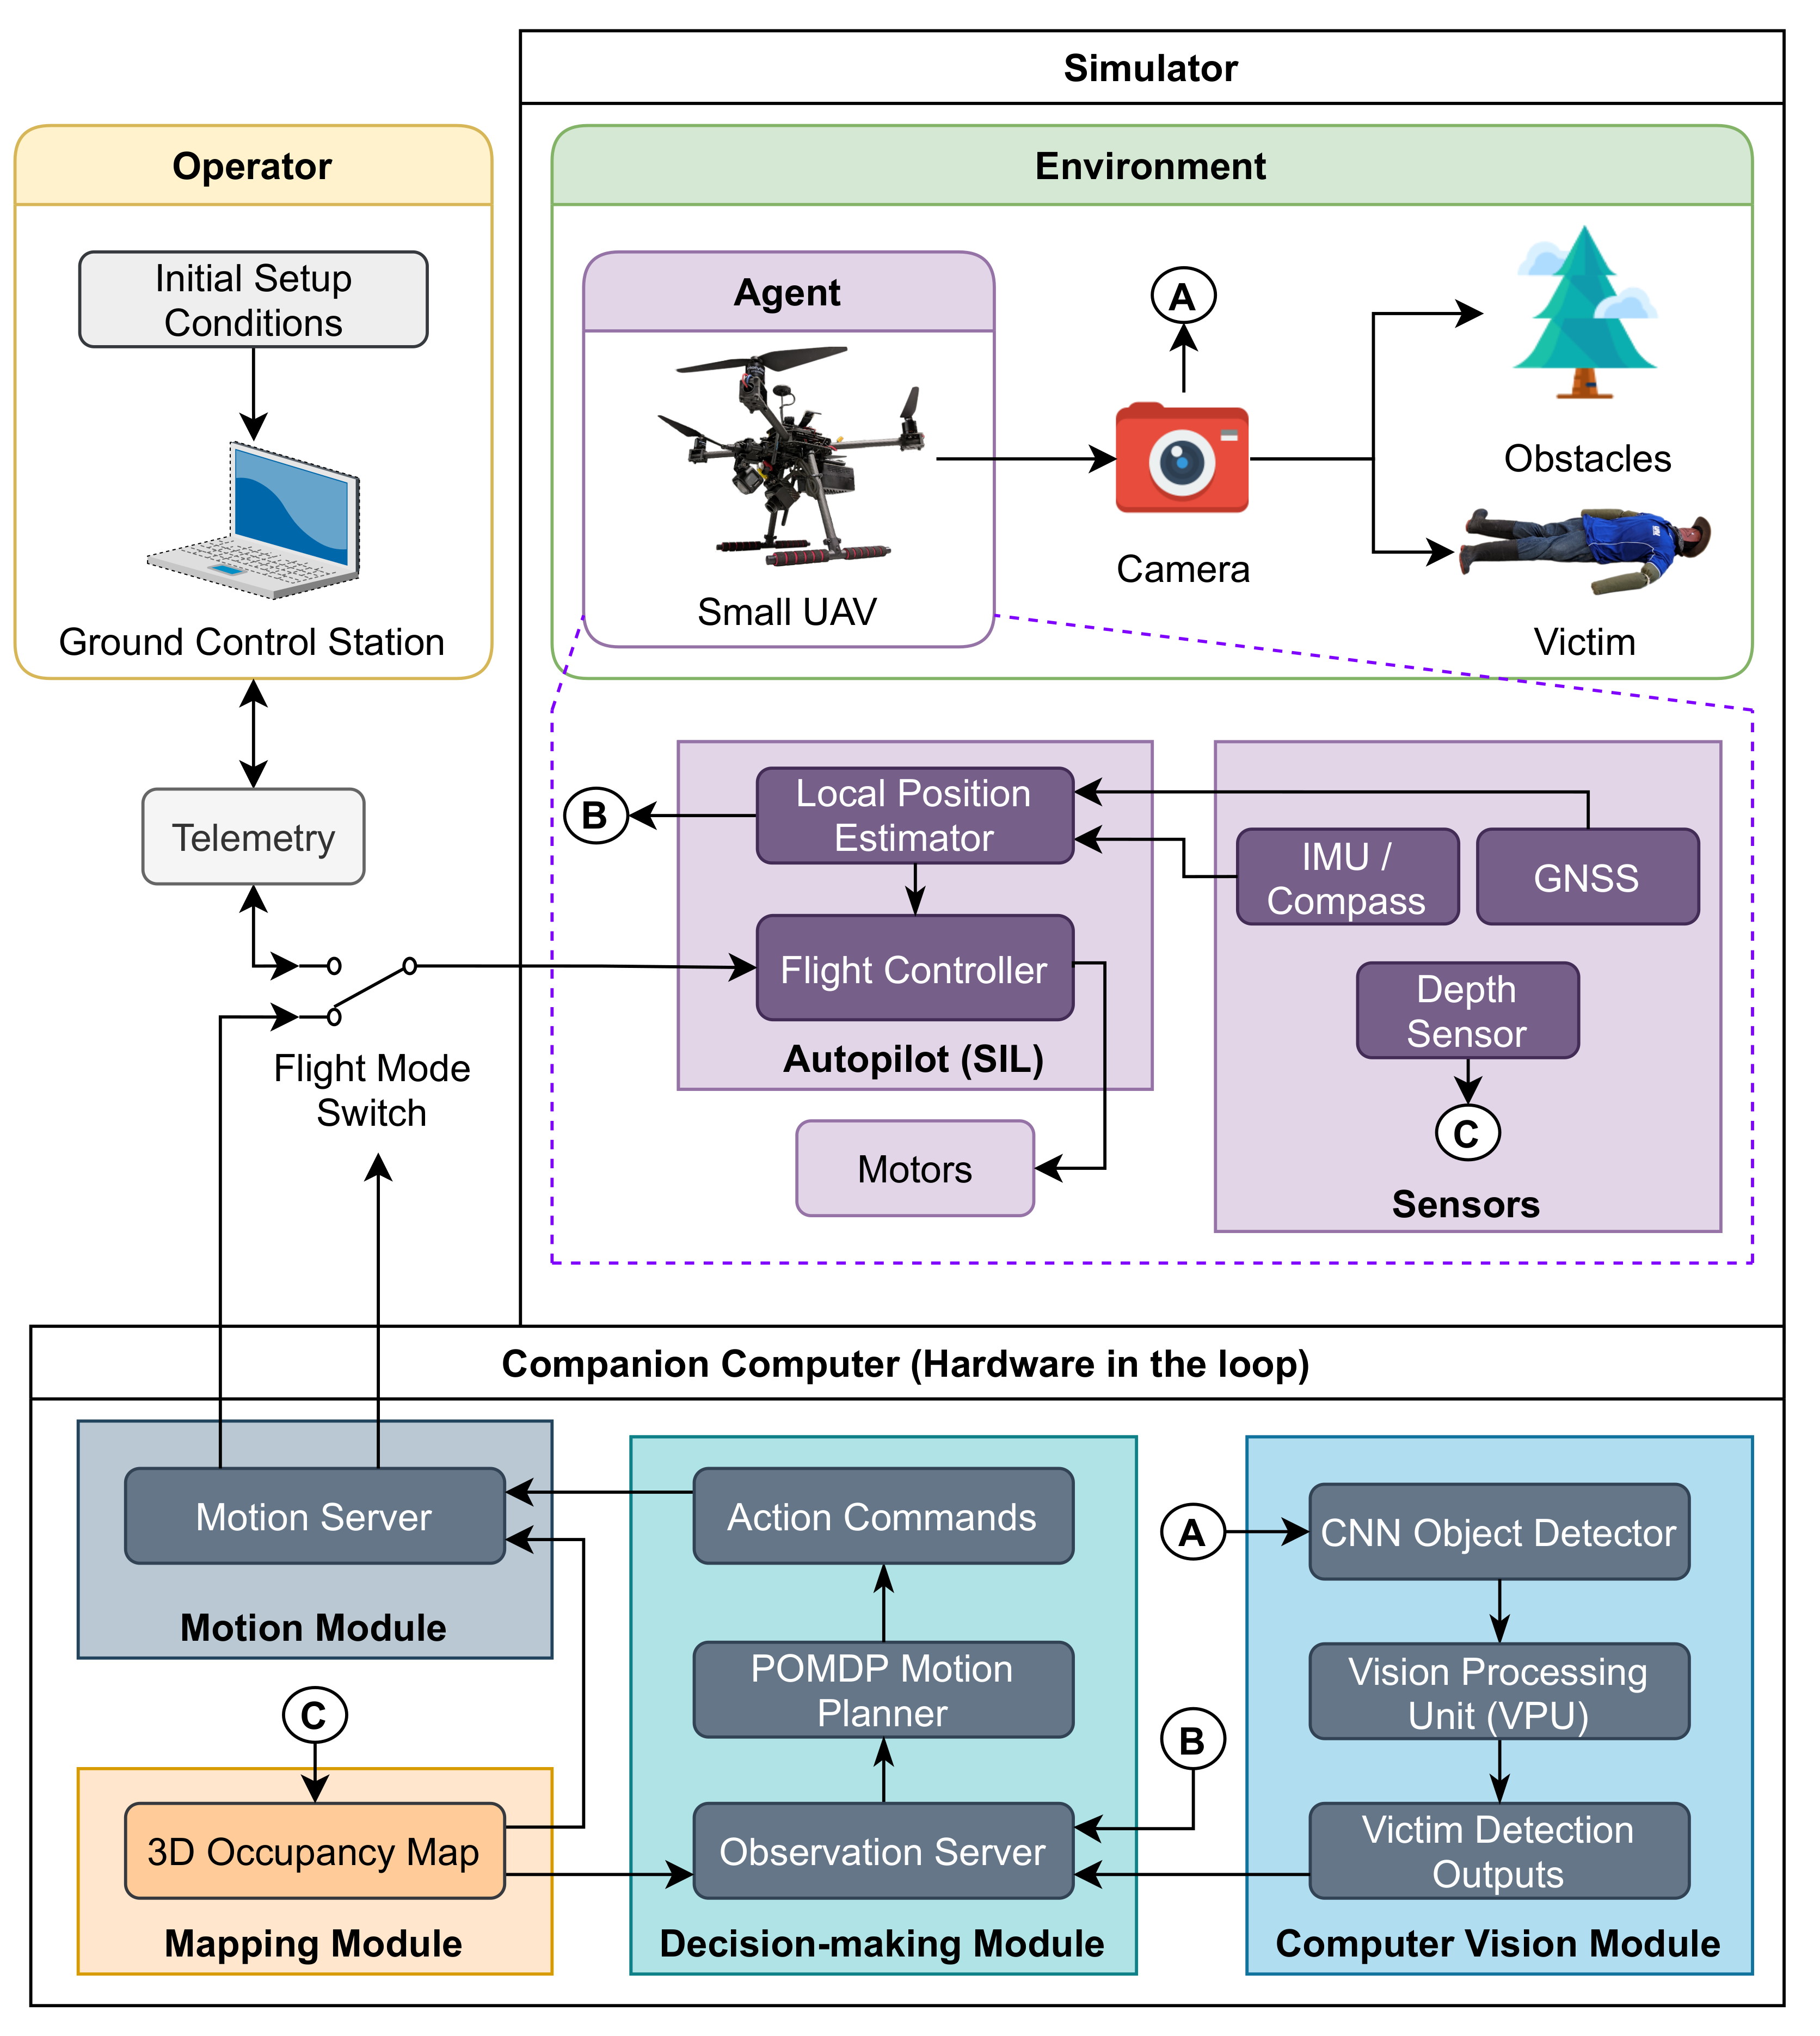
The system architecture uses a modular design that allocates tasks to dedicated nodes, as shown in Figure 2. This architecture design allows users to collect experimental data in simulated environments to be as close as possible to data collected on real-world tests.
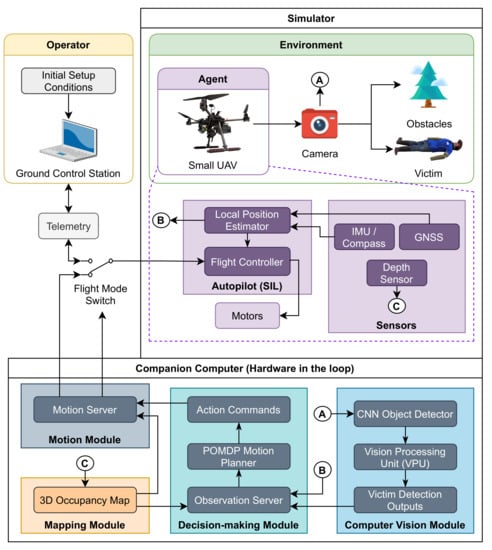
Figure 2.
System architecture for applications with rich global navigation satellite system (GNSS) coverage. The environment, UAV, payloads, victim, and obstacles are emulated in a simulator. The computer vision, decision-making, mapping, and motion modules run in hardware in the loop (HIL) using a companion computer.
The proposed system architecture categorises its modules into two primary categories, namely the simulator and the companion computer (operating under HIL). The simulator is comprised by items within in the simulated environment including models of the UAV body frame, payloads (i.e., cameras), the victim and relevant obstacles. In addition, the simulator contains plugins to add the UAV’s autopilot in the software in the Loop (SIL) mode, and relevant peripheral sensors. The readings of these simulated sensors are used by the autopilot to run its local position estimator based on an extended Kalman filter (EKF). The second category contains the system modules that can be run onboard a UAV’s companion computer using HIL, namely, the Computer vision module, decision-making module, mapping module, and motion module. Specific implementations to enable SIL and HIL are covered in detail in Section 4.
Each sequential decision process starts by capturing observations of the environment, calculating an action using the motion planner, and then the UAV applying the action. The entire sequence is monitored via telemetry using the ground control station, enabling the operator switch between the autonomous motion planner and manual control if required. Beginning the sequence, environment observations are collected using streamed camera frames, and processed in the computer vision module. This module detects people and their location inside the camera frames with a CNN. As CNNs require mathematical operations, which are computationally expensive in embedded hardware, system resources allocated to run CNN models are delegated to the vision processing unit (VPU). Any positive victim detection outputs are ultimately sent to the decision-making module and managed using the observation server.
The decision-making module is primarily constituted by the POMDP motion planner and the observation server. The observation server handles any data traffic requested by the motion planner, such as local position estimations by the autopilot, any positive detections by the computer vision module, and 3D occupancy maps by the mapping module. This map is constituted by volumetric occupancy grids and displays the presence and localisation of obstacles in the surveyed environment. In this implementation, the 3D occupancy map is used by the decision-making and motion modules for obstacle avoidance and collision prevention, respectively.
The motion planner features a POMDP to mathematically formulate the sequential decision-making problem. The POMDP-based motion planner outputs action commands to the motion module, which will subsequently translate and send these commands to the flight controller. Lastly, the flight controller adjusts the control signals to the UAV motors to reflect the requested action from the motion planner, and an idle period is granted to the system while the UAV moves to the next location.
3. Motion Planner Design
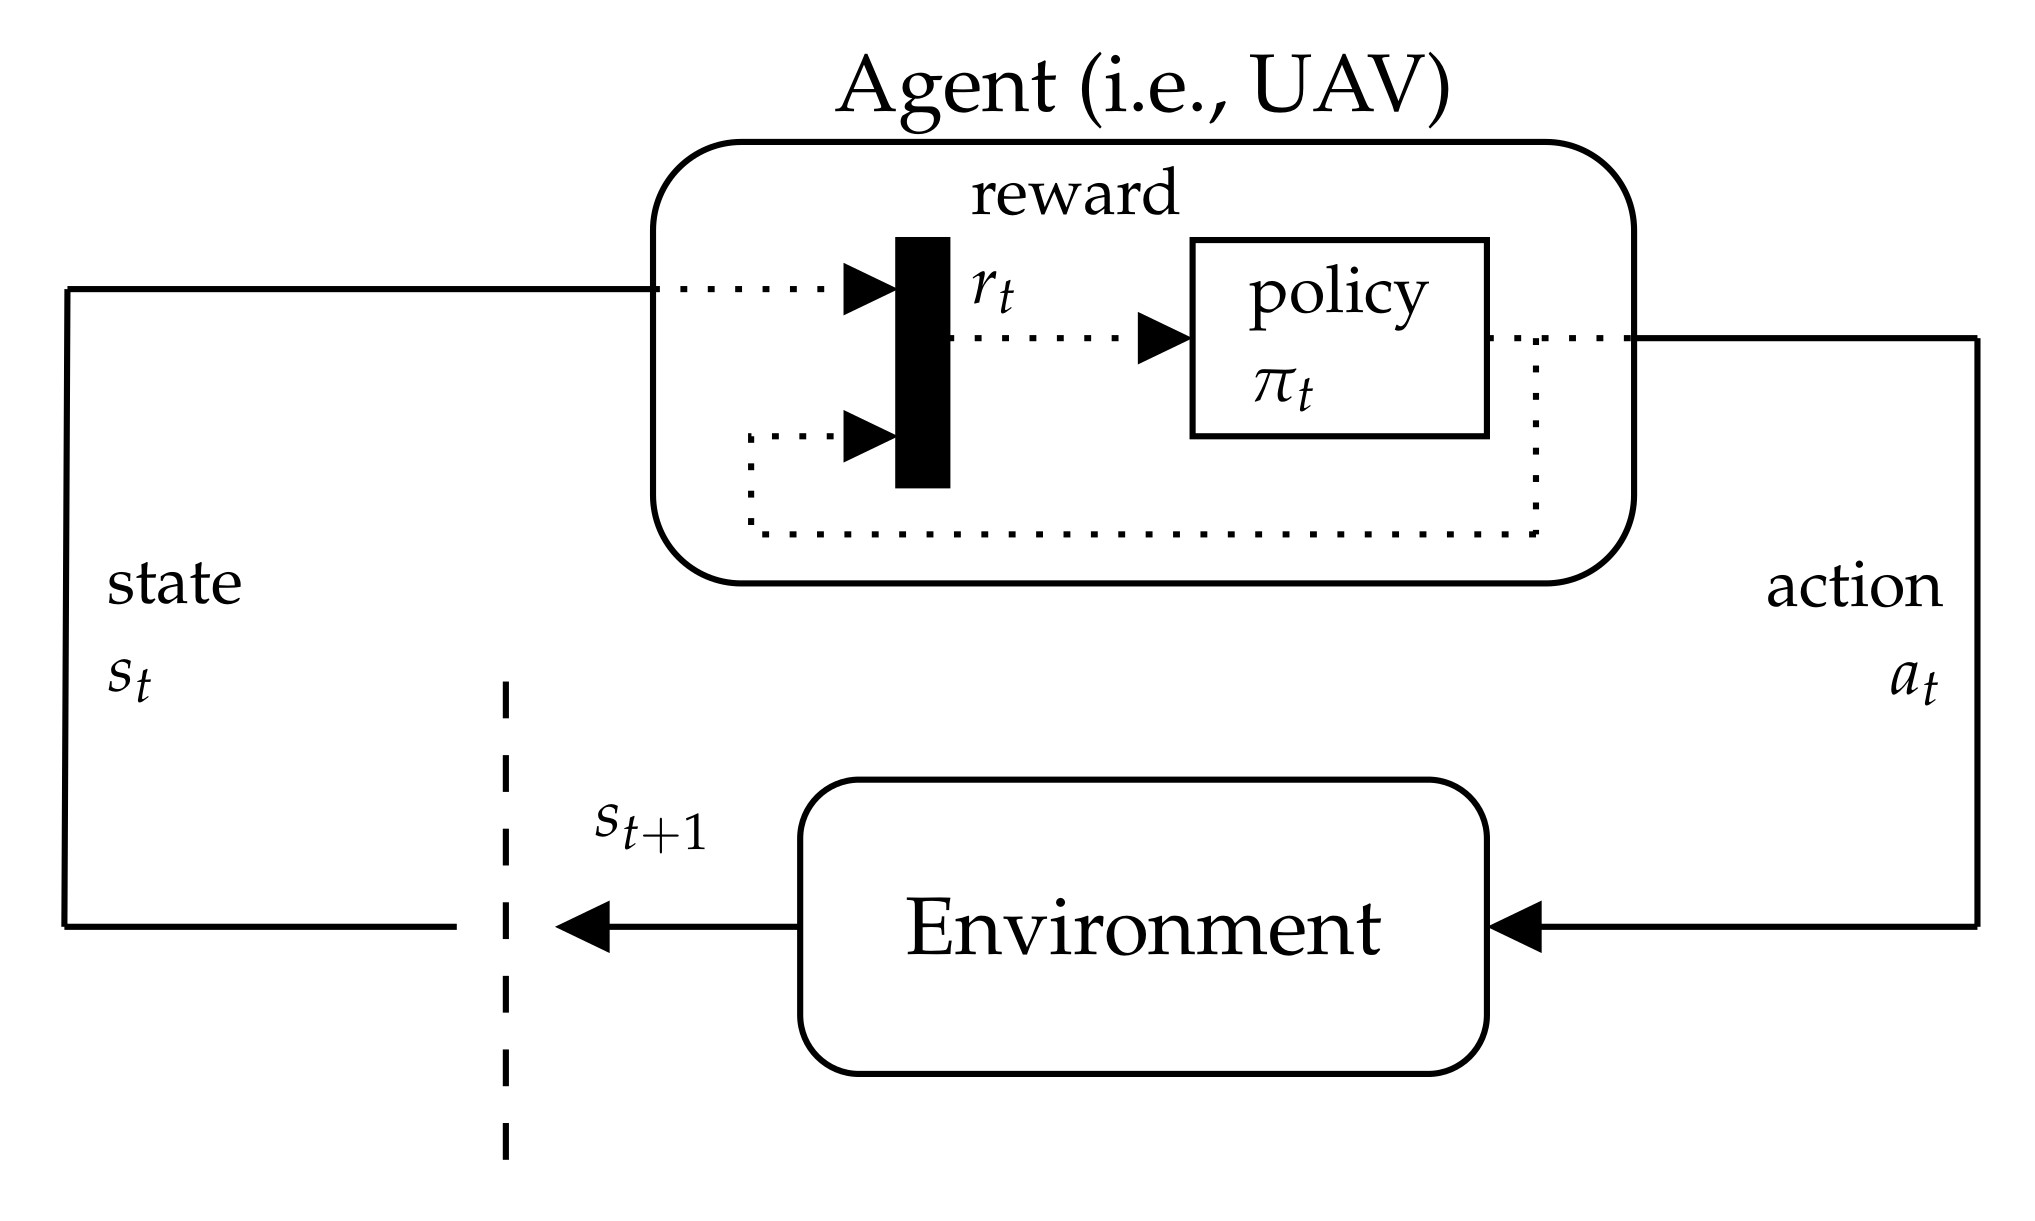
A decision-making problem for autonomous navigation in UAVs can be formulated as the sequence of actions A that the UAV (or agent) needs to take to accomplish a mission goal. This set of actions are limited to the operational abilities of the UAV within the environment. States S are defined as the set of parameters that outline the system. Every action taken by the UAV causes a change of state in the time domain. An illustration of the interaction between the agent and the environment is depicted in Figure 3.
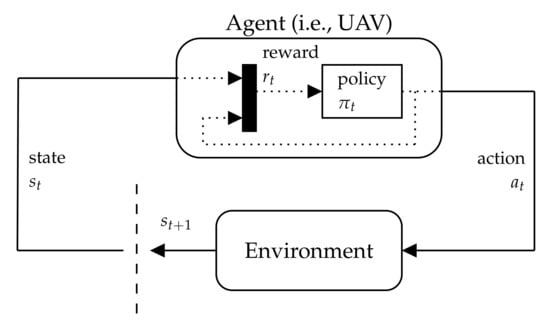
Figure 3.
Interaction between the UAV (or agent) and the environment under the framework of Markov decision processes (MDPs).
Each change of state (or action–state chain) is quantified with a reward r. By giving numerical values to every action–state chain, the behaviour of the UAV can be influenced by seeking the highest possible reward when specific desired states are reached (e.g., locating a victim without colliding with nearby obstacles). Simultaneously, action–state combinations that lead to undesirable future states (e.g., colliding with nearby obstacles, or flying beyond the survey geofence) could be quantified with a penalty (or negative reward). Therefore, these problems can be solved by finding the optimal sequential set of actions that a UAV should take to obtain the highest possible accumulated reward as quick as possible [29].
Data received by UAV of the environment (or observations) from its sensors and processed vision outputs (i.e., CNN model detections) in real-world applications are, unfortunately, noisy, incomplete or inaccurate. These imperfections restrict the inference of actual system states, which have inspired the mathematical formulation of POMDPs [30].
This work uses a POMDP to compute a motion policy, which outputs low-level action commands derived using environment observations. A POMDP [31] is a tuple , where A is a finite set of UAV actions, S is a finite set of states, and O is a finite set of observations. Each time the UAV takes an action from a state , the probability of moving to a new state is defined by a transition function . After an action is taken, the UAV receives an observation followed by an observation function . Lastly, the model quantifies every decision chain (or action taken from state ) with a reward r, calculated using the reward function .
In real-world applications, UAVs are limited to capture partial information about the surveyed environment (and the objects to be detected). A POMDP models the uncertainty given by partial observability of its observed states using a probability distribution over the system states. This modelling is known as the belief b, defined as follows:
where H is the history of actions, observations, and rewards the UAV has experienced until a time step t.
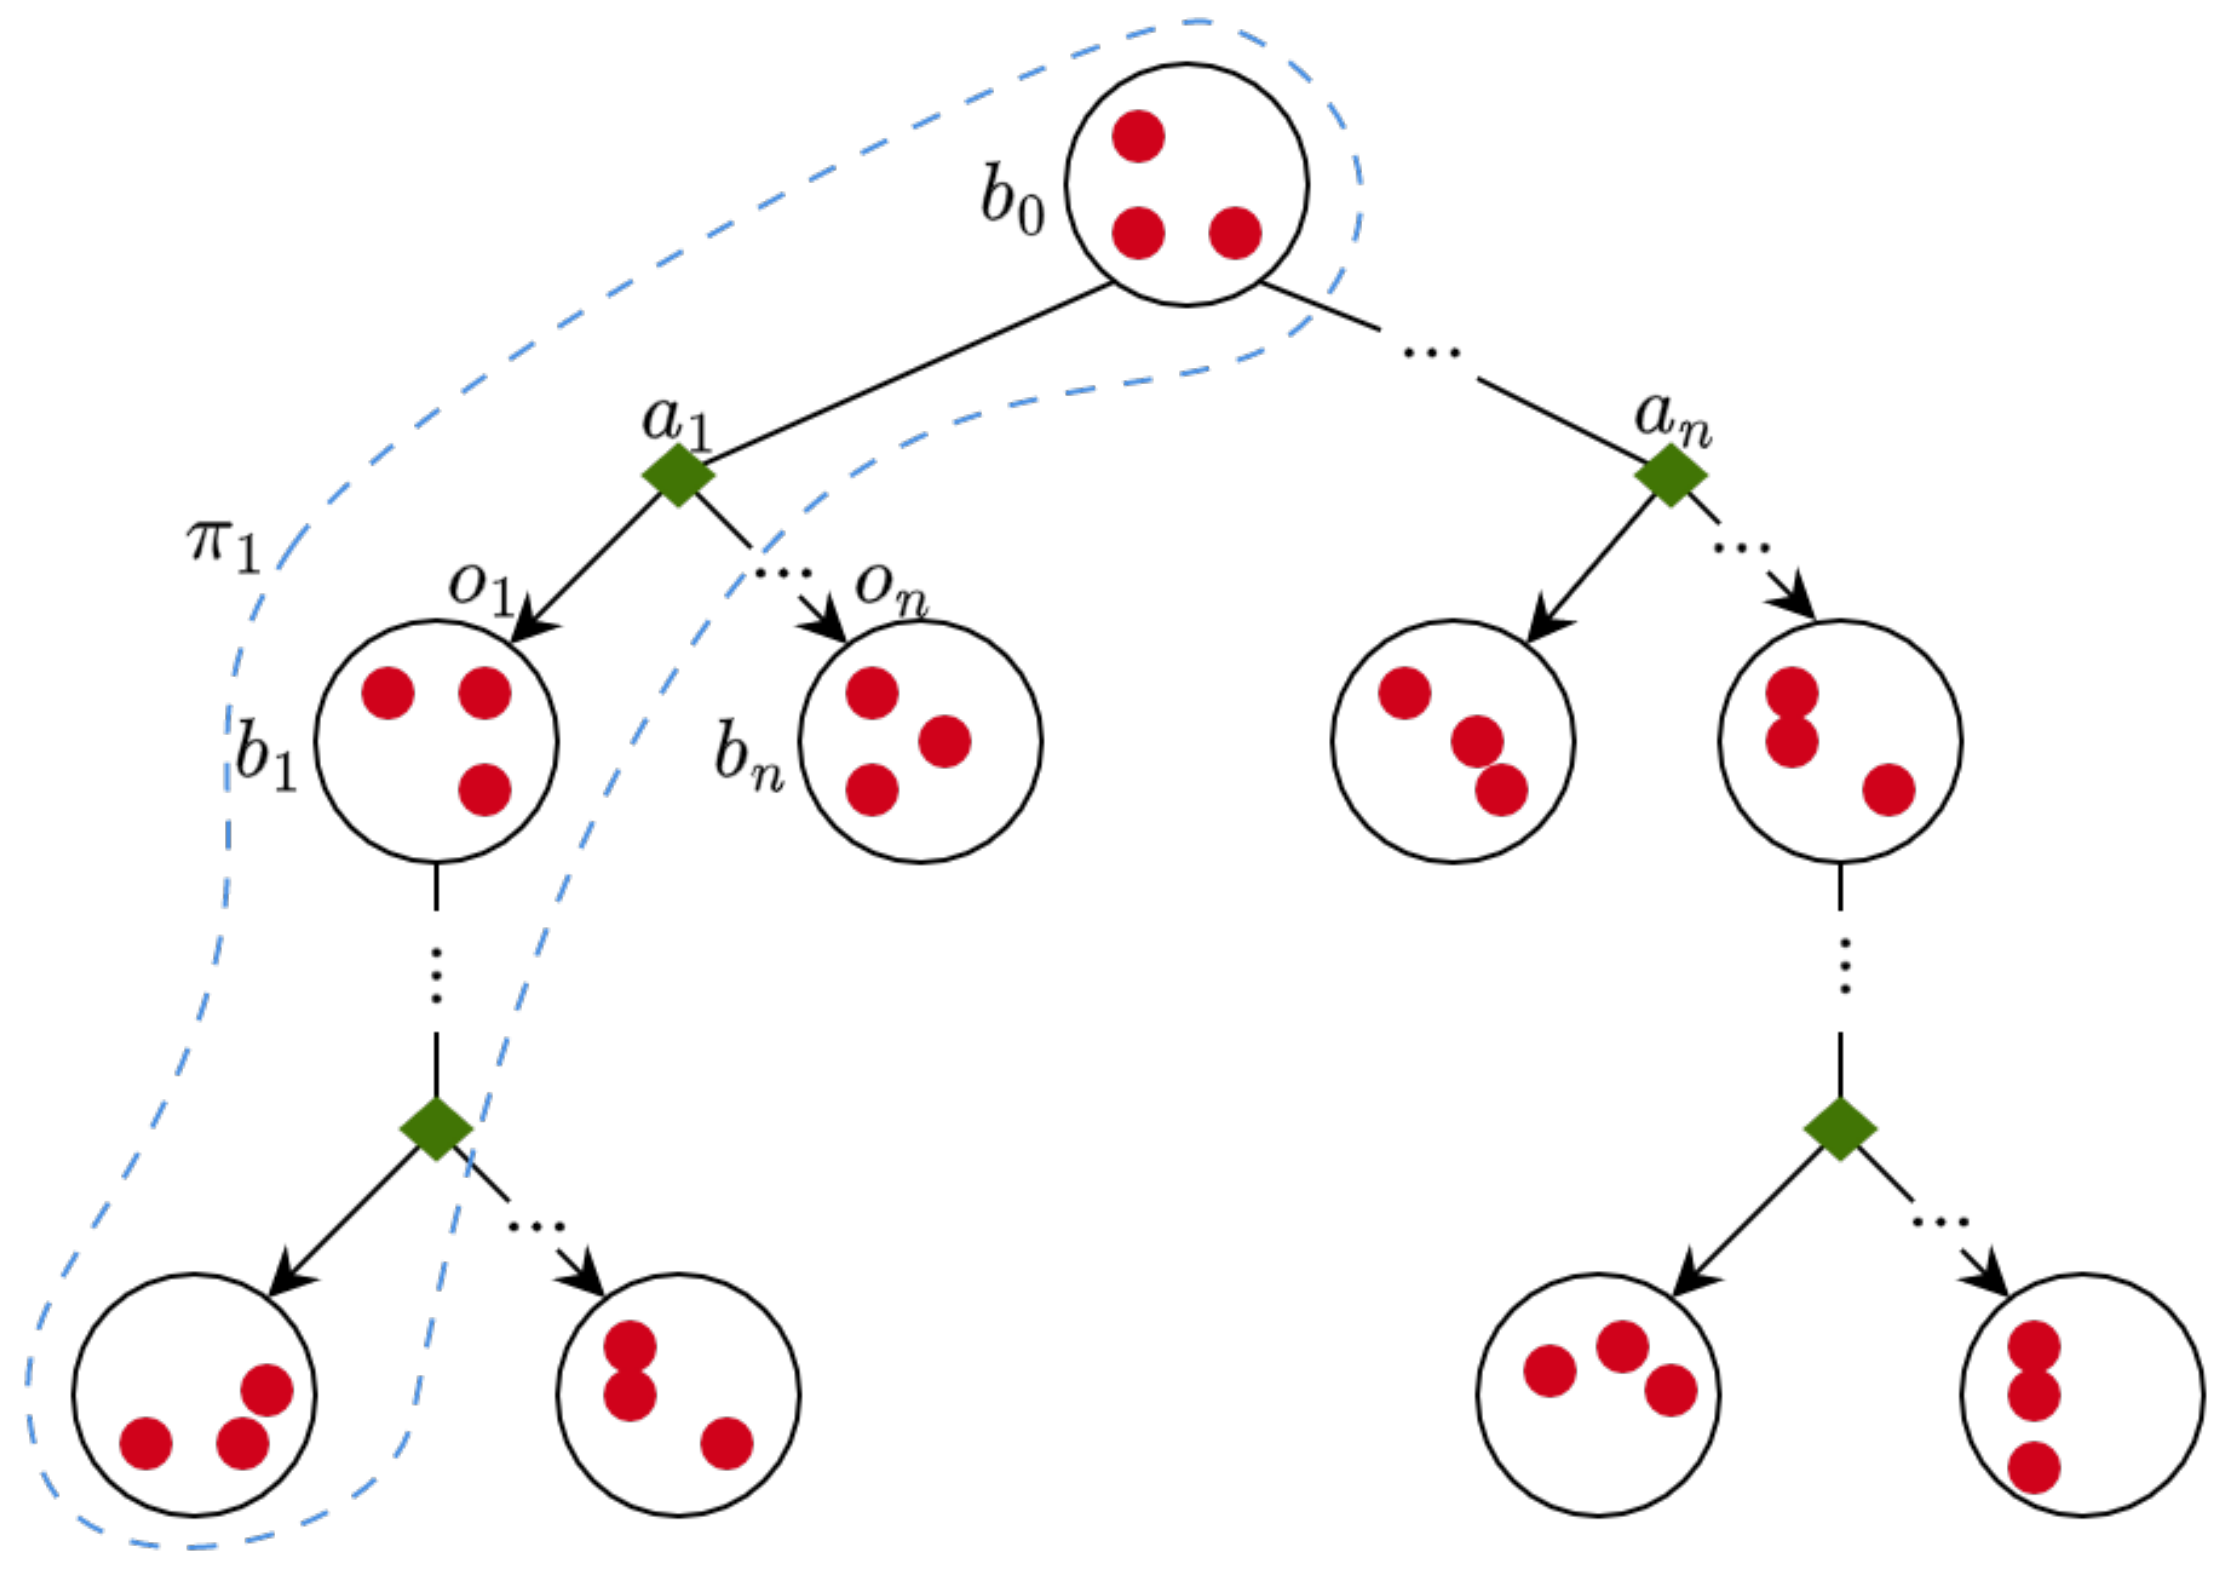
A POMDP solver starts planning from an initial belief , which is usually generated using the initial conditions (and assumptions) of the flight mission. When an observation is made, the belief distribution is subsequently updated. The motion policy of the UAV is represented by mapping belief states to actions . An illustration of a belief tree and motion policy in POMDPs is shown in Figure 4.
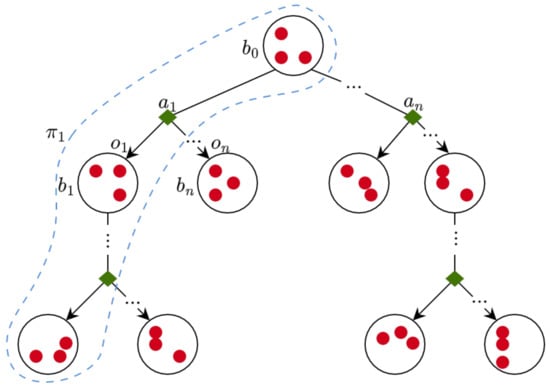
Figure 4.
Belief tree and motion policy representation in partially observable MDPs (POMDPs). Each circle illustrates the system belief as the probability distribution over the system states (red dots). When an observation is made, the belief distribution is subsequently updated.
The solution of a POMDP is obtained after finding the optimal policy , which is defined as follows:
where is the discount factor and defines the relative importance of immediate rewards compared to future rewards.
The solver selected in this work uses augmented belief trees (ABT) [18], which reduce computational demands by reusing past computed policies and updating the optimal policy if changes to the POMDP model are detected. Furthermore, formulated problems with ABT allow declaring continuous values for actions, states, and observations. The following subsections detail the problem assumptions, and the components of the POMDP tuple for exploration and object detection applied on multi-rotor UAVs.
3.1. Assumptions
The following assumptions are applied to the problem formulation for exploration and object detection (i.e., victims) using multi-rotor UAVs:
- An initial 3D occupancy map of the environment is pre-loaded to the UAV before taking-off (further details on how the map is generated can be found in Section 4.4).
- Observations come from real-time streaming of processed camera frames (from the computer vision module), the 3D occupancy map, and the estimated local UAV position from the autopilot.
- The problem formulation is constrained to detect only a single, static victim. However, multiple victims located in the search area could be detected if the motion planner is launched multiple times (see Section 4.5 for further details).
- The motion planner starts once the UAV reaches the initial position waypoint of the flight survey.
- The planner concludes computing motion policies when either: (1) the UAV detects a victim with a high confidence value that exceeds a given threshold (covered in Section 3.7); (2) the UAV covers the entire exploration extent of the search area without finding any victims; or (3) the UAV exceeds a maximum flight timeout.
3.2. Action Commands
This implementation proposes seven low-level UAV actions, which produce position changes in at least one of axes of the world coordinate frame as shown in Table 1. This design allows adding more actions if the application requires it. Possible scenarios include actions to set pitch and roll angles of a camera gimbal, the heading of the UAV (yaw) and actions applied to more than one Cartesian axis (e.g., up and forward, forward and right, etc). Other UAV actions that are executed out of the scope of the POMDP motion planner, such as take-off, return to launch, and land are instead managed by the autopilot.

Table 1.
Set of action commands comprised of local position commands referenced to the world coordinate frame. The system keeps records of its current local position at time step k, and calculates as the change of position magnitude of coordinates , and from time step k to time step .
Each time the UAV takes an action, a change in UAV local position coordinates is applied. The magnitude for and is variable, and its value is defined by the desired overlap of collected camera frames between time steps, as shown below:
where is the length of the projected camera’s field of view (FOV), and is the desired overlap value. High values of result in smoother motion response and conservative detection of victims in the scene, whereas low values lead to more aggressive UAV response. A detailed description of FOV estimations from vision-based sensors can be found in Section 3.7.
3.3. States
In POMDP formulation for autonomous UAV path-planning, the defined states serve two goals: (1) to model the motion dynamics of the UAV; and (2) to oversee key system conditions during the flight mission. A system state for autonomous UAV exploration and object detection is defined as:
where is the position of the UAV in the world coordinate frame, is a flag raised when the UAV crashes with an obstacle, is a flag indicating whether the UAV flying beyond the flying limits, is the flag raised if a potential victim is detected by the UAV. If , the position of the victim in the world coordinate frame is given in , with providing the corresponding detection confidence. The system reaches a terminal state whenever , where is the confidence threshold. The formulated state space is flexible and can be further extended for two or more victims, as well as additional system conditions if required.
3.4. UAV Motion Model
The transition from current to new states is defined through a simplified version of the motion dynamics of a multi-rotor UAV as follows:
where is the position of the UAV at time step k, and is the change in the UAV’s position from time step k to time step . While this implementation does not incorporate the UAV Euler yaw angles in the action space, Equation (6) can be further expanded by including the multi-rotor rotation matrix [32] as presented in the problem formulation given in [26].
The procedure to model follows the system identification process presented in [27]. The primary workflow is defined as follows:
- Track the position responses of the UAV controlled system using a series of step setpoints via a Vicon motion capture system (Vicon, Oxford, UK).
- Estimate the transfer function of the UAV controlled system using the MATLAB system identification toolbox.
- Discretise the transfer function using the Tustin approximation method.
- Obtain the difference equation using the inverse Z transform.
The generic difference equation is defined as:
where is the response of the system, N is the order of the transfer function, and are the numerical constants for each setpoint and response function variables respectively, and is the sampling period. The constants used for the experiments are given in Appendix A.
3.5. Reward Function
Any given reward r to the UAV after taking an action from state is calculated using a reward function . This function design allows multi-objective task definition, and critically influences the UAV behaviour during flight missions. This work proposes Algorithm 1 as a novel algorithm for , which incorporates obstacle avoidance, exploration, and object detection. The proposed algorithm contains several reward variables, whose values are set following an iterative process of the system in the simulator to observe the combination that provides the best behaviour of the UAV to explore the environment and inspect areas with potential victims inside them. Table 2 shows the converged reward values for this implementation.
| Algorithm 1 Reward function R for exploration and object detection. | |
| 1: | |
| 2: if then | |
| 3: | ▹ UAV crashing cost |
| 4: else if then | |
| 5: | ▹ Beyond safety limits cost |
| 6: else if then | |
| 7: | ▹ Detected object reward |
| 8: | ▹ UAV altitude reward |
| 9: if and then | |
| 10: | |
| 11: end if | |
| 12: else | |
| 13: | ▹ Action cost |
| 14: | ▹ UAV altitude cost |
| 15: | ▹ Horizontal distance cost |
| 16: | ▹ Footprint overlap cost |
| 17: end if | |
| 18: return r | |

Table 2.
Applied reward values to the reward function R, defined in Algorithm 1.
The reward function R first evaluates any states that will negatively affect the integrity of the UAV. R returns negative reward values if a given action a provokes a crash or lets the UAV fly beyond the safety limits regardless whether the UAV detects a potential victim. This modelling encourages the UAV to apply a policy that approaches a victim without colliding with an obstacle in the process. If the UAV detects a potential victim (Step 6), R calculates a linear function (Step 8), which returns increased values as the UAV gets closer to the minimum allowed altitude. Once the confidence value from the CNN object detector surpasses a pre-defined threshold, a bigger reward is returned as the potential victim is assumed to be found (Step 9 and 10).
In case there are no detections, R applies a set of cost functions to encourage a greedy horizontal exploration of the environment. The first is the inverse function from (Step 8) to encourage the UAV to explore at the maximum possible altitude to maximise the camera’s footprint extent. The second is an exponential function (Step 14), which assigns lower cost values the closer the UAV is to the victim. This function calculates the Manhattan distance between the UAV and the victim and the maximum exploration distance , which are defined as follows:
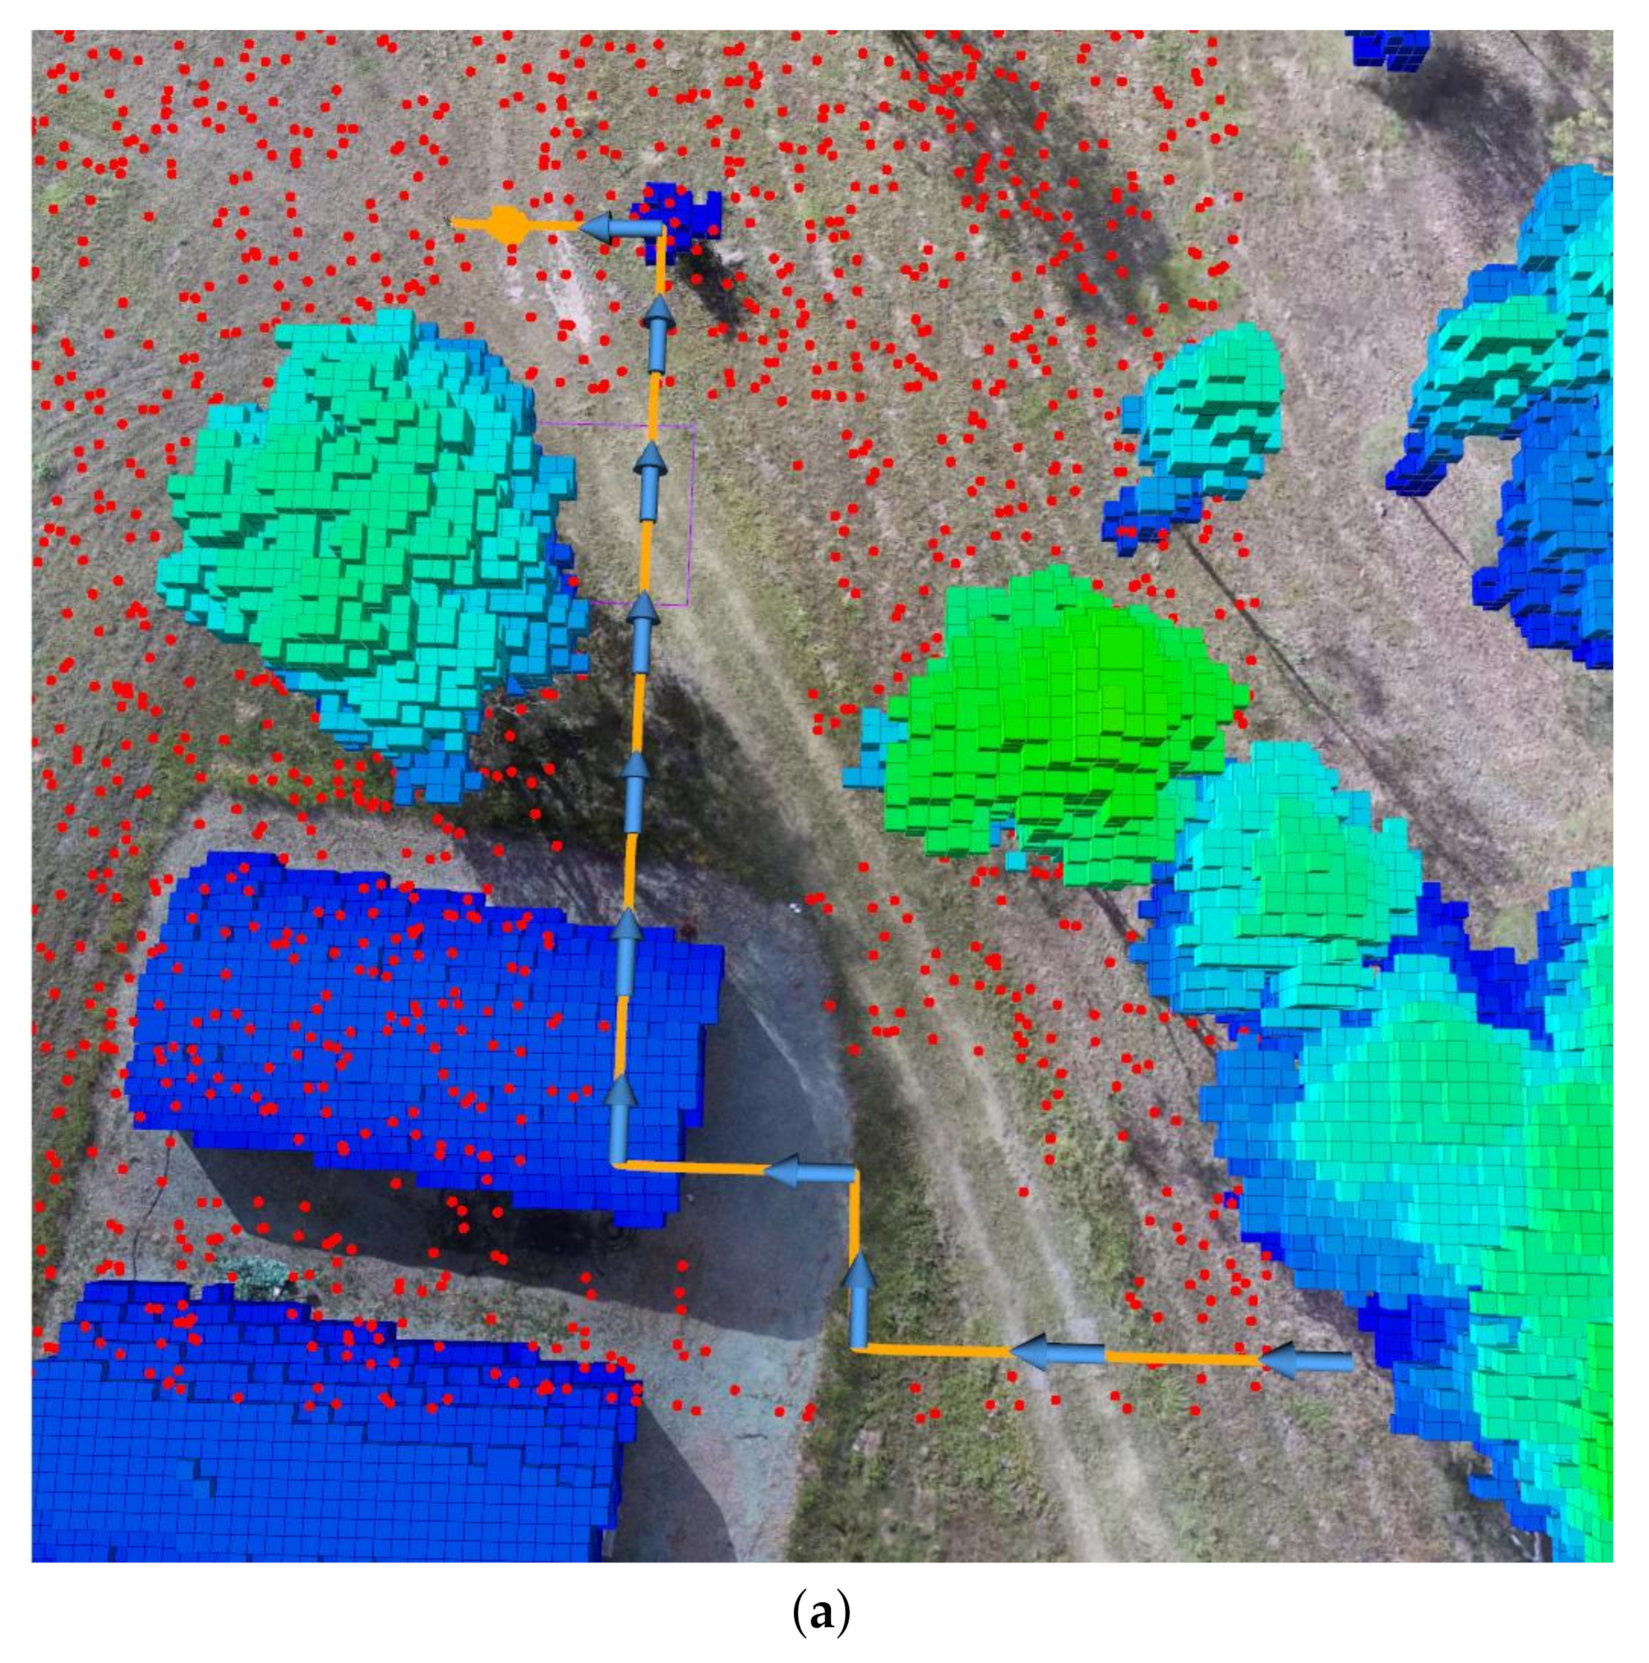
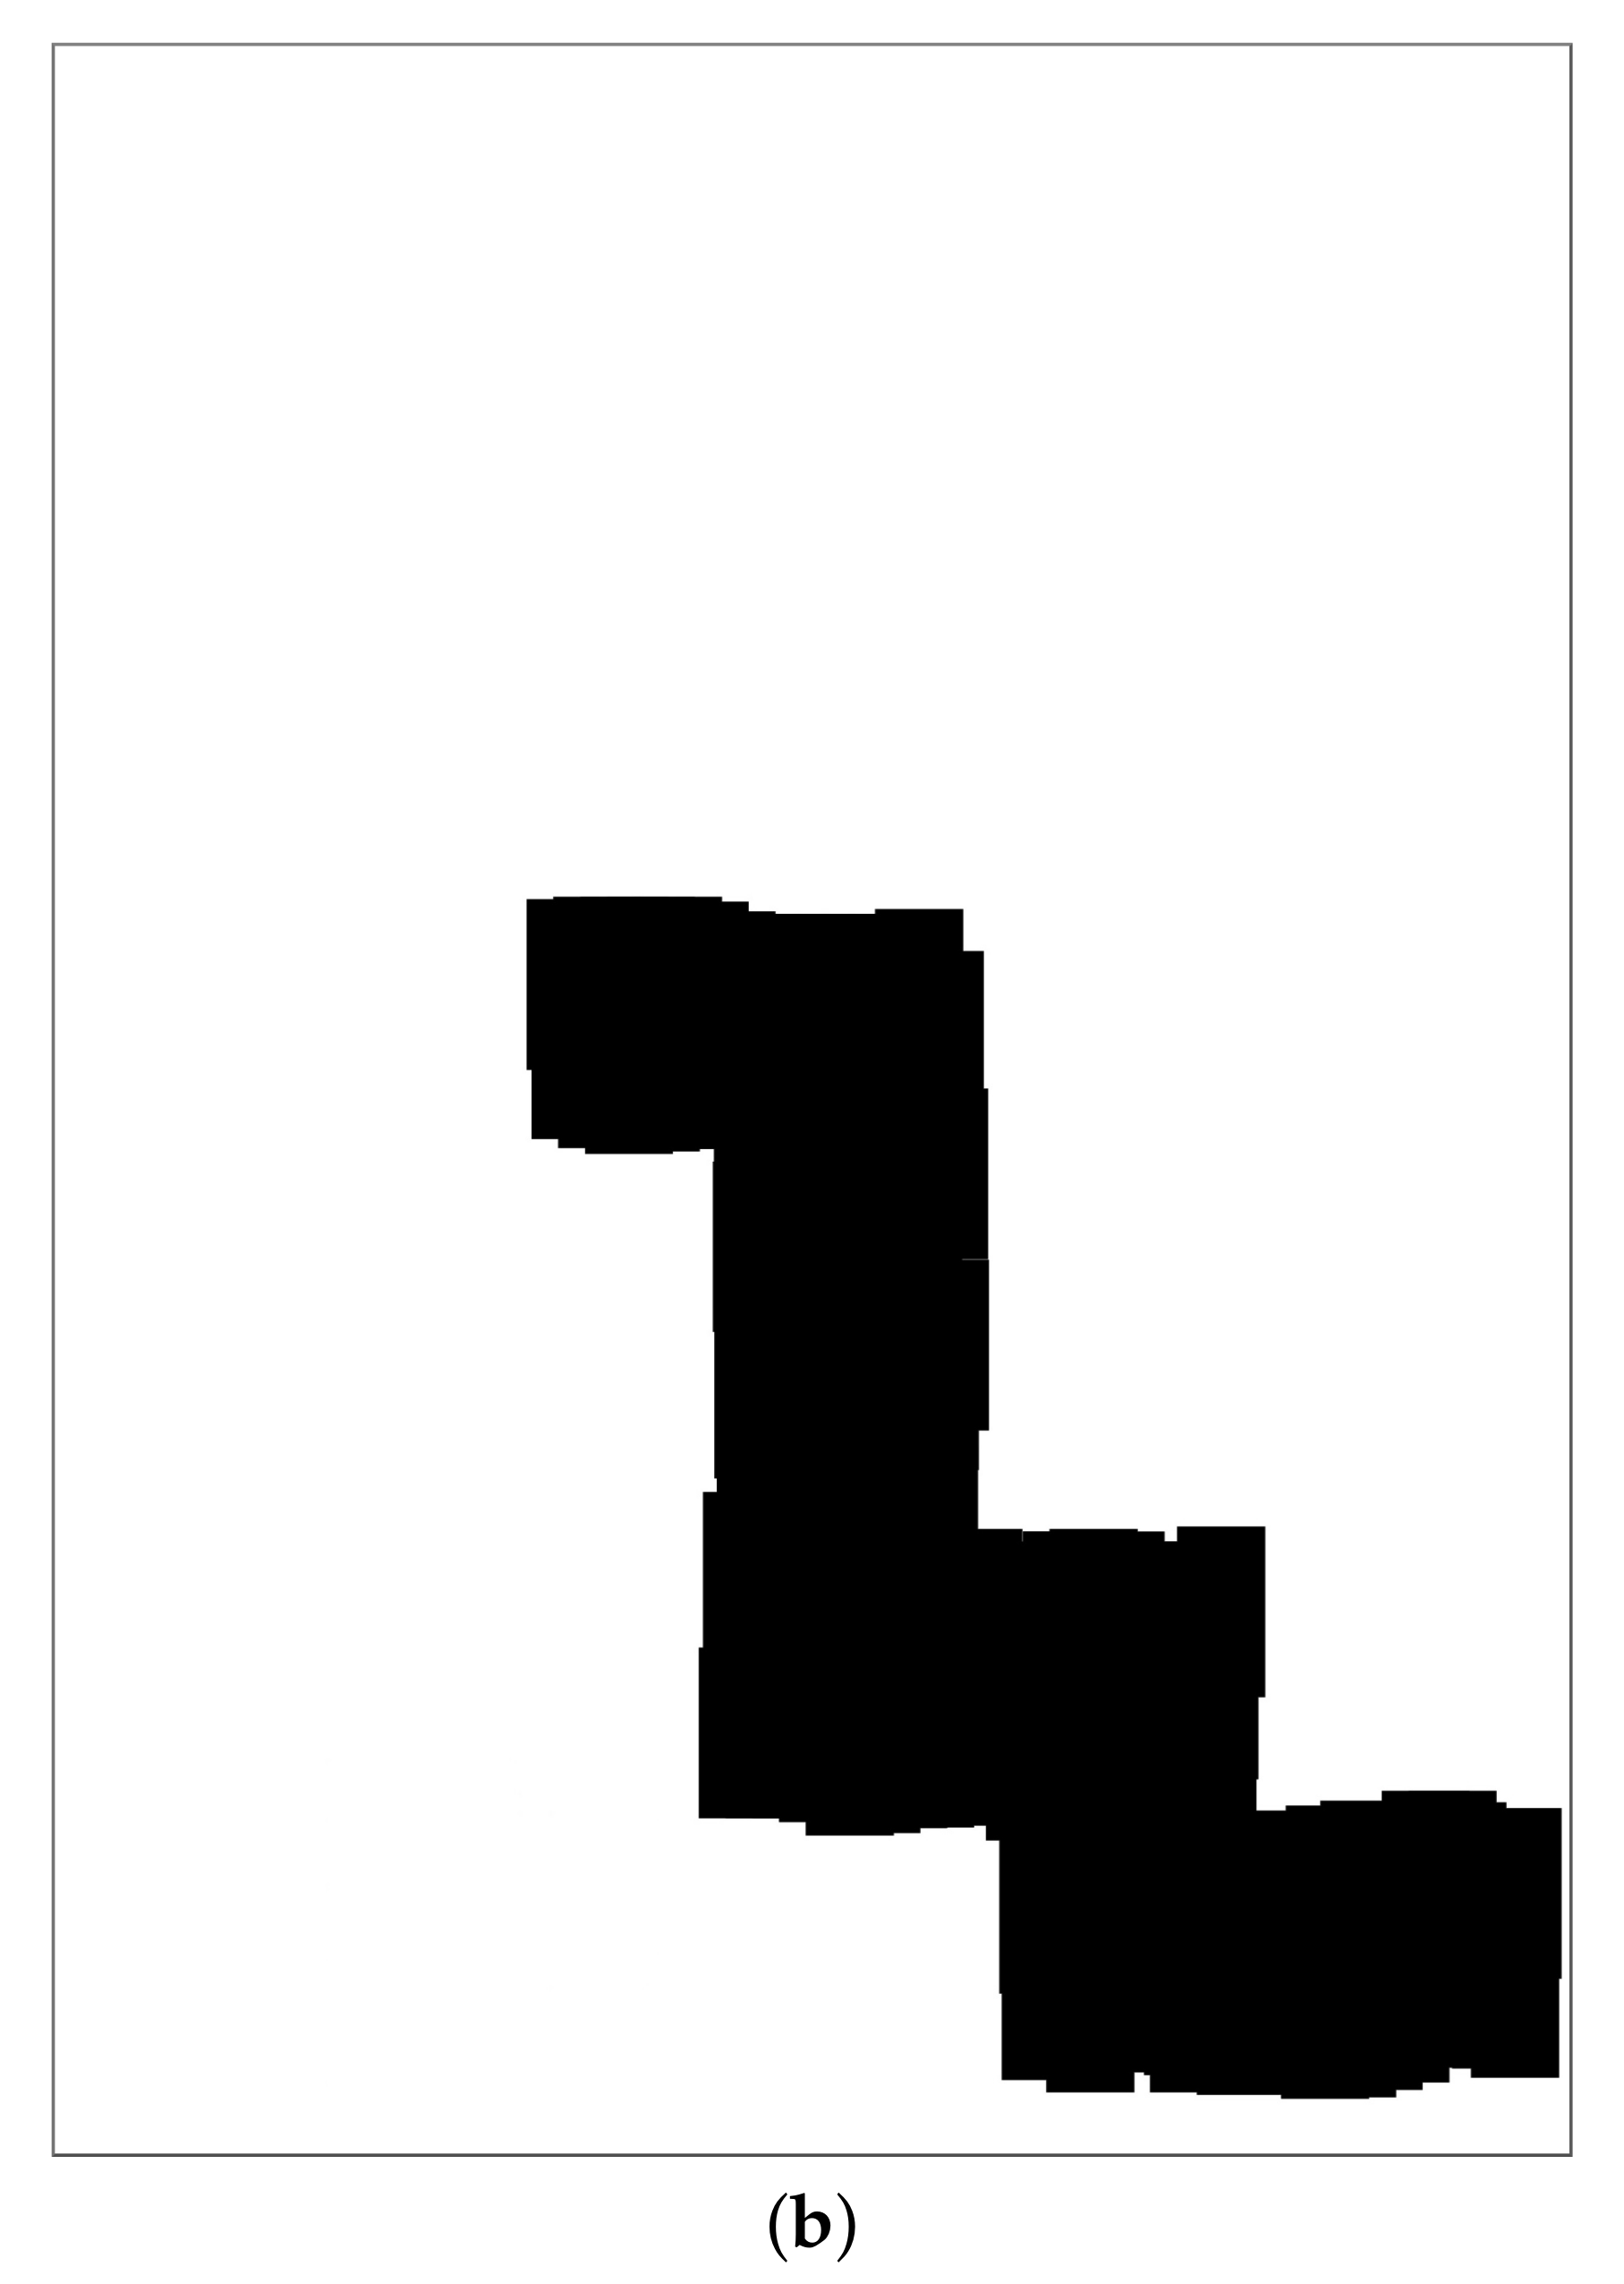
Sub-optimal policies could be generated if a set of distributed victim position particles are equidistant from the UAV by using Equation (10). Moreover, redundant traversed paths have been reported in the literature that implemented similar problem formulations [16,27]. The third cost function (Step 16) counteracts the above-mentioned effects by logging the traversed path by the UAV and introducing the concept of exploration footprint. The concept records the accumulated visual footprint of the downward-looking camera into a two-dimensional (2D) map. The map extent equals the extent limits of the surveyed area, and it is updated after calculating the camera’s footprint once the UAV collects a new observation. An illustration of the concept is shown in Figure 5.
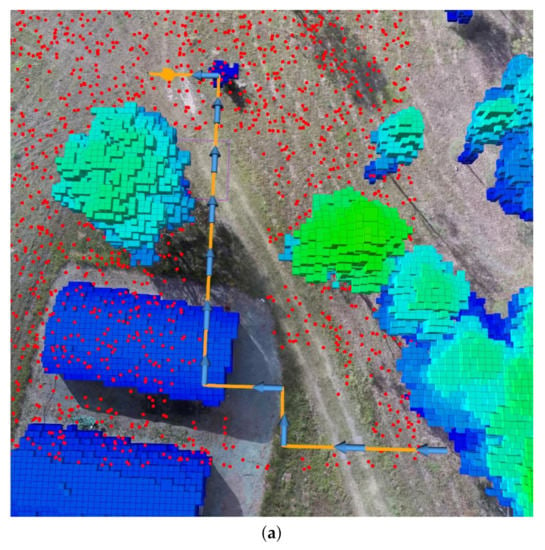
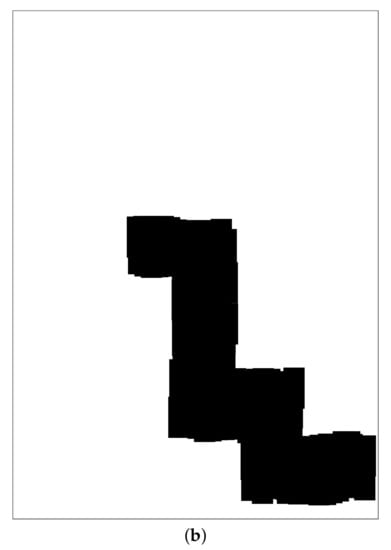
Figure 5.
Example of a traversed path by the UAV and its corresponding footprint map. (a) Traversed path of the UAV (orange splines) in a simulated environment. The arrows indicate actions taken by the UAV per time step. Environment obstacles are depicted with blue and green blocks, and the believed victim location points are shown using a red point cloud. (b) Accumulated traced footprint using the extent of the camera’s FOV. Explored areas are depicted in black and unexplored areas in white. The higher the overlap of explored areas after taking an action , the higher the footprint overlap cost.
The overlap between the camera’s current footprint and its correspondent location in the footprint map is defined as follows:
where are the pixel values of the projected FOV in the footprint map, and n is the total number of projected pixels in the footprint. A maximum overlap value of 1 indicates that such action will place the UAV to a fully previously explored area, and, as indicated in Step 16 of Algorithm 1, the whole penalty value will be added to the reward. A minimum value of 0 means that a given action will place the UAV in an unexplored area and no penalty will be added to the reward. Intermediate values of represent partial overlapping, adding a partial penalty value to the reward.
3.6. Observations
A captured observation —data from UAV sensors about the state of the environment and the UAV itself (illustrated in Figure 2)—is defined as follows:
where is the UAV position calculated by the local position estimator of the autopilot, is the flag triggered by the very first detection of a potential victim by the CNN object detector, and are the local positions of the victim and the detection confidence, respectively, both of them defined only if there are any positive detections, and is the flag triggered after processing the 3D occupancy map for any obstacles located in front of the UAV. The detection confidence , defined in Equation (13), is a summary statistic that measures the frequency of positive detections between the last two observation calls:
where n is the number of processed image frames between observation calls, and is the flag indicating a positive detection per processed frame i.
3.7. Observation Model
An advantage of ABT compared to other solvers is that the probabilistic transition functions T and do not require to be explicitly defined, but instead it uses a generative model. This model generates T and using a modelled observation o given an action a and the next state . In this implementation, the variables contained in the generative model are the local position of the UAV , the local position of the victim , and the detection confidence . The estimation of follows the UAV motion estimations detailed in Section 3.4.
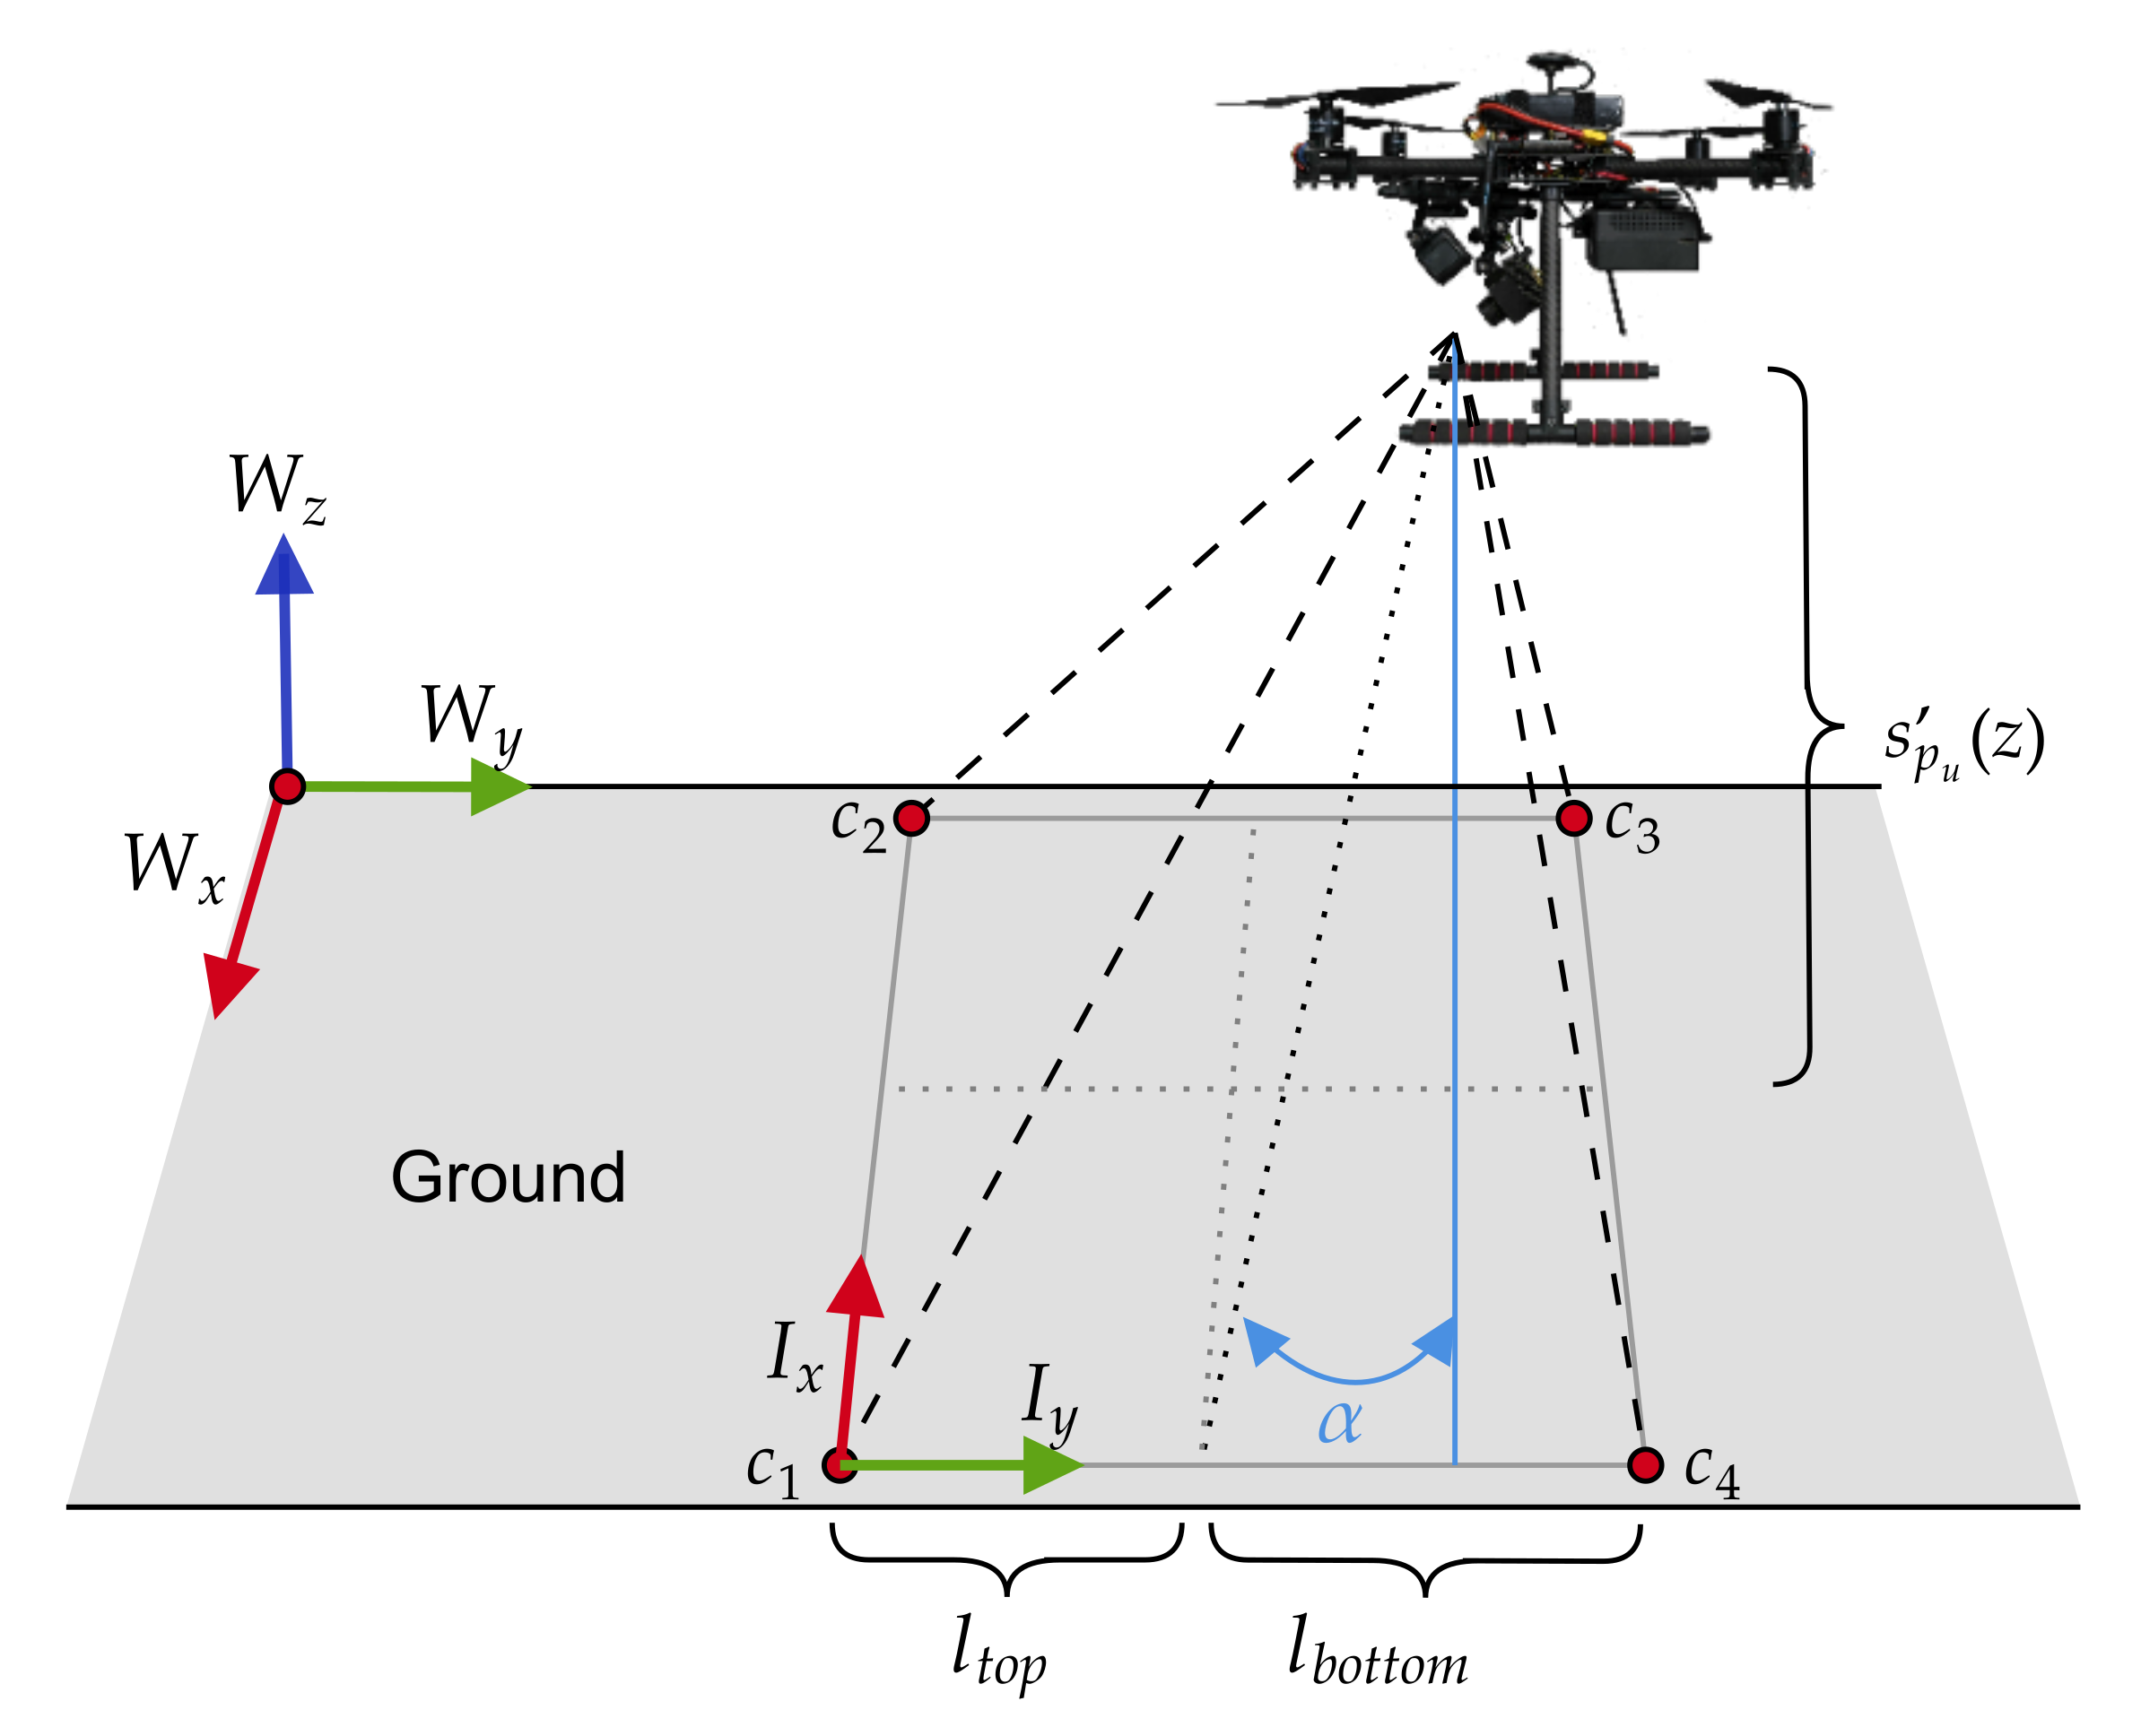
Potential victim detections and their subsequent positioning estimations are conditioned by the camera pose at the UAV frame and its projected footprint of the environment. Specifically, if the 2D local position coordinates of the victim are within the projected footprint limits of the camera, the victim is assumed to be detected. This estimation is done by calculating the sum of angles between a 2D point (i.e., ) and each pair of points that constitute the footprint boundaries (the footprint rectangular corners) [33]. The 2D projected footprint extent l of a vision-based sensor, illustrated in Figure 6, can be calculated using Equations (14) and (15):
where is the UAV altitude, and are the camera’s pointing angles from the vertical z and horizontal x axis of the world coordinate frame, w is the lens width, h is the lens height, and f is the focal length.
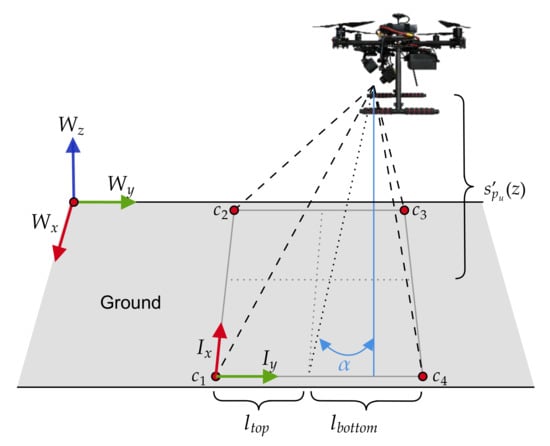
Figure 6.
Field of view (FOV) projection and footprint extent of a vision-based sensor. The camera setup on the UAV frame defines as the pointing angle from the vertical (or pitch) and determines the coordinates of the footprint corners c.
The footprint corners c from the camera’s local coordinate frame I are translated to the world’s coordinate frame W using the following transformation:
where is the next UAV position state, and is the Euler yaw angle of the UAV. However, as no actions involve adjusting the heading of the UAV mid-flight, and assuming yaw estimation errors are negligible, Equation (16) is simplified as follows:
The detection confidence that comes as part of the output data from the CNN object detector is modelled using Equation (18):
where is the minimally accepted confidence threshold, and are the maximum and minimum UAV flying altitudes respectively, and is the Manhattan distance between the UAV and the victim.
4. Experiments
The proposed system is evaluated under the context of SAR to autonomously scout a bushland area and find a lost person (victim). The following subsections describe the environment setup, victim locations, hardware and software used, and tested flight modes to accomplish the mission. The experiments assume the environmental terrain and 3D occupancy map have been generated prior to launching the UAV to survey the area.
4.1. Environment Setup
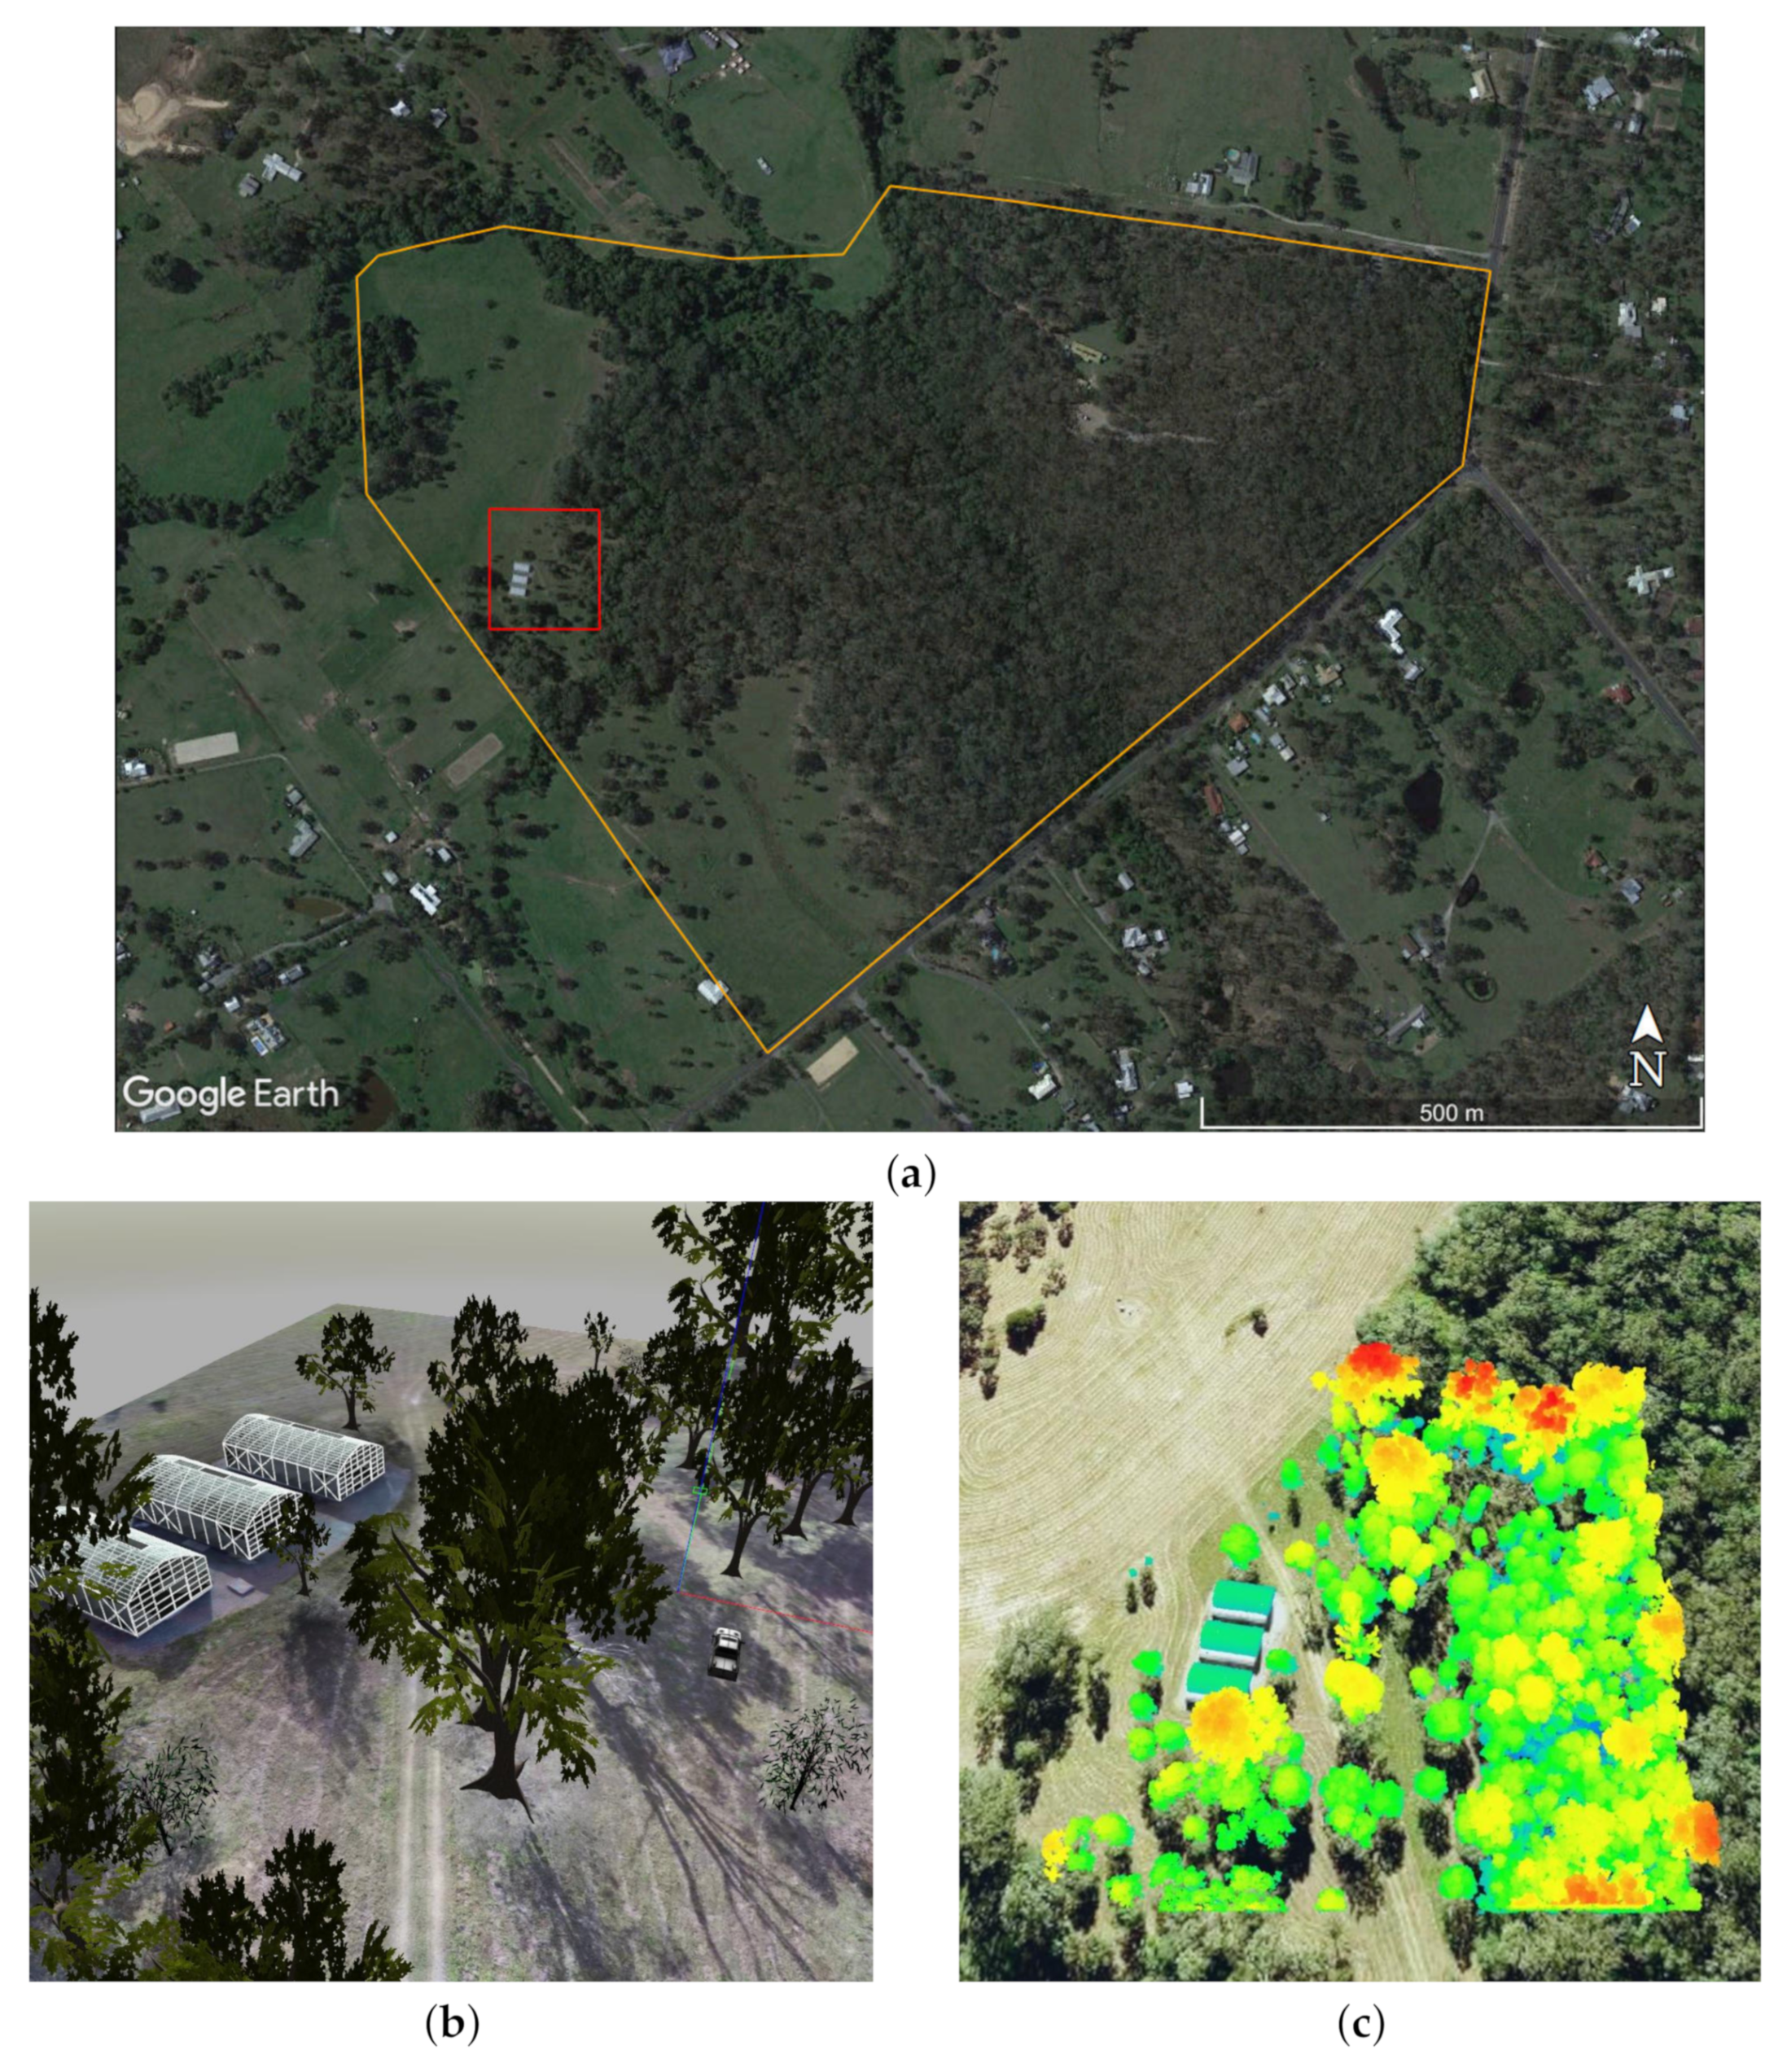
The system was tested under a simulated replica of the Queensland University of Technology (QUT) Samford Ecological Research Facility (SERF), located at 148 Camp Mountain Road, Samford QLD 4520, Australia. SERF is a 51 hectare property comprising a protected dry sclerophyll forest and grazing zones. From this property, a smaller 2.25 hectare of a mostly flat area was chosen for the tests as it contains an environment with a rich combination of open, mixed, and dense tree canopy areas, as depicted in Figure 7a.
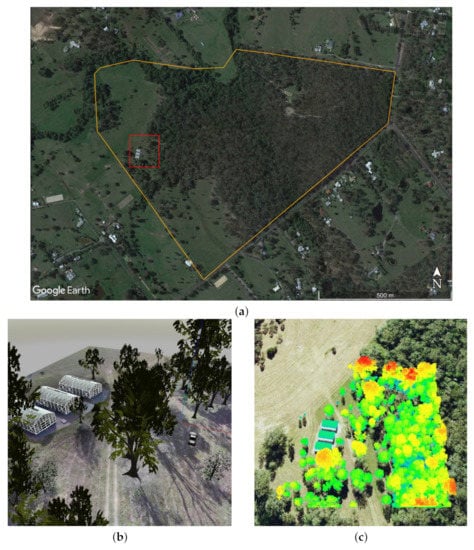
Figure 7.
QUT Samford Ecological Research Facility (SERF) virtual environment setup. (a) Property boundaries of SERF (orange) and simulated region of interest (red). (b) Isometric view of the virtual SERF instance in Gazebo using a high-resolution red, green, blue (RGB) mosaic as the terrain texture. (c) Collected georeferenced LiDAR at SERF using a Hovermap mapper (Emesent Pty Ltd., QLD, Australia). LiDAR data are used to set accurate building and tree canopy heights in the simulated environment.
The environment was emulated using the Gazebo Robotics Simulator. High-fidelity terrain textures from SERF were generated after projecting a high-resolution georeferenced red, green, blue (RGB) mosaic onto the world’s surface, as illustrated in Figure 7b. Imagery datasets for the mosaic are captured using a DJI Zenmuse XT2 camera (DJI, Shenzhen, China), mounted on a DJI M210 V2 (DJI, Shenzhen, China). The UAV collected the data at an above ground level (AGL) height of 60 m, 70% overlap, and 60% sidelap, at a constant speed of 10 m/s. Orthomosaics have been produced from video files by extracting and georeferencing still images, significantly increasing the area coverage rates.
Relevant obstacles in the environment, such as trees and greenhouses, are placed following their corresponding projections in the world’s terrain. In addition, the altitude values of each tree in the scene are set following a LiDAR dataset collected from a Hovermap mapper (Emesent Pty Ltd., QLD, Australia), shown in Figure 7c. The dataset has been captured by mounting the Hovermap into a DJI M600Pro (DJI, Shenzhen, China) at an AGL height of 60 m and constant speed of 5.4 m/s.
4.2. Victim Locations
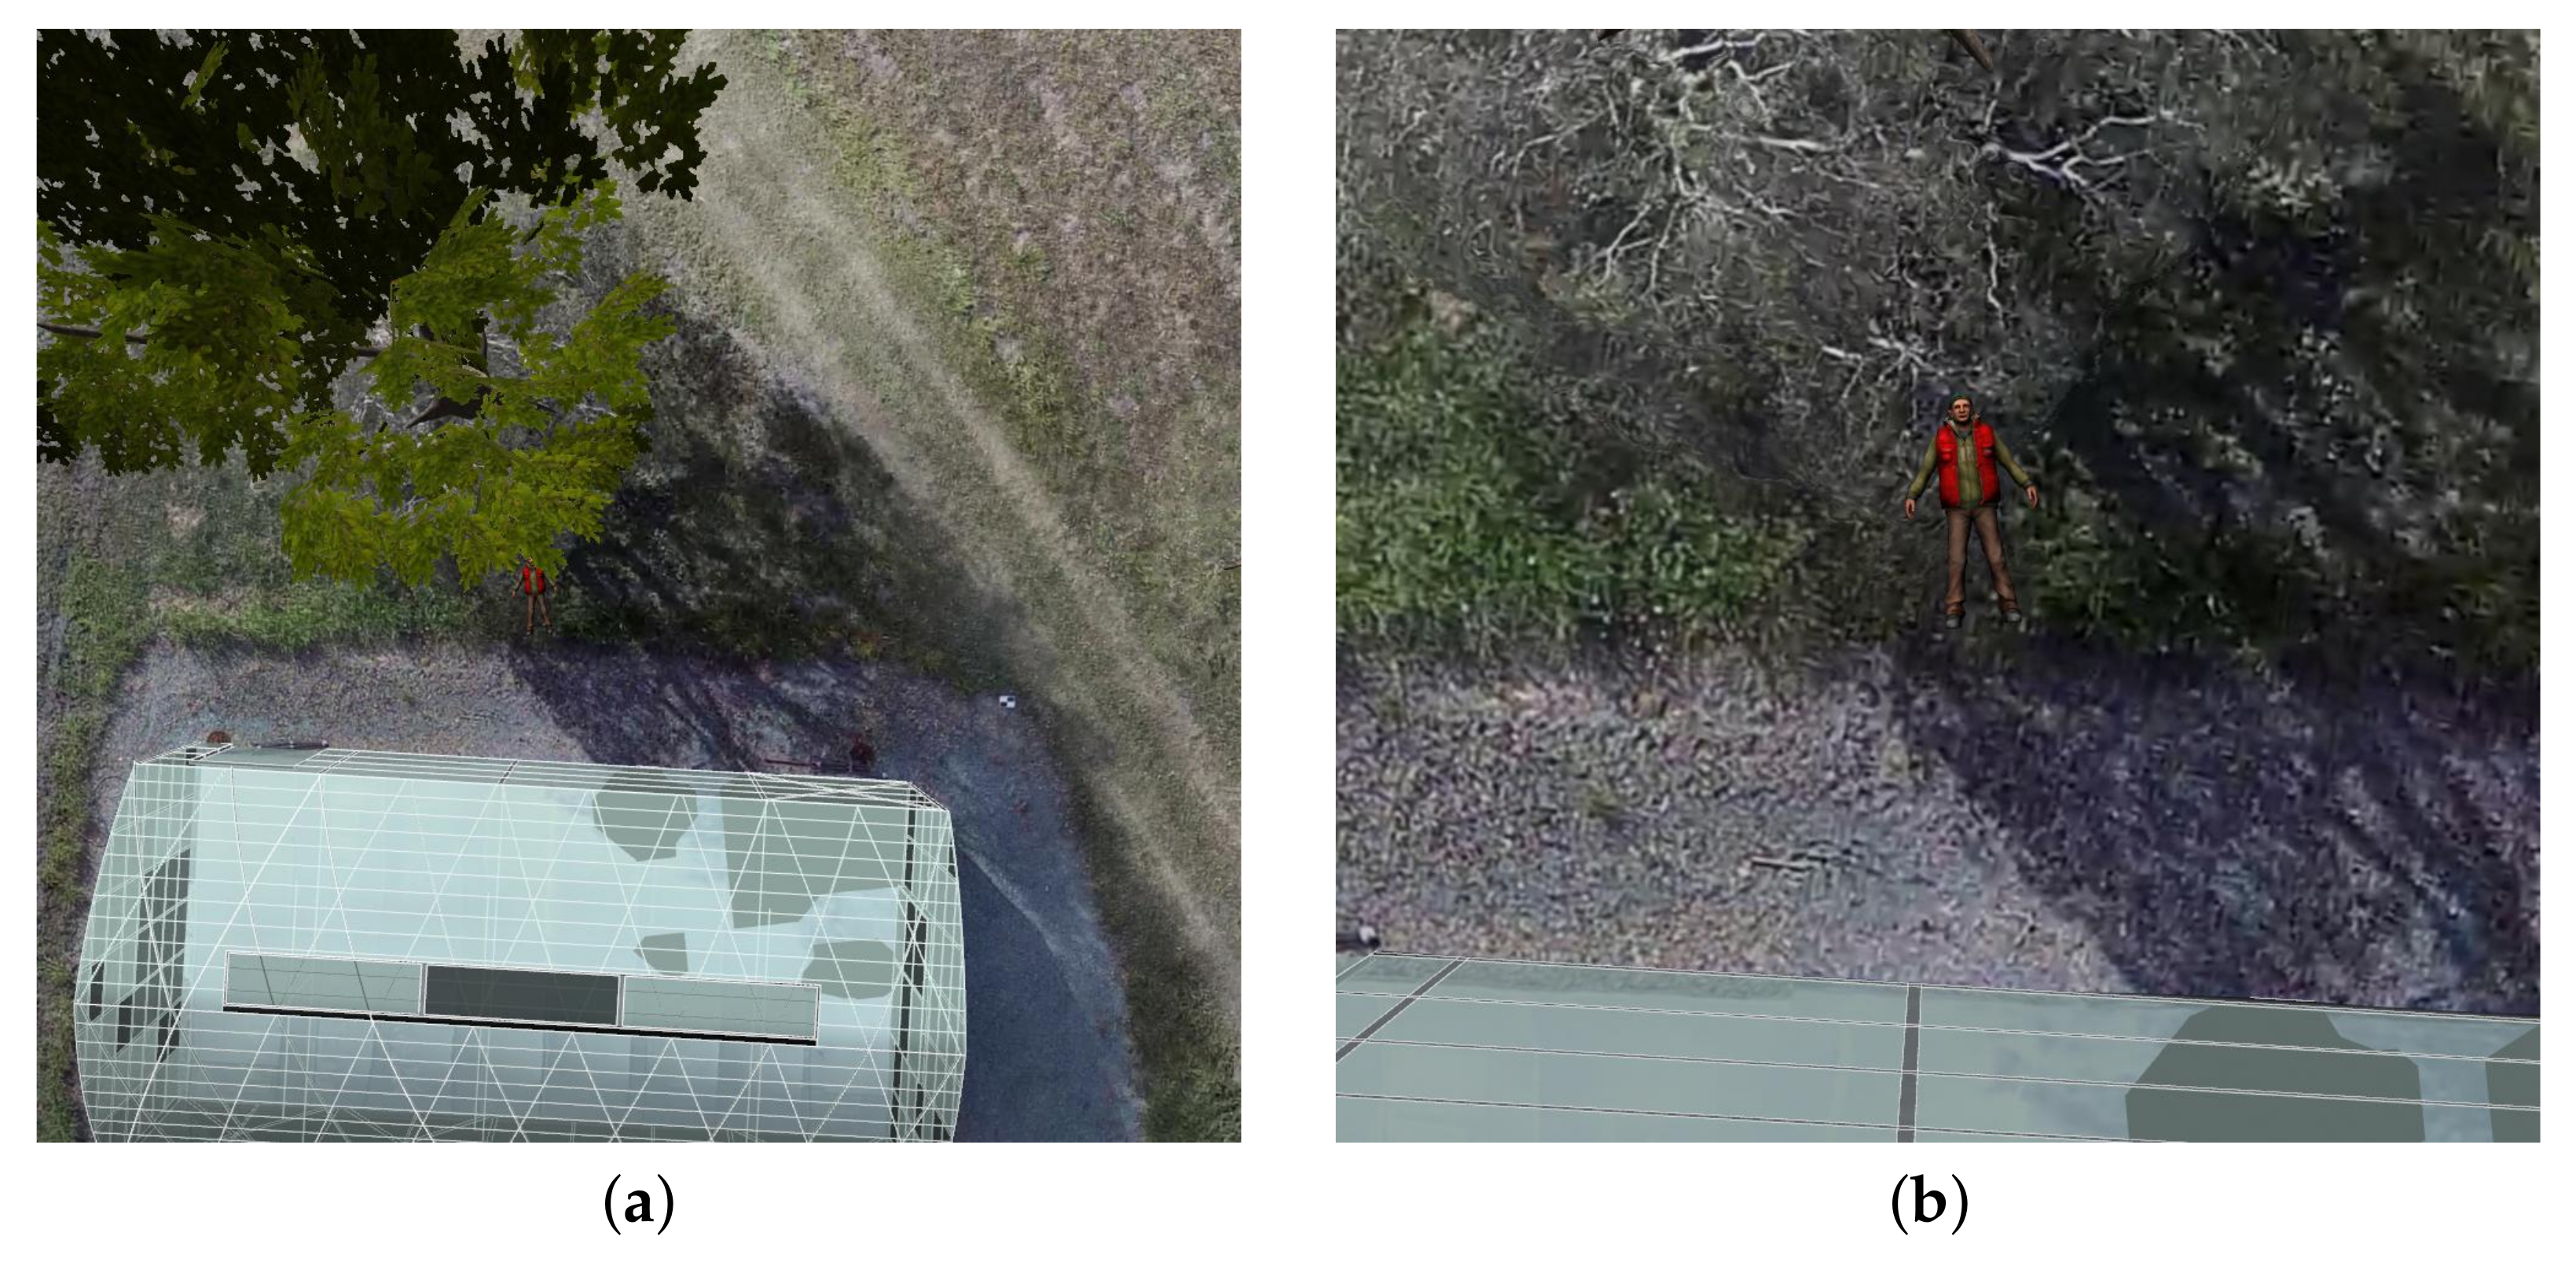
Two sets of experiments with a single victim (male adult) at two locations are proposed to validate the system in terms of detection complexity. The first location (L1) setup (latitude ; longitude −27.38938274) displays the victim in an area free of obstacles and no visibility challenges from streamed UAV data. The second location (L2) setup (latitude ; longitude −27.38966054) features the victim located close to one of the trees where partial or full occlusion may occur as portrayed in Figure 8. For both locations, the victim is static, lying on the ground with a heading of from the north compass.
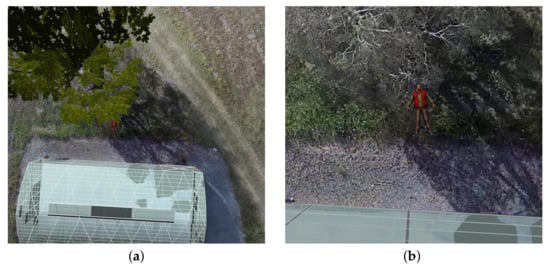
Figure 8.
Top-down visualisation and detection challenges of the victim placed at location L2. (a) Partial occlusion of the victim from the tree branches and leaves. (b) Magnified view of the victim from Figure 8a.
4.3. Hardware
The system architecture shown in this paper (Figure 2) classifies hardware into two primary components: (1) the companion computer, which runs all of the modules as if the system is tested on real flight tests; and (2) the workstation that supports the simulated environment and the SIL implementation of the autopilot.
The companion computer selected for these experiments follows the recommended hardware used by Sandino et al. [27] for onboard navigation using small quadrotor UAVs. The computer vision, decision-making, motion, and 3D occupancy mapping modules run on an UP2 (AAEON Technology Inc., New Taipei City, Taiwan). Relevant specifications include a 64-bit quad-core Intel® Pentium® N4200 processor running at 1.1 GHz, 64 GB eMMC solid state drive, 8 GB DDR3 RAM, four FL110 USB 3.0 connectors, two Ethernet controllers, two high-speed UART controllers, and one mPCIe connector. The mPCIe connector from the UP2 is used to plug an AI CORE Movidius Myriad X VPU 2485 and load CNN object detectors and perform real-time inference.
The simulated environment setup, ground control station, and the autopilot (running in SIL mode) are tested under a desktop computer with the following specifications: 64-bit 12-core Intel® Core® i7-8700 CPU running at 3.2 GHz, 512 GB solid state drive, 32 GB DDR4 RAM, 6 GB NVIDIA GeForce GTX 1060, six (6) USB 3.0 ports, and one Ethernet controller.
4.4. Software and Communications
The presented system applies a set of various software solutions per module. It uses the robot operating system (ROS) [34] as the common middleware for communications and allows the modular design presented in this paper. The software for both the companion computer and desktop runs under Linux Ubuntu 18.04 64-bit operating system.
The CNN model architecture used to detect potential victims in the computer vision module is a Google MobileNet single-shot detector (SSD) [35]. This instance of MobileNet SSD is tuned using pre-trained weights from the PASCAL VOC2012 dataset and deployed using the Caffe framework [36]. The model classifies up to 21 unique objects from the PASCAL dataset, and achieves a mean average precision of 72.7%. The computer vision module only filters and outputs the class person, and positive detections with a confidence of at least 60%. The CNN is loaded to the VPU using OpenVINO and OpenCV libraries. The UAV system is not limited to this detector, and other CNN models trained with airborne specific datasets can be implemented instead. Nevertheless, existing limitations from the chosen model (i.e., most of the labelled images were taken from a front-view camera configuration) aid its intentional usage to demonstrate of the robustness of the motion planner against higher levels of detection uncertainty.
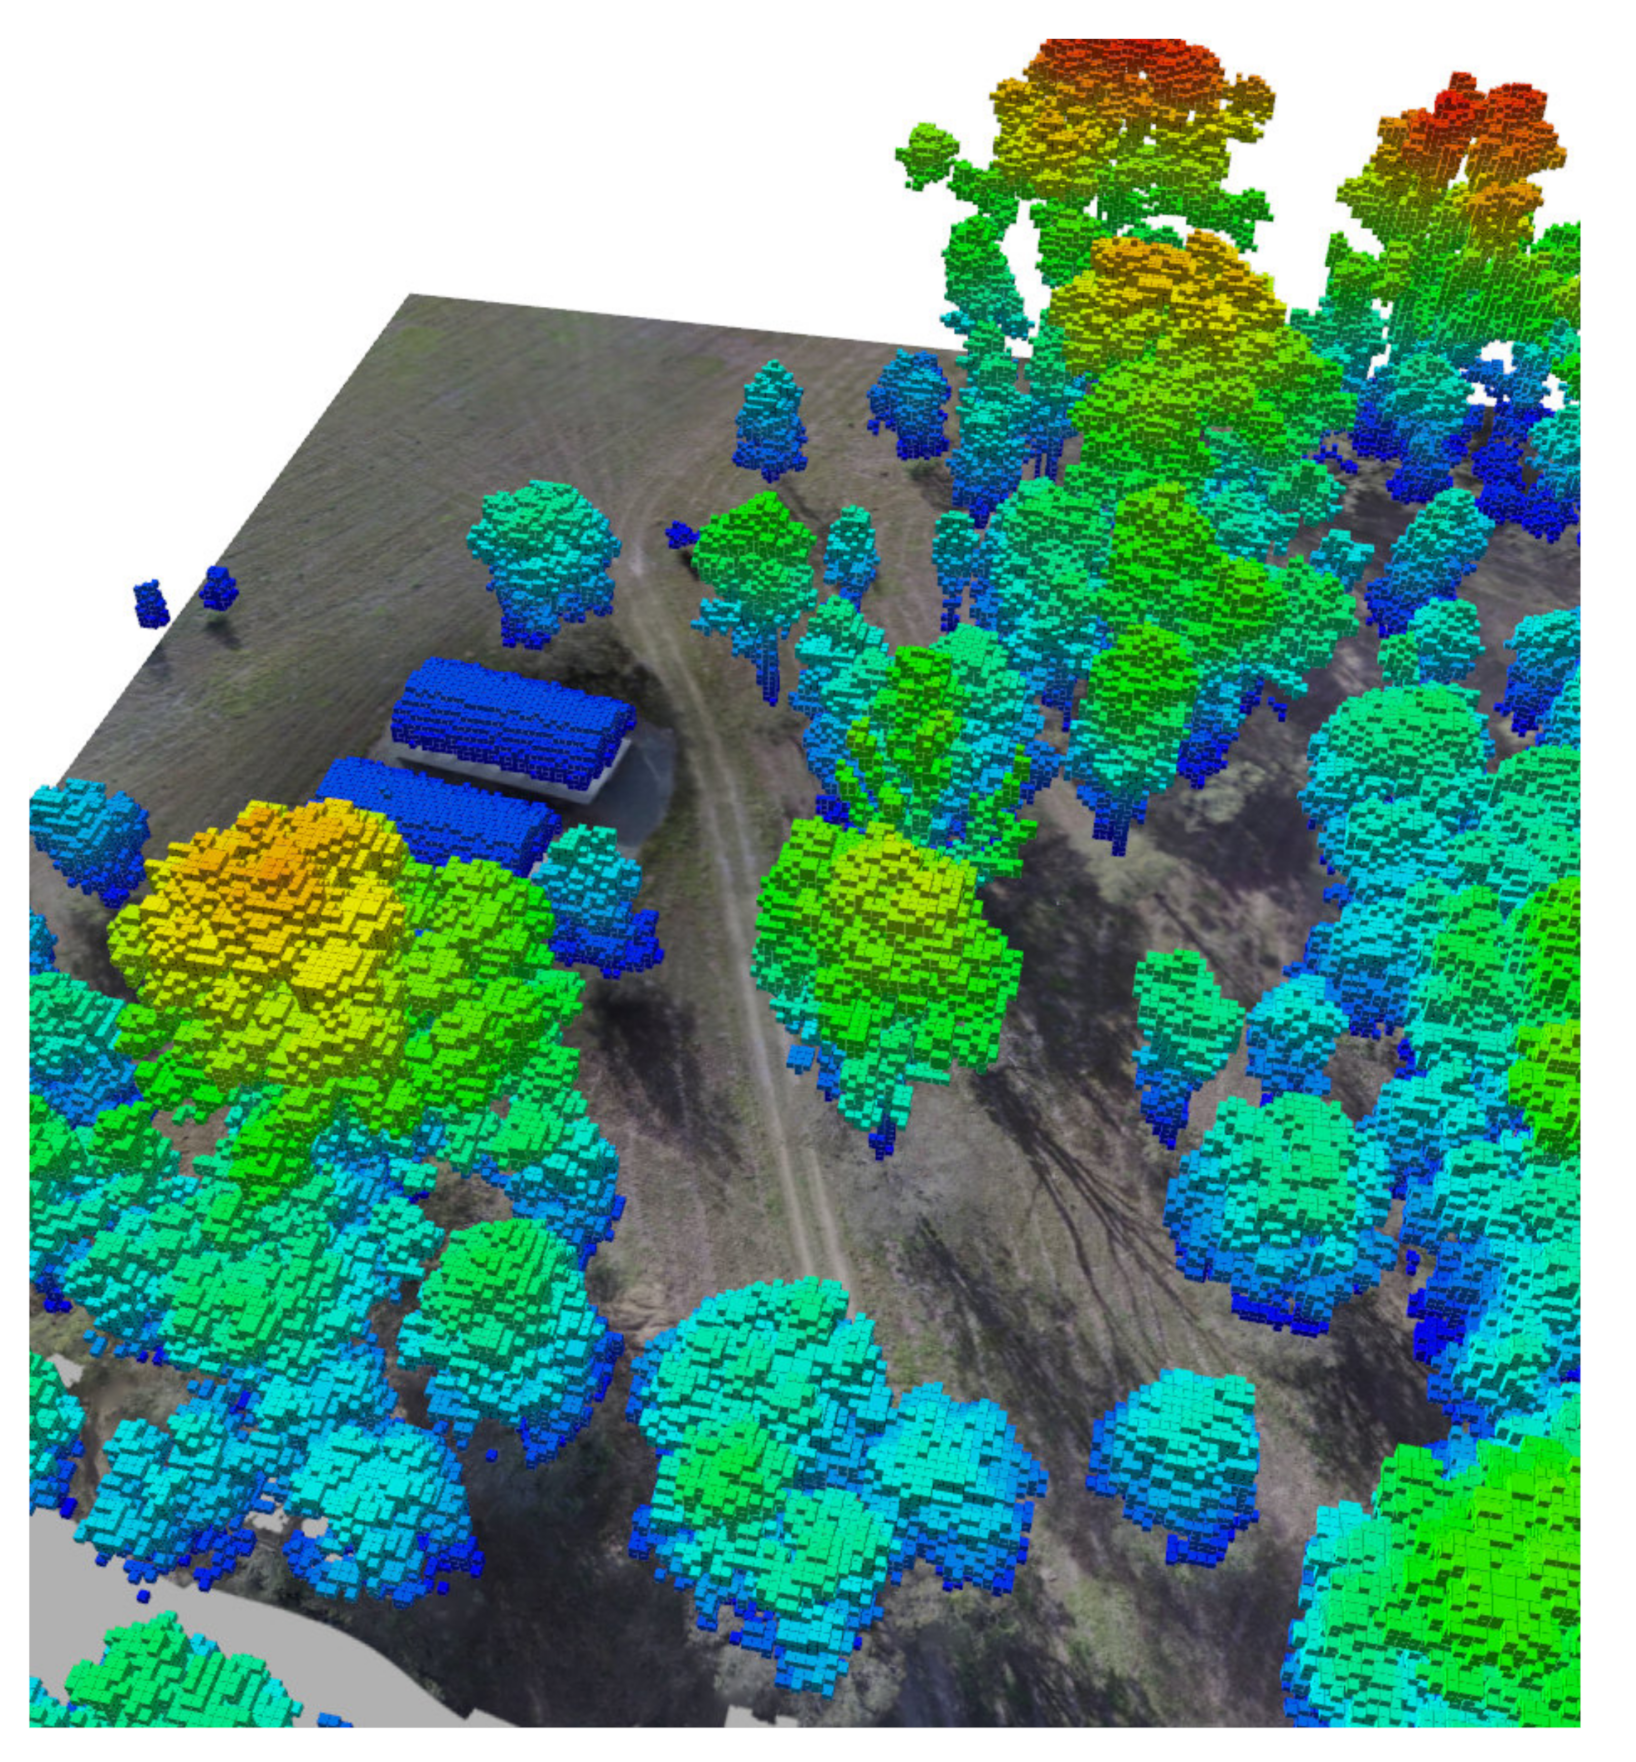
The key nodes of the decision-making module are programmed using the C++ programming language and the TAPIR toolkit [37], which implements the ABT online POMDP solver. The mapping module, which contains 3D occupancy map node for obstacle avoidance, runs under the OctoMap library [38]. A benefit of using OctoMap is the capability of generating and updating occupancy maps from 3D point cloud data such as LiDAR or depth sensors. Therefore, the LiDAR data captured at SERF by Hovermap are loaded to generate an initial occupancy map of the environment, as shown in Figure 9.
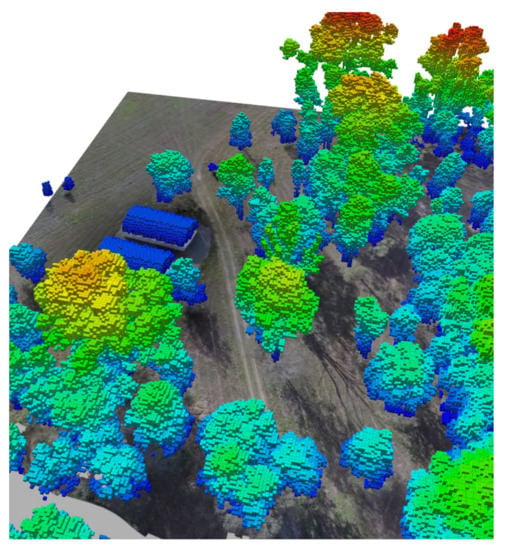
Figure 9.
Three-dimensional (3D) occupancy map from the Hovermap LiDAR data of The Samford Ecological Research Facility (SERF). Occupied cells represent the physical location of various tree species and greenhouses present at SERF.
The emulation of the autopilot is performed using the PX4 SIL plugin for Gazebo. This plugin provides a high-fidelity experience of the interface and flight controller behaviour with other modules. The communication interface between the motion module and the PX4 autopilot (with the SIL Gazebo plugin) is based on the second version of the Micro Air Vehicle Link (MAVLink) protocol [39] and applied through MAVROS, a ROS wrapper of MAVLink. Telemetry to the ground control station is achieved using QGroundControl via a UDP connection.
4.5. UAV Flight Modes
Three flight modes are proposed to evaluate the system at each victim location mentioned in Section 4.2. From a SAR application context, the presumed location of the victim is unknown. Hence, the flight modes are designed to scout the entire delimited flying area.
4.5.1. Mission Mode
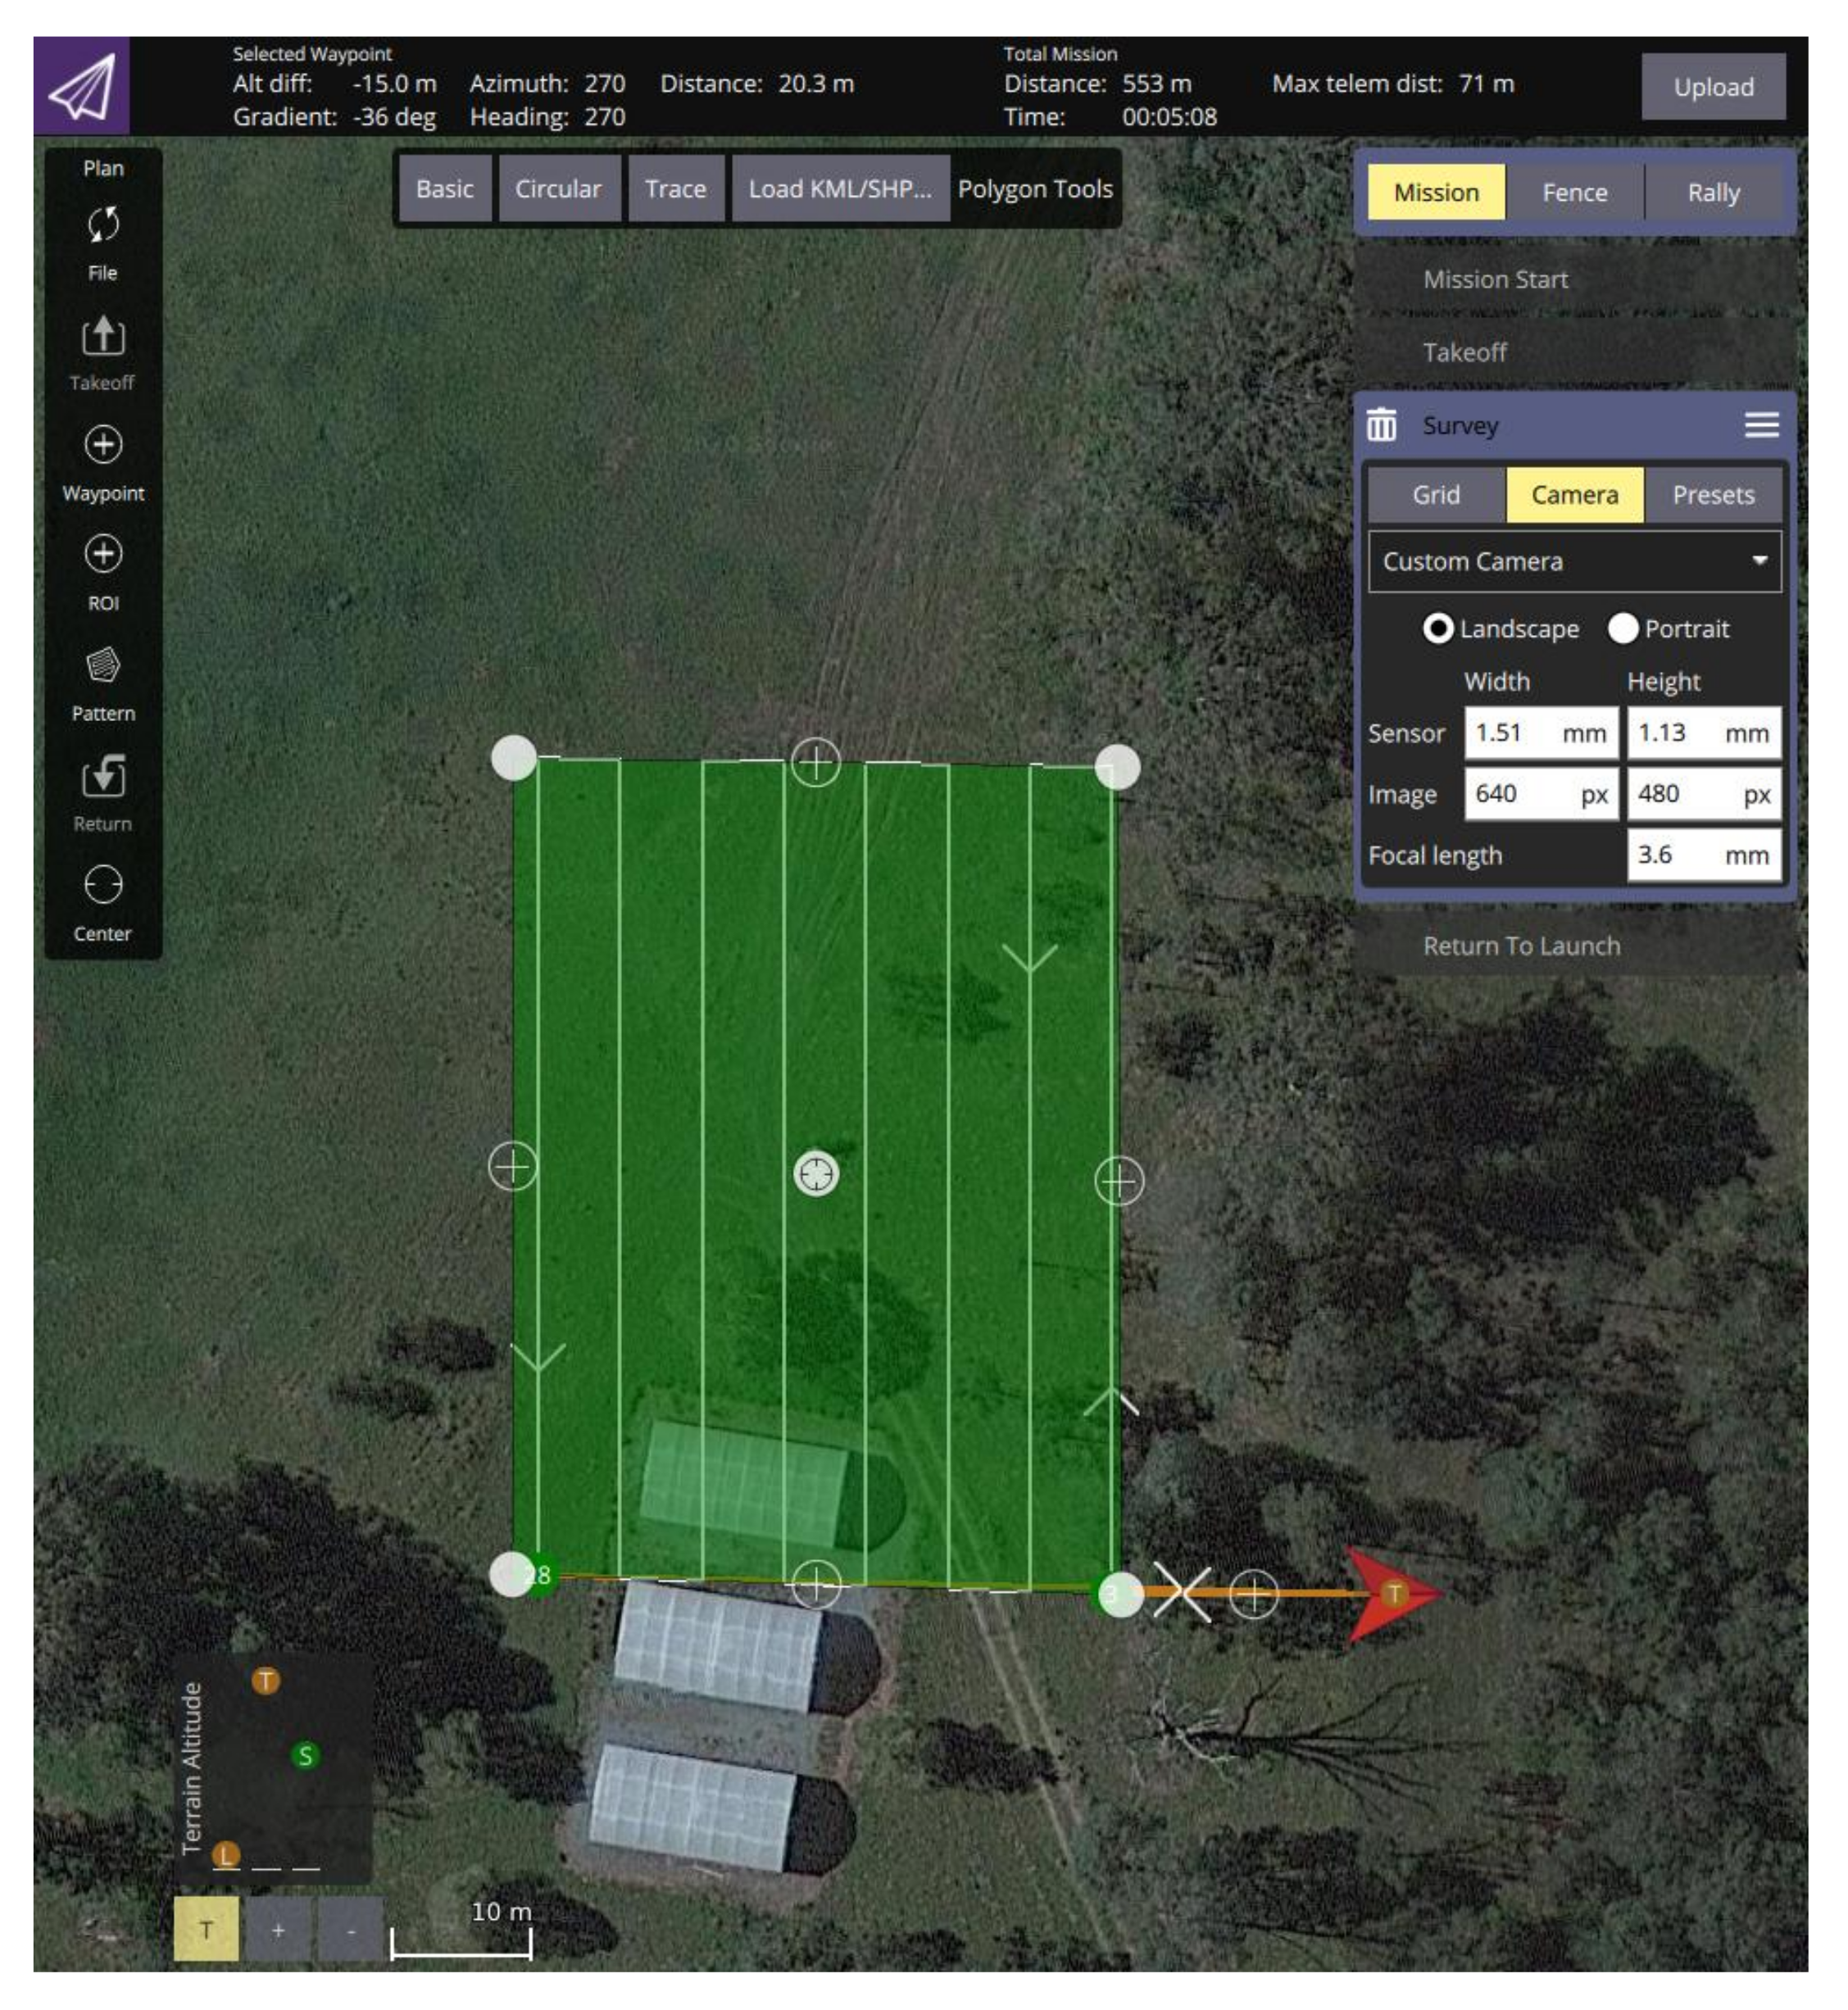
The first flight mode, denominated here as mission mode, is intended to be served as the UAV motion planner baseline for this study. This flight mode uses the traditional survey approach provided by many modern flight controllers. Typically, a sequential list of position waypoints that follows the desired survey pattern by the pilot are generated by a ground control station software and sent to the UAV autopilot. The flight plan to assess this mode follows the flight parameter values from Table 3, and is compiled using QGroundControl, as shown in Figure 10. This flight mode is triggered with the UAV on the ground and allows the UAV to take off, reach the initial position waypoint, and perform the survey. The mode terminates after completing the survey and manoeuvring the UAV back to its launch position.

Table 3.
Flight plan parameters for mission mode.
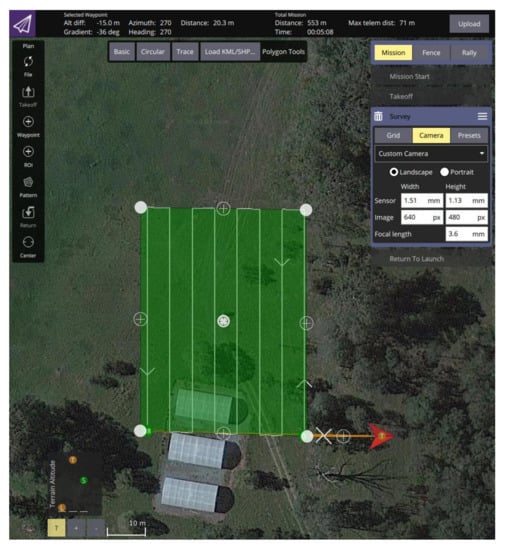
Figure 10.
Designed flight plan that the UAV follows in mission mode. The survey is set for a single pass of the setup at a constant height of 20 m, UAV velocity of 2 m/s, and overlap of 30%.
4.5.2. Offboard Mode
The second flight mode, denominated here as Offboard mode, runs the POMDP-based motion planner described in Section 3. In concordance to the flight plan design from mission mode, the initial conditions set for the offboard mode and defined variables from Section 3.4 are detailed in Table 4.

Table 4.
Initial conditions set to the POMDP motion planner.
Before the planner is run at the initial UAV location , TAPIR—the toolkit the planner is coded—runs an offline policy solver for two seconds. Then, for every time step, an observation is collected and TAPIR triggers the solver online to update the motion policy with a timeout of 800 ms. The remaining time is an idle period while the UAV moves to the next position following the action taken from the updated policy. Compared to the first flight mode, this flight mode finishes once the maximum flight time is exceeded or if the victim is found (i.e., ).
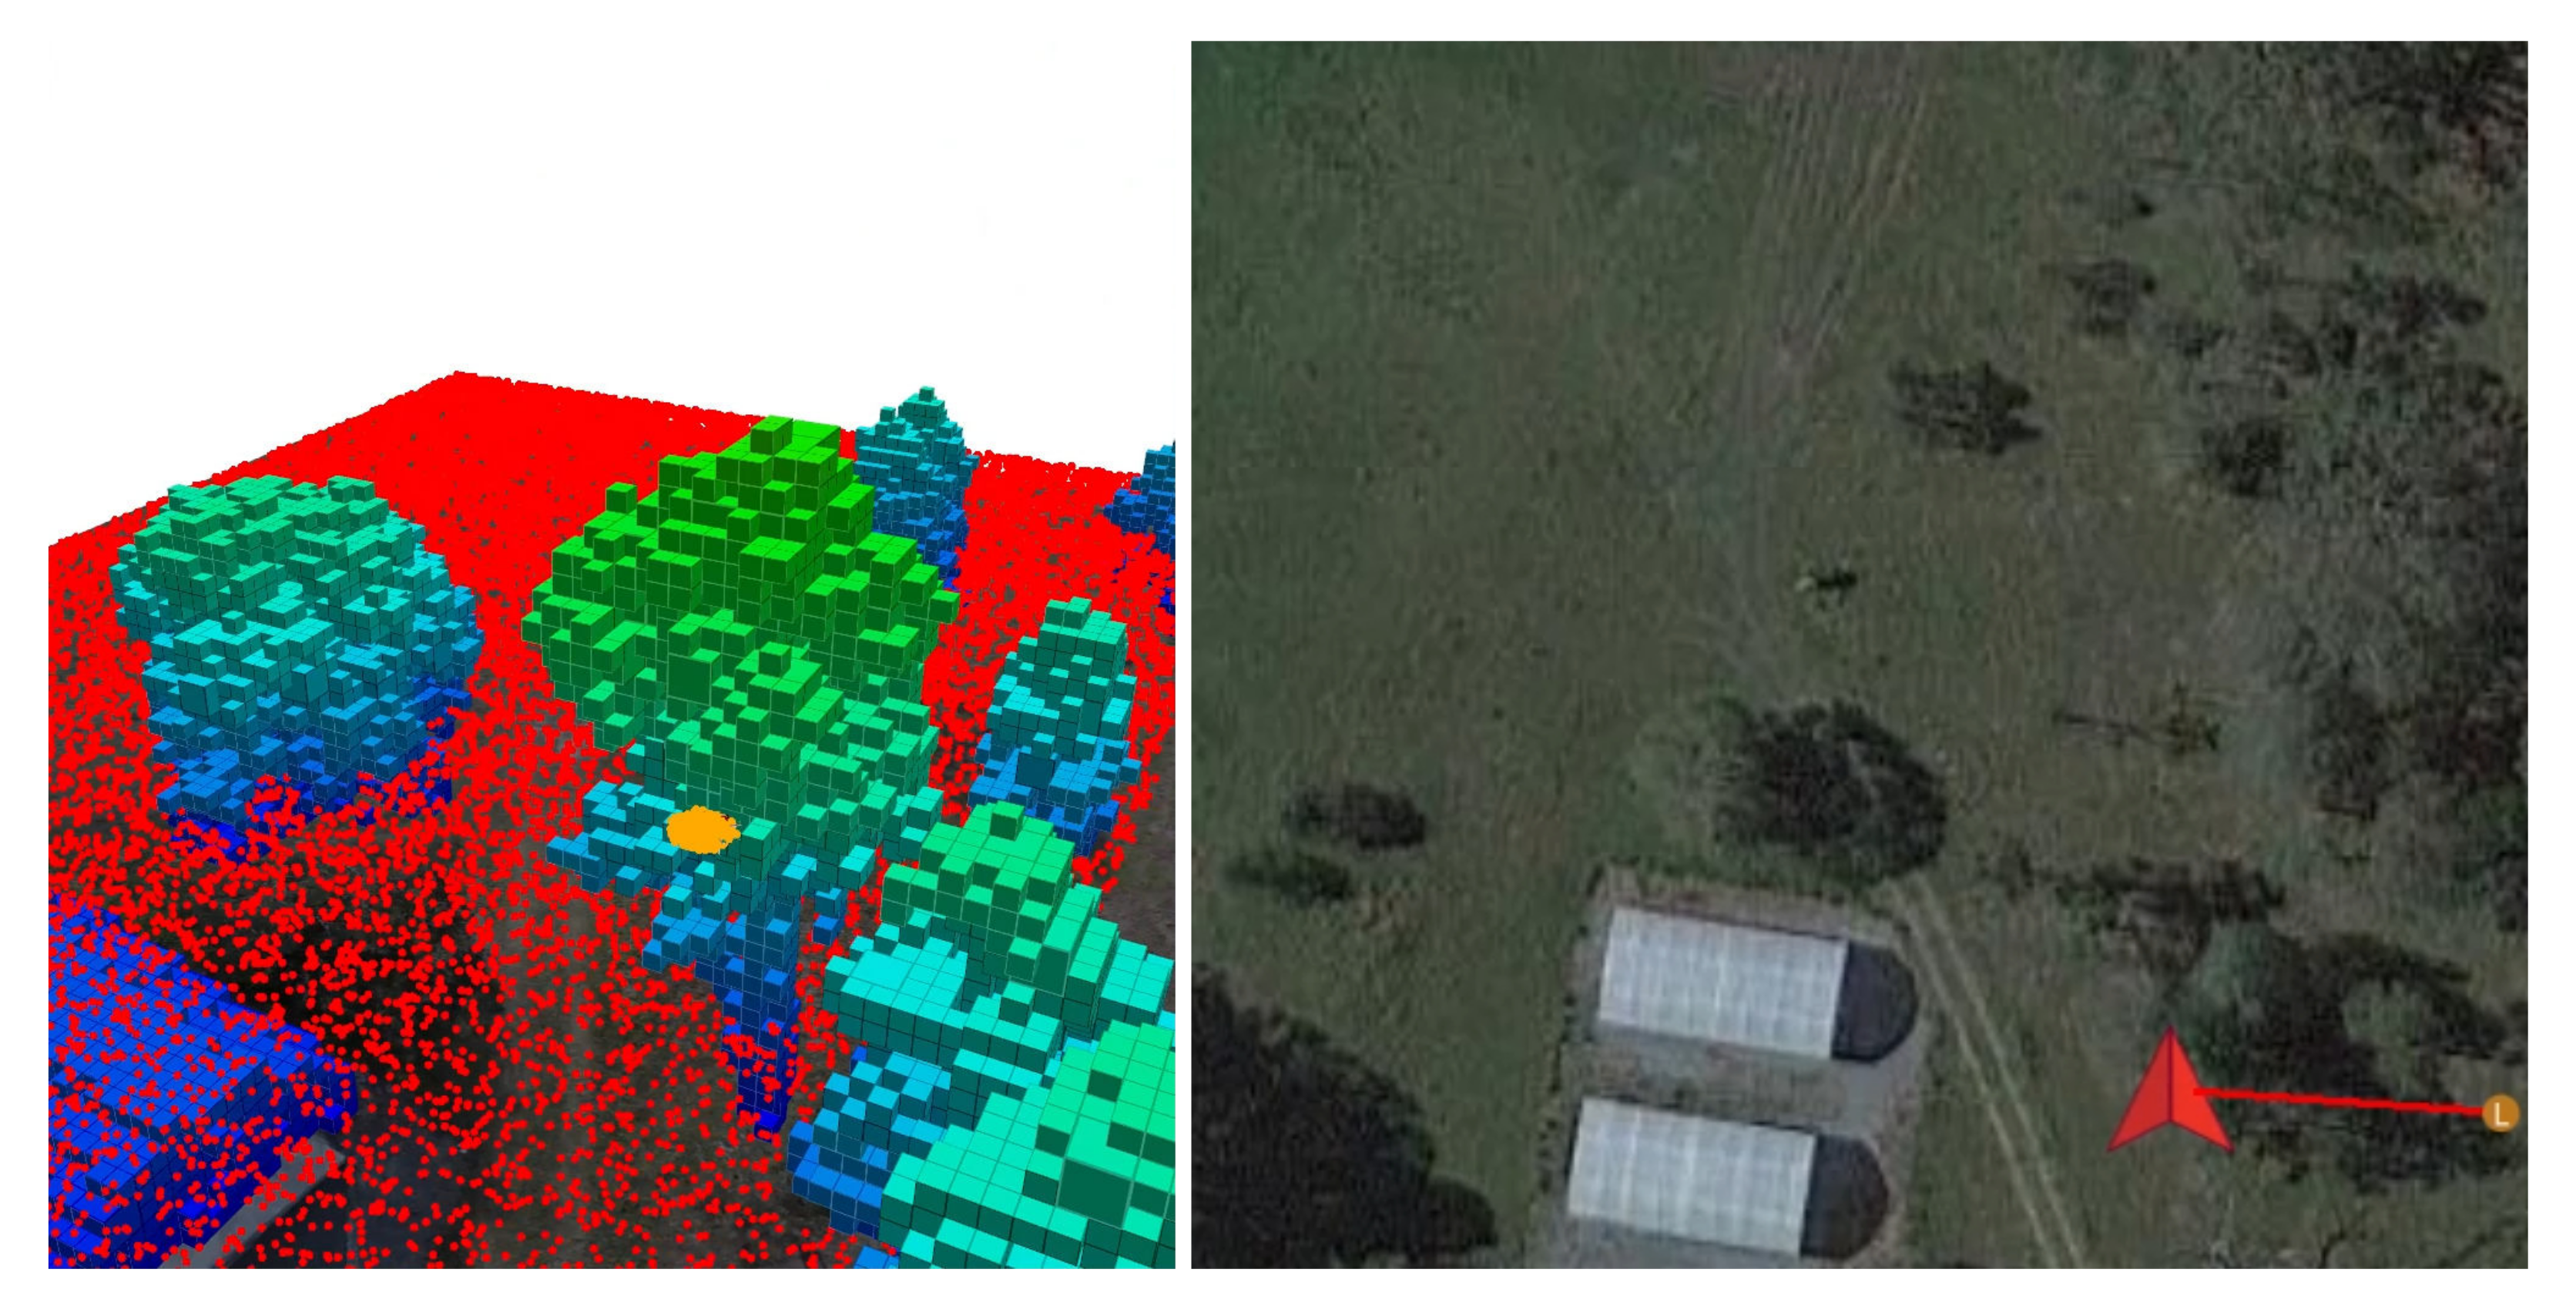
The initial state belief of the POMDP model consists of the position of UAV and the victim. The UAV position belief follows a normal distribution with a mean of and standard deviation of 1.5 m. The victim position belief follows a uniform distribution whose limits are equivalent to the survey extent of the flight plan from mission mode, as shown in Figure 11.
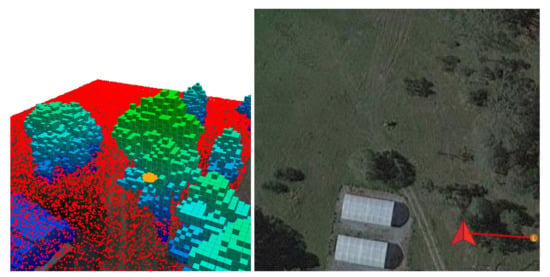
Figure 11.
Probabilistic distribution of initial UAV and victim position belief across the survey extent. The UAV position belief (orange points) follows a normal distribution with mean equals to and standard deviation of 1.5 m. The victim position belief (red points) follow a uniform distribution, whose limits are equivalent to the survey extent of the flight plan from mission mode.
4.5.3. Hybrid Mode
The third flight mode, known as hybrid mode, combines the methods from mission and offboard modes. This mode splits the overall navigation task into two components: it uses mission mode to skim the survey area and triggers the POMDP motion planner after a first positive detection. The primary difference in the design of the POMDP motion planner between the offboard and hybrid modes relies on the modelling of the initial belief . In a hybrid mode, the mean value of the normal distribution of the UAV position belief is now defined as the UAV position coordinate, where the first victim detection takes place. Instead of distributing the victim position belief uniformly across the entire flying area, this mode constraints the search area to the extent of the camera’s FOV, as shown in Figure 12.
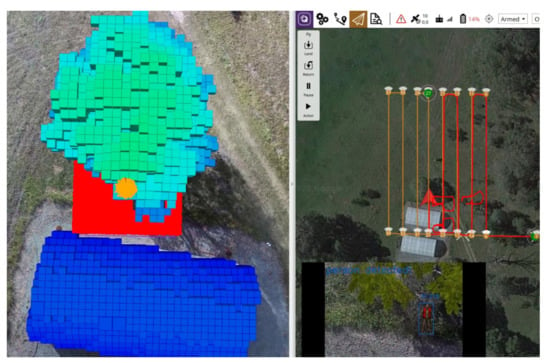
Figure 12.
Probabilistic distribution of initial UAV and victim position belief under hybrid flight mode. The UAV position belief (orange points) follows a normal distribution, with a mean equals to the current UAV position where a potential victim is first detected, and standard deviation of 1.5 m. The victim position belief (red points) follow a uniform distribution whose limits are equivalent to the extent of the camera’s FOV.
5. Results
Validation of the system through the presented SAR case study contains the following performance metrics: (1) Heatmaps of recorded GNSS coordinates of any detected victims; (2) accuracy of output detections and collisions; (3) speed analysis of POMDP-based motion planner in offboard and hybrid flight modes; and (4) system speed to cover the survey area or until the victim is detected. Each performance indicator is evaluated per flight mode and victim locations (which represent various detection complexities because of occlusion from nearby obstacles). Each setup combination (flight mode and victim location) was tested for 20 iterations. Demonstrative videos of the UAV system operating under mission (Video S1), offboard (Video S2), and hybrid (Video S3) flight modes can be found in the Supplementary Materials section.
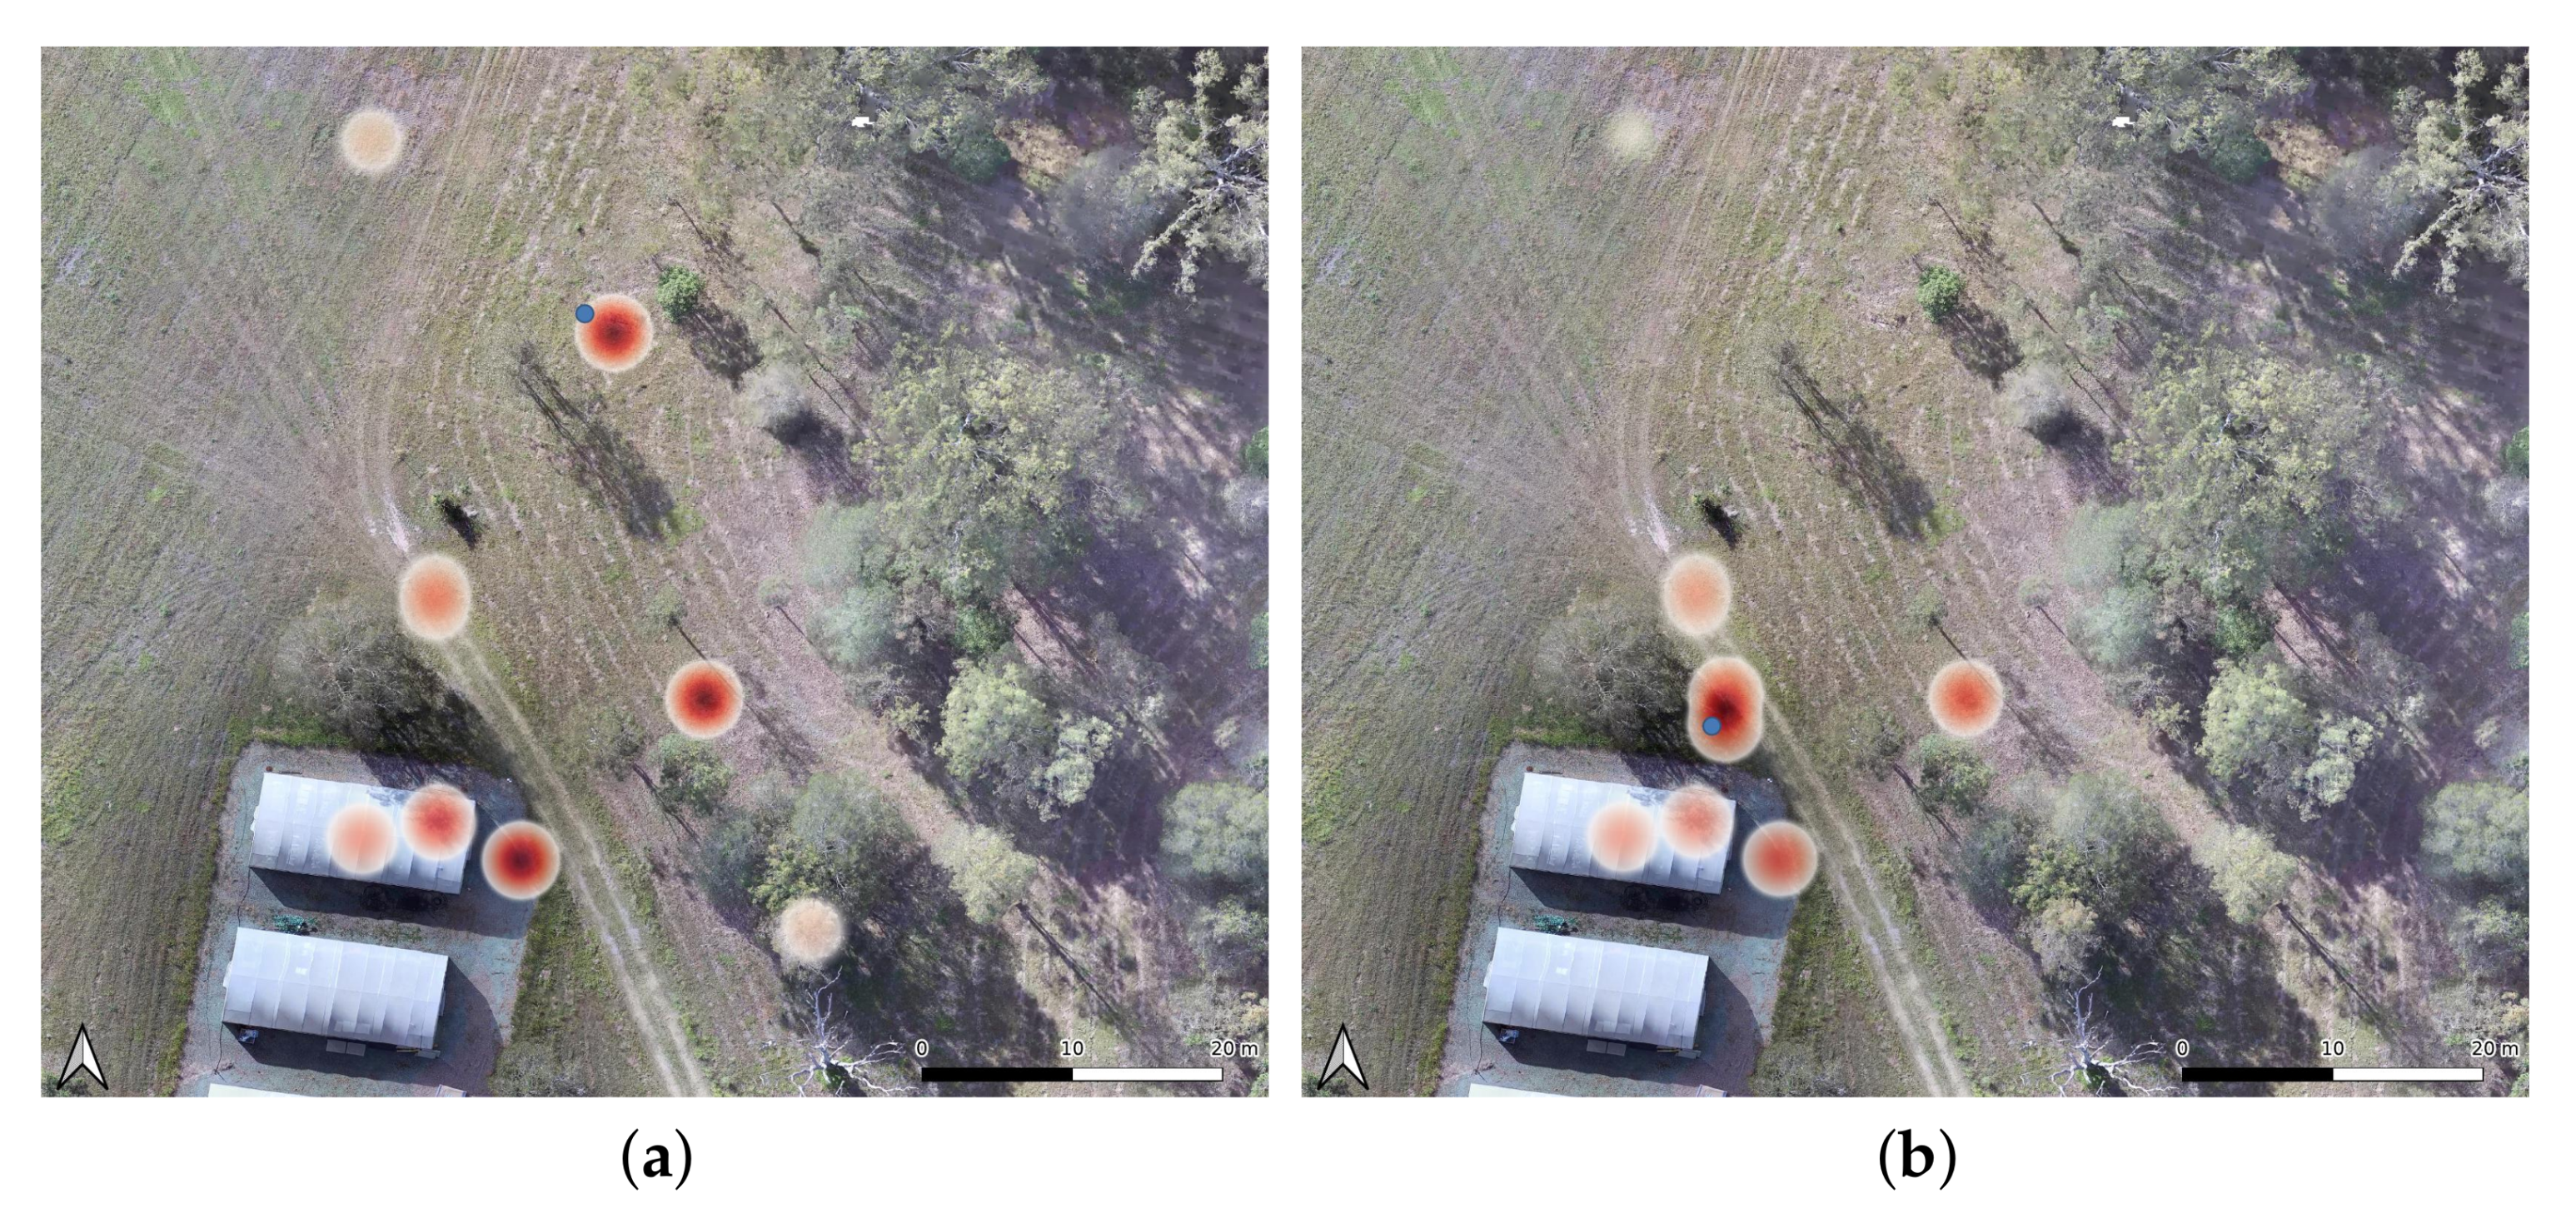
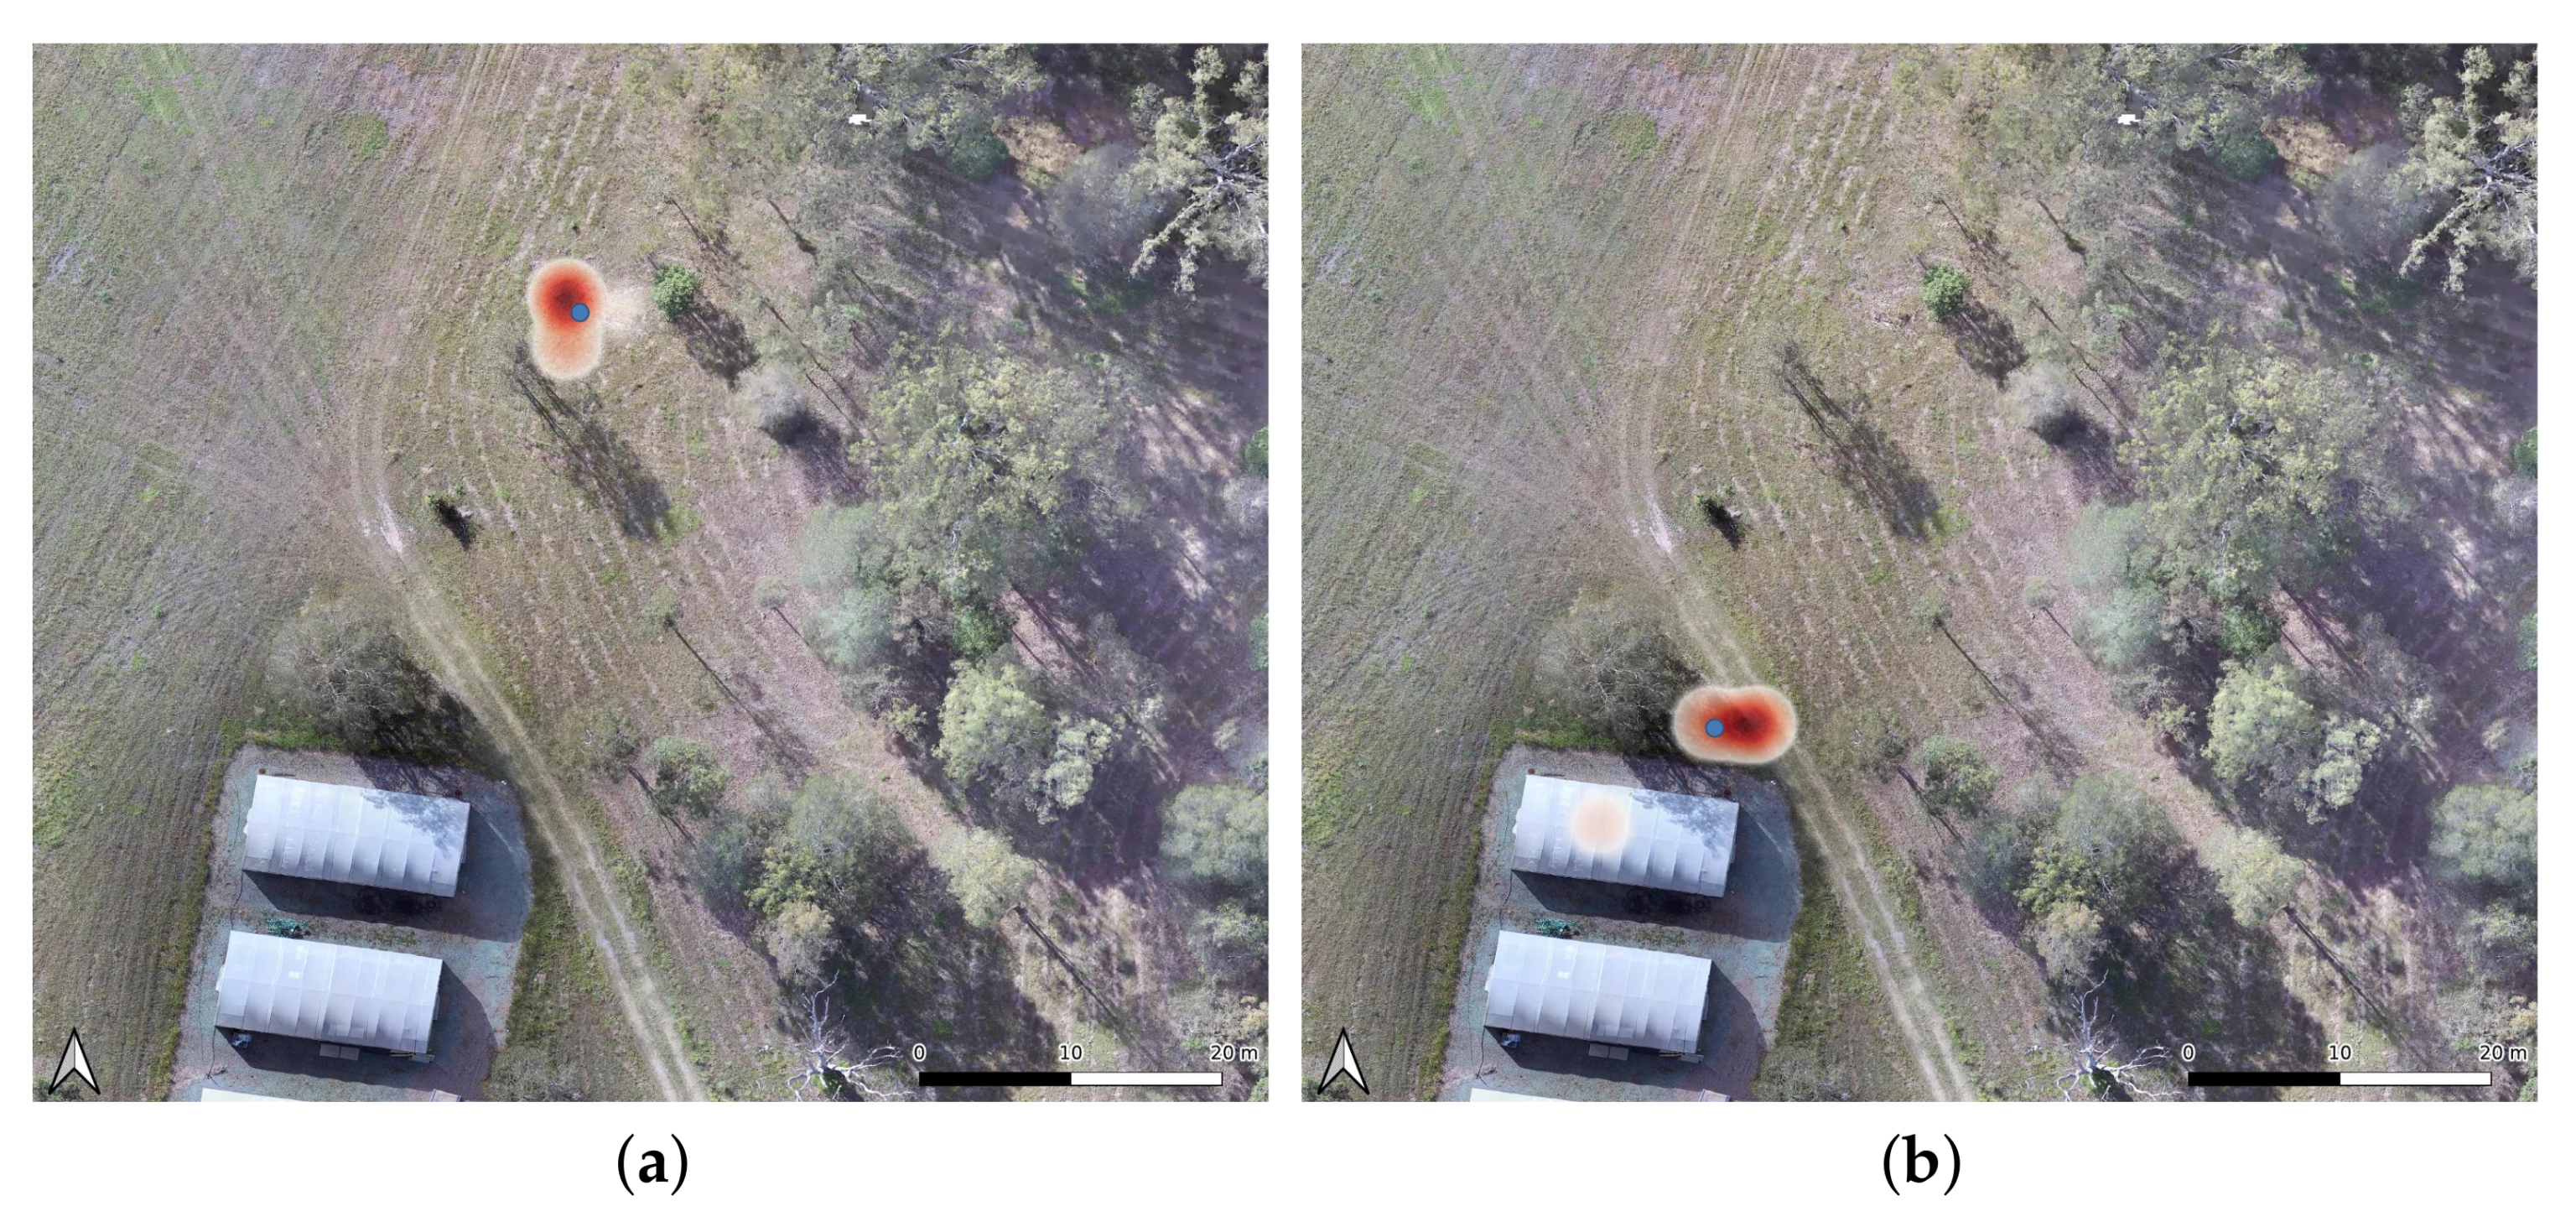
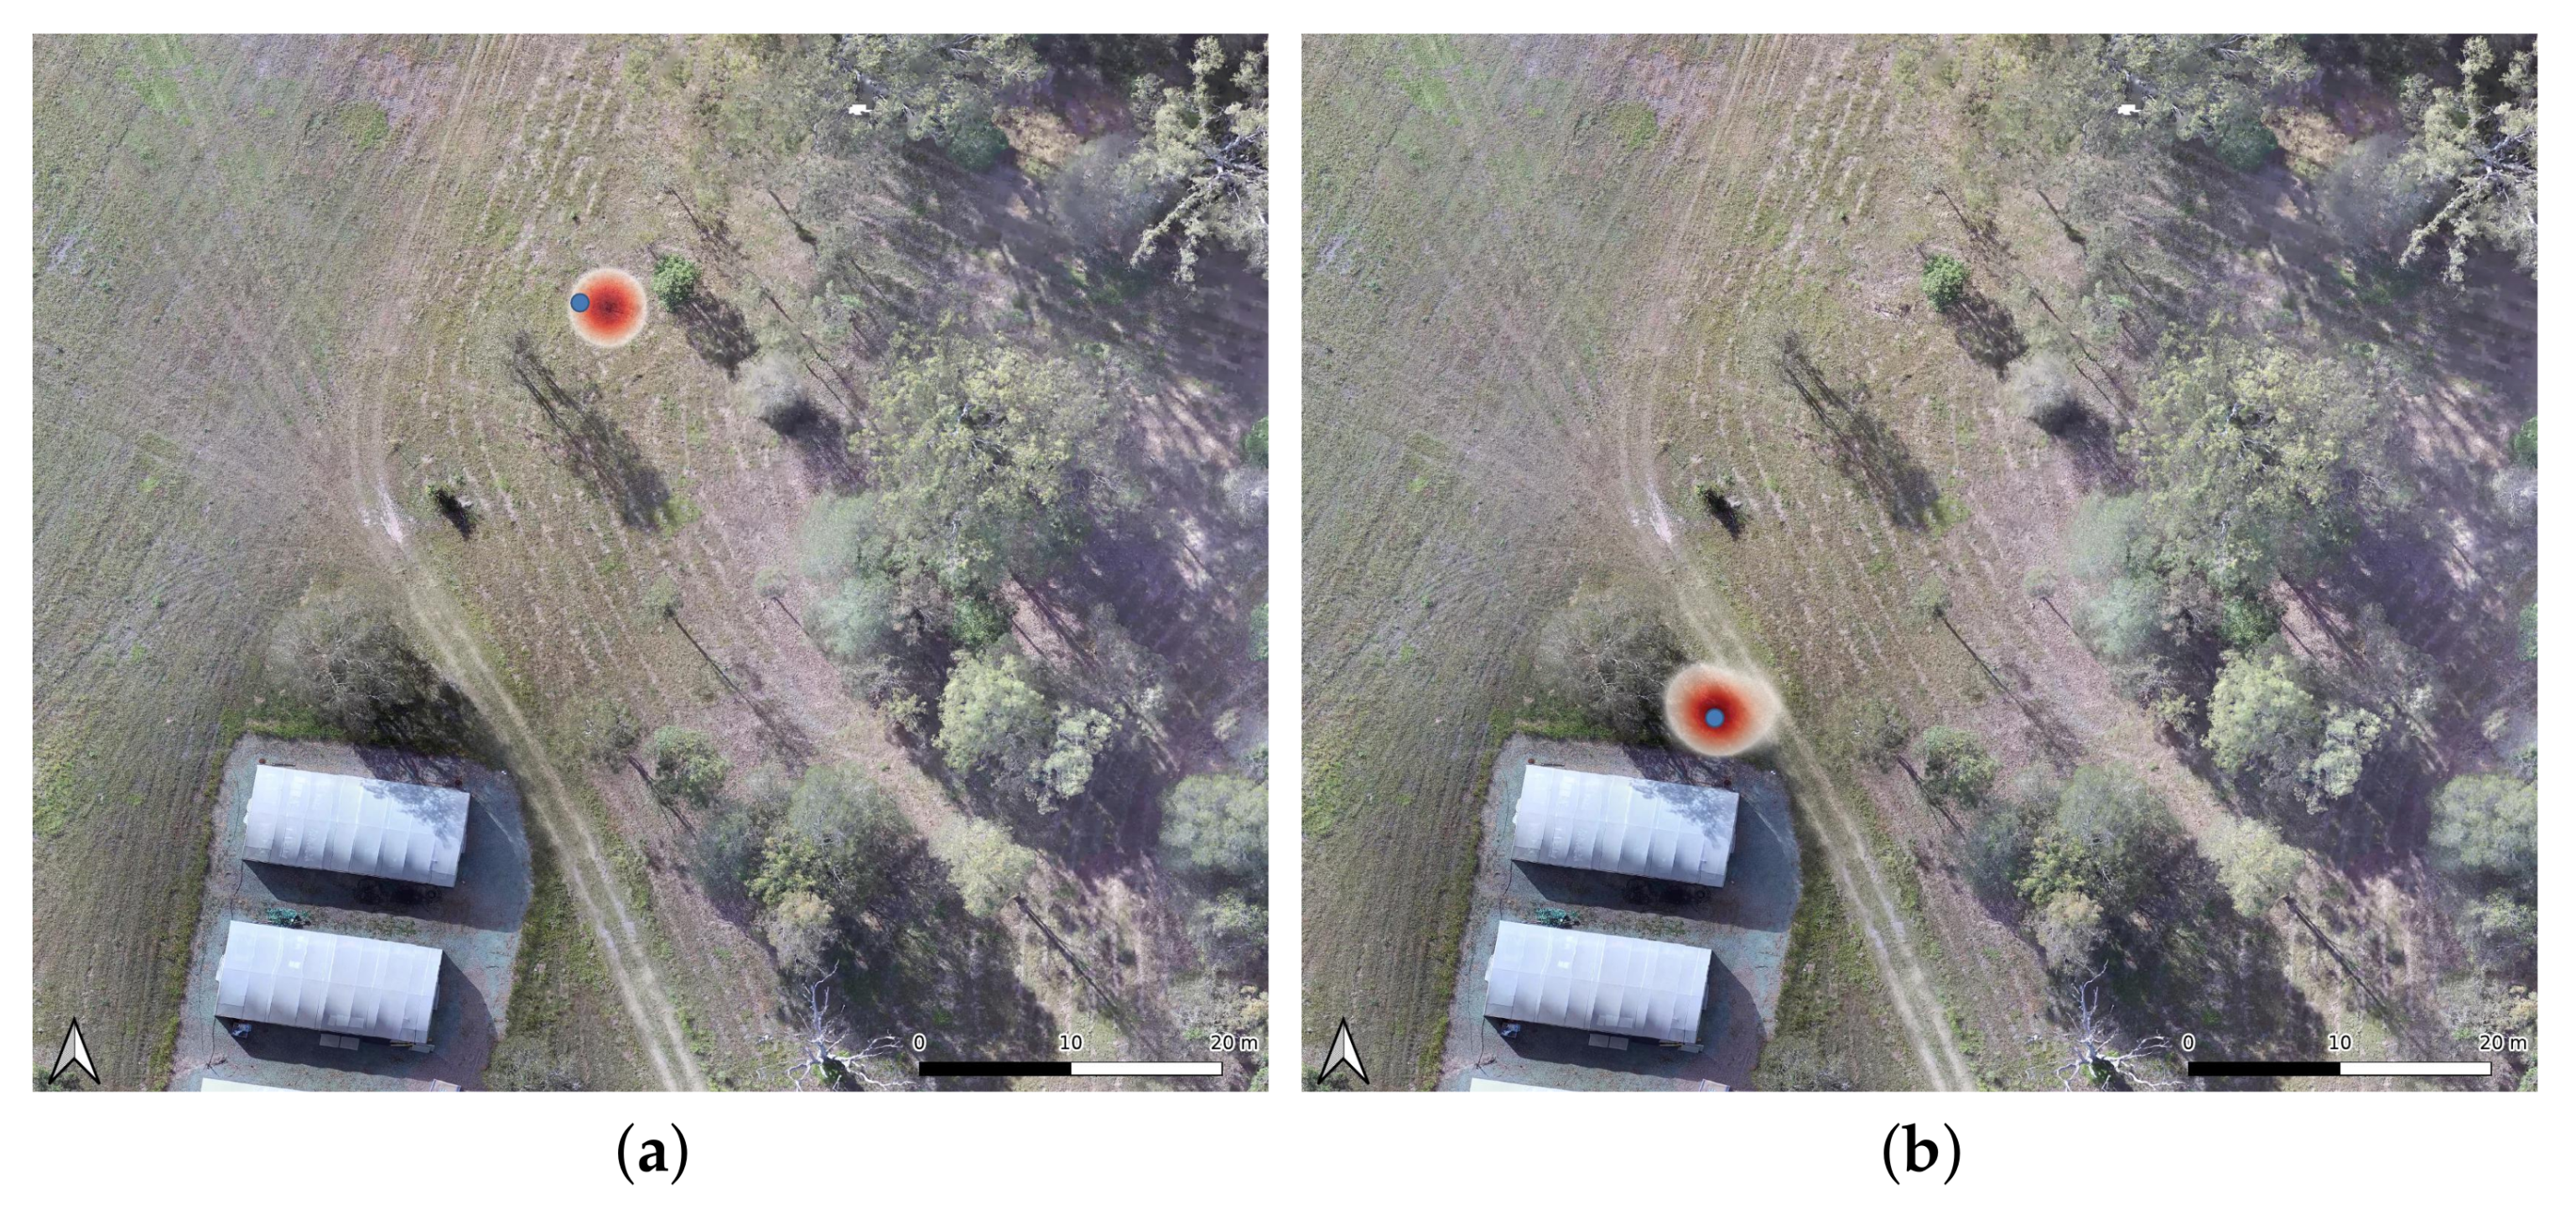
A series of heatmaps of GNSS coordinates (from detected victims) returned by mission, offboard and hybrid flight modes are shown in Figure 13, Figure 14 and Figure 15 respectively.
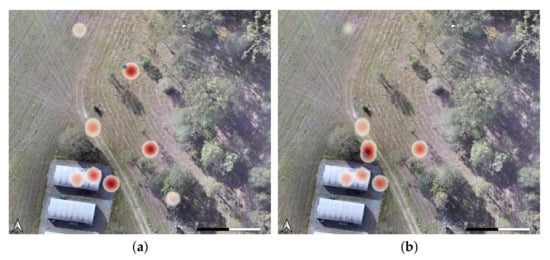
Figure 13.
Heatmaps from recorded GNSS coordinate points from detections in mission mode. The amount of false positive locations were triggered by the CNN model from detecting other objects as people during the survey. (a) First victim location (blue dot) in an open area. (b) Second victim location (blue dot) nearby a tree.
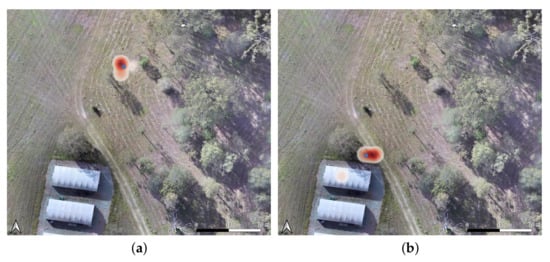
Figure 14.
GNSS coordinates’ heatmaps of confirmed victim detections by the POMDP-based motion planner in offboard flight mode. (a) First victim location (blue dot) in an open area. (b) Second victim location (blue dot) nearby a tree.
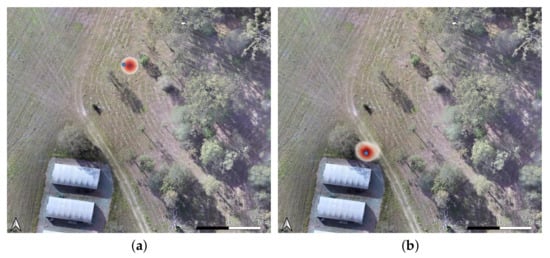
Figure 15.
GNSS coordinates’ heatmaps of confirmed victim detections by the POMDP-based motion planner in hybrid flight mode. (a) First victim location (blue dot) in an open area. (b) Second victim location (blue dot) nearby a tree.
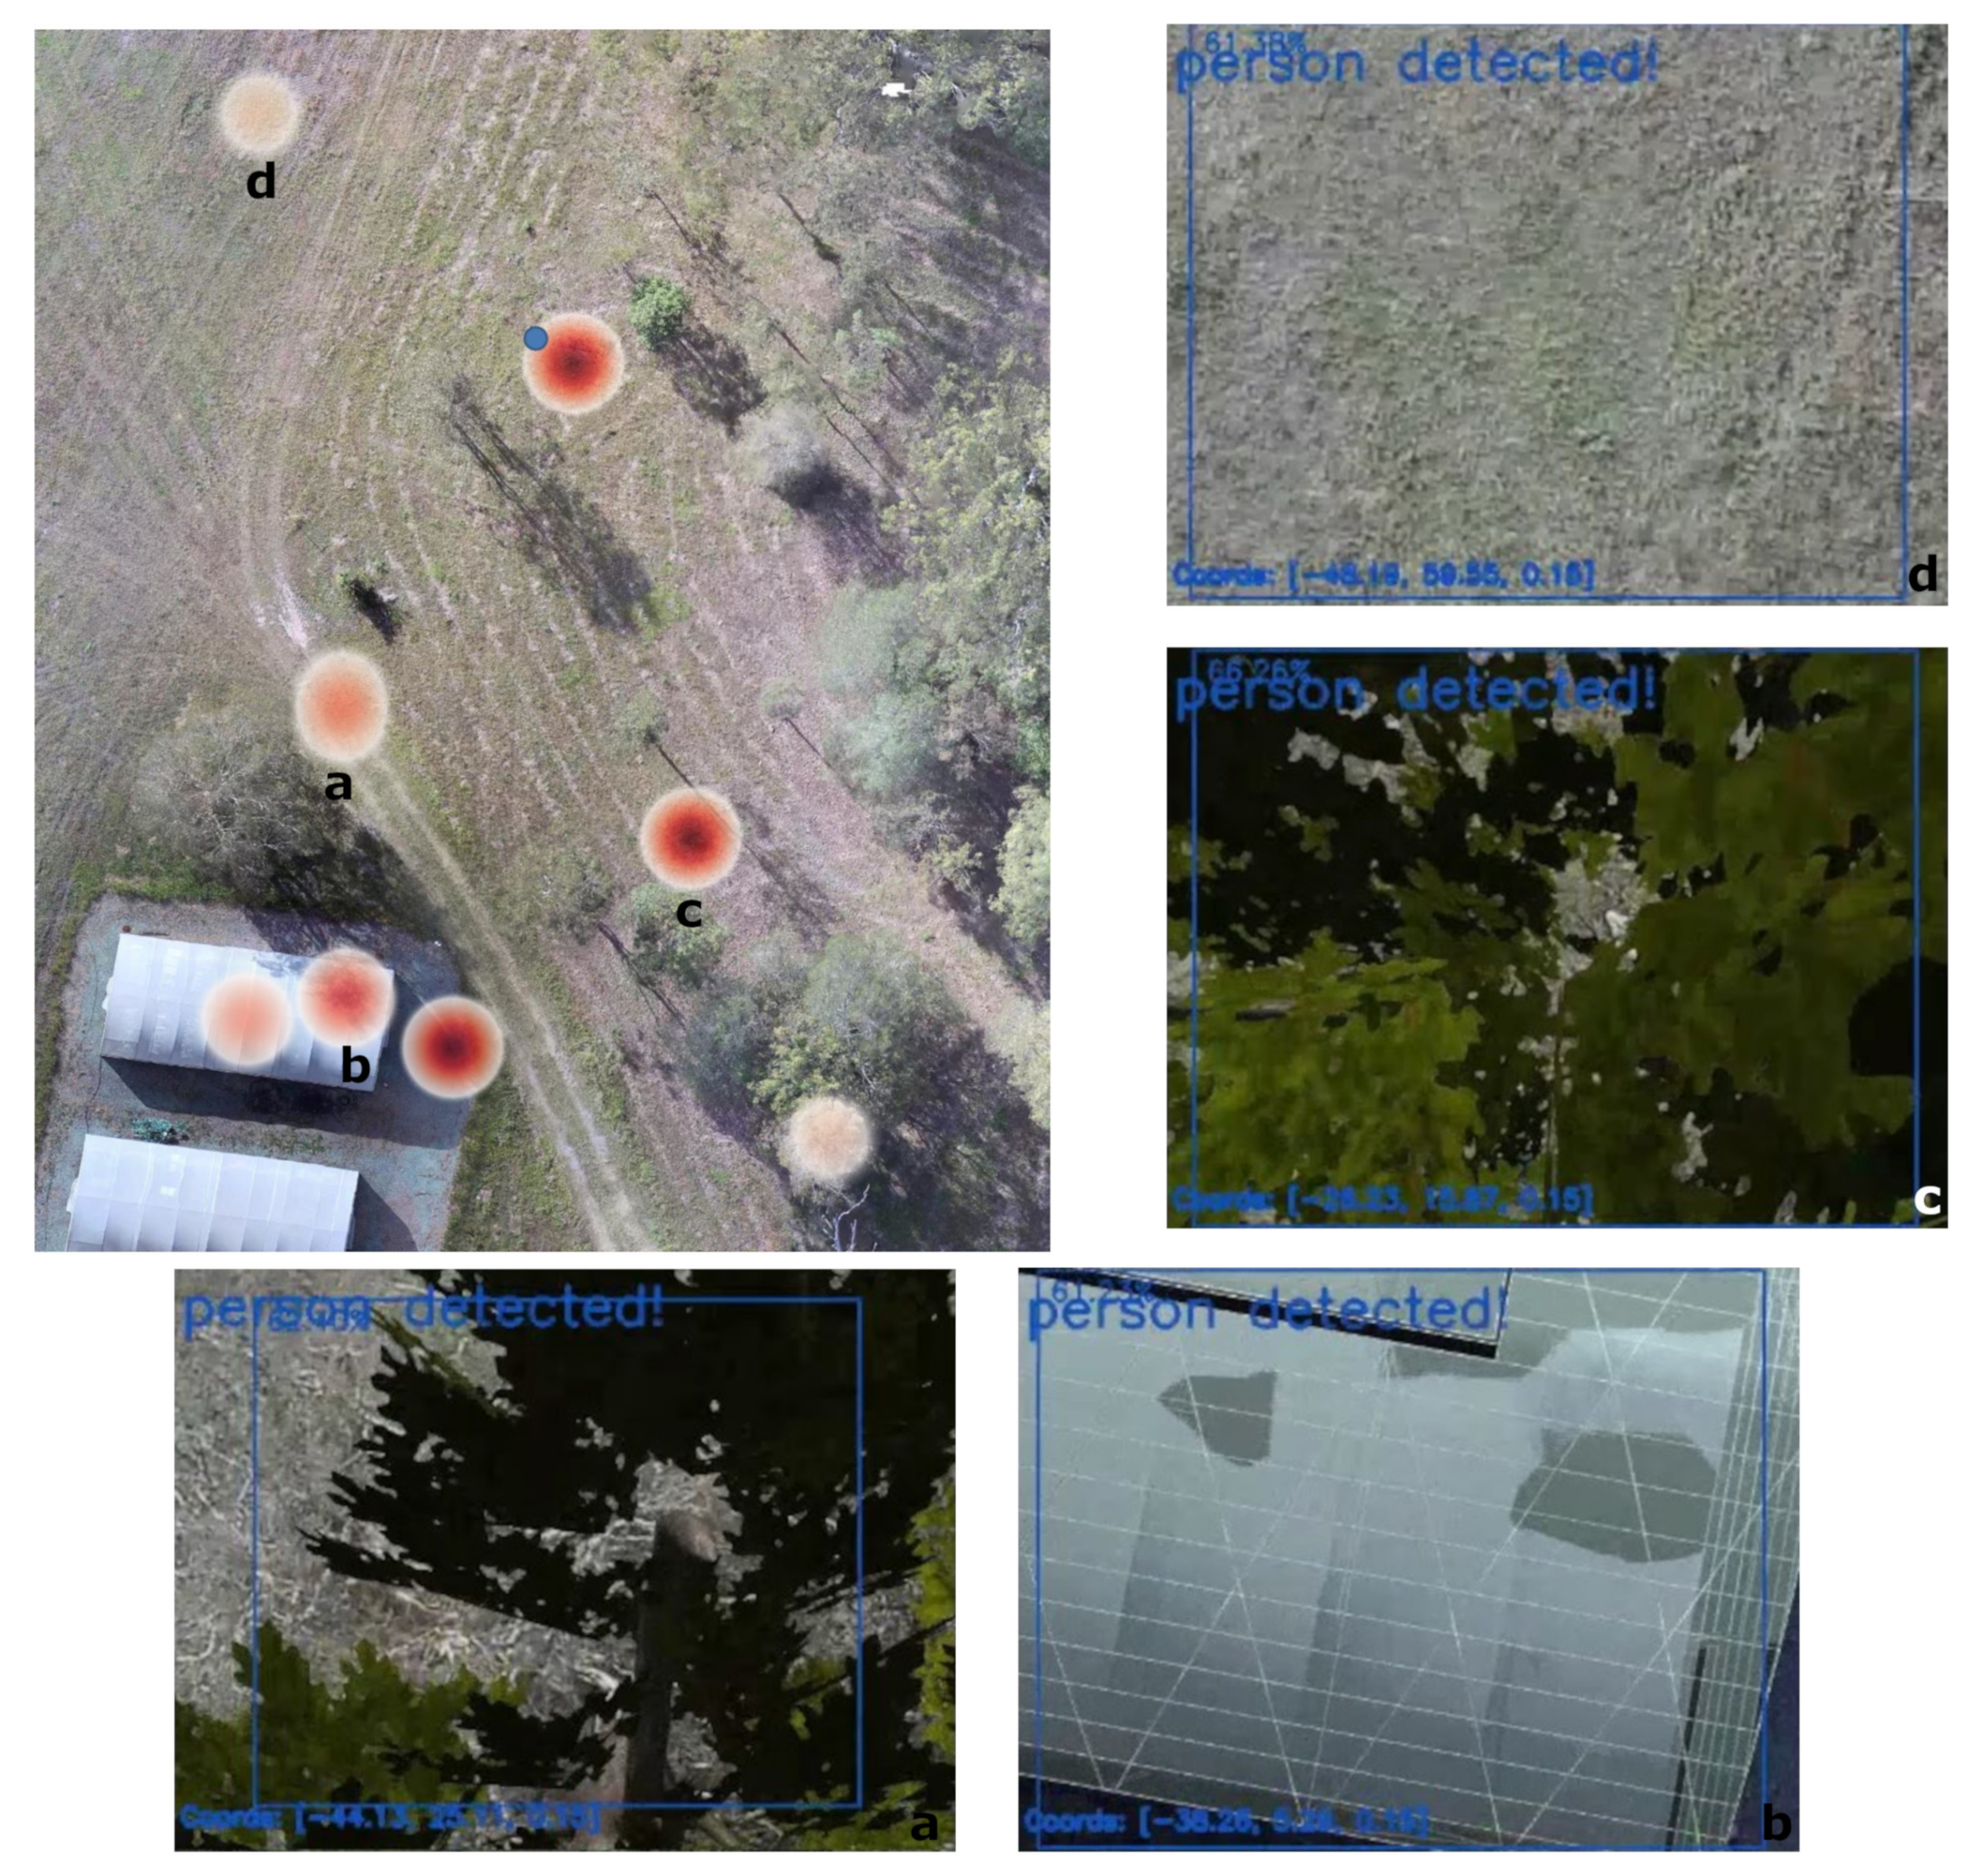
The distribution of GNSS coordinates in the heatmaps suggests a considerably higher precision when the system runs offboard and hybrid flight modes to report victim locations compared to the baseline (mission) flight mode. The visualisation complexity from the defined victim locations does not indicate any significant differences to the precision outputs of the system. The variable distribution of victim GNSS coordinates in mission mode (Figure 13) was caused by false positive readings from specific object visualisations. For this case study and environment setup, other objects wrongly detected as people included trees, greenhouse rooftops, and to a lesser degree, bare grass. Examples of these detections are displayed in Figure 16.
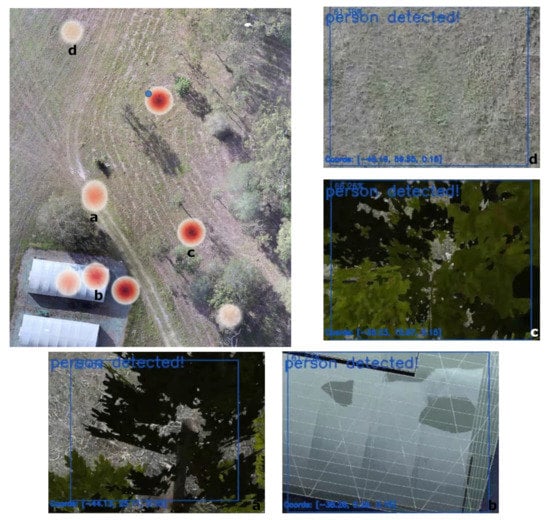
Figure 16.
Most common object visualisations that triggered false positive readings of people in mission mode. Other objects wrongly detected as people included trees, greenhouse rooftops, and to a lesser degree, bare grass.
The detection outputs of the CNN model also had an impact in the accuracy metrics of the system when surveying the studied area in mission mode. A summary of the accuracy and collision metrics per flight mode and victim location is shown in Table 5.

Table 5.
Accuracy and collision metrics of the system to locate a victim at two locations (L1 and L2). Each setup was evaluated for 20 iterations.
Regardless of the victim location in the surveyed area, the use of the MobileNet SSD CNN model had a negative impact on any flights using mission mode. After testing each setup combination for 20 iterations, the positive detection rate for victims in a trivial location (or Location 1 (L1) as referred in Table 5) did not exceed 20% of the reported detections. In contrast, offboard and hybrid flight modes reported improved detection rates of 100% and 92.5% respectively. An overall slight decrease in the victim detection rates was observed between trivial and complex locations, where up to 5.0% of the iteration runs failed to confirm a victim’s location in hybrid mode. The tests reported that 2.5% of the iterations in hybrid mode (5.0% for Location 1) with the UAV colliding with obstacles. However, taking into account all of the tested runs from offboard and hybrid modes, the overall collision probability experienced using the POMDP-based motion planner is 1.25%.
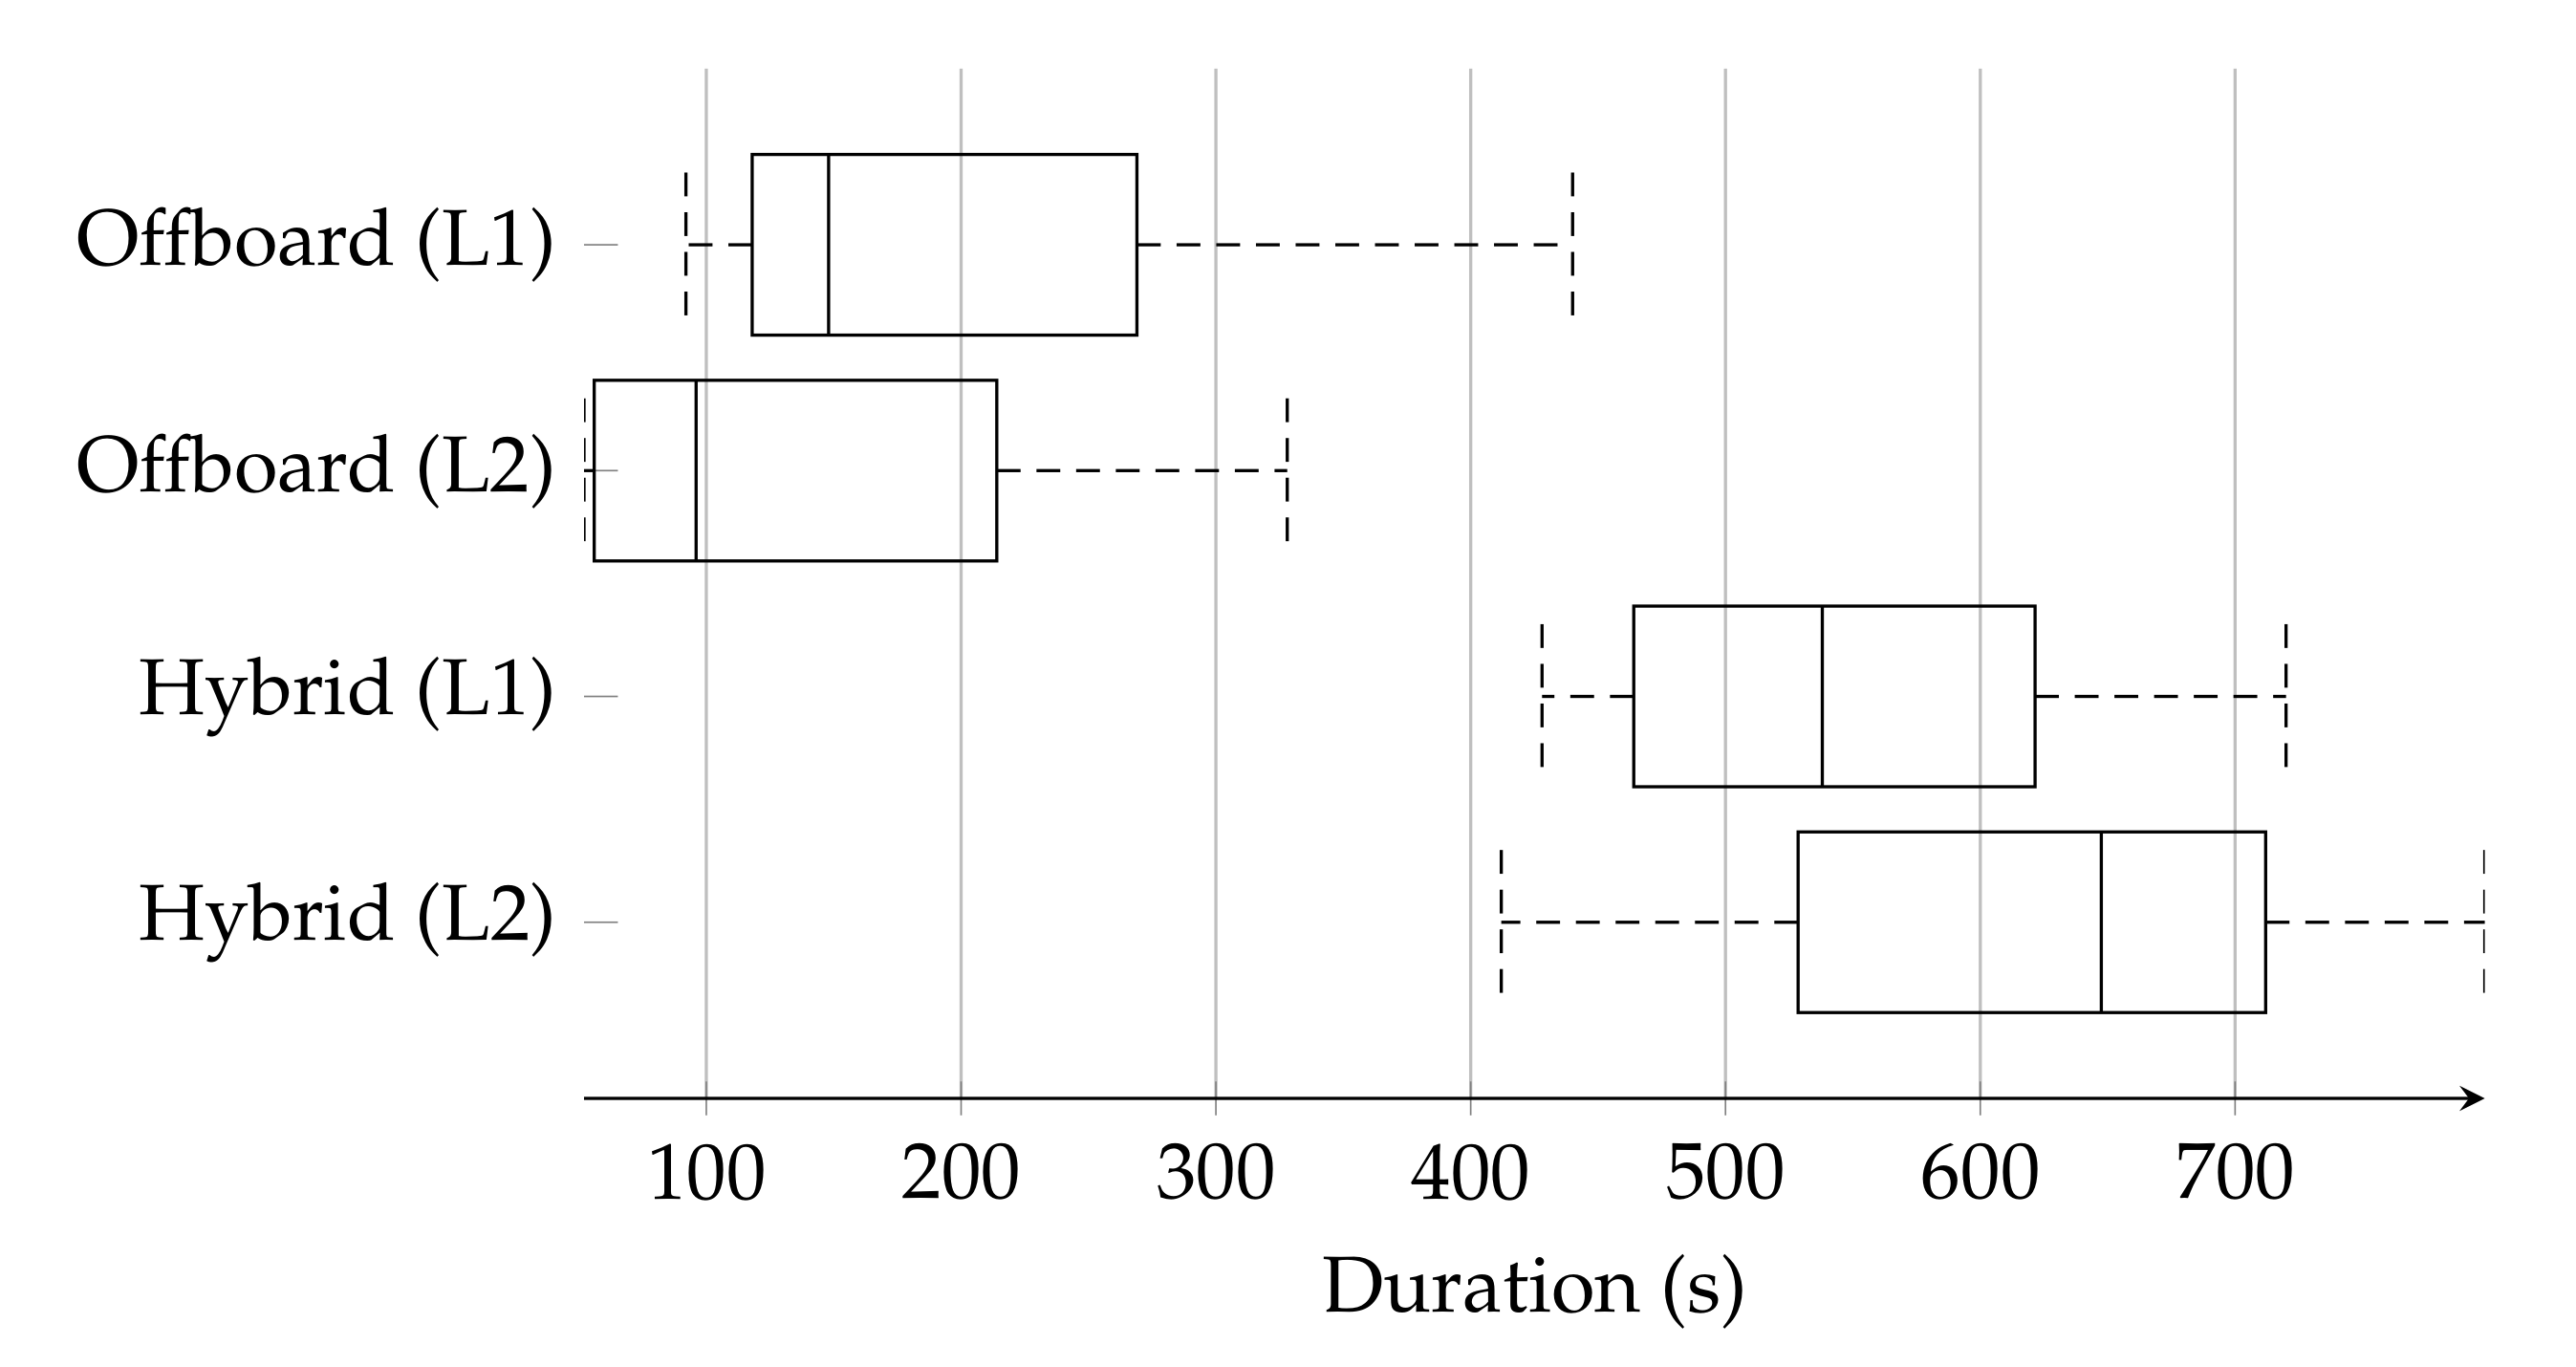
A speed analysis of the evaluated flight modes tracked the elapsed time from the initial position waypoint until a victim detection was confirmed. The collected data are represented with box plots, as shown in Figure 17.
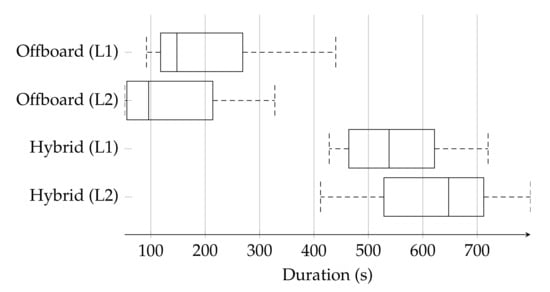
Figure 17.
Distribution frequency of the elapsed time until the POMDP-based motion planner confirmed a detected victim in a trivial (L1) and complex (L2) locations.
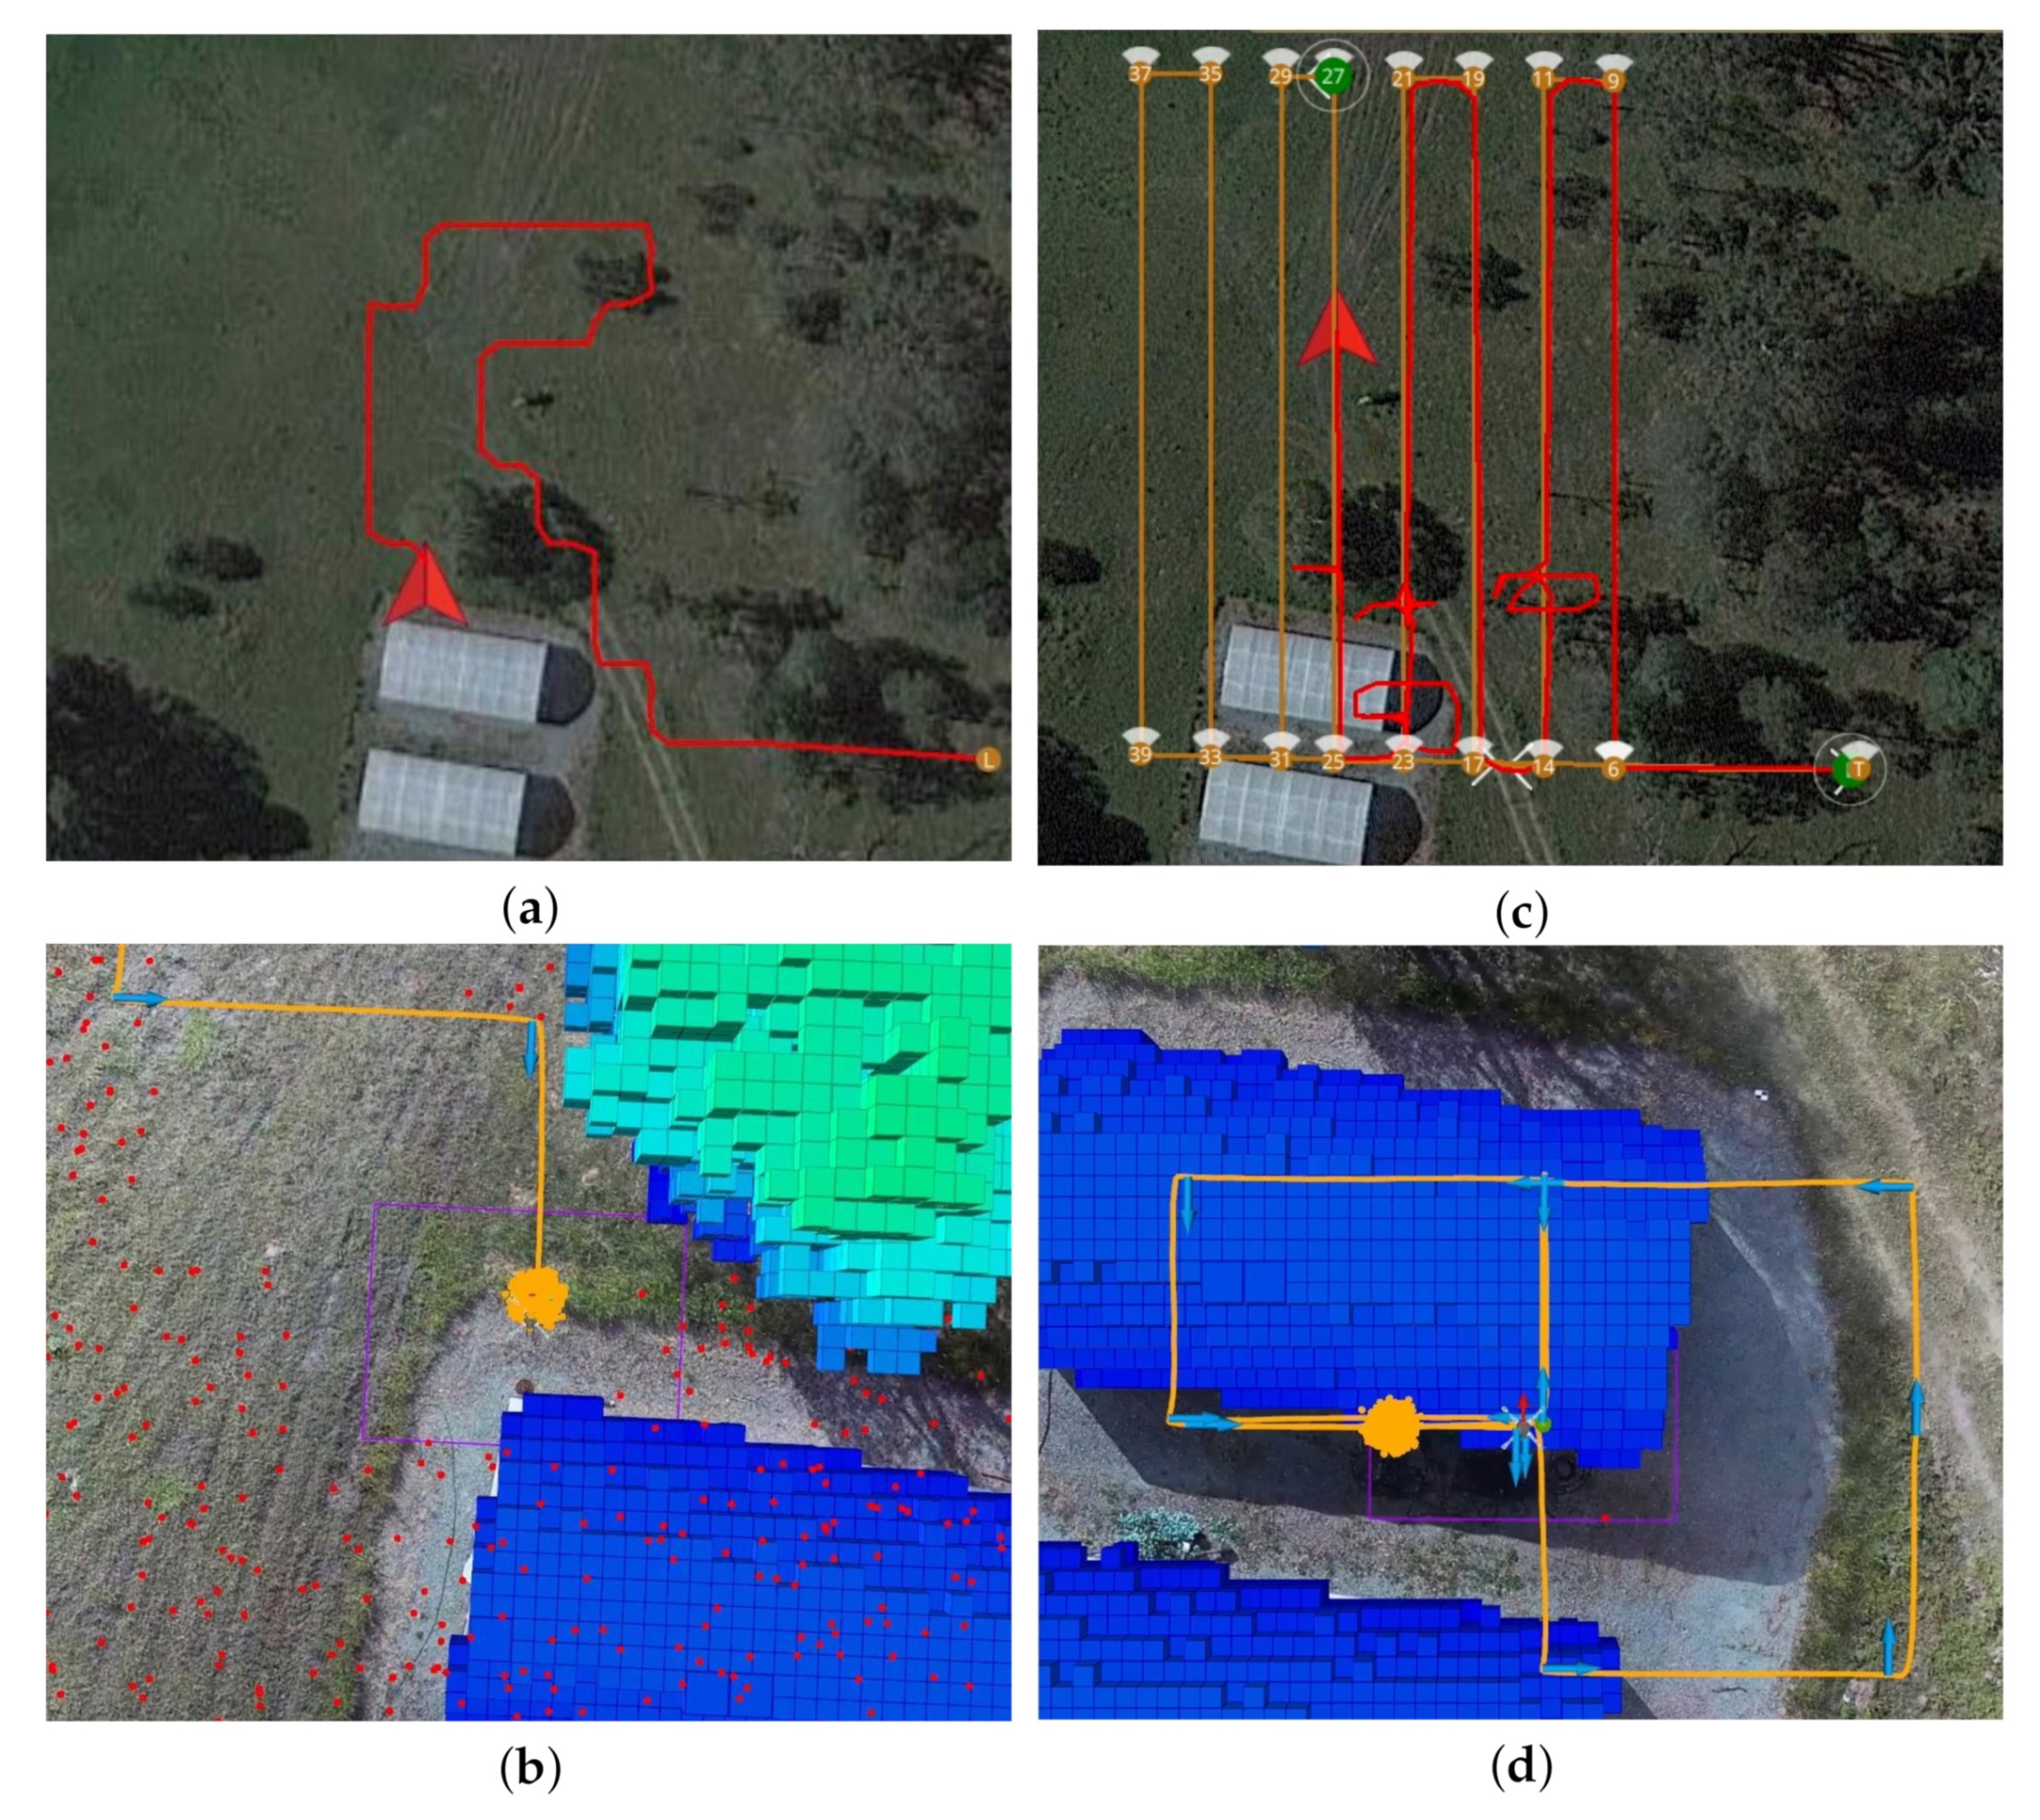
The data distribution shows a wider range in the top quartile and top whisker on the conducted tests using offboard mode for both victim locations. This distribution anomaly was caused by increased uncertainty given to the solver to compute a motion policy for a higher extent of area to survey compared to hybrid mode. Similarly, a bigger search area resulted in increased combinations of traversed paths to survey and locate the victim. Recorded paths indicated a trend of the solver to navigate towards the centre of the area extent, surrounding trees, as shown in Figure 18a.
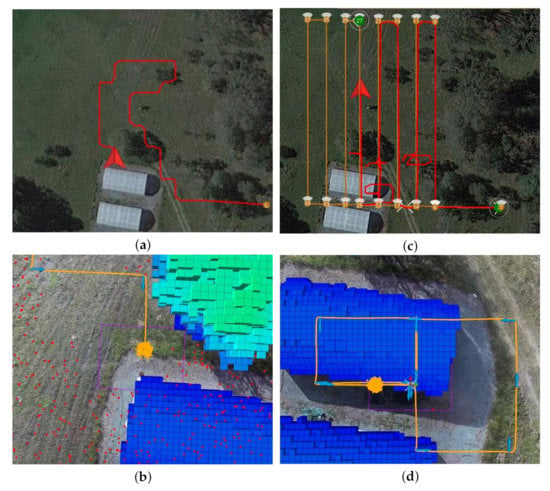
Figure 18.
Illustration of two traversed paths using the proposed POMDP-based motion planner. (a) Traversed path of the UAV in offboard mode. (b) Probabilistic belief locations of the UAV (orange) and victim (red), the latter covering the entire surveyed area. (c) Traversed path of the UAV in hybrid mode. (d) Common path pattern by the UAV to confirm or discard positive detections sent by the computer vision module.
Data distribution and traversed paths on tests under hybrid flight mode were more consistent as the exploration extent is constrained to the lawnmower pattern followed in mission mode. However, elapsed times in hybrid mode were considerable higher at both victim locations because of the occurrences of false positives. As first detection readings trigger offboard mode to inspect such locations, the system required additional time to confirm or discard the presence of any victim. An illustration of the traversed path by the UAV in hybrid flight mode is shown in Figure 18c.
The average elapsed time to locate the victim in locations 1 and 2, shown in Table 6, indicates contrasting values between offboard and other flight modes. A trend to detect a victim at location 2 quicker than at location 1 was caused by the proximity of the initial position waypoint to begin the search (bottom right corner of the survey pattern). Overall, the system required 2.3 times more time to survey the flight area in hybrid mode than in mission mode. Nonetheless, using tuned CNN models from UAV image datasets is expected to decrease the instances of false positive readings at it was the case in this work. As the primary contribution of this work is on presenting a fully autonomous robust motion planner system against high levels of object detection uncertainty and partial observability, a pre-trained detector from a PASCAL VOC2012 dataset was purposely used to test the performance of the system.

Table 6.
Average duration among flight modes to locate the victim. Here, M1, M2, and M3 refer to mission, offboard, and hybrid flight modes, respectively.
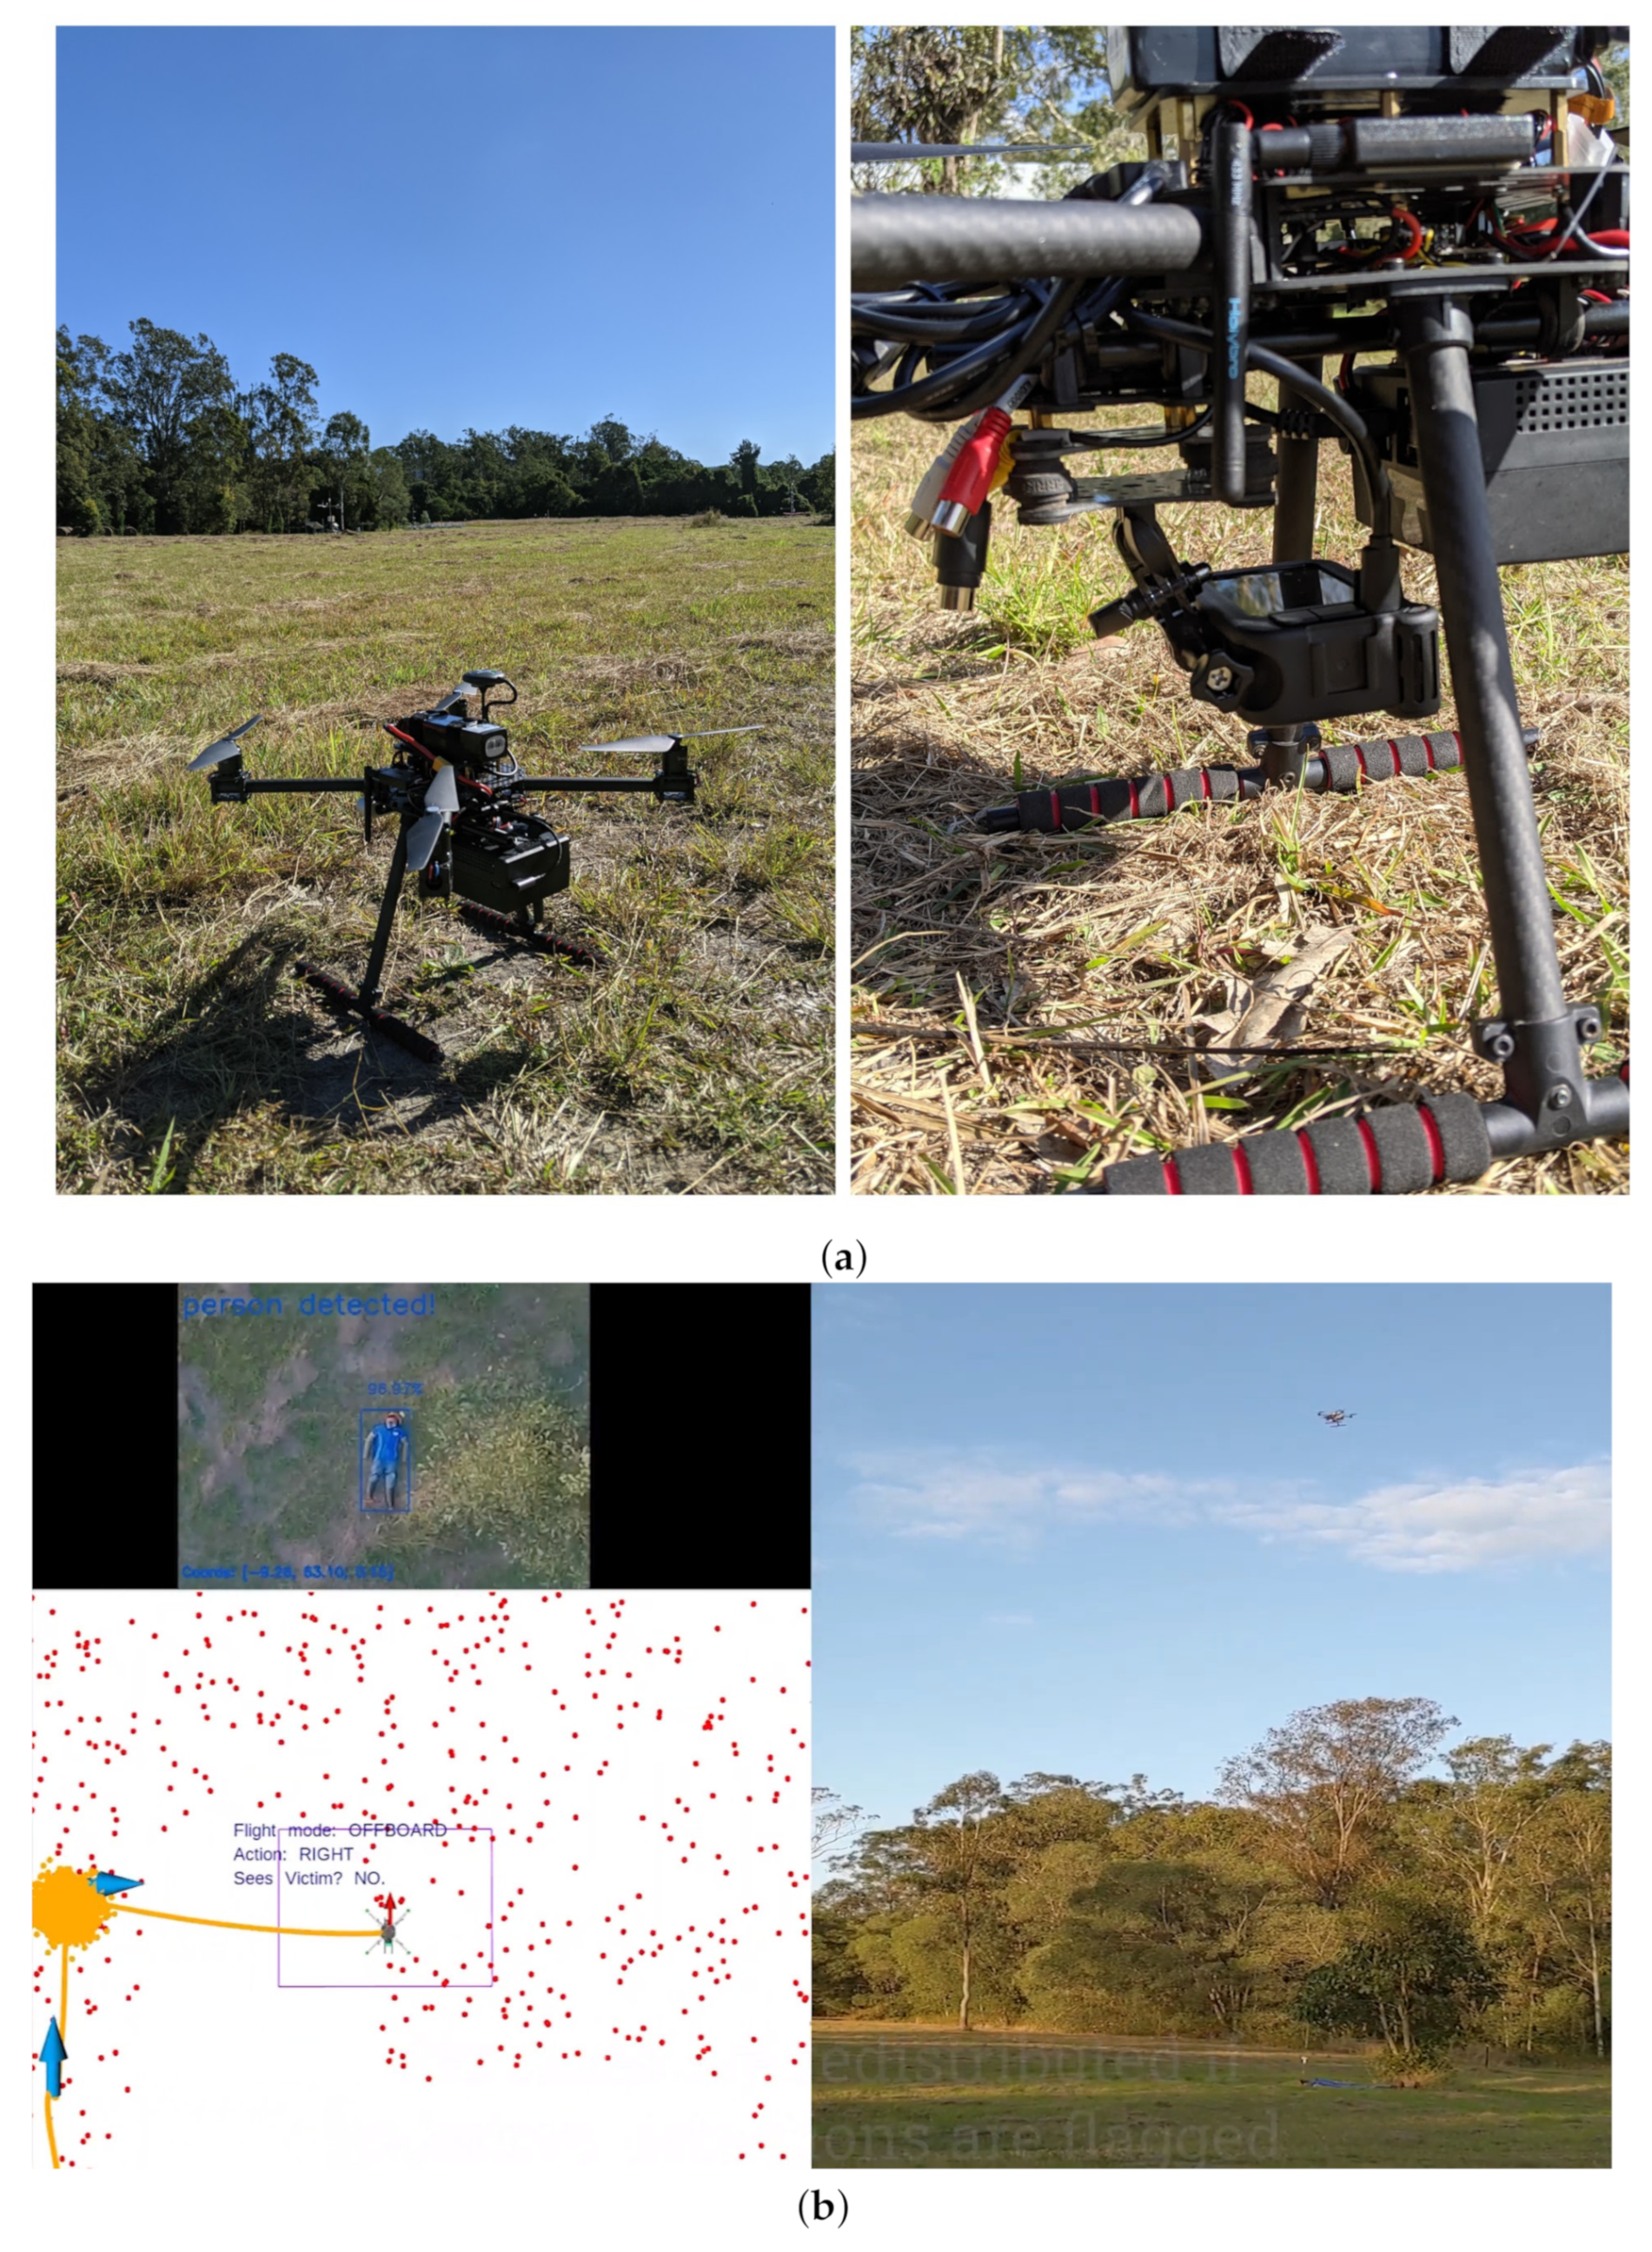
A further preliminary evaluation of the UAV system presented in this paper has been conducted with real flight tests at QUT SERF. The UAV framework has been adopted from the system tested by Sandino et al. [27] for a SAR case study in GNSS-denied environments, which follows a similar system architecture for simulation and real flight tests. The demonstrative flights tested mission, offboard, and hybrid flight modes to locate an adult mannequin placed in a trivial location. As shown in Figure 19, the UAV frame consists of a carbon-fibre Holybro X500 quadrotor, a Pixhawk 4 with GPS and 433 MHz telemetry radio. The tested companion computer in HIL mode (Section 4.3) and software tools (Section 4.4) are integrated to the frame during the tests, as well as a GoPro Hero 9 for real-time streaming of RGB frames. A detailed visual representation of the system can be found in Supplementary Video S4.
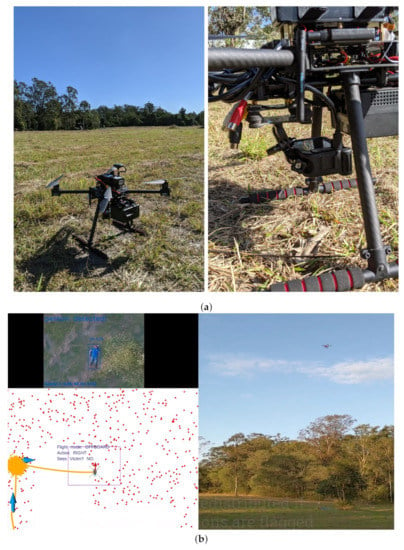
Figure 19.
Demonstration of the presented UAV system in hardware with real flight tests at QUT SERF. (a) Holybro X500 quadrotor UAV frame kit with UP2 as a companion computer and a GoPro Hero 9 as RGB camera. (b) UAV detecting an adult mannequin for the first time while navigating in offboard flight mode.
6. Discussion
The presented system constitutes a step towards fully autonomous navigation onboard small UAVs in real-world environments under uncertainty and partial observability. This research expands the navigation problem of Sandino et al. [26,27], by (1) formulating a more sophisticated reward function for a better discrimination between exploration and object inspection; (2) proposing optimised action commands based on the desired overlap between the camera’s FOV and the UAV altitude; and (3) incorporating a new flight mode (i.e., hybrid mode) to further optimise the exploration capabilities when partial information on the environment is provided beforehand (e.g., UAV navigation in outdoor scenarios, compared to GNSS-denied environments). Furthermore, this work indicates an enhanced design of UAV simulation environments by using realistic representations of ground textures and elevation, obstacle location and 3D occupancy maps from airborne UAV georeferenced mosaic and LiDAR datasets.
The system architecture and POMDP motion planner presented in this paper improve the autonomy capabilities of small UAVs under environment and object detection uncertainty. Under the presence of uncertainty from potential incorrect readings of vision-based detectors, such as CNNs, the standard objective of many existing approaches is to improve the performance metrics of their customised CNN-based object detectors for real-world UAV operations [40]. In contrast, this paper proposes an alternative approach to this uncertainty issue by augmenting the cognitive power onboard UAVs. Using reactive UAV systems that calculate and update a motion policy while interacting with the environment allow higher flexibility to detect objects (i.e., victims) at various levels of object detection uncertainty, regardless if this uncertainty comes from inaccurate detections by the detector model, noise in the data, or sensor malfunctioning. Even though the performance of the object detector model can be enhanced with tailored datasets and fit models from UAV data [41,42], this approach shows the possibility to use UAVs to navigate autonomously and accomplish a victim finding mission using off-the-shelf detectors, such as MobileNet SSDs.
The speed of the UAV system to survey an area is partly conditioned by the flight plan design, and especially the maximum surveying altitude. The maximum altitude is defined by extrinsic and intrinsic factors on a case study basis. Extrinsic factors include the maximum height of surrounding obstacles, lifting restrictions in high-altitude environments, and local flight regulations. Intrinsic factors are defined by hardware and software limitations in the UAV to detect objects (i.e., victims). For instance, the camera lens properties (e.g., sensor width and focal length) define the camera’s FOV and, thus, the footprint extent and scale of observed objects. The image resolution of streamed camera frames into the computer vision module also determines the number of given pixels that represent an object to be detected using CNNs [43]. In this implementation, the system could capture positive victim detections using the MobileNet SSD model for a maximum surveying altitude of 20 m (and camera lens properties shown in Table 3). However, other CNN-based object detectors trained with airborne datasets are expected to allow surveys at higher altitudes and object detections with smaller scale visualisations, which translate in reduced duration for the UAV to survey the same area extent [40,43].
The design of the computer vision module is not limited to the MobileNet SSD detector, but it can be extended with other CNN architectures compatible with OpenVINO. Zhang et al. [44], for instance, propose a global density fused CNN model for UAV images that addresses object detection uncertainty factors such as variations in scale, viewpoint, and occlusion. A survey on CNN models for object detection on the VisDrone2019 dataset—an established low-altitude UAV dataset—shows that recent architectures, such as Cascade RCNN, RefineDet, and CornerNet outperform methods such as YOLO, SSD, and faster RCNN [40]. However, low average precision values for the best performing models (i.e., 17.41% on the VisDrone2019 dataset compared to 40.6% on the MS-COCO dataset) implies that further efforts in CNN architectures for object detection from airborne UAV data are required. Future implementations of CNN models discussed above could require a separate study of any model performance impacts caused by the streaming and processing of high-resolution frames onboard sub-2 kg UAVs, and onboard inference of CNN models in embedded computing systems, such as the UP2, Jetson Nano, and Edge TPU [45,46].
The UAV system presented in this paper ultimately offers several benefits for first responders in the event of an emergency. The system provides real-time telemetry of camera frames processed onboard the UAV as, thus, prior secured risk and accessibility assessment of the environment, the presence of any found victims, and their visible health conditions. The generated list of GNSS coordinates shown in Figure 13, Figure 14 and Figure 15 can be further transferred to the ground team (SAR squads) to update intervention strategy, and other UAVs for air-to-ground first aid deployment. An additional extension of this system is the use of other sensors and computer vision models such as Doppler radars, microphones, and thermal cameras [5,47,48], which provide a better understanding of health conditions from potential victims.
7. Conclusions
This article presented a modular system for autonomous motion planning and object finding, capable of running in resource-constrained hardware onboard small UAVs. The system uses a POMDP to increase autonomy of UAVs for obstacle avoidance, environment exploration, and object inspection in outdoor environments under object detection uncertainty and partial observability. The system was evaluated with an emulated SAR scenario in Gazebo using real-world airborne georeferenced rasters, and airborne LiDAR point clouds to produce 3D occupancy maps. The task consisted of finding a lost person last seen in a bushland in two locations at various levels of occlusion and complex path planning strategies because of nearby obstacles. High-fidelity simulation results were achieved as the proposed system architecture combines SIL to emulate real-behaviour from a PX4 autopilot, and HIL for onboard inference of a MobileNet SSD detector, and the computed motion policy using TAPIR and the ABT solver.
The proposed UAV system was tested in simulation and with preliminary real flight tests with three flight configurations (i.e., mission, offboard and hybrid) and four performance metrics: (1) heatmaps of accumulated GNSS coordinates of the victim; (2) accuracy metrics to detect a victim; (3) speed analysis of proposed flight modes utilising the POMDP-based motion planner; and (4) speed analysis until the victim is found. Heatmaps show that false positive victim detections recorded in mission mode, from objects, such as trees, building structures and grass, were discarded (or rejected) by the UAV after exploring the area using the POMDP-based planner with and without a pre-defined flight plan (i.e., in hybrid and offboard modes respectively). Offboard and hybrid flight modes achieved the highest detection accuracy rates (of 100% and 92.5% respectively), and a slight decrease in detection rates (from 95.0% to 90.0%) was observed between trivial and complex victim locations. The elevated occurrence of false positive detections from the MobileNet SSD detector resulted in increased flight times in offboard and hybrid flight modes. However, the use of other CNN architectures, such as Cascade RCNN, RefineDet, and CornerNet are expected to reduce flight times of the UAV to inspect and reject false positive detections.
Further research avenues include a detailed experimental analysis using real flight tests, static and dynamic obstacles, and with sensors commonly used for SAR applications, such as thermal cameras. Placing the victim at random locations or increasing the number of victims could contribute to further understand the limits of the used POMDP solver. Similar case studies that can also be explored include surveillance for victims, using dynamic camera gimbal configurations and computer vision systems, which provide additional statistics of the victim, such as age, gender, and heartbeat rate. An evaluation of performance impacts in resource-constrained hardware for onboard inference using more complex CNN architectures for UAV object detection, and processing of high-resolution streamed frames, could help understand the limits of the proposed system architecture in sub-2 kg UAVs. Other sequential decision-making algorithms could also be implemented to compare the performance of the ABT solver.
Supplementary Materials
The following video demonstrations are available online: Video S1: system demonstration using mission mode, available at https://youtu.be/H1qmdo1Qzok (accessed on 6 November 2021); Video S2: system demonstration using offboard mode, available at https://youtu.be/ykPI-yimgtQ (accessed on 6 November 2021); Video S3: system demonstration using hybrid mode, available at https://youtu.be/cFzx8XtGI2w (accessed on 6 November 2021); and Video S4: Preview of UAV system running on real hardware at QUT SERF, available at https://youtu.be/U_9LbNXUwV0 (accessed on 6 November 2021).
Author Contributions
Conceptualisation, J.S., F.M., P.C. and F.G.; methodology, J.S. and F.G.; software, J.S.; validation, J.S.; formal analysis, J.S.; investigation, J.S.; resources, F.G.; data curation, J.S.; writing—original draft preparation, J.S.; writing—review and editing, F.M., P.C., C.S. and F.G.; visualisation, J.S.; supervision, F.M., P.C., C.S. and F.G.; project administration, F.G.; funding acquisition, P.C. and F.G. All authors have read and agreed to the published version of the manuscript.
Funding
This research was funded by The Commonwealth Scientific and Industrial Research Organisation (CSIRO) through the CSIRO Data61 PhD and Top Up Scholarships (Agreement 50061686), the Australian Research Council (ARC) through the ARC Discovery Project 2018 “Navigating under the forest canopy and in the urban jungle” (grant number ARC DP180102250) and the Queensland University of Technology (QUT) through the Higher Degree Research (HDR) Tuition Fee Sponsorship. The APC was funded by the QUT Office for Scholarly Communication (OSC).
Institutional Review Board Statement
Not applicable.
Informed Consent Statement
Not applicable.
Data Availability Statement
Flight logs and recorded GNSS coordinates per flight mode and victim location are available by contacting the corresponding author upon request.
Acknowledgments
The authors acknowledge continued support from the Queensland University of Technology (QUT) through the Centre for Robotics. The authors would also like to gratefully thank the QUT Research Engineering Facility (REF) team (Dmitry Bratanov, Gavin Broadbent, Dean Gilligan), for collection and processing of airborne LiDAR and imagery datasets that were used as a ground reference for the simulated environment. Special thanks to Hexagon through the Hexagon SmartNet RTK corrections service that enabled high accuracy surveying and positioning data using the EMLID Reach RTK receiver during the experimentation phase.
Conflicts of Interest
The authors declare no conflict of interest. The funders had no role in the design of the study; in the collection, analyses, or interpretation of data; in the writing of the manuscript, or in the decision to publish the results.
Abbreviations
The following abbreviations are used in this manuscript:
| 2D | two-dimensional |
| 3D | three-dimensional |
| ABT | augmented belief trees |
| AGL | above ground level |
| CNN | convolutional neural network |
| FOV | field of view |
| GNSS | global navigation satellite system |
| HIL | hardware in the loop |
| LiDAR | light detection and ranging |
| MAVLink | micro air vehicle link |
| MDP | Markov decision process |
| MTOW | maximum take-off weight |
| POMDP | partially observable Markov decision process |
| QUT | Queensland University of Technology |
| RGB | red, green, blue |
| ROS | robot operating system |
| SAR | search and rescue |
| SERF | Samford Ecological Research Facility |
| SIL | software in the loop |
| SSD | single shot detector |
| TAPIR | toolkit for approximating and adapting POMDP solutions in real time |
| UAV | unmanned aerial vehicle |
| VPU | vision processing unit |
Appendix A. Difference Equation Constants
A Holybro S500 quad-rotor UAV (Holybro, China) was tested in a controlled VICON flying arena for a series of position responses in the x, y and z Cartesian axes. The UAV responses per axis were recorded for increments of m every five seconds. The obtained difference equation constants for a sampling period s are defined in Table A1, Table A2 and Table A3:

Table A1.
Difference in equation constants for the x Cartesian axis.
Table A1.
Difference in equation constants for the x Cartesian axis.
| Variable | Value |
|---|---|

Table A2.
Difference in equation constants for the y Cartesian axis.
Table A2.
Difference in equation constants for the y Cartesian axis.
| Variable | Value |
|---|---|

Table A3.
Difference in equation constants for the z Cartesian axis.
Table A3.
Difference in equation constants for the z Cartesian axis.
| Variable | Value |
|---|---|
References
- Australian National Search and Rescue Council. Search and Rescue Operations. In National Search and Rescue Manual, 2020 ed.; Number February; Australian Maritime Safety Authority (AMSA): Canberra, ACT, Australia, 2020; Volume 2, Chapter 3; pp. 73–535. [Google Scholar]
- Bricknell, S. Missing Persons: Who Is at Risk? Technical Report; Australian Institute of Criminology: Canberra, ACT, Australia, 2017.
- Hanson, L.; Namuduri, K. Real-World Applications. In UAV Networks and Communications; Namuduri, K., Chaumette, S., Kim, J.H., Sterbenz, J.P.G., Eds.; Cambridge University Press: Cambridge, UK, 2017; pp. 194–213. [Google Scholar] [CrossRef]
- Pajares, G. Overview and Current Status of Remote Sensing Applications Based on Unmanned Aerial Vehicles (UAVs). Photogramm. Eng. Remote Sens. 2015, 81, 281–330. [Google Scholar] [CrossRef] [Green Version]
- Lee, S.; Har, D.; Kum, D. Drone-Assisted Disaster Management: Finding Victims via Infrared Camera and LiDAR Sensor Fusion. In Proceedings of the 3rd Asia-Pacific World Congress on Computer Science and Engineering, Nadi, Fiji, 5–6 December 2016; pp. 84–89. [Google Scholar] [CrossRef]
- Motlagh, N.H.; Bagaa, M.; Taleb, T. UAV-Based IoT Platform: A Crowd Surveillance Use Case. IEEE Commun. Mag. 2017, 55, 128–134. [Google Scholar] [CrossRef] [Green Version]
- Jiménez López, J.; Mulero-Pázmány, M. Drones for Conservation in Protected Areas: Present and Future. Drones 2019, 3, 10. [Google Scholar] [CrossRef] [Green Version]
- Erdelj, M.; Natalizio, E. UAV-assisted disaster management: Applications and open issues. In Proceedings of the International Conference on Computing, Networking and Communications, Kauai, HI, USA, 15–18 February 2016; pp. 1–5. [Google Scholar] [CrossRef] [Green Version]
- Pensieri, M.G.; Garau, M.; Barone, P.M. Drones as an Integral Part of Remote Sensing Technologies to Help Missing People. Drones 2020, 4, 15. [Google Scholar] [CrossRef]
- Mayer, S.; Lischke, L.; Woźniak, P.W. Drones for Search and Rescue. In Proceedings of the 1st International Workshop on Human-Drone Interaction, Glasgow, UK, 5 May 2019; pp. 1–7. [Google Scholar]
- Valavanis, K.P.; Vachtsevanos, G.J. Future of Unmanned Aviation. In Handbook of Unmanned Aerial Vehicles; Valavanis, K.P., Vachtsevanos, G.J., Eds.; Springer: Dordrecht, The Netherlands, 2015; Chapter 126; pp. 2993–3009. [Google Scholar] [CrossRef]
- Weldon, W.T.; Hupy, J. Investigating Methods for Integrating Unmanned Aerial Systems in Search and Rescue Operations. Drones 2020, 4, 38. [Google Scholar] [CrossRef]
- Chen, M.; Frazzoli, E.; Hsu, D.; Lee, W.S. POMDP-lite for Robust Robot Planning under Uncertainty. In Proceedings of the International Conference on Robotics and Automation, Stockholm, Sweden, 16–21 May 2016; pp. 5427–5433. [Google Scholar] [CrossRef] [Green Version]
- Ilhan, U.; Gardashova, L.; Kilic, K. UAV Using Dec-POMDP Model for Increasing the Level of Security in the Company. Procedia Comput. Sci. 2016, 102, 458–464. [Google Scholar] [CrossRef] [Green Version]
- Ponzoni Carvalho Chanel, C.; Albore, A.; T’Hooft, J.; Lesire, C.; Teichteil-Königsbuch, F. AMPLE: An anytime planning and execution framework for dynamic and uncertain problems in robotics. Auton. Robot. 2019, 43, 37–62. [Google Scholar] [CrossRef] [Green Version]
- Vanegas, F.; Gonzalez, F. Uncertainty based online planning for UAV target finding in cluttered and GPS-denied environments. In Proceedings of the 2016 IEEE Aerospace Conference, Big Sky, MT, USA, 5–12 March 2016; pp. 1–9. [Google Scholar] [CrossRef] [Green Version]
- Vanegas, F.; Campbell, D.; Eich, M.; Gonzalez, F. UAV based target finding and tracking in GPS-denied and cluttered environments. In Proceedings of the 2016 IEEE/RSJ International Conference on Intelligent Robots and Systems, Daejeon, Korea, 9–14 October 2016; pp. 2307–2313. [Google Scholar] [CrossRef] [Green Version]
- Kurniawati, H.; Yadav, V. An Online POMDP Solver for Uncertainty Planning in Dynamic Environment. In Robotics Research. Springer Tracts in Advanced Robotics; Inaba, M., Corke, P., Eds.; Springer: Cham, Switzerland, 2016; Volume 114, pp. 611–629. [Google Scholar] [CrossRef]
- Ragi, S.; Chong, E.K.P. UAV Path Planning in a Dynamic Environment via Partially Observable Markov Decision Process. IEEE Trans. Aerosp. Electron. Syst. 2013, 49, 2397–2412. [Google Scholar] [CrossRef]
- Ragi, S.; Chong, E.K.P. UAV Guidance Algorithms via Partially Observable Markov Decision Processes. In Handbook of Unmanned Aerial Vehicles; Valavanis, K., Vachtsevanos, G., Eds.; Springer: Dordrecht, The Netherlands, 2015; Chapter 73; pp. 1775–1810. [Google Scholar] [CrossRef]
- Waharte, S.; Trigoni, N. Supporting Search and Rescue Operations with UAVs. In Proceedings of the International Conference on Emerging Security Technologies, Canterbury, UK, 6–7 September 2010; pp. 142–147. [Google Scholar] [CrossRef]
- Bravo, R.Z.B.; Leiras, A.; Cyrino Oliveira, F.L. The Use of UAVs in Humanitarian Relief: An Application of POMDP-Based Methodology for Finding Victims. Prod. Oper. Manag. 2019, 28, 421–440. [Google Scholar] [CrossRef]
- Kurniawati, H.; Hsu, D.; Lee, W.S.; Wee, D.H.; Lee, S. SARSOP: Efficient Point-Based POMDP Planning by Approximating Optimally Reachable Belief Spaces. In Proceedings of the Robotics: Science and Systems IV, Zurich, Switzerland, 25–28 June 2008; pp. 1–8. [Google Scholar]
- Dalamagkidis, K.; Valavanis, K.P.; Piegl, L.A. On Integrating Unmanned Aircraft Systems into the National Airspace System; Springer: Dordrecht, The Netherlands, 2012; pp. 1–305. [Google Scholar] [CrossRef]
- Gupta, A.; Bessonov, D.; Li, P. A decision-theoretic approach to detection-based target search with a UAV. In Proceedings of the International Conference on Intelligent Robots and Systems, Vancouver, BC, Canada, 24–28 September 2017; pp. 5304–5309. [Google Scholar] [CrossRef] [Green Version]
- Sandino, J.; Vanegas, F.; Gonzalez, F.; Maire, F. Autonomous UAV Navigation for Active Perception of Targets in Uncertain and Cluttered Environments. In Proceedings of the 2020 IEEE Aerospace Conference, Big Sky, MT, USA, 7–14 March 2020; pp. 1–12. [Google Scholar] [CrossRef]
- Sandino, J.; Vanegas, F.; Maire, F.; Caccetta, P.; Sanderson, C.; Gonzalez, F. UAV Framework for Autonomous Onboard Navigation and People/Object Detection in Cluttered Indoor Environments. Remote Sens. 2020, 12, 3386. [Google Scholar] [CrossRef]
- Chanel, C.; Teichteil-Königsbuch, F.; Lesire, C. Multi-target detection and recognition by UAVs using online POMDPs. In Proceedings of the Twenty-Seventh AAAI Conference on Artificial Intelligence, Bellevue, WA, USA, 14–18 July 2013; pp. 1381–1387. [Google Scholar]
- Sutton, R.S.; Barto, A.G. Reinforcement Learning: An Introduction, 2nd ed.; MIT Press: Cambridge, MA, USA, 2018; pp. 1–548. [Google Scholar]
- Dutech, A.; Scherrer, B. Partially Observable Markov Decision Processes. In Markov Decision Processes in Artificial Intelligence; Sigaud, O., Buffet, O., Eds.; John Wiley & Sons, Inc.: Hoboken, NJ, USA, 2013; Chapter 7; pp. 185–228. [Google Scholar] [CrossRef]
- Thrun, S.; Burgard, W.; Fox, D. Probabilistic Robotics; MIT Press: Cambridge, MA, USA, 2005; pp. 485–542. [Google Scholar]
- Chovancová, A.; Fico, T.; Chovanec, L.; Hubinsk, P. Mathematical Modelling and Parameter Identification of Quadrotor (a survey). Procedia Eng. 2014, 96, 172–181. [Google Scholar] [CrossRef] [Green Version]
- Bourke, P. Polygons and Meshes. 1997. Available online: http://paulbourke.net/geometry/polygonmesh (accessed on 6 October 2021).
- Open Source Robotics Foundation. Robot Operating System. 2018. Available online: https://www.ros.org (accessed on 6 October 2021).
- Chuanqi, Y. Caffe Implementation of Google MobileNet SSD Detection Network, with Pretrained Weights on VOC0712 and mAP = 0.727. 2020. Available online: https://github.com/chuanqi305/MobileNet-SSD (accessed on 6 October 2021).
- Jia, Y.; Shelhamer, E.; Donahue, J.; Karayev, S.; Long, J.; Girshick, R.; Guadarrama, S.; Darrell, T. Caffe: Convolutional Architecture for Fast Feature Embedding. In Proceedings of the International Conference on Multimedia, Orlando, FL, USA, 3–7 November 2014; ACM Press: New York, NY, USA, 2014; pp. 675–678. [Google Scholar] [CrossRef]
- Klimenko, D.; Song, J.; Kurniawati, H. TAPIR: A software Toolkit for approximating and adapting POMDP solutions online. In Proceedings of the Australasian Conference on Robotics and Automation, Melbourne, VIC, Australia, 2–4 December 2014; pp. 1–9. [Google Scholar]
- Hornung, A.; Wurm, K.M.; Bennewitz, M.; Stachniss, C.; Burgard, W. OctoMap: An efficient probabilistic 3D mapping framework based on octrees. Auton. Robot. 2013, 34, 189–206. [Google Scholar] [CrossRef] [Green Version]
- Koubaa, A.; Allouch, A.; Alajlan, M.; Javed, Y.; Belghith, A.; Khalgui, M. Micro Air Vehicle Link (MAVlink) in a Nutshell: A Survey. IEEE Access 2019, 7, 87658–87680. [Google Scholar] [CrossRef]
- Mittal, P.; Singh, R.; Sharma, A. Deep learning-based object detection in low-altitude UAV datasets: A survey. Image Vis. Comput. 2020, 104, 104046. [Google Scholar] [CrossRef]
- Lygouras, E.; Santavas, N.; Taitzoglou, A.; Tarchanidis, K.; Mitropoulos, A.; Gasteratos, A. Unsupervised Human Detection with an Embedded Vision System on a Fully Autonomous UAV for Search and Rescue Operations. Sensors 2019, 19, 3542. [Google Scholar] [CrossRef] [PubMed] [Green Version]
- Bejiga, M.; Zeggada, A.; Nouffidj, A.; Melgani, F. A Convolutional Neural Network Approach for Assisting Avalanche Search and Rescue Operations with UAV Imagery. Remote Sens. 2017, 9, 100. [Google Scholar] [CrossRef] [Green Version]
- Zhang, H.; Sun, M.; Li, Q.; Liu, L.; Liu, M.; Ji, Y. An empirical study of multi-scale object detection in high resolution UAV images. Neurocomputing 2021, 421, 173–182. [Google Scholar] [CrossRef]
- Zhang, R.; Shao, Z.; Huang, X.; Wang, J.; Li, D. Object Detection in UAV Images via Global Density Fused Convolutional Network. Remote Sens. 2020, 12, 3140. [Google Scholar] [CrossRef]
- Mandel, N.; Milford, M.; Gonzalez, F. A Method for Evaluating and Selecting Suitable Hardware for Deployment of Embedded System on UAVs. Sensors 2020, 20, 4420. [Google Scholar] [CrossRef]
- Faniadis, E.; Amanatiadis, A. Deep Learning Inference at the Edge for Mobile and Aerial Robotics. In Proceedings of the 2020 IEEE International Symposium on Safety, Security, and Rescue Robotics, Abu Dhabi, United Arab Emirates, 4–6 November 2020; pp. 334–340. [Google Scholar] [CrossRef]
- Arnold, R.D.; Yamaguchi, H.; Tanaka, T. Search and rescue with autonomous flying robots through behavior-based cooperative intelligence. J. Int. Humanit. Action 2018, 3, 18. [Google Scholar] [CrossRef] [Green Version]
- Al-Naji, A.; Perera, A.G.; Mohammed, S.L.; Chahl, J. Life Signs Detector Using a Drone in Disaster Zones. Remote Sens. 2019, 11, 2441. [Google Scholar] [CrossRef] [Green Version]
Publisher’s Note: MDPI stays neutral with regard to jurisdictional claims in published maps and institutional affiliations. |
© 2021 by the authors. Licensee MDPI, Basel, Switzerland. This article is an open access article distributed under the terms and conditions of the Creative Commons Attribution (CC BY) license (https://creativecommons.org/licenses/by/4.0/).

