Abstract
Accurate knowledge of photosynthetic capacity is critical for understanding the carbon cycle under climate change. Despite the fact that deep neural network (DNN) models are increasingly applied across a wide range of fields, there are very few attempts to predict leaf photosynthetic capacity (indicated by maximum carboxylation rate, Vcmax, and maximum electron transport rate, Jmax) from reflected information. In this study, we have built a DNN model that uses leaf reflected spectra, alone or together with other leaf traits, for the reliable estimation of photosynthetic capacity, accounting for leaf types and growing periods in cool–temperate deciduous forests. Our results demonstrate that even though DNN models using only the reflectance spectra are capable of estimating both Vcmax and Jmax acceptably, their performance could nevertheless be improved by including information about other leaf biophysical/biochemical traits. The results highlight the fact that leaf spectra and leaf biophysical/biochemical traits are closely linked with leaf photosynthetic capacity, providing a practical and feasible approach to tracing functional traits. However, the DNN models developed in this study should undergo more extensive validation and training before being applied in other regions, and further refinements in future studies using larger datasets from a wide range of ecosystems are also necessary.
1. Introduction
Leaf maximum carboxylation rate (Vcmax) and maximum electron transport rate (Jmax) are two key parameters describing leaf photosynthetic capacity which are essential to providing a mechanistic understanding of plant carbon fixation. Their parameterization determines the performance of carbon uptake simulations in terrestrial biosphere models [1,2,3]. Traditionally, the two parameters are obtained from in vivo measurements using gas exchange systems [4], which are not only time-consuming and labor-intensive but also consistently face scaling dilemmas because of their large variabilities across temporal and spatial scales [5,6,7,8]. Due to recent advances, hyperspectral remote sensing techniques can increasingly provide opportunities to rapidly measure leaf-level photosynthetic information using low-cost, nondestructive, and wide-scale monitoring, and they may help to enhance our understanding of photosynthetic capacity. Leaf hyperspectral reflectance contains many narrow and contiguous spectral channels, representing a collection of optical properties related to leaf biochemical characteristics and cell structure, as well as physiological properties. These properties have been used to estimate leaf photosynthetic capacity accurately [9,10] across different species, canopy environments, and leaf ages [11].
Strong connections between the leaf photosynthetic capacity and reflectance spectra have been reported, although their underlying mechanisms remain unclear in most cases. A range of studies have also demonstrated that leaf reflectance spectra can be used to accurately estimate leaf photosynthetic capacity in several different ways, ranging from simple linear regression to machine learning techniques [9,10,11,12,13,14], even though the capacity varies greatly due to multiple biotic and environmental variables [15,16]. Considering some examples in detail, multiple vegetation indices, such as the normalized difference vegetation index, enhanced vegetation index, photochemical reflectance index, simple ratio, double difference, and chlorophyll index, have been used to predict photosynthetic parameters [17,18,19,20,21] and to reveal photosynthetic productivity [22,23]. Similarly, partial least squares regressions have also been widely applied to estimate Vcmax and Jmax from leaf reflectance spectra [14,17,24], due to their advantages in handling the problems of both collinearity and more predictors than observations, although obvious variations in the performance of partial least squares regressions for estimating photosynthetic traits are found across different plant species and environmental conditions, or different years and growing periods [25]. Furthermore, machine learning techniques, including the support vector machine, least absolute shrinkage and selection operator, and random forests, have also been used to estimate leaf photosynthetic capacity [26].
Deep learning is a recent advanced data-oriented analytical approach, which can be described as a model that represents nonlinear processing composed of a multilayer artificial neural network, and it employs multiple neurons. Examples include the deep neural network (DNN), convolutional neural network (CNN), recurrent neural network (RNN), etc. [27,28]. Previous studies have reported that deep learning can be used to process large-scale and multi-feature data by using a hierarchical learning capacity to characterize input and target data, which usually leads to better performance and generalization ability [28,29,30,31,32]. Accordingly, the deep learning model has a powerful ability to capture highly abstracted features with deeper layers and could be used to mine effective information better and to estimate the target parameters accurately [33,34]. A deep learning model will thus consider the relationships between each spectrum and the plant characteristics more comprehensively and could provide an accurate estimation of plant properties from leaf spectra. To date, deep learning has been widely employed for big data analysis with remote sensing [35,36], and has also been applied to speech recognition and object detection [37,38], surface parameters [30,31,39], yield prediction [40,41,42,43,44], stress and disease detection [28,45,46], and other fields using different types of deep neural network architectures. However, the approach has not yet been thoroughly explored in terms of photosynthetic capacity estimation. To the best of our knowledge, only Fu et al. [26] reported the potential of an artificial neural network (ANN) regression in estimating photosynthetic capacities in tobacco genotypes. Thus, it is necessary to explore the potential of powerful deep learning techniques to estimate photosynthetic capacity.
Unfortunately, deep learning models with complex multi-layer structures have a fundamental limitation for practical applications due to the need for a large training dataset and the connections among the input, hidden, and output layers, which lead to uncertainties and fluctuations in predictions, particularly for limited samples [47]. However, increasing evidence has indicated that an ensemble of deep learning models with the application of the bootstrap sampling approach provides a potential solution to increase the robustness and accuracy [48] and has obtained satisfactory results in the fields of species distribution [49] and complex diseases and medicine [50,51]. Including the bootstrap sampling approach in the deep learning models may thus be necessary for handling unknown complexity in a given dataset.
Among current deep-learning-based techniques, deep neural network (DNN) models have recently gained wide attention across various fields; for example, they have been used for the prediction of soil properties [52], biomass estimation [53], and forecasting [33,34,54]. In general, the DNN has been proposed to overcome the shortcomings of the traditional ANN and, because it has more complexity, it can efficiently learn from training samples, with high accuracy [33,37,55]. Although most available studies focused on the field of classification [56,57,58], the applications of DNN models in regression problems have increased in recent years. For example, Cai et al. [29] obtained promising results using a DNN-based regression model to predict soil moisture from meteorological variables and initial moisture data. Similarly, Elbeltagi et al. [59] used a DNN model to estimate and predict crop evapotranspiration from recorded historical and future meteorological data, with good results. These results suggest the superiority of the DNN in dealing with regression issues.
However, to date, no study has yet estimated leaf photosynthetic capacity using a DNN model based on leaf reflectance. Hence, the objectives of this study are (1) to assess the feasibility of predicting the photosynthetic capacity from leaf reflectance in cool–temperate deciduous forests by employing DNN models; (2) to assess the performance of DNN models across different leaf types and different temporal scales; (3) to evaluate whether including other leaf traits would improve the estimation of leaf photosynthetic capacity using DNN models. This study explores the potential of deep learning for predicting photosynthetic capacities quantitatively in different leaf types and during different growing periods in cool–temperate deciduous forests.
2. Materials and Methods
2.1. The Naeba Dataset
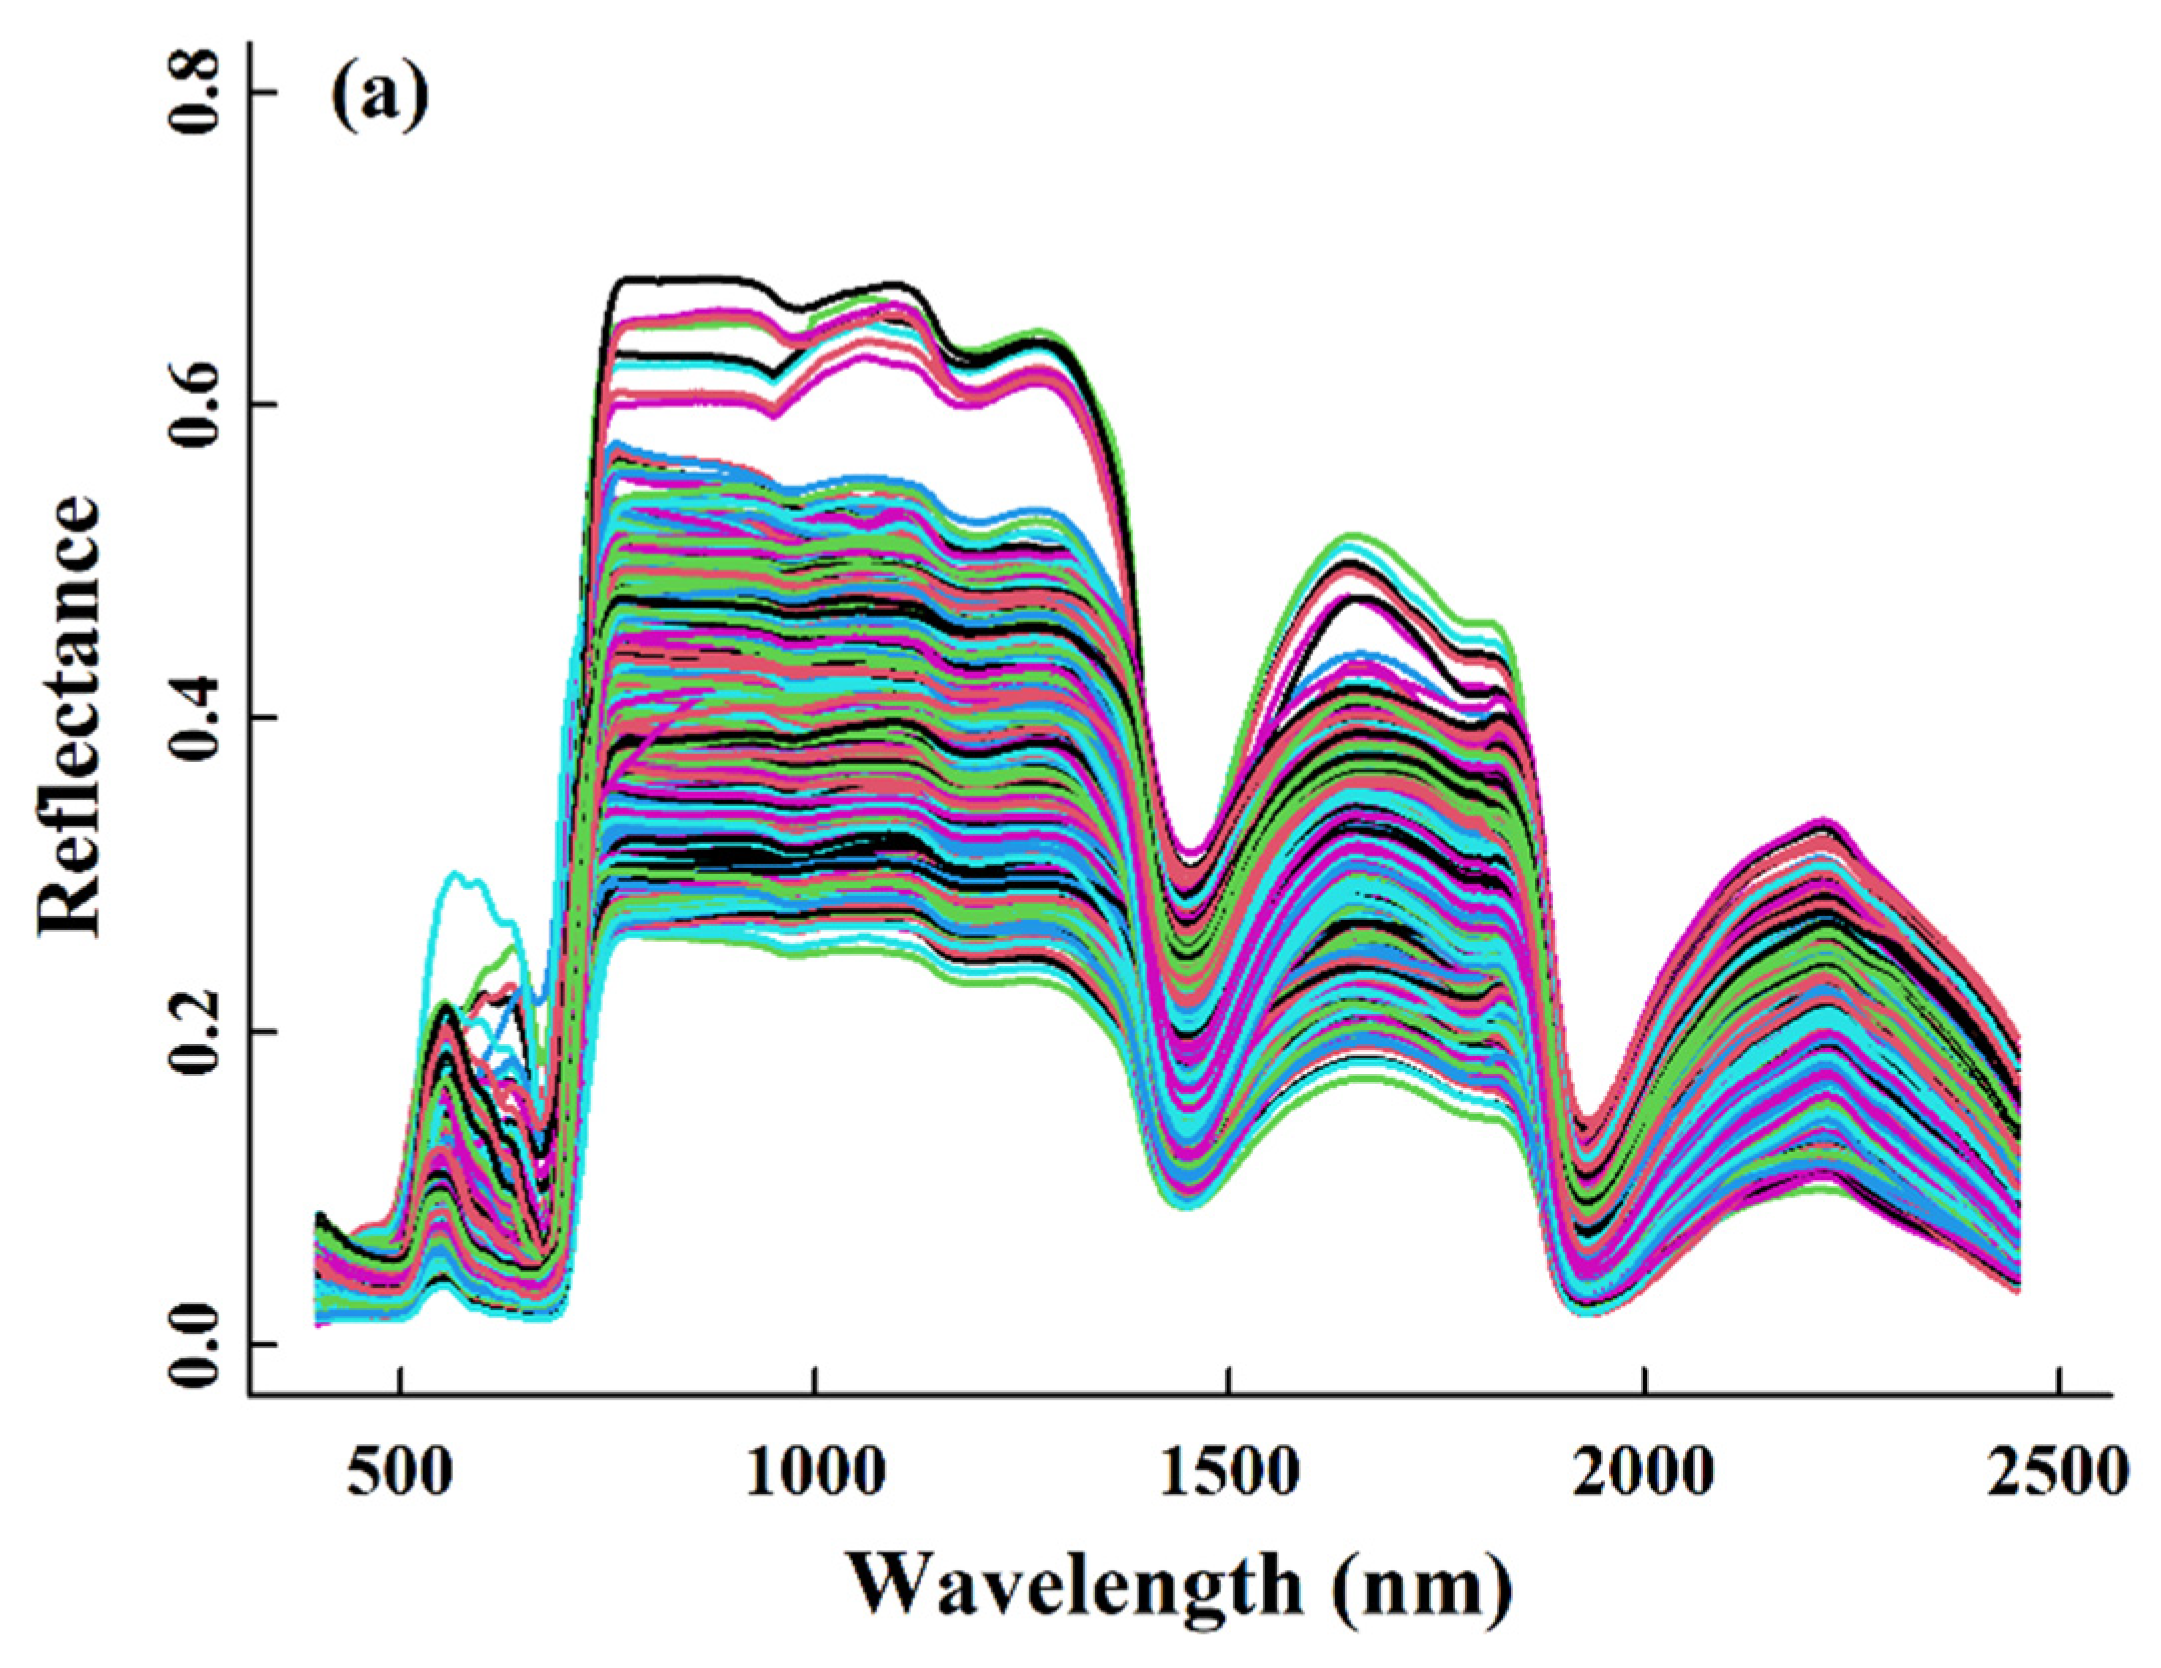
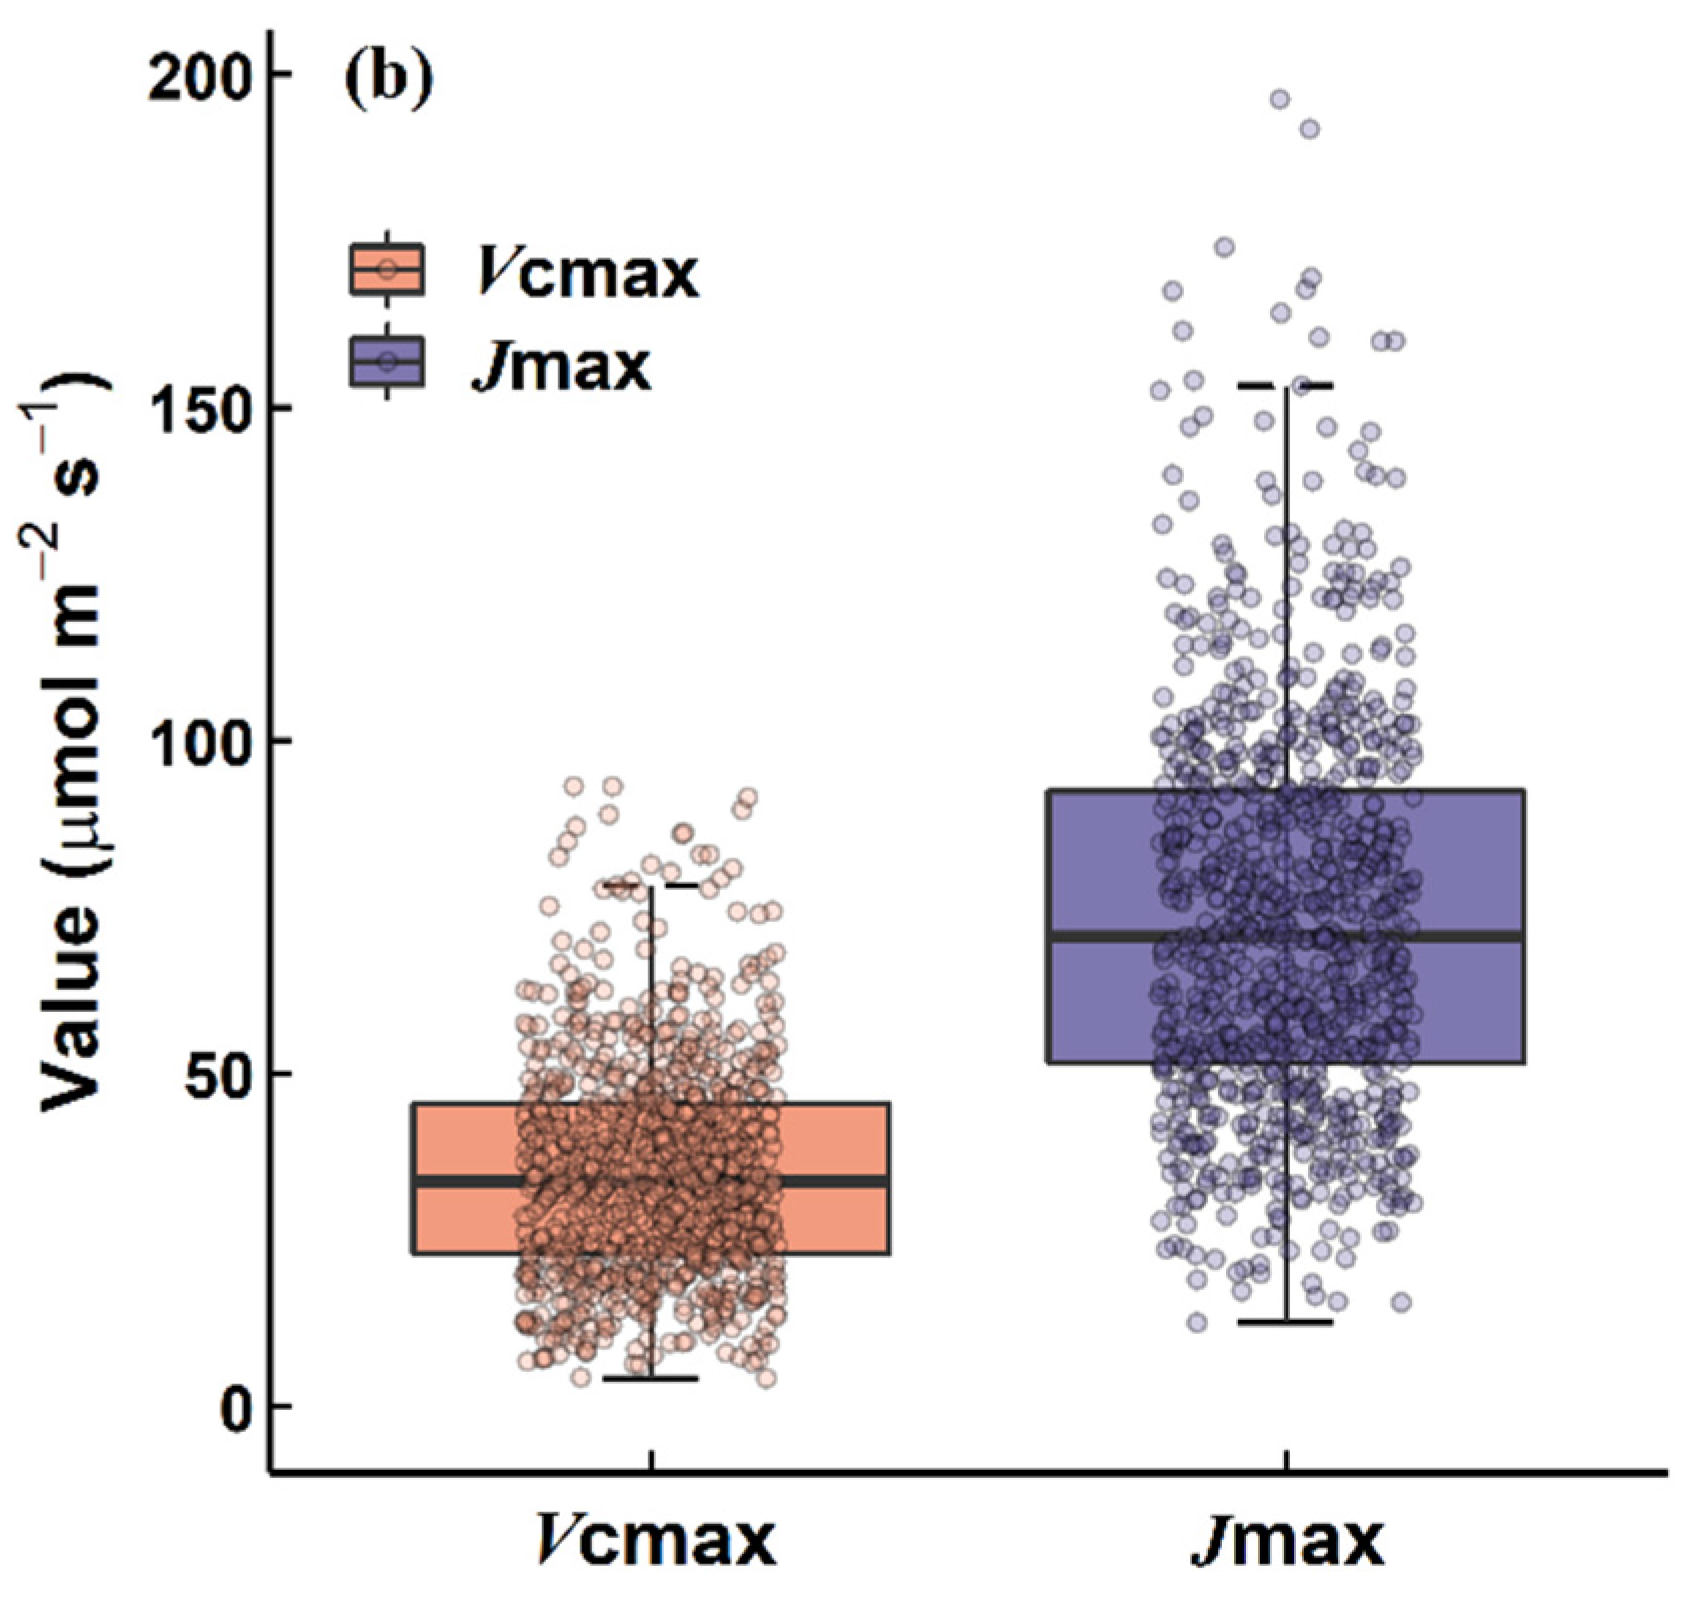
A composite dataset consisting of simultaneous leaf photosynthetic CO2 response measurements and reflectance spectra was built up for leaf samples taken during the period from May to October on Mount Naeba (36°51′ N and 138°40′ E, adjacent to the Sea of Japan). This mountain has typical cold–temperate deciduous forests from elevations of 550 to 1600 m [60]. Leaf sampling was carried out consistently using the detached branch method [61] from 2007 to 2015, except for 2011, on different layers of Fagus crenata Blume canopies, the only dominant species in the 4 permanent tower sites deployed along these altitudes, with one site at 550 m, two sites at 900 m (denoted 900 m X1 and 900 m X5), and another site at 1500 m. The photosynthetic parameters Vcmax and Jmax were estimated from the leaf photosynthetic CO2 response (A-Ci) curves at the saturating irradiance level, which was measured using a LI-COR LI-6400 portable photosynthesis system equipped with standard leaf chambers [7]. The “plantecophys” package [62] in the R platform was used. The synchronic reflectance measurements were performed using a FieldSpec spectrometer (Analytical Spectral Devices Inc., Boulder, CO, USA) with a leaf clip, which operates in the 350–2500 nm spectral range [63]. The reflectance spectra data spanning 350–399 nm and 2451–2500 nm were excluded from the analyses in this study due to the substantial noise in the edge bands of the spectrum produced by both the immediate environment and the instrument itself. The reflectance spectra data and corresponding Vcmax and Jmax values in the dataset are presented in Figure 1.
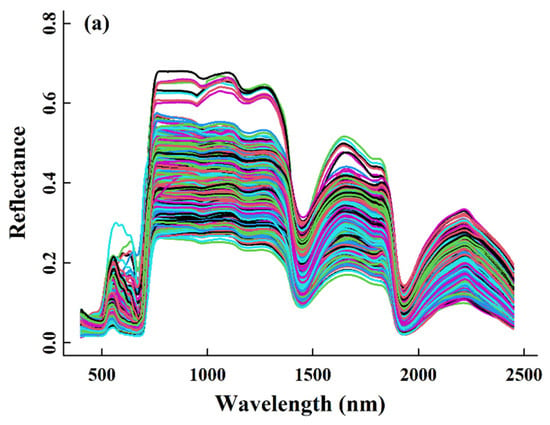
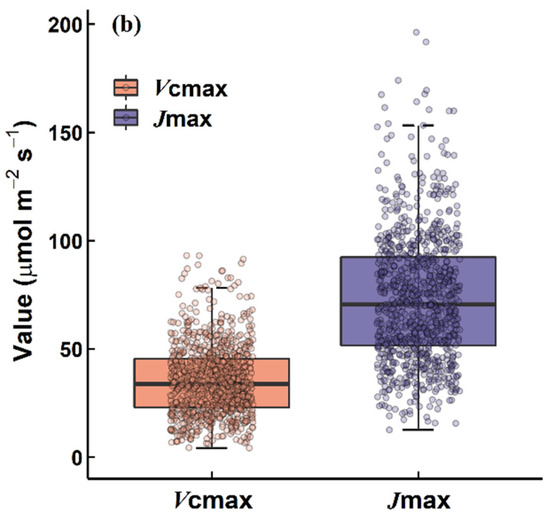
Figure 1.
The spectra data with 2051 features (400–2450 nm) (a) and the corresponding photosynthetic traits of maximum carboxylation rate (Vcmax) and maximum electron transport (Jmax) (b), in the Naeba dataset.
2.2. DNN Model Construction
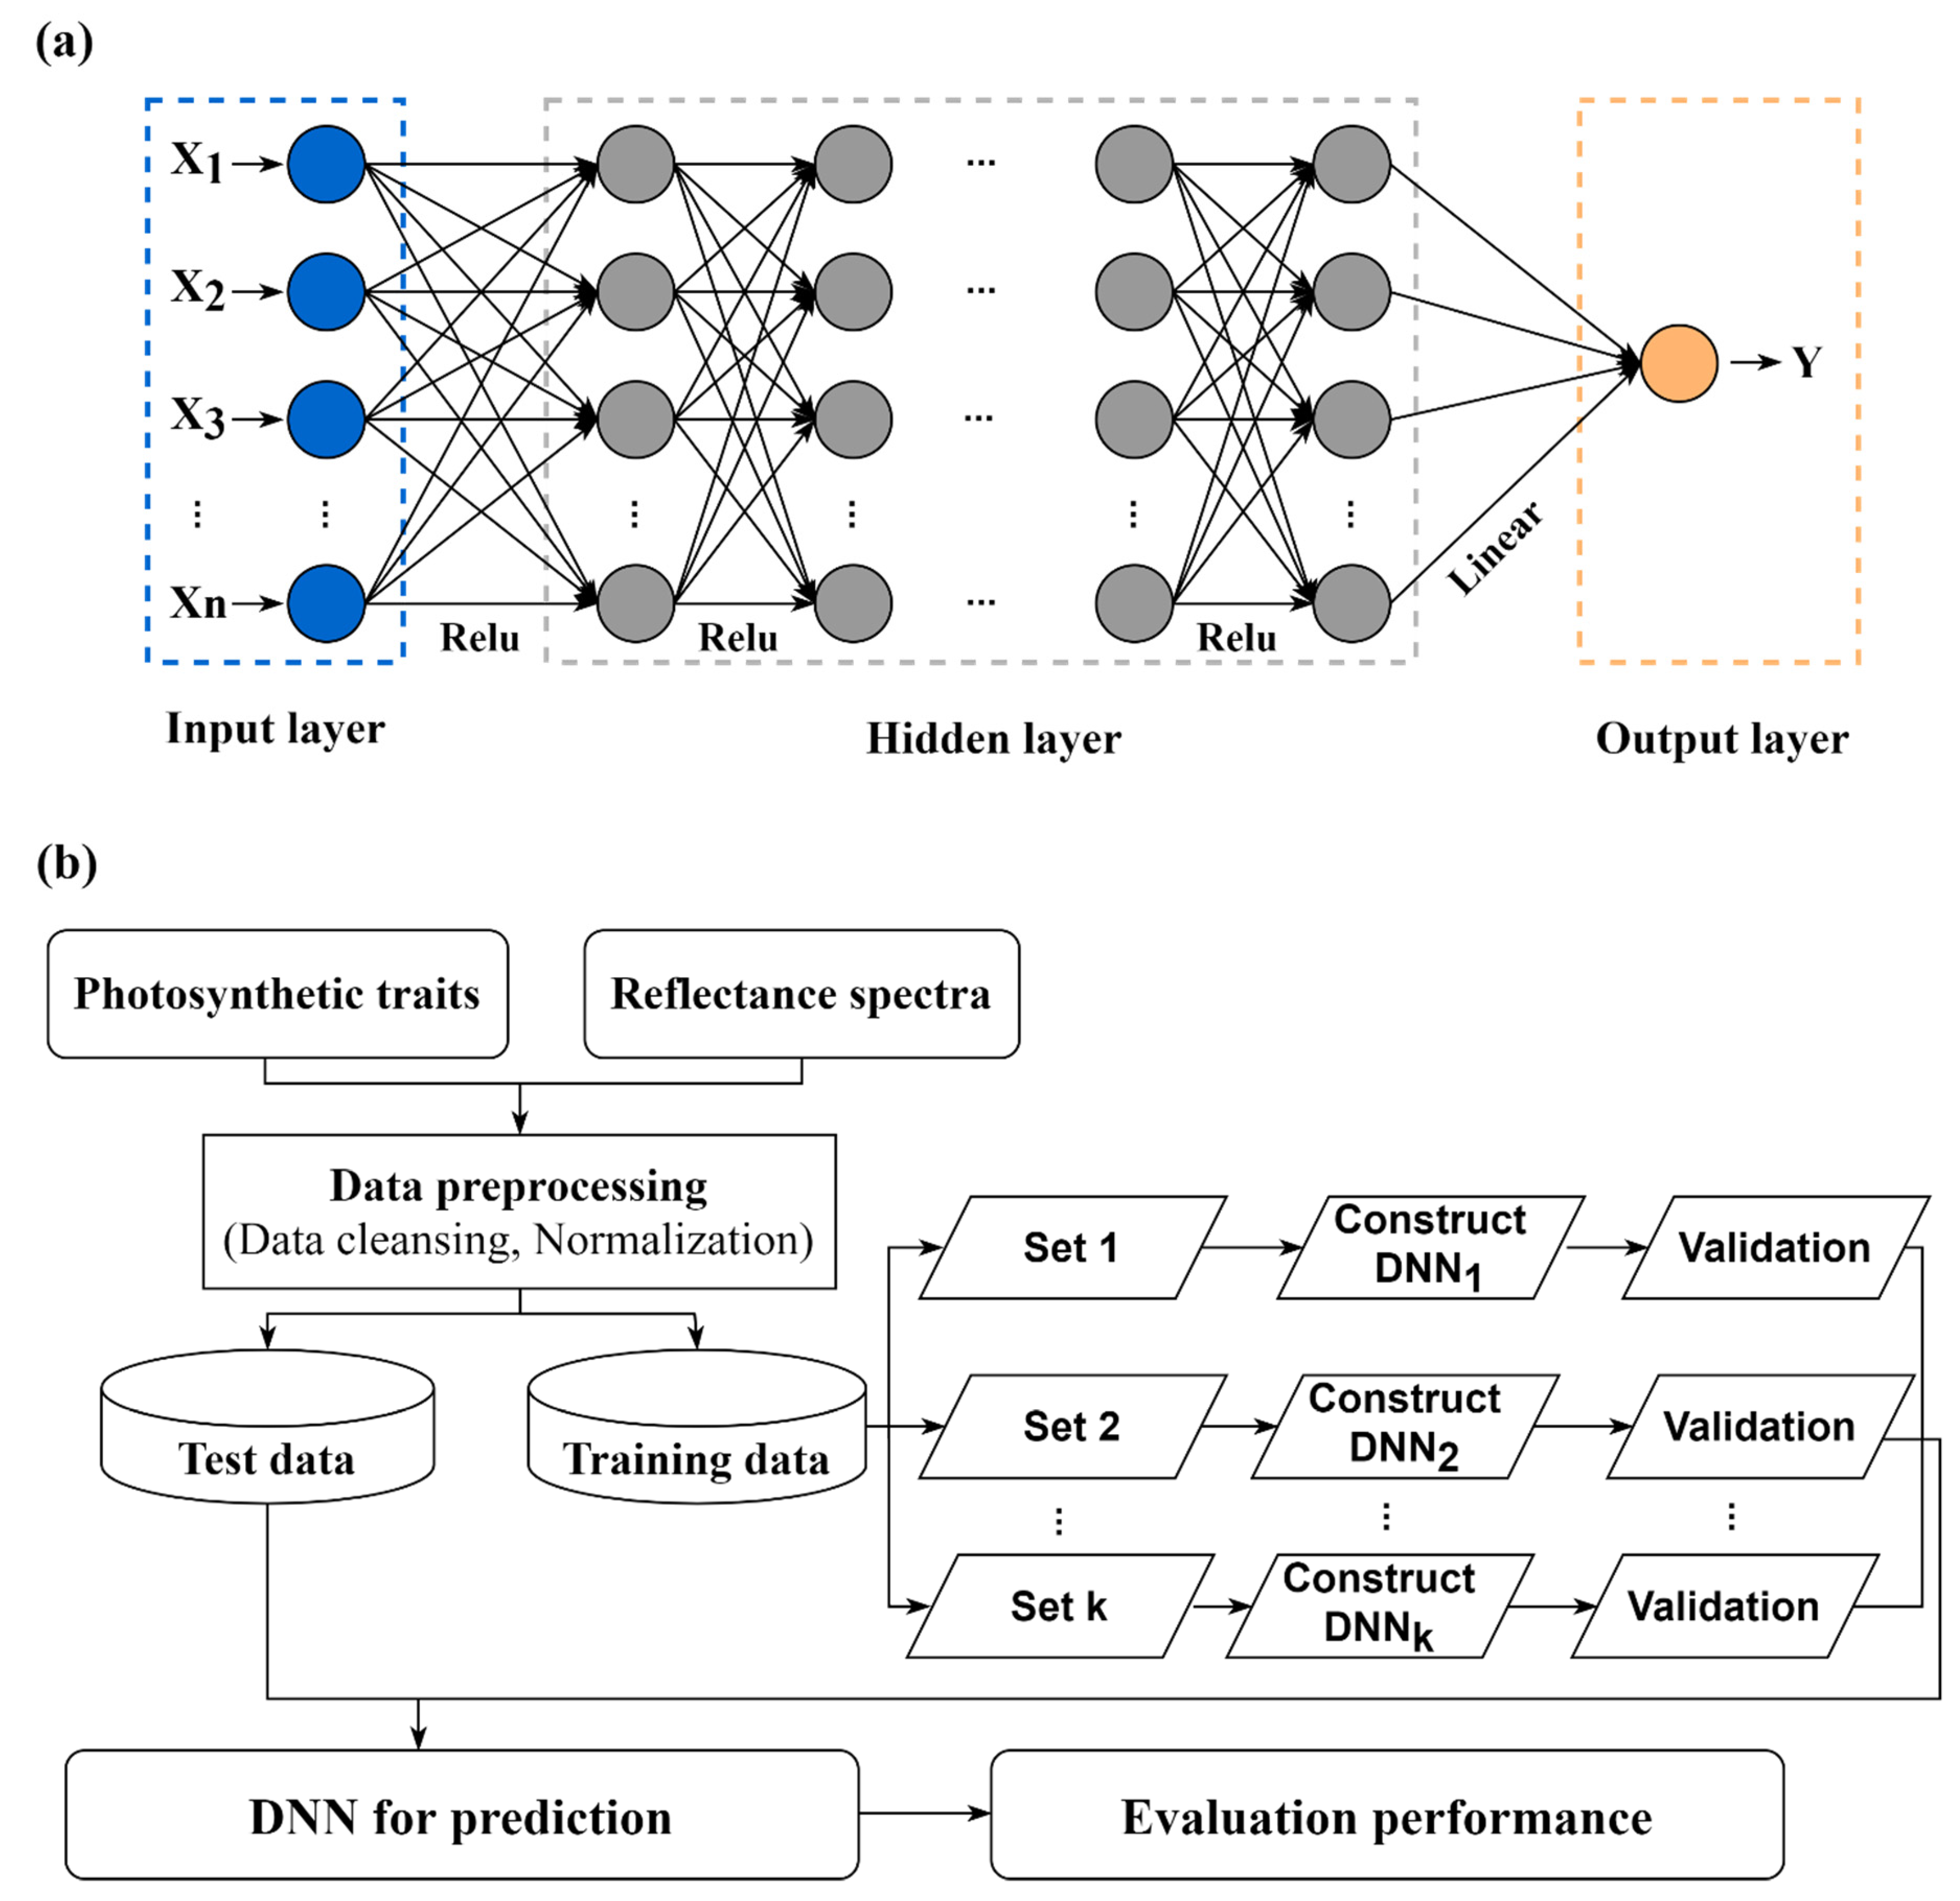
A DNN model is generally composed of an input layer, an output layer, and several hidden layers placed between them, and each layer contains a number of neurons. In this study, leaf reflectance data were considered as predictors of Vcmax and Jmax when constructing the deep neural network. The workflow is illustrated in Figure 2. All predictor variables were normalized prior to building the neural networks. The entire dataset was then randomly divided into training data (75%, randomly chosen) and test data (25%), while the training dataset was further arranged to be in proportion (25%) to the validation data. Specifically, the networks had the following architecture: an input layer, seven hidden layers with 16, 32, 64, 128, 256, 128, and 64 neurons, respectively, and an output layer, with the nodes being fully connected. The rectified linear unit (Relu) activation function was utilized as the activation function in the neurons. The loss and optimization functions selected were the mean square error and the Adam optimizer, respectively. The number of training epochs was defined using early stopping; the networks were trained for 500 epochs, with the patience equal to 20 epochs, to minimize the loss function until the minimum error was achieved to prevent overfitting. Furthermore, dropout [64], which is a regularization technique that randomly and temporarily removes a fixed proportion of different neurons and their respective connections from the network in each training step, was also used to avoid complex co-adaptations on training data, therefore reducing overfitting. The deep neural networks were built and trained with the TensorFlow backend, using the Keras library in RStudio (1.4.1717).
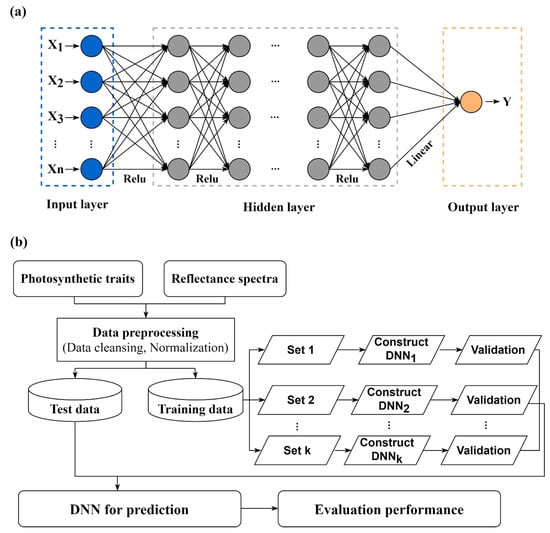
Figure 2.
The structure of the deep neural network (DNN) (a) and the flowchart of the ensemble DNN model with the bootstrap sampling approach (b) for predicting the maximum carboxylation rate (Vcmax) and maximum electron transport (Jmax) in this study.
To improve the generality and predictive performance of the DNN model, a bootstrap approach was applied for the training dataset in this study. Bootstrapping is a resampling method that samples independently with replacement from a sample dataset with the sample size, which reduces biases and strengthens the robustness, especially when the number of samples is limited [48,65]. Specifically, we randomly sampled the training set with replacement k times; the maximum k value was set to 50 and the best k value was selected based on the mean squared error. The DNN model was fitted using a bootstrap sample each time and prediction values from each DNN model were created. This was repeated 10 times to improve the model performance.
2.3. Other Leaf Biophysical/Biochemical Traits as Additional Predictors
In this study, other leaf biophysical/biochemical traits besides reflected spectra were also investigated as potential predictors: the photosynthetic capacity (Vcmax and Jmax) was treated as a function of reflectance (ref), leaf thickness (LT), leaf mass per area (LMA), and/or leaf chlorophyll content (Chl). Among the set of predictors, leaf thickness was measured using a digital micrometer (with a precision of 0.001 mm). The LMA was calculated using the leaf dry mass divided by its area, with the leaf area scanned using a digital scanner (EPSON GT-S600; Epson, Indonesia) and the dry mass weighed using a precision balance (with a precision of 0.001 g) after being dried in an oven. Leaf discs for chlorophyll content were punched, and their chlorophyll contents were determined using a dual-beam scanning UV–Vis spectrophotometer (Ultrospec 3300 pro, Amersham Biosciences, Piscataway, NJ, USA).
2.4. Performance Evaluation
The actual and predicted dependent values were compared and the model performance was evaluated using the following statistical indicators: the coefficient of determination (R2), root mean square error (RMSE), mean absolute error (MAE), and the ratio of the performance to the standard deviation (RPD). All these indicators are defined as follows:
where and are the observed and predicted values, respectively, and is the total number of samples. is the mean of the observed values. SD is the standard deviation of the observed values, and SEP is the standard error prediction. The RPD is an auxiliary indicator of the model, and the model’s predictive ability and future reliability can be categorized as follows: (A) > 2.0: good model, (B) 1.4–2.0: fair model, and (C) < 1.4: model with poor predictive ability [66].
3. Results
3.1. Performance of DNN Models for Predicting Vcmax and Jmax from Reflectance
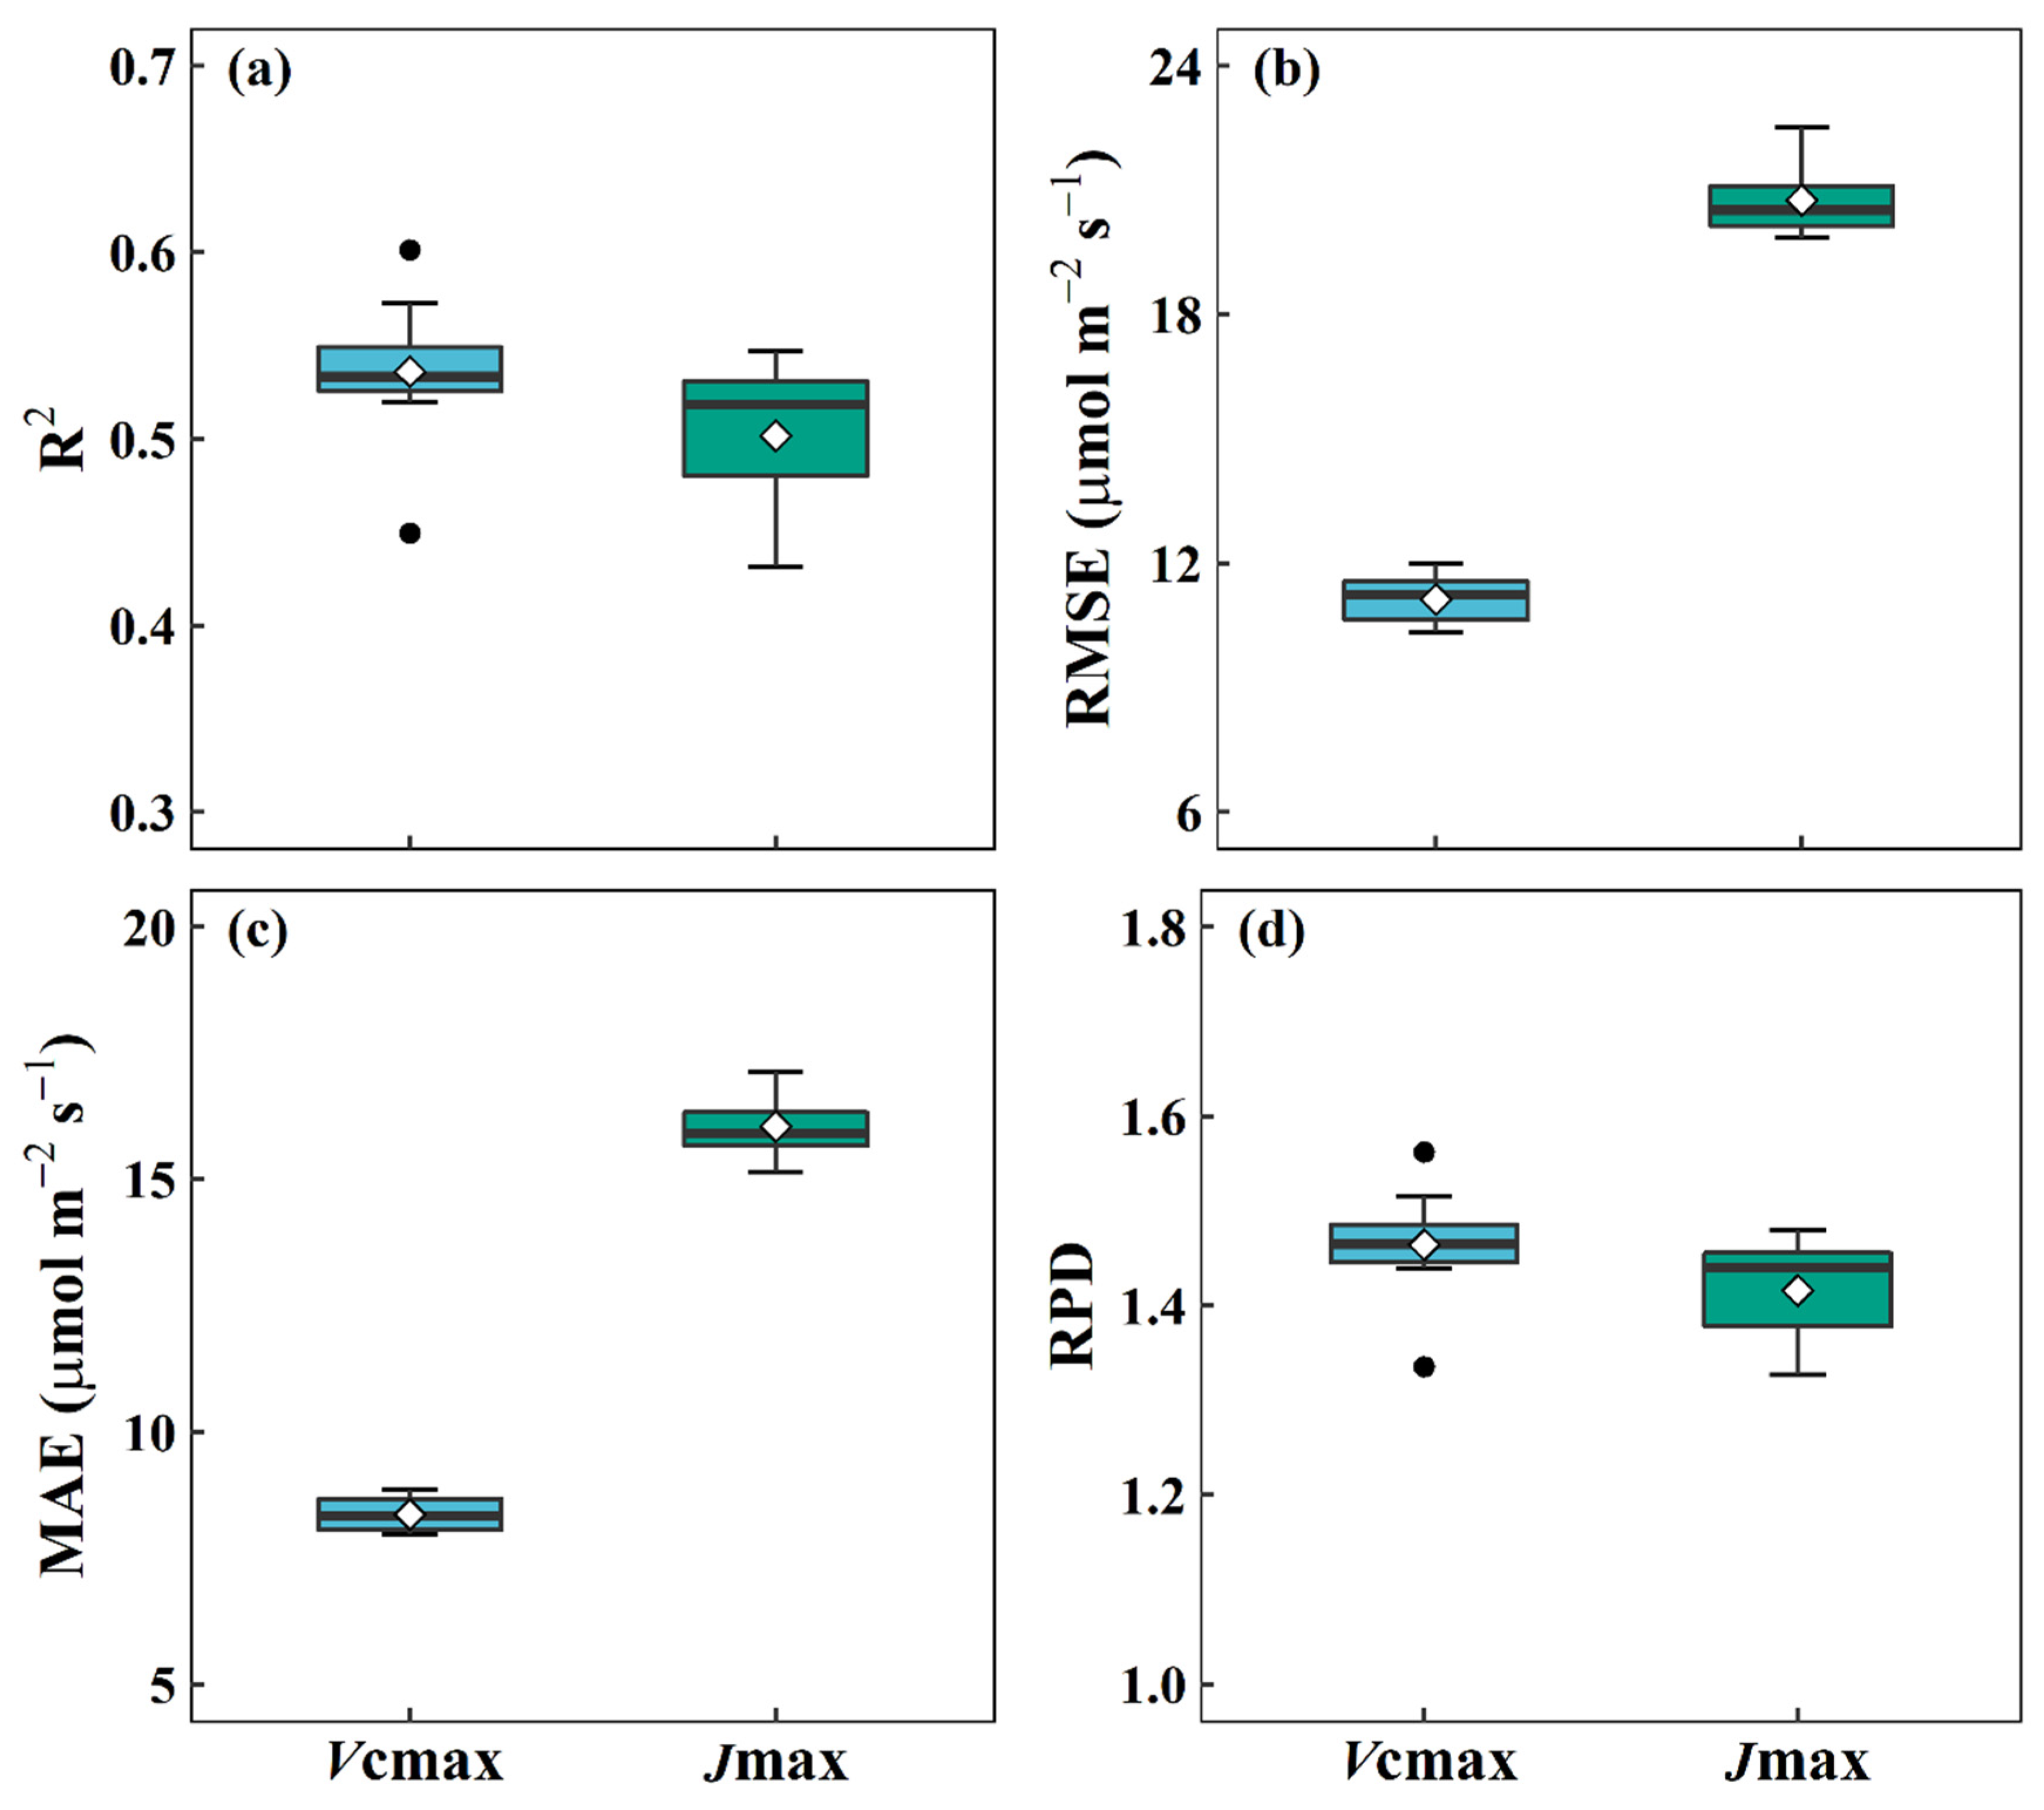
Vcmax in the Naeba dataset ranged from 4.23 to 93.09 μmol m−2 s−1, with mean and standard deviation values of 35.38 and 16.30 μmol m−2 s−1, respectively. Similarly, Jmax also exhibited a large variation from 12.58 to 196.26 μmol m−2 s−1 (mean value: 73.28 μmol m−2 s−1 and standard deviation: 29.61 μmol m−2 s−1) (Figure 1). The diagrams of statistical values (R2, RMSE, MAE, and RPD) resulting from using the built DNN models coupled with bootstrap sampling to predict Vcmax and Jmax are shown in Figure 3. In detail, the respective DNN model yielded a mean R2 of 0.54 within the range of 0.45 to 0.60, with a corresponding mean RMSE of 11.13 μmol m−2 s−1 (10.33–11.98) and a mean MAE value of 8.37 μmol m−2 s−1, when predicting Vcmax. The mean RPD value was 1.46, and the model performance was categorized as “B” (1.4–2.0). For predicting Jmax, the R2 values varied from 0.43 to 0.55, with a mean R2 value of 0.50. Furthermore, the DNN model had a mean RMSE of 20.76 μmol m−2 s−1, an MAE of 16.05 μmol m−2 s−1, and an RPD of 1.42 for Jmax.
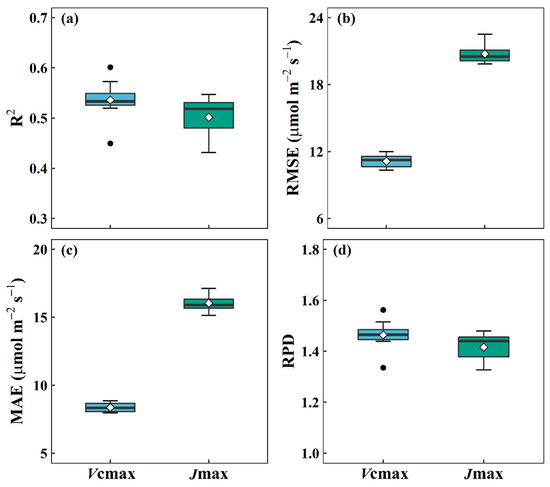
Figure 3.
The statistical distributions of the R2 (a), RMSE (b), MAE (c), and RPD (d) values of the ensemble DNN model using a bootstrap bagging approach for predicting the maximum carboxylation rate (Vcmax) and maximum electron transport rate (Jmax) in the Naeba dataset. R2: coefficient of determination; RMSE: root mean square error; MAE: mean absolute error; RPD: ratio of performance to standard deviation.
3.2. Performance of DNN Models for Predicting Vcmax and Jmax from Reflectance in Different Leaf Types
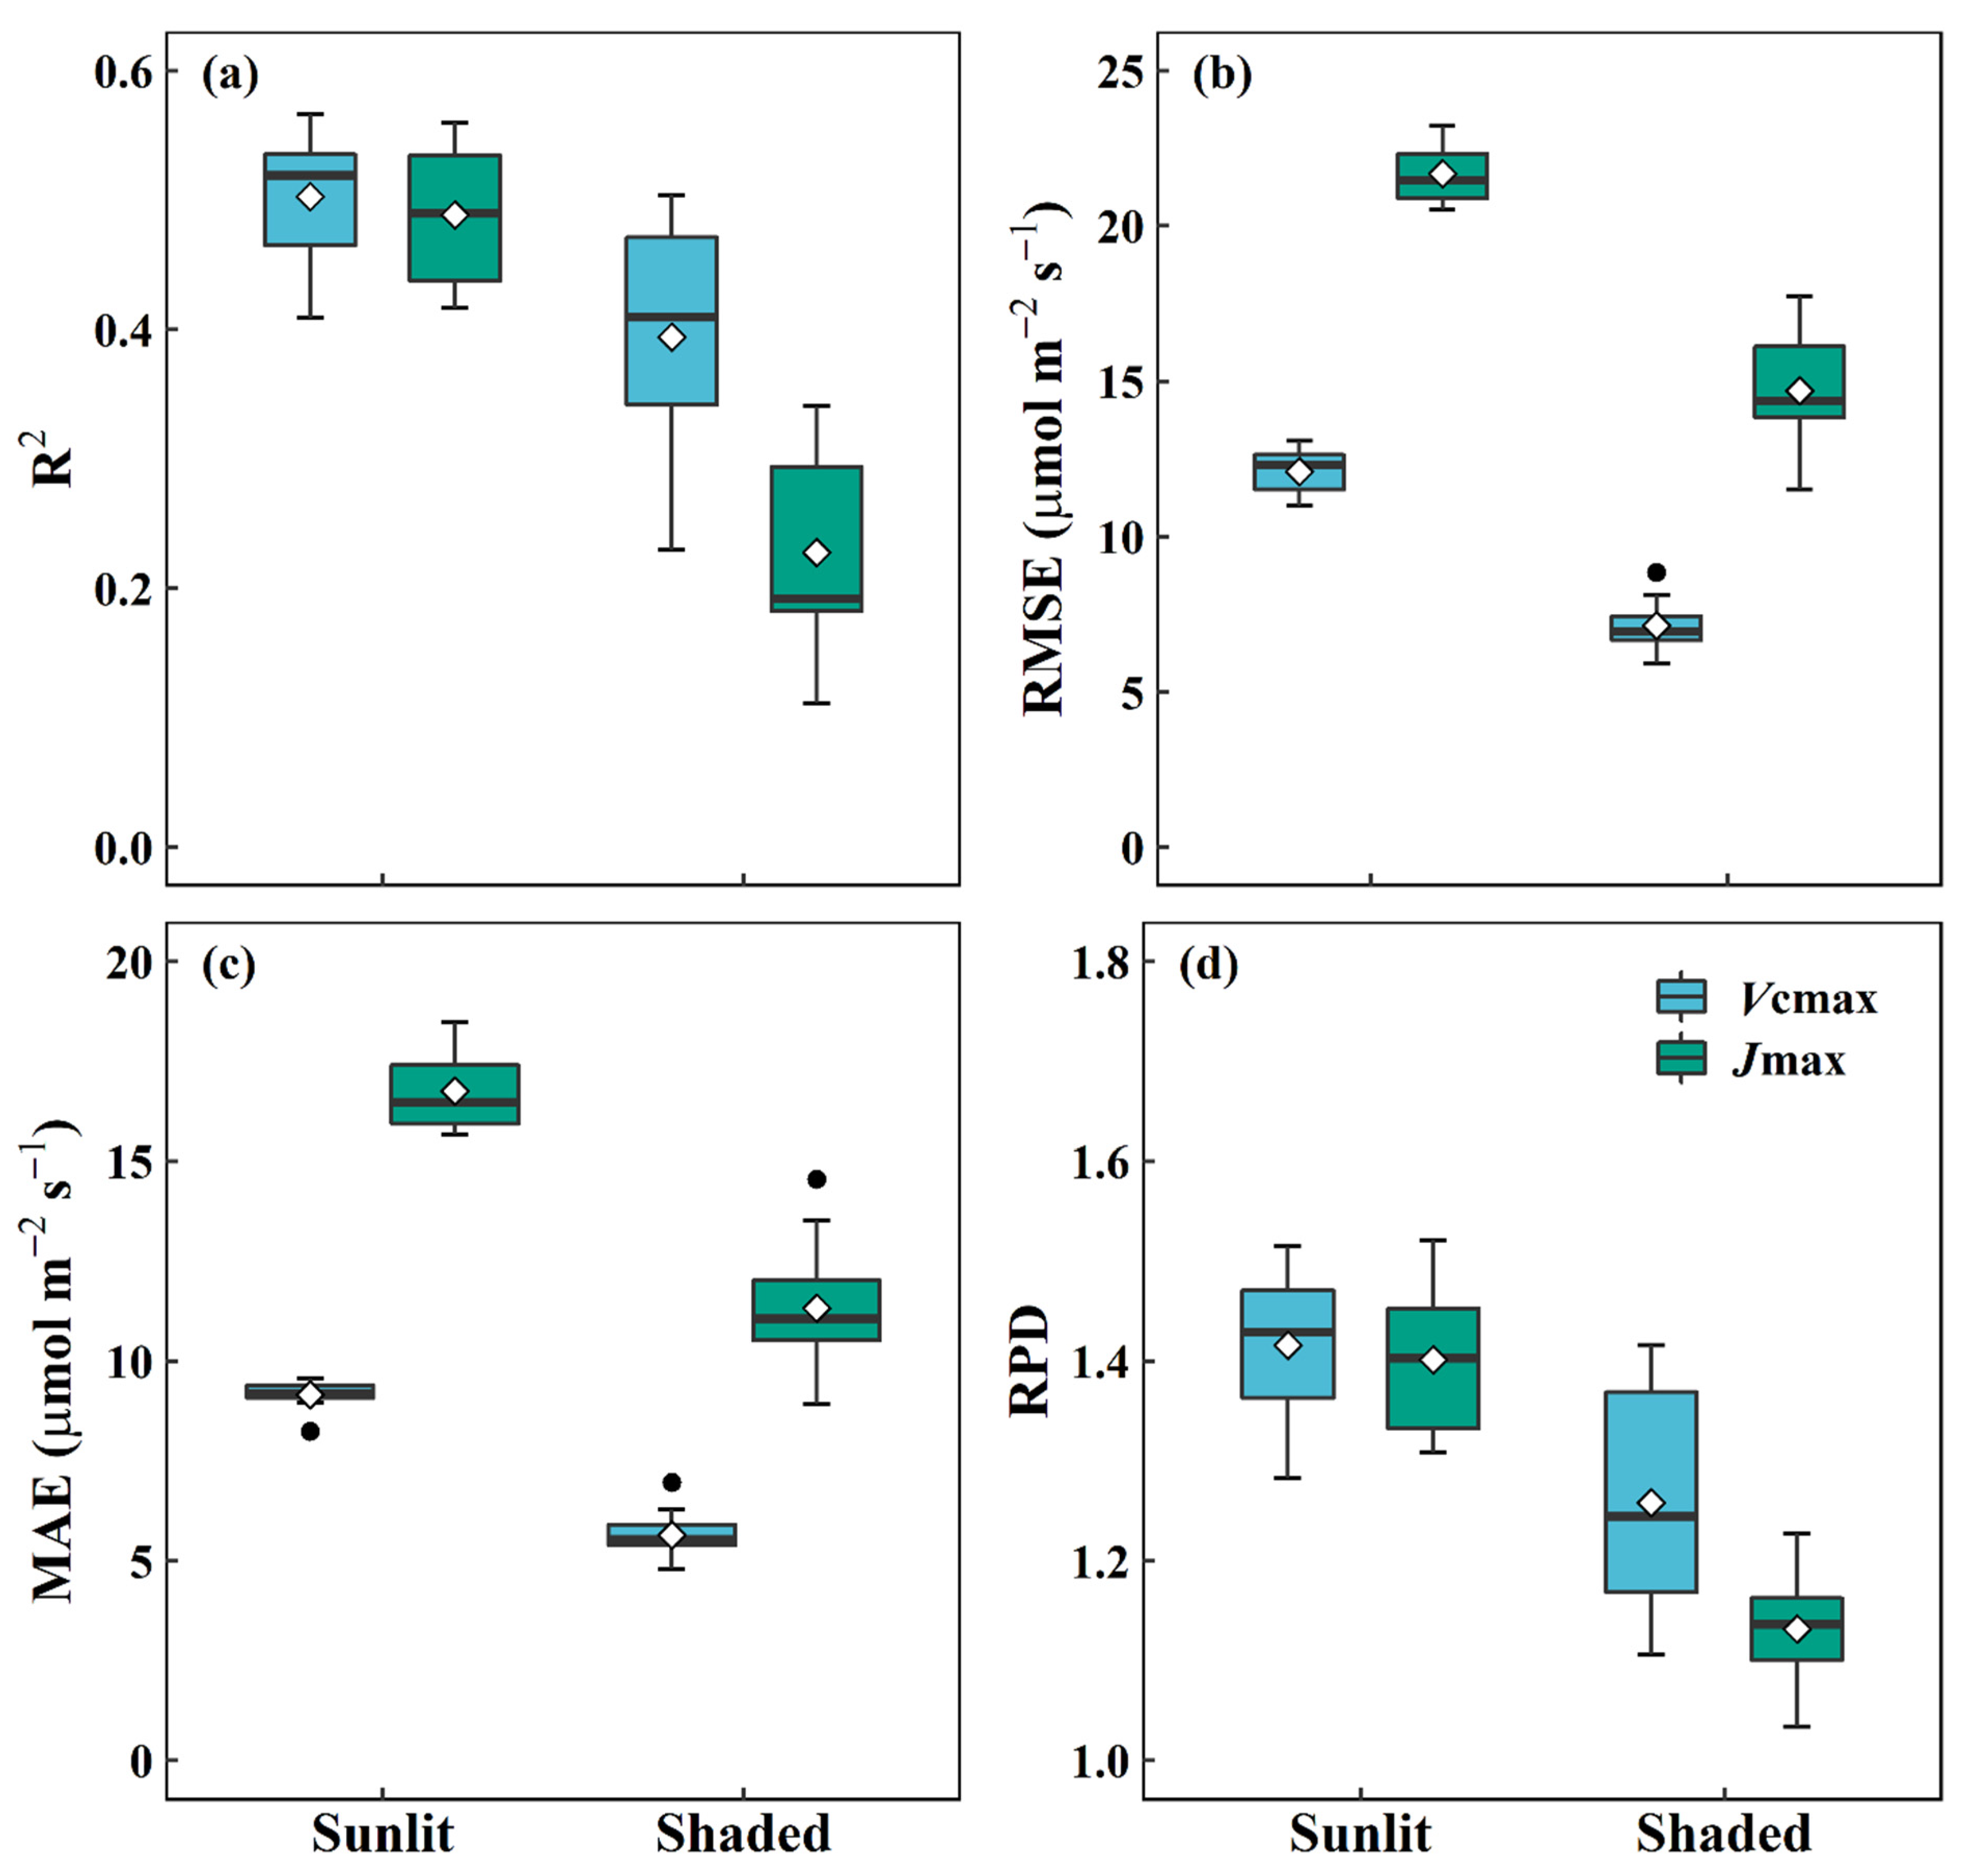
The DNN models used to predict Vcmax and Jmax from reflectance in different leaf types were further explored, and the results are presented in Figure 4. In detail, the DNN model for predicting Vcmax for sunlit leaves had a mean R2 of 0.50, RMSE of 12.10 μmol m−2 s−1, MAE of 9.17 μmol m−2 s−1, and RPD of 1.42. In comparison, the DNN model for shaded leaves had a mean R2 of 0.39, RMSE of 7.15 μmol m−2 s−1, and MAE of 5.64 μmol m−2 s−1. Furthermore, the mean RPD value of the DNN model for estimating the Vcmax of shaded leaves only reached 1.26 (lower than 1.40), so its performance was classed as “C” (RPD < 1.40) only. Similar results were also found when predicting Jmax using the DNN model. The best predictive performance was achieved for sunlit leaves (mean R2 = 0.49, RMSE = 21.68 μmol m−2 s−1, MAE = 16.76 μmol m−2 s−1, and RPD = 1.40). However, the DNN model had a relatively poor performance for predicating Jmax in shaded leaves (mean R2 = 0.23, RMSE = 14.69 μmol m−2 s−1, MAE = 11.34 μmol m−2 s−1, and RPD = 1.13). In terms of R2 and RPD values, it is worth noting that the predicted performances were higher in sunlit leaves than in shaded leaves for both Vcmax and Jmax.
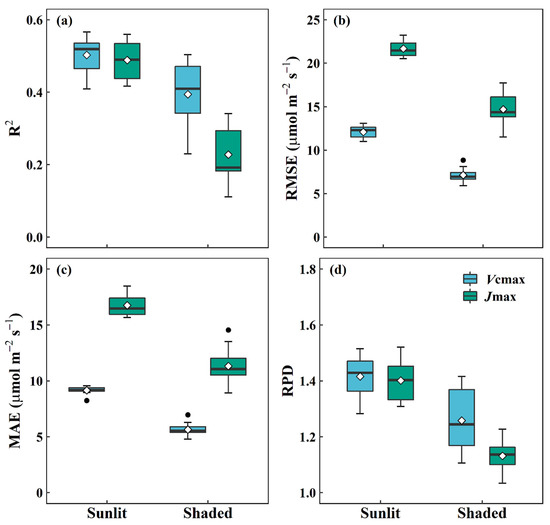
Figure 4.
The statistical distributions of R2 (a), RMSE (b), MAE (c), and RPD (d) for predicting the maximum carboxylation rate (Vcmax) and maximum electron transport (Jmax) in sunlit and shaded leaves using the ensemble DNN model. R2: coefficient of determination; RMSE: root mean square error; MAE: mean absolute error; RPD: ratio of performance to standard deviation.
3.3. Performance of DNN Models for Predicting Vcmax and Jmax from Reflectance during Different Growing Periods
Distinctive DNN models were trained to predict Vcmax and Jmax in different growing periods, namely, leaf flushing, maturity, and senescence. Their respective performances are listed in Table 1. Specifically, the estimations of Vcmax (based on the mean R2 and RPD values) during the flushing period (mean R2 = 0.70, RPD = 1.85) were considerably higher than those in the mature (mean R2 = 0.48, RPD = 1.41) and senescence (mean R2 = 0.52, RPD = 1.46) periods, in terms of R2 and RPD. Likewise, the estimation of Jmax was best during the flushing period (mean R2 = 0.78, RMSE = 16.60 μmol m−2 s−1, MAE = 12.06 μmol m−2 s−1, RPD = 2.15), followed by the leaf senescence period (mean R2 = 0.55, RMSE = 18.84 μmol m−2 s−1, MAE = 15.04 μmol m−2 s−1, RPD = 1.47). The poorest model performance was found during the mature leaf period, with a mean R2 of 0.50, RMSE of 19.68 μmol m−2 s−1, MAE of 15.18 μmol m−2 s−1, and RPD of 1.43.

Table 1.
Performance results for predicting the maximum carboxylation rate (Vcmax) and maximum electron transport rate (Jmax) using the ensemble DNN model during different growing periods (flushing, maturity, and senescence). R2: coefficient of determination; RMSE: root mean square error; MAE: mean absolute error; RPD: ratio of performance to standard deviation.
3.4. Leaf Biophysical/Biochemical Traits as Additional Predictors of DNN Models
The effects of including additional leaf biophysical/biochemical traits (LT, LMA, and Chl in this study) as predictors in the ensemble DNN models have been investigated in this study. The results are shown in Table 2. It worth noting that the model performance for Vcmax improved only slightly when LMA and Chl were taken into consideration, in terms of the mean R2 and RPD values (R2 = 0.55, RPD = 1.48). In terms of the mean R2 and RPD values, including the additional leaf chlorophyll trait resulted in the DNN models for Jmax providing a higher mean R2 value (0.55) and RPD (1.49) than for the reflectance alone.

Table 2.
Results of the DNN model for predicting photosynthetic traits (Vcmax: maximum carboxylation rate; Jmax: maximum electron transport rate) using hyperspectral information, with different additional leaf traits and their combinations added in as predictors. R2: coefficient of determination; RMSE: root mean square error; MAE: mean absolute error; RPD: ratio of performance to standard deviation.
Impressive improvement, however, was noted when leaf traits were included in the ensemble DNN models as predictors for dealing with different leaf types. In detail, for sunlit leaves, the trained DNN model including leaf chlorophyll content showed an improvement in terms of the mean R2 and RPD: they increased by up to 8.00% (0.50 to 0.54) and 4.93% (1.42 to 1.49), respectively, while the mean RMSE was reduced by 4.55% (12.10 to 11.55 μmol m−2 s−1) for Vcmax. Similarly, including Chl also resulted in a significant improvement for Jmax (mean R2 = 0.52, RMSE = 19.96 μmol m−2 s−1, and RPD = 1.45), even though the best DNN model was found when both the LMA and Chl were included; this had a mean R2 of 0.54, RMSE of 20.97 μmol m−2 s−1, MAE of 16.62 μmol m−2 s−1, and RPD of 1.49. On the other hand, notable improvements were found when the LMA was added to the reflectance in shaded leaves. In detail, the mean RMSE and MAE decreased by 13.71% and 10.46%, while the mean R2 and RPD increased by 25.64% and 11.90%, respectively, for Vcmax. Many improvements were obtained through the addition of the LMA for Jmax compared to other traits, and the mean R2, RMSE, MAE, and RPD values were 0.45, 11.48 μmol m−2 s−1, 9.14 μmol m−2 s−1, and 1.39, respectively.
Furthermore, we also examined the performances of DNN models when other leaf traits were included as predictors in different growth periods, and the results are presented in Table 3. We confirmed the performance improvements that resulted from including leaf traits as well as the reflectance in the DNN models for predicting Vcmax and Jmax. Specifically, for Vcmax, the mean RMSE decreased from 11.03 to 10.64 (3.54%) μmol m−2 s−1, and the mean R2 and RPD increased from 0.70 to 0.82 (17.14%) and 1.85 to 2.26 (22.16%), respectively, when considering both the leaf chlorophyll content and the LMA as inputs during the leaf flushing period. According to the mean R2 and RPD, the performance was also greatly improved (mean R2 = 0.83, RMSE = 15.65 μmol m−2 s−1, RPD = 2.21) for Jmax when the leaf chlorophyll content, leaf thickness, and LMA were used as predictors.

Table 3.
Results of DNN model for predicting photosynthetic traits (Vcmax: maximum carboxylation rate; Jmax: maximum electron transport rate) using hyperspectral information, with different additional leaf traits and their combinations used as predictors during different growing periods (flushing, maturity, and senescence). R2: coefficient of determination; RMSE: root mean square error; MAE: mean absolute error; RPD: ratio of performance to standard deviation.
However, the estimation accuracy of Vcmax (mean R2 = 0.49, RPD = 1.45) and Jmax (mean R2 = 0.52, RPD = 1.45) were only slightly increased when the LMA and all of the traits, respectively, were combined with the reflectance during the leaf maturity period. Furthermore, during the leaf senescence period, Vcmax prediction using the DNN model based on the reflectance combined with Chl improved, with mean R2, RMSE, MAE, and RPD values of 0.56, 7.84 μmol m−2 s−1, 6.03 μmol m−2 s−1, and 1.52, respectively. Similarly, the DNN model with the LT, LMA, and Chl coupled with the reflectance performed best for estimating Jmax; this had mean R2, RMSE, MAE, and RPD values of 0.61, 17.67 μmol m−2 s−1, 14.14 μmol m−2 s−1, and 1.62, respectively.
4. Discussion
4.1. Estimation of Leaf Photosynthetic Traits from Spectra Using the DNN Models
Our results suggest that DNN models can be used to estimate photosynthetic traits with moderate accuracy, except for shaded leaves. Our results are in agreement with previous studies that reported that the photosynthetic capacity can be estimated from reflectance spectral data [10,14,67,68]. For example, one previous study reported moderate predictive performance for sunlit tobacco leaves using an ANN model (Vcmax: R2 = 0.60, RMSE = 54.80; Jmax: R2 = 0.48, RMSE = 41.50) and emphasized the potential predictive ability of neural networks regarding photosynthesis [26]. Beyond such pioneering works, we have explored DNN models with multiple hidden layers in this study. These have previously been proven to outperform ANNs in predicting soil properties [52]. Even though the DNN model developed in this study (mean R2 = 0.54, RMSE = 11.13) for predicting Vcmax exhibited relatively low R2 and RMSE values compared with those of Fu et al. [26], the DNN model nevertheless had a better performance for predicting Jmax (mean R2 = 0.50, RMSE = 20.46) than the ANN in that study [26], with impressive reductions in RMSE values and increases in R2 values. This work has thus advanced the use of deep learning algorithms in photosynthesis.
As claimed previously, the DNN models performed better than the other machine learning models; they are the best types of models to estimate surface parameters in almost all cases [52]. In this study, we also explored the one-dimensional convolutional neural network (CNN) [69,70] for predicting Vcmax and Jmax. However, the use of the CNN model yielded a weak predictive performance, with R2 and RMSE values of 0.46 and 11.76 μmol m−2 s−1 for Vcmax and 0.45 and 23.54 for Jmax. In addition, the RPD values (1.36 and 1.29) for Vcmax and Jmax were both classified as “C”, indicating the unreliability of the model. The inferior performance of the CNN model could be related to explicitly considering photosynthetic traits with large seasonal variations, canopy variations, and sampling times, all of which increase the uncertainty. Overall, the DNN model outperformed the CNN model, with a better correlation with in situ photosynthetic trait measurements.
Compared with other commonly applied data-driven approaches, the DNN models unsurprisingly outperformed reported indices such as the photochemical reflectance index (PRI), normalized difference vegetation index (NDVI), and enhanced vegetation index (EVI) [71], when estimating both Vcmax and Jmax. Furthermore, the performance for estimating Vcmax using the DNN model was also better than double difference (DDn) types of vegetation indices (R2 = 0.50, RPD = 1.42), as proposed by Jin et al. [71] for mature leaves with mixed dominant species. However, the DNN model had a relatively weaker performance than the PLSR model used for Vcmax and Jmax modeling by Jin et al. [72].
Furthermore, we explored the robustness of the DNN models for predicting the photosynthetic capacity with different leaf groups. The modeling performances for Vcmax and Jmax of the DNN model for sunlit leaves were much higher than those for shaded leaves. The differences in leaf groups can be explained by the differences in their responses to the photosynthesis process [73] and/or the changes in leaf properties such as the leaf mass per area, and the light environment throughout the vertical profile [74,75,76,77]. Taking the sunlit and shaded leaf groups into consideration is helpful for improving the estimation of carbon and water fluxes [78,79]. In addition, the performance using the DNN models in estimating Vcmax and Jmax was notably the best during the leaf flushing period, followed by the senescence period, with the poorest performance occurring during the maturity period. This observation could be attributed to the range of variation in Vcmax and Jmax for model development [11]. As reported by previous studies, leaf flushing and senescence are accompanied by a strong increase and decline in photosynthetic capacity, while leaf maturity is relatively stable with minor changes [7,80]. A more likely explanation is that the spectra–photosynthetic capacity linkages could vary with leaf age. The results suggest that including as many axes of variation as possible is critical in tracing the photosynthetic capacity using spectral information.
4.2. Including Other Leaf Biophysical/Biochemical Traits to Better Predict Photosynthetic Capacity from Reflectance Using DNN Models
Our results showed that using only leaf hyperspectral reflectance, it is possible to capture a large variety of photosynthetic traits. However, combining other leaf biophysical/biochemical traits could further improve the estimation accuracy of photosynthetic traits using DNN models, since our results clearly indicated that the estimation accuracy of Vcmax from reflectance using DNN models was much improved by the addition of the leaf chlorophyll content for sunlit leaves. Leaf chlorophyll is an important component of the photosynthesis machinery that harvests light and transports electrons to support the production of the biochemical energy necessary to drive photosynthesis [81], and it is an important indicator of physiological status [19]. Several studies found that there were strong correlations between leaf chlorophyll content and both Vcmax and Jmax for several broadleaf tree species [82] and crops [83], and the integration of the relationship into terrestrial biosphere models has been reported to reduce errors in the estimated primary productivity [84]. However, we found that shaded leaves were different from sunlit leaves, and that the addition of the LMA to the DNN models could improve the prediction of Vcmax and Jmax. The results are consistent with those of Song et al. [85]. In addition, leaf chlorophyll, together with leaf morphological characteristics, has been considered to improve Vcmax and Jmax prediction during the leaf flushing period. The increments in chlorophyll and morphological traits were similar to those in Vcmax and Jmax [7], and these trends can possibly contribute to tracing the photosynthetic capacity when using leaf spectra.
Overall, we found that the inclusion of leaf traits can effectively constrain the uncertainty of modeled photosynthesis and improve the estimation accuracy, particularly for areas with strong seasonal cycles and different leaf types, and in turn this can provide a more realistic estimation of photosynthetic capacity.
4.3. Bootstrap as a Remedy for Setting Up Robust DNN Models from Limited Samples
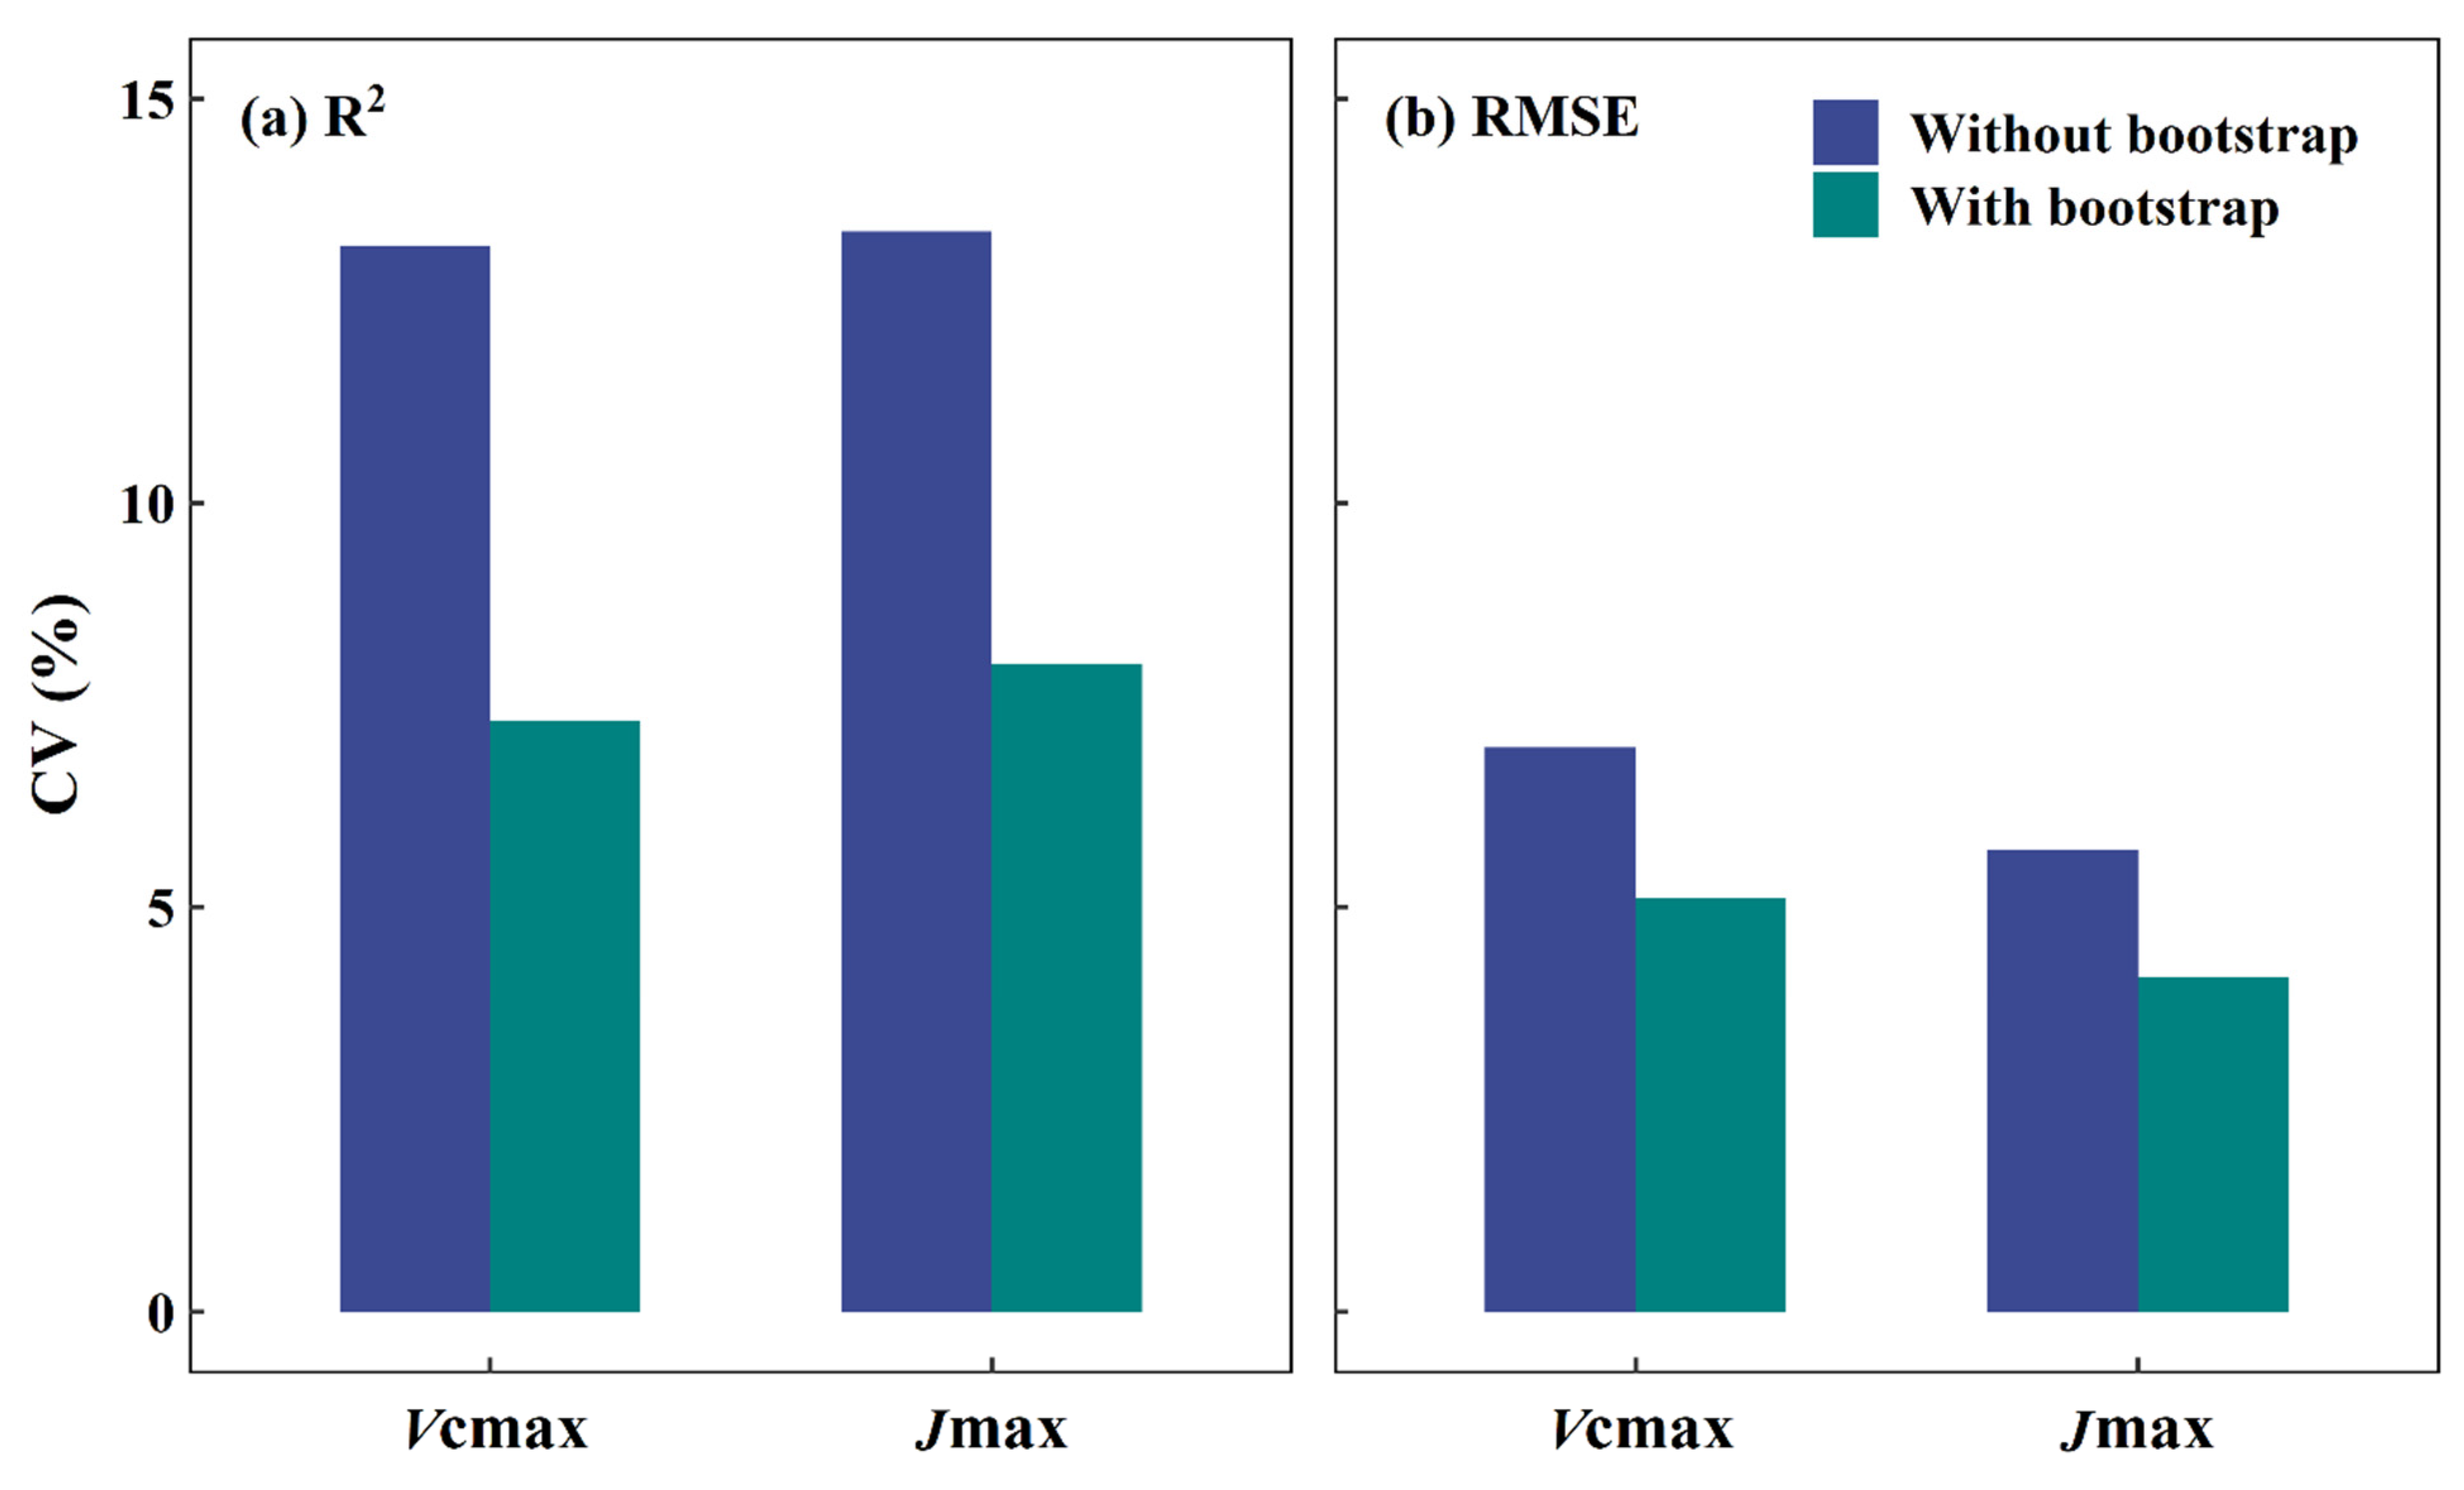
Our results have clearly demonstrated that a DNN model using the bootstrap approach is an effective solution that increases the stability and accuracy of leaf photosynthetic capacity prediction. We have verified the approach’s effectiveness in comparison to the original DNN model based on the measured data using the coefficient of variation (CV) in terms of R2 and RMSE values (see Figure 5). The DNN model based on limited samples exhibited relatively larger variations in both R2 and RMSE values when predicting Vcmax (CV = 13.18% and 6.97%) and Jmax (CV = 13.36% and 5.70%). In comparison, using the bootstrap sampling approach, as in the ensemble DNN, resulted in a decrease in the CV values for R2 for predicting Vcmax (7.30%) and Jmax (8.00%), and also in the RMSE CV values (5.10% and 4.13% for Vcmax and Jmax, respectively). The differences between the performances of these two approaches are attributed to the fact that deep learning methods require large datasets to develop good prediction models [70]. As a result, the ensemble DNN model could predict photosynthetic capacity with high stability, unlike the single DNN model built from limited samples. This could provide high-quality results in future applications.
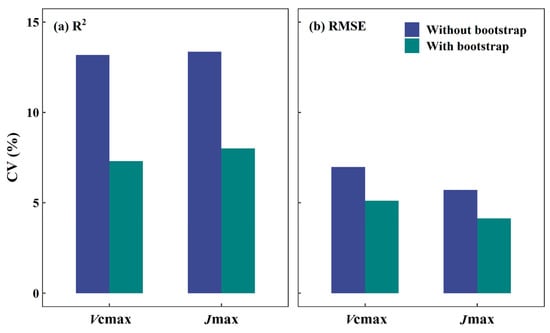
Figure 5.
The coefficient of variation (CV) for the coefficient of determination (R2) (a) and root mean square error (RMSE) (b) for predicting the maximum carboxylation rate (Vcmax) and maximum electron transport rate (Jmax) using the DNN model without and with the bootstrap sampling approach.
These results are in agreement with previous studies that use the bootstrapping approach in ensemble deep learning models, spanning a wide range of fields [49,86]. For example, Rew et al. [49] reported that a DNN model based on the bootstrap aggregating method obtained more accurate and robust prediction results for species distribution than other typically used models. Overall, the results of this study indicated that it is important to use the bootstrapping approach when the data acquisition is limited in the modeling process, as it enhances the strengths of the deep learning techniques, even if further evaluations are still necessary.
4.4. Limits and Future Studies
We have combined the leaf trait information (possibly the causes of the variations in leaf photosynthetic capacity) and leaf reflectance (not the cause but the outside expression only) to build DNN models in this study. Although the feasibility of this technique is confirmed in this study, the inherent biological mechanisms of prediction models are, unfortunately, difficult to understand due to the “black-box” nature of neural networks as well as the large number of layers and neurons involved in training the DNN models. This experiment still needs to be applied to more study areas in order to verify the effectiveness of the model in predicting photosynthetic traits under different environmental conditions and to further analyze the impact of different leaf characteristics on the accuracy of predicting photosynthetic traits. Furthermore, the potential of DNN models for mapping photosynthetic capacity using satellite spectral imagery should be explored, thereby providing a powerful tool to accurately assess photosynthetic capacity across large spatial scales. Feature selection methods, to simplify the model based on the relationship between reflectance spectra and photosynthesis, should also be explored in the future to exclude unimportant and redundant auxiliary variables.
5. Conclusions
DNN models using reflected information for predicting leaf photosynthetic capacity were evaluated extensively in this study, in terms of different leaf types and growth periods. High correlations between the actual and predicted photosynthetic parameters suggested that the DNN is a feasible approach for predicting leaf functions from outside reflected information. However, DNN models can be much improved by including associated leaf traits as predictors, in addition to the spectra. Although there are still many unknowns that need to be explored, the approach of coupling deep learning with hyperspectral information to trace leaf photosynthetic capacity, especially with the aid of other leaf traits, is promising. This study has addressed an important challenge by estimating leaf photosynthetic capacity based on reflected hyperspectral information, and it advances our understanding of tracking physiological dynamics using remote sensing technology.
Author Contributions
Q.W. designed this study. G.S. carried out the analyses. G.S. and Q.W. wrote the manuscript. All authors have read and agreed to the published version of the manuscript.
Funding
This research was supported by the JSPS project (Grant No. 21H02230).
Data Availability Statement
The data that support the findings of this study are available on request from the corresponding author.
Acknowledgments
The authors would like to express their gratitude to the members of the Laboratory of Macroecology and the Institute of Silviculture, Shizuoka University, for their support in conducting both fieldwork and laboratory analyses.
Conflicts of Interest
The authors declare no conflict of interest.
References
- Bernacchi, C.J.; Bagley, J.E.; Serbin, S.P.; Ruiz-Vera, U.M.; Rosenthal, D.M.; Vanloocke, A. Modelling C3 photosynthesis from the chloroplast to the ecosystem. Plant Cell Environ. 2013, 36, 1641–1657. [Google Scholar] [CrossRef] [PubMed]
- Farquhar, G.D.; von Caemmerer, S.; Berry, J.A. A biochemical model of photosynthetic CO2 assimilation in leaves of C3 species. Planta 1980, 149, 78–90. [Google Scholar] [CrossRef] [PubMed] [Green Version]
- Rogers, A.; Medlyn, B.E.; Dukes, J.S.; Bonan, G.; von Caemmerer, S.; Dietze, M.C.; Kattge, J.; Leakey, A.D.B.; Mercado, L.M.; Niinemets, Ü.; et al. A roadmap for improving the representation of photosynthesis in Earth system models. New Phytol. 2017, 213, 22–42. [Google Scholar] [CrossRef] [PubMed] [Green Version]
- Long, S.P.; Bernacchi, C.J. Gas exchange measurements, what can they tell us about the underlying limitations to photosynthesis? Procedures and sources of error. J. Exp. Bot. 2003, 54, 2393–2401. [Google Scholar] [CrossRef] [PubMed] [Green Version]
- Albert, L.P.; Wu, J.; Prohaska, N.; de Camargo, P.B.; Huxman, T.E.; Tribuzy, E.S.; Ivanov, V.Y.; Oliveira, R.S.; Garcia, S.; Smith, M.N.; et al. Age-dependent leaf physiology and consequences for crown-scale carbon uptake during the dry season in an Amazon evergreen forest. New Phytol. 2018, 219, 870–884. [Google Scholar] [CrossRef] [Green Version]
- Burnett, A.C.; Serbin, S.P.; Lamour, J.; Anderson, J.; Davidson, K.J.; Yang, D.; Rogers, A. Seasonal trends in photosynthesis and leaf traits in scarlet oak. Tree Physiol. 2021, 41, 1413–1424. [Google Scholar] [CrossRef] [PubMed]
- Song, G.; Wang, Q.; Jin, J. Exploring the instability of the relationship between maximum potential electron transport rate and maximum carboxylation rate in cool-temperate deciduous forests. Agric. For. Meteorol. 2021, 308–309, 108614. [Google Scholar] [CrossRef]
- van de Weg, M.J.; Meir, P.; Grace, J.; Ramos, G.D. Photosynthetic parameters, dark respiration and leaf traits in the canopy of a Peruvian tropical montane cloud forest. Oecologia 2012, 168, 23–34. [Google Scholar] [CrossRef] [PubMed]
- Dechant, B.; Cuntz, M.; Vohland, M.; Schulz, E.; Doktor, D. Estimation of photosynthesis traits from leaf reflectance spectra: Correlation to nitrogen content as the dominant mechanism. Remote Sens. Environ. 2017, 196, 279–292. [Google Scholar] [CrossRef]
- Silva-Perez, V.; Molero, G.; Serbin, S.P.; Condon, A.G.; Reynolds, M.P.; Furbank, R.T.; Evans, J.R. Hyperspectral reflectance as a tool to measure biochemical and physiological traits in wheat. J. Exp. Bot. 2018, 69, 483–496. [Google Scholar] [CrossRef] [Green Version]
- Wu, J.; Rogers, A.; Albert, L.P.; Ely, K.; Prohaska, N.; Wolfe, B.T.; Oliveira, R.C.; Saleska, S.R.; Serbin, S.P. Leaf reflectance spectroscopy captures variation in carboxylation capacity across species, canopy environment and leaf age in lowland moist tropical forests. New Phytol. 2019, 224, 663–674. [Google Scholar] [CrossRef] [PubMed]
- Fu, P.; Meacham-Hensold, K.; Guan, K.; Wu, J.; Bernacchi, C. Estimating photosynthetic traits from reflectance spectra: A synthesis of spectral indices, numerical inversion, and partial least square regression. Plant Cell Environ. 2020, 1241–1258. [Google Scholar] [CrossRef] [PubMed]
- Heckmann, D.; Schlüter, U.; Weber, A.P.M. Machine learning techniques for predicting crop photosynthetic capacity from leaf reflectance spectra. Mol. Plant 2017, 10, 878–890. [Google Scholar] [CrossRef] [Green Version]
- Serbin, S.P.; Dillaway, D.N.; Kruger, E.L.; Townsend, P.A. Leaf optical properties reflect variation in photosynthetic metabolism and its sensitivity to temperature. J. Exp. Bot. 2012, 63, 489–502. [Google Scholar] [CrossRef] [PubMed] [Green Version]
- Ali, A.A.; Xu, C.; Rogers, A.; McDowell, N.G.; Medlyn, B.E.; Fisher, R.A.; Wullschleger, S.D.; Reich, P.B.; Vrugt, J.A.; Bauerle, W.L.; et al. Global-scale environmental control of plant photosynthetic capacity. Ecol. Appl. 2015, 25, 2349–2365. [Google Scholar] [CrossRef] [PubMed] [Green Version]
- Smith, N.G.; Keenan, T.F.; Colin Prentice, I.; Wang, H.; Wright, I.J.; Niinemets, Ü.; Crous, K.Y.; Domingues, T.F.; Guerrieri, R.; Yoko Ishida, F.; et al. Global photosynthetic capacity is optimized to the environment. Ecol. Lett. 2019, 22, 506–517. [Google Scholar] [CrossRef] [PubMed] [Green Version]
- Ainsworth, E.A.; Serbin, S.P.; Skoneczka, J.A.; Townsend, P.A. Using leaf optical properties to detect ozone effects on foliar biochemistry. Photosynth. Res. 2014, 119, 65–76. [Google Scholar] [CrossRef] [PubMed]
- Akaike, H. A new look at the statistical model identification. IEEE Trans. Automat. Contr. 1974, 19, 716–723. [Google Scholar] [CrossRef]
- Houborg, R.; Anderson, M.C.; Daughtry, C.S.T.; Kustas, W.P.; Rodell, M. Using leaf chlorophyll to parameterize light-use-efficiency within a thermal-based carbon, water and energy exchange model. Remote Sens. Environ. 2011, 115, 1694–1705. [Google Scholar] [CrossRef]
- Jolliffe, I.T.; Cadima, J. Principal component analysis: A review and recent developments. Phil. Trans. R Soc. A 2016, 374, 20150202. [Google Scholar] [CrossRef] [PubMed]
- Wang, Q.; Iio, A.; Kakubari, Y. Broadband simple ratio closely traced seasonal trajectory of canopy photosynthetic capacity. Geophys. Res. Lett. 2008, 35, L07401. [Google Scholar] [CrossRef]
- DuBois, S.; Desai, A.R.; Singh, A.; Serbin, S.P.; Goulden, M.L.; Baldocchi, D.D.; Ma, S.; Oechel, W.C.; Wharton, S.; Kruger, E.L.; et al. Using imaging spectroscopy to detect variation in terrestrial ecosystem productivity across a water-stressed landscape. Ecol. Appl. 2018, 28, 1313–1324. [Google Scholar] [CrossRef]
- Muraoka, H.; Noda, H.M.; Nagai, S.; Motohka, T.; Saitoh, T.M.; Nasahara, K.N.; Saigusa, N. Spectral vegetation indices as the indicator of canopy photosynthetic productivity in a deciduous broadleaf forest. J. Plant Ecol. 2013, 6, 393–407. [Google Scholar] [CrossRef] [Green Version]
- Yendrek, C.R.; Tomaz, T.; Montes, C.M.; Cao, Y.; Morse, A.M.; Brown, P.J.; McIntyre, L.M.; Leakey, A.D.B.; Ainsworth, E.A. High-throughput phenotyping of maize leaf physiological and biochemical traits using hyperspectral reflectance. Plant Physiol. 2017, 173, 614–626. [Google Scholar] [CrossRef] [PubMed]
- Song, G.; Wang, Q.; Jin, J. Temporal instability of partial least squares regressions for estimating leaf photosynthetic traits from hyperspectral information. 2021; under review. [Google Scholar]
- Fu, P.; Meacham-Hensold, K.; Guan, K.; Bernacchi, C.J. Hyperspectral leaf reflectance as proxy for photosynthetic capacities: An ensemble approach based on multiple machine learning algorithms. Front. Plant Sci. 2019, 10, 1–13. [Google Scholar] [CrossRef]
- Alzubaidi, L.; Zhang, J.; Humaidi, A.J.; Al-Dujaili, A.; Duan, Y.; Al-Shamma, O.; Santamaría, J.; Fadhel, M.A.; Al-Amidie, M.; Farhan, L. Review of deep learning: Concepts, CNN architectures, challenges, applications, future directions. J. Big Data 2021, 8, 53. [Google Scholar] [CrossRef] [PubMed]
- Kamarudin, M.H.; Ismail, Z.H.; Saidi, N.B. Deep learning sensor fusion in plant water stress assessment: A comprehensive review. Appl. Sci. 2021, 11, 1403. [Google Scholar] [CrossRef]
- Cai, Y.; Zheng, W.; Zhang, X.; Zhangzhong, L.; Xue, X. Research on soil moisture prediction model based on deep learning. PLoS ONE 2019, 14, e0214508. [Google Scholar] [CrossRef] [PubMed]
- Ferreira, L.B.; da Cunha, F.F. New approach to estimate daily reference evapotranspiration based on hourly temperature and relative humidity using machine learning and deep learning. Agric. Water Manag. 2020, 234, 106113. [Google Scholar] [CrossRef]
- Fariñas, M.D.; Jimenez-Carretero, D.; Sancho-Knapik, D.; Peguero-Pina, J.J.; Gil-Pelegrín, E.; Gómez Álvarez-Arenas, T. Instantaneous and non-destructive relative water content estimation from deep learning applied to resonant ultrasonic spectra of plant leaves. Plant Methods 2019, 15, 1–10. [Google Scholar] [CrossRef]
- Saggi, M.K.; Jain, S. Reference evapotranspiration estimation and modeling of the Punjab Northern India using deep learning. Comput. Electron. Agric. 2019, 156, 387–398. [Google Scholar] [CrossRef]
- Dalto, M.; Matusko, J.; Vasak, M. Deep neural networks for ultra-short-term wind forecasting. In Proceedings of the 2015 IEEE International Conference on Industrial Technology (ICIT), Seville, Spain, 17–19 March 2015; pp. 1657–1663. [Google Scholar]
- Ryu, S.; Noh, J.; Kim, H. Deep neural network based demand side short term load forecasting. In Proceedings of the 2016 IEEE International Conference on Smart Grid Communications (SmartGridComm), Sydney, Australia, 6–9 November 2016; pp. 308–313. [Google Scholar]
- Ma, L.; Liu, Y.; Zhang, X.; Ye, Y.; Yin, G.; Johnson, B.A. Deep learning in remote sensing applications: A meta-analysis and review. ISPRS J. Photogramm. Remote Sens. 2019, 152, 166–177. [Google Scholar] [CrossRef]
- Yuan, Q.; Shen, H.; Li, T.; Li, Z.; Li, S.; Jiang, Y.; Xu, H.; Tan, W.; Yang, Q.; Wang, J.; et al. Deep learning in environmental remote sensing: Achievements and challenges. Remote Sens. Environ. 2020, 241, 111716. [Google Scholar] [CrossRef]
- Hinton, G.; Deng, L.; Yu, D.; Dahl, G.E.; Mohamed, A.; Navdeep, J. Deep neural networks for acoustic modeling in speech recognition. IEEE Signal Process. Mag. 2012, 29, 82–97. [Google Scholar] [CrossRef]
- Zhao, Z.Q.; Zheng, P.; Xu, S.T.; Wu, X. Object detection with deep learning: A review. IEEE Trans. Neural Netw. Learn. Syst. 2019, 30, 3212–3232. [Google Scholar] [CrossRef] [PubMed] [Green Version]
- Yao, X.; Huang, Y.; Shang, G.; Zhou, C.; Cheng, T.; Tian, Y.; Cao, W.; Zhu, Y. Evaluation of six algorithms to monitor wheat leaf nitrogen concentration. Remote Sens. 2015, 7, 14939–14966. [Google Scholar] [CrossRef] [Green Version]
- Alhnaity, B.; Pearson, S.; Leontidis, G.; Kollias, S. Using deep learning to predict plant growth and yield in greenhouse environments. Acta Hortic. 2020, 1296, 425–431. [Google Scholar] [CrossRef]
- Kaul, M.; Hill, R.L.; Walthall, C. Artificial neural networks for corn and soybean yield prediction. Agric. Syst. 2005, 85, 1–18. [Google Scholar] [CrossRef]
- Kim, N.; Lee, Y.W. Machine learning approaches to corn yield estimation using satellite images and climate data: A case of Iowa State. J. Korean Soc. Surv. Geod. Photogramm. Cartogr. 2016, 34, 383–390. [Google Scholar] [CrossRef] [Green Version]
- Kuwata, K.; Shibasaki, R. Estimating crop yields with deep learning and remotely sensed data. In Proceedings of the 2015 IEEE International Geoscience and Remote Sensing Symposium (IGARSS), Milan, Italy, 26–31 July 2015; pp. 858–861. [Google Scholar]
- Shahhosseini, M.; Hu, G.; Khaki, S.; Archontoulis, S.V. Corn yield prediction with ensemble CNN-DNN. Front. Plant Sci. 2021, 12, 1–13. [Google Scholar] [CrossRef]
- Kamilaris, A.; Prenafeta-Boldú, F.X. Deep learning in agriculture: A survey. Comput. Electron. Agric. 2018, 147, 70–90. [Google Scholar] [CrossRef] [Green Version]
- Lee, K.; Choi, C.; Shin, D.H.; Kim, H.S. Prediction of heavy rain damage using deep learning. Water 2020, 12, 1942. [Google Scholar] [CrossRef]
- Chlingaryan, A.; Sukkarieh, S.; Whelan, B. Machine learning approaches for crop yield prediction and nitrogen status estimation in precision agriculture: A review. Comput. Electron. Agric. 2018, 151, 61–69. [Google Scholar] [CrossRef]
- Breiman, L. Bagging predictors. Mach. Learn. 1996, 24, 123–140. [Google Scholar] [CrossRef] [Green Version]
- Rew, J.; Cho, Y.; Hwang, E. A robust prediction model for species distribution using bagging ensembles with deep neural networks. Remote Sens. 2021, 13, 1495. [Google Scholar] [CrossRef]
- Mi, X.; Zou, F.; Zhu, R. Bagging and deep learning in optimal individualized treatment rules. Biometrics 2019, 75, 674–684. [Google Scholar] [CrossRef] [PubMed]
- Mi, X.; Zou, B.; Zou, F.; Hu, J. Permutation-based identification of important biomarkers for complex diseases via machine learning models. Nat. Commun. 2021, 12, 1–12. [Google Scholar] [CrossRef]
- Emadi, M.; Taghizadeh-Mehrjardi, R.; Cherati, A.; Danesh, M.; Mosavi, A.; Scholten, T. Predicting and mapping of soil organic carbon using machine learning algorithms in Northern Iran. Remote Sens. 2020, 12, 2234. [Google Scholar] [CrossRef]
- Jin, X.; Li, Z.; Feng, H.; Ren, Z.; Li, S. Deep neural network algorithm for estimating maize biomass based on simulated Sentinel 2A vegetation indices and leaf area index. Crop J. 2020, 8, 87–97. [Google Scholar] [CrossRef]
- Merkel, G.D.; Povinelli, R.J.; Brown, R.H. Short-term load forecasting of natural gas with deep neural network regression. Energies 2018, 11, 2008. [Google Scholar] [CrossRef] [Green Version]
- Schmidhuber, J. Deep Learning in neural networks: An overview. Neural Netw. 2015, 61, 85–117. [Google Scholar] [CrossRef] [Green Version]
- Dargan, S.; Kumar, M.; Ayyagari, M.R.; Kumar, G. A survey of deep learning and its applications: A new paradigm to machine learning. Arch. Comput. Methods Eng. 2020, 27, 1071–1092. [Google Scholar] [CrossRef]
- Tiwari, S. A comparative study of deep learning models with handcraft features and non-handcraft features for automatic plant species identification. Int. J. Agric. Environ. Inf. Syst. 2020, 11, 44–57. [Google Scholar] [CrossRef]
- Tripathi, S.; Acharya, S.; Sharma, R.D.; Mittal, S.; Bhattacharya, S. Using deep and convolutional neural networks for accurate emotion classification on deap dataset. In Proceedings of the Twenty-Ninth AAAI Conference on Innovative Applications (IAAI-17), Hawaiian, HI, USA, 6–9 February 2017; pp. 4746–4752. [Google Scholar]
- Elbeltagi, A.; Deng, J.; Wang, K.; Malik, A.; Maroufpoor, S. Modeling long-term dynamics of crop evapotranspiration using deep learning in a semi-arid environment. Agric. Water Manag. 2020, 241, 106334. [Google Scholar] [CrossRef]
- Wang, Q.; IIo, A.; Tenhunen, J.; Kakubari, Y. Annual and seasonal variations in photosynthetic capacity of Fagus crenata along an elevation gradient in the Naeba Mountains, Japan. Tree Physiol. 2008, 28, 277–285. [Google Scholar] [CrossRef] [Green Version]
- Foley, S.; Rivard, B.; Sanchez-Azofeifa, G.A.; Calvo, J. Foliar spectral properties following leaf clipping and implications for handling techniques. Remote Sens. Environ. 2006, 103, 265–275. [Google Scholar] [CrossRef]
- Duursma, R.A. Plantecophys—An R package for analysing and modelling leaf gas exchange data. PLoS ONE 2015, 10, e0143346. [Google Scholar] [CrossRef] [PubMed]
- Sonobe, R.; Wang, Q. Towards a universal hyperspectral index to assess chlorophyll content in deciduous forests. Remote Sens. 2017, 9, 191. [Google Scholar] [CrossRef] [Green Version]
- Srivastava, N.; Hinton, G.; Krizhevsky, A.; Sutskever, I.; Salakhutdinov, R. Dropout: A simple way to prevent neural networks from overfitting. J. Mach. Learn. Res. 2014, 15, 1929–1958. [Google Scholar] [CrossRef] [Green Version]
- Chernick, M.R. Bootstrap Methods: A Guide for Practitioners and Researchers, 2nd ed.; Wiley: New York, NY, USA, 2007. [Google Scholar]
- Chang, C.W.; Laird, D.A.; Mausbach, M.J.; Hurburgh, C.R. Near-infrared reflectance spectroscopy-principal components regression analyses of soil properties. Soil Sci. Soc. Am. J. 2001, 65, 480–490. [Google Scholar] [CrossRef] [Green Version]
- Meacham-Hensold, K.; Fu, P.; Wu, J.; Serbin, S.; Montes, C.M.; Ainsworth, E.; Guan, K.; Dracup, E.; Pederson, T.; Driever, S.; et al. Plot-level rapid screening for photosynthetic parameters using proximal hyperspectral imaging. J. Exp. Bot. 2020, 71, 2312–2328. [Google Scholar] [CrossRef]
- Wang, S.; Guan, K.; Wang, Z.; Ainsworth, E.A.; Zheng, T.; Townsend, P.A.; Li, K.; Moller, C.; Wu, G.; Jiang, C. Unique contributions of chlorophyll and nitrogen to predict crop photosynthetic capacity from leaf spectroscopy. J. Exp. Bot. 2020, 72, 341–354. [Google Scholar] [CrossRef]
- Kawamura, K.; Nishigaki, T.; Andriamananjara, A.; Rakotonindrina, H.; Tsujimoto, Y.; Moritsuka, N.; Rabenarivo, M.; Razafimbelo, T. Using a one-dimensional convolutional neural network on visible and near-infrared spectroscopy to improve soil phosphorus prediction in Madagascar. Remote Sens. 2021, 13, 1519. [Google Scholar] [CrossRef]
- Ng, W.; Minasny, B.; Montazerolghaem, M.; Padarian, J.; Ferguson, R.; Bailey, S.; McBratney, A.B. Convolutional neural network for simultaneous prediction of several soil properties using visible/near-infrared, mid-infrared, and their combined spectra. Geoderma 2019, 352, 251–267. [Google Scholar] [CrossRef]
- Jin, J.; Pratama, B.A.; Wang, Q. Tracing leaf photosynthetic parameters using hyperspectral indices in an Alpine deciduous forest. Remote Sens. 2020, 12, 1124. [Google Scholar] [CrossRef] [Green Version]
- Jin, J.; Wang, Q.; Song, G. Selecting informative bands for partial least squares regressions improves their goodness-of-fits to estimate leaf photosynthetic parameters from hyperspectral data. Photosynth. Res. 2021, 1–12. [Google Scholar] [CrossRef]
- Reich, P.B.; Ellsworth, D.S.; Walters, M.B. Leaf structure (specific leaf area) modulates photosynthesis—nitrogen relations: Evidence from within and across species and functional groups. Funct. Ecol. 1998, 12, 948–958. [Google Scholar] [CrossRef]
- Chaves, A.R.M.; Ten-Caten, A.; Pinheiro, H.A.; Ribeiro, A.; Damatta, F.M. Seasonal changes in photoprotective mechanisms of leaves from shaded and unshaded field-grown coffee (Coffea arabica L.) trees. Trees-Struct. Funct. 2008, 22, 351–361. [Google Scholar] [CrossRef]
- Lichtenthaler, H.K.; Buschmann, C.; Döll, M.; Fietz, H.J.; Bach, T.; Kozel, U.; Meier, D.; Rahmsdorf, U. Photosynthetic activity, chloroplast ultrastructure, and leaf characteristics of high-light and low-light plants and of sun and shade leaves. Photosynth. Res. 1981, 2, 115–141. [Google Scholar] [CrossRef]
- Niinemets, Ü.; Keenan, T.F.; Hallik, L. A worldwide analysis of within-canopy variations in leaf structural, chemical and physiological traits across plant functional types. New Phytol. 2015, 205, 973–993. [Google Scholar] [CrossRef] [Green Version]
- Niinemets, Ü.; Kull, O.; Tenhunen, J.D. Within-canopy variation in the rate of development of photosynthetic capacity is proportional to integrated quantum flux density in temperate deciduous trees. Plant Cell Environ. 2004, 27, 293–313. [Google Scholar] [CrossRef]
- Chen, J.M.; Liu, J.; Cihlar, J.; Goulden, M.L. Daily canopy photosynthesis model through temporal and spatial scaling for remote sensing applications. Ecol. Modell. 1999, 124, 99–119. [Google Scholar] [CrossRef] [Green Version]
- Luo, X.; Chen, J.M.; Liu, J.; Black, T.A.; Croft, H.; Staebler, R.; He, L.; Arain, M.A.; Chen, B.; Mo, G.; et al. Comparison of big-leaf, two-big-leaf, and two-leaf upscaling schemes for evapotranspiration estimation using coupled carbon-water modeling. J. Geophys. Res. Biogeosci. 2018, 123, 207–225. [Google Scholar] [CrossRef]
- Dillen, S.Y.; de Beeck, M.O.; Hufkens, K.; Buonanduci, M.; Phillips, N.G. Seasonal patterns of foliar reflectance in relation to photosynthetic capacity and color index in two co-occurring tree species, Quercus rubra and Betula papyrifera. Agric. For. Meteorol. 2012, 160, 60–68. [Google Scholar] [CrossRef]
- Alton, P.B. Retrieval of seasonal Rubisco-limited photosynthetic capacity at global FLUXNET sites from hyperspectral satellite remote sensing: Impact on carbon modelling. Agric. For. Meteorol. 2017, 232, 74–88. [Google Scholar] [CrossRef] [Green Version]
- Croft, H.; Chen, J.M.; Luo, X.; Bartlett, P.; Chen, B.; Staebler, R.M. Leaf chlorophyll content as a proxy for leaf photosynthetic capacity. Glob. Chang. Biol. 2017, 23, 3513–3524. [Google Scholar] [CrossRef]
- Houborg, R.; McCabe, M.F.; Cescatti, A.; Gitelson, A.A. Leaf chlorophyll constraint on model simulated gross primary productivity in agricultural systems. Int. J. Appl. Earth Obs. Geoinf. 2015, 43, 160–176. [Google Scholar] [CrossRef] [Green Version]
- Houborg, R.; Cescatti, A.; Migliavacca, M.; Kustas, W.P. Satellite retrievals of leaf chlorophyll and photosynthetic capacity for improved modeling of GPP. Agric. For. Meteorol. 2013, 117, 10–23. [Google Scholar] [CrossRef]
- Song, G.; Wang, Q.; Jin, J. Leaf photosynthetic capacity of sunlit and shaded mature leaves in a deciduous forest. Forests 2020, 11, 318. [Google Scholar] [CrossRef] [Green Version]
- Seo, Y.A.; Kim, K.R.; Cho, C.; Oh, J.W.; Kim, T.H. Deep neural network-based concentration model for oak pollen allergy warning in South Korea. Allergy Asthma Immunol. Res. 2020, 12, 149–163. [Google Scholar] [CrossRef]
Publisher’s Note: MDPI stays neutral with regard to jurisdictional claims in published maps and institutional affiliations. |
© 2021 by the authors. Licensee MDPI, Basel, Switzerland. This article is an open access article distributed under the terms and conditions of the Creative Commons Attribution (CC BY) license (https://creativecommons.org/licenses/by/4.0/).

