Abstract
Hyperspectral image (HSI) clustering is a major challenge due to the redundant spectral information in HSIs. In this paper, we propose a novel deep subspace clustering method that extracts spatial–spectral features via contrastive learning. First, we construct positive and negative sample pairs through data augmentation. Then, the data pairs are projected into feature space using a CNN model. Contrastive learning is conducted by minimizing the distances of positive pairs and maximizing those of negative pairs. Finally, based on their features, spectral clustering is employed to obtain the final result. Experimental results gained over three HSI datasets demonstrate that our proposed method is superior to other state-of-the-art methods.
1. Introduction
Hyperspectral remote sensing has been widely used in many different fields [1,2,3]. Hyperspectral image (HSI) classification is a fundamental issue and a hot topic in hyperspectral remote sensing. HSIs can provide rich spectral and spatial information, which improves the utility of HSIs in various applications. However, the abundant spectral information also causes a low classification accuracy, which is called the Hughes phenomenon. Moreover, the limited number of labeled hyperspectral samples also causes difficulties in hyperspectral image classification. In the real world, more and more hyperspectral data are becoming available with the development of information acquisition technology. However, most of these data are unlabeled, and labeling the data is an extremely laborious and time-consuming process. Nevertheless, HSI clustering focus on achieving a good classification performance without training labels. Thus, HSI clustering has attracted increasing levels of attention in recent years.
Some traditional methods used for natural images have been applied in the study of HSI clustering [4,5,6,7,8]. The complex characteristics of HSIs strongly reduce their accuracy. Subsequently, more and more HSI clustering methods have been proposed. These methods can be divided into two main groups: spectral-only methods and spatial–spectral methods. Spectral-only methods ignore the spatial information of HSIs, which limits the performance of these methods. To improve accuracy, some spatial–spectral clustering methods have been proposed [9,10,11,12].
Additionally, to solve problems relating to high dimensionality, some methods based on sparse subspace clustering (SSC) [13] have been proposed. Those methods rely on clustering HSI data in the low-dimensional subspace. However, the subspace that HSI data exists in is usually non-linear. This limits the performance of these clustering methods.
Recently, deep learning has achieved great success in the computer vision field [14,15,16,17]. To handle the challenge of nonlinearity, many deep learning-based methods have been proposed. Zhong et al. [18] proposed a spectral–spatial residual network (SSRN) based on ResNet [19]. Inspired by DenseNet [20], Wang et al. [21] designed a fast dense spectral–spatial convolution network (FDSSC). Ma et al. [22] adopted a two-branch architecture and proposed a double-branch multi-attention mechanism network (DBMA). Li et al. [23] introduced the self-attention mechanism to their double-branch dual-attention mechanism network (DBDA).
For HSI clustering, most of the existing deep-learning-based clustering methods can be divided into two steps: feature extraction via deep learning models and traditional clustering. Auto-encoders are used in deep clustering as feature extractors under unsupervised conditions. By encoding images into features and reconstructing images from the features, the model can extract features from HSIs without labels. Based on these features, traditional clustering methods or classification layers can be used to obtain the clustering result. For example, Zeng et al. [24] proposed a Laplacian regularized deep subspace clustering method (LRDSC) for HSI clustering. In this method, a 3D auto-encoder network with skip connections is used to extract spatial–spectral features. Lei et al. [25] designed a multi-scale auto-encoder to obtain spatial–spectral information for HSI clustering. Inputs at different scales can provide different types of information, but can increase the computation significantly.
However, the auto-encoder used for HSI processing requires an inordinate amount of computational resources due to the need to reconstruct the input data. Recently, contrastive learning was proposed as a means to extract features under unsupervised conditions. Unlike autoencoders, contrastive learning models operate on different augmented views of the same input image. Since these methods do not require image reconstruction, they require fewer computational resources. Li et al. [26] proposed a clustering method based on contrastive learning.
To the best of our knowledge, there has been little research on contrastive learning methods for HSI processing. The contrastive learning methods used for typical RGB images can not be applied directly to HSI processing because some typical RGB image augmentation methods are not available for HSIs. For example, color distortion for typical RGB images will destroy spectral information when used on HSIs. We explore HSI augmentation by removing the spectral information of some non-central pixels. Different methods of selecting pixels to remove spectral information can be considered as different HSI augmentation methods.
In this paper, we propose a clustering method for HSIs based on contrastive learning. Firstly, we use contrastive learning methods to train a CNN model to extract features from HSIs. Then, we apply a spectral clustering algorithm to these features. The main contributions of our study are summarized as follows.
- Inspired by DBMA and DBDA, we designed a double-branch dense spectral–spatial network for HSI clustering. These two branches can extract spectral and spatial features separately, avoiding the huge computation caused by multi-scale inputs. To reduce the computational load further, we remove the attention blocks in DBDA and DBMA.
- We use contrastive learning to explore spatial–spectral information. We augment the image by removing the spectral information of some non-central pixels. Different methods of selecting pixels to remove spectral information can provide different augmented views of the HSI block.
- The experimental results obtained over three publicly available HSI datasets demonstrate the superiority of our proposed method compared to other state-of-the-art methods.
2. Related Works
2.1. Traditional Clustering for HSIs
Spectral-only methods only use spectral information. For example, Paoli et al. [27] proposed a method for estimating the class number, extracting features, and performing clustering simultaneously. Zhong et al. [28] introduced an artificial immune network for HSI clustering. However, the absence of spatial information affects the accuracy of these methods.
Spatial–spectral clustering methods based on both spatial information and spectral information can provide a higher accuracy than spectral-only methods. Chen et al. [10] proposed a spatial constraint based fuzzy C-means method for HSI clustering. Murphy and Magioni [12] combined spatial–spectral information and diffusion-inspired labeling to create a diffusion learning-based spatial–spectral clustering method (DLSS).
Many sparse subspace clustering (SSC) [13]-based methods have also been proposed for HSI clustering. Zhai et al. [29] proposed a band selection method. Tian et al. [30] applied Gaussian kernels and proposed a kernel spatial–spectral-based multi-view low-rank sparse subspace clustering method. Zhang et al. [31] designed a spectral–spatial sparse subspace clustering () algorithm that utilizes the spectral similarity of a local neighborhood. However, these methods cannot handle the problem of the non-linear subspace structure of HSIs, which decreases their accuracy enormously.
2.2. Deep Clustering for HSIs
Many deep learning-based clustering methods have been proposed recently. A study proposing a deep embedded clustering (DEC) [32] method was the first to propose using deep networks to learn feature representations and cluster assignments simultaneously. Chang et al. [33] designed a deep adaptive image clustering (DAC) method using a binary constrained pairwise-classification model for clustering. Fard et al. [34] proposed a novel approach for addressing the problem of joint clustering and learning representations. Barthakur and Sarma [35] proposed a deep learning-based method for the semantic segmentation of satellite images in a complex background. Sodjinou et al. [36] proposed a deep semantic segmentation-based algorithm to segment crops and weeds in agronomic color images. Based on SSC, Ji et al. [37] used convolutional autoencoders to map data into a latent space and achieved a more robust clustering result than could be gained using traditional clustering methods. A generative adversarial network (GAN) [38,39] was also used to cluster normal images.
For HSI clustering, Egaña et al. [40] proposed a novel methodology for geometallurgical sample characterization based on HSI data. Xu et al. [41] proposed a a novel context-aware unsupervised discriminative ELM method for HSI clustering. Zeng et al. [24] applied skip connections and proposed a Laplacian regularized deep subspace clustering (LRDSC) method for HSI clustering. Lei et al. [25] designed a multi-scale 3D auto-encoder network for HSI clustering. Different input sizes can encourage the model to extract features from different scales. However, these methods aim to reconstruct data, which greatly increases the amount of computation required. Moreover, using a multi-scale network further increases the amount of computation. We used a two-branch CNN model in our method. One branch is used to extract spectral information and the other is used to extract spatial information. We believe that this can play the same role as multi-scale inputs without imposing the same computational burden.
2.3. Contrastive Learning
As a recently proposed unsupervised learning method, contrastive learning has achieved a promising performance. Different from autoencoder and GAN, the contrastive learning method does not focus on generating data. Instead, it maps the data to a feature space by maximizing the distances of negative pairs and minimizing the distances of positive pairs. The positive pair contains two different augmented views of the same sample and the other pairs between different samples are regarded as negative. Several contrastive learning methods have been proposed for normal images, such as similar contrastive learning (SimCLR) [42], momentum contrast for unsupervised visual representation learning (MoCo) [43], and bootstrap your own latent (BYOL) [44].
For clustering, Li et al. [26] proposed an online clustering method named Contrastive Clustering (CC) that can explicitly perform instance- and cluster-level contrastive learning. Inspired by CC, we used the contrastive clustering method to train the CNN model. Then, we adopted a traditional spectral clustering algorithm rather than a simple layer to obtain the clustering result.
3. Method
Our proposed method consists of two stages: training and testing. Firstly, we used two augmented versions of HSI to train our CNN model. After training, we used the CNN model to obtain the features. Finally, we applied the spectral clustering algorithm based on the features to obtain the clustering result.
3.1. Augmentation in Our Experimental Method
We use two different composite methods to augment the HSI image. The augmentation methods are based on two steps. First, we use horizontal flip or vertical flip as the preliminary augmentation method. Then, we select some non-central pixels in the input blocks to remove spectral information. The different ways in which these pixels are selected can result in different augmentation methods, as illustrated in Algorithms 1 and 2, and Figure 1. The size of the rectangular area in Algorithm 1 is not fixed.
| Algorithm 1 Selecting Random Rectangular Area to Remove Spectral Information. | |
| 1: | Input: input image I; image size . |
| 2: | Output: augmented image . |
| 3: | Generate a matrix of the size () using 1 |
| 4: | Select a random submatrix in this matrix and change the elements inside to 0 |
| 5: | if the center point of the matrix is in the submatrix then |
| 6: | change the element of that point to 1 |
| 7: | end if |
| 8: | for i = 1 to c do |
| 9: | multiply the image in the ith channel by this matrix to obtain the augmented image |
| 10: | end for |
| 11: | Return the augmented image |
Figure 1.
The augmentation methods used in our proposed method.
| Algorithm 2 Selecting Discrete Points to Remove Spectral Information. | |
| 1: | Input: input image I; image size |
| 2: | Output: augmented image |
| 3: | Use 0 and 1 with the same probability to generate a random matrix of the size () |
| 4: | if the center point of the matrix is 0 then |
| 5: | change the element of that point to 1 |
| 6: | end if |
| 7: | for i = 1 to c do |
| 8: | multiply the image in the ith channel by this matrix to obtain the augmented image |
| 9: | end for |
| 10: | Return the augmented image |
3.2. Architectures of Our Experimental Models
Our proposed method is illustrated in 
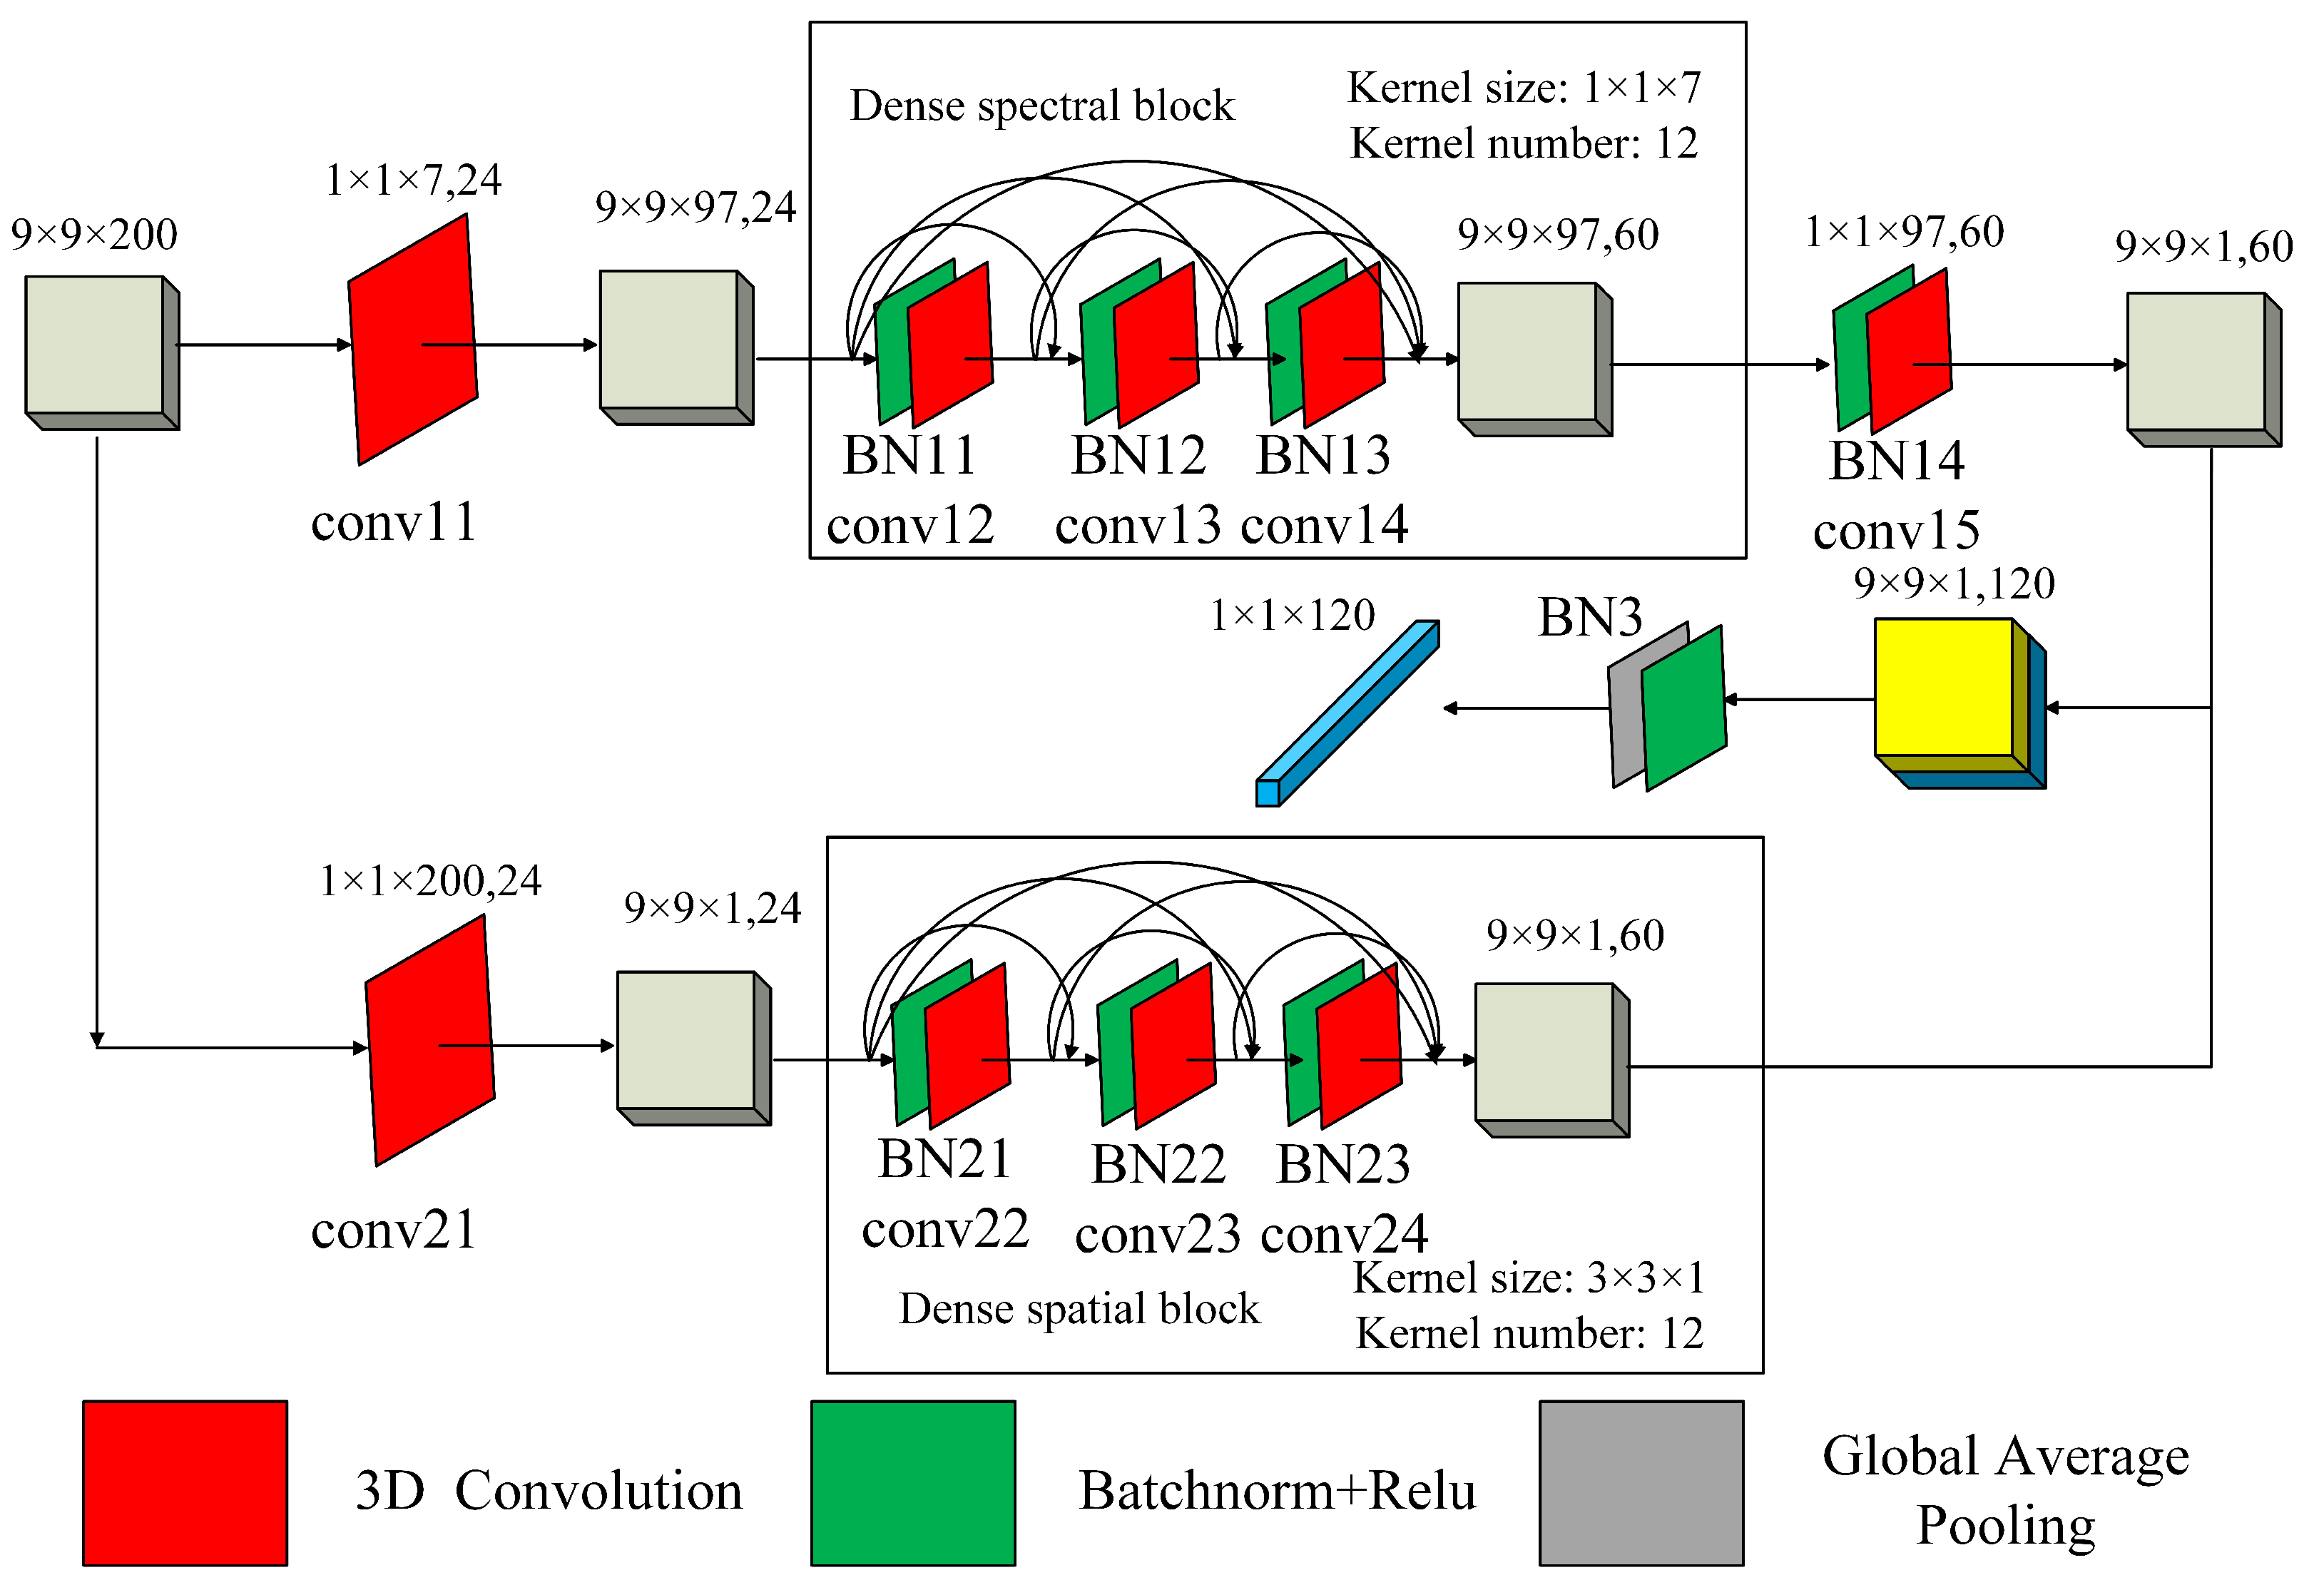
Figure 2. We use a two-branch CNN model as the backbone model. The double-branch architecture can reduce the interference between spectral and spatial features. The backbone of the CNN model is shown in Figure 3. To keep the network architecture the same for different hyperspectral images with different bands, we use the PCA method to reduce the dataset dimension to 100. The parameters of the 3D convolutions and batchnorms in our model are illustrated in Table 1. A detailed introduction of these datasets is presented in 
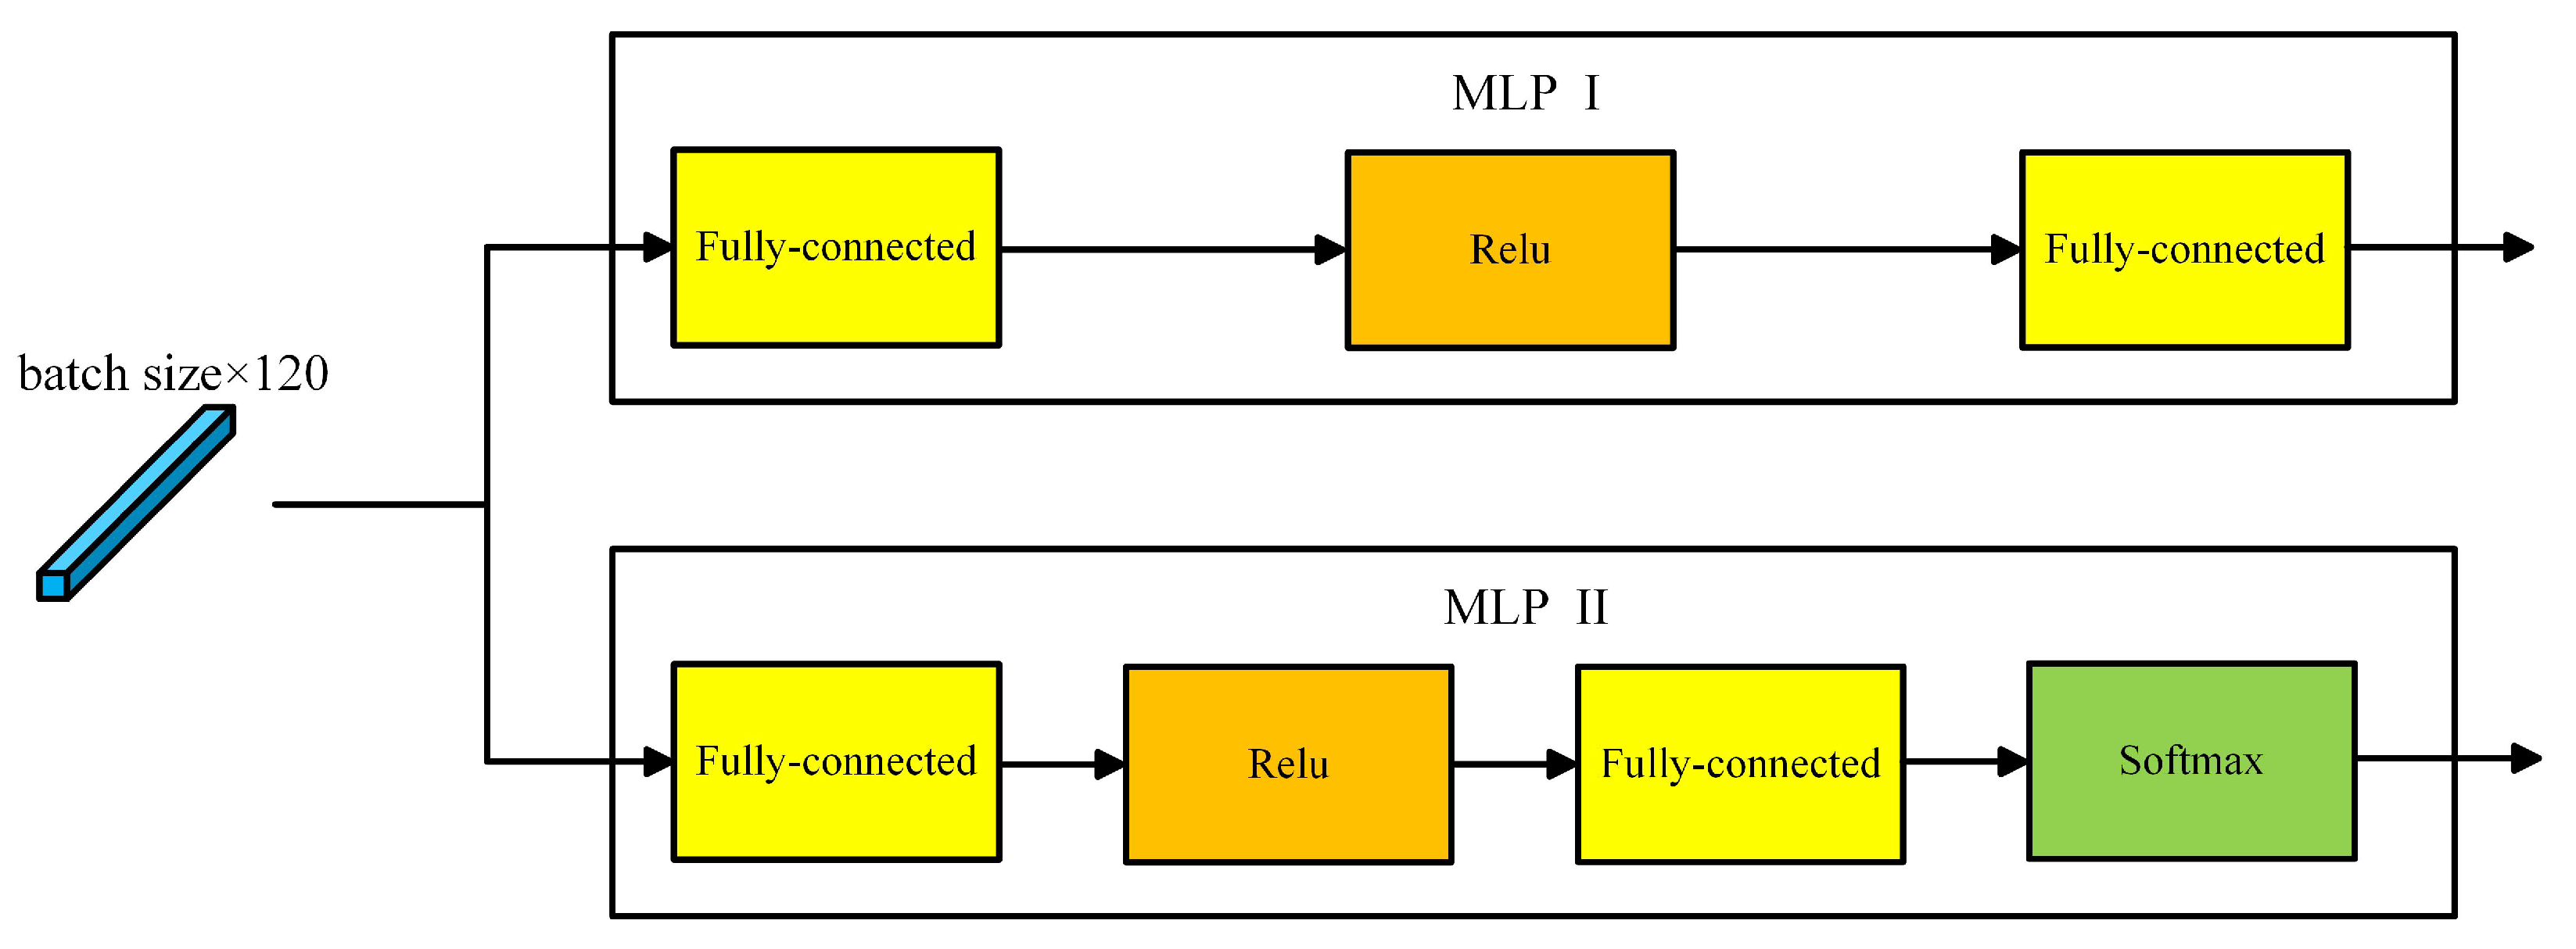
Section 4.1. The two MLPs in our method are shown in Figure 4. The parameters of these MLPs can be seen in Table 2. For MLP II, the final output dimension is equal to the cluster number.
Figure 2.
The overall architecture of our proposed method.
Figure 3.
The architecture of our backbone CNN model.
Table 1.
Parameters of the 3D convolutions and batchnorms in our model.
Figure 4.
The architecture of our MLPs.
Table 2.
Parameters of the two MLPs.
3.3. Summary of Our Experimental Method
The overall architecture of our proposed method is shown in Algorithm 3 and Figure 3. Firstly, we use different augmentations to generate different views of input. Then, we traine the CNN model. After training, we can obtain the features of input HSIs via the CNN model. Finally, we use the spectral clustering algorithm based on the features to obtain the clustering result.
| Algorithm 3 Our proposed clustering algorithm. | |
| 1: | Input: dataset I; pixel block size ; training epochs E; batch size N. |
| 2: | Output: cluster assignments. |
| 3: | Sample pixel block of size from the dataset I |
| 4: | //training |
| 5: | for epoch = 1 to E do |
| 6: | compute instance-level contrastive loss |
| 7: | compute cluster-level contrastive loss |
| 8: | compute overall contrastive loss |
| 9: | update the network |
| 10: | end for |
| 11: | //test |
| 12: | Extract features using the CNN model |
| 13: | Use spectral clustering algorithm to obtain the clustering result |
We utilize overall contrastive loss to guide the training process. The overall contrastive loss consists of two parts: instance-level contrastive loss and cluster-level contrastive loss .
In this paper, the mini-batch size is N. After two types of image augmentations on each input image , our proposed method works based on samples . For a specific sample , there are a positive pair and negative pairs between this sample with the augmented visions of other input images. We can obtain using MLP I. The instance-level contrastive loss is calculated based on the cosine similarity of each pair. The similarity is computed by
where and . The cluster-level contrastive loss is calculated using the following equations.
where is the instance-level temperature parameter. is the loss for the sample and is the loss for the sample .
For cluster-level contrastive loss , we use the MLP II output , . are the two types of image augmentations, N is the batch size, and K is the cluster number. is the ith column of , which is the representation of cluster i under the data augmentation a. There is one positive pair and negative pairs. The cluster-level contrastive loss is calculated based on the cosine similarity of each pair. The similarity is computed by
where and . The instance-level contrastive loss is calculated using the following equations.
where is the cluster-level temperature parameter. is the loss for the sample and is the loss for the sample . H(Y) prevents most instances from being assigned to the same cluster.
The overall contrastive loss is calculated using the following equation:
After training, we can use the model to extract features. Then, we use the spectral clustering algorithm to obtain the final clustering result. To the best of our knowledge, we are the first to propose a contrastive learning-based HSI clustering method. Moreover, we explore the HSI augmentation method that we apply to our proposed clustering method.
4. Experiments
4.1. Experimental Datasets
We conducted experiments using three real HSI datasets: Indian Pines, University of Pavia, and Salinas. For computational efficiency, we used three subsets of these datasets for experiments and analyses, as stated in Figure 5. The details of the three subsets are presented in Table 3. The false-color images were acquired by the Spectral python library using the default library.
Figure 5.
(a–c) False-color images of the Indian Pines, University of Pavia, and Salinas data sets.
Table 3.
Summary of the experimental subsets.
The Indian Pines image was acquired by the AVIRIS sensor over northwestern Indiana. The image has a size of . Due to the water absorption effect, 20 bands were removed.
The University of Pavia dataset was collected by the ROSIS sensor over Pavia, northern Italy. The image has pixels with 103 bands.
The Salinas dataset was gathered by the AVIRIS sensor over Salinas Valley, California. The image consists of pixels. As with the Indian Pines scene, 20 water absorption bands were discarded. The remaining 204 bands are available for processing.
4.2. Evaluation Metrics
We used three metrics—overall accuracy (OA), average accuracy (AA), and kappa coefficient (KAPPA)—to evaluate the performances of all the experimental methods. These metrics vary in [0,1]. The higher the values are, the better the clustering result is.
4.3. Experimental Parameter
We performed all the experiments on a server with four Titan-RTX GPUs and a 125 G memory. Because our proposed method does not require much GPU memory, we only used one Titan-RTX GPU throughout the whole experiment. According to Table 1, the CNN model consumes 7.61 M GPU memory for an input patch. The model was implemented using the Pytorch framework. We used the PCA to reduce the raw data dimension to 100. The input size was . We set the batch size as 128. The learning rate was set to 0.00003. We trained the CNN model for 15 epochs and chose the model with the least training loss for the test. The instance-level temperature parameter was 1. The cluster-level temperature parameter was 0.5. The spectral clustering algorithm was carried out using the scikit-learn python library. We only set the cluster number. Since the kmeans label assignment strategy is unstable, we set the label assignment strategy to discretize. The remaining parameters of the spectral clustering algorithm were the default ones.
4.4. Comparison Methods
To validate the effectiveness of our proposed method, we compared it with several clustering methods, including traditional clustering methods and state-of-the-art methods. Traditional clustering methods are k-means [5], sparse subspace clustering (SSC) [13], elastic net subspace clustering (EnSC) [45], and sparse subspace clustering by orthogonal matching pursuit (SSC-OMP) [46]. The state-of-the-art methods include spectral–spatial sparse subspace clustering [31], spectral–spatial diffusion learning (DLSS) [12], Laplacian regularized deep subspace clustering (LRDSC) [24], and deep spatial–spectral subspace clustering network () [25]. As far as we know, is the most recent method based on deep learning for HSI clustering. The results of SSC, , DLSS, LRDSC, and were gained from the published literature [25]. The k-means clustering was conducted using the scikit-learning python library. We used the public code to implement the EnSC and SSC-OMP methods.
4.5. Result Analysis
4.5.1. Indian Pines
The clustering result gained for the Indian Pines dataset is shown in Table 4 and Figure 6. The spectral information of the Indian Pines dataset is stated in Figure 7. From the table and the figure, we can easily conclude that our proposed method achieved the highest clustering accuracy. Moreover, three deep-learning-based methods, LRDSC, , and our proposed method, performed much better than other traditional clustering methods. Furthermore, the spatial–spectral-based clustering methods, including , DLSS, and the three deep-learning-based methods, achieved a higher accuracy than the spectral-only clustering methods. As can be seen from the table, our proposed method had an at least 15.72% accuracy increase for the Corn-notill class. From Figure 7 and Figure 8, we found that the spectral characteristics of Corn-notill were similar to those of Soybean-mintill. Using our CNN model, it is much easier to cluster the features of Corn-notill and Soybean-mintill.
Table 4.
The clustering results of the Indian Pines dataset. The best results are highlighted in bold.
Figure 6.
The clustering results achieved by different methods on the Indian Pines dataset.
Figure 7.
The spectral information of Indian Pines dataset.
Figure 8.
Visualization of data points of the Indian Pines dataset. Using t-SNE, we reduced the feature dimensionality to 2.
4.5.2. University of Pavia
The clustering result gained for the University of Pavia dataset is indicated in Table 5 and Figure 9. The spectral information of the University of Pavia dataset is stated in Figure 10. It can be seen that our proposed method obtained the highest clustering accuracy. Moreover, similar to the results of the Indian Pines dataset, three deep-learning-based methods—LRDSC, , and our proposed method—performed much better than the other traditional clustering methods, while the spatial–spectral-based clustering methods (including , DLSS, and three deep-learning-based methods) achieved a higher accuracy than the spectral-only clustering methods. As can be seen from the table, in some areas our proposed method achieved a 100% accuracy for the University of Pavia dataset.
Table 5.
The clustering results of the University of Pavia dataset. The best results are highlighted in bold.
Figure 9.
The clustering results of different methods on the Pavia University dataset.
Figure 10.
The spectral information of the University of Pavia dataset.
It should, however, be noted that for the University of Pavia dataset, our proposed method obtained a 0% accuracy for some classes. We think the reason for is that the pixel number was too low. In fact, trees, self-blocking bricks, and shadows were the three least numerous sample types. According to the Figure 10 and Figure 11, the spectral characteristics of trees are very different to those of other sample types. Taking these two factors together, our proposed method only achieved an accuracy of 49.2% for trees, while the accuracy was 0% for self-blocking bricks and shadows.
Figure 11.
Visualization of the data points of the University of Pavia dataset. Using t-SNE, we reduced the feature dimensionality to 2.
4.5.3. Salinas
The clustering result of the Salinas dataset is presented in Table 6 and Figure 12. The spectral information of the Salinas dataset is illustrated in Figure 13. Our proposed method obtained the highest clustering accuracy. This is different from the results of the Indian Pines dataset and the University of Pavia dataset, where many methods, including all spatial–spectral methods and one spectral-only method, SSC-OMP, achieved an OA higher than 80%. From Figure 13 and Figure 14, we can see that the spectral characteristics of Fallow_rough_plow, Fallow_smooth, Stubble, and Celery are easy to cluster. However, the spectral characteristics of Grapes_untrained and Vineyard_untrained are very similar. Moreover, the pixels belonging to these two categories are distributed in the neighboring areas. All these methods used for comparison with our proposed method achieved a high accuracy for Grapes_untrained but a very low accuracy for Vineyard_untrained. Considering that the sample number of each class is quite close, we think that this phenomenon dramatically affects the overall accuracy.
Table 6.
The clustering results achieved for the Salinas dataset. The best results are highlighted in bold.
Figure 12.
The clustering results of different methods on the Salinas dataset.
Figure 13.
The spectral information of the Salinas dataset.
Figure 14.
Visualization of the data points of the Salinas dataset. Using t-SNE, we reduced the feature dimensionality to 2.
From Figure 8, Figure 11 and Figure 14, we can see that the features show better clustering characteristics than the original data. After training, the CNN model can extract the features under unsupervised conditions efficiently. For example, in the Indian Pines image, Corn-notill, Soybean-notill, and Soybean-mintill are difficult to cluster, as these three kinds of samples have similar spectral characteristics. Using the CNN model to obtain the features, it can be seen that these three kinds of features are easier to cluster. For the University of Pavia dataset, meadows, bare soil, asphalt, and bitumen are easy to cluster; for the Salinas dataset, Grapes_untrained and Vinyard_untrained are easy to cluster. These samples are also easier to cluster when the CNN model is used to obtain the features.
5. Discussion
5.1. Influence of Patch Size
The input patch size is important for the 3D CNN for HSI classification. We set the input patch size to , , , and . The classification result is shown in Table 7. From the results, we can see that is the best patch size for our proposed method.
Table 7.
Accuracy with different input patch sizes. The best value in a row is bolded.
5.2. Influence of Data Augmentation Methods
To find the best augmentation method for HSI clustering, we conducted several experiments. We used no flip, only selected discrete points, only selected random rectangular areas, and used rotation instead of flips and compared the performance. The results are presented in Table 8. From the results, we can see our proposed method did not achieve the best accuracy over the Indian Pines dataset and Salinas datasets. However, the differences are very small. Moreover, selecting only discrete points or rectangular areas can provide very different results in different datasets. These two methods are weakly robust.
Table 8.
Accuracy obtained with different augmentation methods. The best value in a row is bolded.
5.3. Influence of Spectral Clustering
K-means and spectral clustering are two commonly used clustering methods. Here, we compare the performance of our proposed method based on spectral clustering and our method based on K-means clustering. The results are shown in Table 9. As shown in Table 9, our proposed method based on spectral clustering surpasses the performance of our method based on K-means clustering.
Table 9.
Accuracy with K-means clustering and spectral clustering. The best results obtained for each dataset are bolded.
5.4. Running Time and Complexity
The running time of our proposed method is presented in Table 10. From the table, we can see that training the CNN model consumes most of the time. Since the input patch size for different datasets is the same, we believe that the computational complexity of training the model is O(n). As for spectral clustering, the computational complexity is O(n) [47], and the space complexity is O(n) [48]. Because of the space complexity, we cannot conduct our proposed method on the complete hyperspectral images.
Table 10.
The running time of our proposed method.
6. Conclusions and Future Research
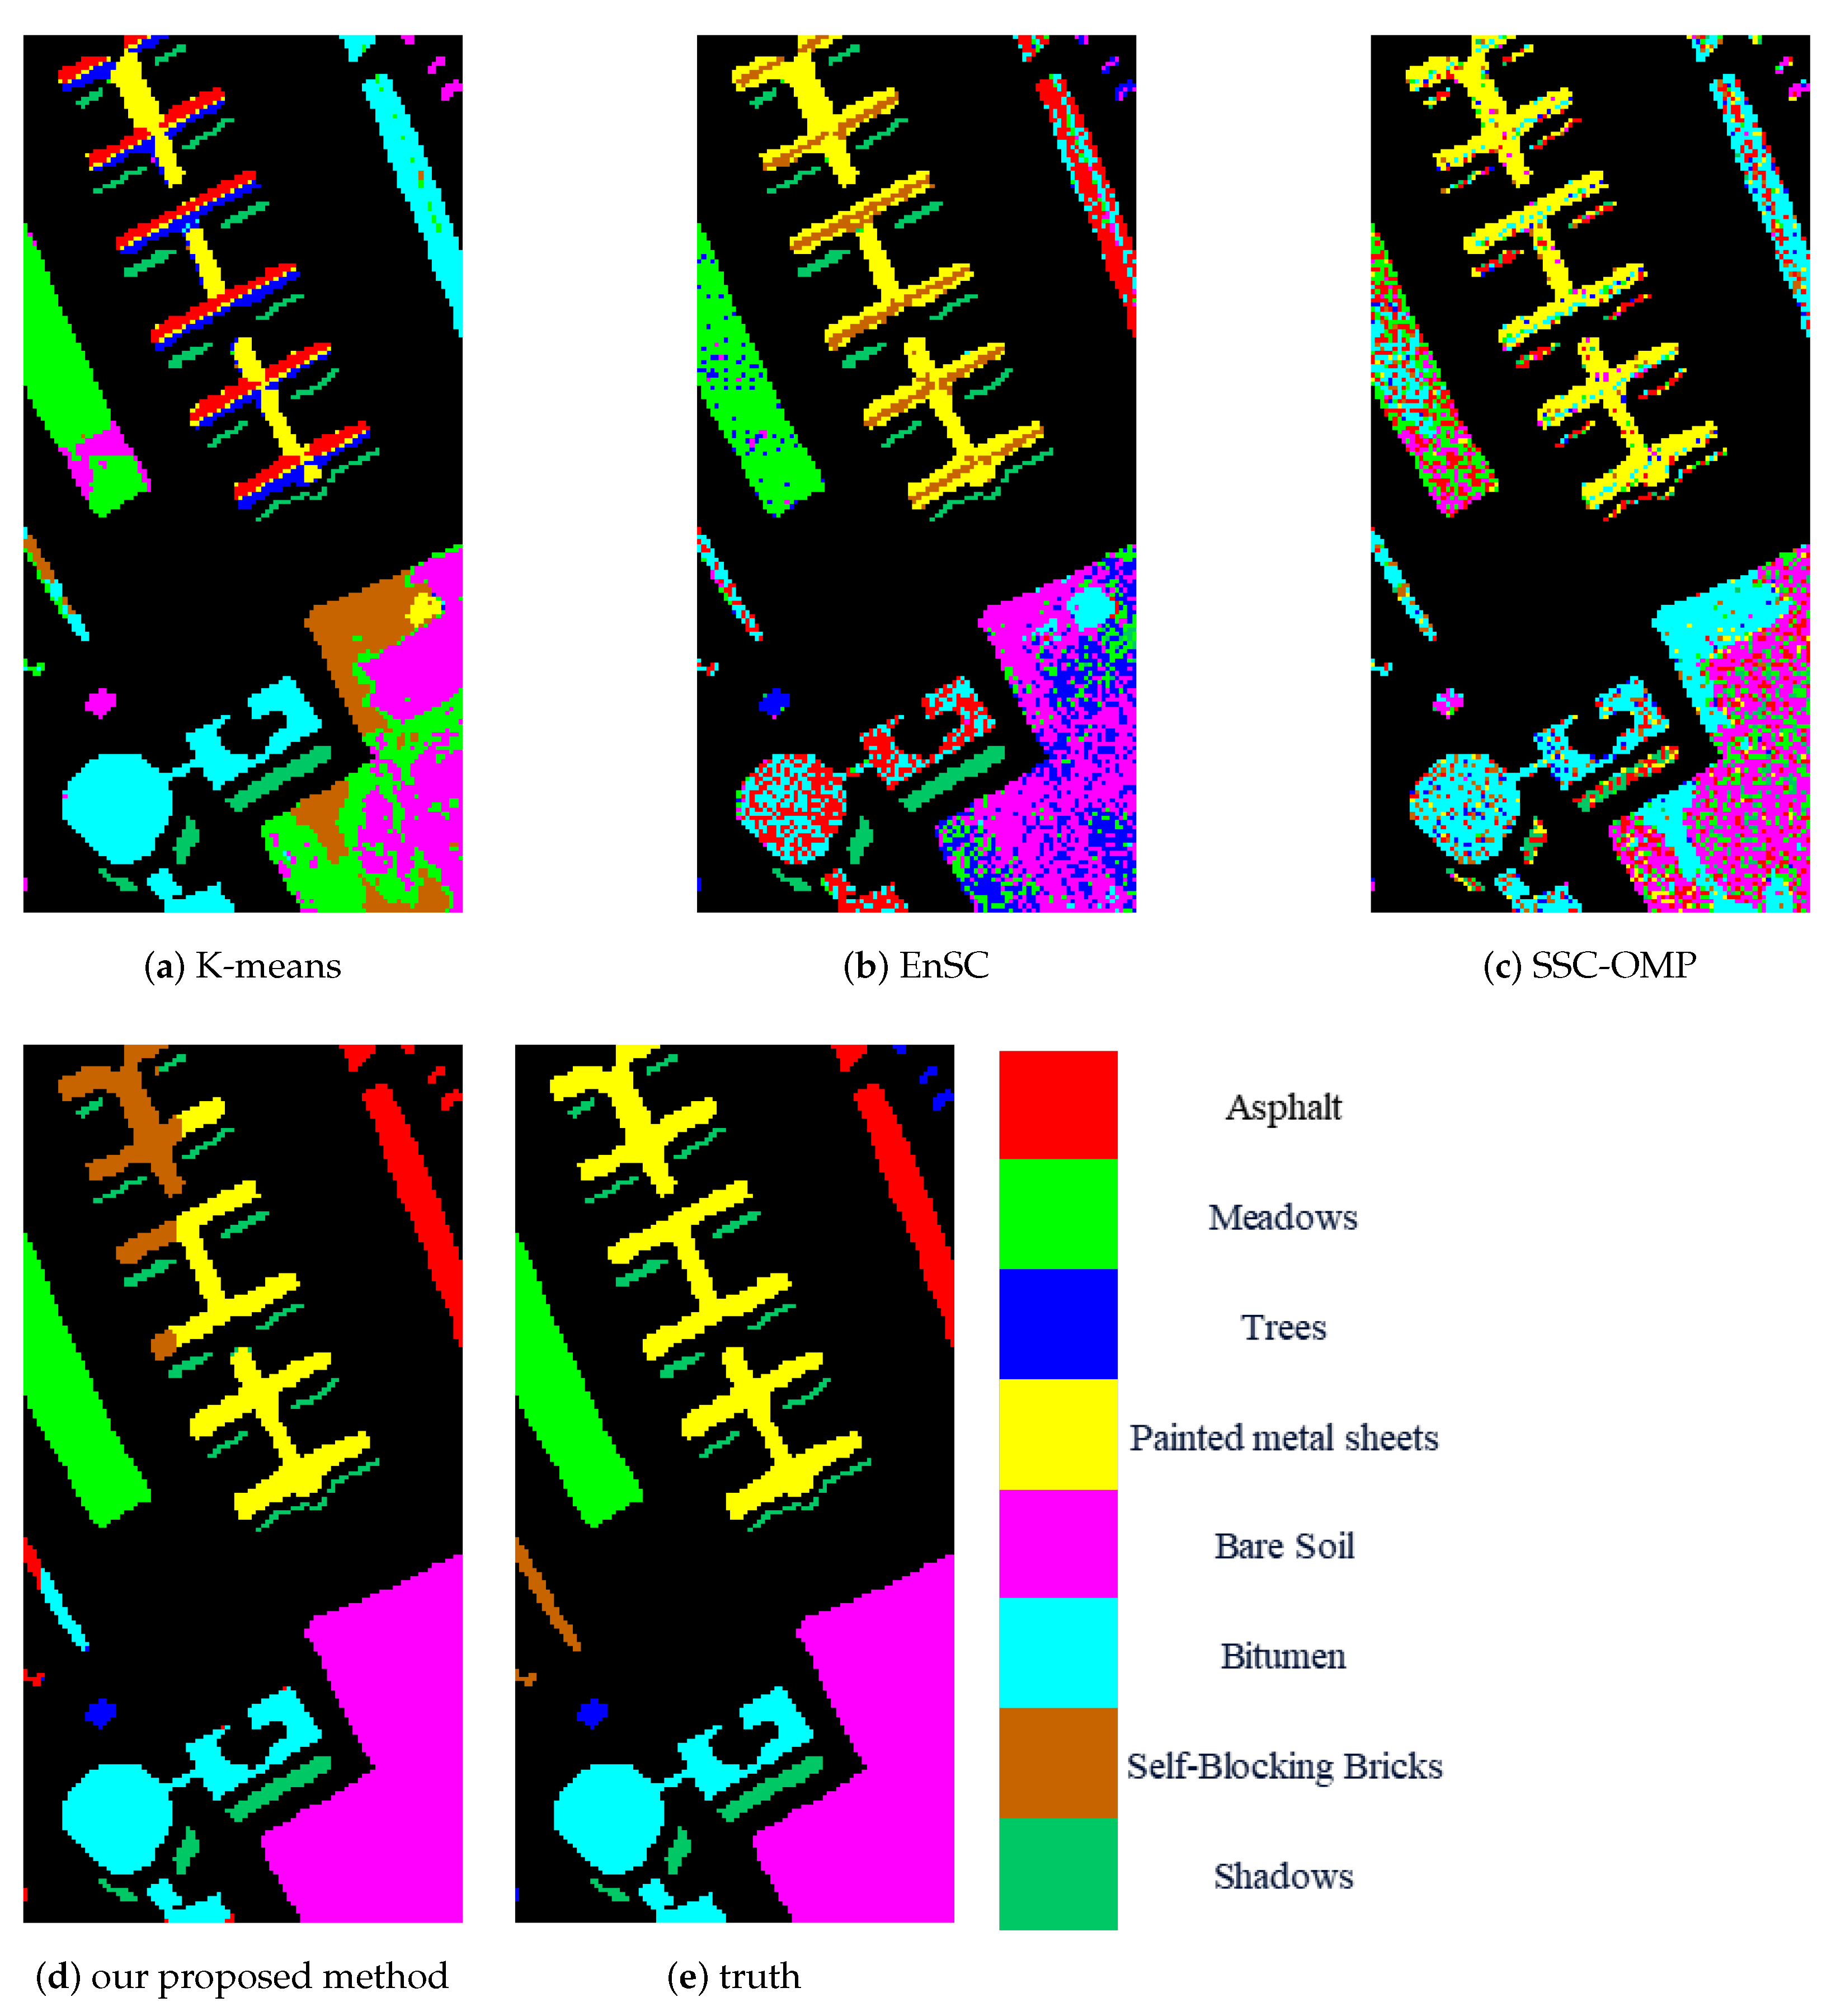
In this paper, we proposed a contrastive learning method for HSI clustering. The contrastive learning method extracts spatial–spectral information based on different augmented views of HSI. We removed the spectral information of some non-central pixels to augment the HSIs. Different methods of selecting the pixels to remove spectral information can be regarded as different augmentation methods. Based on the augmented views of samples, the CNN model was trained under supervision using instance-level and cluster-level contrastive loss. After training, the CNN model was used to extract features from input pixel blocks. Finally, according to the features, we conducted spectral clustering to obtain the clustering result. The experimental results achieved on three public datasets confirmed the superiority of our proposed method. However, our proposed method also has some disadvantages. Because spectral clustering has the computational complexity of O(n) and the space complexity of O(n), it is not suitable for use on large datasets.
In the future, we will focus on HSI data augmentation. More augmentation methods for use on HSIs will be studied, such as rotation, GAN-based augmentation, and so on. We will also try to find a more effective method for selecting non-central pixels to remove the corresponding spectral information. Moreover, we will try to study our proposed method under more challenging conditions, such as luminosity, atmospheric conditions, spatial data sparsity, and noisy spectral data.
Author Contributions
X.H. and T.Z. implemented the algorithms, designed the experiments, and wrote the paper; X.H. performed the experiments; Y.P. and T.L. guided the research. All authors have read and agreed to the published version of the manuscript.
Funding
This research was partially supported by the National Key Research and Development Program of China (No. 2017YFB1301104 and 2017YFB1001900), the National Natural Science Foundation of China (No. 91648204 and 61803375), and the National Science and Technology Major Project.
Institutional Review Board Statement
Not applicable.
Informed Consent Statement
Not applicable.
Data Availability Statement
The datasets involved in this paper are all public datasets.
Acknowledgments
The authors acknowledge the State Key Laboratory of High-Performance Computing, College of Computer, National University of Defense Technology, China.
Conflicts of Interest
The authors declare no conflict of interest.
Abbreviations
The following abbreviations are used in this manuscript:
| HSI | Hyperspectral image; |
| SSC | Sparse subspace clustering; |
| CNN | Convolutional neural networks; |
| MLP | Multilayer perceptron. |
References
- Zhao, C.; Wang, Y.; Qi, B.; Wang, J. Global and local real-time anomaly detectors for hyperspectral remote sensing imagery. Remote Sens. 2015, 7, 3966–3985. [Google Scholar] [CrossRef] [Green Version]
- Awad, M.; Jomaa, I.; Arab, F. Improved capability in stone pine forest mapping and management in Lebanon using hyperspectral CHRIS-Proba data relative to Landsat ETM+. Photogramm. Eng. Remote Sens. 2014, 80, 725–731. [Google Scholar] [CrossRef]
- Ibrahim, A.; Franz, B.; Ahmad, Z.; Healy, R.; Knobelspiesse, K.; Gao, B.C.; Proctor, C.; Zhai, P.W. Atmospheric correction for hyperspectral ocean color retrieval with application to the Hyperspectral Imager for the Coastal Ocean (HICO). Remote Sens. Environ. 2018, 204, 60–75. [Google Scholar] [CrossRef] [Green Version]
- Rodriguez, A.; Laio, A. Clustering by fast search and find of density peaks. Science 2014, 344, 1492–1496. [Google Scholar] [CrossRef] [Green Version]
- Hartigan, J.A.; Wong, M.A. Algorithm AS 136: A k-means clustering algorithm. J. R. Stat. Soc. Ser. (Appl. Stat.) 1979, 28, 100–108. [Google Scholar] [CrossRef]
- Maggioni, M.; Murphy, J.M. Learning by Unsupervised Nonlinear Diffusion. J. Mach. Learn. Res. 2019, 20, 1–56. [Google Scholar]
- Ester, M.; Kriegel, H.P.; Sander, J.; Xu, X. A density-based algorithm for discovering clusters in large spatial databases with noise. In Proceedings of the Second International Conference on Knowledge Discovery and Data Mining, KDD, Portland, OR, USA, 2–4 August 1996; Volume 96, pp. 226–231. [Google Scholar]
- Roy, S.; Bhattacharyya, D.K. An approach to find embedded clusters using density based techniques. In Proceedings of the International Conference on Distributed Computing and Internet Technology, Bhubaneswar, India, 22–24 December 2005; pp. 523–535. [Google Scholar]
- Cariou, C.; Le Moan, S.; Chehdi, K. Improving k-nearest neighbor approaches for density-based pixel clustering in hyperspectral remote sensing images. Remote Sens. 2020, 12, 3745. [Google Scholar] [CrossRef]
- Chen, S.; Zhang, D. Robust image segmentation using FCM with spatial constraints based on new kernel-induced distance measure. IEEE Trans. Syst. Man, Cybern. Part B (Cybern.) 2004, 34, 1907–1916. [Google Scholar] [CrossRef] [PubMed] [Green Version]
- Lin, J.; He, C.; Wang, Z.J.; Li, S. Structure preserving transfer learning for unsupervised hyperspectral image classification. IEEE Geosci. Remote Sens. Lett. 2017, 14, 1656–1660. [Google Scholar] [CrossRef]
- Murphy, J.M.; Maggioni, M. Unsupervised clustering and active learning of hyperspectral images with nonlinear diffusion. IEEE Trans. Geosci. Remote Sens. 2018, 57, 1829–1845. [Google Scholar] [CrossRef] [Green Version]
- Elhamifar, E.; Vidal, R. Sparse subspace clustering: Algorithm, theory, and applications. IEEE Trans. Pattern Anal. Mach. Intell. 2013, 35, 2765–2781. [Google Scholar] [CrossRef] [Green Version]
- Liu, Y.; Dou, Y.; Jin, R.; Li, R.; Qiao, P. Hierarchical learning with backtracking algorithm based on the visual confusion label tree for large-scale image classification. Vis. Comput. 2021, 1–21. [Google Scholar] [CrossRef]
- Liu, Y.; Dou, Y.; Jin, R.; Qiao, P. Visual tree convolutional neural network in image classification. In Proceedings of the 2018 24th International Conference on Pattern Recognition (ICPR), Beijing, China, 20–24 August 2018; pp. 758–763. [Google Scholar]
- Nagpal, C.; Dubey, S.R. A performance evaluation of convolutional neural networks for face anti spoofing. In Proceedings of the 2019 International Joint Conference on Neural Networks (IJCNN), Budapest, Hungary, 14–19 July 2019; pp. 1–8. [Google Scholar]
- Ren, S.; He, K.; Girshick, R.; Sun, J. Faster R-CNN: Towards real-time object detection with region proposal networks. IEEE Trans. Pattern Anal. Mach. Intell. 2016, 39, 1137–1149. [Google Scholar] [CrossRef] [Green Version]
- Zhong, Z.; Li, J.; Luo, Z.; Chapman, M. Spectral–spatial residual network for hyperspectral image classification: A 3-D deep learning framework. IEEE Trans. Geosci. Remote Sens. 2017, 56, 847–858. [Google Scholar] [CrossRef]
- He, K.; Zhang, X.; Ren, S.; Sun, J. Deep residual learning for image recognition. In Proceedings of the IEEE Conference on Computer Vision and Pattern Recognition, Las Vegas, NV, USA, 27–30 June 2016; pp. 770–778. [Google Scholar]
- Huang, G.; Liu, Z.; Van Der Maaten, L.; Weinberger, K.Q. Densely connected convolutional networks. In Proceedings of the IEEE Conference on Computer Vision and Pattern Recognition, Honolulu, HI, USA, 21–26 July 2017; pp. 4700–4708. [Google Scholar]
- Wang, W.; Dou, S.; Jiang, Z.; Sun, L. A fast dense spectral–spatial convolution network framework for hyperspectral images classification. Remote Sens. 2018, 10, 1068. [Google Scholar] [CrossRef] [Green Version]
- Ma, W.; Yang, Q.; Wu, Y.; Zhao, W.; Zhang, X. Double-branch multi-attention mechanism network for hyperspectral image classification. Remote Sens. 2019, 11, 1307. [Google Scholar] [CrossRef] [Green Version]
- Li, R.; Zheng, S.; Duan, C.; Yang, Y.; Wang, X. Classification of hyperspectral image based on double-branch dual-attention mechanism network. Remote Sens. 2020, 12, 582. [Google Scholar] [CrossRef] [Green Version]
- Zeng, M.; Cai, Y.; Liu, X.; Cai, Z.; Li, X. Spectral-spatial clustering of hyperspectral image based on Laplacian regularized deep subspace clustering. In Proceedings of the IGARSS 2019—2019 IEEE International Geoscience and Remote Sensing Symposium, Yokohama, Japan, 28 July–2 August 2019; pp. 2694–2697. [Google Scholar]
- Lei, J.; Li, X.; Peng, B.; Fang, L.; Ling, N.; Huang, Q. Deep spatial-spectral subspace clustering for hyperspectral image. IEEE Trans. Circuits Syst. Video Technol. 2020, 31, 2686–2697. [Google Scholar] [CrossRef]
- Li, Y.; Hu, P.; Liu, Z.; Peng, D.; Zhou, J.T.; Peng, X. Contrastive clustering. In Proceedings of the 2021 AAAI Conference on Artificial Intelligence (AAAI), Vancouver, BC, Canada, 2–9 February 2021. [Google Scholar]
- Paoli, A.; Melgani, F.; Pasolli, E. Clustering of hyperspectral images based on multiobjective particle swarm optimization. IEEE Trans. Geosci. Remote Sens. 2009, 47, 4175–4188. [Google Scholar] [CrossRef]
- Zhong, Y.; Zhang, L.; Gong, W. Unsupervised remote sensing image classification using an artificial immune network. Int. J. Remote Sens. 2011, 32, 5461–5483. [Google Scholar] [CrossRef]
- Zhai, H.; Zhang, H.; Zhang, L.; Li, P. Laplacian-regularized low-rank subspace clustering for hyperspectral image band selection. IEEE Trans. Geosci. Remote Sens. 2018, 57, 1723–1740. [Google Scholar] [CrossRef]
- Tian, L.; Du, Q.; Kopriva, I.; Younan, N. Spatial-spectral Based Multi-view Low-rank Sparse Sbuspace Clustering for Hyperspectral Imagery. In Proceedings of the IGARSS 2018—2018 IEEE International Geoscience and Remote Sensing Symposium, Valencia, Spain, 22–27 July 2018; pp. 8488–8491. [Google Scholar]
- Zhang, H.; Zhai, H.; Zhang, L.; Li, P. Spectral–spatial sparse subspace clustering for hyperspectral remote sensing images. IEEE Trans. Geosci. Remote Sens. 2016, 54, 3672–3684. [Google Scholar] [CrossRef]
- Xie, J.; Girshick, R.; Farhadi, A. Unsupervised deep embedding for clustering analysis. In Proceedings of the International Conference on Machine Learning, New York, NY, USA, 9–14 June 2016; pp. 478–487. [Google Scholar]
- Chang, J.; Wang, L.; Meng, G.; Xiang, S.; Pan, C. Deep adaptive image clustering. In Proceedings of the IEEE International Conference on Computer Vision, Venice, Italy, 22–29 October 2017; pp. 5879–5887. [Google Scholar]
- Fard, M.M.; Thonet, T.; Gaussier, E. Deep k-means: Jointly clustering with k-means and learning representations. Pattern Recognit. Lett. 2020, 138, 185–192. [Google Scholar] [CrossRef]
- Barthakur, M.; Sarma, K.K. Semantic Segmentation using K-means Clustering and Deep Learning in Satellite Image. In Proceedings of the 2019 2nd International Conference on Innovations in Electronics, Signal Processing and Communication (IESC), Shillong, India, 1–2 March 2019; pp. 192–196. [Google Scholar]
- Sodjinou, S.G.; Mohammadi, V.; Mahama, A.T.S.; Gouton, P. A deep semantic segmentation-based algorithm to segment crops and weeds in agronomic color images. Inf. Process. Agric. 2021. [Google Scholar] [CrossRef]
- Ji, P.; Zhang, T.; Li, H.; Salzmann, M.; Reid, I. Deep subspace clustering networks. arXiv 2017, arXiv:1709.02508. [Google Scholar]
- Mukherjee, S.; Asnani, H.; Lin, E.; Kannan, S. Clustergan: Latent space clustering in generative adversarial networks. In Proceedings of the AAAI Conference on Artificial Intelligence, Honolulu, HI, USA, 27 January–1 February 2019; Volume 33, pp. 4610–4617. [Google Scholar]
- Chen, X.; Duan, Y.; Houthooft, R.; Schulman, J.; Sutskever, I.; Abbeel, P. Infogan: Interpretable representation learning by information maximizing generative adversarial nets. In Proceedings of the 30th International Conference on Neural Information Processing Systems, Barcelona, Spain, 5–10 December 2016; pp. 2180–2188. [Google Scholar]
- Egaña, Á.F.; Santibáñez-Leal, F.A.; Vidal, C.; Díaz, G.; Liberman, S.; Ehrenfeld, A. A Robust Stochastic Approach to Mineral Hyperspectral Analysis for Geometallurgy. Minerals 2020, 10, 1139. [Google Scholar] [CrossRef]
- Xu, J.; Li, H.; Liu, P.; Xiao, L. A novel hyperspectral image clustering method with context-aware unsupervised discriminative extreme learning machine. IEEE Access 2018, 6, 16176–16188. [Google Scholar] [CrossRef]
- Chen, T.; Kornblith, S.; Norouzi, M.; Hinton, G. A simple framework for contrastive learning of visual representations. In Proceedings of the International Conference on Machine Learning, Online, 13–18 July 2020; pp. 1597–1607. [Google Scholar]
- He, K.; Fan, H.; Wu, Y.; Xie, S.; Girshick, R. Momentum contrast for unsupervised visual representation learning. In Proceedings of the IEEE/CVF Conference on Computer Vision and Pattern Recognition, Seattle, WA, USA, 14–19 June 2020; pp. 9729–9738. [Google Scholar]
- Grill, J.B.; Strub, F.; Altché, F.; Tallec, C.; Richemond, P.H.; Buchatskaya, E.; Doersch, C.; Pires, B.A.; Guo, Z.D.; Azar, M.G.; et al. Bootstrap your own latent: A new approach to self-supervised learning. arXiv 2020, arXiv:2006.07733. [Google Scholar]
- You, C.; Li, C.G.; Robinson, D.P.; Vidal, R. Oracle based active set algorithm for scalable elastic net subspace clustering. In Proceedings of the IEEE Conference on Computer Vision and Pattern Recognition, Las Vegas, NV, USA, 27–30 June 2016; pp. 3928–3937. [Google Scholar]
- You, C.; Robinson, D.; Vidal, R. Scalable sparse subspace clustering by orthogonal matching pursuit. In Proceedings of the IEEE Conference on Computer Vision and Pattern Recognition, Las Vegas, NV, USA, 27–30 June 2016; pp. 3918–3927. [Google Scholar]
- Yan, D.; Huang, L.; Jordan, M.I. Fast approximate spectral clustering. In Proceedings of the 15th ACM SIGKDD International Conference on Knowledge Discovery and Data Mining, Paris, France, 28 June–1 July 2009; pp. 907–916. [Google Scholar]
- Mall, R.; Langone, R.; Suykens, J.A. Kernel Spectral Clustering for Big Data Networks. Entropy 2013, 15, 1567–1586. [Google Scholar] [CrossRef] [Green Version]
Publisher’s Note: MDPI stays neutral with regard to jurisdictional claims in published maps and institutional affiliations. |
© 2021 by the authors. Licensee MDPI, Basel, Switzerland. This article is an open access article distributed under the terms and conditions of the Creative Commons Attribution (CC BY) license (https://creativecommons.org/licenses/by/4.0/).