Article

Southwestern Atlantic Ocean Fronts Detected from Satellite-Derived SST and Chlorophyll

1
College of Information Science and Engineering, Ocean University of China, No.238 Songling Road, Qingdao 266100, China
2
Qingdao National Laboratory for Marine Science and Technology, No.1 Wenhai Road, Qingdao 266200, China
*
Author to whom correspondence should be addressed.
Remote Sens. 2021, 13(21), 4402; https://doi.org/10.3390/rs13214402
Submission received: 19 September 2021 / Revised: 17 October 2021 / Accepted: 29 October 2021 / Published: 1 November 2021
(This article belongs to the Section Ocean Remote Sensing)

Abstract

:
The Southern Ocean front (SOF) is an important factor that affects the heat exchange and material transport of the Southern Ocean. In the past two decades, with the advancements in satellite remote-sensing technology, the study of the spatio-temporal variability of the Southern Ocean front has become a new hot topic. Nevertheless, the southwestern Atlantic, as an important part of the Southern Ocean, is poorly studied in this regard. Based on the 16-year (2004–2019) high-resolution satellite observations of sea surface temperature (SST) and 13-year (2007–2019) observations of chlorophyll (CHL), this study detected and analyzed the position and seasonal variation of the SOF in the southwestern Atlantic using a gradient-based frontal detection method. According to the experimental results, the thermal front (derived from the SST data) disappeared in winter due to the spatially uniform surface cooling, whereas the ocean color front (derived from the CHL data) existed without remarkable spatio-temporal changes. Furthermore, the exact position and seasonal variation of the SOF in the southwestern Atlantic are determined by comparing the paths of the two fronts. Since the formation of the Kuroshio front in the East China Sea (ECS) is similar to the SOF in the southwestern Atlantic, the seasonal distributions of the two fronts were compared. Apart from that, the Kuroshio thermal fronts were mostly distributed in winter and less in summer, while the Southern Ocean thermal fronts showed the opposite. These results indicated that the ocean current properties significantly influence the spatio-temporal variability of the front.

Graphical Abstract

1. Introduction

The southwestern Atlantic, located to the southeast of South America, includes a continental shelf to the northwest and a broad Argentine Basin to the southeast. As a part of the Southern Ocean, it is connected to the Pacific and Antarctic through the Drake Passage (Figure 1). Between the subtropical waters and the Antarctic Peninsula, the southwestern Atlantic is characterized by a sequence of currents and associated hydrographical features, including frontal systems. From north to south, the most pronounced currents are the Brazil Current [1], the Malvinas [2,3] or Falkland Current [4], the South Atlantic Current in the Subtropical Convergence [5], and the Antarctic Circumpolar Current (ACC) [6,7,8]. At large scales, the Southern Ocean is characterized by the intense eastward-flowing ACC. Connecting the three oceans in the world, the ACC significantly influences the environment of Antarctica, the transport of materials in the Southern Ocean, and climate change [9,10]. The Falkland Current, as a tributary of the ACC at Cape Horn and the main source of cooling and oceanic materials of open-ocean origin, plays an important role in the transport of material and the regional frontogenesis in the southwestern Atlantic [11].
Observations dating back to the Discovery Expedition have revealed that the ACC consists of large-scale hydrographic fronts [6]. The front refers to the boundary of different water masses in the ocean and has a narrow and long strip structure characterized by enhanced horizontal gradients of temperature, salinity, density, etc. [12]. In the frontal regions, water mass properties change rapidly [13]. It is noteworthy that the Southern Ocean front (SOF) plays an important role in the global climate system. However, the seasonal variability of both the strength and position of Southern Ocean fronts is still poorly understood. With the development of satellite remote-sensing technology, increasing numbers of researchers are using the satellite remote-sensing data with better space–time continuity, so that the SOF study enters a new stage. A sea surface temperature (SST) front is widely used to identify an ocean front at the surface, because temperature largely represents the character of a water mass, and the corresponding observations are abundant [14]. SST data, which was first used to analyze the SOF [15,16], remains in use currently [17]. In addition, Southern Ocean fronts also influence the ecology of the Southern Ocean from the base to the top of the trophic chain. It was observed that the chlorophyll (CHL) concentration near the South American continental shelf was higher than that in the Southern Ocean due to the influence of the SOF [18,19,20,21]. Therefore, CHL data plays a significant role in studying the distribution of the SOF in the southwestern Atlantic.
Geographically, the 200 m isobath line tends to be used as the dividing line between the continental shelf and the continental slope. Between the 200 m and 1000 m isobaths is the continental slope break zone, where the property of the water is prone to dramatic changes due to the increase in depth [22]. As shown in Figure 1, the 200 m isobath divides the southwestern Atlantic into the South American shelf water and the Falkland Current water. Moreover, the Falkland Current invades the shelf water from south to north. Under the influence of the Brazil Current, the South American continental shelf water is warmer. Since the ACC is the strongest cold current in the South Hemisphere, the Falkland Current (a part of the ACC in the southwestern Atlantic) is cooler than the shelf water. Thus, the Southern Ocean fronts are easily generated between these two water masses with distinct temperature differences. Indeed, detecting the Southern Ocean thermal front with the SST data has been an effective method to investigate the position and seasonal distribution of the SOF [23]. Thus, many studies use proxies for SST from a single core site [24,25]. However, in winter, the increasing surface cooling effects make SSTs uniform, and the thermal front disappears. Obviously, there are some limitations to detecting the position of the SOF only by SST, and it is necessary to introduce a new tracer to detect the SOF. Since the upwelling of deep waters supplies the Southern Ocean with large quantities of nitrates, phosphates, and silicates, the Southern Ocean is a known “high-nutrient, low-CHL” zone due to iron limitation [18,26]. Apart from that, the concentration of CHL in the South American shelf water is relatively high [18,19,20,21]. Therefore, it is feasible to use the Southern Ocean color front (derived from the CHL data) to explore the distribution position and seasonal spatio-temporal variation of the SOF in the southwestern Atlantic. In this paper, the Southern Ocean thermal front (derived from the SST data) and the Southern Ocean color front (derived from the CHL data) were used to investigate the position and seasonal spatio-temporal variation of the SOF in the southwestern Atlantic, which could effectively avoid the disappearance of the thermal front in winter caused by the SST’s uniformity. Furthermore, the paths of the two fronts were compared to determine the exact position and seasonal variation of the SOF in the southwestern Atlantic. Similar to the formation of the Kuroshio front in the East China Sea (ECS), the SOF in the southwestern Atlantic is caused by the intrusion of a strong current into shelf water. However, the Falklands Current (a strong cold current) and the Kuroshio (a strong warm current) have different ocean current properties. In order to explore the effect of ocean current properties on seasonal spatio-temporal variations of fronts, this study compared the seasonal distribution of the two fronts and then analyzed the results.
The rest of the paper is organized as follows. Section 2 introduces the multisource data used in the research, as well as the method for detecting the SOF. Then, the distribution of thermal fronts and ocean color fronts in the southwestern Atlantic are explained in Section 3. Some comparison experiments and the influence of ocean current properties on the seasonal spatio-temporal variation of the fronts are discussed in the Section 4, and in the last section, some conclusions are drawn.

2. Materials and Methods

2.1. Multisource Data

The daily optimum interpolated (OI) SST data [27] with a spatial resolution of 9 km spanning 16 years from January 2004 to December 2019 were obtained from the Remote Sensing Systems (RSS) (http://www.remss.com/measurements/sea-surface-temperature/, accessed on 18 September 2021). In addition, the SST data were used to detect Southern Ocean thermal fronts in the southwestern Atlantic. As a near-real time product, it uses microwave and infrared data (MW_IR) at a 9 km resolution [28], and combines the through-cloud capabilities of the microwave data with the high spatial resolution and near-coastal capability of the infrared SST data, making it an ideal choice for research activities in which a complete, daily SST map is desirable. The CHL data [29] for 13 years (from January 2007 to December 2019) of daily 0.25 × 0.25 gridded estimates, which were derived from satellite measurements of ocean color by the Moderate Resolution Imaging Spectroradiometer (MODIS), were adopted to detect Southern Ocean color fronts in the southwestern Atlantic (available online at https://hermes.acri.fr). Meanwhile, the topographical data were obtained from the National Geophysical Data Center, an office of the National Oceanic and Atmospheric Administration (NOAA). The set of bottom topography data was the ETOP01 [30].

2.2. Methodology

Three approaches were mainly used for detecting Southern Ocean fronts: the probability density function (PDF) method [31], the contour method [32,33], and the gradient method [34]. The PDF method relies on the collection of multiple points to construct meaningful PDFs, while the contour method seeks to identify some quantities, such as a particular value of SST or sea surface height (SSH), that one can use to identify a front over some regions or even over the entire ACC. Gradient thresholding is based on the gradient of some quantity (typically SST or SSH) that exceeds some pre-defined thresholds. Generally speaking, detecting Southern Ocean fronts with the PDF and contour methods is continuous in space, but they can easily miss the front in comparison to gradient thresholding.
In this study, a gradient-based edge-detection method was utilized to detect the SOF in the southwestern Atlantic. The algorithm calculated the SST gradient and CHL gradient at each pixel. First, a Gaussian filter was adopted to make the SST map and CHL map smooth. A Gaussian filter is a linear smoothing filter that can remove isolated noise and increase the width of the edges. The equation of Gaussian filter is as follows:
g σ ( m , n ) = 1 2 π σ 2 e m 2 + n 2 2 σ 2 · f ( m , n )
where f ( m , n ) represents the pixel value at the ( m , n ) position, g σ ( m , n ) represents the value of each point after Gaussian filtering, and σ represents the standard deviation. In fact, Equation (1) shows that a Gaussian matrix convolves with each pixel and its neighborhood. Then, the Sobel operator that consists of two 3 × 3 convolution masks G x and G y is used to compute the gradient vector. As for G x = [ 1   0   1 ; 2   0   2 ; 1   0   1 ] and G y = [ 1 2 1 ;   0   0   0 ;   1   2   1 ] , they convolve with each pixel and approximate the first-order derivatives g x ( m , n ) and g y ( m , n ) , respectively. The final gradient magnitude of each pixel at ( m , n ) can be computed with Equation (2) below:
G ( m , n ) = g x ( m , n ) 2 + g y ( m , n ) 2
Since the CHL data was distributed lognormally at various spatio-temporal scales [35], the ocean color gradient was calculated from the lognormally transformed data, which was the natural logarithm of the ratio of adjacent CHL value at every pixel. Finally, the Canny edge detector [36] was adopted to identify the SOF path in the southwestern Atlantic. The Canny method is an optimal edge detection that can be used to detect image edges independently, rather than according to a specific gradient threshold. Meanwhile, edges were marked at local maxima in the gradient magnitude based on a gradient magnitude map, in which the thermal front path was defined in an SST gradient magnitude map, and the ocean color front path was identified by a CHL gradient magnitude map.

3. Results

3.1. Seasonal Mean Distribution of SST and CHL in the Southwestern Atlantic

The southwestern Atlantic mainly contains the South American continental shelf water and the Falkland Current, which are bounded by the 200 m isobath. Beyond that, the west side is the high-temperature South American continental shelf waters, while the east side is the low-temperature Falkland Current. Moreover, the Falkland Current invades the shelf waters from south to north. The South American shelf water and the Falkland current water continuously exchange materials along the South American shelf break, an area where the depths range between 200 m and 1000 m isobaths. Therefore, it is easy to produce fronts in the southwestern Atlantic. However, according to the seasonal mean distribution of SST, the SST in the southwestern Atlantic had a significant seasonal variation under the influence of solar radiation and west wind drift. Figure 2 describes the seasonal difference of SST distribution in the southwestern Atlantic. As shown in Figure 2a, in summer, the SST increased gradually from south to north. With the 200 m isobath as an approximate boundary, the temperature on both sides was between 12 °C and 15 °C, and there was an obvious difference in temperature. Since the South American continental shelf waters are influenced by the Brazil Warm Current, the shelf water is warmer than the Falkland Current water. Between these two water masses, it is easy for the fronts to develop. However, due to the weakening of solar radiation and the influence of west wind drift in winter, the increasing sea surface cooling effect in the southwestern Atlantic made the SST uniform (see Figure 2b). With the 200 m isobath as the boundary, the temperature difference between the two sides was less than 2 °C, and the SST difference was small.
In winter, SST tends to be uniform, which leads to weakening of the SST gradient. Therefore, there are some limitations in using SST to identify the SOF in the southwestern Atlantic in winter. It was essential to select another ocean remote-sensing parameter to determine SOF, in order to effectively compensate for the gradient weakening of SST in winter. The concentration of CHL in the continental shelf water of South America is relatively high, while the Southern Ocean is a known “high-nutrient, low-CHL” zone, so there is an obvious difference in the concentrations of CHL between the shelf waters and the Falkland Current. Therefore, the CHL data was an ideal choice to detect the SOF in the southwestern Atlantic. Figure 3 shows the seasonal mean lognormal distribution of CHL in the southwestern Atlantic. Whether in summer or winter, the concentration of CHL was always approximately bounded by 200 m isobath, the west side was the shelf water with a high CHL concentration, and the east side was the Falkland Current with a low CHL concentration. As shown in Figure 3a, in summer, the concentration of CHL in the South American shelf water was high, especially to the south of 45°S. The concentration of CHL was between 1 mg/m3 and 3 mg/m3 on both sides of the 200 m isobath. The CHL data showed the amount of marine phytoplankton communities. Although the continental shelf water of South America is rich in nutrients, the low temperature environment is not favorable to the reproduction of phytoplankton in winter. Thus, the concentration of CHL in winter was relatively lower than that in summer. In winter, the concentration of CHL was relatively higher in the northern shelf waters (north of 45°S), which had an obvious CHL concentration difference with the Falkland Current (see Figure 3b).
Based on the above experimental results, it was found that SST had obvious seasonal differences in the southwestern Atlantic. Meanwhile, there were some limitations to analyzing the position and variation of SOF only by SST. In order to compensate for the limitations of SST, this study used two types of oceanic remote-sensing data, SST and CHL, to study the SOF in the southwestern Atlantic.

3.2. Monthly Mean Distribution of the Southern Ocean Front in the Southwestern Atlantic

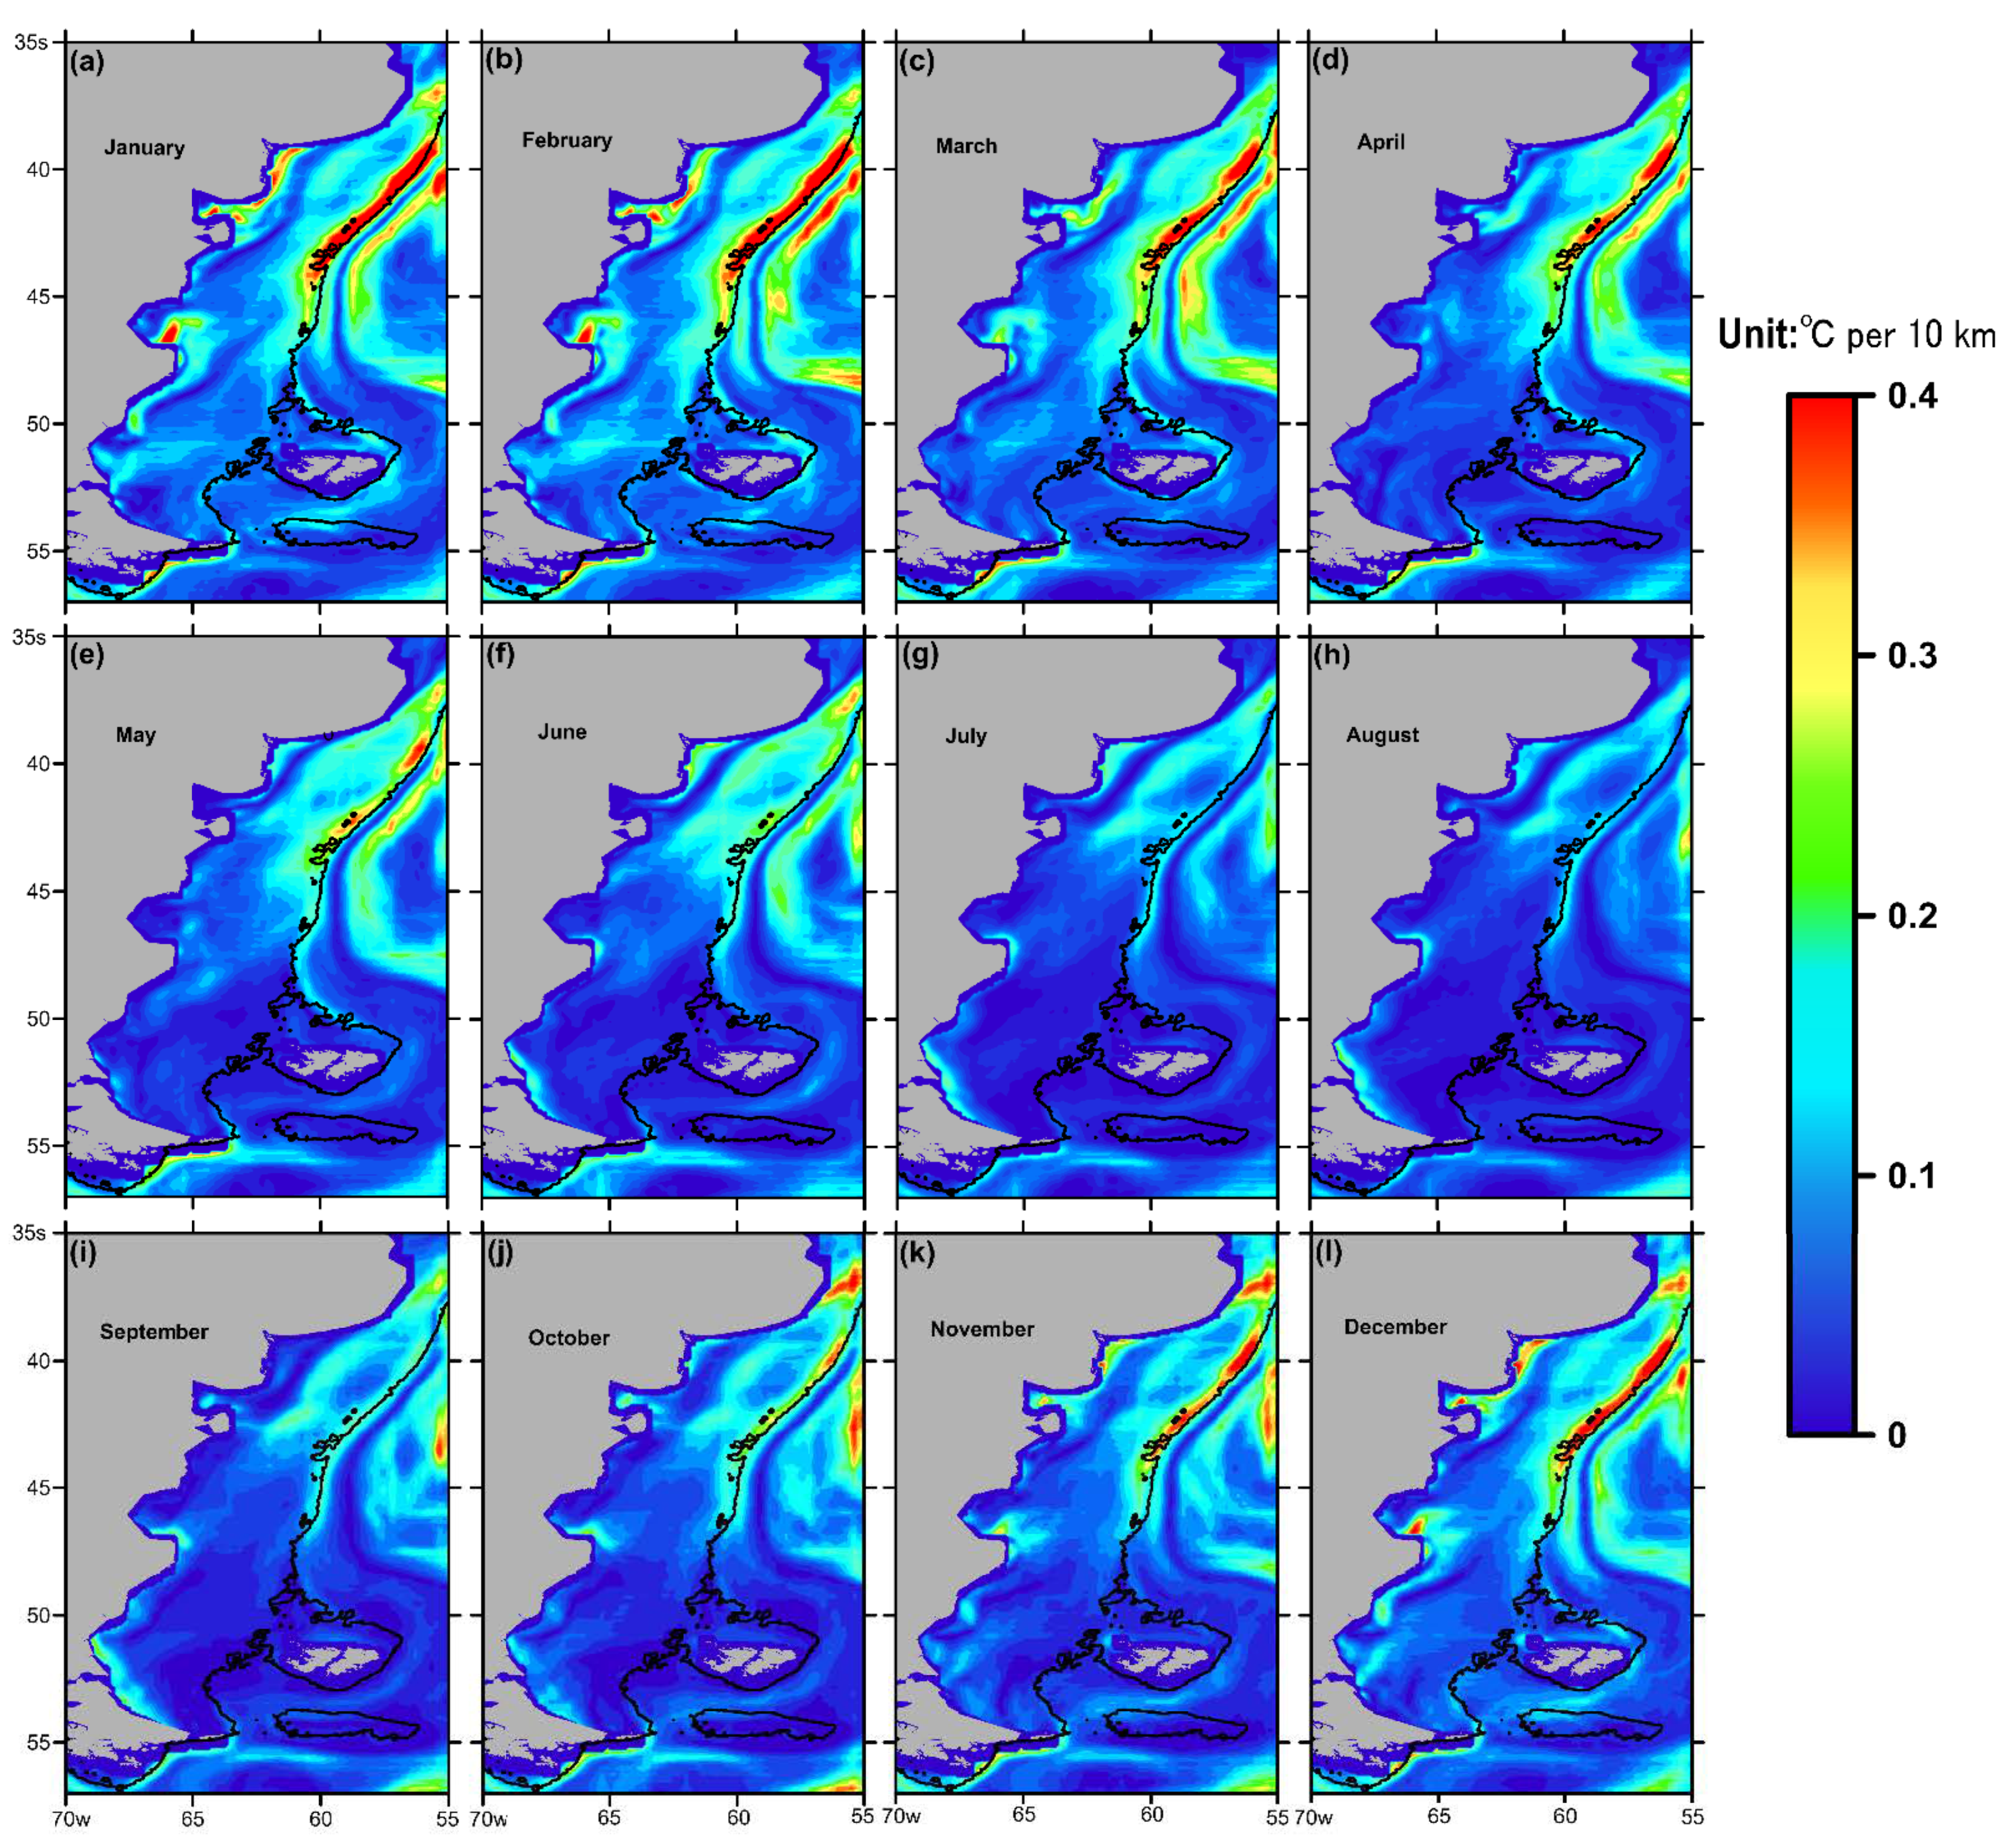
In order to accurately study the position and spatio-temporal variation of the SOF in the southwestern Atlantic, this study adopted the monthly mean distribution of the Southern Ocean thermal front and the Southern Ocean color front to detect the distribution of the SOF in the southwestern Atlantic. First of all, a Gaussian filter was used to smooth the monthly mean SST and CHL data. Furthermore, a Sobel operator was adopted to calculate the gradient magnitude map of SST and CHL, indicating the position and strength of the thermal front and ocean color front. Generally speaking, the gradient can represent a front [37]. In Figure 4 and Figure 5, the gradient units are °C per 10 km and ln (mg m−3) per 25 km, respectively, which only represent the intensity of the gradient. Therefore, the difference of values in the colorbar only represents the difference of gradient intensity [22,37].
As displayed in Figure 4, the distribution of the SST gradient magnitude in the southwestern Atlantic gradually decreased from north to south. Apart from that, the strongest SST gradient magnitude was mainly concentrated in the slope break zone of the South American continental shelf and the northern coastal zone of Argentina. The maximum SST gradient magnitude along the 200 m isobath was about 0.04 °C/km, and the maximum SST gradient magnitude along the northern coast of Argentina was always stronger than 0.01 °C/km, and even reached 0.03 °C/km. In addition, the region with the smallest SST gradient was adjacent to the 200 m isobath on the east side of the Malvinas Islands. The SST gradient magnitude in this area was often below 0.01 °C/km, and had almost disappeared in July and August.
As can be seen in Figure 4, the Southern Ocean thermal front was complete and the SST gradient was the most pronounced from December to February. Apart from that, the SST gradient gradually weakened from March to August. Particularly, the one that was along the 200 m isobath that was between the South American shelf water and the Falkland Current had almost disappeared by August. However, the SST gradient gradually recovers starting in September. Furthermore, the monthly mean gradient magnitude distribution of CHL showed another form of frontal distribution and spatio-temporal variation. Figure 5 shows the monthly mean ocean color gradient magnitude maps.
Figure 5 illustrates the monthly mean position of the Southern Ocean color front in the southwestern Atlantic. The ocean color gradient magnitude was calculated from the lognormally transformed original CHL data for 2007–2019. Similar to the distribution of the SST gradient magnitude in the southwestern Atlantic, the Southern Ocean color gradient magnitude was higher on both sides of the 200 m isobath and along the northern coast of Argentina (see Figure 5). As for the pattern of the ocean color gradient, it was mainly distributed along the 200 m isobath, and surrounded the Malvinas Islands on the east side, then gradually left the isobath to the west and reached Cape Horn. The ocean color gradient magnitude from June to August was weaker than in other months. Since the low temperature in winter was not conducive to the reproduction of phytoplankton, the concentration of CHL also dropped, leading to the weakening of the ocean color gradient magnitude. In general, the Southern Ocean color gradient was present all year in the southwestern Atlantic.
Based on the above experimental results, it was found that the Southern Ocean thermal front in the southwestern Atlantic was similar to the Southern Ocean color front in position, and the Southern Ocean thermal front had obvious seasonal differences, whereas the corresponding ocean color front existed without remarkable spatio-temporal changes.

4. Discussion

4.1. Comparison of the Thermal Front Path and the Ocean Color Front Path

According to the gradient magnitude maps shown in Figure 4 and Figure 5, the strength and approximate position of the SOF in the southwestern Atlantic could be known. In order to detect the exact position and seasonal variation of the SOF in the southwestern Atlantic more accurately, this study used a Canny edge detector and seasonal climatology data to calculate the SOF path in the southwestern Atlantic based on the gradient magnitude.
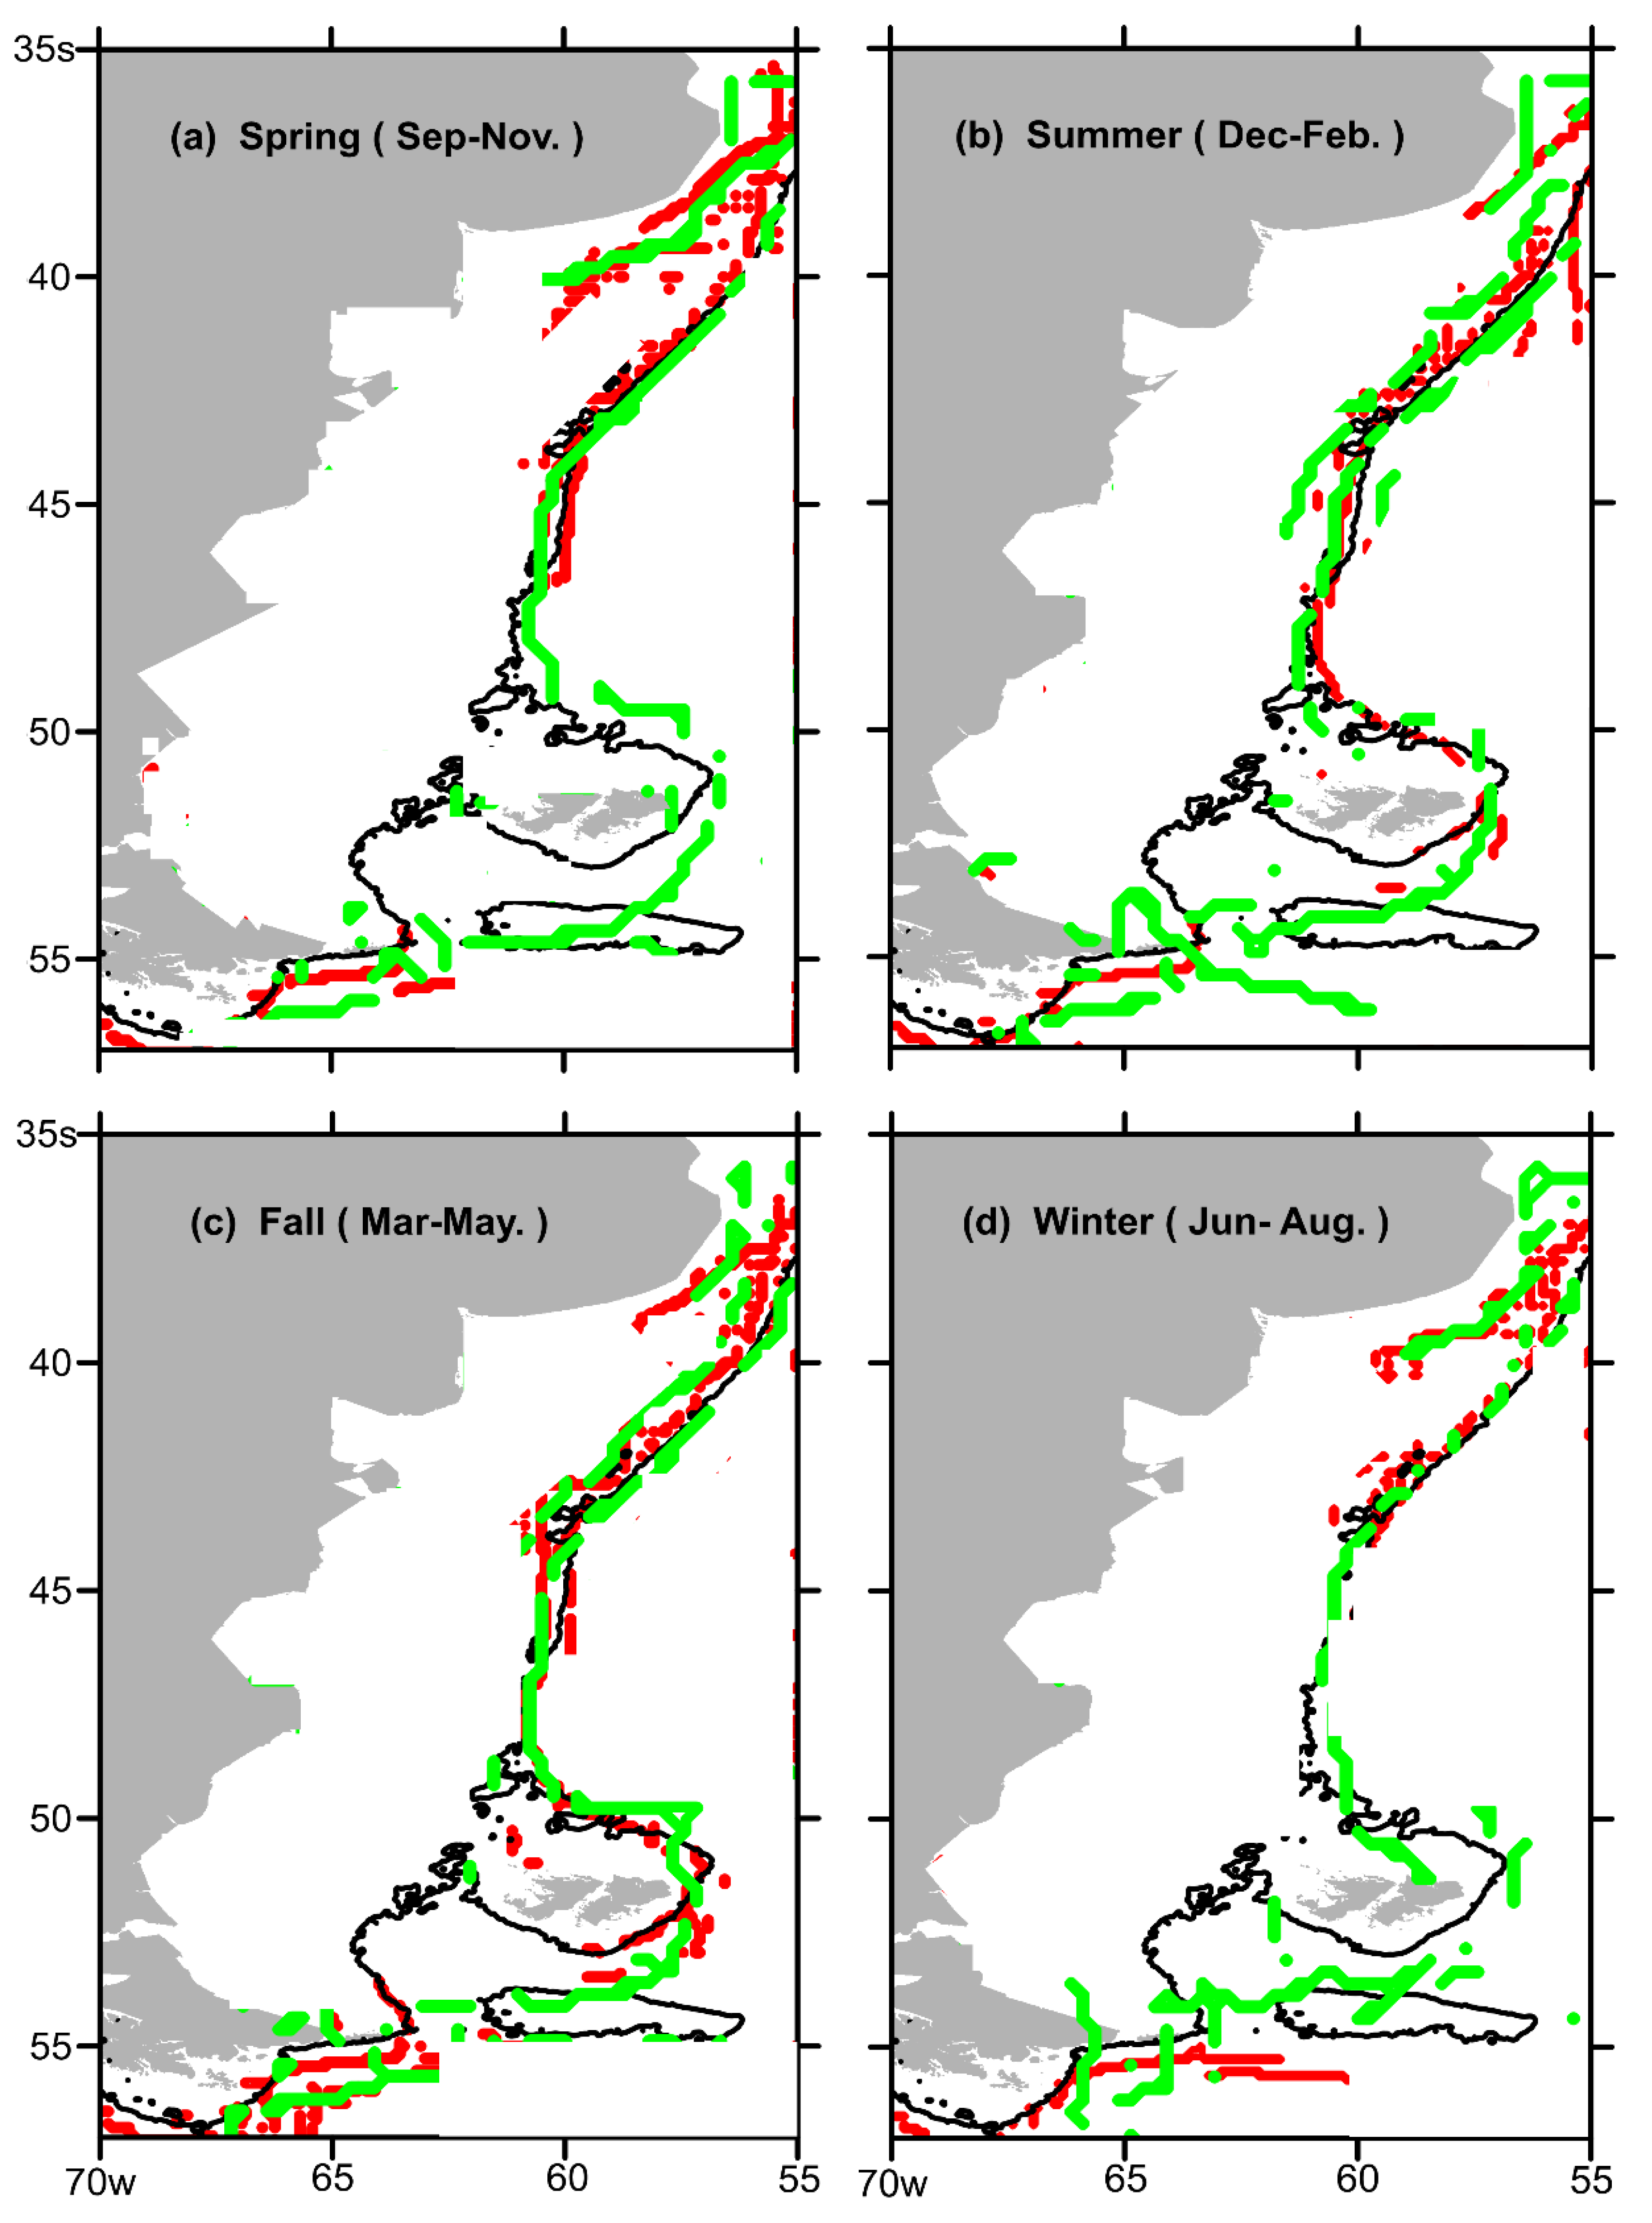
Figure 6 shows the seasonal variation of the SOF path in the southwestern Atlantic. Moreover, the path of the Southern Ocean thermal front was compared with that of the Southern Ocean color front.
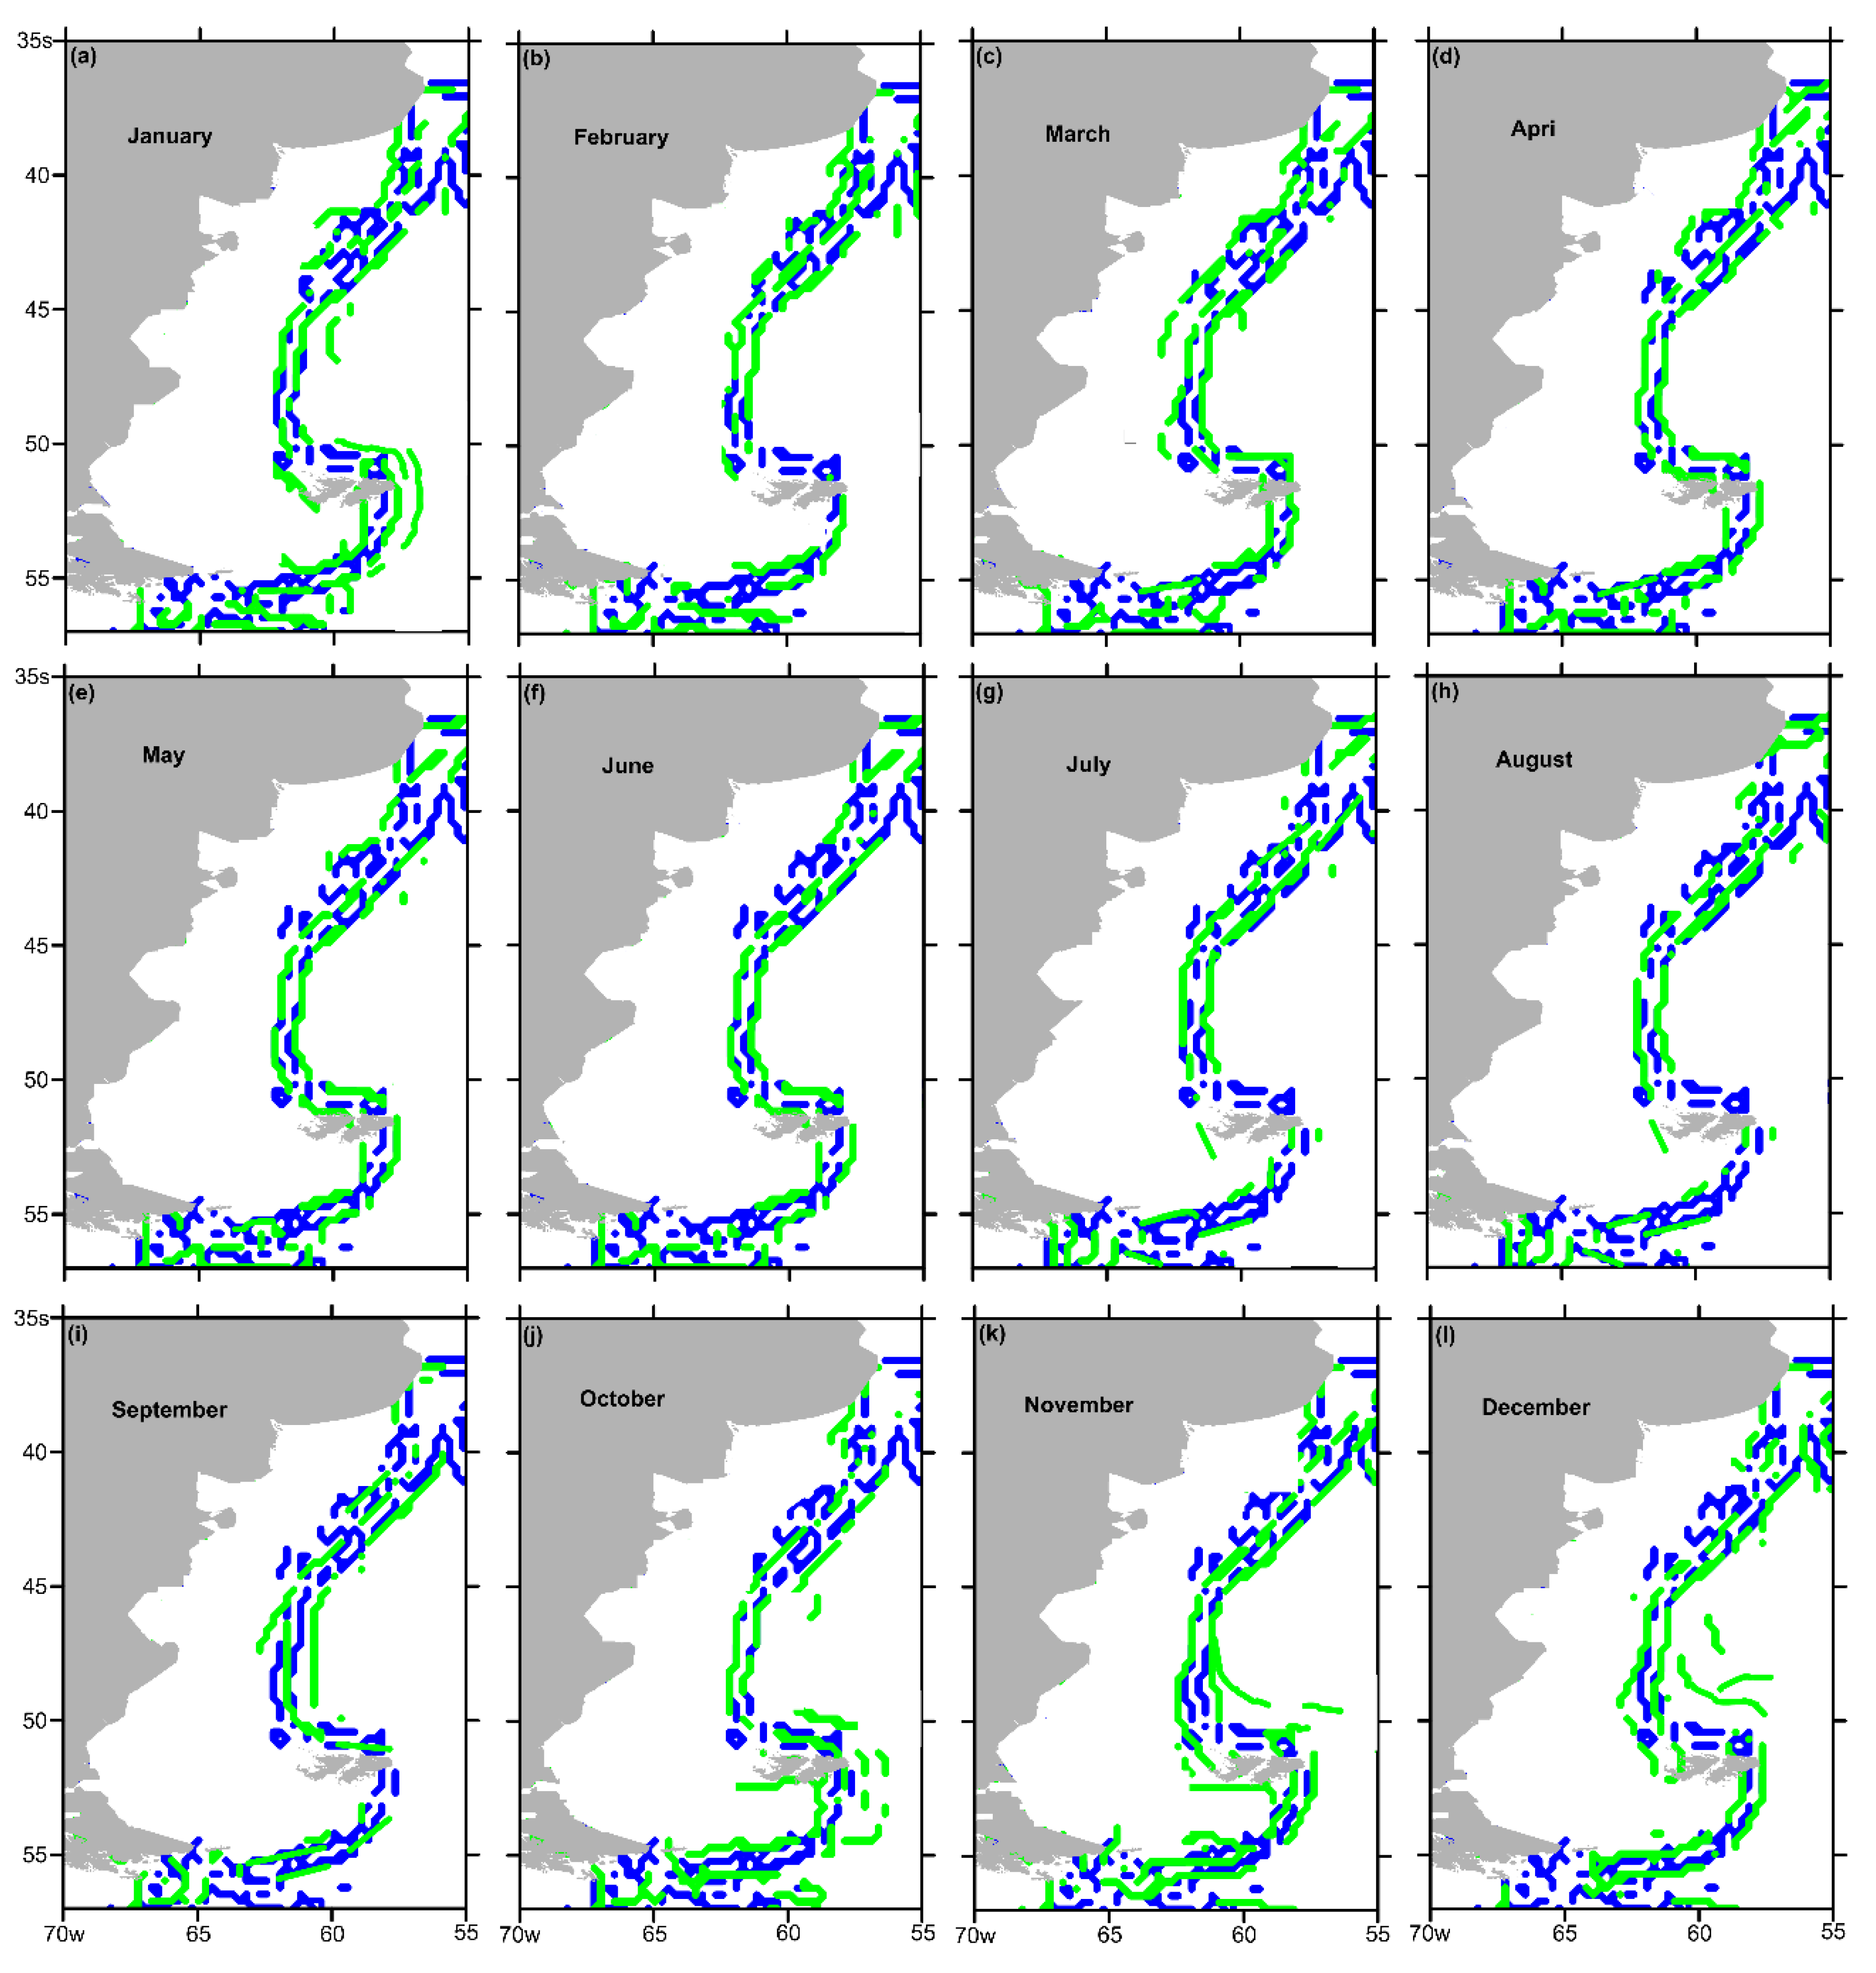
As displayed in Figure 6, the Southern Ocean thermal front had obvious seasonal differences. In summer, the Southern Ocean thermal front path was complete, but it disappeared between 45°S and 55°S in wintertime. As the four seasons in the Southern Hemisphere are the opposite of those in the Northern Hemisphere, the distribution of the Southern Ocean thermal front was complete from December to February (summer), and almost disappeared from June to August (winter) (see Figure 4). The reason for this type of phenomenon is illustrated in Figure 2b: in winter, the increasing surface cooling effects made SSTs uniform, and the thermal front disappeared. Therefore, there were some limitations in using SST to detect the position of the SOF in the southwestern Atlantic in winter. Apart from that, the corresponding ocean color front was introduced into this study to detect the position of the SOF more accurately. Compared with the Southern Ocean thermal front path, the Southern Ocean color front path had no distinct seasonal difference, meaning that the boundary between the shelf water of South America and the Falkland Current persisted even in winter. In order to prove the stable existence of the Southern Ocean color front in the southwestern Atlantic, the annual mean path and the monthly mean path of the Southern Ocean color front were compared, and their difference rate was calculated. Based on the long-term (13 years) annual mean CHL data and monthly mean CHL data, the Canny edge detector was used to calculate the annual mean path and monthly mean path, respectively. By comparing the relative positions of the two paths, the difference points between the two paths were found. The number of difference points divided by the number of total points is the difference rate between the two paths. The equation of difference rate is as follows:
D i f f e r e n c e   R a t e = N d N t
where N d represents the number of difference points between the two paths, and N t represents the number of total points. The difference rate reflects the stability of the Southern Ocean color front in the southwestern Atlantic. A low difference rate indicated that the front had no significant spatio-temporal variation, while a high difference rate indicated that a front with strong variability. The comparison results of the two paths are shown in Figure 7, and Table 1 shows the difference rates between the two paths. As displayed in Figure 7, the Southern Ocean color front always existed from January to December, and the overall position of the monthly mean path was similar to the annual mean path, which further proved that the Southern Ocean color front was more stable than the Southern Ocean thermal front. As can be seen in Table 1, the largest difference rate was 7.37% in December, while the smallest was 4.75% in July. The monthly difference was no more than 3%, indicating that there was no significant seasonal difference in the spatio-temporal variability of the Southern Ocean color front. Therefore, the Southern Ocean color front could effectively compensate for the limitation of the Southern Ocean thermal front. It was noteworthy that during wintertime, signatures of the Southern Ocean thermal front faded and disappeared due to cooling, while the signatures of missing features could be derived from the Southern Ocean color front.
By comparing the path of the thermal fronts and the ocean color fronts, this study found that the position of the two fronts was coupled. Their coupling position was mainly distributed along the 200 m isobaths. Meanwhile, along the isobath, they skirted the Malvinas Islands from the east, gradually leaving the isobath to the west and then reaching Cape Horn. Thus, the exact position of the SOF in the southwestern Atlantic could be determined.
As shown in Figure 5, Figure 6 and Figure 7, the Southern Ocean color front was more stable than the Southern Ocean thermal front, but the intensity of the Southern Ocean color front in winter was weaker than that in summer. Since the low temperature environment was not suitable for phytoplankton reproduction, the CHL concentration decreased. Thus, the seasonal variation of the SOF in the southwestern Atlantic could be determined. The SOF in the southwestern Atlantic was easy to generate in summer. Compared with other seasons, the intensity of the SOF in summer was the strongest. In winter, the SOF in the southwestern Atlantic was less distributed, and the intensity of the SOF was the weakest.

4.2. Effects of Ocean Current Properties on the Seasonal Spatial-Temporal Variation of Front

The Falkland Current, as a tributary of the ACC, belongs to the strong cold current. The SOF in the southwestern Atlantic is caused by the intrusion of the Falkland Current into the South American shelf water. In addition, the Falkland Current has a low temperature and high salinity, while the South American shelf water has a high temperature and low salinity. Similar to the SOF in the southwestern Atlantic, the Kuroshio front in the East China Sea (ECS) is also caused by the intrusion of strong current into shelf water. Furthermore, Kuroshio is the strongest warm current in the western North Pacific, as well as a tributary of the North Equatorial Warm Current. Compared with the shelf water of ECS, Kuroshio has a higher temperature and a higher salinity. In fact, the formation of the two fronts is similar. Thus, in this section, SST and CHL data were used to study the seasonal variation of the fronts in the two regions, and analyze the effects of different ocean current properties on the seasonal spatio-temporal variation of fronts.

4.2.1. Comparison of the Seasonal Distribution of SST and CHL in the East China Sea and the Southwestern Atlantic

The ECS mainly contains two water masses, the shelf water and the Kuroshio water [38]. Figure 8, which lists the seasonal mean SST distributions in the ECS, shows that the distribution of SST had obvious seasonal differences. In winter, the temperature difference at the Kuroshio main stream was more than 3 °C. With the 200 m isobath as an approximate boundary, the southeast is the Kuroshio with high temperature, and the northwest is the shelf water with relatively low temperature. Due to the strong solar radiation and the warm southerly wind in summer, the SSTs showed uniform surface heating over the ECS. The temperature difference in the ECS was the smallest in summer, which led to the disappearance of the SST gradient.
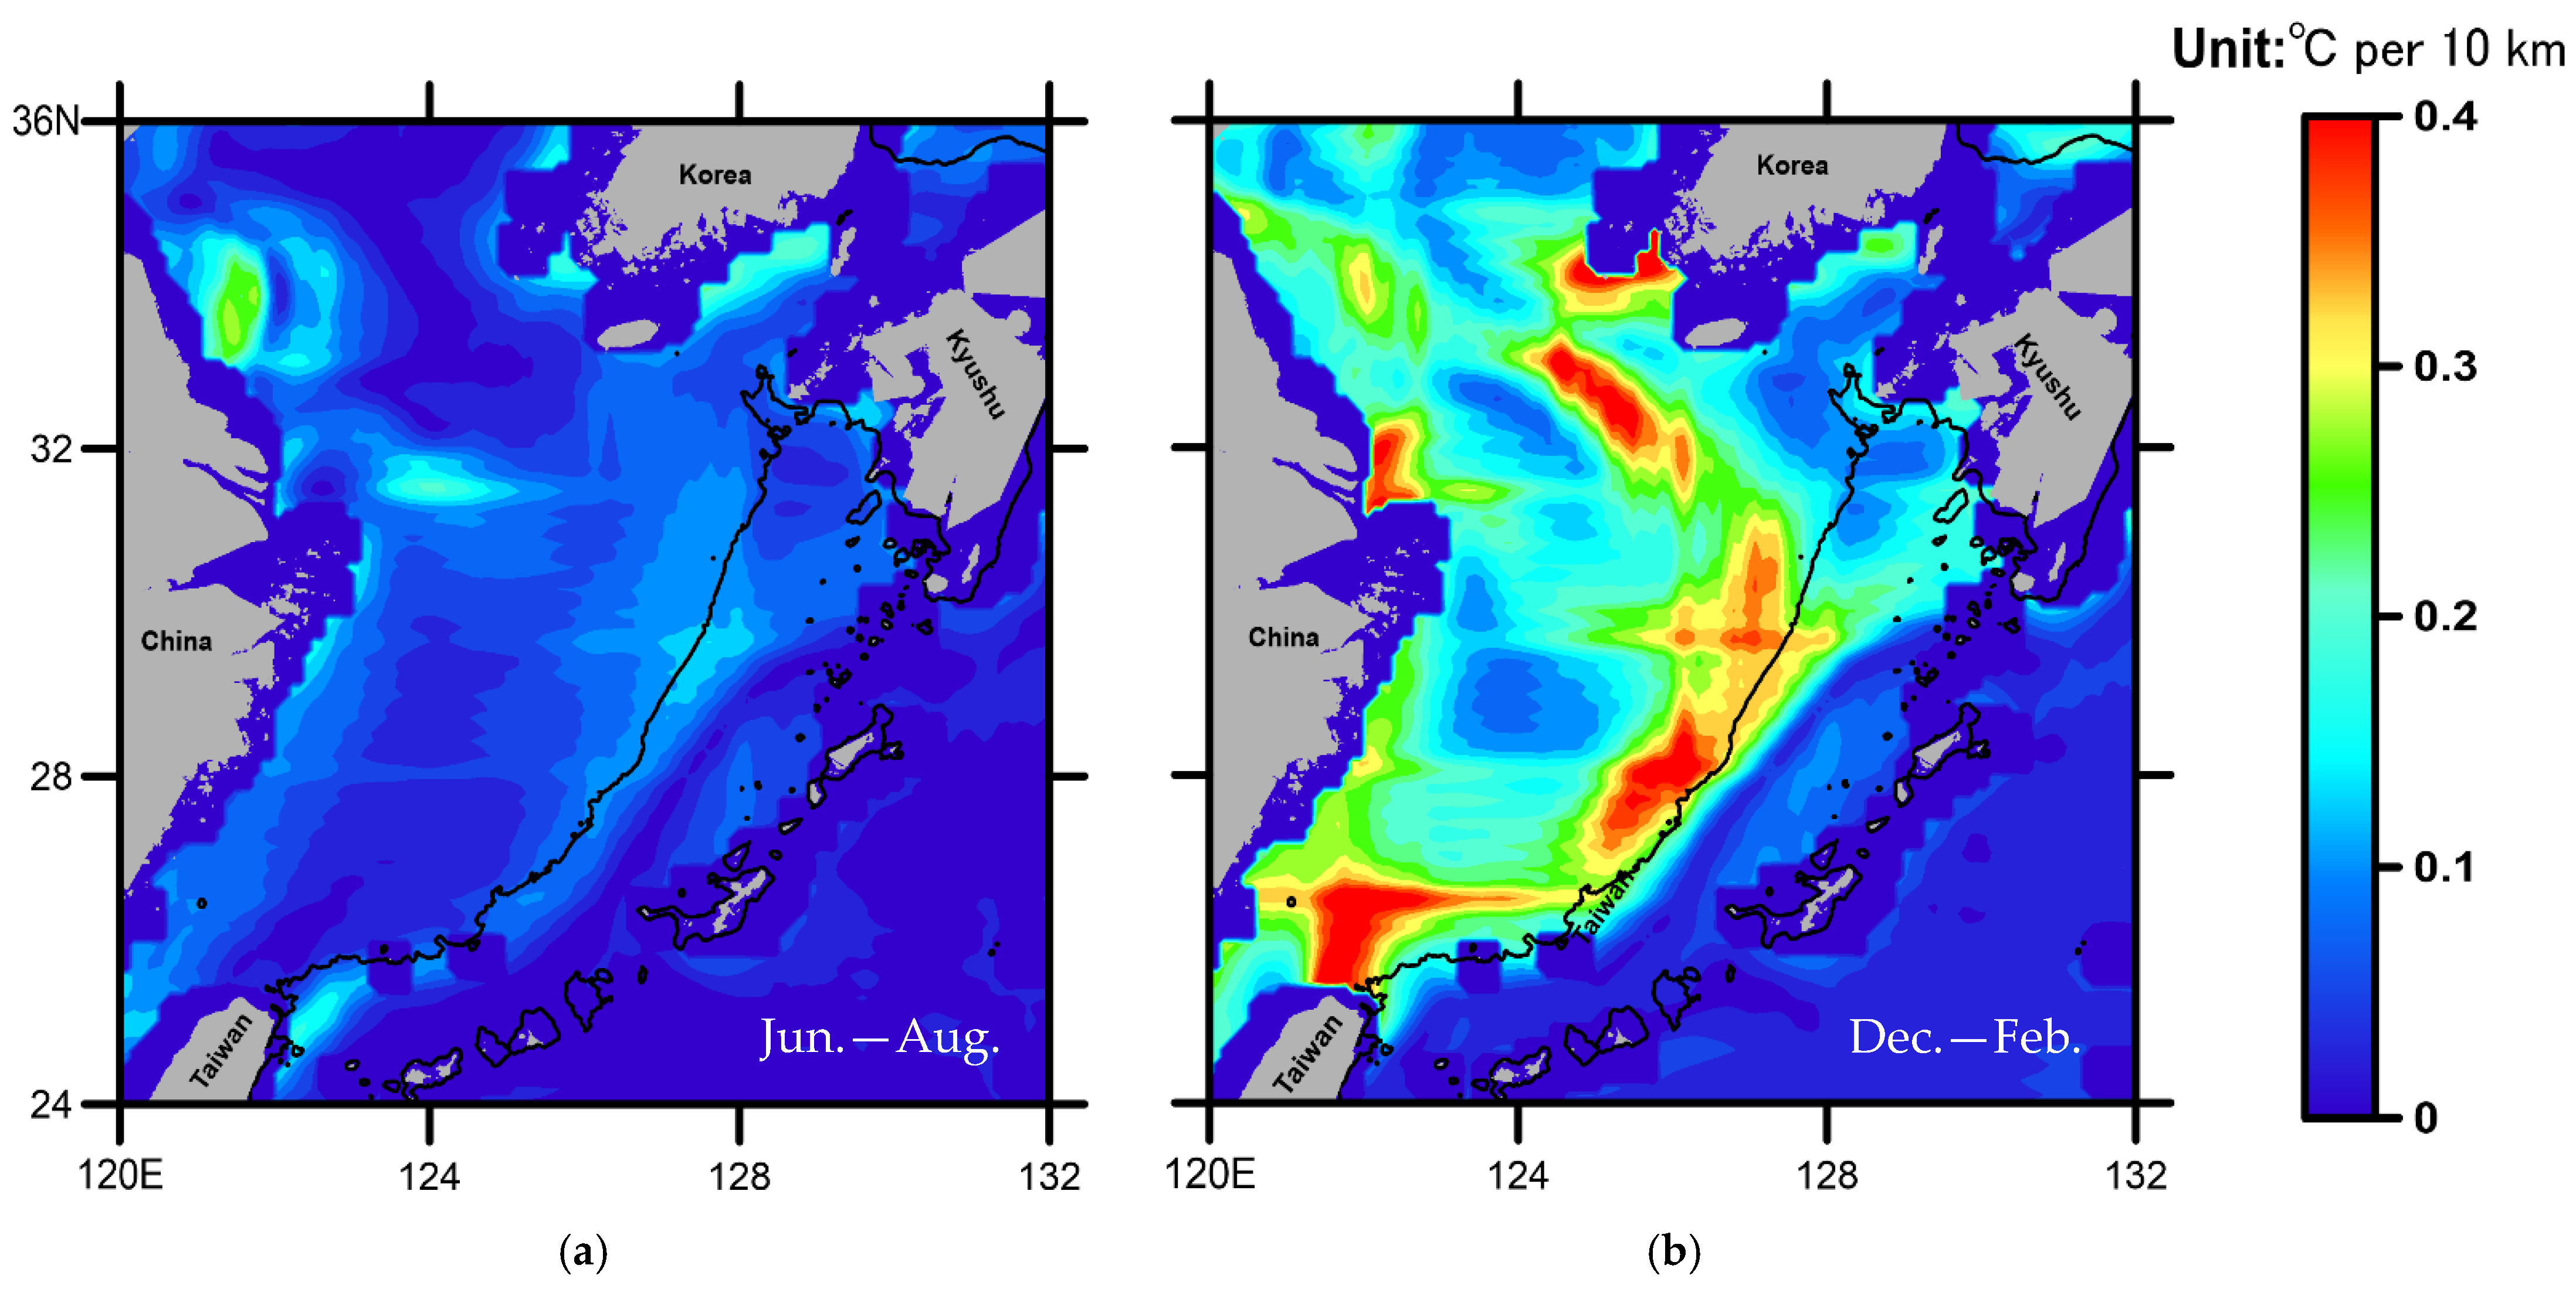
When comparing the experimental results shown in Figure 2 and Figure 8, it can be observed that the SST distributions all had significant seasonal differences in the ECS and the southwestern Atlantic, but the results were completely opposite. In the southwestern Atlantic, the SST gradient was weakest in winter, while the gradient was weakest in the ECS during summer. The main reason for this phenomenon was that these two regions are invaded by strong ocean currents, yet the natures of the two currents are completely different: the Falkland Current is a cold current, while the Kuroshio is a warm current.
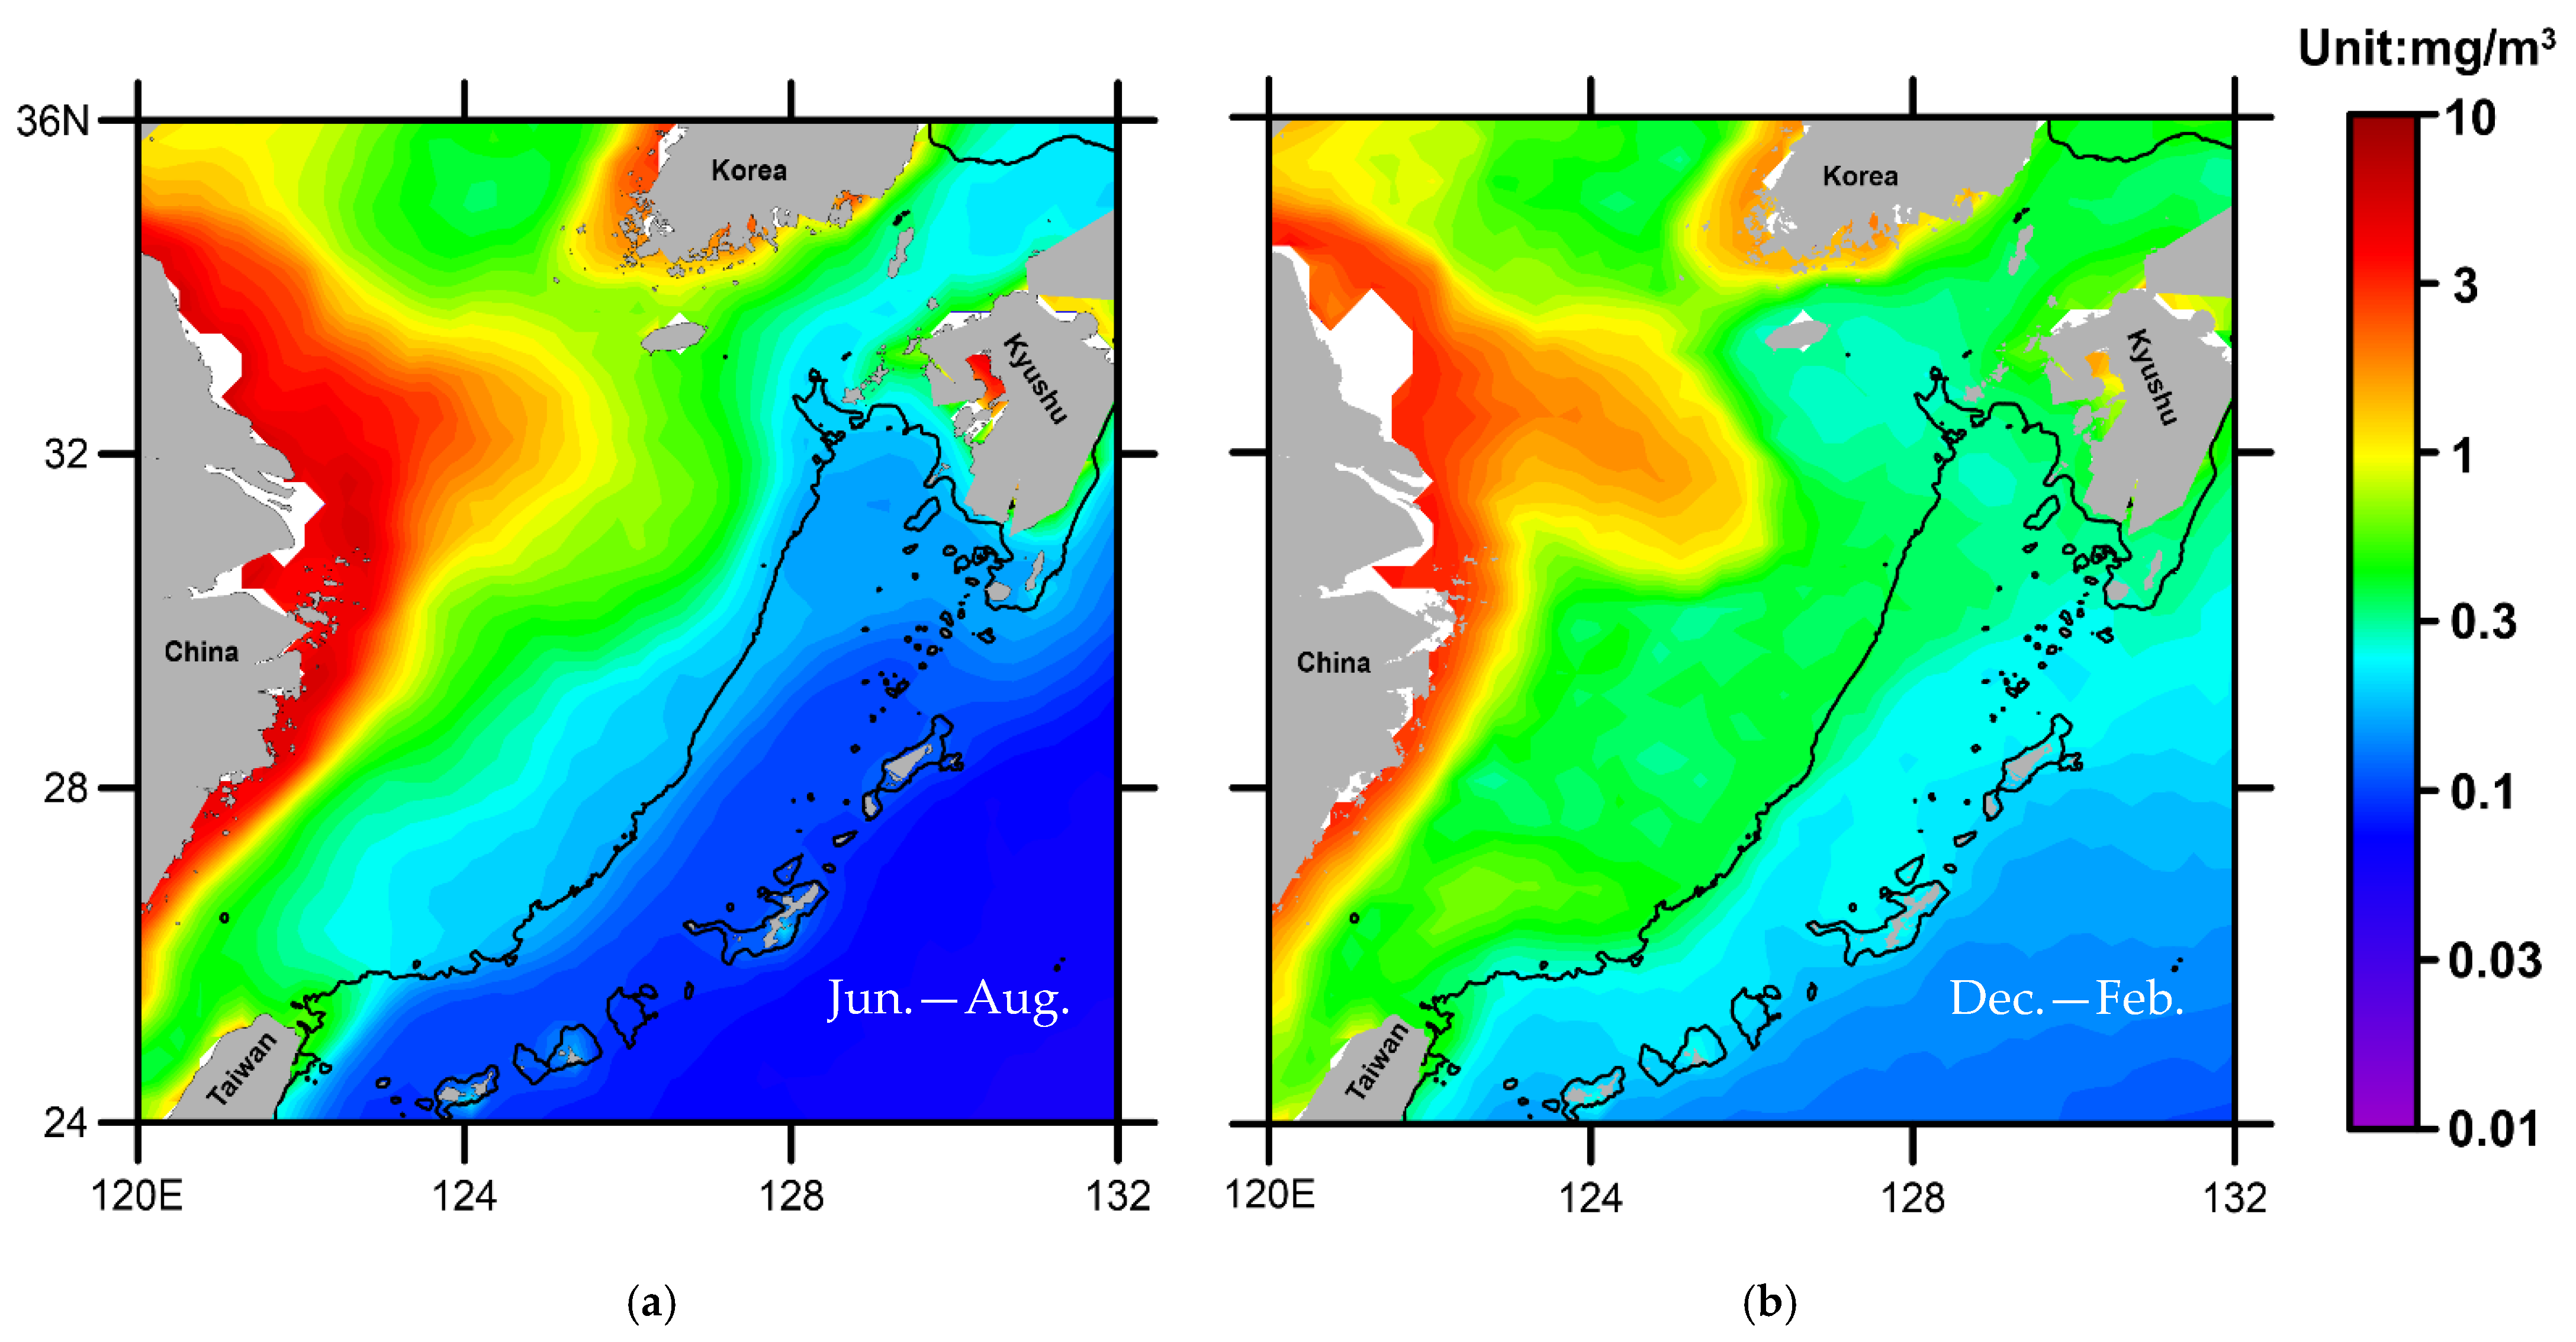
Since the SST gradient in the ECS was the weakest and even disappeared in summer, CHL data were also used to make up for the limitations of SST to better study the Kuroshio front in the ECS [22]. Figure 9 shows the seasonal mean CHL lognormal distributions in the ECS. As displayed in Figure 9, even in summer, there were obvious differences in CHL concentrations between the ECS shelf water and the Kuroshio. This was similar to the distribution of CHL in the southwestern Atlantic, where the concentration gradient of CHL was not affected by the season, and was more stable than the SST gradient.

4.2.2. Comparison of the Seasonal Distribution of the Kuroshio Front and the Southern Ocean Front

As mentioned in Section 4.2.1, the seasonal SST distribution results for the ECS and the southwestern Atlantic were completely opposite due to the different ocean current properties. Therefore, the two regions have a north–south symmetry. In this section, the seasonal distribution of thermal fronts and ocean color fronts in the two regions will be calculated. Beyond that, the results will be compared to analyze the seasonal variation of the fronts in these two regions.
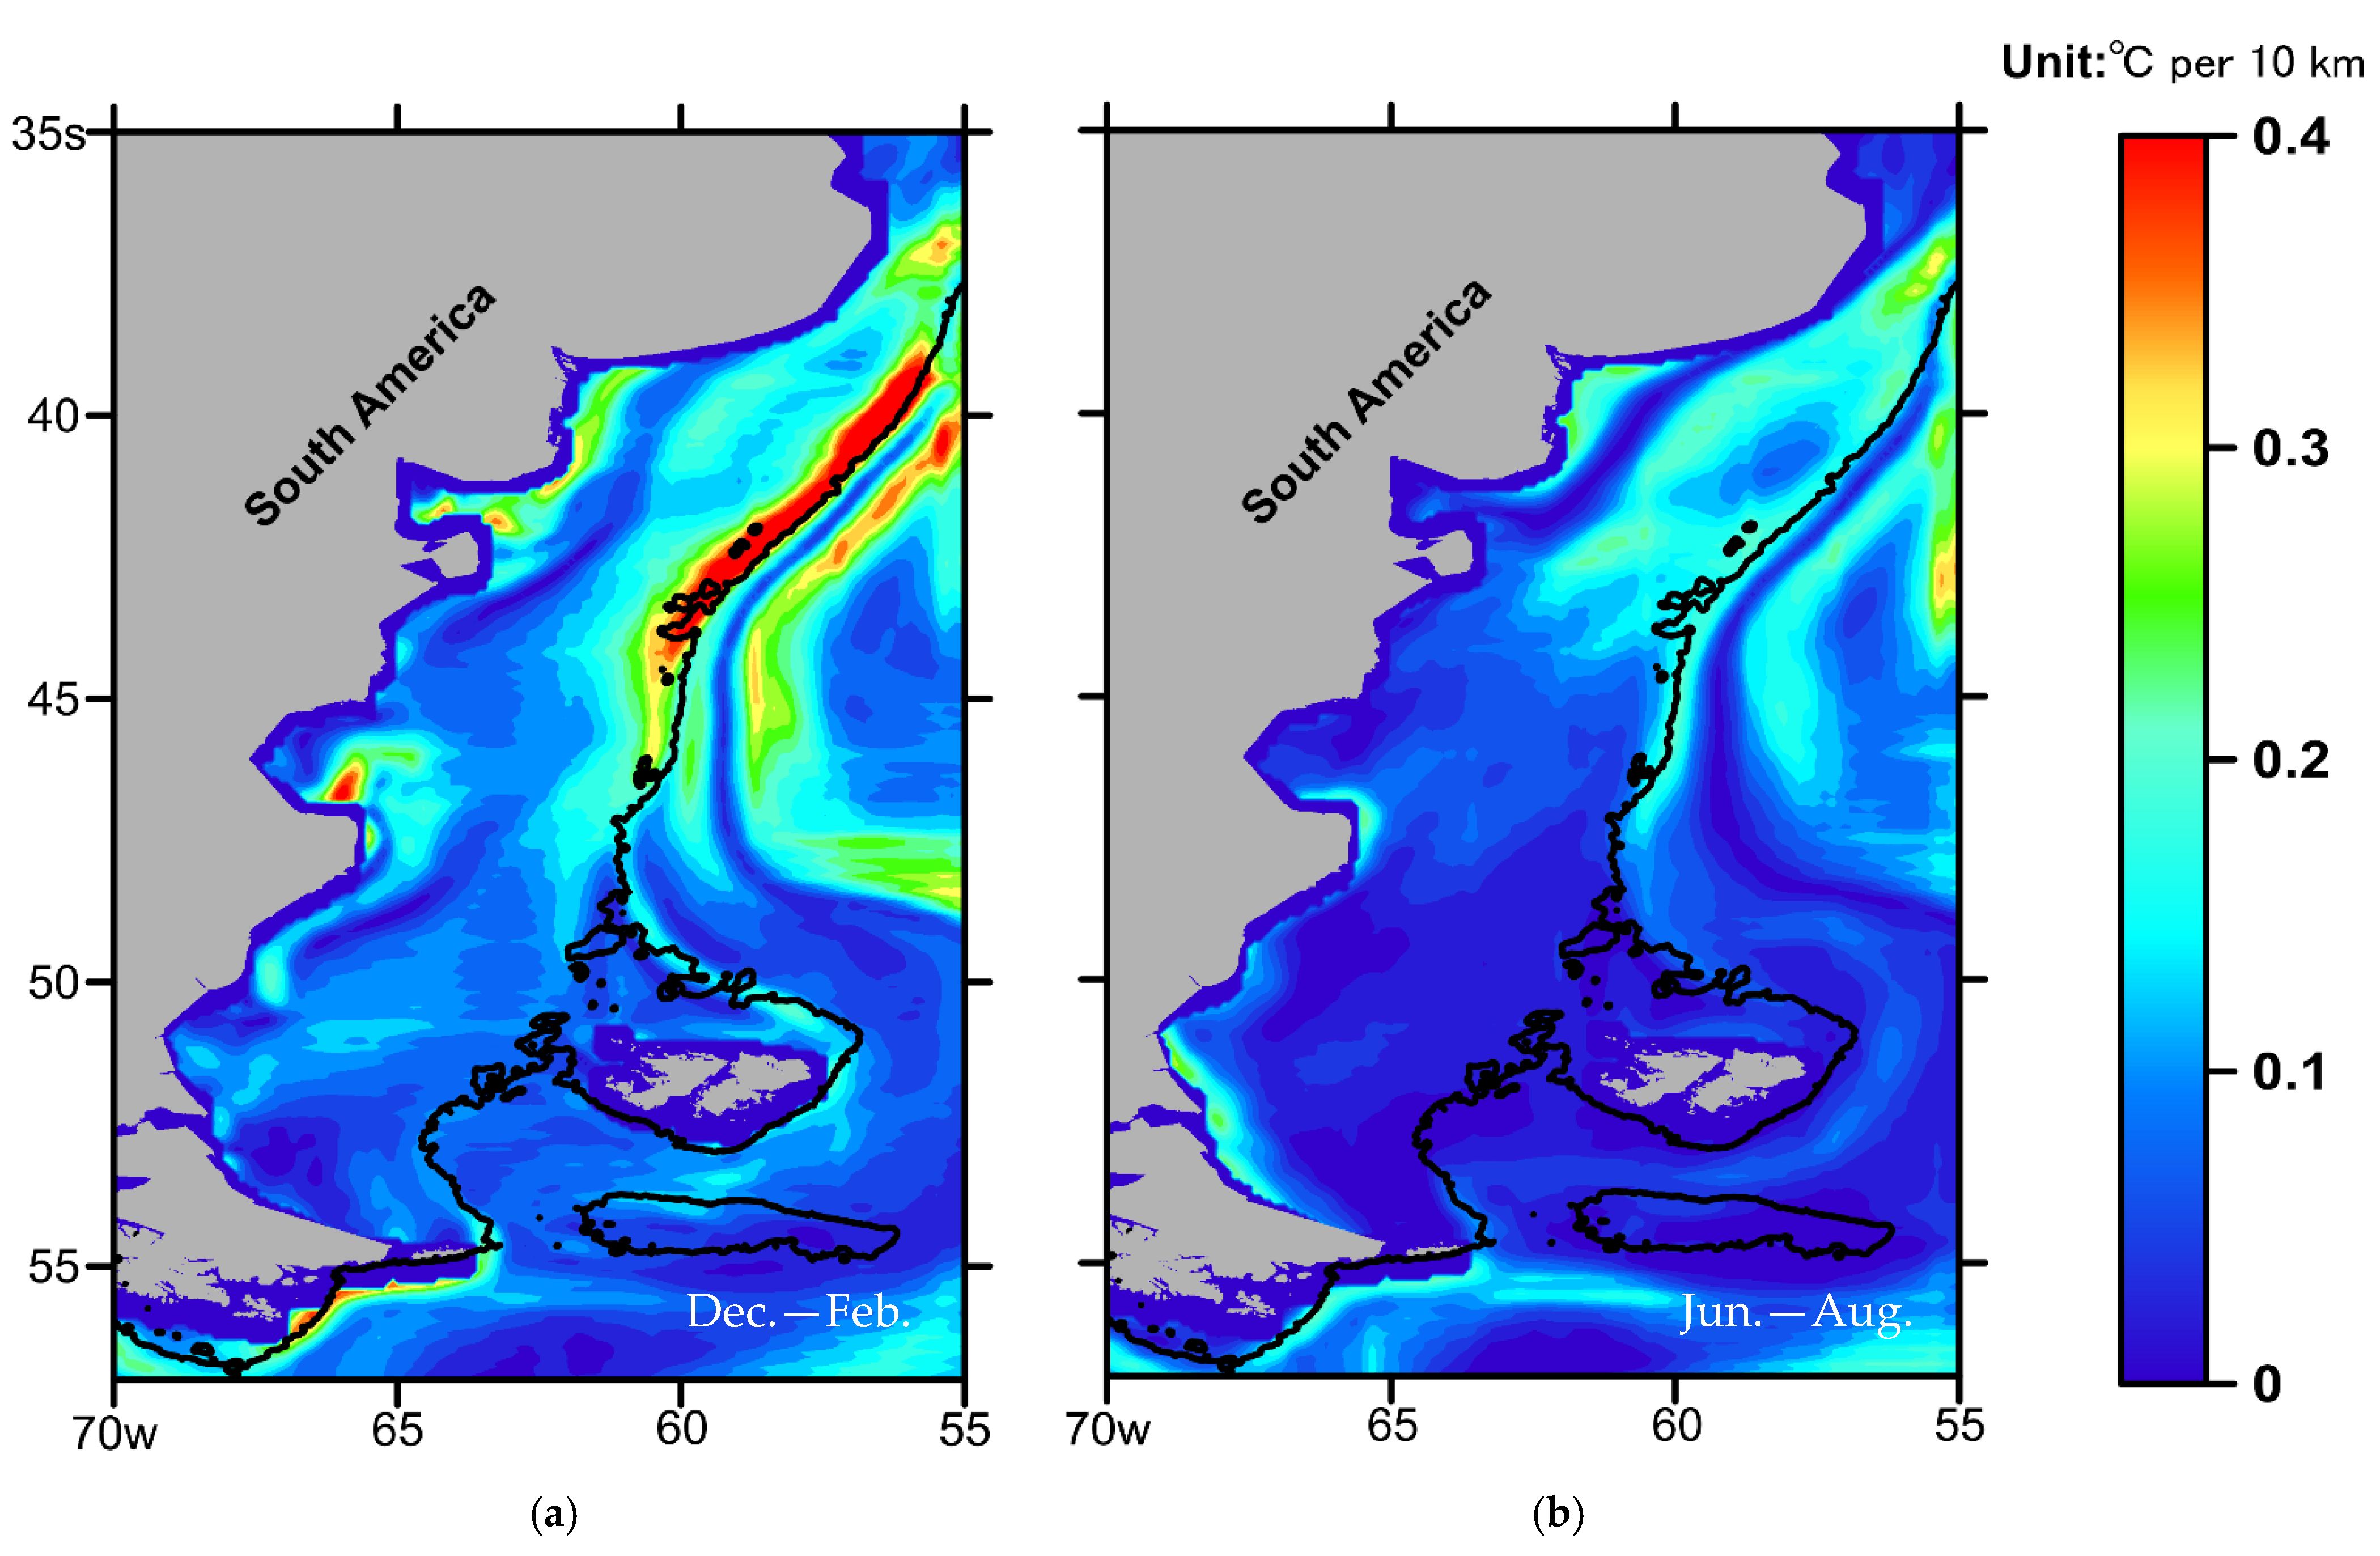
The Sobel operator and seasonal climatology data were used to calculate the gradient magnitude map of SST and CHL. Figure 10 illustrates the seasonal difference of the Kuroshio thermal front in the ECS. In winter, the SST gradient magnitude was higher near the 200 m isobaths. However, in summer, the SST gradient magnitude was very small, and was less than 0.01 °C km−1 near the 200 m isobaths. Compared with the results in Figure 10, the results in Figure 11 illustrate a completely opposite situation. Specifically, in the southwestern Atlantic, the Southern Ocean thermal fronts were more pronounced in summer and weaker in winter. Meanwhile, the thermal fronts in ECS and southwestern Atlantic were mainly distributed along the 200 m isobaths.
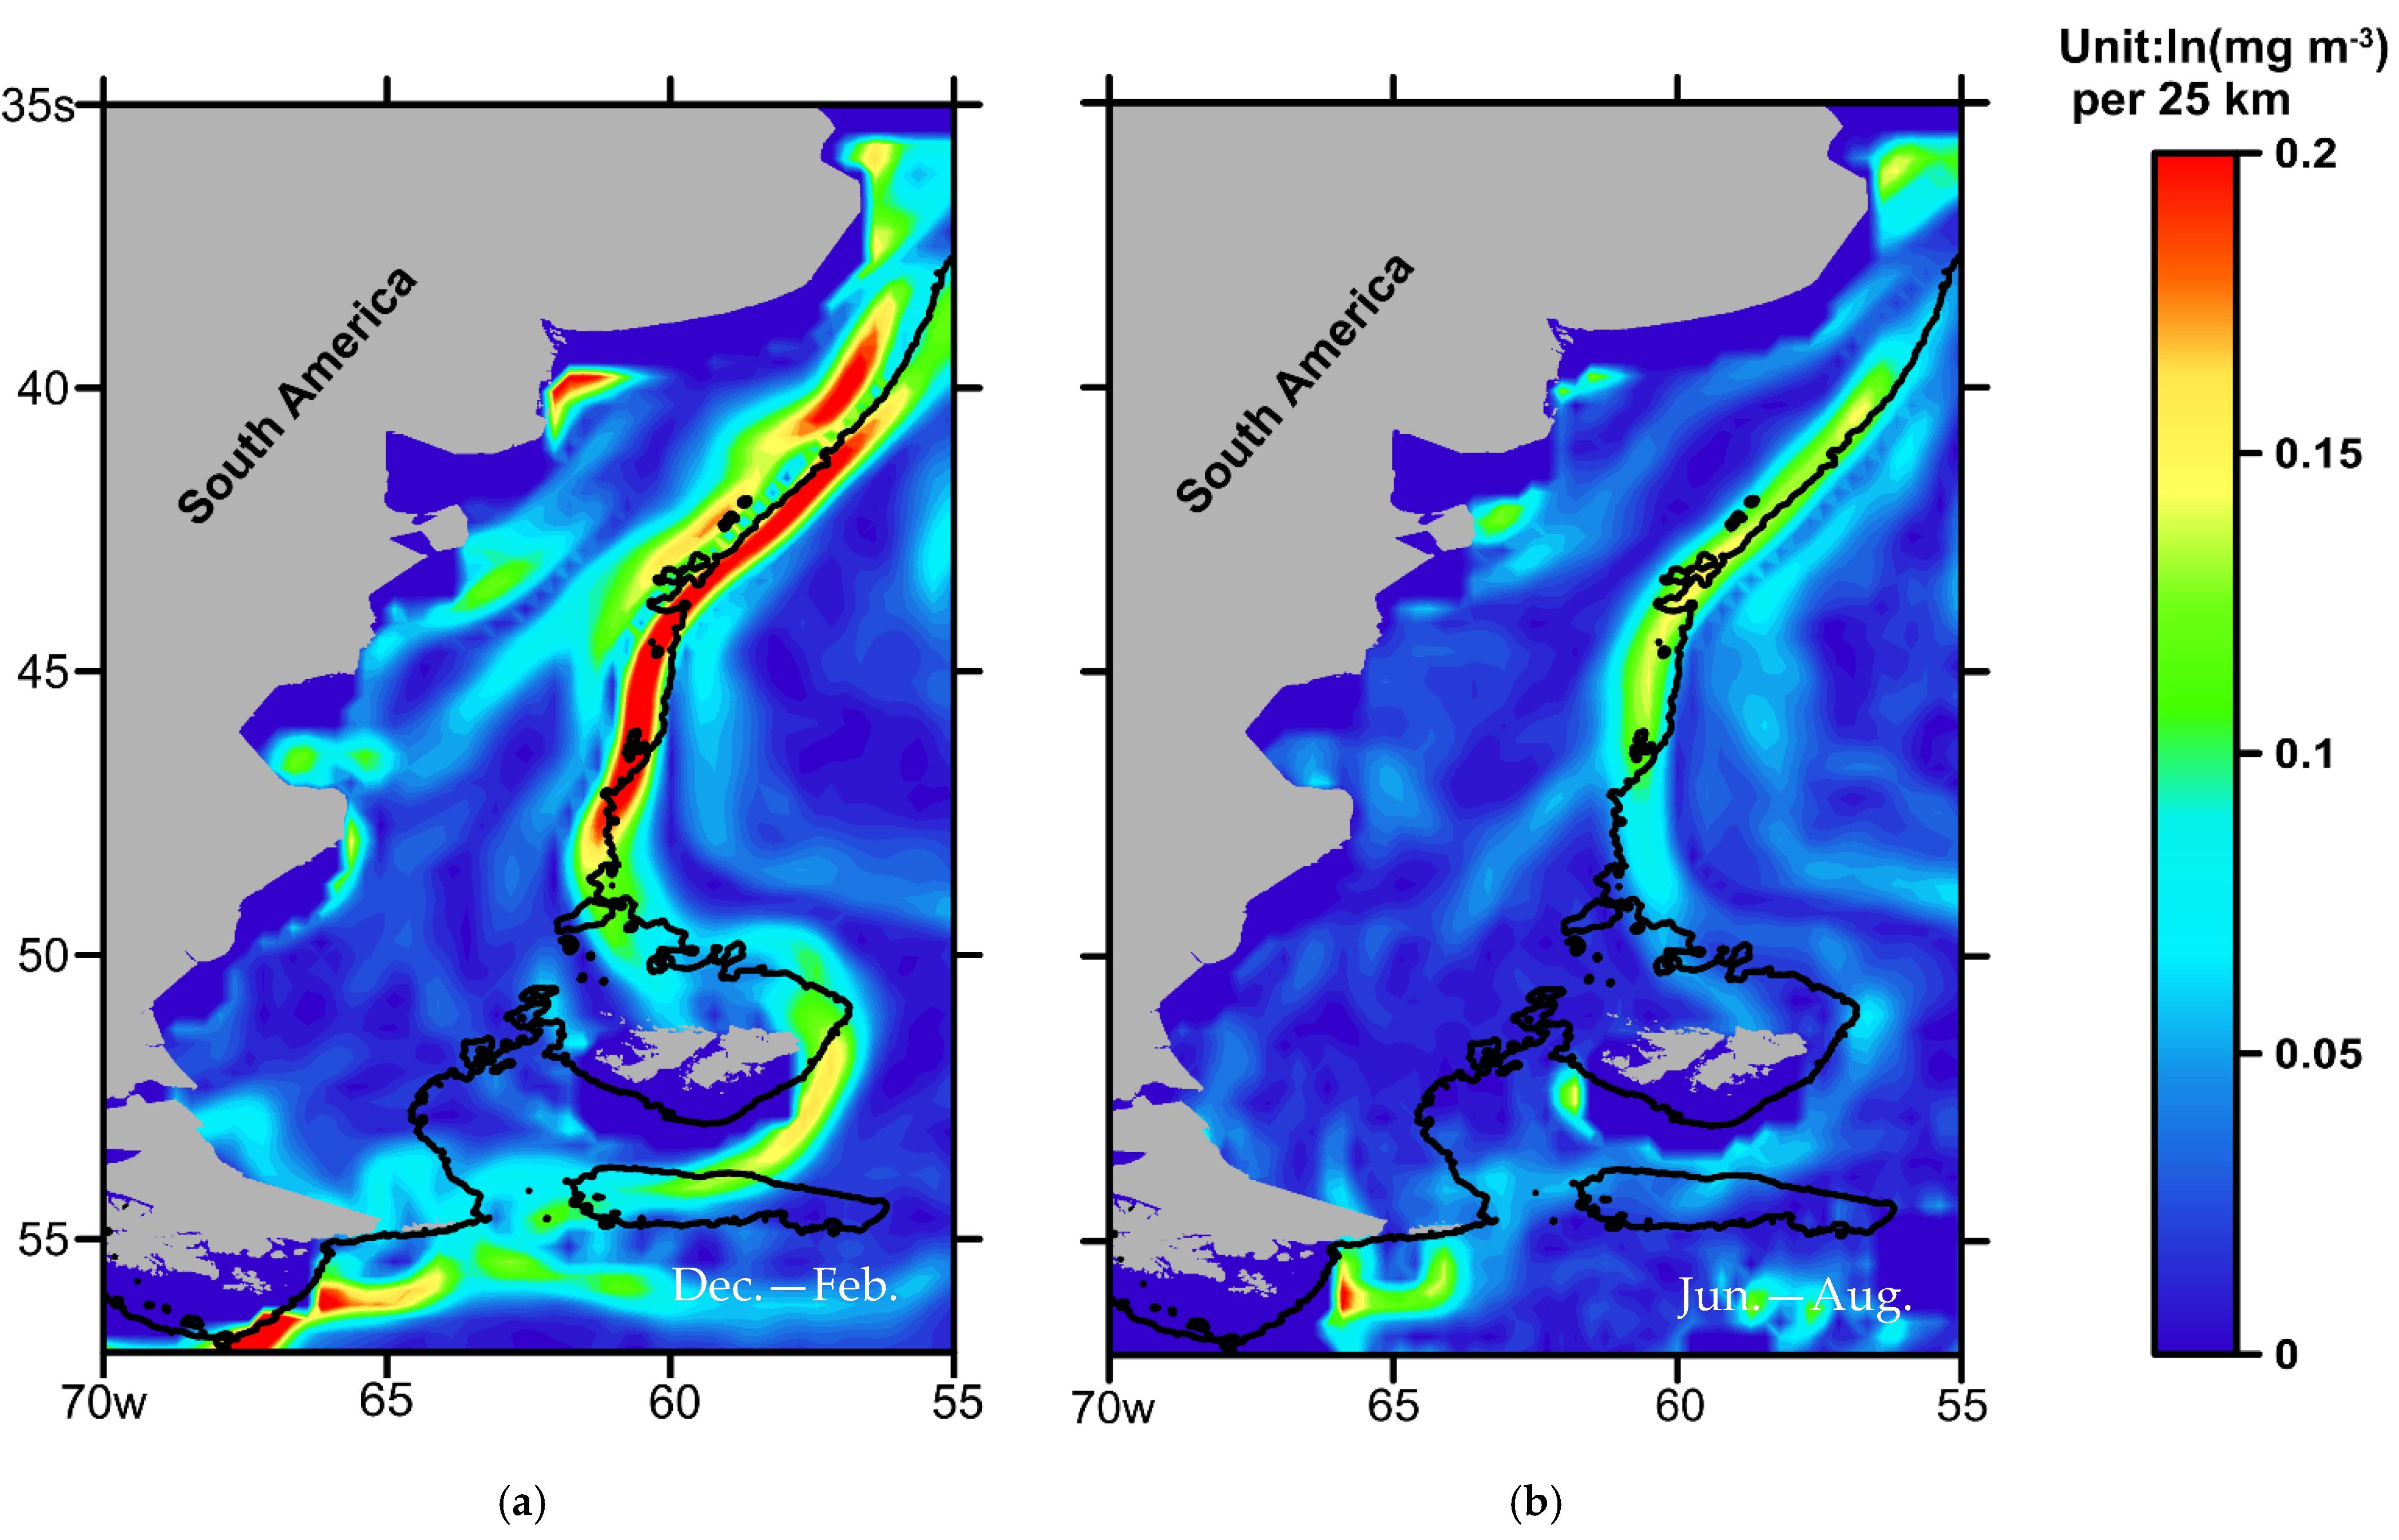
As displayed in Figure 10 and Figure 11, both the thermal fronts in the two regions had obvious seasonal differences. Therefore, the seasonal climatology CHL data were used to calculate the ocean color fronts of the two regions shown in Figure 12 and Figure 13. By comparing the results in Figure 12 and Figure 13, this study found that the seasonal distribution of ocean color fronts in the two regions was similar. Moreover, the ocean color fronts were not affected by the seasons, whether in winter or summer. As shown in Figure 12, the Kuroshio ocean color fronts in the ECS were mainly distributed along the 200 m isobaths, and the strength of the fronts in summer was stronger than that in winter. The Southern Ocean color fronts were similar to the Kuroshio ocean color fronts. The main reason for this phenomenon was that the low temperature in winter was not conducive to the reproduction of phytoplankton; hence, the concentration of CHL decreased, and the strength of the ocean color front also weakened.
The Kuroshio ocean color fronts in ECS were mainly distributed along the 200 m isobath line. Compared with the Kuroshio ocean color fronts, the Southern Ocean color fronts in the southwestern Atlantic were also mainly distributed along the 200 m isobaths line, but gradually deviated from the 200 m isobath between 50°S and 55°S. Indeed, this phenomenon was mainly influenced by the Southern Ocean jets [21]. The Southern Ocean is a known “high-nutrient, low-chlorophyll” zone due to iron limitation [18,26]. Jets play an important role in the transport of iron in the Southern Ocean, exporting high iron concentrations downstream, which can extend phytoplankton blooms hundreds or even thousands of kilometers downstream of the iron source regions [21]. As shown in Figure 13, the Southern Ocean color fronts were mainly distributed downstream of the Malvinas Islands between 50°S and 55°S. The jet transported iron downstream, where it collected downstream of the Malvinas Islands, which not only caused phytoplankton to flourish, but also increased chlorophyll concentrations in this area. Thus, chlorophyll concentration gradients were relatively higher downstream of the Malvinas Islands, making it easy to generate ocean color fronts. This is why the Southern Ocean color fronts did not appear to match the 200 m isobath line between 50°S and 55°S.
Based on the above experimental results, it was observed that the Kuroshio thermal fronts in the ECS and the Southern Ocean thermal fronts in the southwestern Atlantic were completely opposite in their seasonal distributions. Due to the different properties of ocean currents invading the two regions, the distribution of SSTs in the two regions had obvious seasonal differences. In the ECS, the warm current intruded into the shelf water and caused the spatially uniform surface heating in summer, which led to the disappearance of the thermal front. In the southwestern Atlantic, the homogenization of SSTs due to the increasing surface cooling effect caused by the cold current invading the shelf water was the reason for the disappearance of the thermal front in winter. The oceanic color front of these two regions was more stable than the thermal front. In both regions, the ocean color fronts were stronger in summer. The above analysis further proves that the properties of ocean currents significantly influenced the seasonal spatio-temporal variability of the fronts.

5. Conclusions

In this study, the 16-year (2004–2019) RSS SST and 13-year (2004–2019) MODIS CHL data were applied to investigate the position and seasonal spatio-temporal variation of the SOF in the southwestern Atlantic. Notably, during wintertime, the thermal front weakened and disappeared due to cooling, while the missing features could be derived from ocean color gradient magnitude maps. By comparing the monthly mean distribution and the path of the Southern Ocean thermal front and the Southern Ocean color front, this study found that the SOF in the southwestern Atlantic was caused by the Falkland Current invading the South American shelf water. At the same time, the exact position and the seasonal variation of the SOF were determined. The position of the SOF in the southwestern Atlantic was mainly distributed along the 200 m isobaths. Moreover, along the isobath, they skirted the Malvinas Islands from the east, and then gradually left the isobath to the west and reached Cape Horn. In summer, the SOF was easily generated, and its intensity was the strongest, while the distribution of the SOF was the least and its intensity was the weakest in winter. Since the Kuroshio front in the ECS and the SOF in the southwestern Atlantic are caused by the intrusion of strong ocean current into shelf water, the seasonal distribution of the two fronts was compared in this study. According to the results, the seasonal distribution of the Kuroshio thermal front in the ECS was completely opposite to the Southern Ocean thermal front in the southwestern Atlantic, proving that the ocean current properties significantly influenced the spatio-temporal variability of the fronts.

Author Contributions

Conceptualization, Z.W. and C.M.; methodology, Z.W. and M.L.; software, Y.H.; validation, Z.W.; formal analysis, Z.W., G.C. and C.M.; investigation, Z.W.; resources, G.C. and C.M.; data curation, C.M.; writing—original draft preparation, Z.W.; writing—review and editing, Z.W. and C.M.; visualization, Z.W.; supervision, G.C. and C.M.; project administration, C.M.; funding acquisition, C.M. All authors have read and agreed to the published version of the manuscript.

Funding

This research was funded by the National Natural Science Foundation of China (Grant Nos. 42030406 and 41906155), the Key Research and Development Program of Shandong Province (Grant No. 2019GHZ023), and the Marine S&T Fund of Shandong Province for the Pilot National Laboratory for Marine Science and Technology (Qingdao) (Grant No. 2018SDKJ0102-8).

Institutional Review Board Statement

Not applicable.

Informed Consent Statement

Not applicable.

Data Availability Statement

Publicly available datasets were analyzed in this study. This data can be found here: [http://www.remss.com/measurements/sea-surface-temperature/] and [https://hermes.acri.fr] (accessed on 18 September 2021).

Acknowledgments

We are very grateful for the microwave OI SST data produced by Remote Sensing Systems and sponsored by National Oceanographic Partnership Program (NOPP) and the NASA Earth Science Physical Oceanography Program. In addition, we are also very grateful for the CHL data used in this study, which was developed, validated, and distributed by ACRI-ST, France. We would like to thank the staff in the editorial office and the authors who have contributed to the paper.

Conflicts of Interest

The authors declare no conflict of interest.

References

  1. Castro, B.M.; Miranda, L.B. Physical oceanography of the western Atlantic continental shelf located between 4N and 34S. In Plankton Ecology of the Southwestern Atlantic; Springer: Cham, Switzerland, 1998. [Google Scholar]
  2. Bianchi, A.A.; Giulivi, C.F.; Piola, A.R. Mixing in the Brazil Malvinas Confluence. Deep Sea Res. Pt I Oceanogr. Res. Pap. 1993, 40, 1345–1358. [Google Scholar] [CrossRef]
  3. Piola, A.R.; Franco, B.C.; Palma, E.D.; Saraceno, M. Multiple jets in the Malvinas Current. J. Geophys. Res. Ocean. 2013, 118, 2107–2117. [Google Scholar] [CrossRef] [Green Version]
  4. Peterson, R.G.; Stramma, L. Upper-Level Circulation in the South-Atlantic Ocean. Prog. Oceanogr. 1991, 26, 1–73. [Google Scholar] [CrossRef] [Green Version]
  5. Stramma, L.; England, M.H. On the water masses and mean circulation of the South Atlantic Ocean. J. Geophys. Res. Ocean. 1999, 104, 20863–20883. [Google Scholar] [CrossRef]
  6. Deacon, G.J.D.R. The hydrology of the Southern Ocean. Discov. Rep. 1937, 15, 3–122. [Google Scholar]
  7. Reid, J.L. Antarctic Polar Front Zone. In Antarctic Oceanology I; AGU: Washington, DC, USA, 2013. [Google Scholar]
  8. Emery, W.J. Antarctic Polar Frontal Zone from Australia to the Drake Passage. J. Phys. Oceanogr. 2010, 7, 811–822. [Google Scholar] [CrossRef] [Green Version]
  9. Rintoul, S.R.; Sokolov, S.; Williams, M.J.M.; Molino, B.P.; Rosenberg, M.; Bindoff, N.L. Antarctic Circumpolar Current transport and barotropic transition at Macquarie Ridge. Geophys. Res. Lett. 2014, 41, 7254–7261. [Google Scholar] [CrossRef]
  10. Toggweiler, J.R.; Russell, J. Ocean circulation in a warming climate. Nature 2008, 451, 286–288. [Google Scholar] [CrossRef]
  11. Lopes, R.M.; Marcolin, C.R.; Brandini, F.P. Influence of oceanic fronts on mesozooplankton abundance and grazing during spring in the south-western Atlantic. Mar. Freshw. Res. 2016, 67, 626–635. [Google Scholar] [CrossRef]
  12. Legeckis, R. A survey of worldwide sea surface temperature fronts detected by environmental satellites. J. Geophys. Res. Ocean. 1979, 83, 4501–4522. [Google Scholar] [CrossRef]
  13. Belkin, I.M.; Cornillon, P.C.; Sherman, K. Fronts in Large Marine Ecosystems. Prog. Oceanogr. 2009, 81, 223–236. [Google Scholar] [CrossRef]
  14. Ullman, D.S.; Cornillon, P.C. Satellite-derived sea surface temperature fronts on the continental shelf off the northeast U.S. coast. J. Geophys. Res. Ocean. 1999, 104, 23459–23478. [Google Scholar] [CrossRef]
  15. Kostianoy, A.G.; Ginzburg, A.I.; Frankignoulle, M.; Delille, B. Fronts in the Southern Indian Ocean as inferred from satellite sea surface temperature data. J. Mar. Syst. 2004, 45, 55–73. [Google Scholar] [CrossRef] [Green Version]
  16. Moore, J.K.; Abbott, M.R.; Richman, J.G. Location and dynamics of the Antarctic Polar Front from satellite sea surface temperature data. J. Geophys. Res. Ocean. 1999, 104, 3059–3073. [Google Scholar] [CrossRef]
  17. Freeman, N.M.; Lovenduski, N.S.; Gent, P.R. Temporal variability in the Antarctic Polar Front (2002–2014). J. Geophys. Res. Ocean. 2016, 121, 7263–7276. [Google Scholar] [CrossRef]
  18. Venables, H.; Moore, C.M. Phytoplankton and light limitation in the Southern Ocean: Learning from high-nutrient, high-chlorophyll areas. J. Geophys. Res. Ocean. 2010, 115, C02015. [Google Scholar] [CrossRef]
  19. Sokolov, S.; Rintoul, S.R. On the relationship between fronts of the Antarctic Circumpolar Current and surface chlorophyll concentrations in the Southern Ocean. J. Geophys. Res. Ocean. 2007, 112, C07030. [Google Scholar] [CrossRef]
  20. Thomalla, S.J.; Fauchereau, N.; Swart, S.; Monteiro, P.M.S. Regional scale characteristics of the seasonal cycle of chlorophyll in the Southern Ocean. Biogeosciences 2011, 8, 2849–2866. [Google Scholar] [CrossRef] [Green Version]
  21. Graham, R.M.; De Boer, A.M.; van Sebille, E.; Kohfeld, K.E.; Schlosser, C. Inferring source regions and supply mechanisms of iron in the Southern Ocean from satellite chlorophyll data. Deep Sea Res. Pt I Oceanogr. Res. Pap. 2015, 104, 9–25. [Google Scholar] [CrossRef] [Green Version]
  22. Liu, Z.; Hou, Y. Kuroshio Front in the East China Sea from Satellite SST and Remote Sensing Data. IEEE Geosci. Remote Sens. Lett. 2012, 9, 517–520. [Google Scholar] [CrossRef]
  23. Chapman, C.C.; Lea, M.A.; Meyer, A.; Sallee, J.B.; Hindell, M. Defining Southern Ocean fronts and their influence on biological and physical processes in a changing climate. Nat. Clim. Chang. 2020, 10, 209–219. [Google Scholar] [CrossRef]
  24. Bard, E.; Rickaby, R.E.M. Migration of the subtropical front as a modulator of glacial climate. Nature 2009, 460, 380–393. [Google Scholar] [CrossRef] [PubMed]
  25. Wells, P.; Okada, H. Response of nannoplankton to major changes in sea-surface temperature and movements of hydrological fronts over Site DSDP 594 (south Chatham Rise, southeastern New Zealand), during the last 130 kyr. Mar. Micropaleontol. 1997, 32, 341–363. [Google Scholar] [CrossRef]
  26. Bristow, L.A.; Mohr, W.; Ahmerkamp, S.; Kuypers, M.M.M. Nutrients that limit growth in the ocean. Curr. Biol. 2017, 27, R474–R478. [Google Scholar] [CrossRef] [PubMed] [Green Version]
  27. Gentemann, C.L.; Meissner, T.; Wentz, F.J. Accuracy of Satellite Sea Surface Temperatures at 7 and 11 GHz. IEEE Trans. Geosci. Remote Sens. 2009, 48, 1009–1018. [Google Scholar] [CrossRef]
  28. Vazquez-Cuervo, J.; Dewitte, B.; Chin, T.M.; Armstrong, E.M.; Purca, S.; Alburqueque, E. An analysis of SST gradients off the Peruvian Coast: The impact of going to higher resolution. Remote Sens. Environ. 2013, 131, 76–84. [Google Scholar] [CrossRef]
  29. Maritorena, S.; d’Andon, O.H.F.; Mangin, A.; Siegel, D.A. Merged satellite ocean color data products using a bio-optical model: Characteristics, benefits and issues. Remote Sens. Environ. 2010, 114, 1791–1804. [Google Scholar] [CrossRef]
  30. Amante, C.; Eakins, B.W. ETOPO1 1 Arc-Minute Global Relief Model: Procedures, Data Sources and Analysis. Open Access Libr. J. 2009, 16, 20–25. [Google Scholar]
  31. Thompson, A.F. Jet Formation and Evolution in Baroclinic Turbulence with Simple Topography. J. Phys. Oceanogr. 2009, 40, 257–278. [Google Scholar] [CrossRef] [Green Version]
  32. Sokolov, S.; Rintoul, S.R. Multiple Jets of the Antarctic Circumpolar Current South of Australia. J. Phys. Oceanogr. 2007, 37, 1394–1412. [Google Scholar] [CrossRef]
  33. Volkov, D.L.; Zlotnicki, V. Performance of GOCE and GRACE-derived mean dynamic topographies in resolving Antarctic Circumpolar Current fronts. Ocean Dyn. 2012, 62, 893–905. [Google Scholar] [CrossRef]
  34. Graham, R.M.; de Boer, A.M.; Heywood, K.J.; Chapman, M.R.; Stevens, D.P. Southern Ocean fronts: Controlled by wind or topography? J. Geophys. Res. Ocean. 2012, 117, C08018. [Google Scholar] [CrossRef] [Green Version]
  35. Campbell, J.W. The lognormal distribution as a model for bio-optical variability in the sea. J. Geophys. Res. Ocean. 1995, 100, 13237–13254. [Google Scholar] [CrossRef]
  36. Canny, J.; Intelligence, M. A Computational Approach to Edge Detection. IEEE Trans. Pattern Anal. Mach. Intell. 1986, 6, 679–698. [Google Scholar] [CrossRef]
  37. Wang, Y.; Yu, Y.; Zhang, Y.; Zhang, H.R.; Chai, F. Distribution and variability of sea surface temperature fronts in the south China sea. Estuar. Coast. Shelf Sci. 2020, 240, 106793. [Google Scholar] [CrossRef]
  38. Wong, G.; Chao, S.Y.; Li, Y.H.; Shiah, F.K. The Kuroshio edge exchange processes (KEEP) study—An introduction to hypotheses and highlights. Cont. Shelf Res. 2000, 20, 335–347. [Google Scholar] [CrossRef]
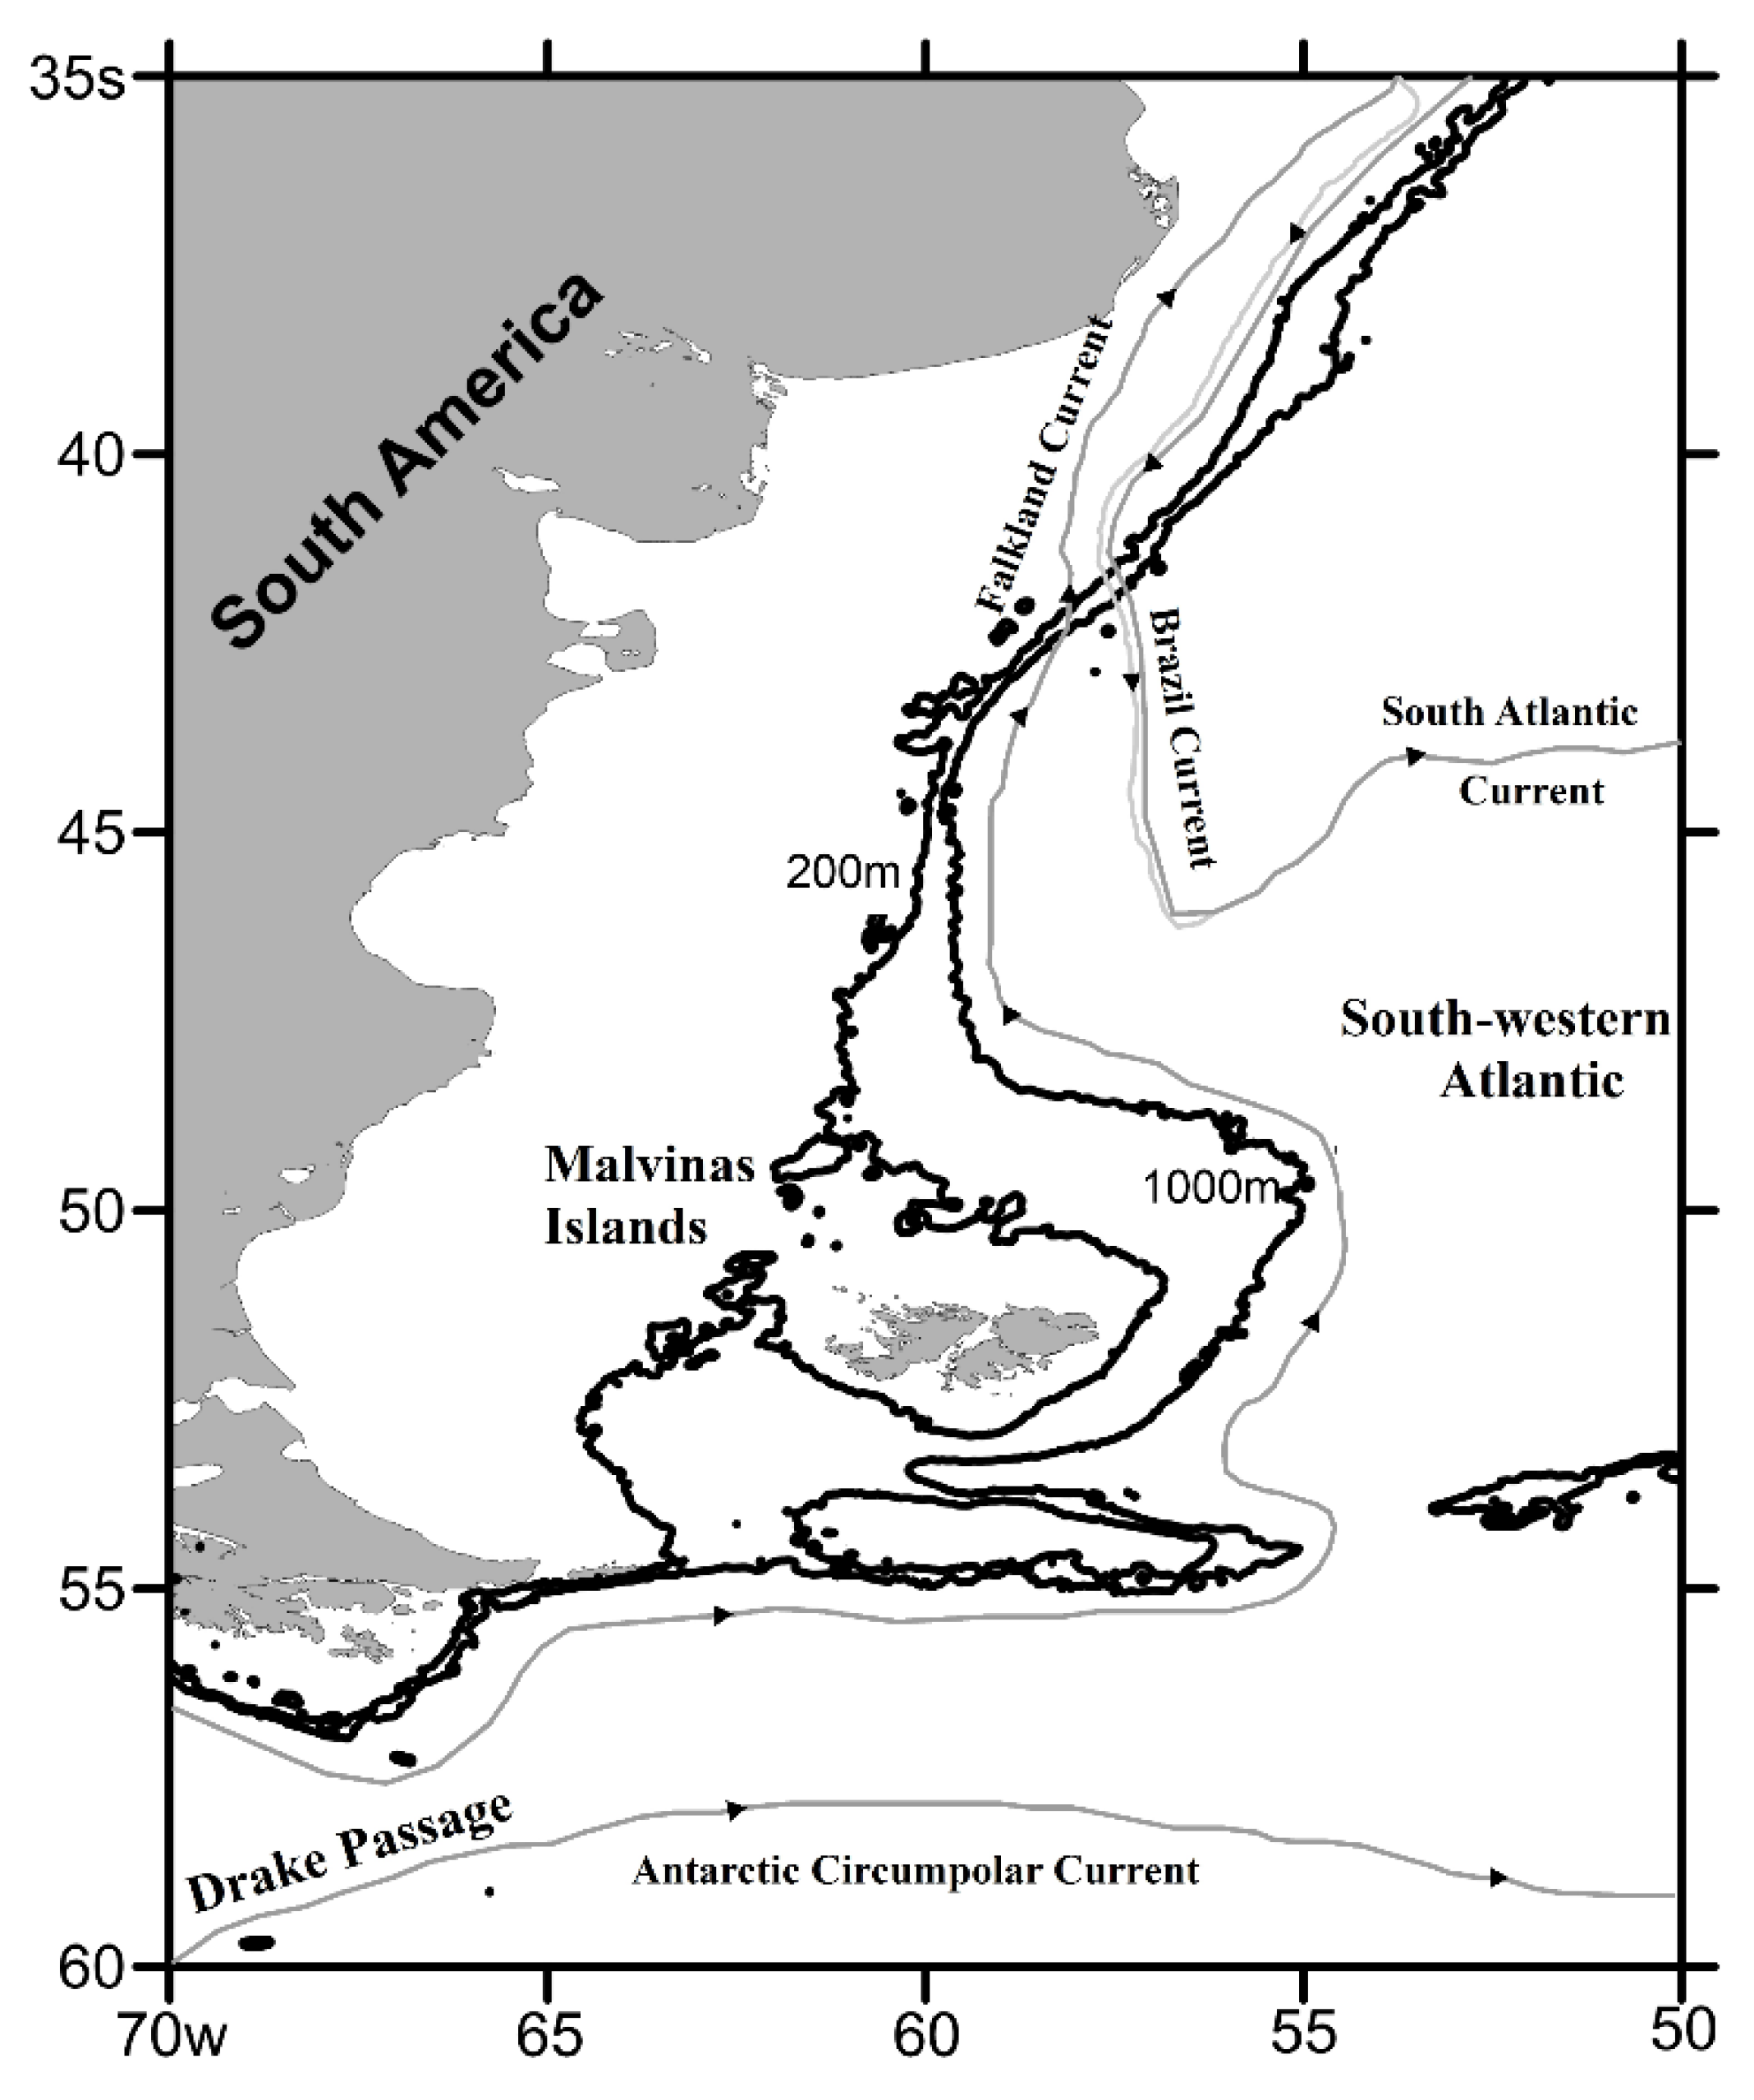
Figure 1. Chart of the southwestern Atlantic with bottom bathymetry from ETOP01 digital topography.
Remotesensing 13 04402 g001
Figure 2. Seasonal mean SST distributions over the southwestern Atlantic obtained from RSS high-resolution SST data for 2004–2019: (a) the summer mean SST distribution; (b) the winter mean SST distribution. The solid black contour lines are 200 m isobaths.
Remotesensing 13 04402 g002
Figure 3. Seasonal mean CHL lognormal distributions over the southwestern Atlantic obtained from MODIS high-resolution CHL data for 2007–2019: (a) the summer mean CHL distribution; (b) the winter mean CHL distribution. The solid black contour lines are 200 m isobaths.
Remotesensing 13 04402 g003
Figure 4. Monthly mean SST gradient magnitude maps obtained from RSS high-resolution SST data for 2004–2019. (al) respectively represent the average gradient magnitude of each month from January to December. The black contours delineate the 200 m isobaths.
Remotesensing 13 04402 g004
Figure 5. Monthly mean ocean color gradient magnitude maps obtained from MODIS high-resolution CHL data for 2007–2019. (al) respectively represent the average gradient magnitude of each month from January to December. The black contours are the 200 m isobaths.
Remotesensing 13 04402 g005
Figure 6. Southern Ocean front path patterns of seasonal climatology in the southwestern Atlantic, including Southern Ocean thermal fronts (red solid lines) and Southern Ocean color fronts (green solid lines). (ad) respectively represent the comparison results of two frontal paths in each season. The black contours are the 200 m isobaths.
Remotesensing 13 04402 g006
Figure 7. Comparison of the annual mean paths and the monthly mean paths of the Southern Ocean color fronts in the southwestern Atlantic. (al) respectively represent the comparison results of the monthly average path and the annual average path from January to December. The blue solid lines represent the annual mean paths, and the green solid lines represent the monthly mean paths.
Remotesensing 13 04402 g007
Figure 8. Seasonal mean SST distributions in the East China Sea obtained from RSS high-resolution SST data for 2004–2019: (a) the summer mean SST distribution; (b) the winter mean SST distribution. The solid black contour lines are the 200 m isobaths.
Remotesensing 13 04402 g008
Figure 9. Seasonal mean CHL lognormal distributions in the East China Sea obtained from MODIS high-resolution CHL data for 2007–2019: (a) the summer mean CHL distribution; (b) the winter mean CHL distribution. The solid black contour lines are the 200 m isobaths.
Remotesensing 13 04402 g009
Figure 10. Seasonal mean SST gradient magnitude maps for the East China Sea: (a) the summer mean SST gradient magnitude map; (b) the winter mean SST gradient magnitude map. The black contours delineate the 200 m isobaths.
Remotesensing 13 04402 g010
Figure 11. Seasonal mean SST gradient magnitude maps for the southwestern Atlantic: (a) the summer mean SST gradient magnitude map; (b) the winter mean SST gradient magnitude map. The black contours delineate the 200 m isobaths.
Remotesensing 13 04402 g011
Figure 12. Seasonal mean ocean color gradient magnitude maps for the East China Sea: (a) the summer mean ocean color gradient magnitude map; (b) the winter mean ocean color gradient magnitude map. The black contours are the 200 m isobaths.
Remotesensing 13 04402 g012
Figure 13. Seasonal mean ocean color gradient magnitude maps for the southwestern Atlantic: (a) the summer mean ocean color gradient magnitude map; (b) the winter mean ocean color gradient magnitude map. The black contours are the 200 m isobaths.
Remotesensing 13 04402 g013
Table 1. The difference rates between the annual mean paths and the monthly mean paths of the Southern Ocean color fronts.
SeasonFallWinterSpringSummer
MonthMar.Apr.May.Jun.Jul.Aug.Sep.Oct.Nov.Dec.Jan.Feb.
Difference Rate (%)5.87%5.48%5.84%5.92%4.75%4.98%5.16%5.74%6.15%7.37%7.03%5.96%
Publisher’s Note: MDPI stays neutral with regard to jurisdictional claims in published maps and institutional affiliations.