Abstract
In the Loess Plateau (LP) of China, the vegetation degradation and soil erosion problems have been shown to be curbed after the implementation of the Grain for Green program. In this study, the LP is divided into the northwestern semi-arid area and the southeastern semi-humid area using the 400 mm isohyet. The spatial–temporal evolution of the vegetation NDVI during 2000–2015 are analyzed, and the driving forces (including factors of climate, environment, and human activities) of the evolution are quantitatively identified using the geographical detector model (GDM). The results showed that the annual mean NDVI in the entire LP was 0.529, and it decreased from the semi-humid area (0.619) to the semi-arid area (0.346). The mean value of the coefficient of variation of the NDVI was 0.1406, and it increased from the semi-humid area (0.1165) to the semi-arid area (0.1926). The annual NDVI growth rate in the entire LP was 0.0079, with the NDVI growing faster in the semi-humid area (0.0093) than in the semi-arid area (0.0049). The largest increments of the NDVI were from grassland, farmland, and woodland. The GDM results revealed that changes in the spatial distribution of the NDVI could be primarily explained by the climatic and environmental factors in the semi-arid area, such as precipitation, soil type, and vegetation type, while the changes were mainly explained by the anthropogenic factors in the semi-humid area, such as the GDP density, land-use type, and population density. The interactive analysis showed that interactions between factors strengthened the impacts on the vegetation change compared with an individual factor. Furthermore, the ranges/types of factors suitable for vegetation growth were determined. The conclusions of this study have important implications for the formulation and implementation of ecological conservation and restoration strategies in different regions of the LP.
1. Introduction
Vegetation plays an indispensable role in regional terrestrial ecosystems, and constitutes an essential link between soil, water, and atmosphere. Moreover, vegetation is the material basis for the survival of surface organisms [1,2]. Vegetation coverage effectively reduces the surface soil erosion caused by exogenous forces such as wind, diminishes the splash erosion caused by raindrops, alleviates the hydrodynamic erosion of rivers, and improves the soil environment. Therefore, it is of crucial importance to explore the vegetation coverage changes and dynamics for the soil erosion prevention and control, ecological environmental protection, and sustainable social and economic development [3,4]
At present, the main monitoring method used in large-scale vegetation coverage change research is based on satellite remote sensing because of its wide spatial range and gradually improving resolution, which effectively makes up for the shortcomings of traditional monitoring methods [5]. The normalized difference vegetation index (NDVI) is strongly associated with the vegetation coverage, leaf area index, biomass, and land use, which can comprehensively reflect the vegetation’s greenness, photosynthesis intensity, and vegetation metabolism intensity [6,7]. The NDVI can be used to quantitatively evaluate the regional vegetation coverage and growth, which is considered to be an effective indicator for monitoring terrestrial vegetation changes, and thus, has been widely used in research and management in various fields, such as agriculture and ecology [8].
The growth process of vegetation is affected by multiple factors. Temperature and precipitation are directly related to global climate change and are generally regarded as the most important natural factors affecting vegetation growth and changes in the long-term [9,10]. Since the 20th century, intense human activities, which are characterized by industrialization and urbanization, have brought about rapid population and economic growth, rapid changes in land use, and ecological and environmental problems such as vegetation degradation and soil erosion, resulting in significant impacts on vegetation growth and changes in the short-term [11,12,13].
The Loess Plateau (LP) of China is located in the semi-arid/humid zones, the local ecological environment of which is extremely fragile. Vegetation degradation and soil erosion have been particularly prominent in this region throughout history, making the LP main sediment source (nearly 90%) of the Yellow River (middle and lower reaches), once the most sand-laden river in the world [14]. Exploring the evolution of vegetation and its driving forces on the LP cannot only help formulate strategies on ecological restoration for this area, but also help predict the sediment and tackle the sediment related problems (such as reservoir sedimentation and flood control) in the Yellow River. Since the 1980s, particularly after 2000 when the Grain for Green program (GGP) was implemented in this area, the restoration of vegetation has been witnessed, and accordingly, the expansion trend of the soil erosion has been curbed [15]. In addition, a new stage of the GGP was launched in 2014 to consolidate the achievements [16].
Many scholars have studied the causes of the vegetation coverage changes on the LP. There are limitations in the existing research, which mainly include the following. (1) Many studies used NDVI data from original Global Inventory Modeling and Mapping Studies (GIMMS) or GIMMS NDVI data expanded from Moderate Resolution Imaging Spectroradiometer (MODIS) and Satellite Pour l’Observation de la Terre (SPOT) Vegetation (VGT) NDVI [6,17,18,19]. The spatial resolution of 8 km leads to serious mixed pixels and insufficient detail capture, making it difficult for the results to show the actual spatial–temporal changes in the vegetation coverage. (2) Several studies used statistical methods, such as correlation or regression, by assuming that the vegetation growth is linearly related to the potential factors with time, but they ignored the spatial heterogeneity [20,21]. Some evidence has suggested that there is no strict linear correlation between the factors and the vegetation growth under the climate change. A statistical linear correlation model may not be able to accurately describe the internal relationship [22,23]. (3) Several studies only considered the influences of climatic factors on vegetation coverage changes, and they neglected other environmental factors. Actually, certain environmental factors (e.g., altitude, slope, and slope aspect) also have key impacts on vegetation growth and changes. For instance, the altitude affects the temperature, precipitation, and soil, thus affecting the vertical distribution of the vegetation. The slope aspect affects the degree to which the slope receives various hydrothermal conditions, which has a certain impact on the type and distribution of the vegetation. Moreover, the steep slopes mean that there may be serious soil erosion, which inhibits the vegetation growth. However, many environmental factors cannot be quantified using statistical methods, which limits the exploration of the effects of environmental factors on vegetation changes [24,25]. (4) Most previous studies merely evaluated the individual effects of the factors without quantitatively evaluating the interactive effects between multiple factors on vegetation changes. (5) The majority of previous studies focused on the entire area and local area of the LP (e.g., relevant research was carried out on Shannxi Province in the LP [26]), little comparative research has been conducted for different climatic regions, and the research conclusions are not conducive to guiding policymaking for different regions.
In this study, attempts were made to address the above research gaps. SPOT NDVI products were used to evaluate the vegetation coverage and growth. The spatial–temporal evolution of the NDVI on the LP during 2000–2015 was explained by the Geographical Detector Model (GDM) [27]. Based on the spatial analysis of variance, the GDM was shown to avoid linear assumption between variables and has a clear physical meaning, which reflects the explanatory power of an individual independent variable acting alone or of multiple independent variables interacting on a dependent variable. Moreover, the GDM can utilize a variety of type variables such as geomorphic type, soil type, vegetation type, and land-use type, and thus, is superior to the traditional statistical methods. The GDM is widely adopted in the exploration of the spatial differentiation characteristics of issues in natural and social sciences. For instance, the GDM was applied to study the explanatory powers of different factors on vegetation changes in Shannxi, Mongolia, Sichuan, and the Heihe River Basin [26,28,29,30].
The study begins by introducing the study area, method and data in Section 2. Then, the linear regression, coefficient of variation and transfer matrix models are used to identify the spatial–temporal evolution of the NDVI on the semi-arid/humid areas of the LP during 2000–2015 in Section 3. The influences of climatic (precipitation and temperature), environmental (altitude, slope, slope aspect, geomorphic type, soil type, and vegetation type), and anthropogenic factors (GDP density, population density, land-use type) on the spatial–temporal evolution of the vegetation NDVI on the semi-arid/humid areas of the LP are identified with the factor, interaction, risk and ecological detectors of the GDM. Section 4 further compares the results in the semi-arid and sub-humid areas, proposes suggestions for formulating and implementing ecological protection and restoration strategies in different areas, and discusses the connections and distinctions with other studies as well as the possible future work. Section 5 summarizes the main findings of the paper. The achievements gained from this study will benefit policy makers and administrative managers in their strategy development and implementation.
2. Data and Methods
2.1. Study Area
The LP is located north of central China, with a total area of 6.49 × 10⁵ km2 (107°54′–114°33′ E, 33°41′–41°16′ N), as shown in Figure 1. It is the transitional zone from the coastal humid region to the inland arid region, and from forest to grassland. The terrain is generally low in the southeast and high in the northwest, including the mountain area, the loess hilly area, the loess tableland area, and the valley plain area. The LP has a temperate monsoon climate, with an annual mean temperature of 3.6–14.3 °C and precipitation of 200–800 mm. Both the temperature and precipitation increase from the northwest to the southeast. The annual and daily temperature ranges are large. Furthermore, the seasonal variation of precipitation is large. Heavy rains occur frequently during summer, resulting in the soil erosion, floods, landslides, debris flows and other disasters. The total annual radiation is 50.2 × 10⁴ J/cm2 to 67.0 × 10⁴ J/cm2, with a long illumination time and high radiation. About 200 rivers have their headwaters on the LP, including the Tao River, Zuli River, Qingshui River, Huangfuchuan River, Kuye River, Wuding River, Beiluo River Wei River, Qin River, Fen River, etc. The study area includes the provinces (or autonomous regions) of Qinghai, Gansu, Ningxia, Inner Mongolia, Shaanxi, Shanxi, and Henan. Throughout history, the overall vegetation coverage has been low and soil erosion has been very serious on the LP due to the special natural and geographical environment, complex vegetation types, and severe impacts of human activities. Since the 1980s, a series of measures for soil and water conservation have been taken to control the soil erosion. Particularly, after 2000, when the GGP was implemented, the regional ecological environment has significantly improved.
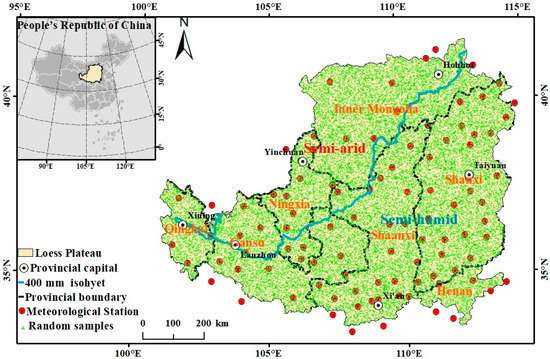
Figure 1.
Study area.
The study area was divided into semi-arid and semi-humid areas using the 400 mm isohyet (calculated using the annual mean precipitation data for the LP during 2000–2015) to carry out the comparative analysis. It should be noted that the 400 mm isohyet is of great significance to the physical geography and socio-economic regionalization in China, and it coincides with the Huhuanyong Line. In addition to dividing the climatic zones, this line divides the forest vegetation from the grassland vegetation and the densely populated area from the sparsely populated area [31,32].
2.2. Geographical Detector Model (GDM)
The GDM is proposed based on spatial differentiation theory and geographic information system (GIS) spatial analysis technique [27]. It is usually employed to study the factors affecting spatial hierarchical heterogeneities and the underlying mechanisms. The model assumes similar spatial pattern between the independent and dependent variables if these variables are spatially correlated [33]. The GDM consists of four detectors, including the factor, interaction, risk and ecological detectors.
(1) The factor detector can be utilized to analyze the spatial heterogeneity and to quantify the explanatory power (measured by the q value) of different impact factors X to dependent variable Y.
where , and with the increase in the q value, the explanatory power is expected to be stronger; h represents the stratum of variable Y (or factor X), ; Nh is the unit number of stratum h; N is the unit number in all the strata; represents the variance of variable Y of stratum h; σ2 is the variance of variable Y of all the strata.
(2) The interaction detector can be used to determine the explanatory power of interaction between two factors (say X1 and X2) on the spatial heterogeneity of variable Y, and to judge whether the interactive effect on variable Y would be enhanced or weakened. The steps are as follows. (1) Compute the respective q value of factors X1 and X2 to variable Y (qX1 and qX2). (2) Compute the q value of the interaction between X1 and X2 to Y (qX1&X2). (3) Compare qX1, qX2, and qX1&X2. If max(qX1,qX2) < qX1&X2 < qX1 + qX2 is true, the factors X1 and X2 enhance each other (bi-enhance). If qX1&X2 > qX1 + qX2 is true, the nonlinearity of two factors is enhanced (nonlinear enhancement). The interaction criteria are presented in Table 1.

Table 1.
Definition of interaction detector.
(3) The risk detector is utilized to judge the difference of significance between the attribute mean values of two strata with the t statistic:
where is the attribute mean value within stratum h; nh is the number of samples within stratum h; Var is the variance.
(4) The ecological detector is developed to compare the explanatory powers of two factors, X1 and X2, on variable Y with the F statistic:
where NX1 and NX2 are the sample numbers of factors X1 and X2, respectively; SIVX1 and SIVX2 are the sum of the internal variances of the strata from factors X1 and X2, respectively; and L1 and L2 are the strata numbers of factors X1 and X2, respectively.
2.3. Data Description
In this study, multi-source data (Table 2) were collected, mainly including the following.
Table 2.
Climatic, environmental and anthropogenic factors.
(1) Vector data: The shape file data for the LP were downloaded from the Resource and Environment Science and Data Center (RESDC), Chinese Academy of Sciences (available from http://www.resdc.cn, accessed on 27 October 2021).
(2) Vegetation NDVI data: The SPOT NDVI data were used in this study (Figure 2), which were obtained from the RESDC. The time span is 2000–2015, the time step is 1 year, and the spatial resolution is 1 km × 1 km. It should be noted that the annual maximum synthesis method was used to obtain the annual value of NDVI, and therefore, there was no area with NDVI < 0.
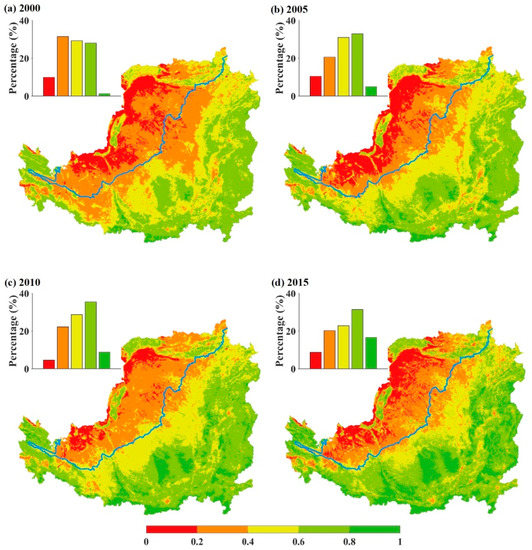
Figure 2.
Spatial distribution of NDVI on Loess Plateau during 2000–2015.
According to [34], the NDVI of the LP was divided into 5 intervals using the equal interval method, i.e., 0 to 0.2, 0.2 to 0.4, 0.4 to 0.6, 0.6 to 0.8, and 0.8 to 1.0, which represent 5 types of vegetation, i.e., low, relatively low, medium, relatively high, and high vegetation coverages, respectively.
(3) Meteorological data: The monthly mean precipitation and temperature from 101 meteorological stations on the LP and in its surrounding areas during 2000–2015 were collected for use, which were downloaded from the China Meteorological Data Service Center (available from http://data.cma.cn/site/index.html, accessed on 27 October 2021). The annual value of the data from each meteorological station was calculated. Moreover, ANUSPLIN v4.3 was used to perform spatial interpolation of the meteorological station data, which were divided into 6 intervals using the equal interval method. Therefore, annual precipitation and temperature grid data (Figure 3 and Figure 4) with the same projection mode, spatial resolution, and time series as the NDVI data were obtained. It should be noted that ANUSPLIN is a widely used software application for spatial interpolation, which was developed on the basis of the thin plate smoothing splines theory. The main feature of ANUSPLIN is that the topographic information can be used in the spatial interpolation of the meteorological data [35].
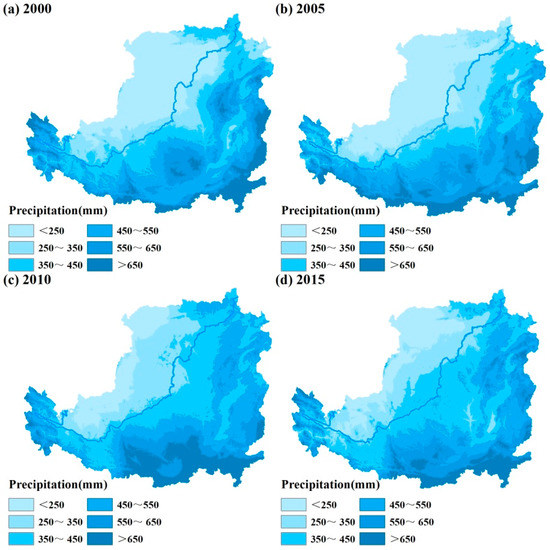
Figure 3.
Spatial distribution of precipitation on Loess Plateau during 2000–2015.
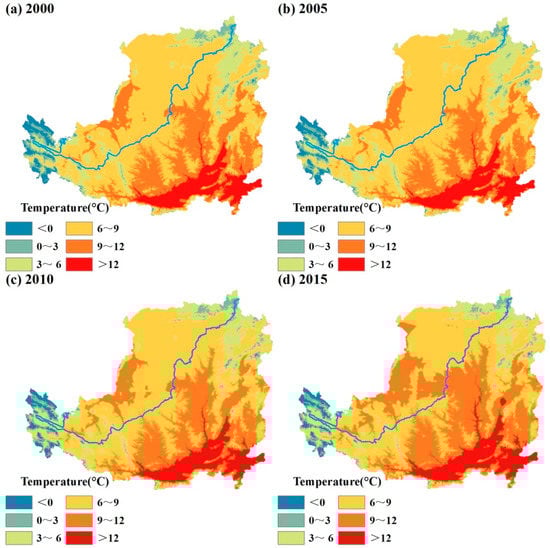
Figure 4.
Spatial distribution of temperature on Loess Plateau during 2000–2015.
(4) DEM data: The DEM data were downloaded from the Shuttle Radar Topography Mission (available from http://srtm.csi.cgiar.org/, accessed on 27 October 2021). According to [28], the natural breakpoint method was used to divide the elevation data into 6 categories, including 90 to 790 m, 790 to 1228 m, 1228 to 1611 m, 1611 to 2136 m, 2136 to 2963 m, and 2963 to 4914 m (Figure 5a).
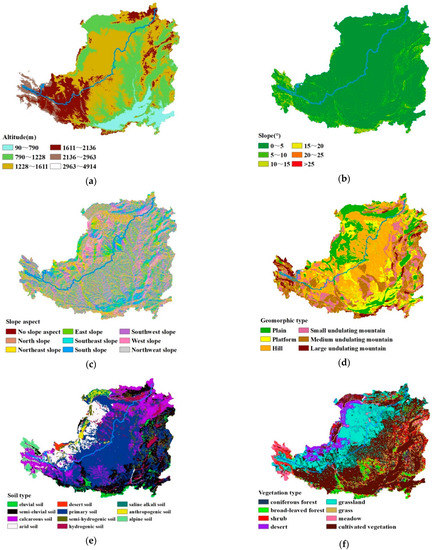
Figure 5.
Ranges/types of environmental factors on Loess Plateau. (a) Altitude. (b) Slope. (c) Slope aspect. (d) Geomorphic type. (e) Soil type. (f) Vegetation type.
Based on the DEM data, the slope and slope aspect data for the study area were extracted using GIS spatial analysis tools. According to the policy of the Grain for Green [36], the slope was divided into 6 categories, including 0° to 5°, 5° to 10°, 10° to 15°, 15° to 20°, 20° to 25°, >25° (Figure 5b).
The slope aspect was divided into 9 categories, which are denoted as no slope aspect (−1), east slope (67.5° to 112.5°), west slope (247.5° to 292.5°), south slope (157.5° to 202.5°), north slope (0° to 22.5° and 337.5° to 360°), southeast slope (112.5° to 157.5°), northeast slope (22.5° to 67.5°), southwest slope (202.5° to 247.5°), and northwest slope (292.5° to 337.5°) (Figure 5c).
(5) Geomorphic type data: These data were obtained from the RESDC. Referring to the Geomorphological Atlas of the People’s Republic of China (1:1 million) (2009), the geomorphology was divided into 6 types, including plain, platform, hill, small undulating mountain, medium undulating mountain, and large undulating mountain (Figure 5d).
(6) Soil type data: These data were downloaded from the RESDC. Referring to the 1:1 Million Soil Map of the People’s Republic of China (1995), the soil was divided into 11 types, including alpine soil, anthropogenic soil, saline alkali soil, hydrogenetic soil, semi-hydrogenetic soil, primary soil, desert soil, arid soil, calcareous soil, semi-eluvial soil, and eluvial soil (Figure 5e).
(7) Vegetation type data: These data were obtained from the RESDC. Referring to the 1:1 Million Vegetation Atlas of China (2001), the vegetation was divided into 8 types, including cultivated vegetation, meadow, grass, grassland, desert, shrub, broad-leaved forest, and coniferous forest (Figure 5f).
(8) Socio-economic data: These data were obtained from the RESDC. The GDP density and population density data for China in 2000, 2005, 2010, and 2015 were obtained. The GDP density and population density were divided into 6 categories, respectively (Figure 6 and Figure 7).
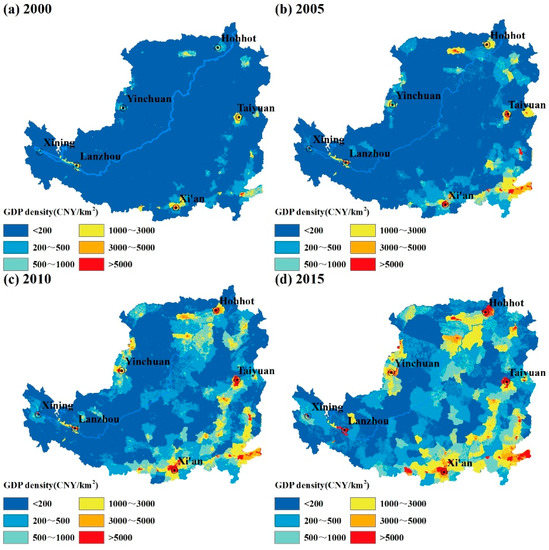
Figure 6.
Spatial distribution of GDP density on Loess Plateau during 2000–2015.
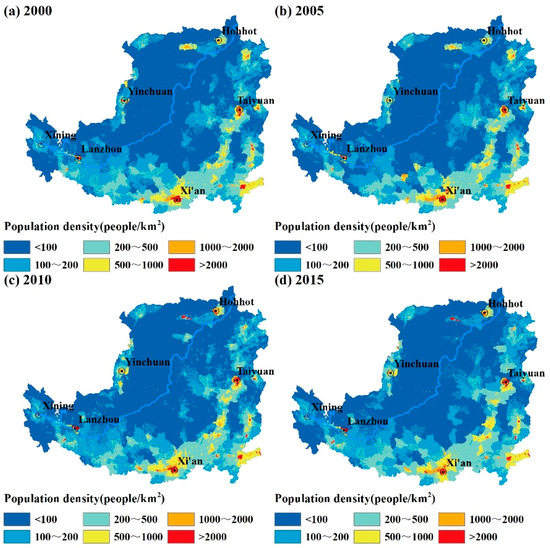
Figure 7.
Spatial distribution of population density on Loess Plateau during 2000–2015.
(9) Land-use type data: These data were downloaded from the RESDC. The spatial resolution is 1 km × 1 km. There are 6 land-use types, including unused land, construction land, water bodies, grassland, woodland, and farmland (Figure 8), with a total of 36 transfer combinations.
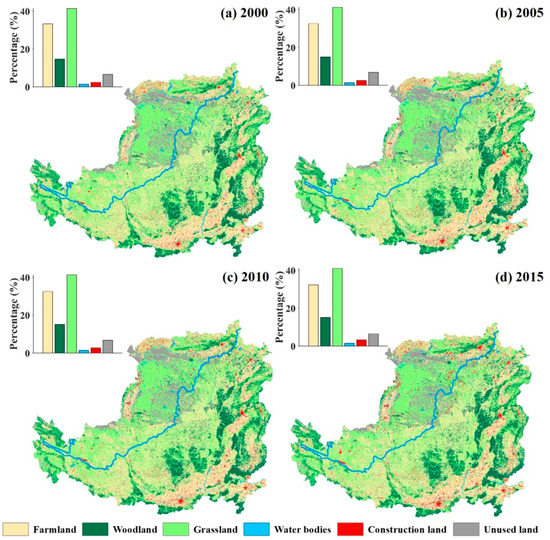
Figure 8.
Spatial distribution of land-use type on Loess Plateau during 2000–2015.
The influences of the various factors on the spatial–temporal evolution of the NDVI on the LP were calculated and analyzed with the GDM. The various factors were classified into climatic, environmental, and anthropogenic aspects. For the climatic factors, precipitation, and temperature were selected as proxy variables. For the environmental factors, altitude, slope, slope aspect, geomorphic type, soil type, and vegetation type were selected as proxy variables. For the anthropogenic factors, the proxy variables were the GDP density, population density, and land-use type.
The following points should be noted: (1) Although environmental factors do not change in the short-term, these factors play a key role in vegetation growth and changes. Thus, they were also considered in this study according to [37]. (2) The data for each factor were discretized since the input of the GDM needs to be discrete data. (3) The data for the factors were converted into grid data with the 1 km × 1 km spatial resolution (same with the NDVI data) in order to facilitate calculation and analysis. (4) Due to the large area of the LP, the GDM’s calculation capacity would be exceeded if all of the grid data were used. Therefore, the sampling method was used and 32,000 sampling points were evenly selected in space to carry out the calculations and analysis (Figure 1), and the consistency of the results of each calculation could be ensured. (5) Two types of inputs were considered in the analysis of the explanatory power of different factors for the spatial–temporal evolution of the NDVI on the LP using the GDM. First, the typical annual values of 2000, 2005, 2010, and 2015 were used to drive the GDM to analyze the influence of various factors on the spatial distribution state of the NDVI. Second, the differences between the annual mean values from 2000 to 2005 and those from 2010 to 2015 were calculated, which were used to drive the GDM to analyze the influence of various factors on the spatial distribution change of the NDVI.
3. Results
3.1. Spatial–Temporal Evolution in NDVI
(1) Grid scale area and area transfer of the NDVI and the driving forces:
The vegetation types on the LP are shown in Figure 5f. In the semi-arid area, the vegetation types were mainly grassland, cultivated vegetation, and desert, accounting for 15.9, 7.2 and 5.0% of the total area, respectively. While in the semi-humid area, cultivated vegetation, grassland, shrub, and broad-leaved forest were widely distributed, accounting for 37.8, 9.2, 6.7 and 5.4% of the total area, respectively.
The grid scale area transfer matrix of the NDVI on the LP during 2000–2015 is shown in Table 3. In 2000, over the entire LP, the coverage areas of the low, relatively low, medium, relatively high, and high vegetation accounted for, respectively, 10.0, 31.5, 29.3, 28.1 and 1.3% of the total area; in the semi-arid area, these types of vegetation accounted for 9.4, 16.0, 5.1, 1.2 and 0.01%, respectively; and in the semi-humid area, they accounted for 0.5, 15.5, 24.2, 26.9 and 1.3%, respectively. In 2015, over the entire LP, the coverage areas of the low, relatively low, medium, relatively high, and high vegetation accounted for 8.7, 20.3, 22.9, 31.5 and 16.7%, respectively; in the semi-arid area, they accounted for 8.5, 14.5, 5.0, 3.3 and 0.4%, respectively; and in the semi-humid area, they accounted for 0.3, 5.8, 17.9, 28.1 and 16.3%, respectively. The proportion of the coverage areas with an NDVI of greater than 0.6 increased significantly, and the proportions of the relatively low vegetation converted to medium vegetation, medium vegetation converted to relatively high vegetation, and relatively high vegetation converted to high vegetation accounted for the largest proportions. The areas of these transitions accounted for, respectively, 10.8, 15.8 and 14.1% of the total area.
Table 3.
Grid scale area transfer matrix of NDVI on Loess Plateau during 2000–2015 (km2).
The land-use type on the LP during 2000–2015 is shown in Figure 8, and the grid scale area transfer matrix is shown in Table 4. In 2000, over the entire LP, the proportions of the farmland, woodland, grassland, water bodies, construction land, and unused land were 33.3, 14.7, 41.5, 1.4, 2.5 and 6.7%, respectively; in the semi-arid area, they were 7.1, 1.2, 16.6, 0.7, 0.8 and 5.3%, respectively; and in the semi-humid area, they were 26.2, 13.5, 24.9, 0.8%, 1.7 and 1.4%, respectively. In 2015, over the entire LP, the proportions of farmland, woodland, grassland, water bodies, construction land, and unused land were 32.4, 15.1, 41.2, 1.5, 3.3 and 6.6%, respectively; in the semi-arid area, they were 6.9, 1.3, 16.4, 0.7, 1.1 and 5.2%, respectively; and in the semi-humid area, they were 25.4, 13.8, 24.8, 0.8, 2.1 and 1.4%, respectively. Overall, the area of the change in land-use types on the LP was not significant, and it was mainly in the 0.94% decrease in farmland, the 0.44% increase in woodland, and the 0.82% increase in construction land. To a certain extent, these changes reflect the impacts of human activities in the study area, such as the implementation of the GGP and urbanization-related development.
Table 4.
Grid scale area transfer matrix of land-use type on Loess Plateau during 2000–2015 (km2).
The difference in the NDVI of the different land-use type transfers on the LP during 2000–2015 is shown in Figure 9. It should be noted that Figure 9 was obtained by subtracting the NDVI data for 2000 from that for 2015 on the grid scale, and the differences in the NDVI of the different land-use type transfers were then counted. Figure 9a shows the mean difference in the NDVI of all grids of different land-use type transfers. Most of the transfers had a positive impact on the NDVI, except for the transfers of farmland and water bodies to construction land, which decreased the NDVI slightly (reduction rates of −0.0173 and −0.0016, respectively). Moreover, the largest increment of the NDVI was due to farmland transferred into woodland (increment of 0.1411), woodland transferred into farmland (increment of 0.1359), and unused land transferred into farmland (increment of 0.1338). Figure 9b shows the total difference in the NDVI of all grids of different land-use type transfers. It can be seen that the largest increments of the NDVI were due to grassland, farmland, and woodland, and these land-use types did not change. The increments were 28,539.55, 25,545.42, and 12,450.86, respectively. The probable reasons are as follows. On the LP, the precipitation is limited and there exists a gap between agricultural water demand and supply. In the past, there used to be large areas of farmland that could not be irrigated adequately and were greatly affected by the precipitation. With the implementation of the GGP, some infertile areas of farmland that could not be irrigated adequately were returned to the woodland or grassland, and what remained was adequately irrigated or fertile areas of farmland that were less affected by the precipitation. Moreover, with the development of agricultural technologies and the optimization and adjustment of planting structures, the crop yields on the LP were continuously increased.
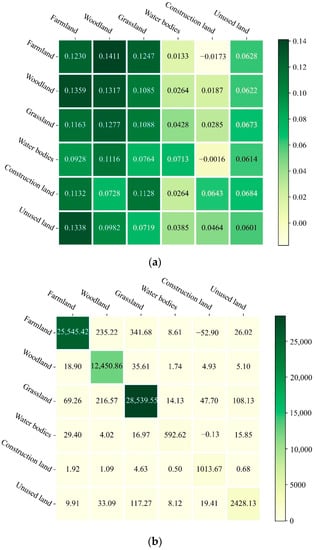
Figure 9.
Difference in NDVI of different land-use type transfers during 2000–2015. (a) Mean difference in NDVI of all grids of different land-use type transfers. (b) Total difference in NDVI of all grids of different land-use type transfers.
(2) Spatial changes in the NDVI on the grid scale:
The spatial changes in the NDVI on the grid scale on the LP during 2000–2015 are shown in Figure 10. Figure 10a indicates that the annual mean value of the NDVI on the LP was 0.529, with an uneven spatial distribution, i.e., decreasing from the southeastern to the northwestern areas. The high and low values were mainly distributed in the semi-humid and semi-arid areas, with annual mean values of 0.619 and 0.346, respectively.
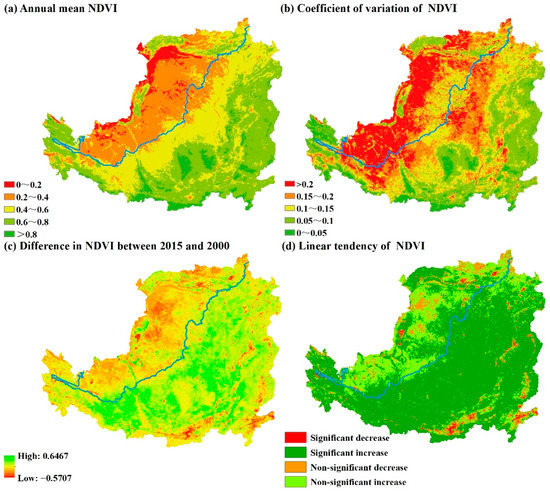
Figure 10.
Spatial change in NDVI on grid scale on Loess Plateau during 2000–2015.
Figure 10b shows that the mean value of the coefficient of variation of the NDVI was 0.1406 on the LP, with an uneven spatial distribution, i.e., increasing from the southeastern semi-humid area (mean value of 0.1165) to the northwestern semi-arid area (mean value of 0.1926). There was 7.0% of the total area with 0 < CV < 0.05, mainly distributed in the eastern and southern regions. The area with 0.05 ≤ CV < 0.1 accounted for 25.9% of the total area. The area with 0.1 ≤ CV < 0.15 accounted for 25.7% of the total area. Moreover, there was 41.4% of the total area with 0.15 ≤ CV < 0.2 and CV ≥ 0.2, mainly distributed in the semi-arid area as well as the junction of the semi-arid/humid areas.
Figure 10c,d show that of the total area, the positive area accounted for 91.5% while the negative area accounted for 8.5%, which was obtained by subtracting the NDVI in 2000 from that in 2015. The NDVI in most areas of the LP (92.8% of the total area) increased from 2000 to 2015, indicating that the ecological environment in the region significantly improved. In addition, 70.0% of the area passed the significance test (p < 0.05); and 68.6% of the area increased significantly, while 1.4% of the area decreased significantly. The decrease in the NDVI was mainly concentrated in the semi-arid area as well as the urban area with rapid economic development and a large population concentration.
(3) Temporal changes in the NDVI on the regional scale:
The temporal changes in the NDVI on the regional scale on the LP during 2000–2015 are shown in Figure 11. The NDVI on the LP exhibited a fluctuating upward trend. The annual NDVI growth rates of the entire LP, the semi-arid area, and the semi-humid area were 0.0079, 0.0049, and 0.0093, respectively, indicating that the growth rate of the NDVI in the semi-humid area was higher than in the semi-arid area after the GGP was implemented.
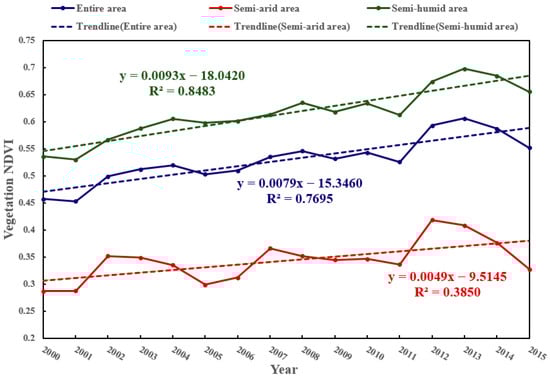
Figure 11.
Temporal change in NDVI on regional scale on Loess Plateau during 2000–2015.
3.2. Individual Effects of Factors on NDVI
(1) Results of typical years:
Using the typical annual values of 2000, 2005, 2010, and 2015 to drive the factor detector, the individual effects of the factors (represented by the q value) could be obtained, as shown in Figure 12.
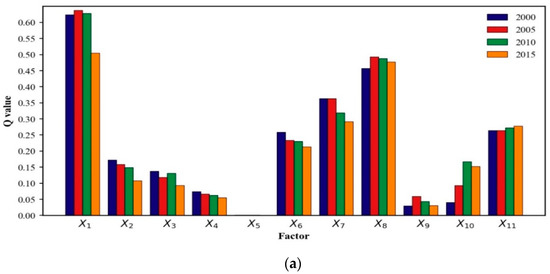
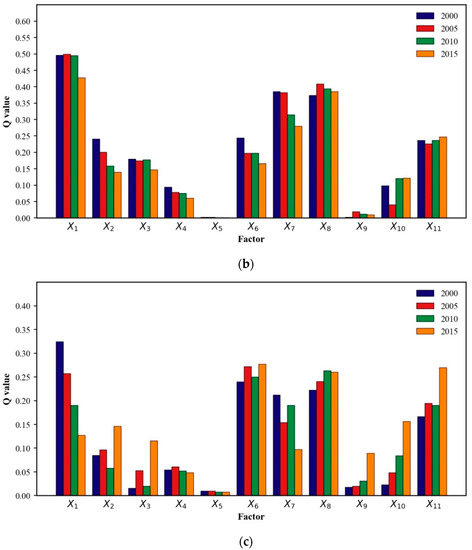
Figure 12.
Effects of individual factors derived from the factor detector with inputs of typical annual values. (a) Entire area. (b) Semi-arid area. (c) Semi-humid area.
For the entire LP, the order of the annual mean q values was precipitation (q = 0.5985) > vegetation type (q = 0.4790) > soil type (q = 0.3346) > land-use type (q = 0.2697) > geomorphic type (q = 0.2341) > temperature (q = 0.1469) > altitude (q = 0.1203) > population density (q = 0.1132) > slope (q = 0.0649) > GDP density (q = 0.0411) > slope aspect (q = 0.0012).
For the semi-arid area, the order of the annual mean q values was precipitation (q = 0.4796) > vegetation type (q = 0.3906) > soil type (q = 0.3409) > land-use type (q = 0.2368) > geomorphic type (q = 0.2013) > temperature (q = 0.1851) > altitude (q = 0.1695) > population density (q = 0.0954) > slope (q = 0.0774) > GDP density (q = 0.0110) > slope aspect (q = 0.0019).
For the semi-humid area, the order of the annual mean q values was geomorphic type (q = 0.2597) > vegetation type (q = 0.2466) > precipitation (q = 0.2250) > land-use type (q = 0.2053) > soil type (q = 0.1637) > temperature (q = 0.0965) > population density (q = 0.0783) > slope (q = 0.0541) > altitude (q = 0.0512) > GDP density (q = 0.0397) > slope aspect (q = 0.0086).
(2) Results of annual mean differences:
Using the differences between the annual mean values from 2000 to 2005 and those from 2010 to 2015 to drive the factor detector, the individual effects of the factors (represented by the q value) could be obtained, as shown in Figure 13.
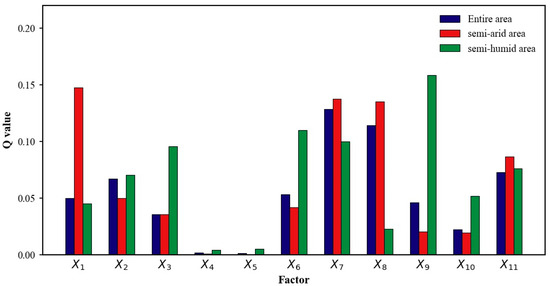
Figure 13.
Effects of individual factors derived from the factor detector with inputs of differences between annual mean values.
For the entire LP, the order of the q values was soil type (q = 0.1287) > vegetation type (q = 0.1142) > land-use type (q = 0.0729) > temperature (q = 0.0680) > geomorphic type (q = 0.0532) > precipitation (q = 0.0508) > GDP density (q = 0.0463) > altitude (q = 0.0357) > population density (q = 0.0224) > slope (q = 0.0020) > slope aspect (q = 0.0010).
For the semi-arid area, the order of the q values was precipitation (q = 0.1476) > soil type (q = 0.1373) > vegetation type (q = 0.1353) > land-use type (q = 0.0864) > temperature (q = 0.0500) > geomorphic type (q = 0.0417) > altitude (q = 0.0358) > GDP density (q = 0.0202) > population density (q = 0.0195) > slope aspect (q = 0.0030) > slope (q = 0.0010).
For the semi-humid area, the order of the q values was GDP density (q = 0.1583) > geomorphic type (q = 0.1101) > soil type (q = 0.0999) > altitude (q = 0.0955) > land-use type (q = 0.0761) > temperature (q = 0.0705) > population density (q = 0.0520) > precipitation (q = 0.0452) > vegetation type (q = 0.0227) > slope aspect (q = 0.0049) > slope (q = 0.0040).
In summary, the explanatory powers of the factors on the spatial distribution state of the NDVI in typical years and the spatial distribution change of the NDVI during 2000–2015 were different. In addition, the explanatory powers were different for the entire LP, and for the semi-arid/humid areas. With respect to the spatial distribution state of the NDVI in typical years, the decisive climatic factor was precipitation, the decisive environmental factors were geomorphic type, soil type, and vegetation type, and the decisive anthropogenic factor was land-use type. With respect to the spatial distribution change of the NDVI during 2000–2015, in the semi-arid area, the climatic and environmental factors were the decisive factors, including precipitation, soil type, and vegetation type; the impacts of anthropogenic factors, such as the GDP density, land-use type, and population density, were more significant in the semi-humid area.
3.3. Interactive Effects between Factors on NDVI
(1) Results of typical years:
Using the typical annual values of 2000, 2005, 2010, and 2015 to drive the interaction detector, the interactive effects of the factors (represented by the q value) could be obtained, as shown in Figure 14. For the entire LP and the semi-arid/humid areas, the interactive effects between factors were greater than their individual effects, indicating that none of the factors acted independently, but they had a certain enhancement effect, including nonlinear enhancement and bi-enhancement.
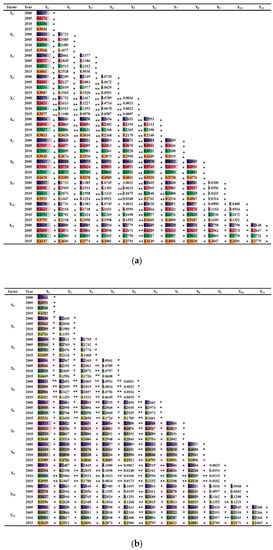
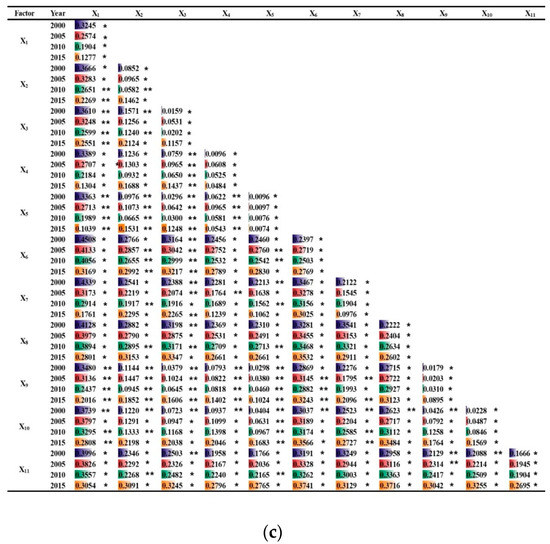
Figure 14.
Effects of interactive factors derived from the interaction detector with inputs of typical annual values. (Note: * indicates bi-enhance; ** indicates nonlinear enhance). (a) Entire area. (b) Semi-arid area. (c) Semi-humid area.
For the entire LP, 26.4% of the interactive factor combinations exhibited nonlinear enhancement and 73.6% exhibited bi-enhancement. The interactive effect between precipitation and vegetation type was the strongest (mean annual?q = 0.7034), followed by precipitation and soil type (mean annual?q = 0.6987).
For the semi-arid area, 32.3% of the interactive factor combinations exhibited nonlinear enhancement and 67.7% exhibited bi-enhancement. The interactive effect between precipitation and soil type was the strongest (mean annual?q = 0.6375), followed by precipitation and vegetation type (mean annual?q = 0.6235).
For the semi-humid area, 44.1% of the interactive factor combinations exhibited nonlinear enhancement and 55.9% exhibited bi-enhancement. The interactive effect between precipitation and geomorphic type was the strongest (mean annual?q = 0.3961), followed by precipitation and vegetation type (mean annual?q = 0.3701).
(2) Results of annual mean differences:
Using the differences between the annual mean values from 2000 to 2005 and those from 2010 to 2015 to drive the interaction detector, the interactive effects of the factors (represented by the q value) could be obtained, as shown in Figure 15.
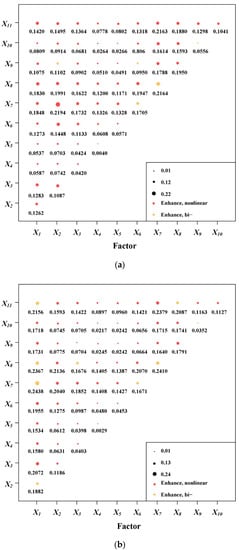
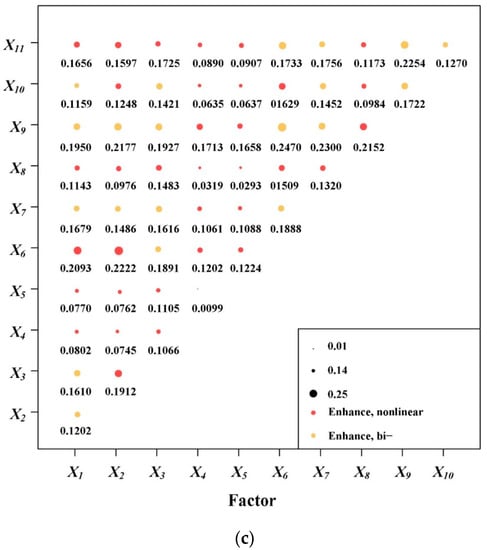
Figure 15.
Effects of interactive factors derived from the interaction detector with inputs of differences between annual mean values. (a) Entire area. (b) Semi-arid area. (c) Semi-humid area.
For the entire LP, 90.9% of the interactive factor combinations exhibited nonlinear enhancement and 9.1% exhibited bi-enhancement. The interactive effect between soil type and temperature was the strongest (q = 0.2194), followed by soil type and vegetation type (q = 0.2164).
For the semi-arid area, 83.6% of the interactive factor combinations exhibited nonlinear enhancement and 16.4% exhibited bi-enhancement. The interactive effect between precipitation and soil type was the strongest (q = 0.2438), followed by soil type and land-use type (q = 0.2379).
For the semi-humid area, 61.8% of the interactive factor combinations exhibited nonlinear enhancement and 38.2% exhibited bi-enhancement. The interactive effect between GDP density and geomorphic type was the strongest (q = 0.2470), followed by GDP density and soil type (q = 0.2300).
3.4. Ranges or Types of Factors for NDVI
Using the typical annual values for 2000, 2005, 2010, and 2015 to drive the risk detector, the ranges or the types of factors for the NDVI could be obtained, as shown in Figure 16. The ranges or the types of factors for the NDVI were different in different years in the entire LP, and in the semi-arid/humid areas.
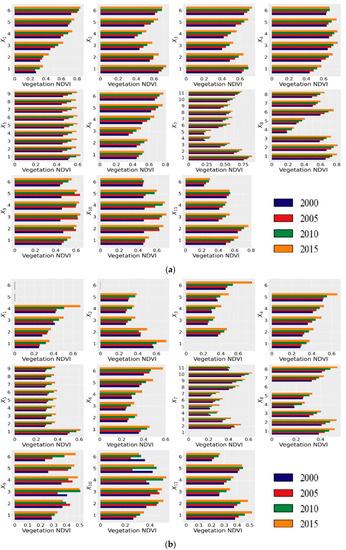
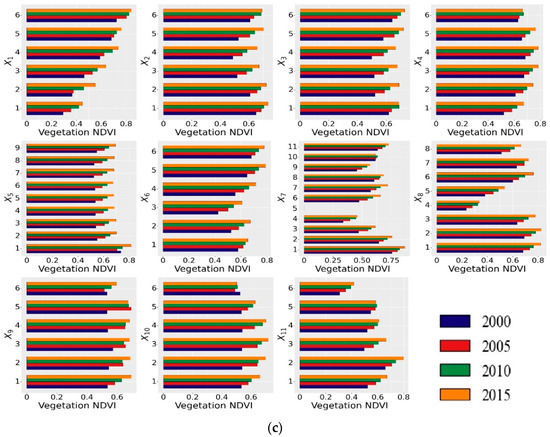
Figure 16.
Ranges or types of factors for NDVI derived from the risk detector with inputs of typical annual values. (a) Entire area. (b) Semi-arid area. (c) Semi-humid area.
For the entire LP, the suitable precipitation range for the NDVI was greater than 650 mm (as the precipitation increased, the NDVI increased), the temperature range was smaller than 0 °C (as the temperature increased, the NDVI decreased first and then increased), the altitude ranged from 90 to 790 m or from 2963 to 4914 m (as the altitude increased, the NDVI decreased first and then increased), the slope ranged from 15° to 20°, the slope aspect was no slope aspect, the geomorphic type was large undulating mountain, the soil type was eluvial soil, the vegetation type was broad-leaved forest, the GDP density ranged from 500 to 1000 CNY/km2, the population density ranged from 200 to 500 people/km2, and the land-use type was woodland.
For the semi-arid area, the suitable precipitation for the NDVI ranged from 450 to 550 mm, the temperature range was smaller than 0 °C, the altitude ranged from 2963 to 4914 m, the slope ranged from 20° to 25°, the slope aspect was no slope aspect, the geomorphic type was large undulating mountain, the soil type was anthropogenic soil, the vegetation type was cultivated vegetation, the GDP density ranged from 500 to 1000 CNY/km2, the population density ranged from 200 to 500 people/km2, and the land-use type was farmland.
For the semi-humid area, the suitable precipitation range for the NDVI was greater than 650 mm, the temperature range was smaller than 0 °C, the altitude ranged from 2963 to 4914 m, the slope ranged from 15° to 20°, the slope aspect was no slope aspect, the geomorphic type was large undulating mountain, the soil type was eluvial soil, the vegetation type was broad-leaved forest, the GDP density ranged from 3000 to 5000 CNY/km2, the population density ranged from 200 to 500 people/km2, and the land-use type was woodland.
3.5. Differences of Significance between Factors on NDVI
Using the typical annual values for 2000, 2005, 2010, and 2015 to drive the ecological detector, the differences of significance between factors for the NDVI could be obtained, as shown in Table 5. For the entire LP, the differences were not significant between the precipitation and other factors in the different years (i.e., relatively certain). The significant differences between the soil type and the other factors did not vary in the different years (i.e., relatively certain). The soil type showed no significant differences with precipitation, GDP density, population density, and land-use type, but it exhibited significant differences with other factors. The differences of significance varied between the other pairs of factors in the different years (i.e., relatively uncertain).
Table 5.
Statistical significance of factors derived from the ecological detector with inputs of typical annual values.
4. Discussion
4.1. Comparison between Semi-Arid and Semi-Humid Areas
Climatic factors influence the environmental conditions of the LP; while environmental factors determine the range and intensity of the human activities. The three types of factors are not independent of each other, and they interact with each other to influence the spatial distribution of the NDVI and its evolution over time on the LP. Based on the above results, there were significant spatial differences in the NDVI and its driving forces on both sides of the 400 mm isohyet on the LP.
For the semi-arid area to the northwest of the 400 mm isohyet, a number of observations were made. (1) The analysis of the spatial–temporal evolution revealed that the precipitation is relatively small and the temperature is relatively low, with annual mean values of 294 mm and 7.6 °C, respectively. The geomorphic types are mainly hills and plains (accounting for 12.3 and 11.0%, respectively). The soil types are mainly primary soil and arid soil (accounting for 11.1 and 8.0%, respectively). The main vegetation types are grassland, cultivated vegetation, and desert (accounting for 15.9, 7.2 and 5.0%, respectively). The grassland and farmland are the main land-use types (accounting for 16.4% and 6.9% in 2015, respectively). Moreover, the GDP density is relatively small (772 CNY/km2 in 2015). The population density is relatively small (96 people/km2 in 2015). The vegetation coverage is relatively low (annual mean NDVI of 0.346), and the coefficient of variation is relatively large (mean value of 0.1926). The growth rate of the NDVI was 0.0049/a after 2000 when the GGP was implemented. (2) The analysis based on the GDM revealed the following: The individual factors that determine the changes in the spatial distribution of the NDVI are the climatic and environmental factors, such as precipitation (q = 0.1476), soil type (q = 0.1373), vegetation type (q = 0.1353), temperature (q = 0.0500), and geomorphic type (q = 0.0417). The main interactive factors are precipitation and soil type (q = 0.2438), and soil type and land-use type (q = 0.2379). The suitable precipitation for the NDVI ranged from 450 to 550 mm, the temperature range was smaller than 0 °C, the altitude ranged from 2963 to 4914 m, the slope ranged from 20° to 25°, the slope aspect was no slope aspect, the geomorphic type was large undulating mountain, the soil type was anthropogenic soil, the vegetation type was cultivated vegetation, the GDP density ranged from 500 to 1000 CNY/km2, the population density ranged from 200 to 500 people/km2, and the land-use type was farmland.
Observations were also made regarding the semi-humid area to the southeast of the 400 mm isohyet. (1) The analysis of the spatial–temporal evolution revealed that both the precipitation and the temperature are relatively high, with annual mean values of 531 mm and 8.3 °C, respectively. The geomorphic types are mainly hills and medium undulating mountains (accounting for 19.4 and 13.3%, respectively). The soil types are mainly primary soil and semi-eluvial soil (accounting for 30.9 and 14.9%, respectively). The main vegetation types are cultivated vegetation and grassland (accounting for 37.8 and 9.2%, respectively). The farmland and grassland are the main land-use types (accounting for 25.4 and 24.8% in 2015, respectively). Moreover, the GDP density is relatively large (834 CNY/km2 in 2015). The population density is relatively large (212 people/km2 in 2015). The vegetation coverage is relatively high (annual mean NDVI of 0.619), and the coefficient of variation is relatively small (mean value of 0.1165). The growth rate of the NDVI was 0.0093/a after the implementation of the GGP in 2000. (2) The analysis based on the GDM revealed the following. The individual factors that determine the changes in the spatial distribution of the NDVI are the anthropogenic factors, such as GDP density (q = 0.1583), land-use type (q = 0.0761), and population density (q = 0.0520). The main interactive factors are GDP density and geomorphic type (q = 0.2470), and GDP density and soil type (q = 0.2300). The suitable precipitation range for the NDVI was greater than 650 mm, the temperature range was smaller than 0 °C, the altitude ranged from 2963 to 4914 m, the slope ranged from 15° to 20°, the slope aspect was no slope aspect, the geomorphic type was large undulating mountain, the soil type was eluvial soil, the vegetation type was broad-leaved forest, the GDP density ranged from 3000 to 5000 CNY/km2, the population density ranged from 200 to 500 people/km2, and the land-use type was woodland.
The conclusions above have important implications for ecological conservation and restoration in the different regions. The impacts of the climatic, environmental, and anthropogenic factors need to be comprehensively considered when formulating and implementing policies. The NDVI is sensitive to the climatic and environmental factors related to water changes in the semi-arid area where there is relatively little water. Therefore, appropriate vegetation types should be selected, regional vegetation structures should be optimized, and high water consumption vegetation should be gradually replaced by low water consumption vegetation such as grass and drought-tolerant plants. In the semi-humid area, the regional water conditions basically meet the needs of vegetation growth because of the suitable climatic and natural conditions. Moreover, human activities have a relatively large disturbance effect on the NDVI. Thus, more positive human activities should be encouraged, including Grain for Green, afforestation, urban greening, and agricultural modernization projects. Furthermore, negative human activities should be controlled, including disordered urban expansion, population expansion, and overgrazing.
4.2. Connections and Distinctions with Other Studies
(1) Vegetation NDVI: In this study, it was found that the NDVI on the entire LP has increased significantly after 2000 when the GGP was implemented, consistent with the findings of [26,37,38].
(2) Climatic factors: In this study, it was found that among all factors, precipitation has the greatest influence on vegetation growth in the semi-arid area of the LP, consistent with the findings of [39,40,41]. In the semi-humid area, precipitation is not the decisive factor controlling vegetation growth because of the relatively good water conditions. Several studies have suggested that temperature is also a key factor affecting the vegetation growth. In general, when the temperature is low, the physiological activity of the vegetation is low. An increase in temperature promotes photosynthesis and vegetation growth, but as the temperature increases further, the growth of vegetation is inhibited by the accelerated evaporation and soil drying [42,43]. It was found in this study that conditions are suitable for vegetation growth when the temperature smaller than 0 °C on the LP. This is the case because the vegetation growth is influenced by many factors other than temperature. It can be seen from Figure 2, Figure 3, Figure 4, Figure 5 and 8 that the NDVI value is large in the southwest corner of semi-arid area of the LP, where the precipitation is large, the land-use types are mainly woodland and grassland, and the altitude ranges from 2963 m to 4914 m (the high altitude causes the low temperature). The finding is consistent with the results of [29]. It was also found that compared with other factors, temperature has relatively small explanatory power in terms of the spatial distribution and its change in the NDVI on the LP, which agrees with the findings and results of [39].
(3) Environmental factors: In this study, it was found that the environmental factors such as topographic types have an impact on the vegetation growth and restoration, consistent with the findings and results of [44]. The study revealed that the explanatory power of interactions between the factors would be increased for the spatial distribution and its change in the NDVI, which is consistent with the practical situation. For instance, the soil moisture is lower for steeper slopes, inhibiting vegetation growth. In this study, it was found that the NDVI value is large when the slope is between 15° and 20°, while it decreases when the slope becomes greater.
(4) Human factors: Certain studies have suggested that the regional land-use types have changed since the implementation of the GGP [45,46], which is not consistent with the results of this study. The reason for this may be that the spatial resolutions of the remote sensing data used in these studies are different. In this study, it was found that the conservation and restoration of the original woodland and grassland have been strengthened since the implementation of the GGP on the LP, resulting in a significant increase in the NDVI throughout the entire region. Additionally, many studies have used the NDVI to predict the grain yield because of the significant correlation between the grain yield and the NDVI [47,48]. The LP is a dry farming area, which has been affected by the scarcity of precipitation for a long time, resulting in a low grain yield [49]. With the agricultural technology developing recently, the optimization and adjustment of the crop planting structure has resulted in a continuous improvement in the grain yield on the LP. Therefore, the NDVI has increased significantly [19].
4.3. Possible Future Work
There is further research that can be carried out, including the following. (1) The factors affecting the spatial–temporal evolution of the NDVI are extremely complex. Due to data limitations, certain factors are not currently considered, such as agricultural fertilization, irrigation area, and CO2 concentration [50,51], but can be further improved with the acquisition of new data in the future. (2) The interaction detector of the GDM only considers the interactions between two factors. There are interactive effects involving more than two factors. The combined impacts of multiple factors would provide insights on the evolution of vegetation, which can be considered in the future by introducing other methods, such as the analytical hierarchy process (AHP) and principal component analysis (PCA) [52]. (3) It is necessary to perform further collection of data with a relatively higher resolution through field investigations and monitoring to determine the practical situation of the surface undulations in the study area. (4) The cumulative and time-lag effects of various factors and indicators (e.g., standardized precipitation and evapotranspiration index, SPEI) should also be evaluated in the future [53]. (5) It is possible for the GDM to identify the impacts of driving forces on the evolution of vegetation from the perspective of spatial analysis and mathematical statistics. In order to further explore the evolutionary mechanism of vegetation, some methods from the field of landscape studies can be introduced in the future [54].
5. Conclusions
The main conclusions of this paper include the following.
(1) The spatial–temporal evolution characteristics of the NDVI on the entire LP, and in the semi-arid/humid areas during 2000–2015 were analyzed via the linear regression, coefficient of variation, and transfer matrix models.
- The proportion of the total area with an NDVI of greater than 0.6 increased significantly, and the proportions of relatively low vegetation (NDVI of 0.2 to 0.4) converted to medium vegetation (NDVI of 0.4 to 0.6), medium vegetation converted to relatively high vegetation (NDVI of 0.6 to 0.8), and relatively high vegetation converted to high vegetation (NDVI of 0.8 to 1.0) accounted for the largest proportions.
- The annual mean value of the NDVI on the LP was 0.529, decreasing from the southeastern semi-humid area (0.619) to the northwestern semi-arid area (0.346). The mean value of the NDVI coefficient of variation was 0.1406 on the LP, increasing from the southeastern semi-humid area (0.1165) to the northwestern semi-arid area (0.1926).
- The NDVI on the LP exhibited an upward trend. The annual growth rate of the NDVI in the entire LP was 0.0079, and the growth rate in the semi-humid area (0.0093) was higher than in the semi-arid (0.0049) area after the GGP was implemented.
- The area of the change in land-use types on the LP was not significant. Overall, a positive impact on the NDVI was found by the changes in the land-use type. The largest increments of the NDVI were due to grassland, farmland, and woodland, and these land-use types did not change.
(2) The GDM was adopted to quantitatively identify the impact of multiple factors on the spatial–temporal evolution of the NDVI on the entire LP, and in the semi-arid/humid areas.
- Using the factor detector, it was found that in the semi-arid area, the climatic and environmental factors were the decisive factors influencing the spatial distribution changes of the NDVI during 2000–2015, including precipitation, soil type, and vegetation type. The impacts of anthropogenic factors, such as the GDP density, land-use type, and population density, were more significant in the semi-humid area.
- Using the interaction detector, it was found that the explanatory power of interactions between factors were greater than their individual effects, exhibiting two types of nonlinear enhancement and bi-enhancement. For the semi-arid area, 83.6% of the interactive factor combinations exhibited nonlinear enhancement and 16.4% exhibited bi-enhancement. The interactive effect between precipitation and soil type was the strongest. For the semi-humid area, 61.8% of the interactive factor combinations exhibited nonlinear enhancement and 38.2% exhibited bi-enhancement. The interactive effect between GDP density and geomorphic type was the strongest.
- Using the risk and ecological detectors, the ranges or types of various factors that are suitable for vegetation growth and the differences of significance between factors for the NDVI on the LP were determined.
The conclusions of this study have important implications for policy makers and administrative managers in terms of the formulation and implementation of ecological conservation and restoration strategies in the different regions. In the semi-arid area, appropriate vegetation types should be selected, regional vegetation structures should be optimized, and high water consumption vegetation should be gradually replaced by low water consumption vegetation such as grass and drought-tolerant plants. In the semi-humid area, more positive human activities should be encouraged, including Grain for Green, afforestation, urban greening, and agricultural modernization projects. Furthermore, negative human activities should be controlled, including disordered urban expansion, population expansion, and overgrazing.
Author Contributions
Conceptualization, Data curation, Investigation, Methodology, Formal analysis, Writing—original draft: Y.D.; Conceptualization, Methodology, Formal analysis, Writing—review and editing, Supervision, Funding acquisition: D.Y.; Validation, Writing—review and editing: X.L. (Xiang Li); Project administration, Funding acquisition. J.H.; Supervision, Funding acquisition: W.S.; Validation, Writing—review and editing: X.L. (Xuecao Li); Supervision, Funding acquisition: H.W. All authors have read and agreed to the published version of the manuscript.
Funding
This research was supported by the National Natural Science Foundation of China (42171024, 51609122, 41701507), the National Key Research and Development Program of China (2018YFE0122700), the Open Research Fund Program of State Key Laboratory of Hydroscience and Engineering (sklhse-2020-A-07), and the Joint Open Research Fund Program of State key Laboratory of Hydroscience and Engineering and Tsinghua-Ningxia Yinchuan Joint Institute of Internet of Waters on Digital Water Governance (sklhse-2021-Iow06). Su Wei would like to thank the 2115 Talent Development Program of China Agricultural University.
Data Availability Statement
The shape file for the boundary of the LP, the SPOT NDVI data, and the influencing factors (including geomorphic type, soil type, vegetation type, socio-economic data, and land-use type) data were downloaded from the Resource and Environment Science and Data Center (RESDC), Chinese Academy of Sciences (available from http://www.resdc.cn, accessed on 6 October 2021). The DEM data were downloaded from the Shuttle Radar Topography Mission (available from http://srtm.csi.cgiar.org/, accessed on 6 October 2021). The precipitation and temperature data were from the China Meteorological Data Service Center (available from http://data.cma.cn/site/index.html, accessed on 6 October 2021).
Conflicts of Interest
The authors declare no conflict of interest.
References
- Yao, R.; Cao, J.; Wang, L.; Zhang, W.; Wu, X. Urbanization Effects on Vegetation Cover in Major African Cities during 2001–2017. Int. J. Appl. Earth Obs. Geoinf. 2019, 75, 44–53. [Google Scholar] [CrossRef]
- Hua, W.; Chen, H.; Zhou, L.; Xie, Z.; Qin, M.; Li, X.; Ma, H.; Huang, Q.; Sun, S. Observational Quantification of Climatic and Human Influences on Vegetation Greening in China. Remote Sens. 2017, 9, 425. [Google Scholar] [CrossRef] [Green Version]
- He, B.; Chen, A.; Jiang, W.; Chen, Z. The Response of Vegetation Growth to Shifts in Trend of Temperature in China. J. Geogr. Sci. 2017, 27, 801–816. [Google Scholar] [CrossRef]
- Yang, Y.; Dou, Y.; Cheng, H.; An, S. Plant Functional Diversity Drives Carbon Storage Following Vegetation Restoration in Loess Plateau, China. J. Environ. Manag. 2019, 246, 668–678. [Google Scholar] [CrossRef] [PubMed]
- Liu, L.; Yang, X.; Zhou, H.; Liu, S.; Zhou, L.; Li, X.; Yang, J.; Han, X.; Wu, J. Evaluating the Utility of Solar-Induced Chlorophyll Fluorescence for Drought Monitoring by Comparison with NDVI Derived from Wheat Canopy. Sci. Total Environ. 2018, 625, 1208–1217. [Google Scholar] [CrossRef]
- Zhao, L.; Dai, A.; Dong, B. Changes in Global Vegetation Activity and Its Driving Factors during 1982–2013. Agric. For. Meteorol. 2018, 249, 198–209. [Google Scholar] [CrossRef]
- Huang, J.; Gómez-Dans, J.L.; Huang, H.; Ma, H.; Wu, Q.; Lewis, P.E.; Liang, S.; Chen, Z.; Xue, J.-H.; Wu, Y.; et al. Assimilation of Remote Sensing into Crop Growth Models: Current Status and Perspectives. Agric. For. Meteorol. 2019, 276–277, 107609. [Google Scholar] [CrossRef]
- Du, Z.; Zhang, X.; Xu, X.; Zhang, H.; Wu, Z.; Pang, J. Quantifying Influences of Physiographic Factors on Temperate Dryland Vegetation, Northwest China. Sci. Rep. 2017, 7, 40092. [Google Scholar] [CrossRef]
- Piao, S.; Mohammat, A.; Fang, J.; Cai, Q.; Feng, J. NDVI-Based Increase in Growth of Temperate Grasslands and Its Responses to Climate Changes in China. Glob. Environ. Chang. 2006, 16, 340–348. [Google Scholar] [CrossRef]
- Mao, J.; Shi, X.; Thornton, P.E.; Hoffman, F.M.; Zhu, Z.; Myneni, R.B. Global Latitudinal-Asymmetric Vegetation Growth Trends and Their Driving Mechanisms: 1982–2009. Remote Sens. 2013, 5, 1484–1497. [Google Scholar] [CrossRef] [Green Version]
- Qu, S.; Wang, L.; Lin, A.; Yu, D.; Yuan, M.; Li, C. Distinguishing the Impacts of Climate Change and Anthropogenic Factors on Vegetation Dynamics in the Yangtze River Basin, China. Ecol. Indic. 2020, 108, 105724. [Google Scholar] [CrossRef]
- Yao, R.; Wang, L.; Huang, X.; Chen, J.; Li, J.; Niu, Z. Less Sensitive of Urban Surface to Climate Variability than Rural in Northern China. Sci. Total Environ. 2018, 628–629, 650–660. [Google Scholar] [CrossRef] [PubMed]
- Zhang, Y.; Peng, C.; Li, W.; Tian, L.; Zhu, Q.; Chen, H.; Fang, X.; Zhang, G.; Liu, G.; Mu, X.; et al. Multiple Afforestation Programs Accelerate the Greenness in the ‘Three North’ Region of China from 1982 to 2013. Ecol. Indic. 2016, 61, 404–412. [Google Scholar] [CrossRef]
- Wang, S.; Fu, B.; Piao, S.; Lü, Y.; Ciais, P.; Feng, X.; Wang, Y. Reduced Sediment Transport in the Yellow River Due to Anthropogenic Changes. Nat. Geosci. 2016, 9, 38–41. [Google Scholar] [CrossRef]
- Zhao, G.; Mu, X.; Wen, Z.; Wang, F.; Gao, P. Soil Erosion, Conservation, and Eco-Environment Changes in the Loess Plateau of China. Land Degrad. Dev. 2013, 24, 499–510. [Google Scholar] [CrossRef]
- Gao, Y.; Liu, Z.; Li, R.; Shi, Z. Long-Term Impact of China’s Returning Farmland to Forest Program on Rural Economic Development. Sustainability 2020, 12, 1492. [Google Scholar] [CrossRef] [Green Version]
- Li, G.; Sun, S.; Han, J.; Yan, J.; Liu, W.; Wei, Y.; Lu, N.; Sun, Y. Impacts of Chinese Grain for Green Program and Climate Change on Vegetation in the Loess Plateau during 1982–2015. Sci. Total Environ. 2019, 660, 177–187. [Google Scholar] [CrossRef] [PubMed]
- Wang, Z.; Yao, W.; Tang, Q.; Liu, L.; Xiao, P.; Kong, X.; Zhang, P.; Shi, F.; Wang, Y. Continuous Change Detection of Forest/Grassland and Cropland in the Loess Plateau of China Using All Available Landsat Data. Remote Sens. 2018, 10, 1775. [Google Scholar] [CrossRef] [Green Version]
- Wu, X.; Wang, S.; Fu, B.; Feng, X.; Chen, Y. Socio-Ecological Changes on the Loess Plateau of China after Grain to Green Program. Sci. Total Environ. 2019, 678, 565–573. [Google Scholar] [CrossRef]
- Hao, H.; Li, Y.; Zhang, H.; Zhai, R.; Liu, H. Spatiotemporal Variations of Vegetation and Its Determinants in the National Key Ecological Function Area on Loess Plateau between 2000 and 2015. Ecol. Evol. 2019, 9, 5810–5820. [Google Scholar] [CrossRef] [PubMed]
- Hu, Y.; Dao, R.; Hu, Y. Vegetation Change and Driving Factors: Contribution Analysis in the Loess Plateau of China during 2000–2015. Sustainability 2019, 11, 1320. [Google Scholar] [CrossRef] [Green Version]
- Yamori, W.; Hikosaka, K.; Way, D.A. Temperature Response of Photosynthesis in C3, C4, and CAM Plants: Temperature Acclimation and Temperature Adaptation. Photosynth. Res. 2014, 119, 101–117. [Google Scholar] [CrossRef]
- Hein, L.; de Ridder, N.; Hiernaux, P.; Leemans, R.; de Wit, A.; Schaepman, M. Desertification in the Sahel: Towards Better Accounting for Ecosystem Dynamics in the Interpretation of Remote Sensing Images. J. Arid Environ. 2011, 75, 1164–1172. [Google Scholar] [CrossRef]
- Liu, L.; Zhang, Y.; Bai, W.; Yan, J.; Ding, M.; Shen, Z.; Li, S.; Zheng, D. Characteristics of Grassland Degradation and Driving Forces in the Source Region of the Yellow River from 1985 to 2000. J. Geogr. Sci. 2006, 16, 131–142. [Google Scholar] [CrossRef]
- Ran, Q.; Hao, Y.; Xia, A.; Liu, W.; Hu, R.; Cui, X.; Xue, K.; Song, X.; Xu, C.; Ding, B.; et al. Quantitative Assessment of the Impact of Physical and Anthropogenic Factors on Vegetation Spatial-Temporal Variation in Northern Tibet. Remote Sens. 2019, 11, 1183. [Google Scholar] [CrossRef] [Green Version]
- Nie, T.; Dong, G.; Jiang, X.; Lei, Y. Spatio-Temporal Changes and Driving Forces of Vegetation Coverage on the Loess Plateau of Northern Shaanxi. Remote Sens. 2021, 13, 613. [Google Scholar] [CrossRef]
- Wang, J.-F.; Li, X.-H.; Christakos, G.; Liao, Y.-L.; Zhang, T.; Gu, X.; Zheng, X.-Y. Geographical Detectors-Based Health Risk Assessment and Its Application in the Neural Tube Defects Study of the Heshun Region, China. Int. J. Geogr. Inf. Sci. 2010, 24, 107–127. [Google Scholar] [CrossRef]
- Peng, W.; Kuang, T.; Tao, S. Quantifying Influences of Natural Factors on Vegetation NDVI Changes Based on Geographical Detector in Sichuan, Western China. J. Clean. Prod. 2019, 233, 353–367. [Google Scholar] [CrossRef]
- Meng, X.; Gao, X.; Li, S.; Lei, J. Spatial and Temporal Characteristics of Vegetation NDVI Changes and the Driving Forces in Mongolia during 1982–2015. Remote Sens. 2020, 12, 603. [Google Scholar] [CrossRef] [Green Version]
- Zhu, L.; Meng, J.; Zhu, L. Applying Geodetector to Disentangle the Contributions of Natural and Anthropogenic Factors to NDVI Variations in the Middle Reaches of the Heihe River Basin. Ecol. Indic. 2020, 117, 106545. [Google Scholar] [CrossRef]
- Guo, X.; Shao, Q. Spatial Pattern of Soil Erosion Drivers and the Contribution Rate of Human Activities on the Loess Plateau from 2000 to 2015: A Boundary Line from Northeast to Southwest. Remote Sens. 2019, 11, 2429. [Google Scholar] [CrossRef] [Green Version]
- Zheng, J.; Yin, Y.; Li, B. A New Scheme for Climate Regionalization in China. Acta Geogr. Sin. 2010, 65, 3–12. [Google Scholar] [CrossRef]
- Wang, J.-F.; Zhang, T.-L.; Fu, B.-J. A Measure of Spatial Stratified Heterogeneity. Ecol. Indic. 2016, 67, 250–256. [Google Scholar] [CrossRef]
- Peng, W.; Wang, G.; Zhou, J.; Xu, X.; Luo, H.; Yang, C.; Zhao, J. Dynamic Monitoring of Fractional Vegetation Cover along Minjiang River from Wenchuan County to Dujiangyan City Using Multi-Temporal Landsat 5 and 8 Images. Acta Ecol. Sin. 2016, 36, 1975–1988. [Google Scholar] [CrossRef]
- Hijmans, R.; Cameron, S.; Parra, J.; Jones, P.; Jarvis, A. Very High Resolution Interpolated Climate Surfaces of Global Land Areas. Int. J. Climatol. 2005, 25, 1965–1978. [Google Scholar] [CrossRef]
- Zheng, K.; Ye, J.-S.; Jin, B.-C.; Zhang, F.; Wei, J.-Z.; Li, F.-M. Effects of Agriculture, Climate, and Policy on NDVI Change in a Semi-Arid River Basin of the Chinese Loess Plateau. Arid Land Res. Manag. 2019, 33, 321–338. [Google Scholar] [CrossRef]
- Su, C.; Fu, B. Evolution of Ecosystem Services in the Chinese Loess Plateau under Climatic and Land Use Changes. Glob. Planet. Chang. 2013, 101, 119–128. [Google Scholar] [CrossRef]
- Fu, B.; Liu, Y.; Lü, Y.; He, C.; Zeng, Y.; Wu, B. Assessing the Soil Erosion Control Service of Ecosystems Change in the Loess Plateau of China. Ecol. Complex. 2011, 8, 284–293. [Google Scholar] [CrossRef]
- Naeem, S.; Zhang, Y.; Zhang, X.; Tian, J.; Abbas, S.; Luo, L.; Meresa, H.K. Both Climate and Socioeconomic Drivers Contribute to Vegetation Greening of the Loess Plateau. Sci. Bull. 2021, 66, 1160–1163. [Google Scholar] [CrossRef]
- Li, Z.; Chen, Y.; Li, W.; Deng, H.; Fang, G. Potential Impacts of Climate Change on Vegetation Dynamics in Central Asia. J. Geophys. Res. Atmos. 2015, 120, 12345–12356. [Google Scholar] [CrossRef]
- Zhao, W.; Hu, Z.; Guo, Q.; Wu, G.; Chen, R.; Li, S. Contributions of Climatic Factors to Interannual Variability of the Vegetation Index in Northern China Grasslands. J. Clim. 2020, 33, 175–183. [Google Scholar] [CrossRef]
- Potter, C.; Klooster, S.; Genovese, V. Net Primary Production of Terrestrial Ecosystems from 2000 to 2009. Clim. Chang. 2012, 115, 365–378. [Google Scholar] [CrossRef] [Green Version]
- Zhang, Q.; Qi, T.; Li, J.; Singh, V.P.; Wang, Z. Spatiotemporal Variations of Pan Evaporation in China during 1960–2005: Changing Patterns and Causes. Int. J. Climatol. 2015, 35, 903–912. [Google Scholar] [CrossRef]
- He, J.; Shi, X.; Fu, Y. Identifying Vegetation Restoration Effectiveness and Driving Factors on Different Micro-Topographic Types of Hilly Loess Plateau: From the Perspective of Ecological Resilience. J. Environ. Manag. 2021, 289, 112562. [Google Scholar] [CrossRef] [PubMed]
- Deng, L.; Shangguan, Z.; Sweeney, S. “Grain for Green” Driven Land Use Change and Carbon Sequestration on the Loess Plateau, China. Sci. Rep. 2014, 4, 7039. [Google Scholar] [CrossRef]
- Zhu, Z.; Liu, L.; Chen, Z.; Zhang, J.; Verburg, P.H. Land-Use Change Simulation and Assessment of Driving Factors in the Loess Hilly Region—A Case Study as Pengyang County. Environ. Monit. Assess. 2010, 164, 133–142. [Google Scholar] [CrossRef]
- Son, N.T.; Chen, C.F.; Chen, C.R.; Chang, L.Y.; Minh, V.Q. Monitoring Agricultural Drought in the Lower Mekong Basin Using MODIS NDVI and Land Surface Temperature Data. Int. J. Appl. Earth Obs. Geoinf. 2012, 18, 417–427. [Google Scholar] [CrossRef]
- Fernandes, J.L.; Ebecken, N.F.F.; Esquerdo, J.C.D.M. Sugarcane Yield Prediction in Brazil Using NDVI Time Series and Neural Networks Ensemble. Int. J. Remote Sens. 2017, 38, 4631–4644. [Google Scholar] [CrossRef]
- Li, F.-M.; Xiong, Y.-C.; Li, X.-G.; Zhang, F.; Guan, Y. Integrated Dryland Agriculture Sustainable Management in Northwest China. In Innovations in Dryland Agriculture; Farooq, M., Siddique, K.H.M., Eds.; Springer International Publishing: Cham, Switzerland, 2016; pp. 393–413. ISBN 978-3-319-47928-6. [Google Scholar]
- Piao, S.; Yin, G.; Tan, J.; Cheng, L.; Huang, M.; Li, Y.; Liu, R.; Mao, J.; Myneni, R.B.; Peng, S.; et al. Detection and Attribution of Vegetation Greening Trend in China over the Last 30 Years. Glob. Chang. Biol. 2015, 21, 1601–1609. [Google Scholar] [CrossRef] [PubMed]
- Xue, R.; Yang, Q.; Miao, F.; Wang, X.; Shen, Y.; Xue, R.; Yang, Q.; Miao, F.; Wang, X.; Shen, Y. Slope Aspect Influences Plant Biomass, Soil Properties and Microbial Composition in Alpine Meadow on the Qinghai-Tibetan Plateau. J. Soil Sci. Plant Nutr. 2018, 18, 1–12. [Google Scholar] [CrossRef]
- Zhang, A.; Jia, G.; Ustin, S.L. Water Availability Surpasses Warmth in Controlling Global Vegetation Trends in Recent Decade: Revealed by Satellite Time Series. Environ. Res. Lett. 2021, 16, 074028. [Google Scholar] [CrossRef]
- Zhao, A.; Yu, Q.; Feng, L.; Zhang, A.; Pei, T. Evaluating the Cumulative and Time-Lag Effects of Drought on Grassland Vegetation: A Case Study in the Chinese Loess Plateau. J. Environ. Manag. 2020, 261, 110214. [Google Scholar] [CrossRef] [PubMed]
- Luo, Y.; Lü, Y.; Liu, L.; Liang, H.; Li, T.; Ren, Y. Spatiotemporal Scale and Integrative Methods Matter for Quantifying the Driving Forces of Land Cover Change. Sci. Total Environ. 2020, 739, 139622. [Google Scholar] [CrossRef] [PubMed]
Publisher’s Note: MDPI stays neutral with regard to jurisdictional claims in published maps and institutional affiliations. |
© 2021 by the authors. Licensee MDPI, Basel, Switzerland. This article is an open access article distributed under the terms and conditions of the Creative Commons Attribution (CC BY) license (https://creativecommons.org/licenses/by/4.0/).