Article

Vertical Structure of Ice Clouds and Vertical Air Motion from Vertically Pointing Cloud Radar Measurements

1
Institute of Environmental Studies, Pusan National University, Busan 46241, Korea
2
Department of Astronomy and Atmospheric Sciences, Center for Atmospheric Remote Sensing (CARE), Kyungpook National University, Daegu 41566, Korea
*
Author to whom correspondence should be addressed.
Remote Sens. 2021, 13(21), 4349; https://doi.org/10.3390/rs13214349
Submission received: 28 September 2021 / Revised: 26 October 2021 / Accepted: 26 October 2021 / Published: 29 October 2021
(This article belongs to the Special Issue Radar-Based Studies of Precipitation Systems and Their Microphysics)

Abstract

:
The vertical structure of ice clouds and vertical air motion (Vair) were investigated using vertically pointing Ka-band cloud radar. The distributions of reflectivity (Z), Doppler velocity (VD), and spectrum width (SW) were analyzed for three ice cloud types, namely, cirrus, anvil, and stratiform clouds. The radar parameters of the cirrus clouds showed narrower distributions than those of the stratiform and anvil clouds. In the vertical structures, the rapid growth of Z and VD occurred in the layer between 8 and 12 km (roughly a layer of −40 °C to −20 °C) for all ice clouds. The prominent feature in the stratiform clouds was an elongated “S” shape in the VD near 7–7.5 km (at approximately −16 °C to −13 °C) due to a significant decrease in an absolute value of VD. The mean terminal fall velocity (Vt) and Vair in the ice clouds were estimated using pre-determined VtZ relationships (Vt = aZb) and the observed VD. Although the cirrus clouds demonstrated wide distributions in coefficients a and exponents b depending on cloud heights, they showed a smaller change in Z and Vt values compared to that of the other cloud types. The anvil clouds had a larger exponent than that of the stratiform clouds, indicating that the ice particle density of anvil clouds increases at a faster rate compared with the density of stratiform clouds for the same Z increment. The significant positive Vair appeared at the top of all ice clouds in range up to 0.5 m s−1, and the anvil clouds showed the deepest layer of upward motion. The stratiform and anvil clouds showed a dramatic increase in vertical air motion in the layer of 6–8 km as shown by the rapid decrease of VD. This likely caused increase of supersaturation above. A periodic positive Vair linked with a significant reduction in VD appeared at the height of 7–8 km (approximately −15 °C) dominantly in the stratiform clouds. This layer exhibited a bi-modal power spectrum produced by pre-existing larger ice particles and newly formed numerous smaller ice particles. This result raised a question on the origins of smaller ice particles such as new nucleation due to increased supersaturation by upward motion below or the seeder-feeder effect. In addition, the retrieved Vair with high-resolution data well represented a Kelvin-Helmholtz wave development.

1. Introduction

Ice clouds are a major factor of global radiation equilibrium, which has a strong influence on climate change and the greenhouse effect on Earth, and they have played an important role in numerical forecasts and climate models [1,2]. The parameterization of ice clouds in numerical models plays an essential role in the accuracy of forecasts [3]. The terminal fall velocity (Vt) of a hydrometeor is the most important parameter in ice cloud parameterization, and it strongly influences the sedimentation of ice crystals in numerical models [4,5,6,7]. Hong et al. [8] showed that microphysical processes with ice sedimentation reveal significant improvement in the amount of high cloud and precipitation of weather forecasting models.
Ice clouds are globally distributed with large spatial and temporal variability. The microphysical (e.g., particle size, number concentration, particle density, and particle habit) and macrophysical (e.g., bottom and top height, amount, and thickness) characteristics of ice clouds have been studied to understand their complexities [9,10,11,12,13,14,15,16,17,18]. In particular, the microphysics of ice clouds are controlled by vertical air motion (Vair) [19]. Protat and Williams [20] underlined that the Vt of ice particles and their variability from long-term observations are needed to understand the dynamics linked to large-scale environments. According to Heymsfield and Westbrook [21], Vt varies with the type of ice particles in in situ measurements and laboratory experiments.
To provide a better understanding of the dynamical properties of ice clouds, observations made with remote sensing equipment, particularly ground-based cloud radar, are useful [22,23]. The cloud radar provides high-quality information about the presence of clouds. Moreover, the particle size and number concentration of ice crystals in ice clouds vary in time and space due to the microphysical properties, which are reflected in the observed reflectivity (Z) and Doppler velocity (VD) from the vertically pointing cloud radars. Z differs by the type and depth of the ice cloud.
VD is determined by the falling speed of ice crystal particles and ambient vertical air velocity, Vair. Ice cloud studies have been performed to identify their characteristics in terms of their types and regions using the decomposition technique of VD [10,20,24,25,26,27,28]. These studies have used the assumption that the mean Vair can vanish with respect to the mean Vt over a given period due to its smaller scale features. Protat and Williams [20] proposed the retrieval technique of Vt using the VtZ relationship and found that it has residuals of less than 0.1 m s−1. The retrieved Vt can be used in microphysical studies because the error is sufficiently small [29]. Kalesse et al. [26] estimated Vt using the VtZ relationship and demonstrated that the microphysical processes of ice clouds are linked with cloud thickness.
Observational studies of ice clouds in Korea have been performed using various equipment [18,30]. Kim et al. [30] compared the determined geometrical properties (e.g., heights of cloud base and top) and optical properties (e.g., cloud optical depth) to determine cloud vertical structures by using ground-based lidar and space-borne Cloud-Aerosol Lidar with Orthogonal Polarization (CALIOP) over the region of Seoul. They showed that a distinct monthly variation in cirrus altitudes is related to a monthly variation in tropopause height. Ye et al. [18] found that the ice clouds classified as high clouds have a significant seasonal variation in their maximum height.
The objective of this study is to analyze ice cloud dynamics with retrieved Vt and Vair from vertical pointing measurements of the Ka-band cloud radar collected in Boseong, Korea. The study examines ice cloud properties and estimates Vt and Vair for classified types. A brief description of cloud measurements and the estimation of Vt and Vair for ice clouds are explained in Section 2 and Section 3. The results and conclusions are presented in Section 4 and Section 5.

2. Data

A Ka-band cloud radar is installed in the Boseong standard weather observatory (34.76° N, 127.21° E) surrounded by agricultural land facing the southern coast of the Korean Peninsula (See Figure 1 of Ye et al. [18]). The cloud radar transmits a horizontally polarized electromagnetic wave with a magnetron transmitter (maximum power of 15 kW) in a frequency of 33.44 GHz (wavelength 8.9 mm) and receives backscattered signals by targets in horizontal and vertical polarization. Thus, the radar produces only a dual-polarization variable (linear depolarization ratio, LDR) and other single-polarization variables (Z, VD, and spectrum width (SW)). The antenna diameter is 1.5 m with a beamwidth of 0.5°. Detailed specifications are shown in Table 1.
Although the contamination by the non-meteorological echoes near the ground can be avoided, the removal processes of noise echo and outlier are essential for the analysis of ice clouds. If the hardware burst power was less than 75 dB, the data were treated as noise and were removed. To derive an accurate VtZ relationship, the quality control of radar parameters was conducted in three steps. The noise had high values of LDR and Z in the vertical direction. If the average LDR of each ray was larger than 5 dB or the average Z of each ray was larger than 30 dBZ, the ray data were eliminated for the first step. The outliers were then removed using the following thresholds: ±3σ for Z and VD, SW > 0.5 m s−1, and VD > 1.5 m s−1 for weak echoes (Z < −15 dBZ). A cloud was defined as having a thickness of greater than 500 m. In the final step, the cloud edge (3 pixels) and the clouds with a thickness of <500 m were excluded.
Before applying the quality control, a VD larger than 1.5 m s−1 or an SW of larger than 0.5 m s−1 in weak cloud echoes (Z < −15 dBZ) frequently appeared in the case of anvil clouds (Figure 1), but after the quality control process was implemented, these echoes were removed. Echoes at the high altitude with low temperatures had a lower Z and a lower VD than the cloud echoes at lower altitudes with higher temperatures.
Time–height cross-sections of radar parameters before and after quality control for a case of cirrus clouds on 9 August 2015 are shown in Figure 2. The cloud echoes had a thickness of approximately 3 to 5 km and developed a height of up to 12 km from 12 to 17 UTC. As the Z increased, the VD increased with the decrease in height. The fall streaks clearly showed the growth of cloud particles. The SW of the cirrus cloud was less than 0.15 m s−1, except for at the bottom of cloud echoes with a height of lower than 8 km. After applying quality control, the cloud echoes with a weak Z under −20 dBZ were slightly removed from 05 to 08 UTC.

3. Methods

3.1. Classification of Ice Clouds

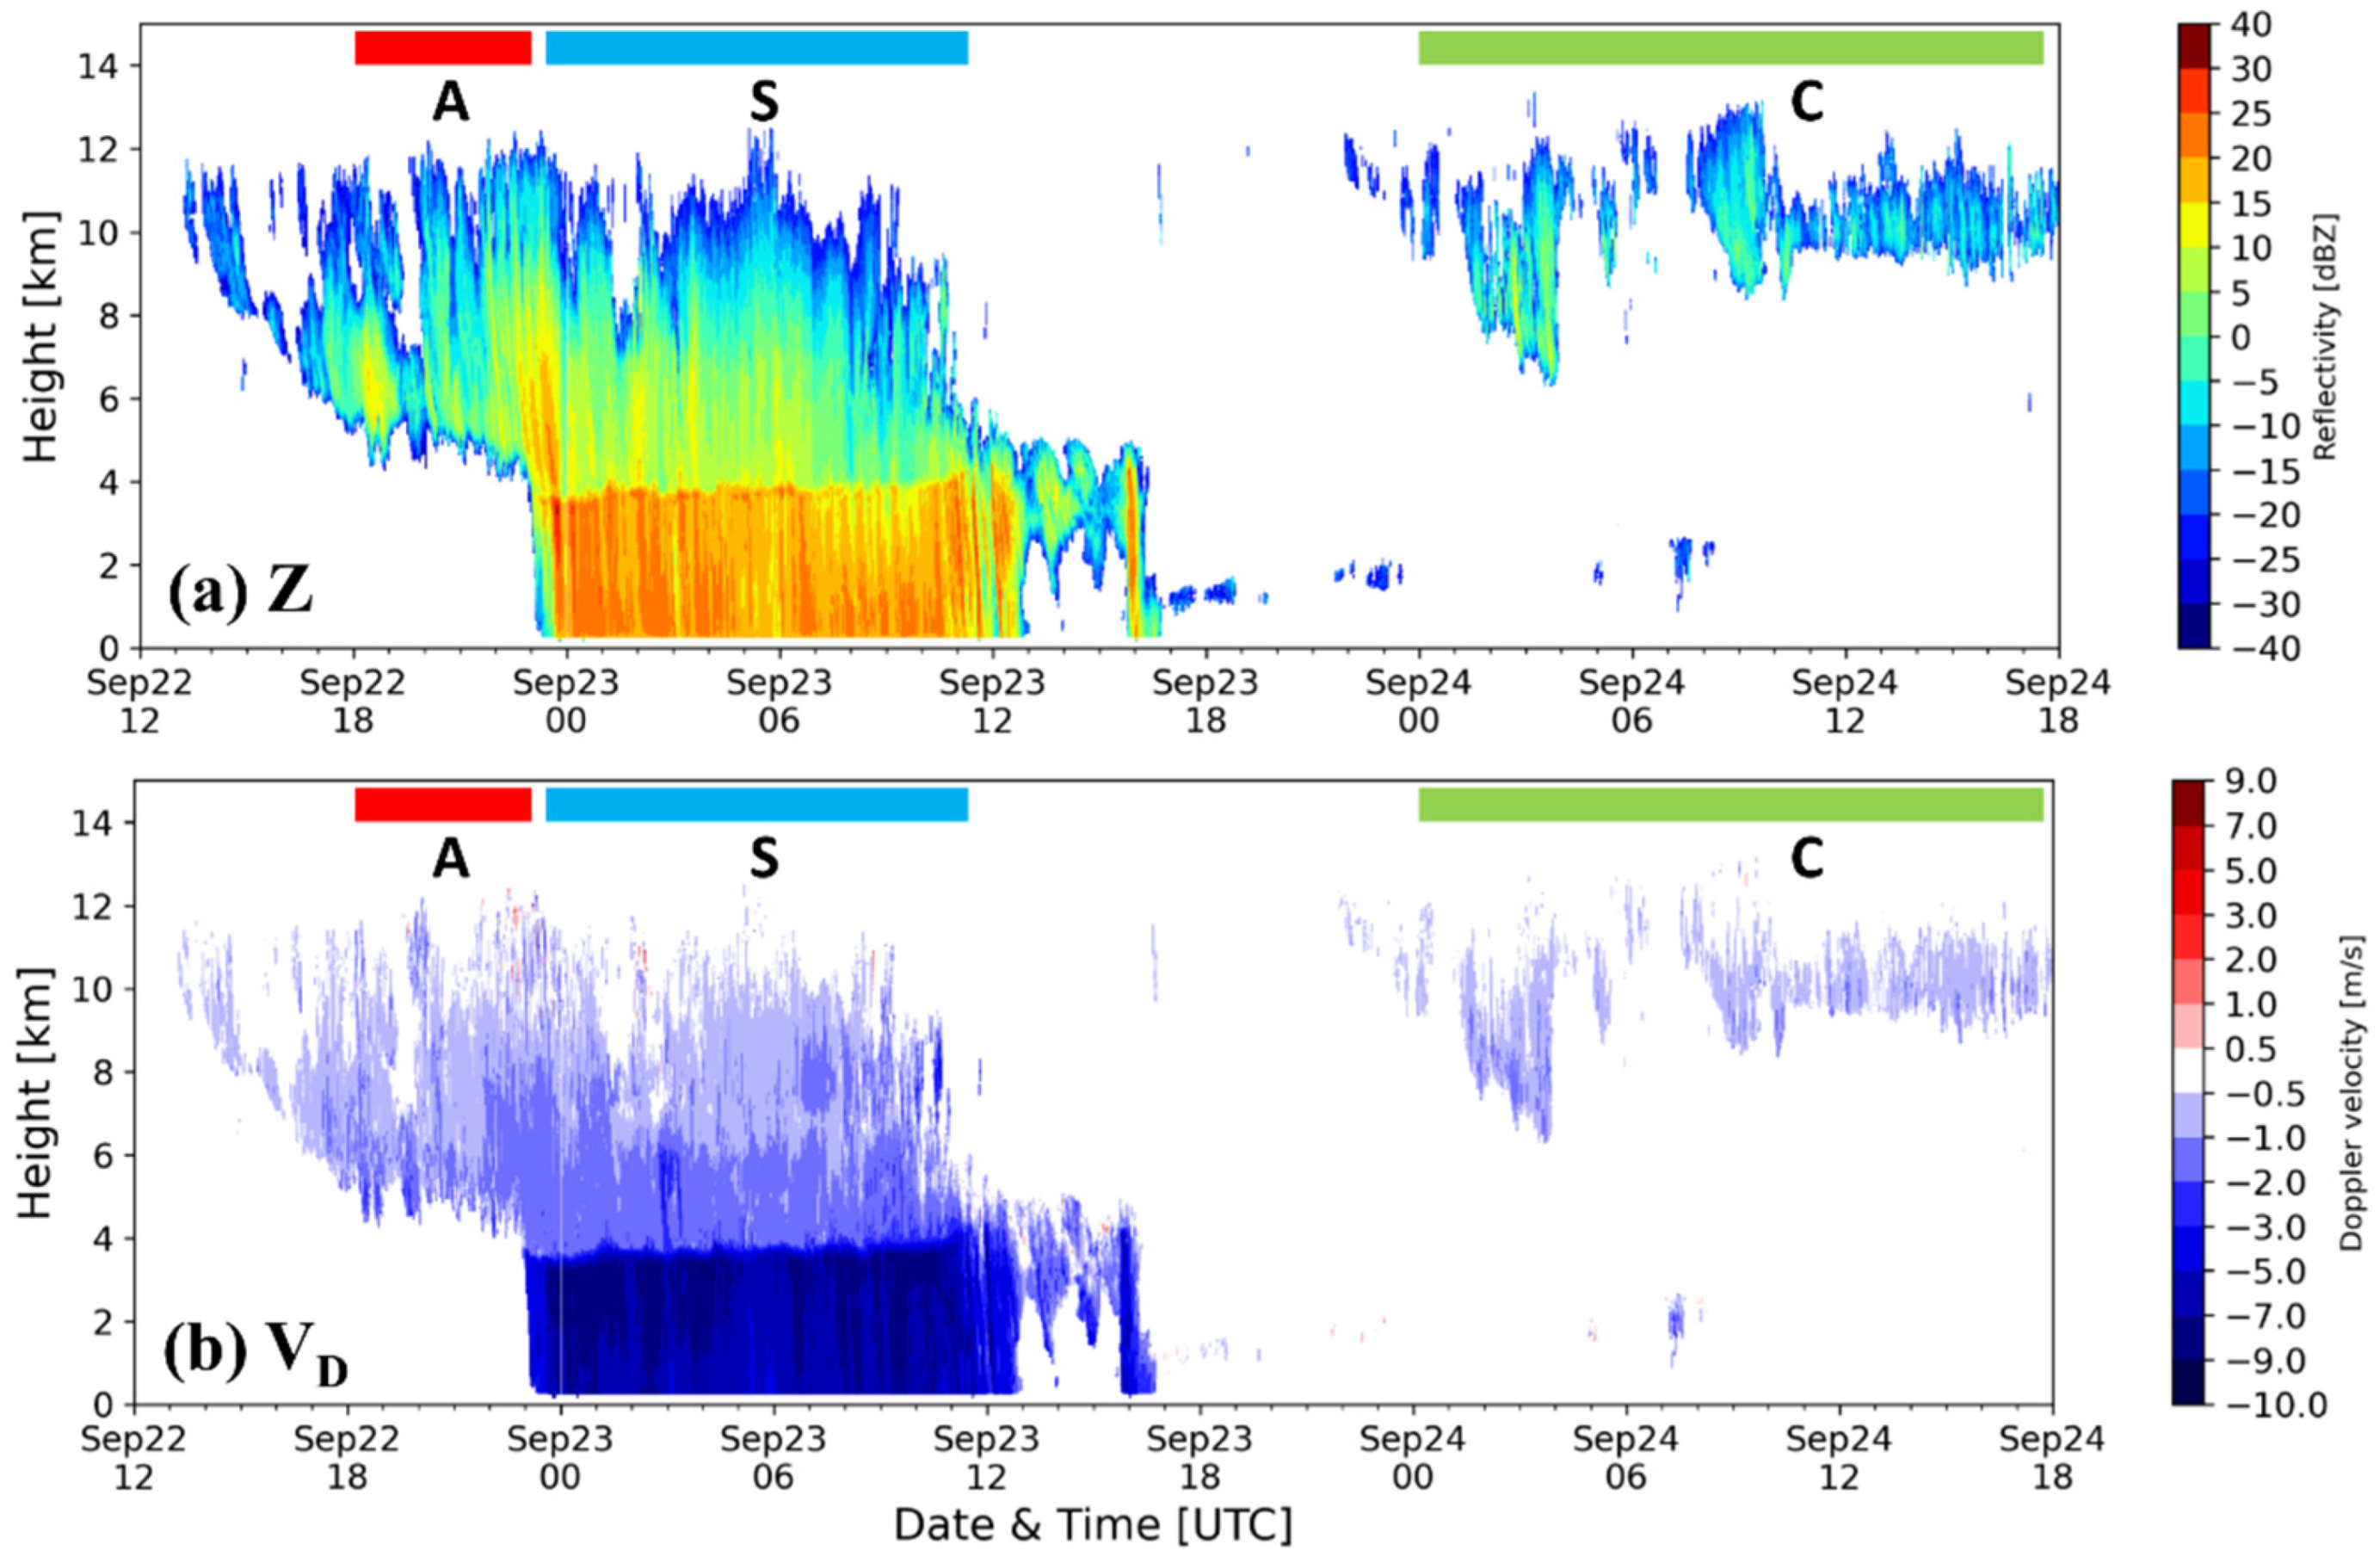
Ice clouds were classified into three types (cirrus clouds: cirrus; stratiform precipitation: stratiform; thick non-precipitating anvils: anvil) using a 1 min Z profile, similar to the classification criteria used by Protat and Williams [20]. The cirrus (cirrus clouds) type had a base height above 6 km (marked by C in Figure 3). The stratiform type was classified as the upper part of the stratiform (stratiform precipitation) showing a melting layer (0 °C height; S part in Figure 3). The anvil (thick non-precipitating anvils) type was defined as a thick cloud that had a bottom height above 3 km and a top height above 6 km with the precipitation not reaching the ground, as shown in the area indicated by A in Figure 3.
The ice cloud cases were selected using 1 min Z profile data from June 2014 to October 2015. Table 2 provides information on the selected cases by ice cloud type. The cirrus cases occurred for a total of 309 h and cirrus echoes were distributed at a height of 6 to 14 km, primarily concentrated in the 9 to 12 km area. We selected 90 h as the stratiform from stratiform precipitation cases with a bright band at a height of 4 to 5 km. The anvil cases were represented by the thick cloud region that appeared before stratiform rainfall reached the ground over a total of 36.5 h.

3.2. Estimation of Terminal Velocity and Vertical Air Motion

The cloud radar cannot directly measure the mean terminal fall velocity, Vt, of hydrometeors within the observational volume. The observed VD is the sum of Vt and the vertical air motion, Vair, as the following equation:
V D ( m   s 1 ) = V t + V a i r .
The observed VD is contributed by the sedimentation of ice particles. The effect of Vair is reflected on VD and cannot be ignored in the ice cloud with respect to the Vt of ice particles. Thus, Vair is derived from Equation (1) by applying estimated Vt and observed VD. Vt can be estimated by using a power-law relationship between Z and Vt as in Equation (2).
V t ( m   s 1 ) = a Z b
where Z is measured with a linear unit (mm6 m−3). Vair should be negligible from the averaged VD over a longer time period, and averaged VD should be identical to the averaged Vt [10,20,26]. The VtZ relationship was then derived using the observed averaged Z and VD during a given time period. The time average was tested in increments of 5, 10, 20, 30, and 60 min. Here, Z was a linear unit and only positive velocity was used. Vt was calculated from the observed Z using a pre-determined VtZ relationship for each type of ice cloud. Vair was then estimated from the calculated Vt and observed VD using Equation (1).

4. Results

4.1. Properties of Radar Parameters

The frequency distributions of Z, VD, and SW were examined for the classified ice clouds. Figure 4 shows the histograms of radar parameters by ice cloud type. The bin size of the histogram was 2 dBZ for Z, 0.2 m s−1 for VD, and 0.02 m s−1 for SW. The frequency was normalized with the total frequency of each type. The Z of the anvil and stratiform were broadly distributed from −30 to 20 dBZ, whereas that of cirrus had a narrow distribution of Z from −30 to 5 dBZ. The Z distributions of the anvil and stratiform displayed similar features, but the Z of the anvil was larger than that of stratiform. In addition, the second peak in anvil and stratiform coincided with the first peak in cirrus. The velocity distribution of cirrus was narrow with a peak of −0.6 m s−1 that showed smaller absolute values than those of the peaks of the anvil and stratiform velocities (−1.2 m s−1). Although anvil had a larger Z, it showed a smaller falling velocity (smaller negative values) than that of stratiform. The peak in SW distribution of cirrus was 0.04 m s−1, while that in stratiform was the largest at 0.14 m s−1.
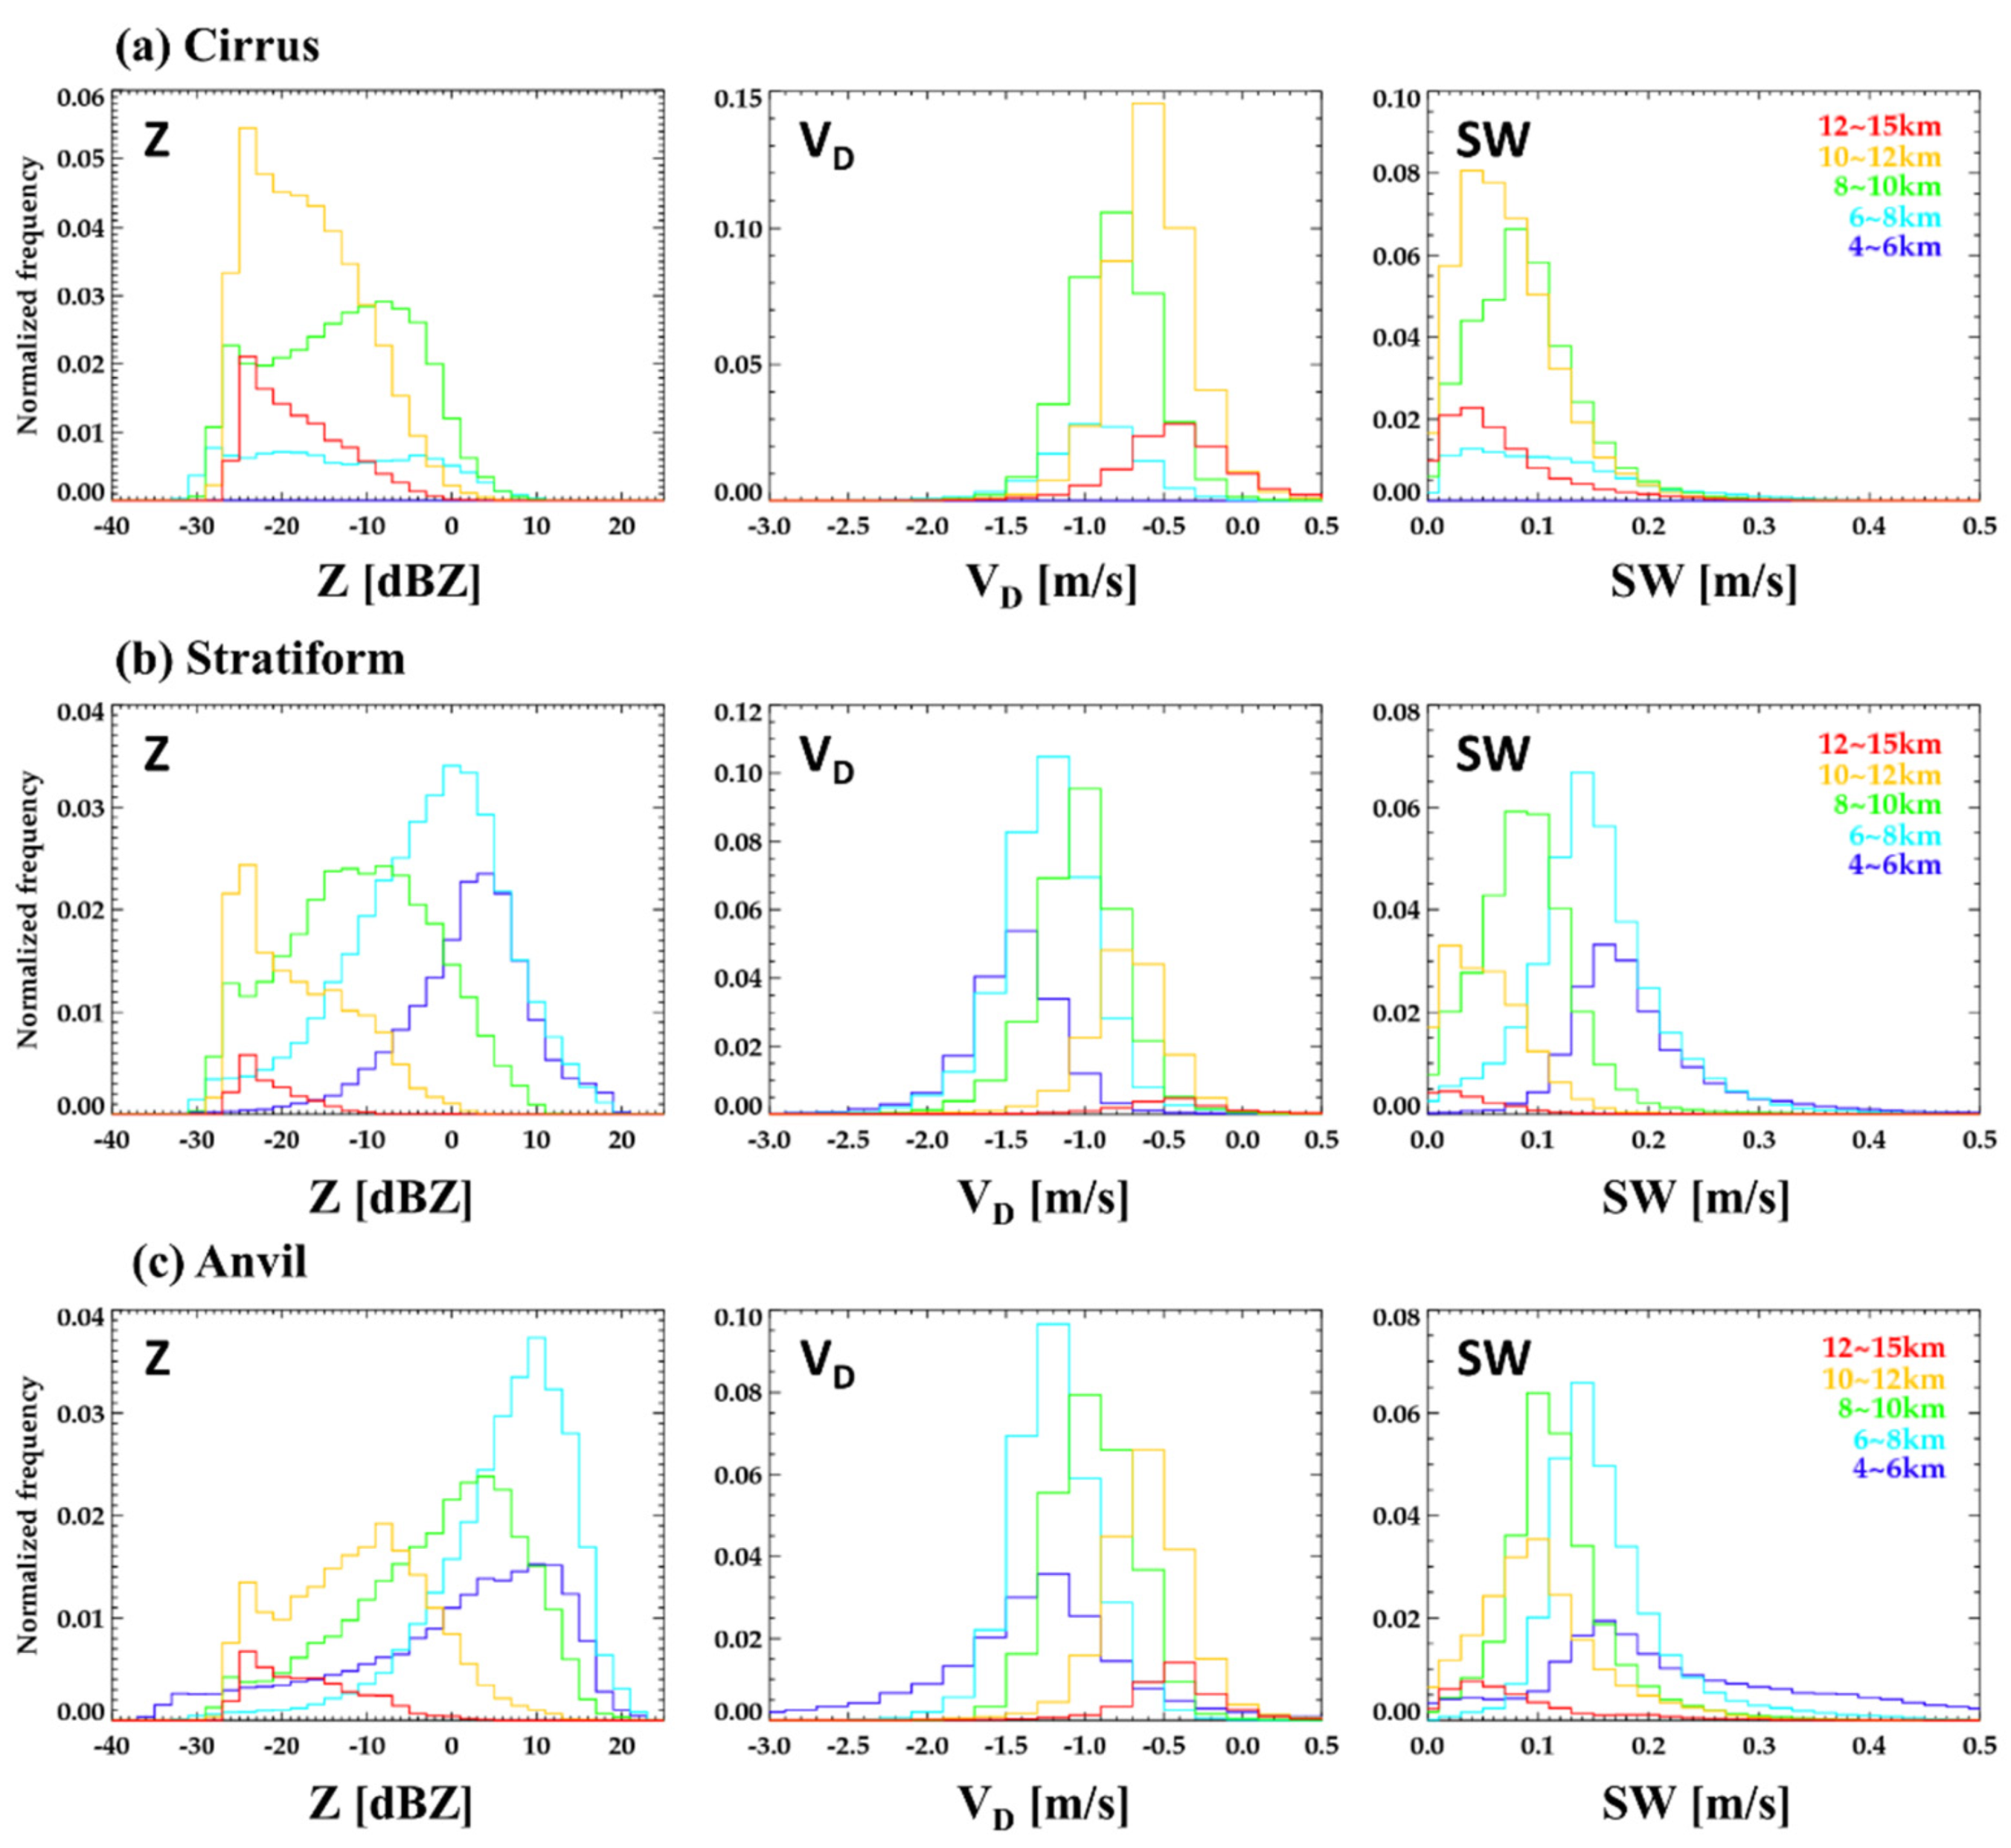
To obtain detailed distributions of radar parameters by ice cloud type, the histograms were calculated in different intervals of cloud height (Figure 5). The cirrus within a height of 10 to 12 km showed the highest frequency at −25 dBZ for Z, −0.6 m s−1 for VD, and 0.03 m s−1 for SW. This result was consistent with that of the work conducted by Ye et al. [18] since over 60% of cirrus cases were observed during the summer season (June to July). The shape of Z distribution in a cirrus that occurred at a height of 12 to 15 km was similar to that in cirrus at a height of 10 to 12 km. In contrast, the cirrus occurring at a height from 8 to 10 km had a right-skewed distribution with a peak at −7 dBZ. In stratiform and anvil types, the highest frequencies occurred at a height range of 6 to 8 km, and the peaks of histograms moved to larger Z and large negative (downward) velocity with decreasing heights, indicating the downward growth of precipitation. The mode of SW distributions systematically moved to larger values with a decrease in height (notably less in cirrus). This is likely an indication of the spread of particle size distribution toward the ground due to their steady growth as indicated by the change in Z mode.
Figure 6 shows contoured frequency by altitude diagrams (CFAD) of Z, VD, and SW for the three ice cloud types. Cirrus typically occurred at a height range from 9 to 12 km. The stratiform and anvil type clouds showed two modes at height ranges of 10–12 km (similar to cirrus) and 5–9 km, respectively. This indicates the potential seeder–feeder effect in stratiform and anvil. The significant growth of Z and VD appeared in the layer from 8 to 10 km for all types of ice clouds. However, the VD of stratiform was nearly constant near a height of 7 to 8 km and seems to be an elongated “S” shape. In addition, SW rapidly increased in this layer due to the broadening of the power spectrum. Thus, this “S” shape of VD with an increase in Z can be interpreted as either (1) the existence of an upward air motion with induced turbulence or (2) broadening of snow particle size distributions due to an increased number concentration of smaller particles.
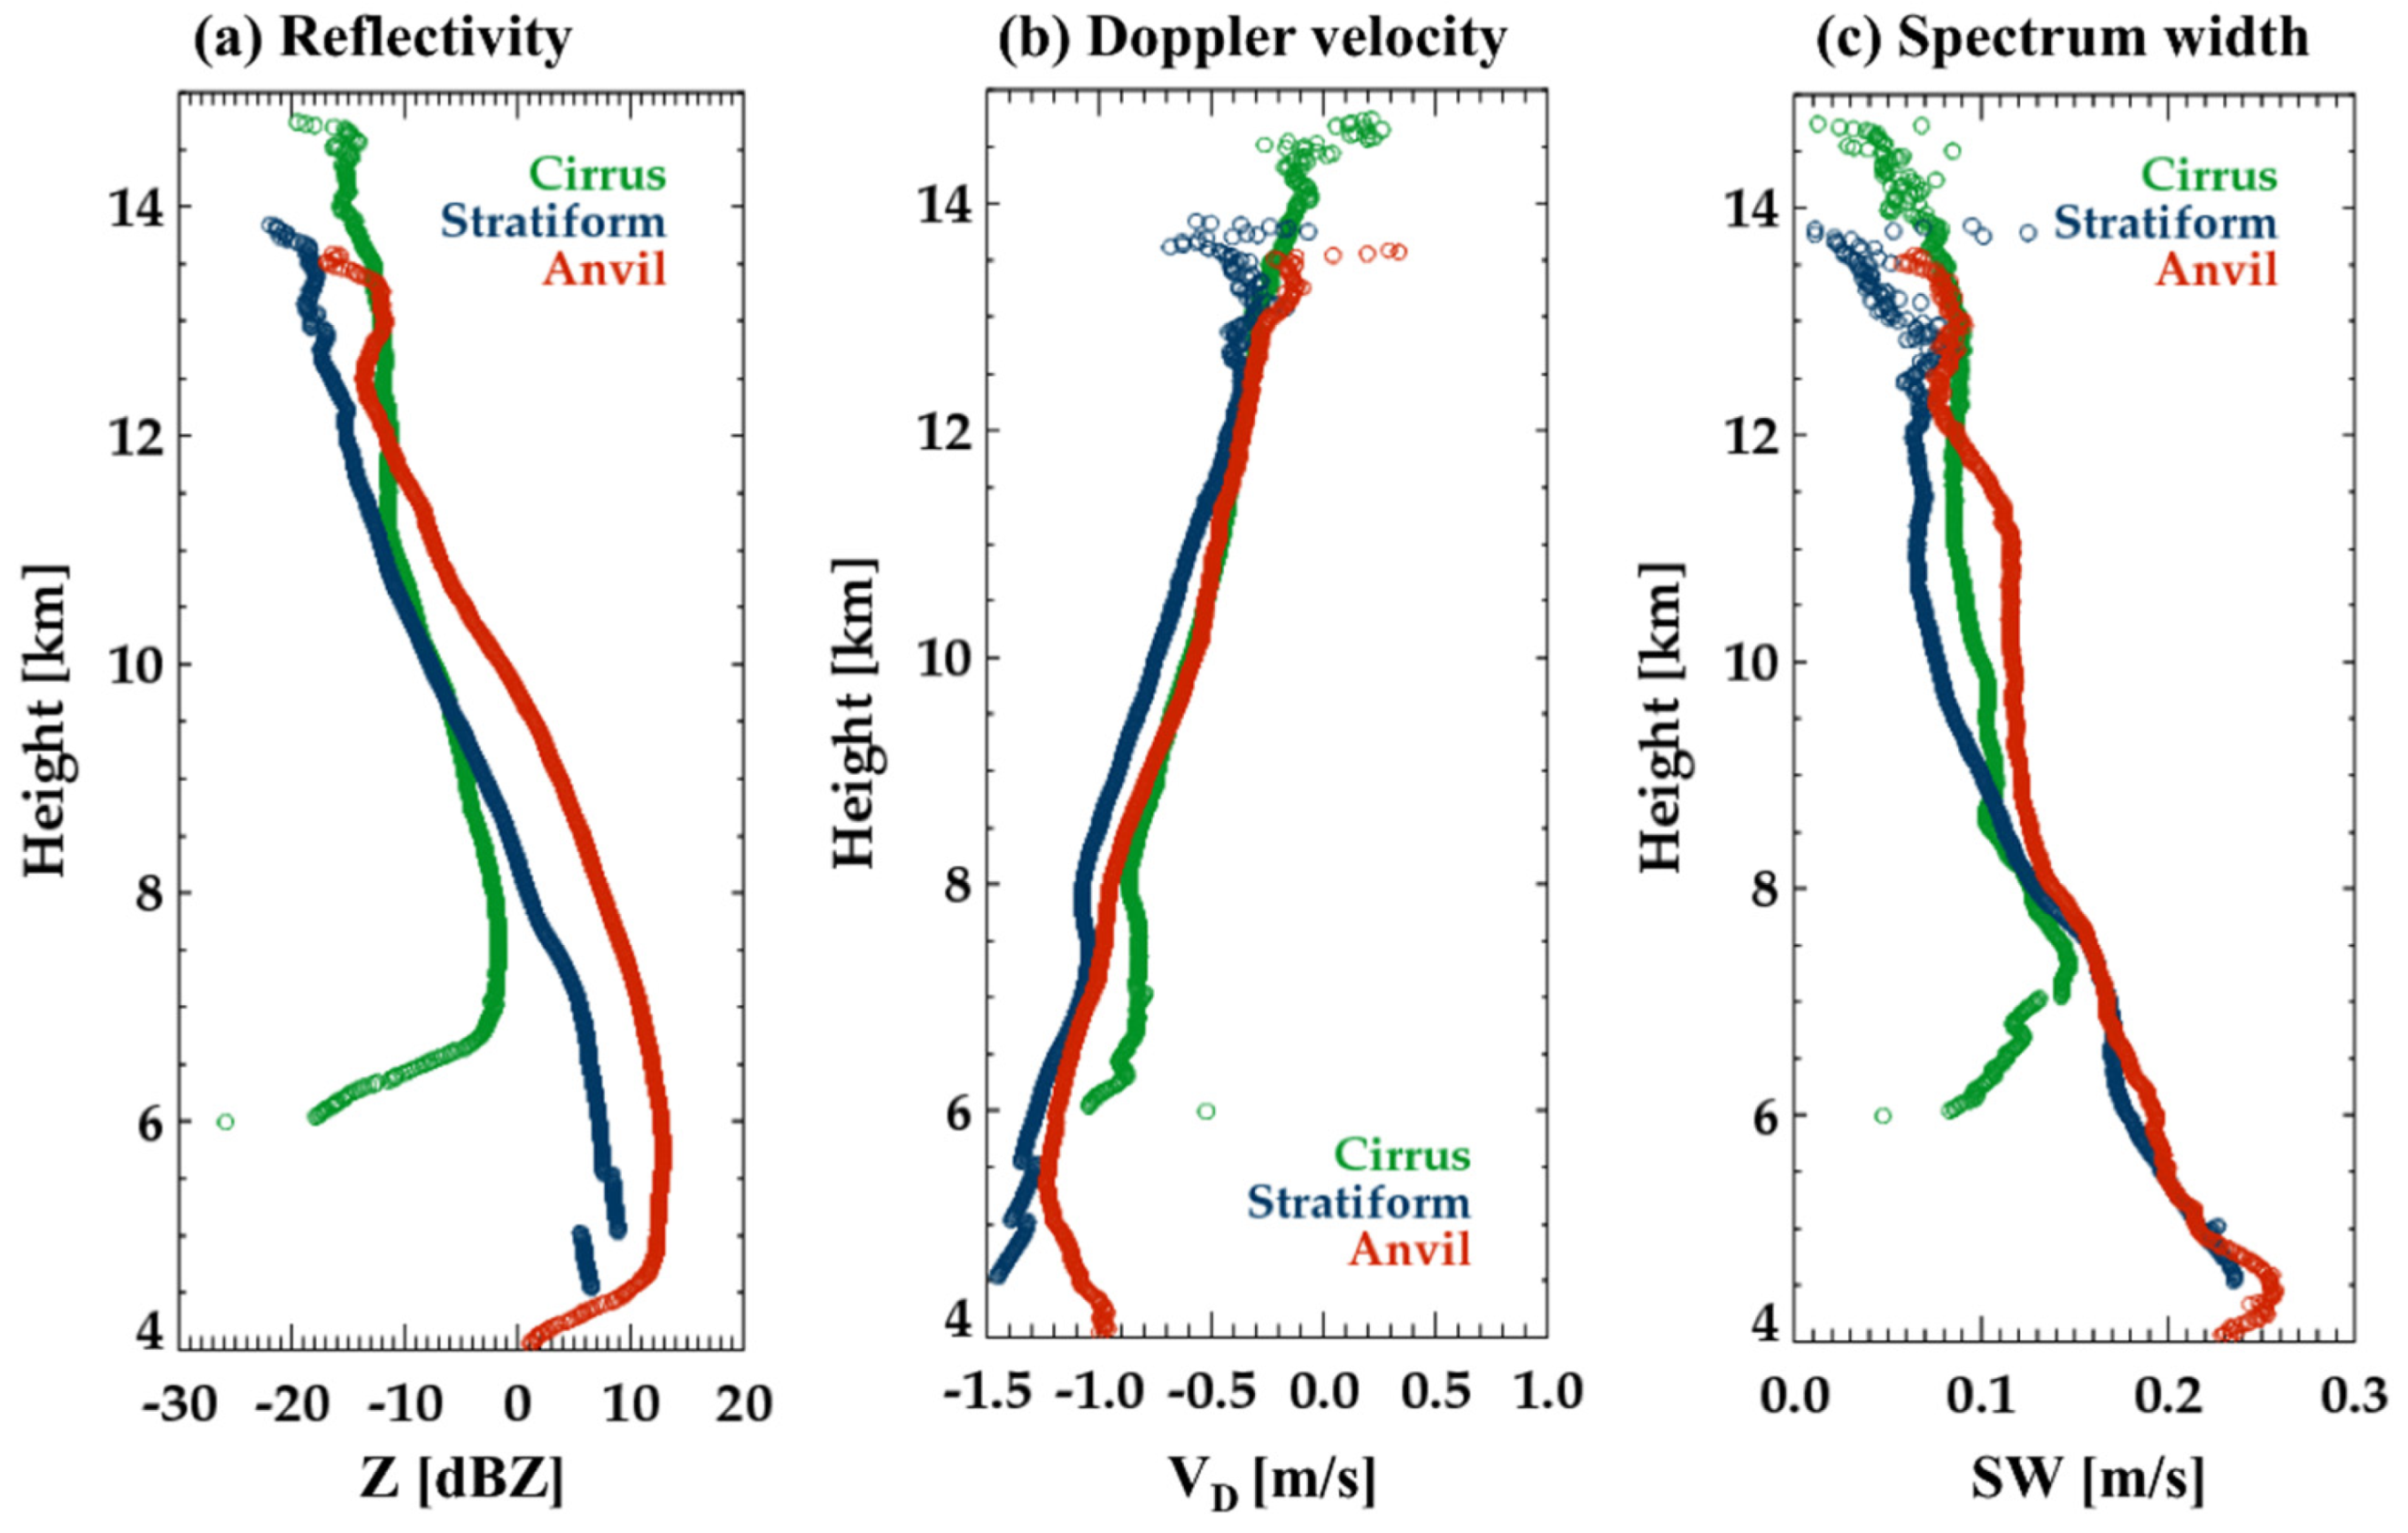
The mean vertical profiles of the radar parameters are shown in Figure 7. The Z slope is related to ice cloud growth. Z in general increased with increasing VD, and SW, indicating general growth of ice particles. The mean Z for stratiform and anvil increased with a similar slope at the height range of 8 to 11 km, but the averaged Z of the anvil was larger than the Z of stratiform throughout the entire altitude. The VD profiles of cirrus and anvil were quite similar in the layer of 9–12 km and then separated below the layer due to a rapid reduction in Z in cirrus (that is, evaporation of ice particles). However, the falling velocity (negative VD) profiles of anvil were smaller than those of stratiform. In addition, the SW of the anvil was the largest due to the diverse size and velocity of ice particles. This indicates that anvil is composed of a lower density and larger sizes of ice particles than those of stratiform. One of the outstanding features in the averaged VD profile was the elongated “S” shape with reduced VD values in the layer of 7–8 km. It is notable that SW in stratiform and anvil dramatically increased at the 7–8 km height.

4.2. Estimation of Terminal Velocity and Vertical Air Motion

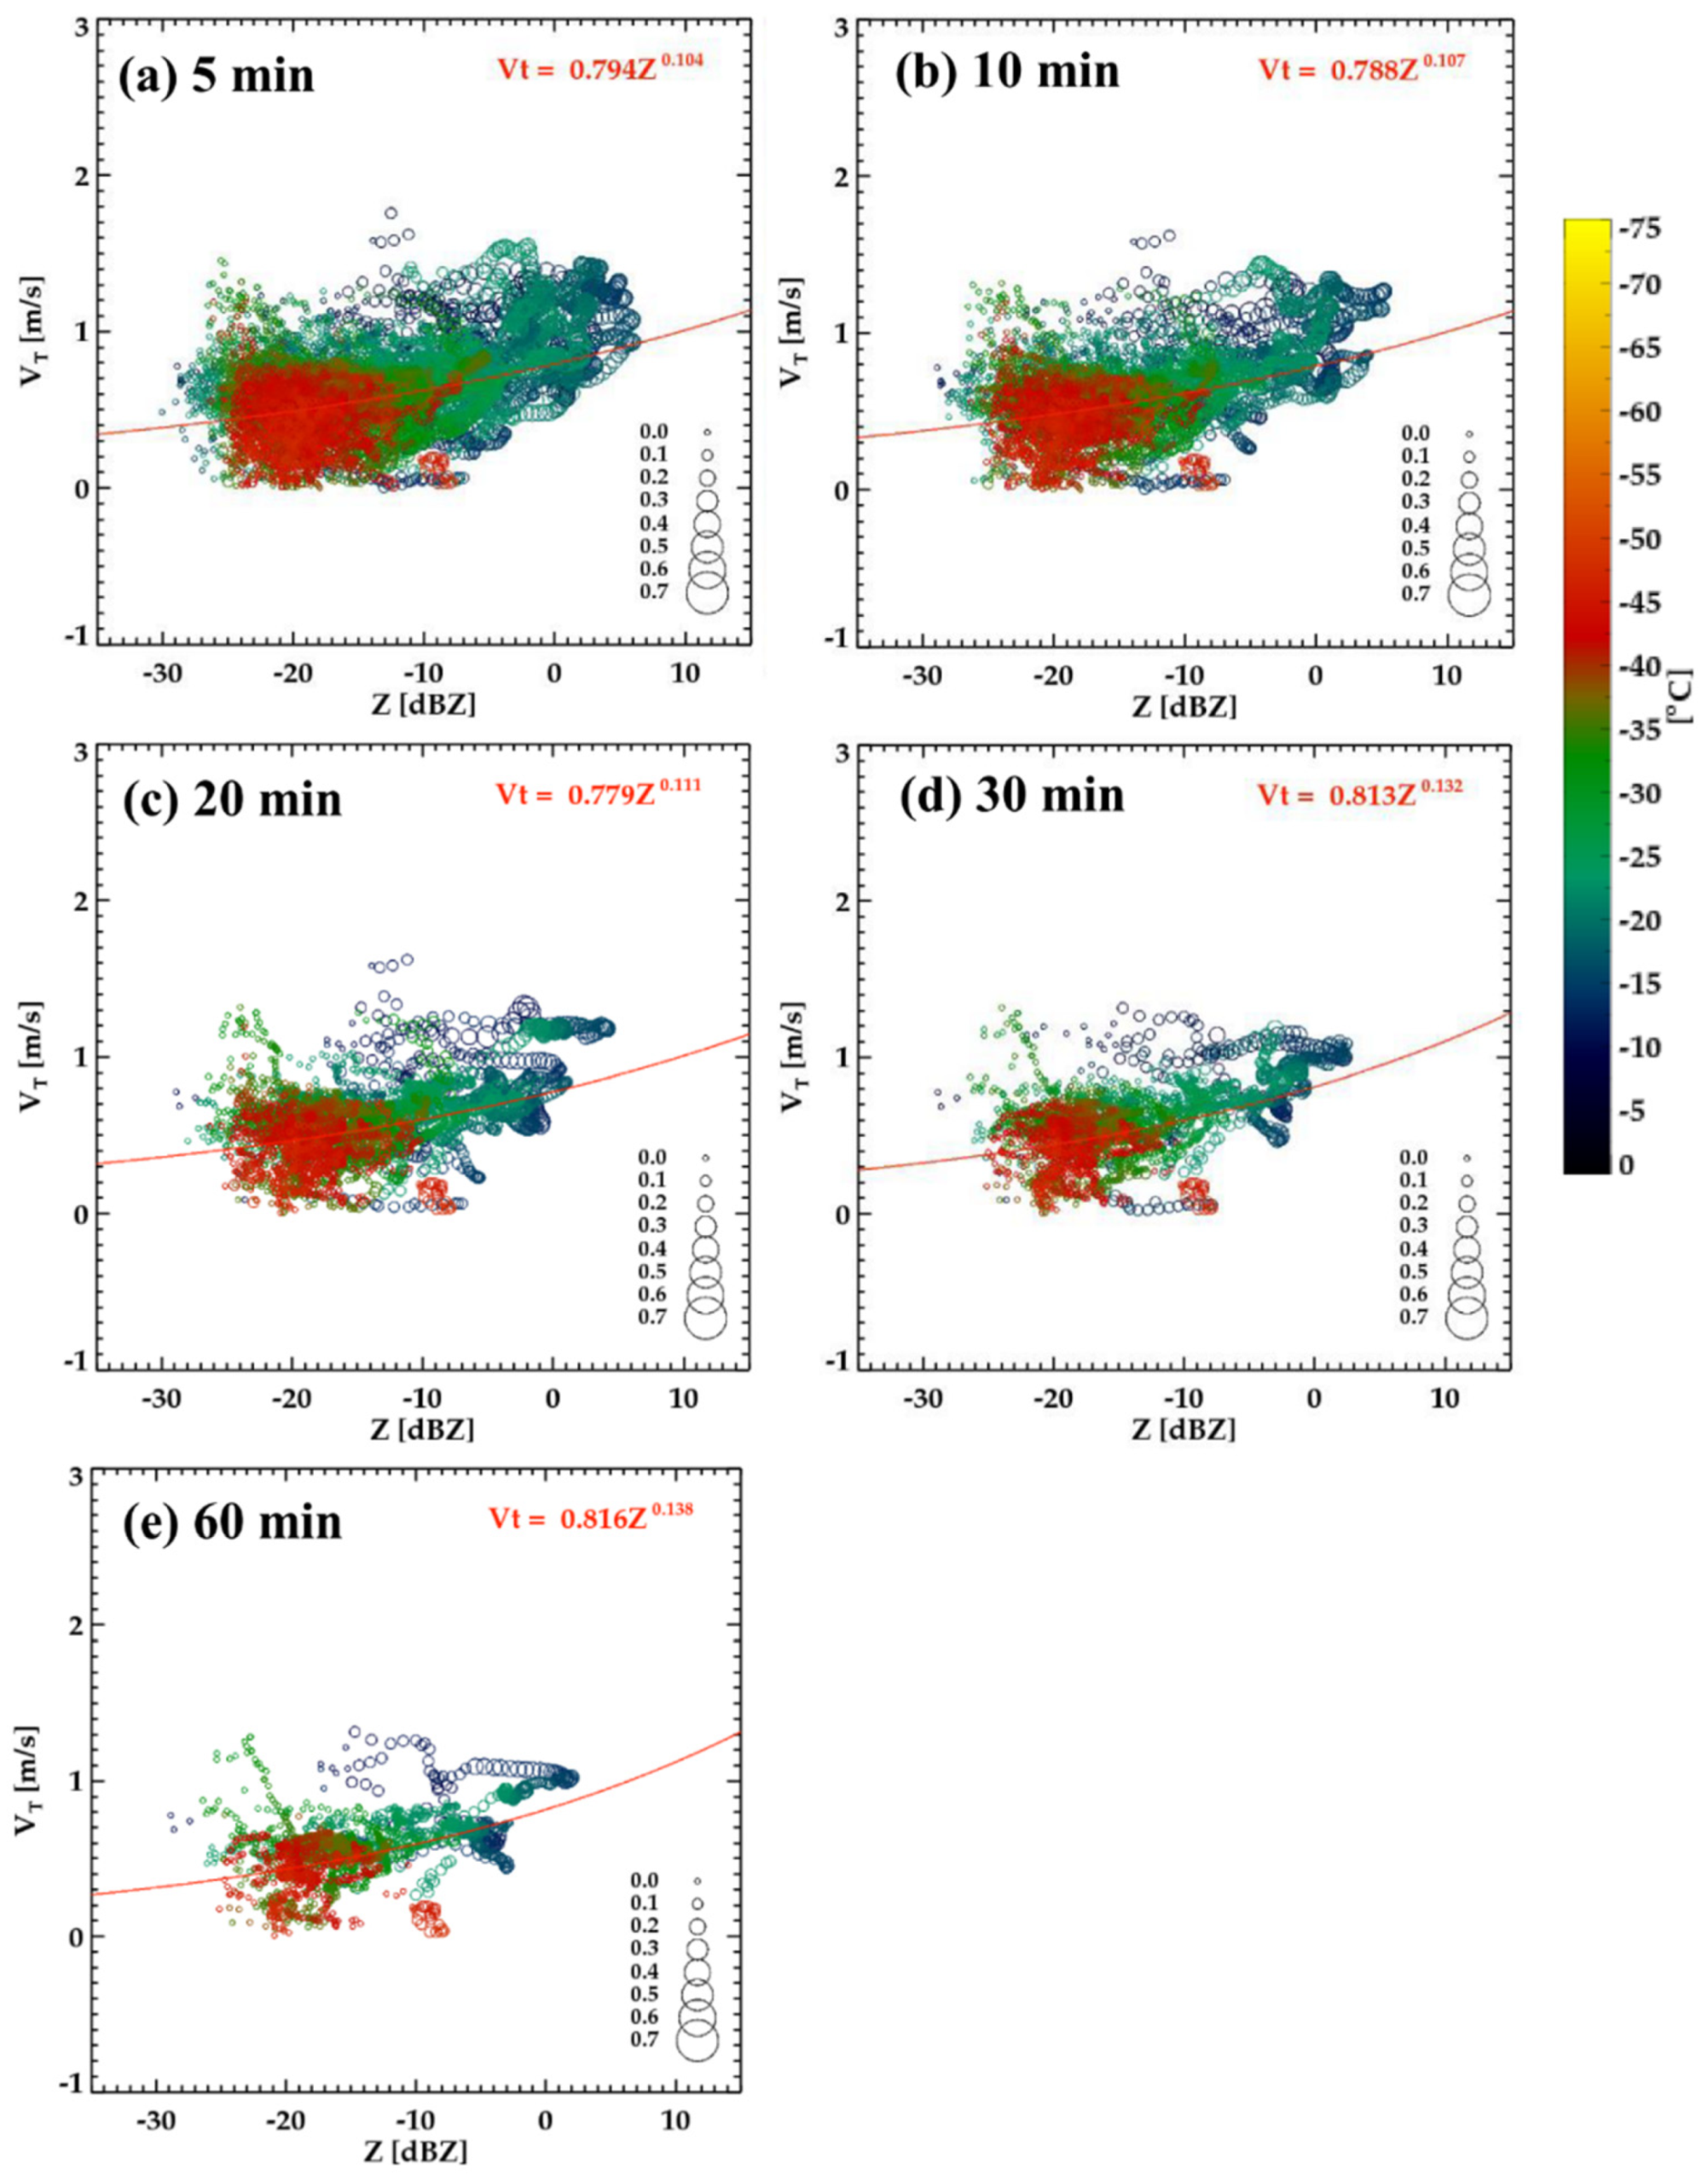
When a VtZ relationship was calculated by the various temporal average intervals, the coefficient a and exponent b changed depending on averaging time and ice cloud types. In the cirrus case on 25 September 2014, the coefficient slightly decreased from 0.794 to 0.779 with an increase in the average time by up to 20 min and then increased from 0.779 to 0.816 at an average time longer than 20 min (Figure 8). The exponent increased from 0.104 to 0.138 with an average time of 5–60 min. In contrast, the coefficients decreased from 0.848 to 0.835 with an increase in average time for the anvil case on 16 June 2014 (not shown). As the average time increased, smaller-scale variabilities were eliminated, and only mean characteristics remained. It was necessary to select the average time in which the coefficient and exponent representing the properties of ice clouds did not significantly change. Protat and Williams [20] found that the error of estimated terminal fall velocity can be most reduced when the average time is set at 20 min. In addition, Matrosov et al. [13] and Delanoë et al. [10] proposed that it is possible to approximate VD as the Vt in this time average since Vair can be neglected with an average of 20 min. Therefore, the average time for the calculation of the VtZ relationship was set as 20 min.
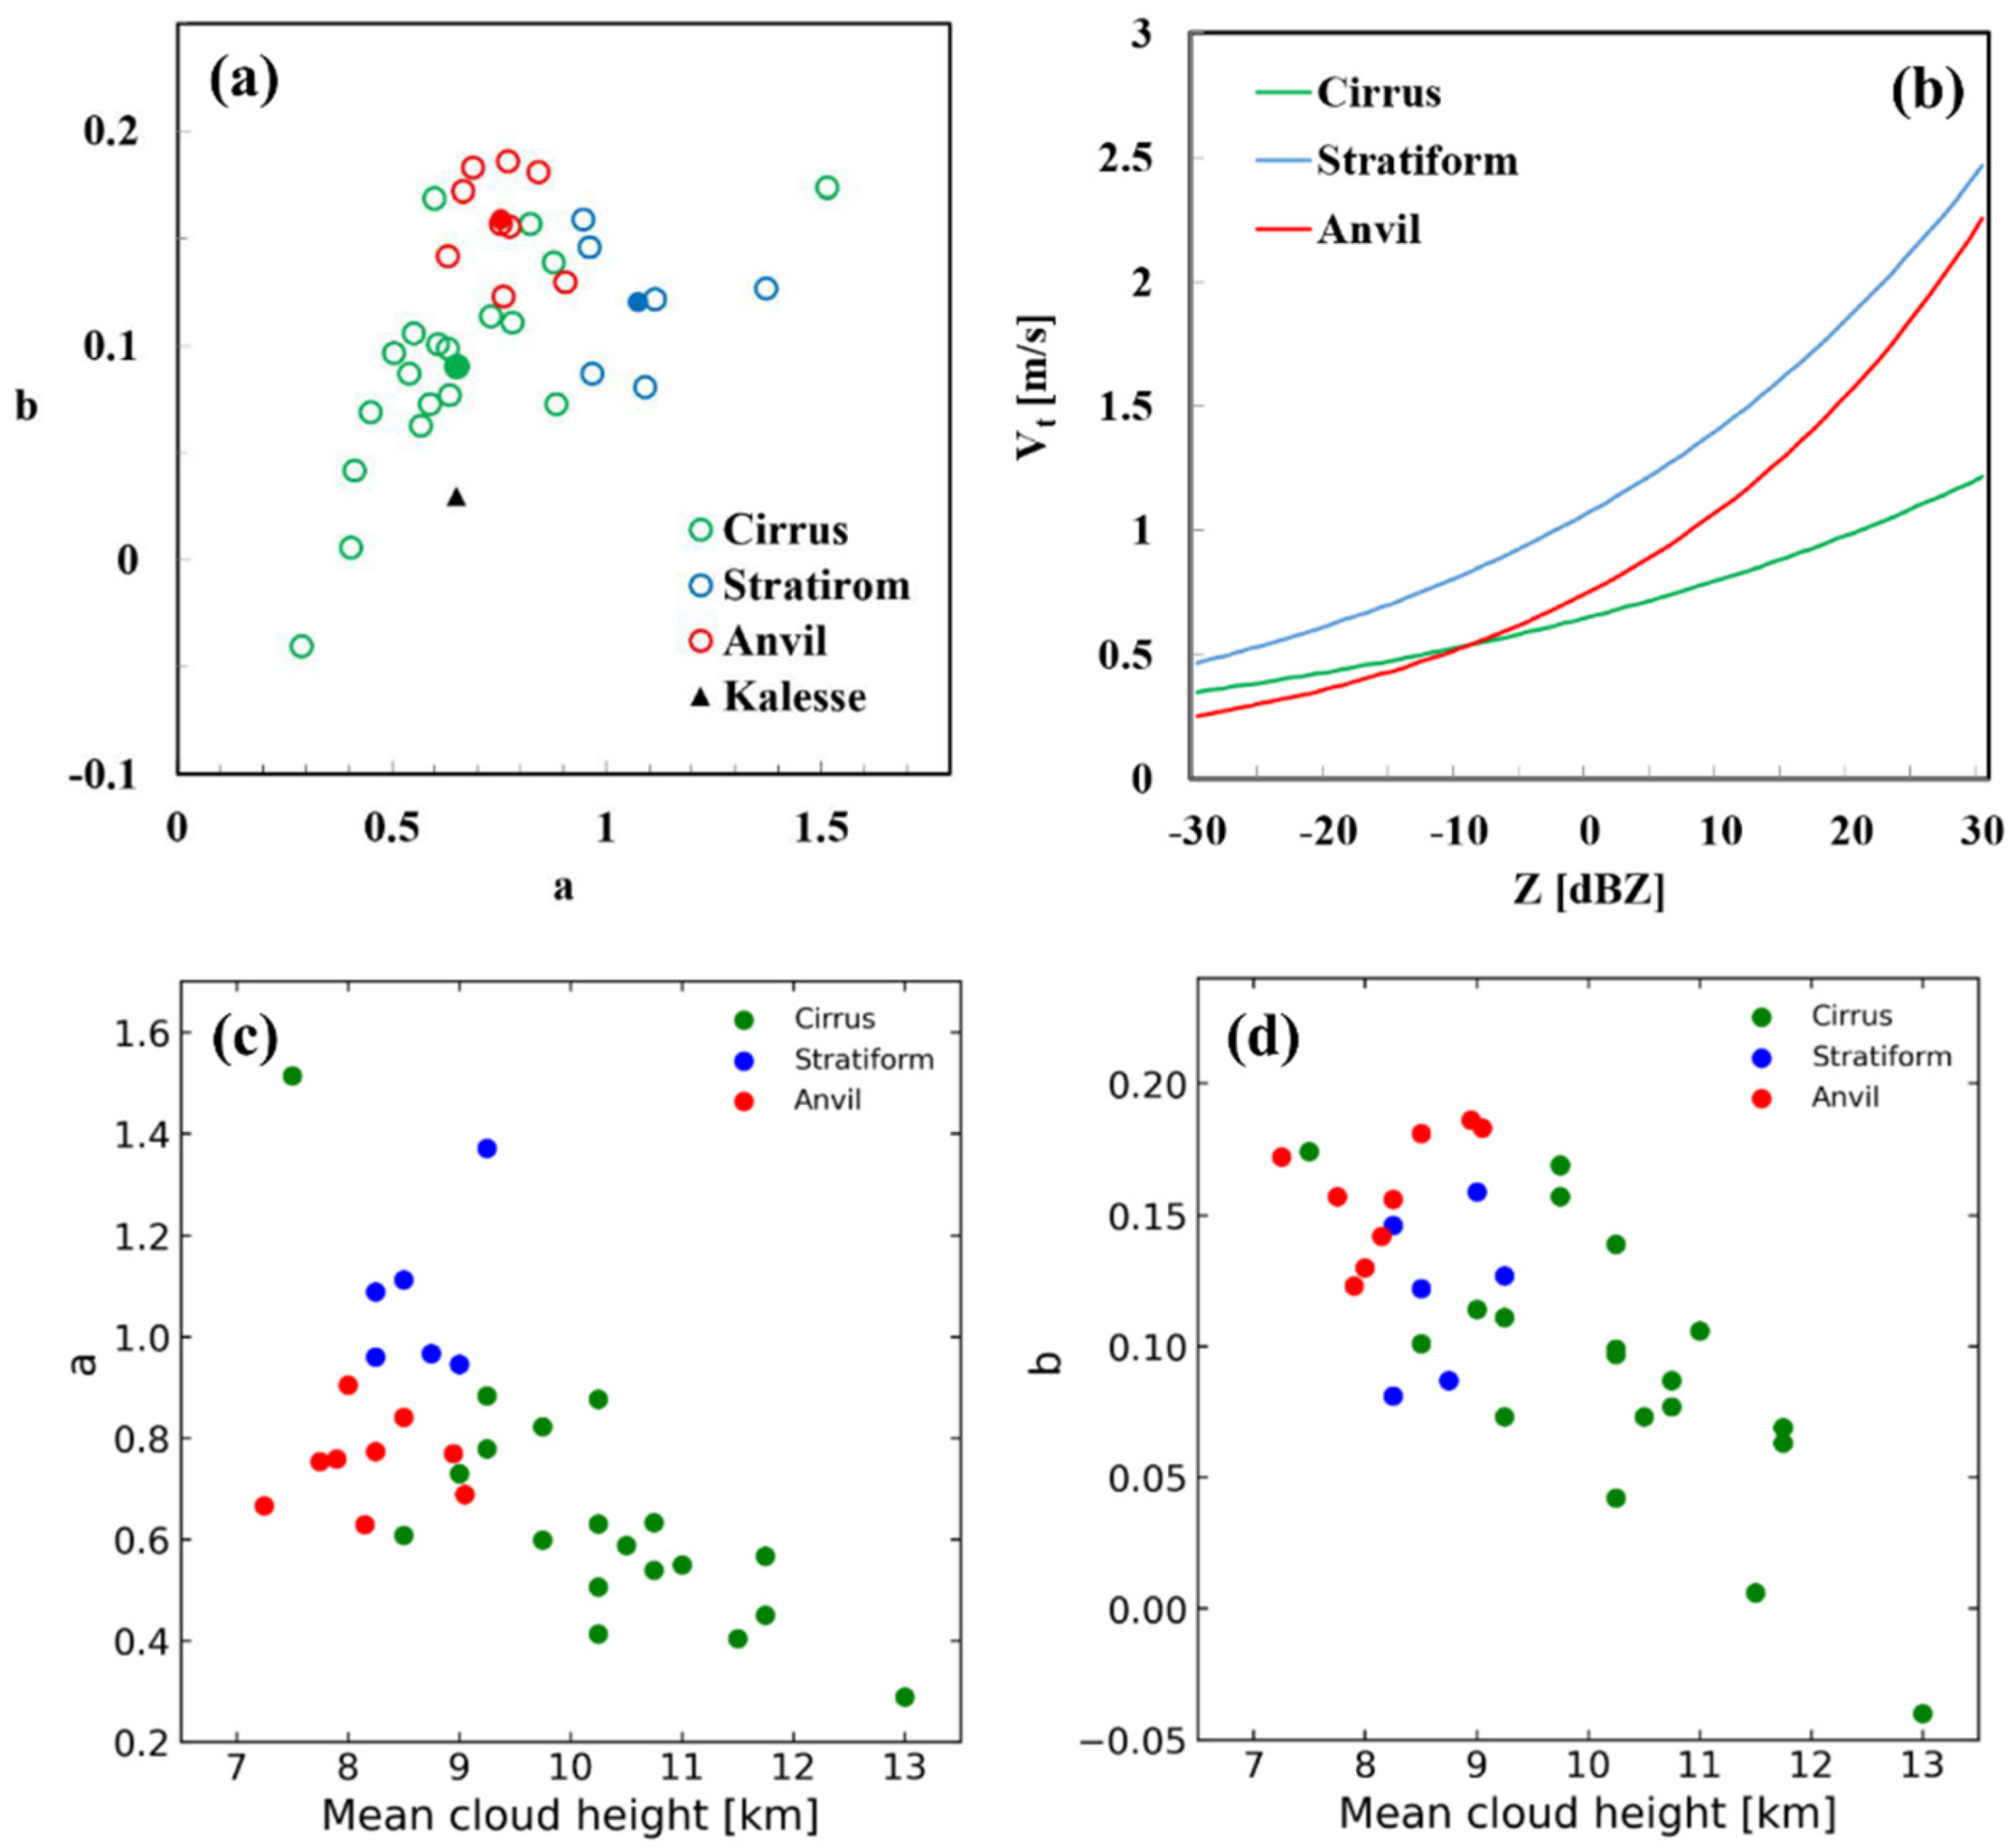
The VtZ relationships were derived for all ice cloud cases (Figure 9). The mean coefficient and mean exponent for cirrus (filled green dot) were 0.65 (0.29 to 1.5) and 0.09 (−0.04 to 0.17), respectively. The cirrus clouds had larger differences in Z and Vt depending on the height of the cloud echo and the wide distribution of the values of coefficients and exponents. As cloud height decreased, the coefficient and exponent became larger (Figure 9c,d). Although cirrus showed a wide variation of coefficients and exponents, the variation of Vt in cirrus was relatively small with Z varying (Figure 9b). These results were similar to those of previous studies on cirrus cloud [20,26]. According to Kalesse et al. [26], the empirical relationship relates dominant microphysical processes in different parts of ice clouds, and exponent b can be explained in terms of moments of particle size distributions. In addition, they showed that a negative (or close to zero) exponent b near the cloud top indicates a rapid increase in number concentration (low moment) rather than reflectivity (high moment). This coefficient was the smallest in cirrus.
For stratiform cases, the coefficient a was from 0.95 to 1.37 (mean of 1.07) and the exponent b was from 0.08 to 0.16 (mean of 0.12). The coefficients and exponents of anvil cases were from 0.63 to 0.90 and from 0.12 to 0.19, respectively. With the same Z, the Vt of stratiform was always higher than the Vt of the anvil. However, anvil had a larger b than that of the exponent of stratiform, indicating that the Vt of anvil increased more rapidly than that of stratiform as Z increased. This implies that the density of anvil increased more quickly than that of stratiform for the same Z increment [31,32].
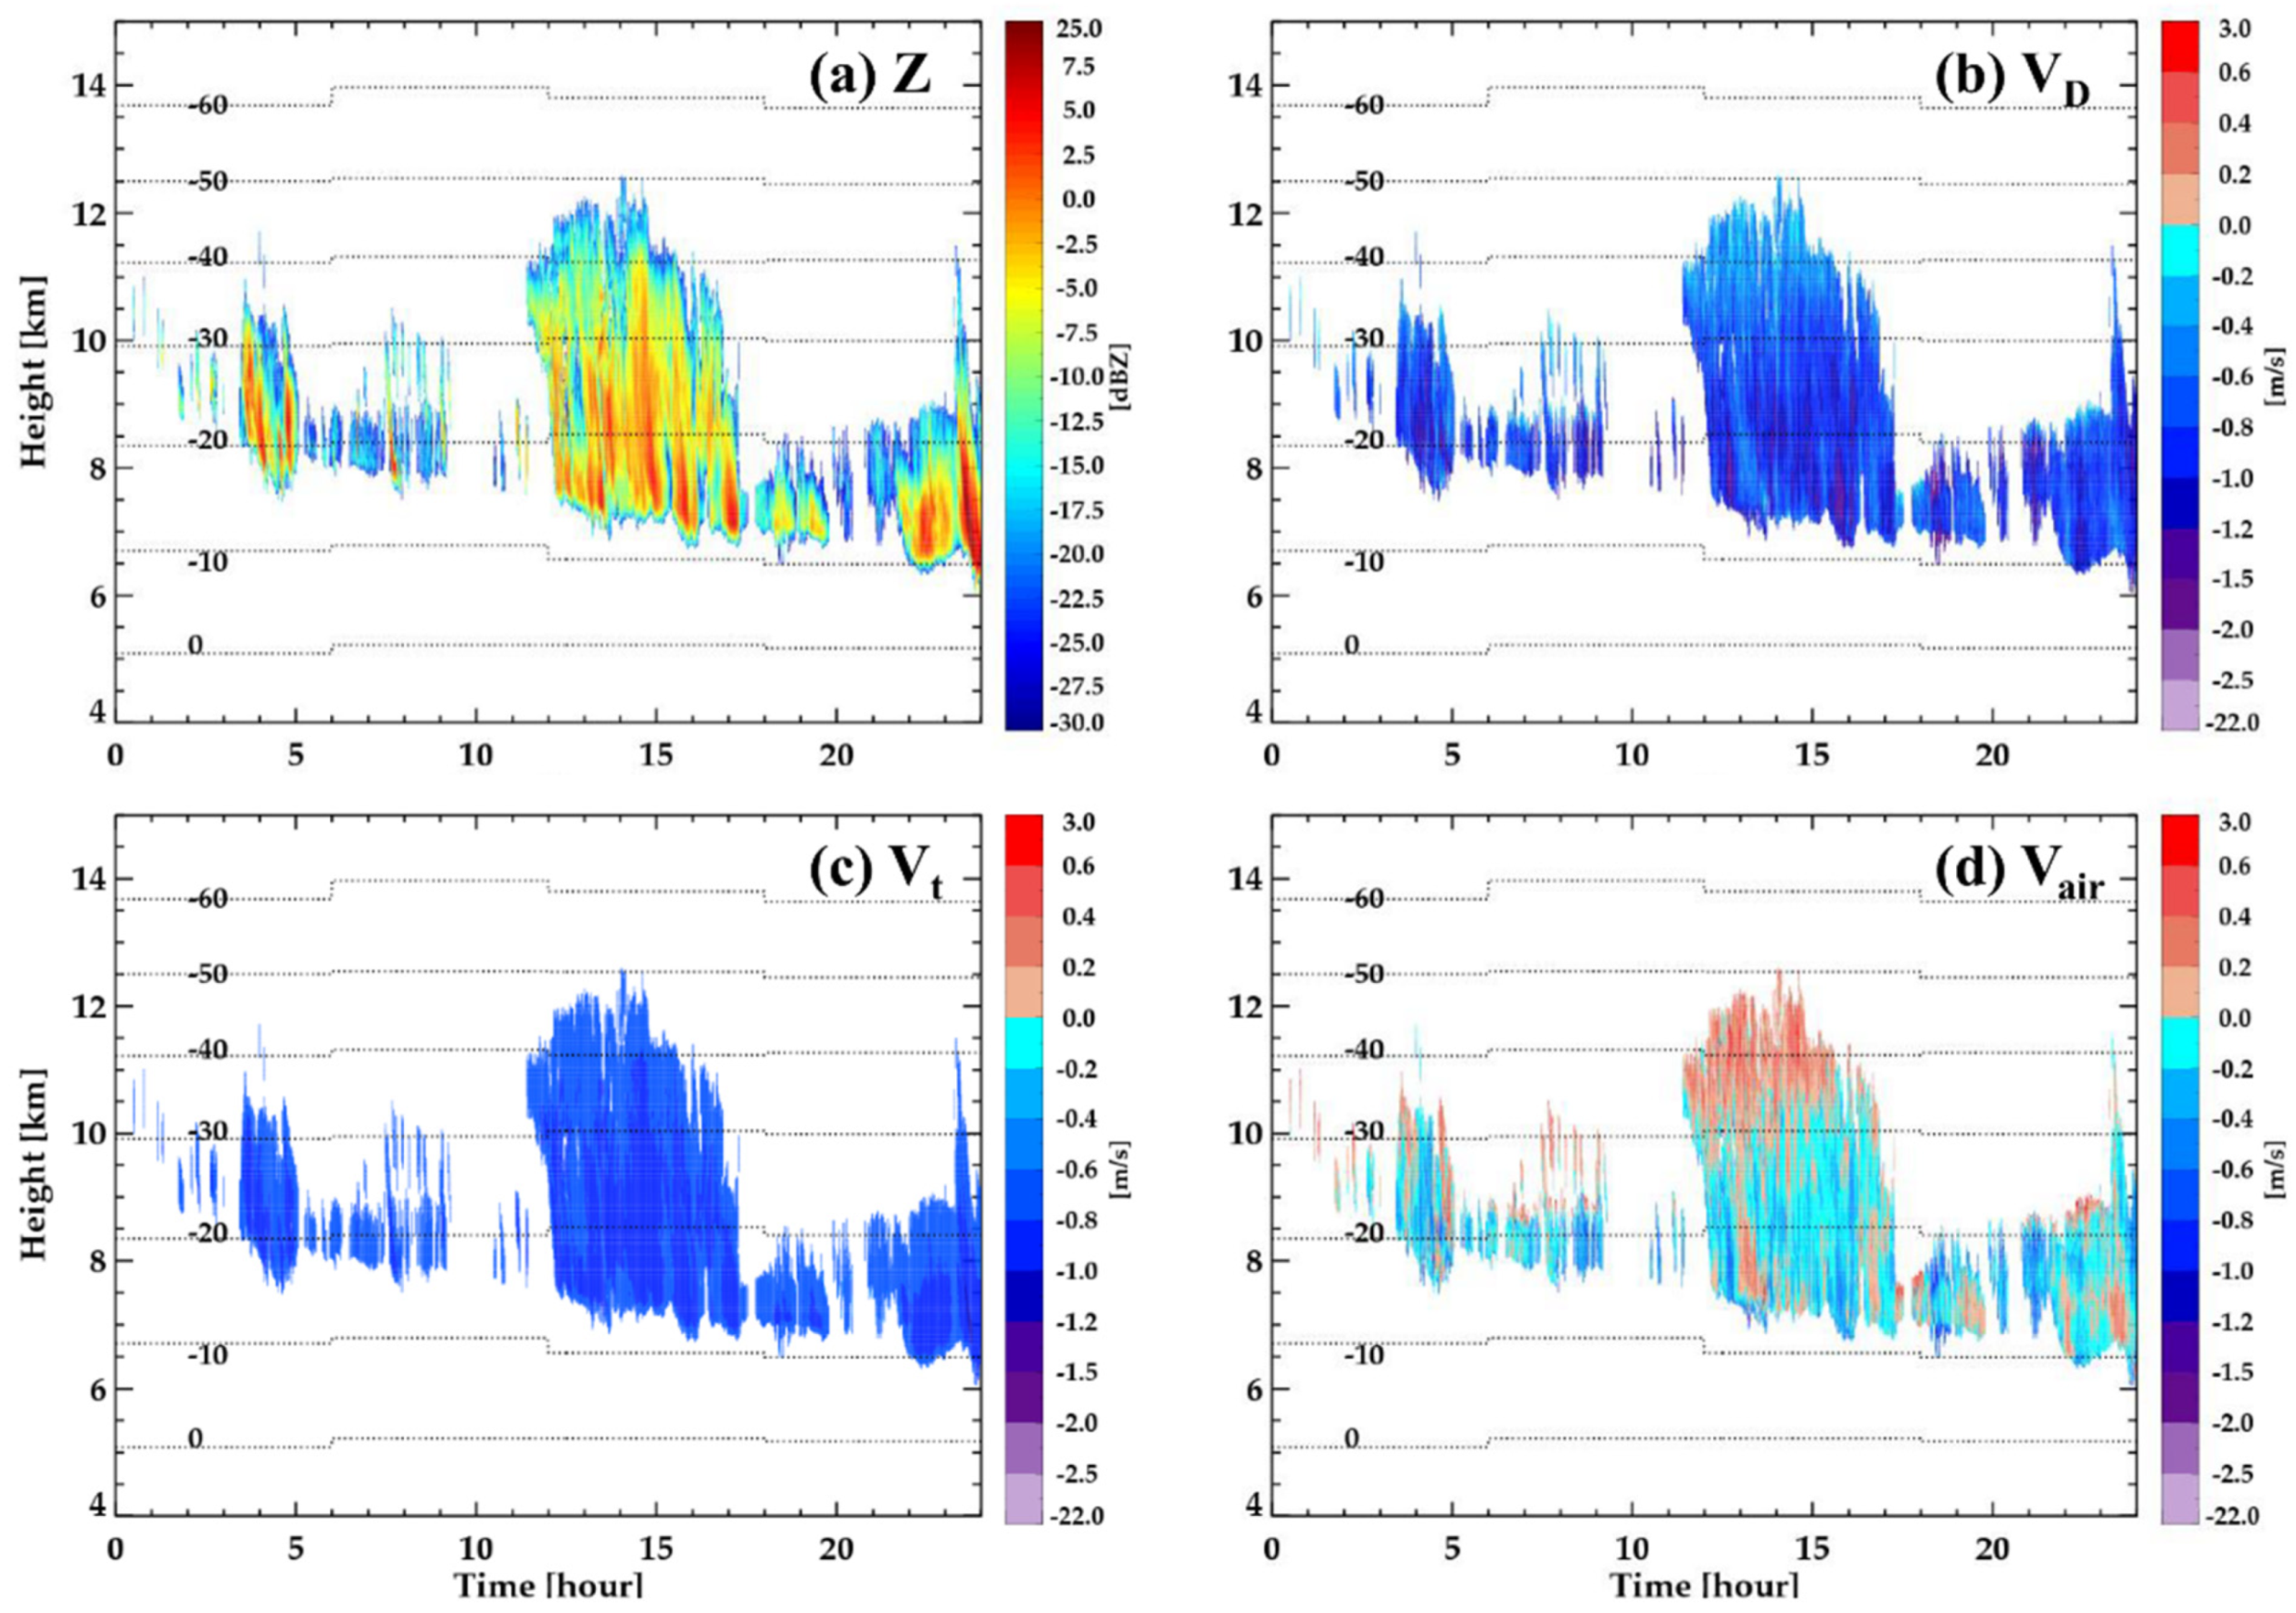
Vt was calculated from the observed Z using pre-determined VtZ relationships by ice cloud types, and Vair was then estimated by comparing VD with derived Vt. Figure 10, Figure 11 and Figure 12 show the time–height cross-section of observed Z and VD as well as the estimated Vt and Vair. In the case of cirrus on 9 August 2015 (Figure 10), Z increased from −25 to 5 dBZ and VD increased from 0 to −1.5 m s−1 as the Vt of ice particles increased. Interestingly, the vertical and temporal structure of VD is much smaller than that of Z and Vt, which is due to the added smaller scale variation in vertical air motion.
According to Protat and Williams [20], the VtZ relationship technique has a high level of accuracy, in which the residual between retrieved Vt and reference Vt is less than 0.1 m s−1 above a height of 9 km. Given this error, the retrieval technique of Vair in this study will contribute to understanding the microphysical and dynamical processes in the ice clouds. Vair had an upward air motion up to 0.4 m s−1 in the upper part of the cloud where VD was small and the estimated Vt ranged from −0.8 to −0.4 m s−1. However, Vair in the lower part of the cloud appeared to be a downward air motion from −0.8 to 0 m s−1. The bottom part of the cloud was repeatedly modulated by upward and downward motions.
The case of stratiform on 5 July 2014 developed vertically to a height of 13 km (Figure 11). A dramatic growth appeared with an increase in Z of about 8 dB km−1 and an increase in Vt of about 0.3 m s−1 km−1 at the height of 10–13 km. Strong upward air motions (up to 1.5 m s−1) appeared in this layer. Strong Z was prominent and vertically well developed at 1200–1330 UTC. This is related to a vertically stacked updraft with strong hot spots of Vair in the top of the precipitation system. There exists a significant reduction in VD in the layer with a height of 7–8 km (−17–−15 °C) (Figure 11b). This is consistent with the mean vertical profiles of VD in Figure 7b. This appeared as the layer of upward motion with some periodicity (Figure 11d). Similar characteristics appeared in different stratiform cases, leading to average statistical characteristics (shown below).
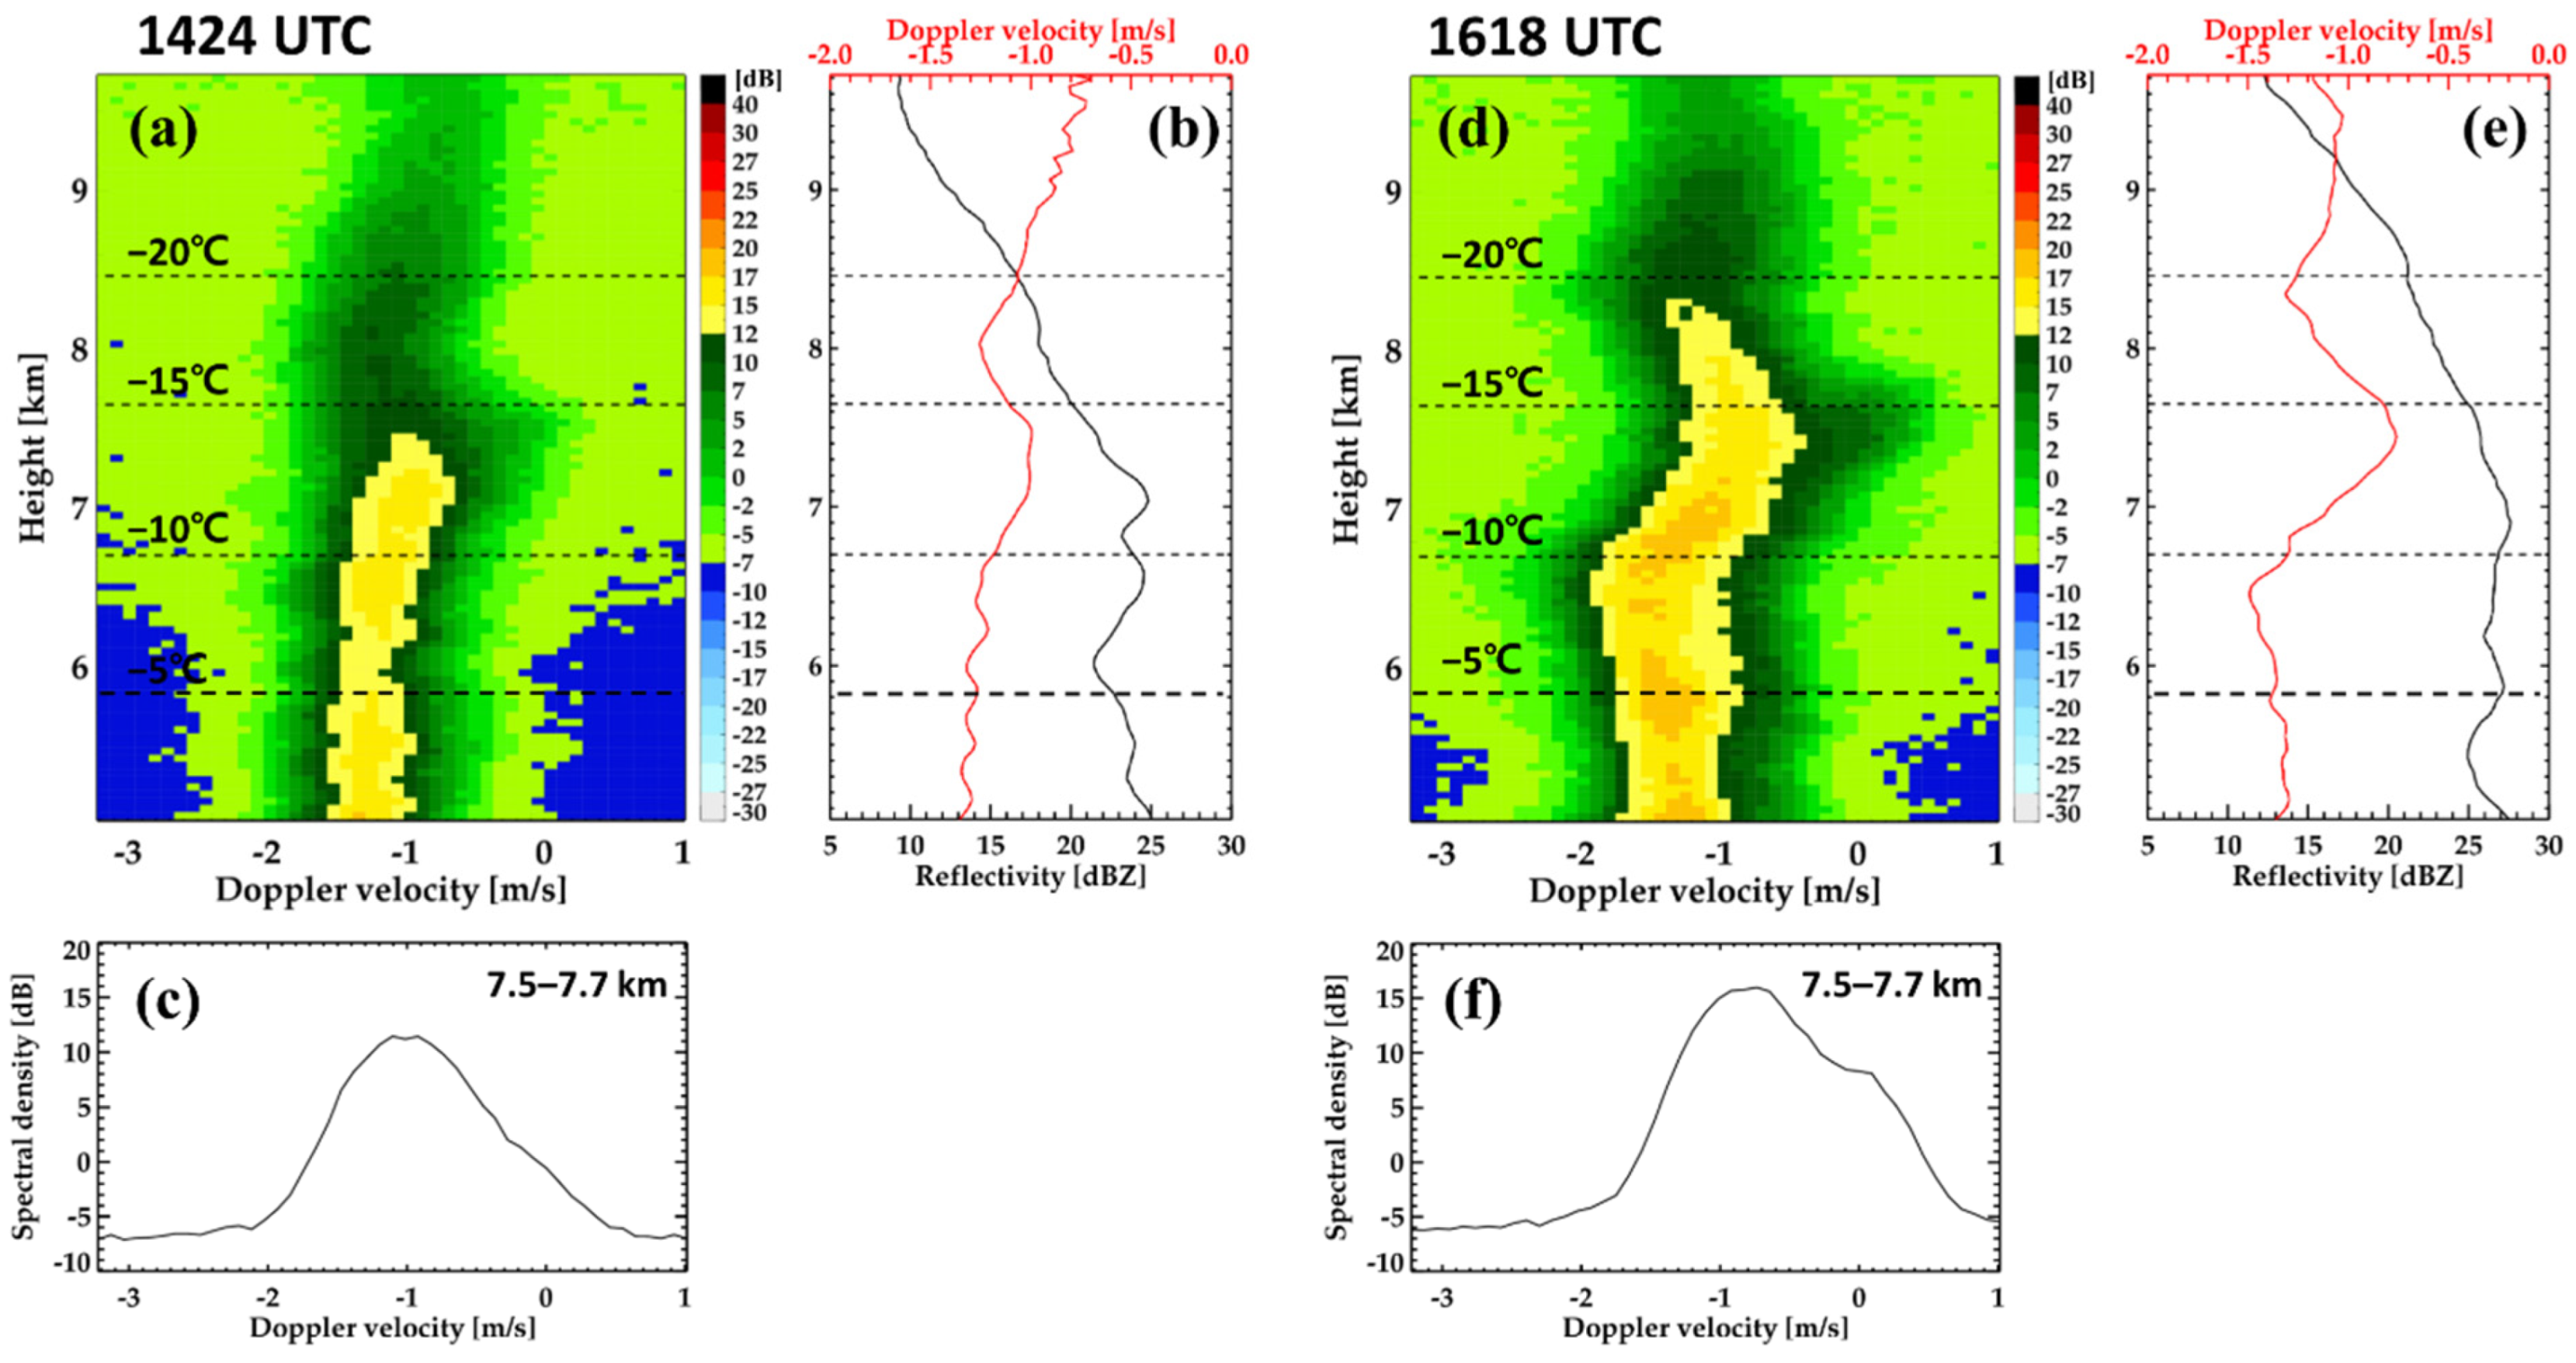
To investigate this unique feature in detail, we examined the Doppler power spectra of vertically pointing X-band radar (VertiX, detail specification in [18]). When upward air motion appeared at a height of 7–8 km, the Doppler spectra at a height of 7.5–7.7 km (layer near −15 °C) showed bi-modality with peaks at −1.0–−0.8 and −0.2–0.2 m s−1 (Figure 12). The second peaks at a smaller fall velocity (smaller particles) became more pronounced from 1424 UTC to 1618 UTC on 5 July 2014. In addition, the VD (Z) of the first peak decreased (increased) from 9.5 to 8.4km, indicating the growth of larger ice particles. Then, VD increased from a height of 8.4 to 7.3 km, where the second peak completely merged with the first peak. This increase was induced by the upward air motion. Furthermore, as shown by the second peak, numerous smaller ice particles of low Vt were produced in this layer, grew, and merged afterward with existing larger ice particles. This layer had a temperature range of −16 °C to −13 °C, which was favorable for the growth of pristine crystals to planar types [33,34,35,36]. Thus, further investigation of the physical causes of upward motion and the following microphysical processes with dual-polarimetric radar data and snow habits from aircraft in situ measurements is recommended.
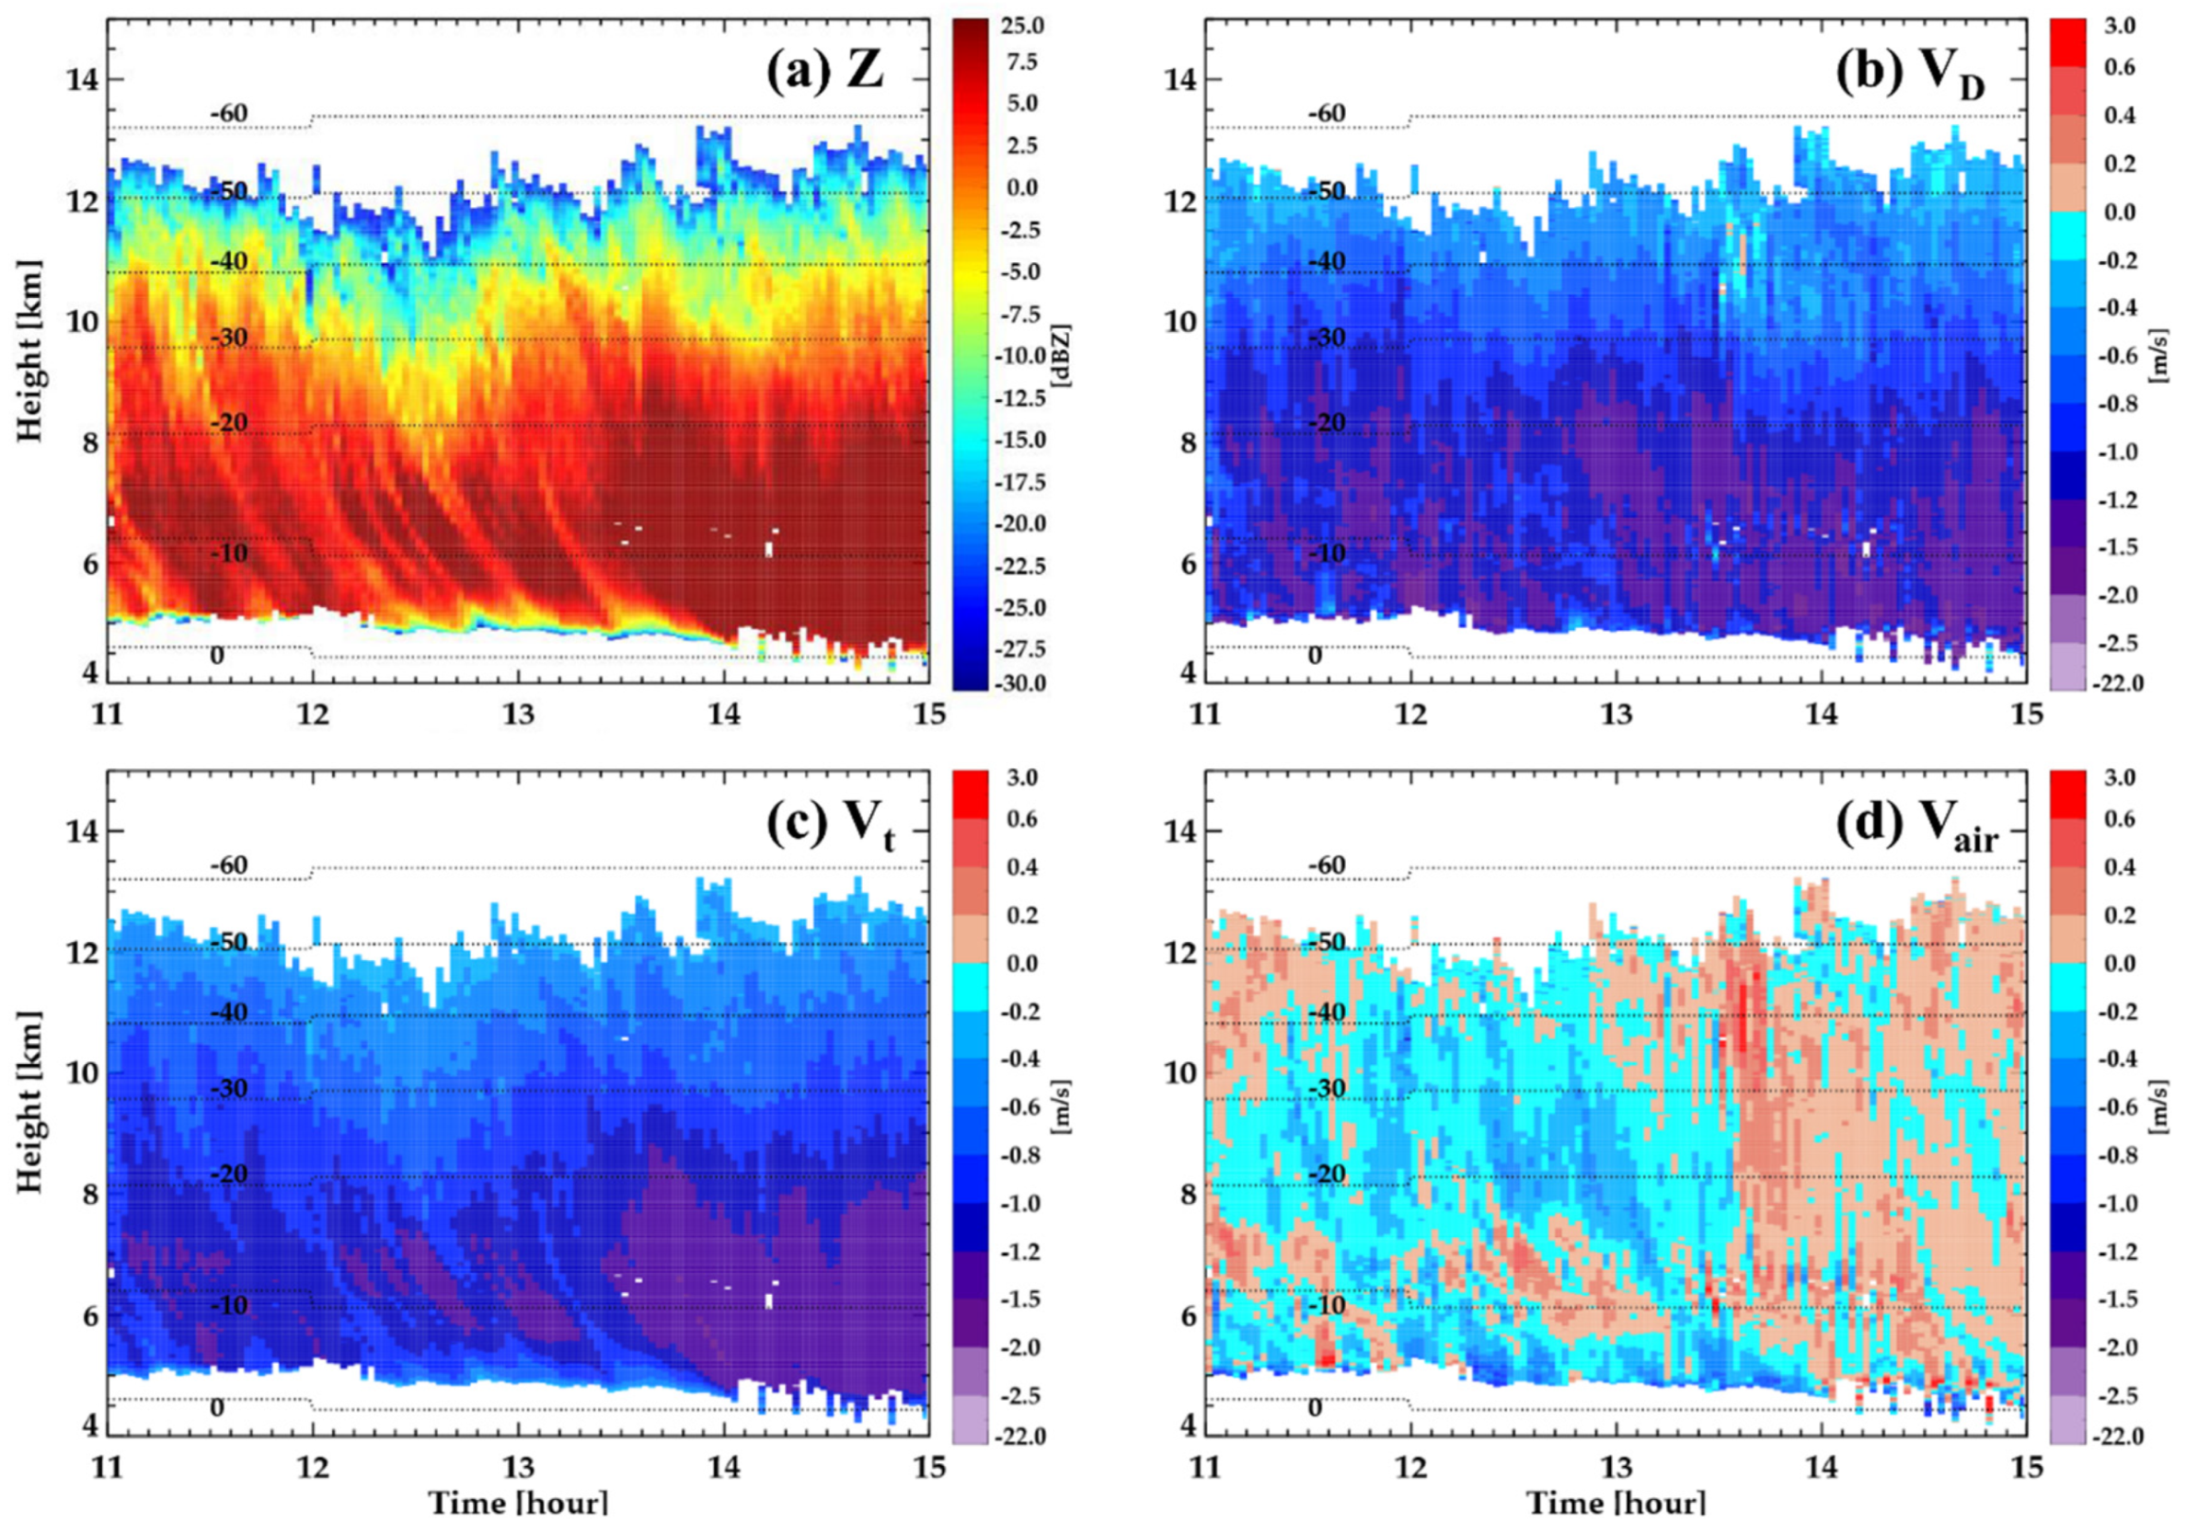
In the case of anvil on 16 July 2014, the Z and VD increased with a decrease in height and showed fall streaks of cloud particles (Figure 13). Vt also showed a clear fall streak below 8 km. A rapid increase in Z was observed in the layer of 7–8 km, which was consistent with the rapid decrease in VD at 1100–1300 UTC. The Vair showed positive values (upward) in this layer and the upper part of this system. After 13 UTC, the upward air motion appeared in the entire clouds, and the rapid growth started from the upper layers.
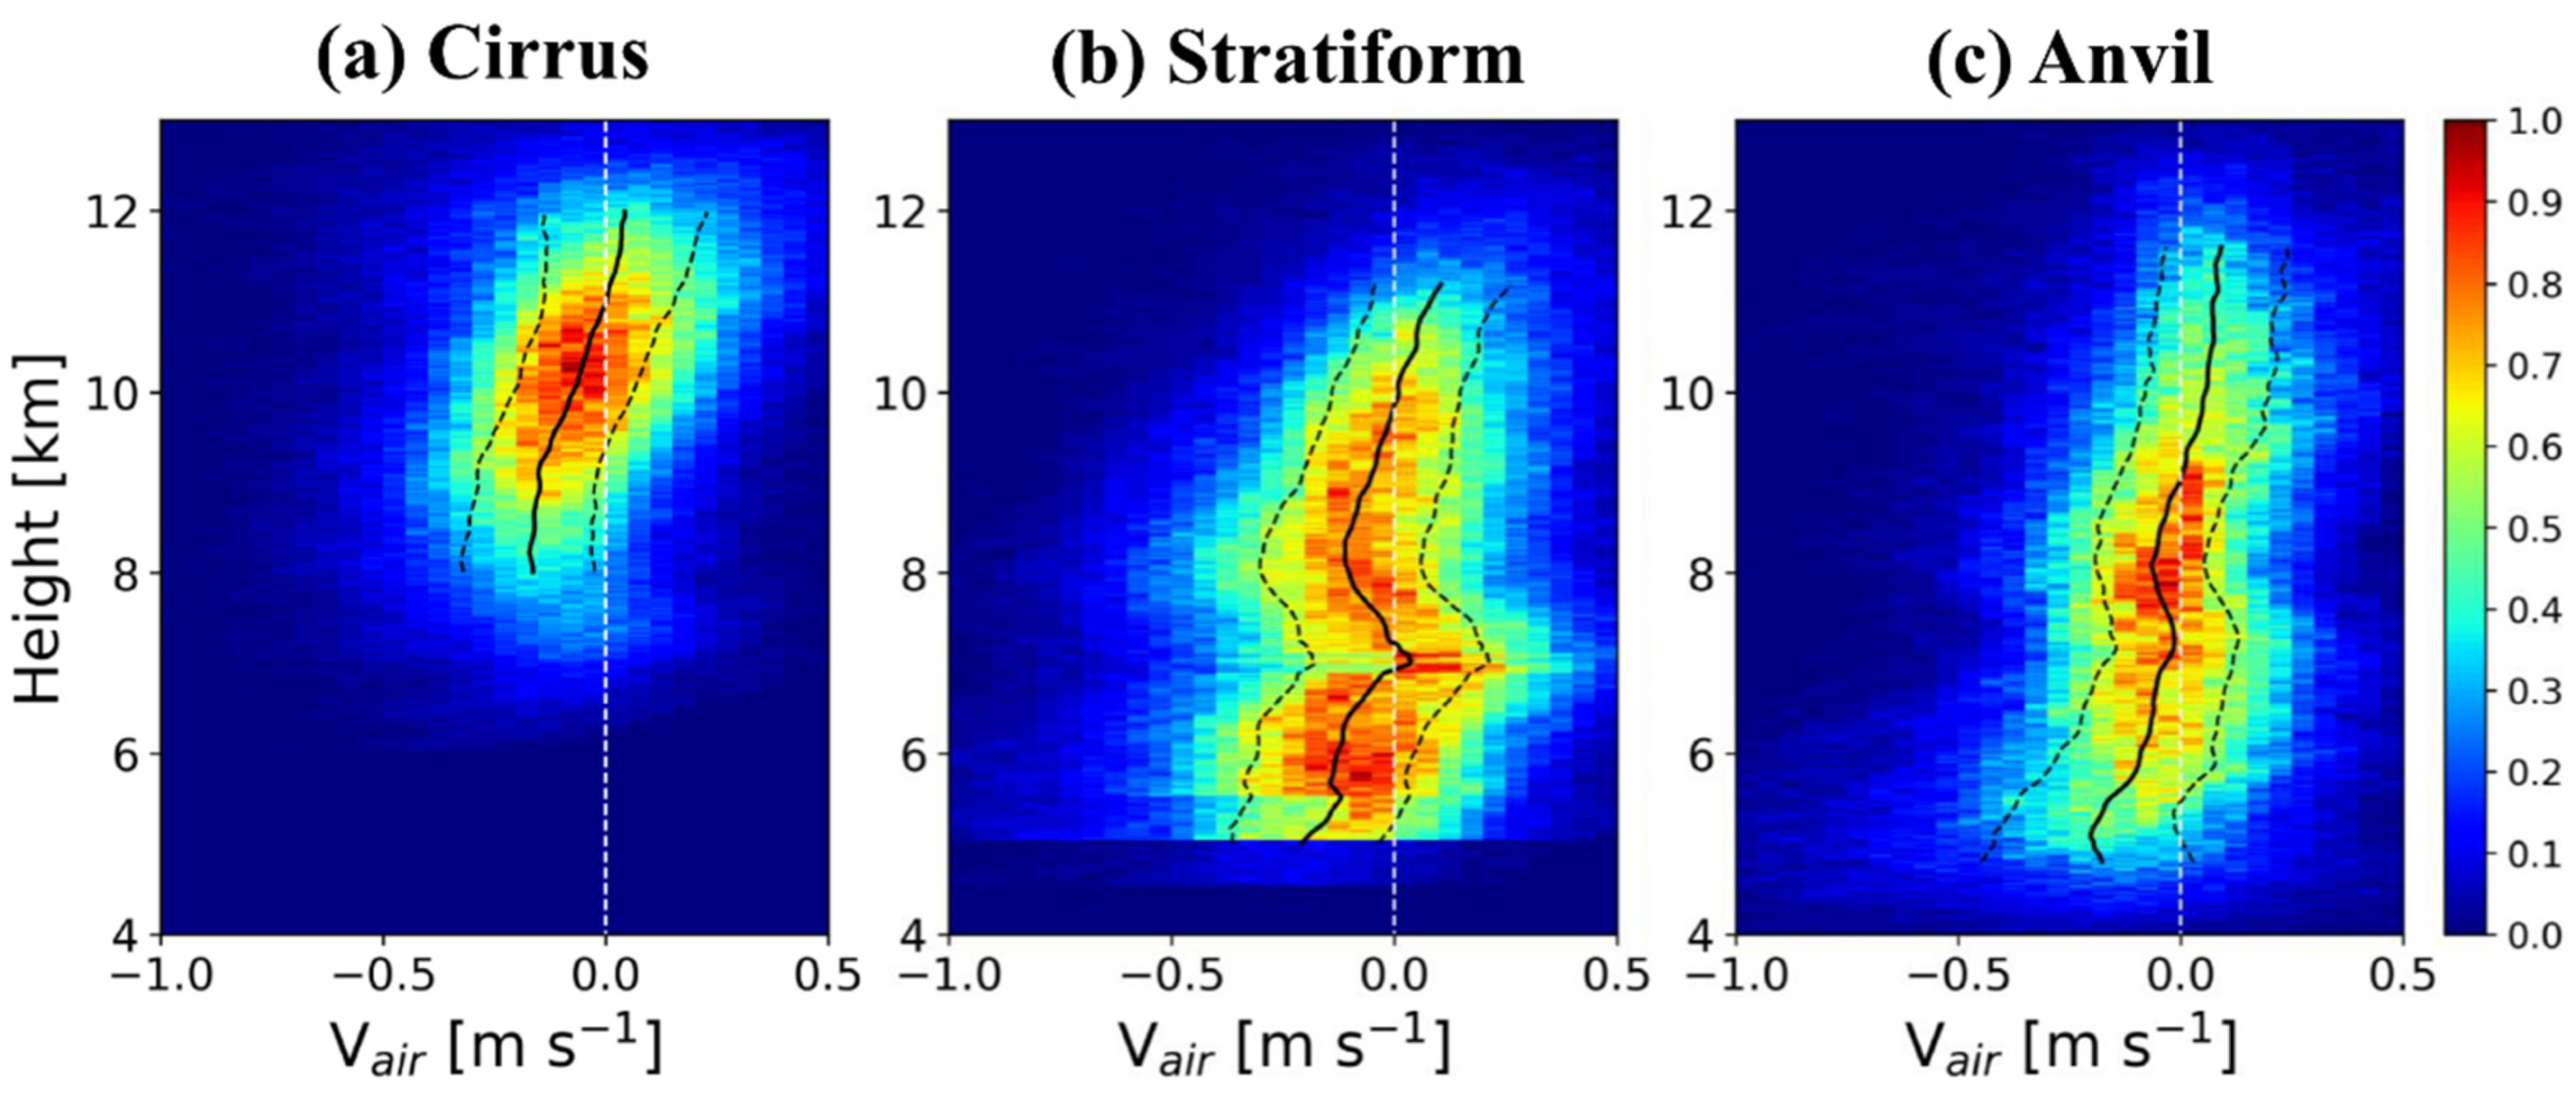
The same retrieval procedure of Vt and Vair for all cases (Table 2) was repeated, and the averaged VD, Vt, and Vair for all cases are shown in Figure 14. In cirrus, average Vt showed the smallest values (of −0.7 to −0.4 m s−1), although its VD was similar to that of the anvil, which is due to the slow growth of particles (Figure 7a) and a smaller slope in the VtZ relationship (Figure 9b). Vt showed dramatic increases (from −0.5 to −1.1 m s−1) in anvil due to larger values of Z, as shown in Figure 7a. The Vt values of the stratiform were the largest (from −0.7 to −1.2 m s−1). The smallest mean upward air motion of less than 0.03 m s−1 appeared in the top layer above 11 km in cirrus and the downward motion was dominant below this layer. The average Vair of stratiform and anvil showed a similar trend: upward motion in the top layer, followed downward motion below, dramatic upward motion in the layer with a height of 7 km, and then downward motion below. In particular, the elongated “S” shape of the average Vair was remarkable, with dramatic upward motion in the layer at around 7 km, particularly in the case of stratiform.
Vair was further examined via its CFAD, as shown in Figure 15. Stratiform and anvil showed the clear feature of an elongated “S” shape with a significant upward movement in the layer of 7 km. Vair reached 0.5 m s−1 for some cases in this layer. The physical reasons for this upward motion layer, which corresponds to about −15 °C, are yet to be determined. In addition, the quantile range of Vair was the largest in the case of stratiform, indicating the existence of active dynamical processes.

4.3. Variability of Vertical Air Motion in a Case of Kelvin–Helmholtz (K–H) Wave on 18 June 2013

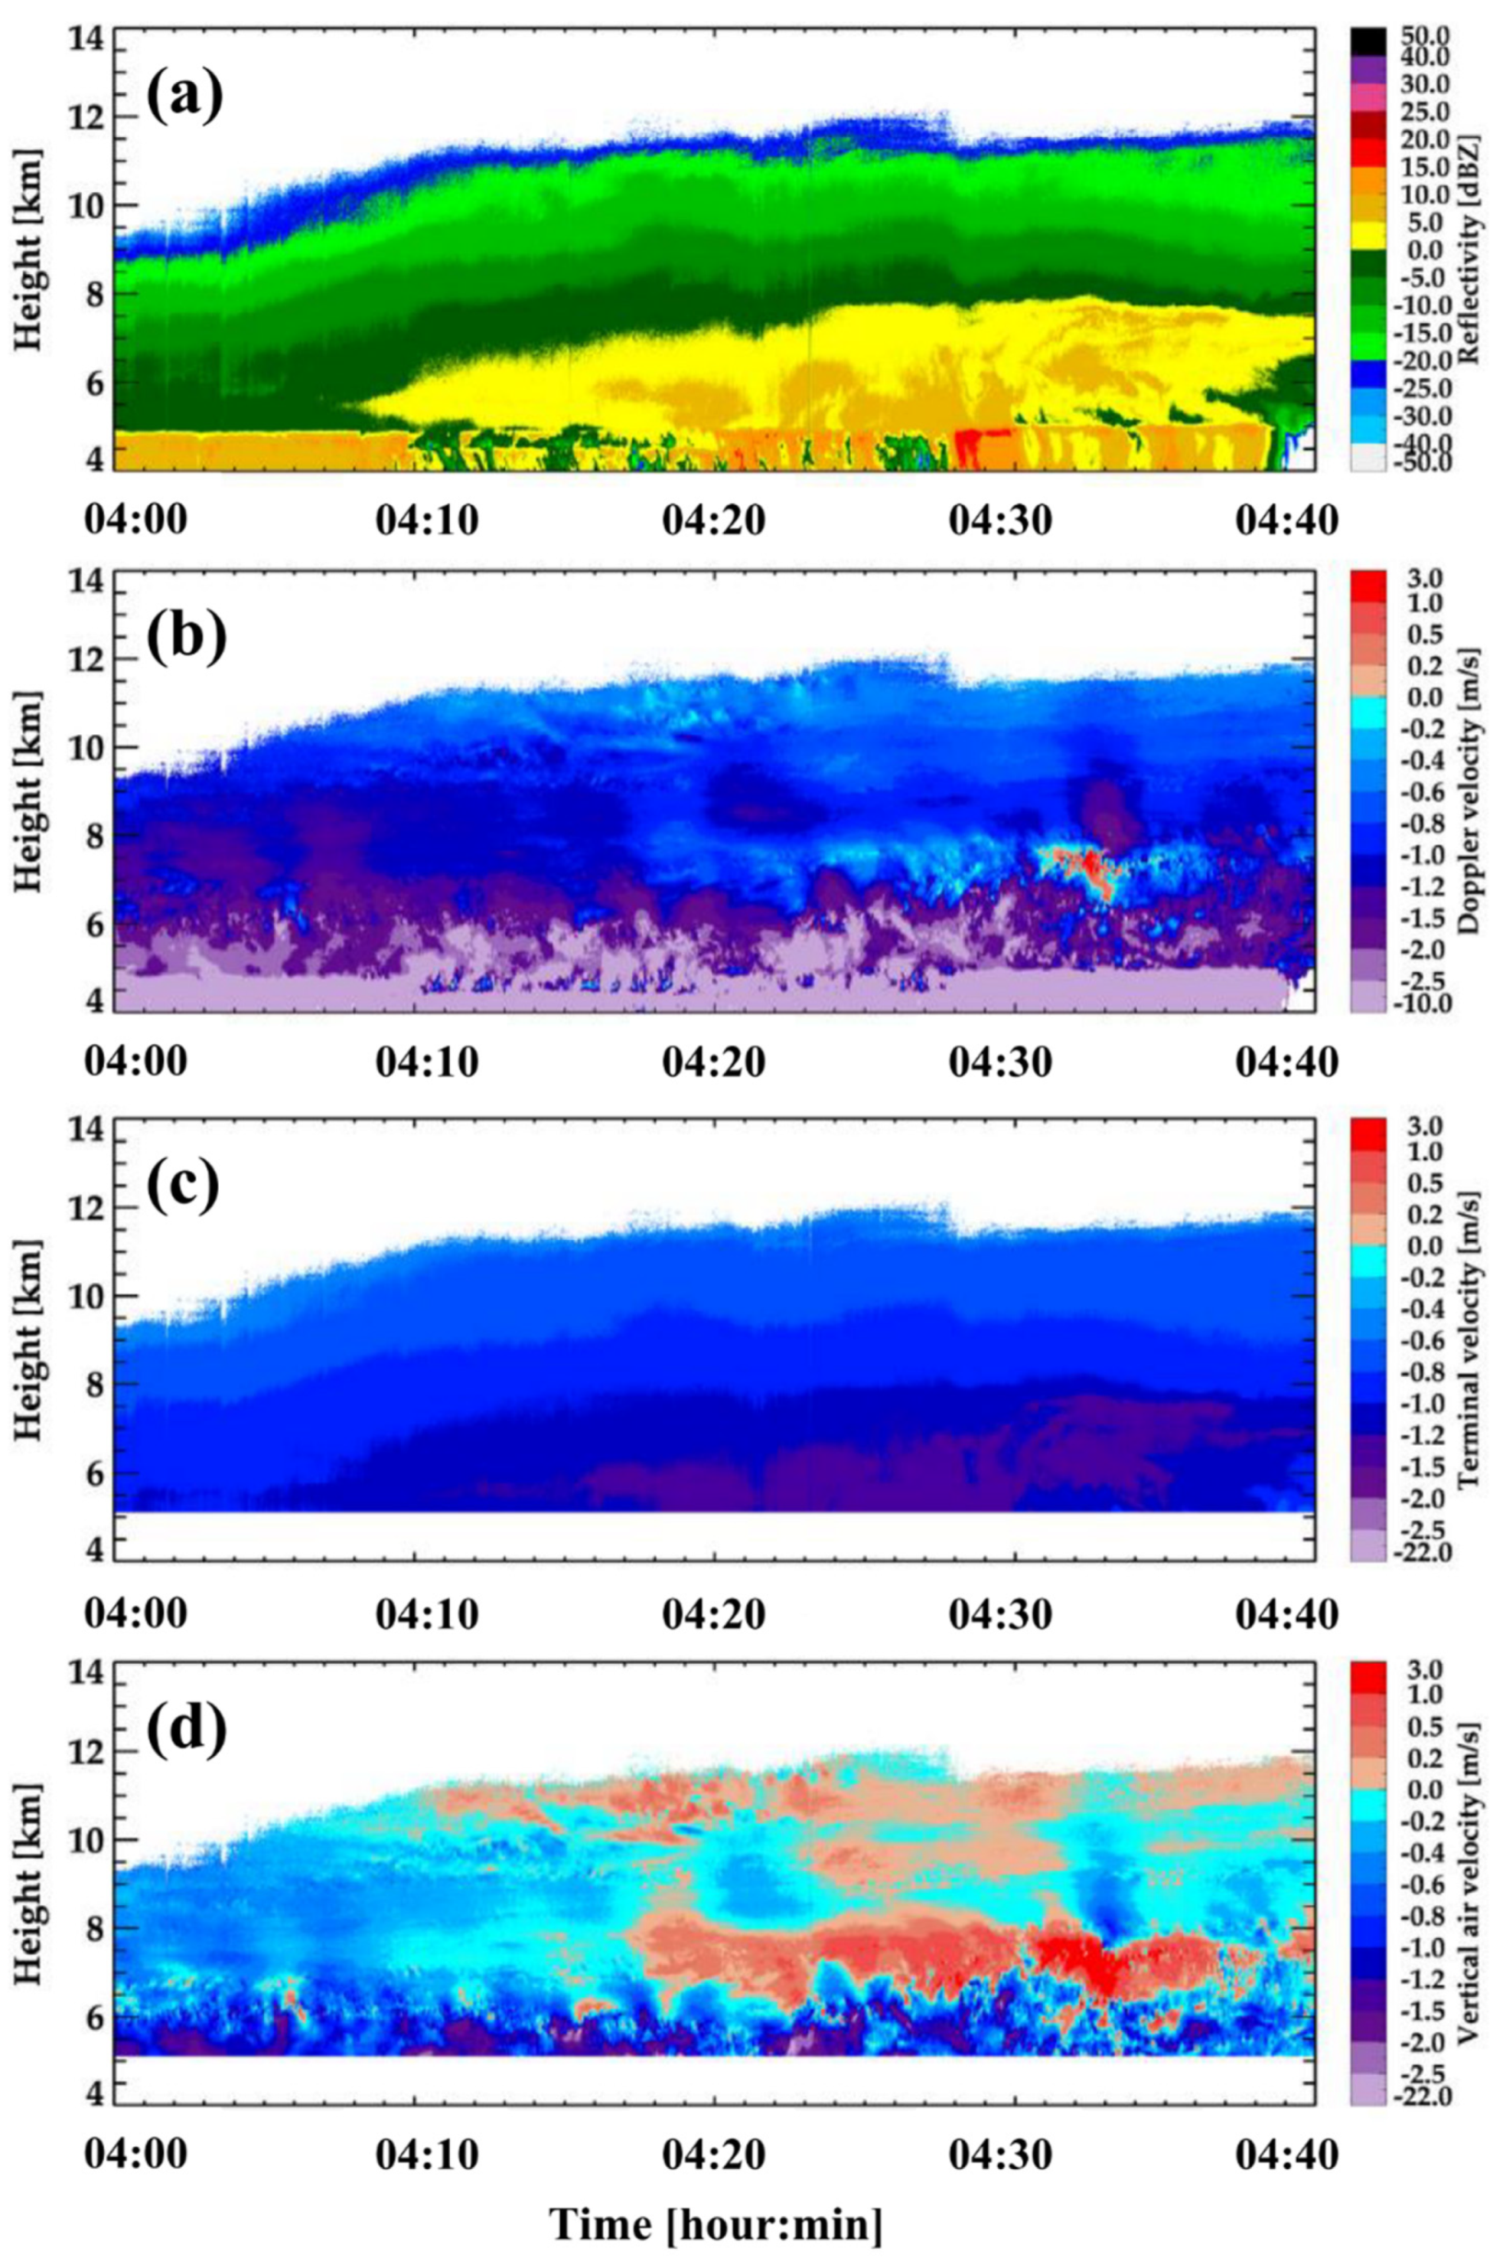
The estimations of Vt and Vair were performed for a cloud case associated with a heavy precipitation system from 0400 to 0440 UTC on 18 June 2013 (Figure 16). This system was associated with the stationary front, Changma front. The melting layer of precipitation occurring at 4.5–5 km showed a rapid increase in Z and VD. Above the melting layer, the large variability of VD occurred, in particular, a smaller scale structure in the layer of 5–6 km. The positive VD (warm colors and upward motion) also appeared in the layer of 6 to 7.5 km at 0432 UTC. As a result of estimations of Vt and Vair, Vt gradually increased with a decrease in height, whereas Vair appeared with large variability in time and height.
The three major layers of upward motion were observed at around 10.5, 9, and 7 km. The upward motion was observed near the cloud echo top with a maximum of 0.5 m s−1 at 0418 UTC. After 0418 UTC, a large upward motion occurred in the layer of 6 to 8 km until 0437 UTC. The alternating feature of downward and upward motions near 6 km was observed with high-resolution data (2 s data set), indicating K–H wave development associated with dynamical instability. A similar periodic motion was shown in the layer between 7.5 and 9.5 km with a less pronounced and longer period.
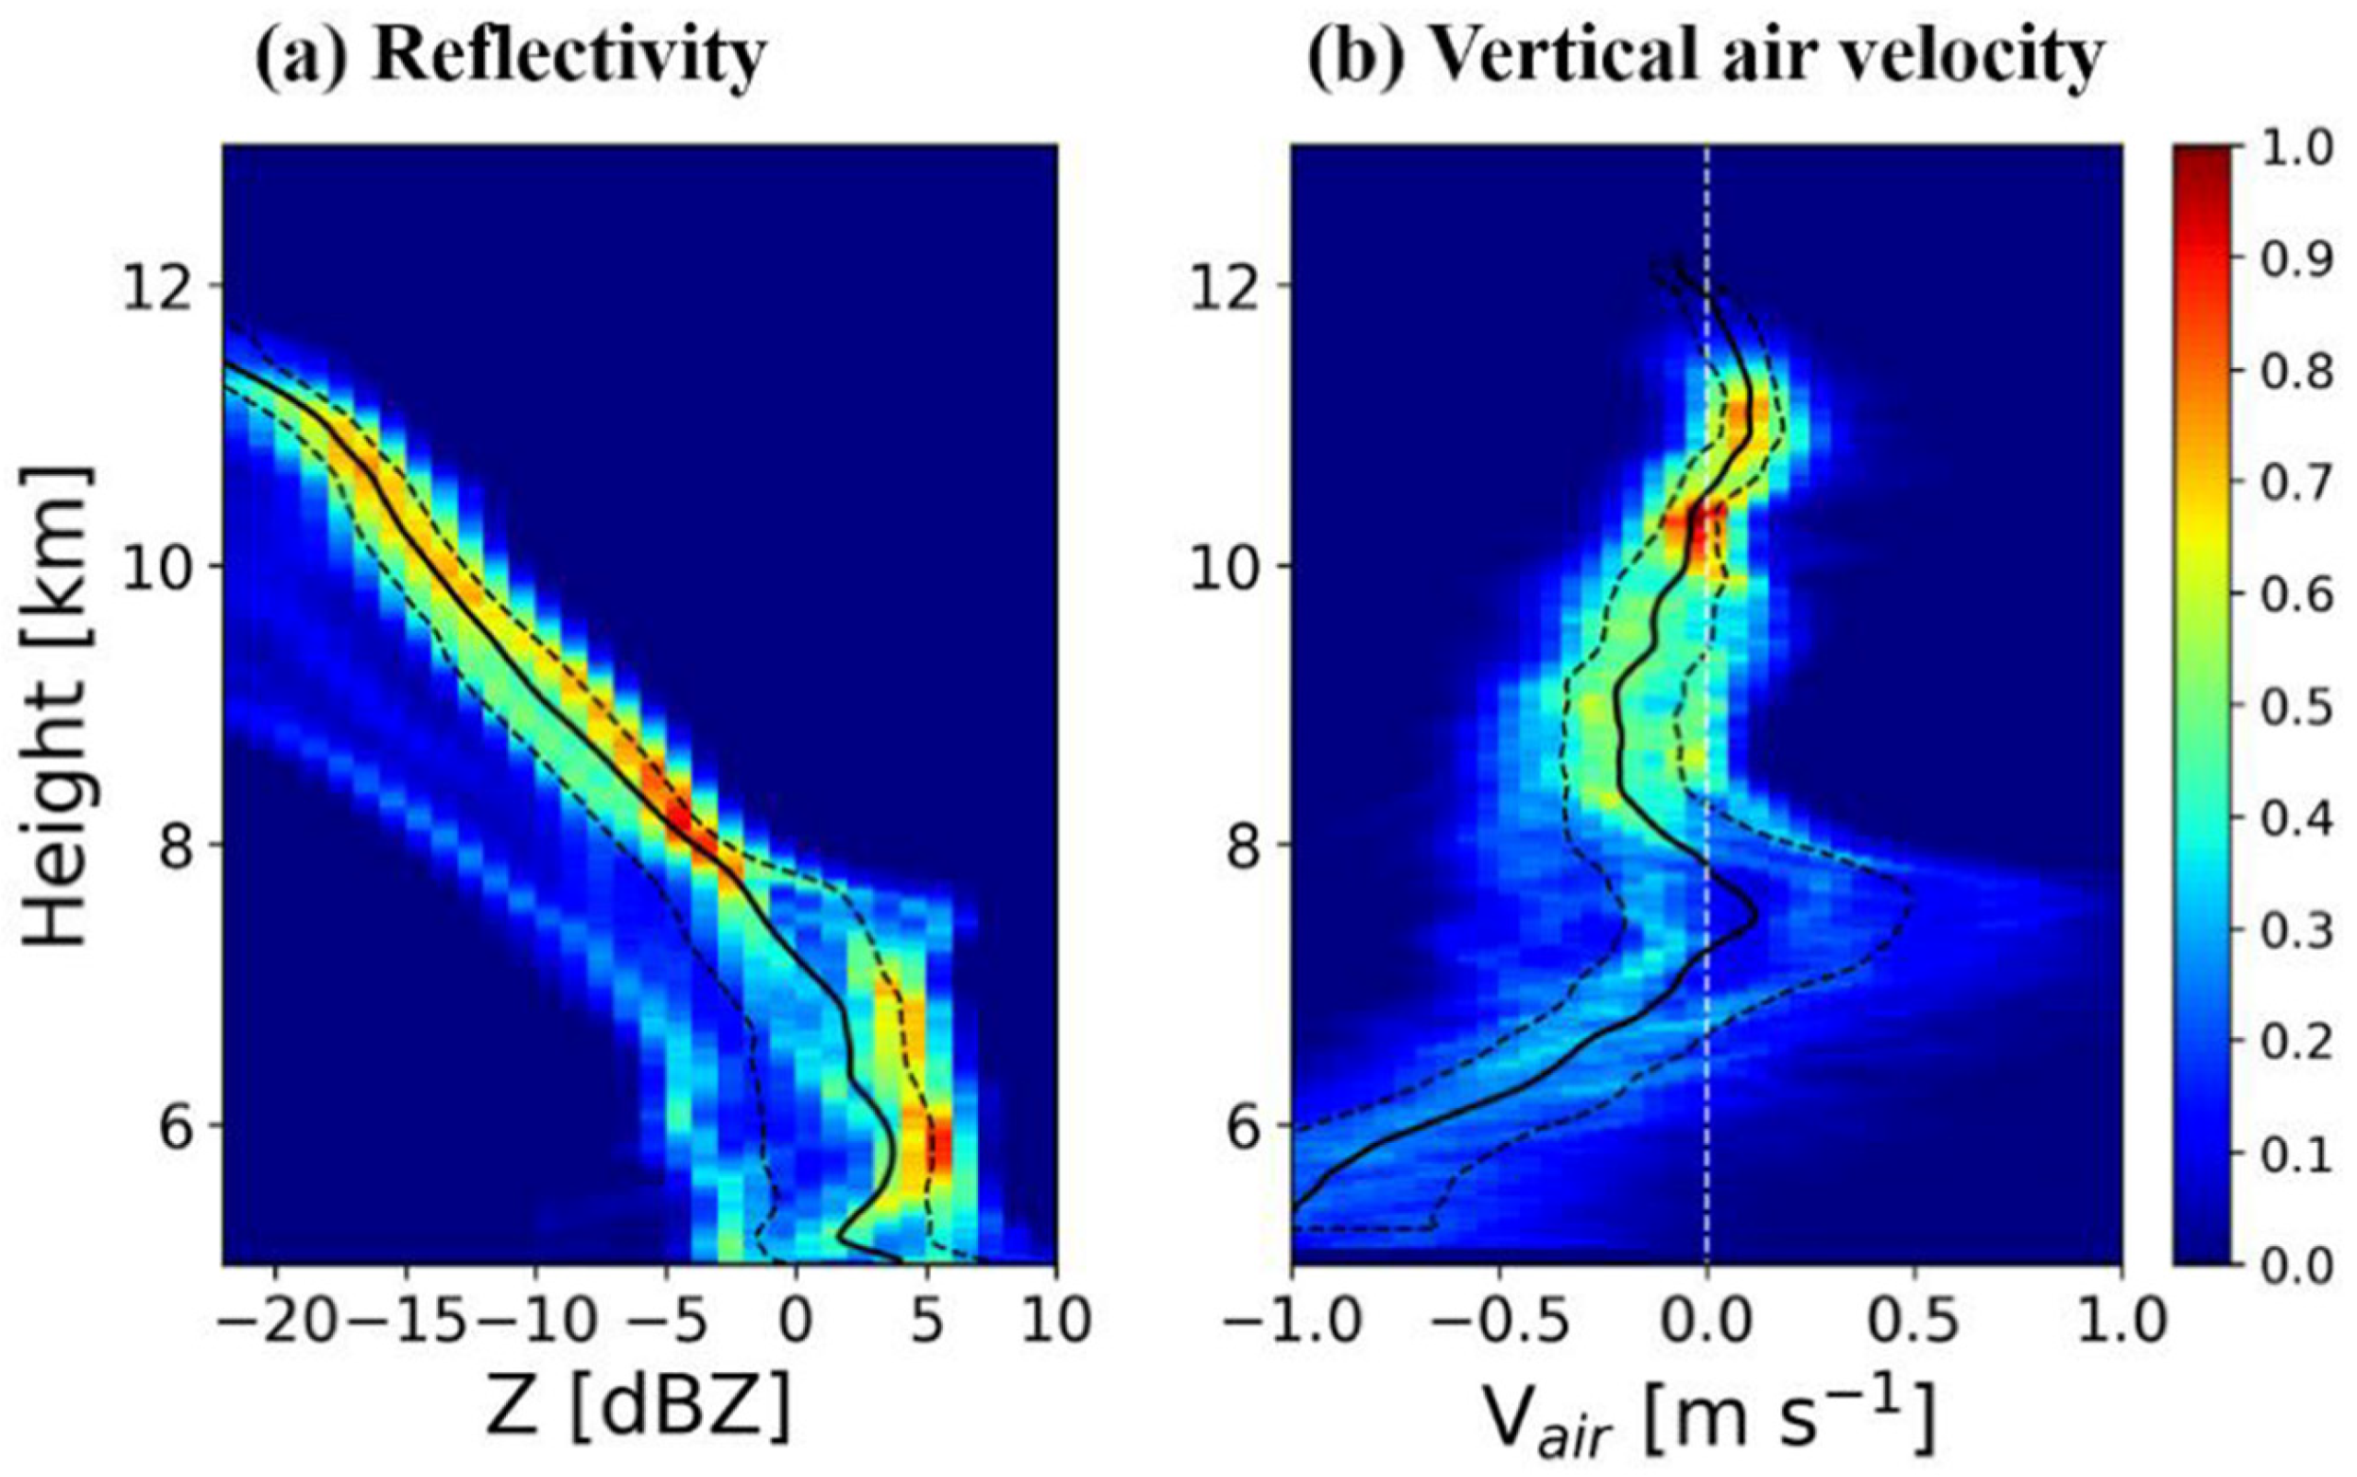
These upward motions were clear in CFADs of observed Z and retrieved Vair (Figure 17). As ice particles grew and fell, Z rapidly increases from −20 to −2dBZ at 7.5 km. While the Vair of about 0.1 m s−1 appeared at a height of 11 km, it gradually decreased until reaching a height of 8.5 km. When a significant increase in Z from −2 to 5 dBZ appeared in the layer from 7.5 to 7 km, a dramatic increase in Vair up to about 1 m s−1 was observed. This significant increase in Z is related to the rapid growth of hydrometeors due to the strong updraft.

5. Conclusions

This study described the long-term characteristics and Vair of ice clouds from vertically pointing measurements from Ka-band cloud radar located at the southern coastal region in South Korea. We interpreted the microphysical and dynamical characteristics of three types (cirrus, anvil, stratiform) of ice clouds for 34 events in terms of observed Z, observed VD, retrieved Vt, Vair, and observed SW. Doppler power spectra were analyzed to identify multi-modal size distributions of snow particles.
Ice clouds with a base height above 6 km were divided into cirrus, stratiform, and anvil clouds. The Z of the anvil and stratiform clouds was broadly distributed from −30 to 20 dBZ, whereas that of the cirrus clouds had a narrower distribution from −30 to 5 dBZ. The velocity distribution of the cirrus clouds was narrow with a peak of −0.6 m s−1, which was smaller than that of the anvil and stratiform clouds (−1.2 m s−1). In the vertical structures of ice clouds, significant growth of Z and VD appeared in the layer of 8 to 12 km (roughly a layer of −40 °C to −20 °C) for all types of ice clouds. The VD of the stratiform clouds had a unique feature of dramatic reduction near 7 to 8 km heights (the so-called elongated “S” shape) with an increase in Z.
From the average window of 20 min, Vt was calculated, and the VtZ relationships were then derived for the cloud types. The cirrus clouds had wide distributions of the values of coefficients a and exponents b depending on cloud height. The negative or close-to-zero value of exponent b indicated that an increase in number concentration was dominant over size in the cirrus clouds. The anvil clouds had the largest b, indicating that their density increased at a faster rate than that of the stratiform clouds for the same Z increment. The a of stratiform was the largest while the b was in between cirrus and anvil. This indicates a more favorable sedimentation of snow particles in stratiform.
The upward air motions appeared at the top of all ice clouds up to 0.2 m s−1, slightly larger in anvil and stratiform clouds. In particular, the upward air motion appeared in the layer of around 7 km in the stratiform clouds, less distinctive in anvil clouds. This was related to the elongated “S” shape of VD near 7–7.5 km (temperature of approximately −16–−13 °C). This unique feature coincided with a bi-modality of Doppler power spectrum observed by vertically pointing X-band radar. The bi-modal peaks consisted of pre-existing large ice particles and newly smaller particles that often develop into planar crystals. This layer was associated with actual updraft in dynamical processes and/or broadening of particle size distribution as a result of numerous small pristine ice particles. Thus, we can speculate that the smaller snow particles are likely generated by new ice nucleation and further growth in increased supersaturation. The new nucleation was feasible due to increased supersaturation by upward motion below. In addition, the existence of active dynamical processes was observed with the alternating feature of downward and upward motion for a heavy precipitation case, indicating Kelvin-Helmholtz wave. Further investigation of the unique signature in VD would be useful in improving our understanding of the dynamical and/or microphysical processes of clouds and precipitation.

Author Contributions

This work is the result of significant contributions from all authors. Conceptualization, G.L. and B.-Y.Y.; methodology, B.-Y.Y. and G.L.; software, B.-Y.Y.; validation, B.-Y.Y. and G.L.; formal analysis, B.-Y.Y. and G.L.; investigation, B.-Y.Y. and G.L.; writing—original draft preparation, B.-Y.Y.; writing—review and editing, G.L.; visualization, B.-Y.Y.; supervision, G.L.; funding acquisition, B.-Y.Y. and G.L. All authors have read and agreed to the published version of the manuscript.

Funding

This research was supported by Basic Science Research Program through the National Research Foundation of Korea (NRF) funded by the Ministry of Education (2020R1A6A1A03044834) and by the National Research Foundation of Korea (NRF) grant funded by the Korean government (MSIT) (No. 2021R1A4A1032646).

Institutional Review Board Statement

Not applicable.

Informed Consent Statement

Not applicable.

Data Availability Statement

The data presented in this study are available on request from the corresponding author.

Acknowledgments

This paper is partially based on Bo-Young Ye’s thesis. The cloud radar data are provided from National Institute of Meteorological Sciences (NIMS). We also greatly appreciate students and researchers in CARE, KNU, for participating in the summer experiment in 2014–2016.

Conflicts of Interest

The authors declare no conflict of interest.

References

  1. Liou, K.-N. Influence of Cirrus Clouds on Weather and Climate Processes: A Global Perspective. Mon. Weather Rev. 1986, 114, 1167–1199. [Google Scholar] [CrossRef]
  2. Parry, M.L.; Canziani, O.F.; Palutikof, J.P.; van der Linden, P.J.; Hanson, C.E. Climate Change 2007: Impacts, Adaptation and Vulnerability. Contribution of Working Group II to the Fourth Assessment Report of the IPCC; Cambridge University Press: Cambridge, UK, 2007. [Google Scholar]
  3. Jakob, C. Ice clouds in numerical weather prediction models: Progress, problems, and prospects. In Cirrus; Lynch, D.K., Sassen, K., Starr, D.O., Stephens, G., Eds.; Oxford University Press: Oxford, UK, 2002; pp. 327–345. ISBN 0-19-513072-3. [Google Scholar]
  4. Heymsfield, A.J.; Donner, L.J. A Scheme for Parameterizing Ice-Cloud Water Content in General Circulation Models. J. Atmos. Sci. 1990, 47, 1865–1877. [Google Scholar] [CrossRef] [Green Version]
  5. Hong, S.-Y.; Lim, K.-S.S.; Kim, J.-H.; Lim, J.-O.J.; Dudhia, J. Sensitivity Study of Cloud-Resolving Convective Simulations with WRF Using Two Bulk Microphysical Parameterizations: Ice-Phase Microphysics versus Sedimentation Effects. J. Appl. Meteorol. Clim. 2009, 48, 61–76. [Google Scholar] [CrossRef]
  6. Jang, S.; Lim, K.-S.S.; Ko, J.; Kim, K.; Lee, G.; Cho, S.-J.; Ahn, K.-D.; Lee, Y.-H. Revision of WDM7 Microphysics Scheme and Evaluation for Precipitating Convection over the Korean Peninsula. Remote Sens. 2021, 13, 3860. [Google Scholar] [CrossRef]
  7. Morrison, H.; Gettelman, A. A New Two-Moment Bulk Stratiform Cloud Microphysics Scheme in the Community Atmosphere Model, Version 3 (CAM3). Part I: Description and Numerical Tests. J. Clim. 2008, 21, 3642–3659. [Google Scholar] [CrossRef]
  8. Hong, S.Y.; Dudhia, J.; Chen, S.H. A revised approach to ice microphysical processes for the bulk parameterization of clouds and precipitation. Mon. Weather Rev. 2004, 132, 103–120. [Google Scholar] [CrossRef]
  9. Bouniol, D.; Delanoë, J.; Duroure, C.; Protat, A.; Giraud, V.; Penide, G. Microphysical characterisation of West African MCS anvils. Q. J. R. Meteorol. Soc. 2010, 136, 323–344. [Google Scholar] [CrossRef]
  10. Delanoë, J.; Protat, A.; Bouniol, D.; Heymsfield, A.J.; Bansemer, A.; Brown, P. The Characterization of Ice Cloud Properties from Doppler Radar Measurements. J. Appl. Meteorol. Clim. 2007, 46, 1682–1698. [Google Scholar] [CrossRef] [Green Version]
  11. Heymsfield, A.J.; Wang, Z.; Matrosov, S. Improved Radar Ice Water Content Retrieval Algorithms Using Coincident Microphysical and Radar Measurements. J. Appl. Meteorol. 2005, 44, 1391–1412. [Google Scholar] [CrossRef]
  12. Mace, G.G.; Benson, S.; Vernon, E. Cirrus Clouds and the Large-Scale Atmospheric State: Relationships Revealed by Six Years of Ground-Based Data. J. Clim. 2006, 19, 3257–3278. [Google Scholar] [CrossRef]
  13. Matrosov, S.Y.; Korolev, A.V.; Heymsfield, A.J. Profiling Cloud Ice Mass and Particle Characteristic Size from Doppler Radar Measurements. J. Atmos. Ocean. Technol. 2002, 19, 1003–1018. [Google Scholar] [CrossRef]
  14. Protat, A.; Bouniol, D.; Delanoë, J.; O’Connor, E.; May, P.T.; Plana-Fattori, A.; Hasson, A.; Görsdorf, U.; Heymsfield, A.J. Assessment of Cloudsat Reflectivity Measurements and Ice Cloud Properties Using Ground-Based and Airborne Cloud Radar Observations. J. Atmos. Ocean. Technol. 2009, 26, 1717–1741. [Google Scholar] [CrossRef] [Green Version]
  15. Sassen, K.; Campbell, J.R. A Midlatitude Cirrus Cloud Climatology from the Facility for Atmospheric Remote Sensing. Part I: Macrophysical and Synoptic Properties. J. Atmos. Sci. 2001, 58, 481–496. [Google Scholar] [CrossRef]
  16. Wang, J.; Dong, X.; Xi, B. Investigation of ice cloud microphysical properties of DCSs using aircraft in situ measurements during MC3E over the ARM SGP site. J. Geophys. Res. Atmos. 2015, 120, 3533–3552. [Google Scholar] [CrossRef]
  17. Yan, Y.; Liu, Y.; Liu, X.; Wang, X. Effects of Cloud Microphysics on the Vertical Structures of Cloud Radiative Effects over the Tibetan Plateau and the Arctic. Remote Sens. 2021, 13, 2651. [Google Scholar] [CrossRef]
  18. Ye, B.-Y.; Jung, E.; Shin, S.; Lee, G. Statistical Characteristics of Cloud Occurrence and Vertical Structure Observed by a Ground-Based Ka-Band Cloud Radar in South Korea. Remote Sens. 2020, 12, 2242. [Google Scholar] [CrossRef]
  19. Kärcher, B.; Ström, J. The roles of dynamical variability and aerosols in cirrus cloud formation. Atmos. Chem. Phys. Discuss. 2003, 3, 823–838. [Google Scholar] [CrossRef] [Green Version]
  20. Protat, A.; Williams, C. The Accuracy of Radar Estimates of Ice Terminal Fall Speed from Vertically Pointing Doppler Radar Measurements. J. Appl. Meteorol. Clim. 2011, 50, 2120–2138. [Google Scholar] [CrossRef]
  21. Heymsfield, A.J.; Westbrook, C. Advances in the Estimation of Ice Particle Fall Speeds Using Laboratory and Field Measurements. J. Atmos. Sci. 2010, 67, 2469–2482. [Google Scholar] [CrossRef] [Green Version]
  22. Kollias, P.; Tselioudis, G.; Albrecht, B.A. Cloud climatology at the Southern Great Plains and the layer structure, drizzle, and atmospheric modes of continental stratus. J. Geophys. Res. Space Phys. 2007, 112, D09116. [Google Scholar] [CrossRef]
  23. Kollias, P.; Clothiaux, E.E.; Miller, M.A.; Albrecht, B.A.; Stephens, G.L.; Ackerman, T.P. Millimeter-Wavelength Radars: New Frontier in Atmospheric Cloud and Precipitation Research. Bull. Am. Meteorol. Soc. 2007, 88, 1608–1624. [Google Scholar] [CrossRef] [Green Version]
  24. Kalesse, H.; Kollias, P. Climatology of High Cloud Dynamics Using Profiling ARM Doppler Radar Observations. J. Clim. 2013, 26, 6340–6359. [Google Scholar] [CrossRef]
  25. Deng, M.; Mace, G.G. Cirrus Microphysical Properties and Air Motion Statistics Using Cloud Radar Doppler Moments. Part I: Algorithm Description. J. Appl. Meteorol. Clim. 2006, 45, 1690–1709. [Google Scholar] [CrossRef]
  26. Kalesse, H.; Kollias, P.; Szyrmer, W. On using the relationship between Doppler velocity and radar reflectivity to identify microphysical processes in midlatitudinal ice clouds. J. Geophys. Res. Atmos. 2013, 118, 12168–12179. [Google Scholar] [CrossRef]
  27. Orr, B.W.; Kropfli, R.A. A Method for Estimating Particle Fall Velocities from Vertically Pointing Doppler Radar. J. Atmos. Ocean. Technol. 1999, 16, 29–37. [Google Scholar] [CrossRef]
  28. Plana-Fattori, A.; Protat, A.; Delanoë, J. Observing ice clouds with a Doppler cloud radar. Comptes Rendus Phys. 2010, 11, 96–103. [Google Scholar] [CrossRef]
  29. Szyrmer, W.; Tatarevic, A.; Kollias, P. Ice clouds microphysical retrieval using 94-GHz Doppler radar observations: Basic relations within the retrieval framework. J. Geophys. Res. Space Phys. 2012, 117, D14203. [Google Scholar] [CrossRef] [Green Version]
  30. Kim, Y.; Kim, S.-W.; Kim, M.-H.; Yoon, S.-C. Geometric and optical properties of cirrus clouds inferred from three-year ground-based lidar and CALIOP measurements over Seoul, Korea. Atmos. Res. 2014, 139, 27–35. [Google Scholar] [CrossRef]
  31. Heymsfield, A.J.; Iaquinta, J. Cirrus Crystal Terminal Velocities. J. Atmos. Sci. 2000, 57, 916–938. [Google Scholar] [CrossRef]
  32. Matrosov, S.; Heymsfield, A.J. Use of Doppler radar to assess ice cloud particle fall velocity-size relations for remote sensing and climate studies. J. Geophys. Res. Space Phys. 2000, 105, 22427–22436. [Google Scholar] [CrossRef]
  33. Bailey, M.P.; Hallett, J. A Comprehensive Habit Diagram for Atmospheric Ice Crystals: Confirmation from the Laboratory, AIRS II, and Other Field Studies. J. Atmos. Sci. 2009, 66, 2888–2899. [Google Scholar] [CrossRef] [Green Version]
  34. Magono, C. Meteorological Classification of Snow Crystals. J. Jpn. Soc. Snow Ice 1962, 24, 33–37. [Google Scholar] [CrossRef]
  35. Matrosov, S.Y.; Ryzhkov, A.V.; Maahn, M.; de Boer, G. Hydrometeor Shape Variability in Snowfall as Retrieved from Polarimetric Radar Measurements. J. Appl. Meteorol. Clim. 2020, 59, 1503–1517. [Google Scholar] [CrossRef]
  36. Westbrook, C.D.; Illingworth, A.J.; O’Connor, E.J.; Hogan, R.J. Doppler lidar measurements of oriented planar ice crystals falling from supercooled and glaciated layer clouds. Q. J. R. Meteorol. Soc. 2010, 136, 260–276. [Google Scholar] [CrossRef] [Green Version]
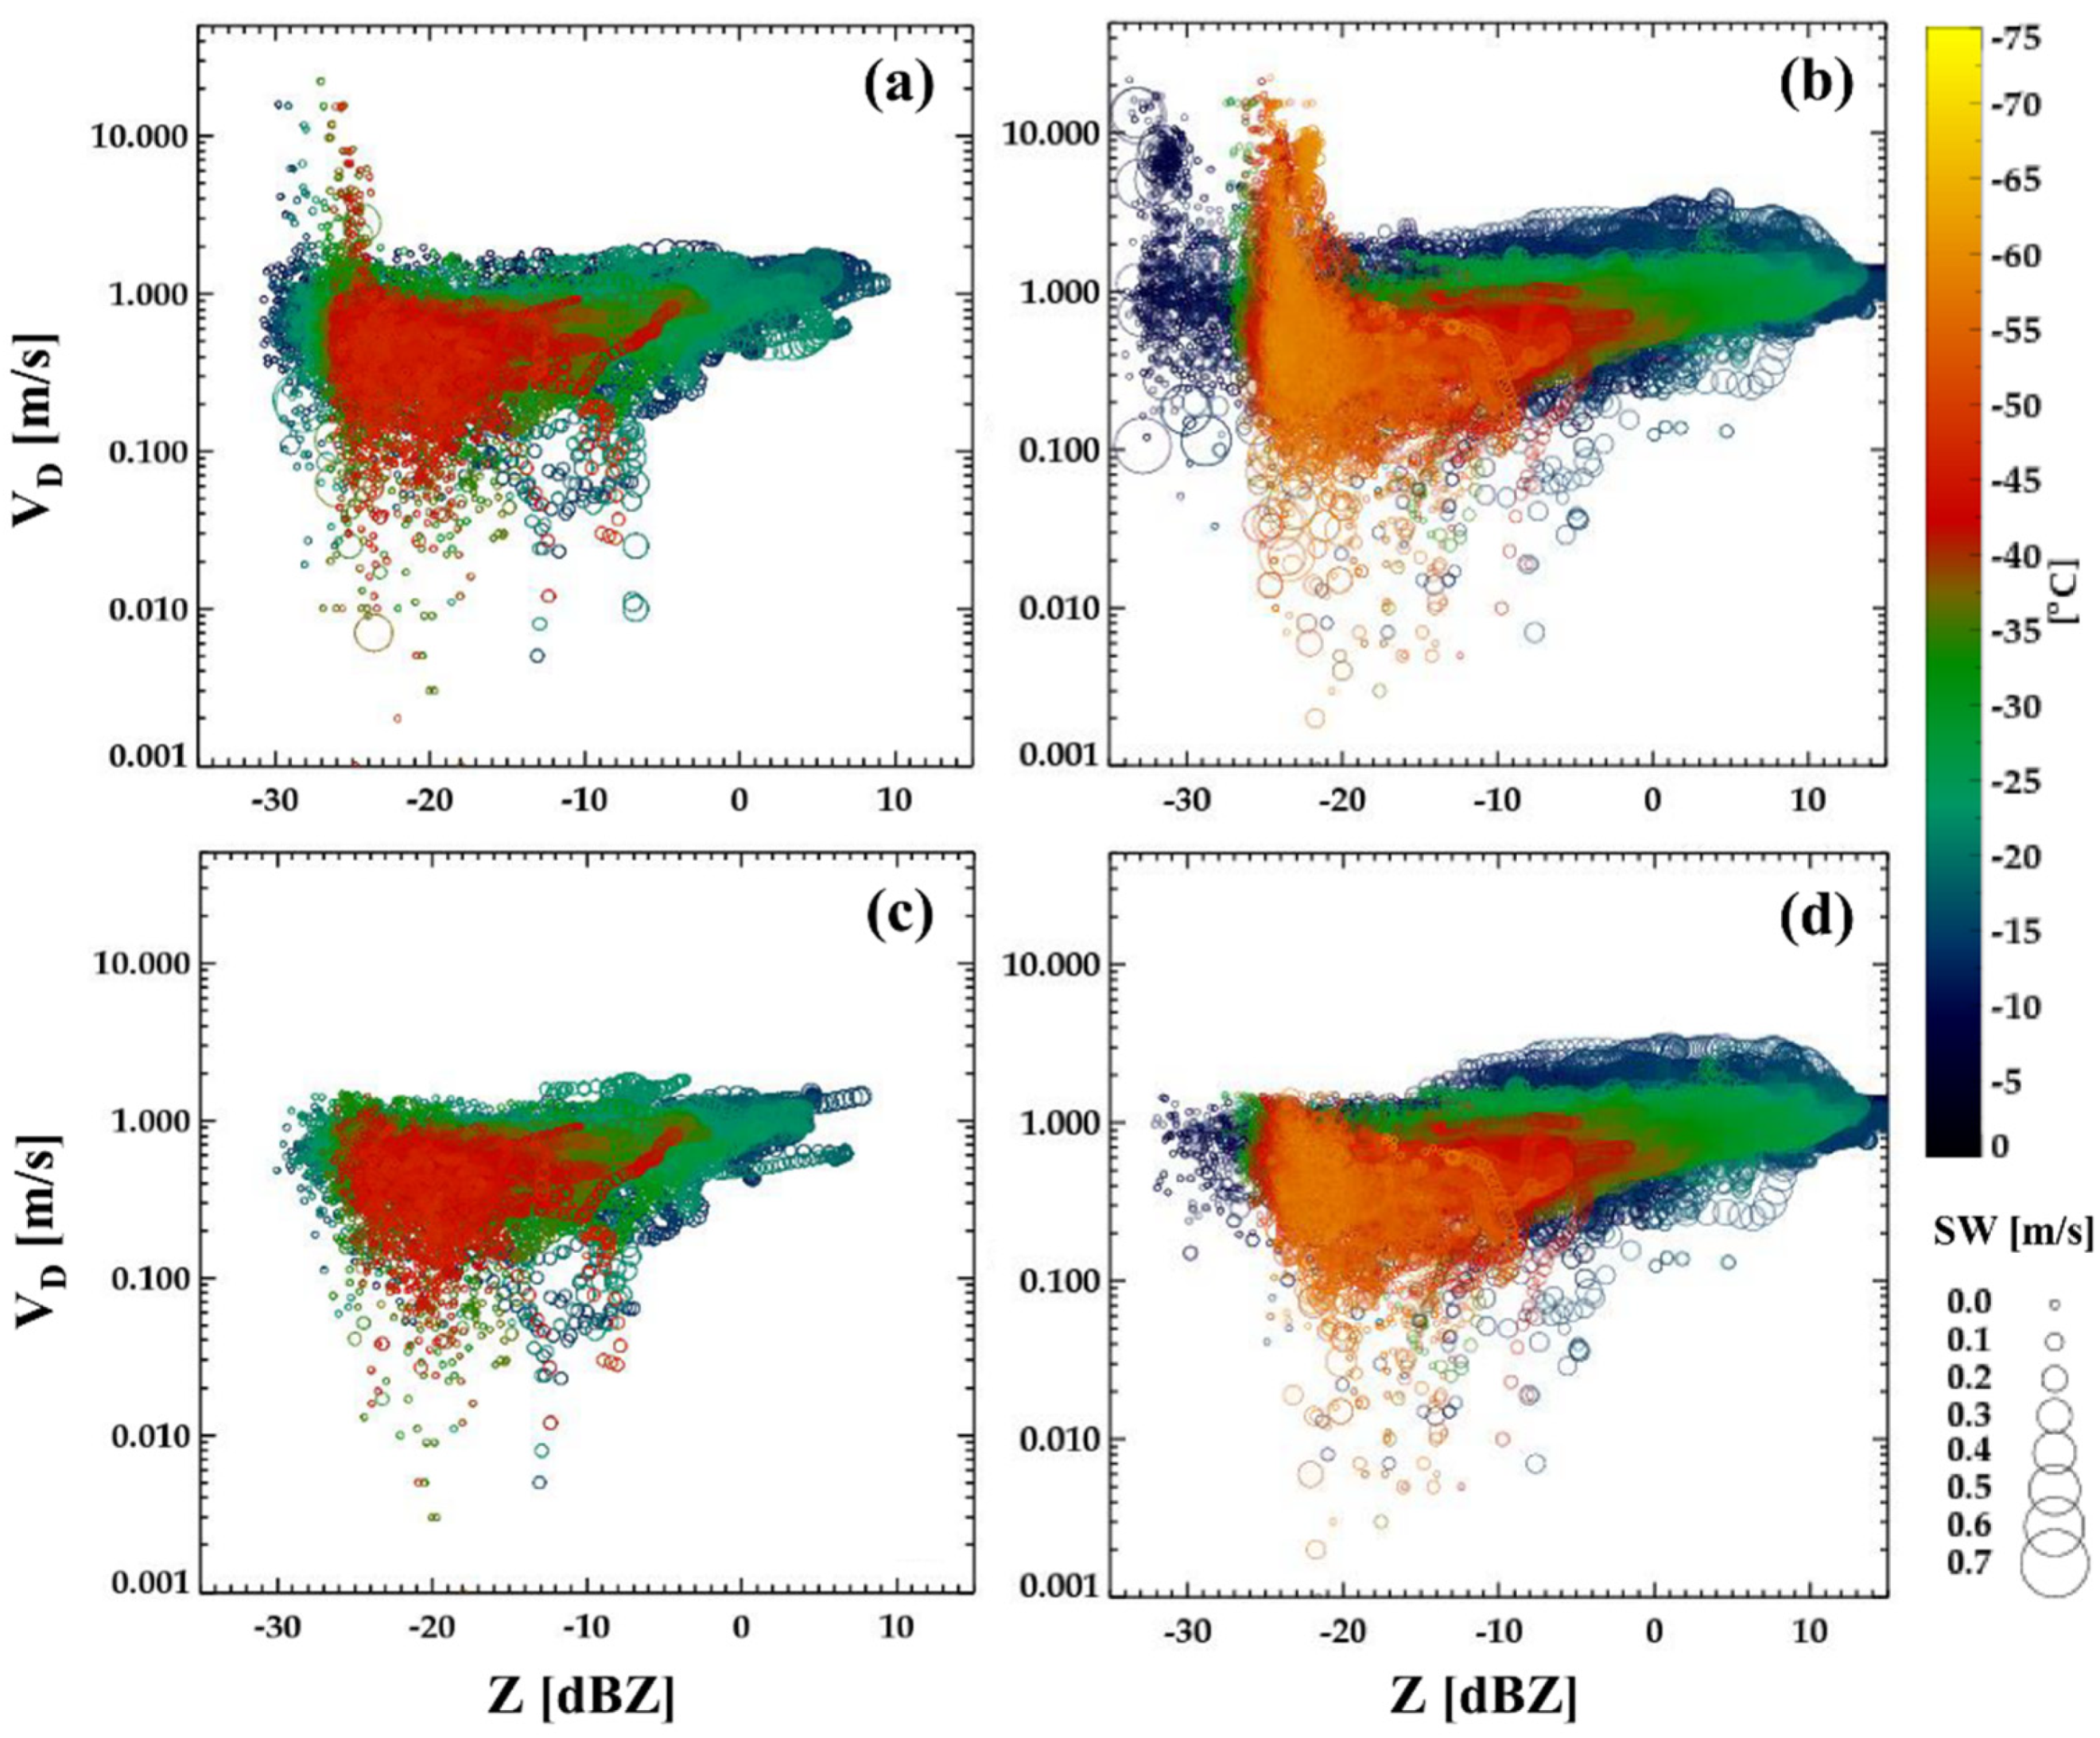
Figure 1. Scatterplots of Doppler velocity (VD) as a function of reflectivity (Z) of (a) before and (c) after applying quality control to a case of cirrus clouds on 25 September 2014 and (b) before and (d) after applying quality control for a case of anvil clouds on 22 May 2015. Circles indicate SW. Color represents atmosphere temperature from sounding measurements.
Remotesensing 13 04349 g001
Figure 2. Time–height cross-sections of Z, VD, and SW of (left) before and (right) after applying quality control for a case of anvil on 22 May 2015. Dotted line is temperature from sounding data.
Remotesensing 13 04349 g002
Figure 3. Time–height cross-sections of (a) Z and (b) VD from 22 September to 24 September 2015. The color bar indicates the period of three types of ice clouds (C: cirrus, S: stratiform, and A: anvil).
Remotesensing 13 04349 g003
Figure 4. Histograms of (a) Z, (b) VD, and (c) SW by ice cloud type (blue: anvil, pink: cirrus, and green: stratiform).
Remotesensing 13 04349 g004
Figure 5. Histograms of Z, VD, and SW for (a) cirrus, (b) stratiform, and (c) anvil with various cloud heights (blue: 4–6 km, cyan: 6–8 km, green: 8–10 km, yellow: 10–12 km, and red: 12–15 km).
Remotesensing 13 04349 g005
Figure 6. Contoured frequency by altitude diagrams (CFADs) of Z, VD, and SW for ice cloud types: (a) cirrus, (b) stratiform, and (c) anvil.
Remotesensing 13 04349 g006
Figure 7. Mean vertical profiles of (a) Z, (b) VD, and (c) SW for three types of ice clouds. Green: cirrus, blue: stratiform, and red: anvil.
Remotesensing 13 04349 g007
Figure 8. Scatterplots of terminal velocity (Vt) as a function of Z for a case of cirrus on 25 September 2014 as a function of average window sizes: (a) 5 min, (b) 10 min, (c) 20 min, (d) 30 min, and (e) 60 min. The red lines are fitted VtZ relationships. The circles indicate SW, and the color is atmospheric temperature from sounding measurements.
Remotesensing 13 04349 g008
Figure 9. (a) Scatterplot of coefficient a and exponent b of VtZ relationships for ice cloud cases. The colored circles indicate ice cloud types (green: cirrus, blue: stratiform, and red: anvil). The black triangle represents the coefficient and exponent from Kalesse et al. [26]. (b) VtZ relationships for ice cloud types. Scatterplots of mean cloud height and (c) coefficient a and (d) exponent b of VtZ relationships for ice cloud cases.
Remotesensing 13 04349 g009
Figure 10. Time–height cross-sections of (a) observed Z, (b) observed VD, (c) Vt retrieved from VtZ relationship of cirrus, and (d) retrieved vertical air motion (Vair) of a case of cirrus on 9 August 2015. Dotted line is temperature from sounding data.
Remotesensing 13 04349 g010
Figure 11. Time–height cross-sections of (a) observed Z, (b) observed VD, (c) Vt retrieved from VtZ relationship of stratiform, and (d) retrieved Vair of a case of stratiform on 5 July 2014. Dotted line is temperature from sounding data.
Remotesensing 13 04349 g011
Figure 12. (a,d) Doppler power spectra at different heights, (b,e) vertical profiles of Z and VD, and (c,f) averaged Doppler power spectrum between 7.5–7.7 km observed from vertically pointing X-band radar at 1424 UTC and 1618 UTC on 5 July 2014. Positive (negative) velocity indicates upward (downward) motion. Dashed lines indicate temperatures from sounding data.
Remotesensing 13 04349 g012
Figure 13. Time–height cross-sections of (a) observed Z, (b) observed VD, (c) Vt retrieved from VtZ relationship of anvil, and (d) retrieved Vair of a case of anvil on 16 June 2014. Dotted line is temperature from sounding data.
Remotesensing 13 04349 g013
Figure 14. Averaged profiles of (a) VD, (b) Vt, and (c) Vair for cirrus, stratiform, and anvil cases.
Remotesensing 13 04349 g014
Figure 15. Contoured frequency by altitude diagrams (CFADs) of Vair for different ice cloud types: (a) cirrus, (b) stratiform, and (c) anvil cases. The median and quantiles (25% and 75%) are shown in the solid and dashed lines.
Remotesensing 13 04349 g015
Figure 16. Time–height cross-sections of (a) observed Z, (b) observed VD, (c) Vt retrieved from VtZ relationship, and (d) retrieved Vair for a case at 04 UTC on 18 June 2013.
Remotesensing 13 04349 g016
Figure 17. CFADs of (a) observed Z and (b) retrieved Vair of a case at 04 UTC on 18 June 2013. The median and quantiles (25% and 75%) are shown in the solid and dashed lines.
Remotesensing 13 04349 g017
Table 1. Specifications of the Ka-band cloud radar.
ParameterValue
Frequency (wavelength)33.44 GHz (8.9 mm)
TransmitterMagnetron
Peak power≥15 kW
Antenna diameter1.5 m
Beamwidth0.42°
Gate spacing/maximum range15 m/15 km
Polarization modeSingle transmitting, dual receiving
ProductLinear depolarization ratio (LDR),
radar reflectivity (Z), Doppler velocity (VD),
spectrum width (SW)
Table 2. Events of three types of ice clouds (C: cirrus, S: stratiform, and A: anvil) and their height ranges.
Case No.PeriodHeight (km)Case No.PeriodHeight (km)
C113/06/2014, 10–23 UTC8–14C1818/09/2015, 06–23 UTC7–11
C214/06/2014, 00–23 UTC7–13C1924/09/2015, 00–18 UTC6–14
C326/06/2014, 00–09 UTC8–13S105/07/2014, 10–21 UTC5–14
C427/06/2014, 05–23 UTC6–12S216/07/2014, 08–17 UTC5–13
C508/07/2014, 07–13 UTC10–14S312/10/2014, 05–23 UTC5–13
C616/08/2014, 00–11 UTC10–13S411/07/2015, 04–23 UTC5.5–14
C730/08/2014, 01–12 UTC8–13S523/09/2015, 00–09 UTC4.5–13
C822/09/2014, 10–21 UTC11–15S630/09/2015, 00–18 UTC5–14
C925/09/2014, 07–23 UTC6–12A116/06/2014, 11–14 UTC4–13
C1015/10/2014, 15–21 UTC8–12A212/09/2014, 00–02 UTC4–12
C1115/03/2015, 05–11 UTC6–10A312/10/2014, 00–02UTC4–13
C1203/04/2015, 03–10 UTC8–13A422/05/2015, 10–14 UTC4–13
C1314/06/2015, 07–21 UTC8–13A504/06/2015, 14–15 UTC4–13
C1423/06/2015, 01–21 UTC7–14A617/06/2015, 03–04 UTC4–14
C1502/07/2015, 00–09 UTC10–14A706/07/2015, 04–10 UTC4–14
C1609/07/2015, 00–23 UTC8–13A816/09/2015, 02–06 UTC4–12
C1709/08/2015, 00–23 UTC6–13A922/09/2015, 17–22 UTC4–13
Publisher’s Note: MDPI stays neutral with regard to jurisdictional claims in published maps and institutional affiliations.