Article

The Interannual Fluctuations in Mass Changes and Hydrological Elasticity on the Tibetan Plateau from Geodetic Measurements

1
School of Geodesy and Geomatics, Wuhan University, Wuhan 430079, China
2
State Key Laboratory of Information Engineering in Surveying, Mapping and Remote Sensing, Wuhan University, Wuhan 430079, China
*
Author to whom correspondence should be addressed.
Remote Sens. 2021, 13(21), 4277; https://doi.org/10.3390/rs13214277
Submission received: 26 September 2021 / Revised: 11 October 2021 / Accepted: 22 October 2021 / Published: 24 October 2021

Abstract

:
The mass balance of water storage on the Tibetan Plateau (TP) is a complex dynamic system that has responded to recent global warming due to the special regional characteristics and geographical environment on the TP. In this study, we present global positioning system (GPS), gravity recovery and climate experiment (GRACE) and follow-on (FO) observations obtained during the 2002–2020 period to identify hydrological changes on the TP. The spatial long-term trends in the GRACE/GRACE-FO data show continuous glacier mass losses around the Himalayas and accumulated mass on the inner TP due to the increased water mass in lakes. The singular spectrum analysis (SSA) was applied for interpolation of the data gap with GRACE/GRACE-FO. We evaluated the correlation between the vertical displacements obtained from 214 continuous GPS stations and GRACE/GRACE-FO-modeled water mass loads and found a high correlation, with spatial variabilities associated with the seasonal terrestrial water storage (TWS) pattern. The common-mode component obtained from continuous GPS coordinates was decomposed using principal component analysis (PCA) and presented different periodic signals related to interannual fluctuations in hydrology and the dynamics of the inner Earth. Moreover, the various characteristics of precipitation and temperature revealed similar interannual fluctuations to those of the El Niño/Southern Oscillation. We conclude that the GPS-inferred interannual fluctuations and the corresponding GRACE/GRACE-FO-modeled hydrological loads reflect climate responses. These findings shed light on the complex role of the spatiotemporal climate and water mass balance on the TP since the beginning of the 21st century.

1. Introduction

The mass transformations that occur in the water cycle in the Tibetan Plateau (TP) occupy an important position in Earth’s dynamic and climate change systems [1]. In addition to the north and south poles (Antarctic and Arctic), the TP, as the world’s “third pole”, breeds a huge total volume of water resources, i.e., glaciers, lakes and permafrost [2,3,4,5]. Widely distributed glaciers and snow on the plateau are the main sources of water for more than one billion people in East Asia and its surroundings; thus, this region is commonly known as the “Asian water tower” [6]. It is also the headstream of many large river basins, contributing to the survival and social stability and development of people. In the past 50 years, with accelerated global climate warming, high-elevation areas and low-lying plains have experienced faster temperature increases than other regions [7]. Under this climate background, the melting of glaciers and water runoff in high mountain areas have accelerated, lakes have expanded significantly, and the water cycle system has shown an overall imbalance on the TP [8,9,10]. Previous studies have shown that the melting of glaciers and thawing of permafrost on the TP have accelerated in recent years, further importantly impacting the rise of global sea levels [11,12,13]. Due to the increase in precipitation and the decrease in evaporation, the water levels of lakes in the TP and its surrounding areas have shown an upward trend [2,14]. In addition, the monsoon from India carries warm and humid air currents across the Himalayan margin, and these monsoon currents encounter cold air currents during their ascent, resulting in variable rain and snow and maintaining the dynamic balance of plateau glaciers [15].
Different glaciers in the alpine region of Asia have their own unique changes. For example, the glaciers distributed throughout TP can be divided into three categories based on the impacts of different climate factors. The glaciers in the southern TP are affected by heavy precipitation during the Indian Ocean monsoon in summer, while glaciers in the Pamirs are mainly affected by westerlies in winter. The glaciers within the inner TP are less affected by these two winds and are mainly controlled by the continental climate [15]. Therefore, the peaks of these different glaciers vary widely among different seasons. In addition, their glacier ablation rates are different. The glaciers on the southern tip of the TP and the Karakorum Mountains are melting at an accelerating rate, but the glaciers on the plateau melt very slowly [15]. The glacier changes in the Pamir Plateau are more complex, and these glaciers have even appeared to grow over a period of time [16].
In the past two decades, the quantitative estimation of the glacier mass balance of the TP based on GRACE data consistently shows that the loss of glaciers in this region has accelerated and has contributed significantly to sea level rise [17]. Matsuo and Heki (2010) [18] estimated the changes in ice and snow mass in the high areas of the TP based on GRACE satellite gravity data and suggested that the glacier melting rate is −47 ± 12 Gt/year without considering glacial isostatic adjustment (GIA); this value is equivalent to a sea level rise of 0.13 ± 0.04 mm/year. Jacob et al. (2012) [12] suggested that the glacier melting rate in the high-mountain area of the TP is −4 ± 20 Gt/year, which makes a significant contribution to the global average sea level rise, while Yi and Sun (2014) [19] gave a glacier loss rate of −41 ± 6.5 Gt/year. The latest result shows that the glacier mass reduction rate of the TP from GRACE and GRACE-FO data during 2003–2019 is −28 ± 6 Gt/year [20]. Different research results have great differences in different time periods. This can be mainly attributed to the limitation of the spatial resolution of GRACE data (usually approximately 400 km) and the differences in the data-processing methods used. In addition, there are many years of oscillating signals in the time series of surface water quality changes retrieved by GRACE satellites, and the geophysical mechanisms of these changes have not been effectively explained.
In this study, we evaluated the spatiotemporal variations in terrestrial hydrological mass changes on the TP and its surroundings using GPS and GRACE/GRACE follow-on (GFO) observations obtained from April 2002 to December 2020. The hydrologic signals and their induced elastic loading displacements are analyzed in detail at different timescales using Fourier spectra and wavelet time-frequency spectra. The interannual and transient fluctuations within the geodetic-inferred hydrological signals are highlighted as being associated with water transformations and climate changes over TP.

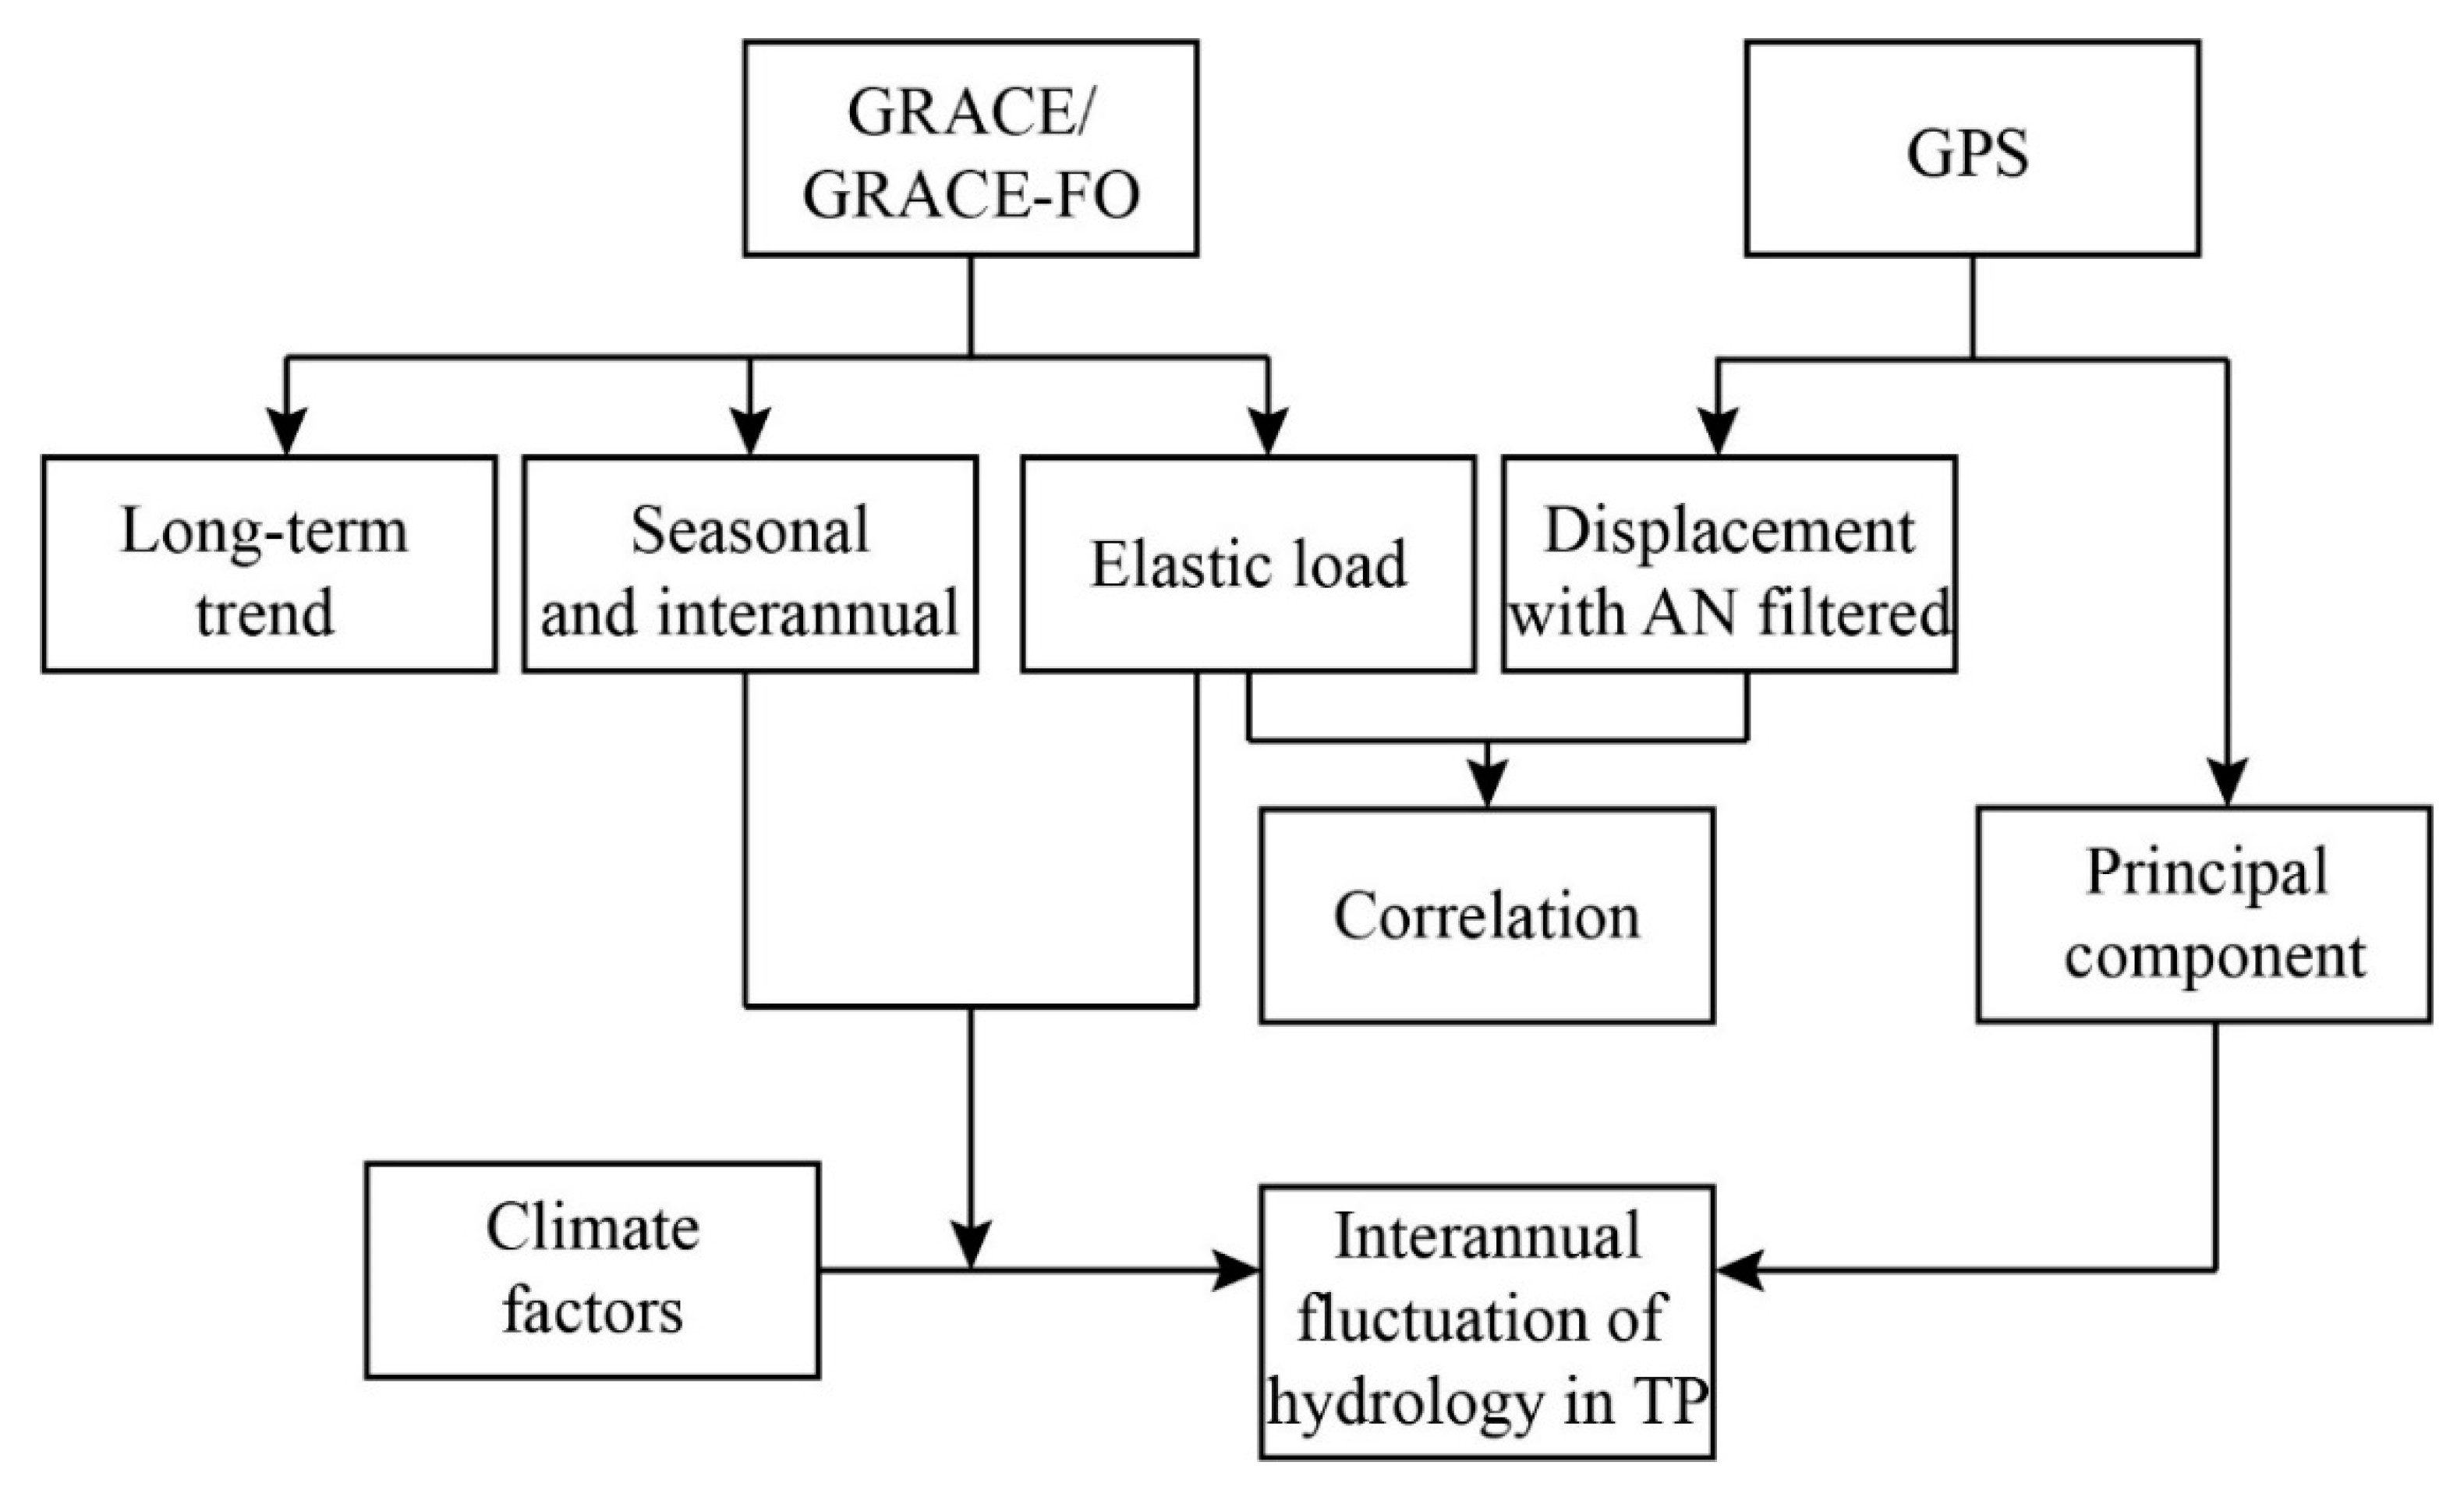
2. Data and Methodology

Continuous GPS (CGPS) observed time series contain a wealth of geophysical signals, which could be related to dynamic processes in different spheres of the Earth. The main sources of seasonal signals from GPS stations are hydrological and atmospheric loading effects, and these effects can also be retrieved from GRACE satellite gravity data. Using CGPS and GRACE/GRACE-FO observations to jointly evaluate the terrestrial water storage on the TP and its surroundings is significant and can further improve our understanding of hydrological dynamic processes at different spatial resolutions. Here, we applied CGPS and GRACE/GRACE-FO observations to identify interannual fluctuations in hydrological signals on the TP. The detailed research approaches used in this study are shown in Figure 1.

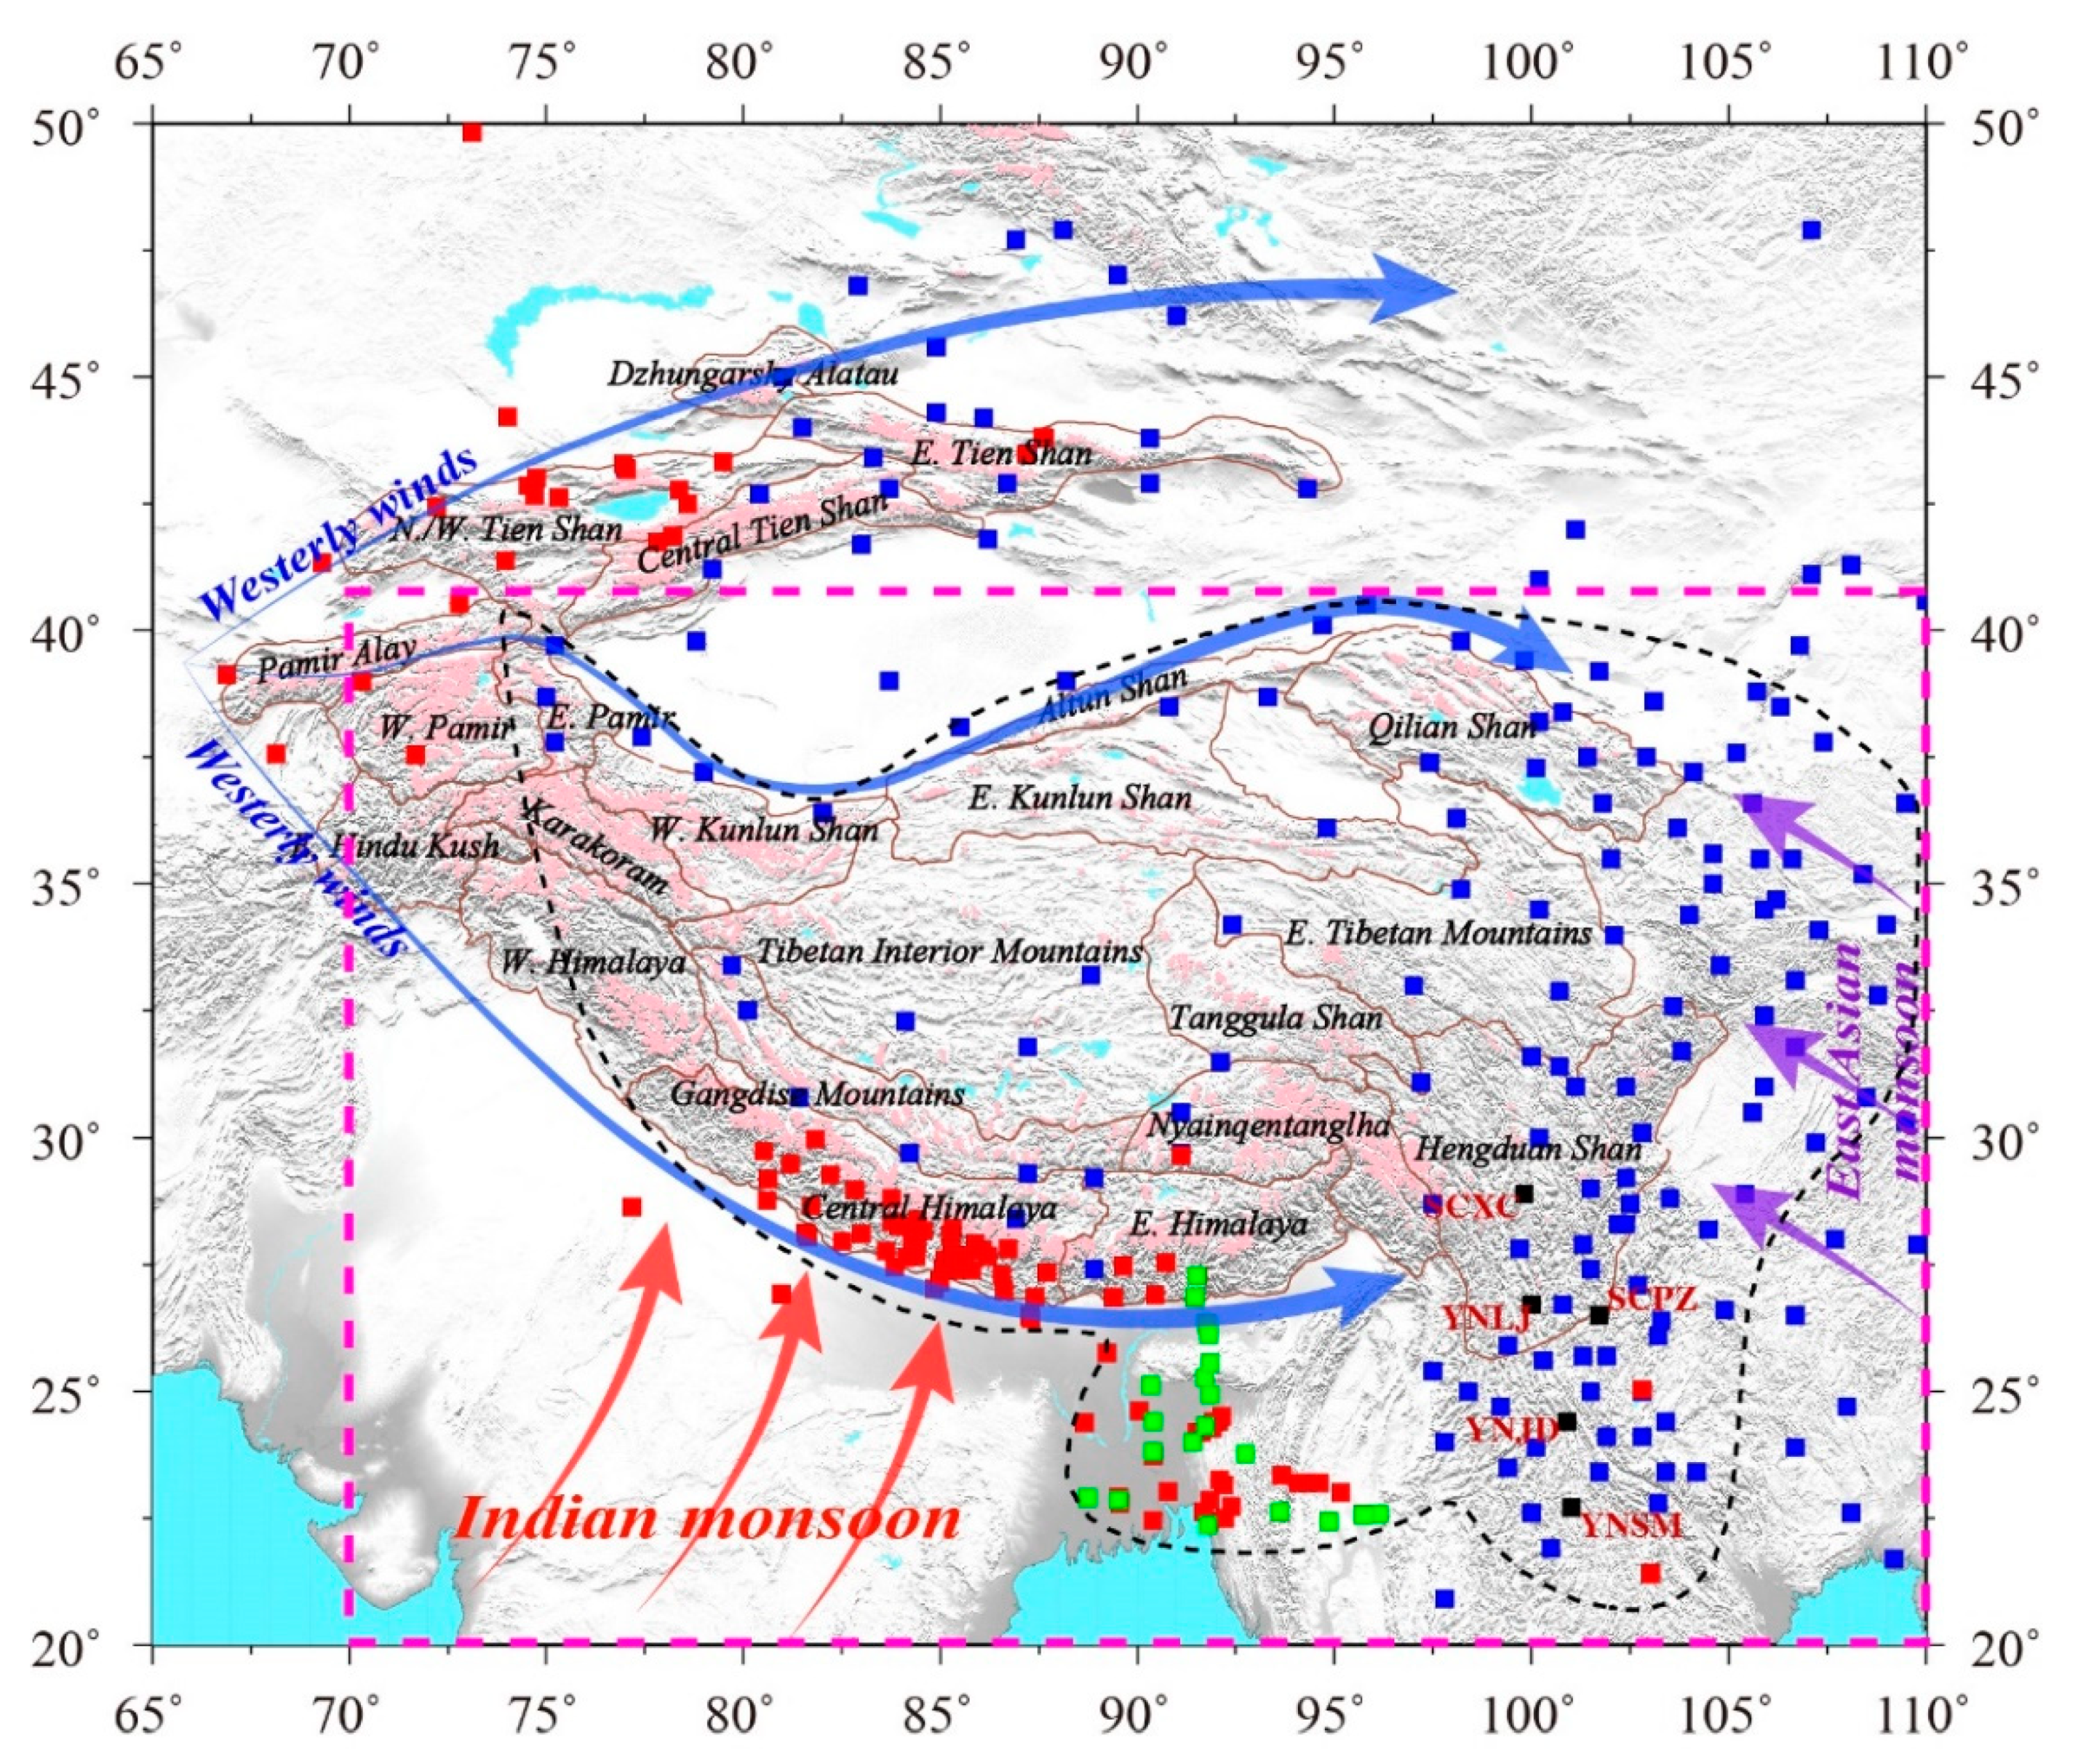
2.1. GPS Data and Processing

In this study, we collected 214 continuous GPS stations (Figure 2) from 2002 to 2020 around the TP from the Crustal Movement Observation Network of China (CMONOC I and II), Nevada Geodetic Laboratory (NGL) and MIBB [21,22]. Daily positions were computed with the GPS-Inferred Positioning System and Orbit Analysis Simulation Software version 6.2 (GIPSY6.2) software, with reference to the International Terrestrial Reference Frame 2014 (ITRF2014) [23]. The Vienna mapping function (VMF1) was adopted for troposphere corrections [24]. We considered the 1st (removed by a linear combination [LC] and phase center [PC]) and 2nd (modeled using ionosphere exchange [IONEX] data with 12th international geomagnetic reference field [IGRF12]) order effects in correcting the ionosphere effects [25]. Solid Earth tides and pole tides were removed with reference to the International Earth Rotation and Reference Systems (IERS) published in 2010 [26]. The Finite Element Solution 2004 (FES2004) model with elastic Green’s functions was used to correct for ocean tides and ocean tidal loading [27]. Finally, the atmospheric and non-tidal ocean loads were removed from the daily GPS coordinates using European Centre for Medium-Range Weather Forecasts (ECMWF) data [28].

2.2. GRACE and GRACE-Follow-On (FO) Data

GRACE/GRACE-FO measurements provide key data for identifying temporally varying water storage and mass transport in the Earth system since 2002 [29]. Here, we present data sources and processing techniques with which to extract reliable water mass changes and elastic load displacements from GRACE/GRACE-FO data on the TP. GRACE/GRACE-FO constrained 192 monthly mascon solutions (Release-06) from the Center for Space Research (CSR) at the University of Texas and from the Jet Propulsion Laboratory/California Institute of Technology (JPL) to estimate the mass variations in terrestrial water storage (TWS) on the TP. The data of the CSR and JPL GRACE/GRACE-FO mascon solutions span from April 2002–December 2020, respectively. In contrast to spherical harmonic solutions, mascon solutions are directly solved for mass variations without de-striping or filtering [30,31,32], depending on the external information provided by near-global geophysical models and an elastic loading algorithm considering equal-area grids. In addition, the spherical harmonic coefficients (SHCs) obtained from the CSR GRACE/GRACE-FO Level-2 products released from April 2002 to December 2020 were adopted for comparison with the mascon solutions. The detailed data processing strategies for the SHCs were conducted following previous studies [33,34]. Finally, Green’s functions [35] were used to derive the hydrological elastic load with the PREM Earth structure [36].

2.3. Meteorological Data

(1)
Precipitation
The fifth-generation ECMWF atmospheric reanalysis of the global climate (ERA5) dataset was released by the European Centre for Medium-Range Weather Forecast. We used the monthly precipitation data output by ERA5; the time span of these data is from 1979 to 2021 and its spatial resolution is 0.25°. The data are provided by the Copernicus Climate Change Service [C3S] Climate Date Store [CDS] and can be downloaded from the following website: https://www.ecmwf.int/en/forecasts/dataset/ecmwf-reanalysis-v5 (last access on 21 October 2021).
In addition, the precipitation model of Global Precipitation Climatology Centre (GPCC) at 1.0° grid resolution was applied to make a comparison with the ERA5 [37]. GPCC monitoring product of monthly global land-surface precipitation based on the station database (SYNOP, CLIMAT) available via the Global Telecommunication System (GTS) of the World Meteorological Organization (WMO) at the time of analysis, which can be downloaded by https://opendata.dwd.de/climate_environment/GPCC/html/gpcc_monitoring_v2020_doi_download.html (last access on 21 October 2021).
(2)
The surface air temperature
The temperature data model used in this paper is the GHCN_CAMS model [38], which consists of two datasets joined by the Global Historical Climatology Network (GHCN) and the Climate Anomaly Monitoring System (CAMS) solutions. The GHCN_CAMS model provides temperature change values at a height of 2 m near the surface of the Earth with a time span from 1948 to the present. The data sampling interval is 1 month, and the spatial resolution is 0.5°. The data can be downloaded from the following website: https://psl.noaa.gov/data/gridded/data.ghcncams.html (last access on 21 October 2021). Meanwhile, we used the ERA5 released temperature of air at 2 m above the surface of land at a regular lat-lon grid of 0.1 × 0.1 degree (downloaded at website: https://cds.climate.copernicus.eu/cdsapp#!/dataset/reanalysis-era5-land-monthly-means?tab=overview) (last access on 21 October 2021), in order to make it more believable.
(3)
Climate index
Part of this article discusses the relationships between climate events and changes in land water quality. Version 2 of the multivariate ENSO index was adopted to identify the interannual response of the global climate; these data can be downloaded at https://psl.noaa.gov/enso/mei/ (last access on 21 October 2021).

2.4. Methods

In this study, a non-parametric and data-adaptive implement method proposed by Singular Spectral Analysis (SSA) was used to fill the data gap within the GRACE and GRACE-FO [39]. The singular spectrum analysis method is introduced below. One of the main advantages of this method is that it is non-parametric and data adaptive, which makes it has a wide range of application scenarios, especially in the fields of meteorology and oceanography [40,41]. The basic principle of SSA is to sample the time series into time-lag fragments, obtain relevant information between the fragments, and reconstruct the time series based on time correlation. SSA is further developed and can fill data gaps in time series based on the characteristics of available data samples [42,43].
In addition, the adopted spectral analysis methods, such as Fourier transform and wavelet spectrum were used to identify the periodic signals of the GPS, GRACE/GRACE-FO observations and climate datasets have been detailed description in previous study [44].

3. Results

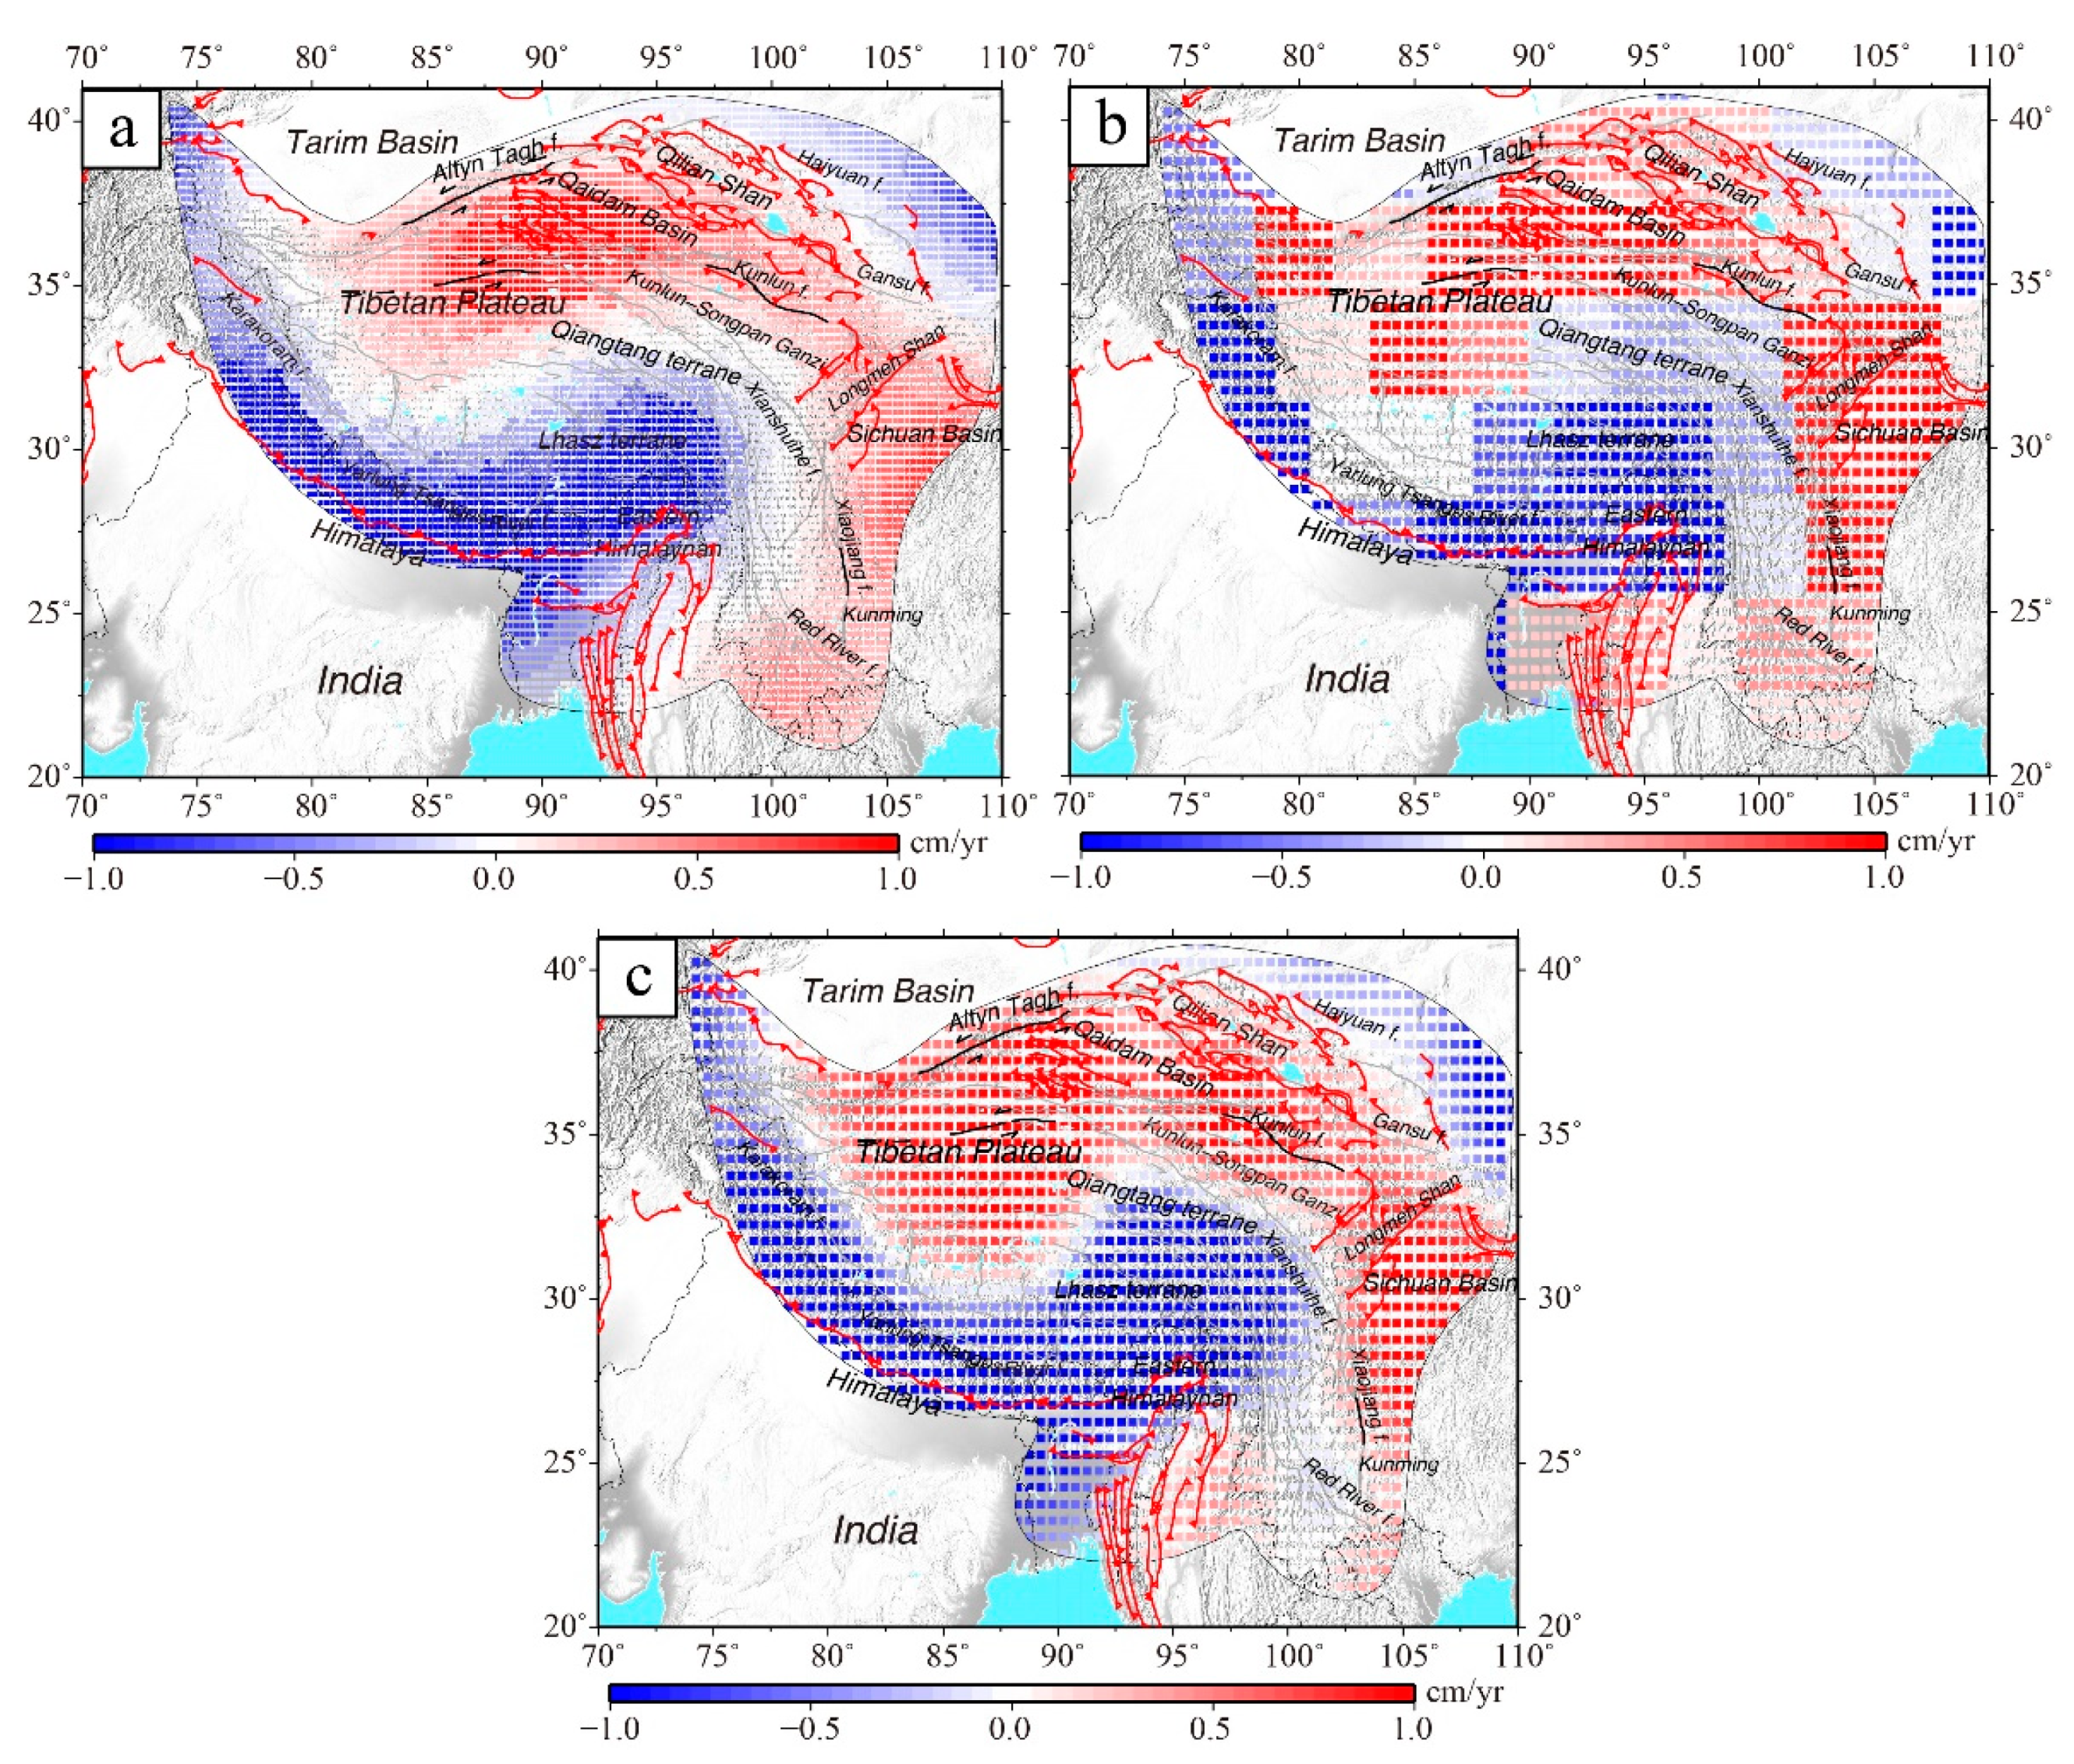
3.1. The Surface Mass Balance from GRACE/GRACE-FO Observations over the TP

The surface mass redistribution data constrained from GRACE/GRACE-FO observations provide critical information to better our understanding of the water cycle in the specified areas. Changes in the terrestrial water storage (TWS), major components of the water mass, reflect changes in the water stored in soil, snow over land, and groundwater reservoirs [45]. Here, we presented the long-term trend of TWS (EWH, equivalent water height) in Tibet and its surroundings from GRACE/GRACE-FO measurements, as shown in Figure 3. The water storage changes in the TP derived by mascon and SHCs in the past 20 years, including the long-term trends and seasonal variations, show good consistency in their spatial patterns. The main difference lies in the spatial resolution calculated using the mascon products provided by JPL and CSR.
Figure 3 shows that the mass loss distributions are mainly concentrated in glacial areas, such as the Himalayas and Nyainqentanglha in the southern TP. The inner TP is dominated by large numbers of lakes, showing an increase in their overall mass; this increase is mainly caused by regional precipitation and replenishment from the melting of peripheral glaciers. The eastern margin of the Qinghai-Tibet Plateau, such as the Sichuan Basin and Yunnan-Guizhou Plateau, is mainly affected by an increasing water storage trend caused by monsoon precipitation.
Figure 4 presents seasonal TWS patterns (with the corresponding annual amplitude and phase) over the TP from the mascon and SHC solutions. The southern edge of the TP has larger annual amplitudes than the inner and northern regions; these higher amplitudes in the southeastern TP are a result of glacier change, which are mainly caused by seasonal monsoon precipitation [46]. Meanwhile, we find that the differences of the phase in western TP and eastern Himalayas are probably caused by the spatial patterns of precipitation brought by westerlies. The southerly winds and precipitation over the Indian Ocean accompanied by the East Asian summer monsoon regions are obviously enhanced in summer, while precipitation over the inner and northern TP is reduced in both summer and winter [47].
Figure 5a shows the monthly averaged time series of the TWS from GRACE/GRACE-FO over the whole region. The SSA-based TWS is almost consistent with time-varying characteristic of the original TWS. To highlight the interannual oscillations and transient variations in the water storage changes, we filtered them with a 2-year moving average by low = pass filtering. Peaks of original and SSA-based TWS were discovered during the period of 2008–2009 and 2011–2012, while there were no obvious fluctuations in the period from 2012 to 2017. After 2017, there was another obvious fluctuation during the period of 2016–2017 and 2018–2019 within original TWS, which is different with SSA-based TWS. It could be caused by data gaps during 2017–2018 within the GRACE/GRACE-FO products. The mean annual cycle of the whole TWS over the TP reveals that peak value occurs around summertime (August–September).
In addition, we performed Fourier transform and wavelet spectrum analyses on two kinds of data (see in Figure 5c and Figure 6). The seasonal signals (annual and semi-annual signals) of the data are obvious and are the main principal component of the temporally varying characteristic. We find that the annual and semi-annual signals of SSA-based TWS are larger than the original TWS, while with the decrescent of the interannual signals, especially during the period of 2014–2020 (Figure 6). The interannual oscillating signal mainly includes periodic signals with frequency bands of 2–7 years. There is a periodic signal of ~3.4 years with an amplitude of ~1 cm, which follows the amplitude of a semi-annual period.

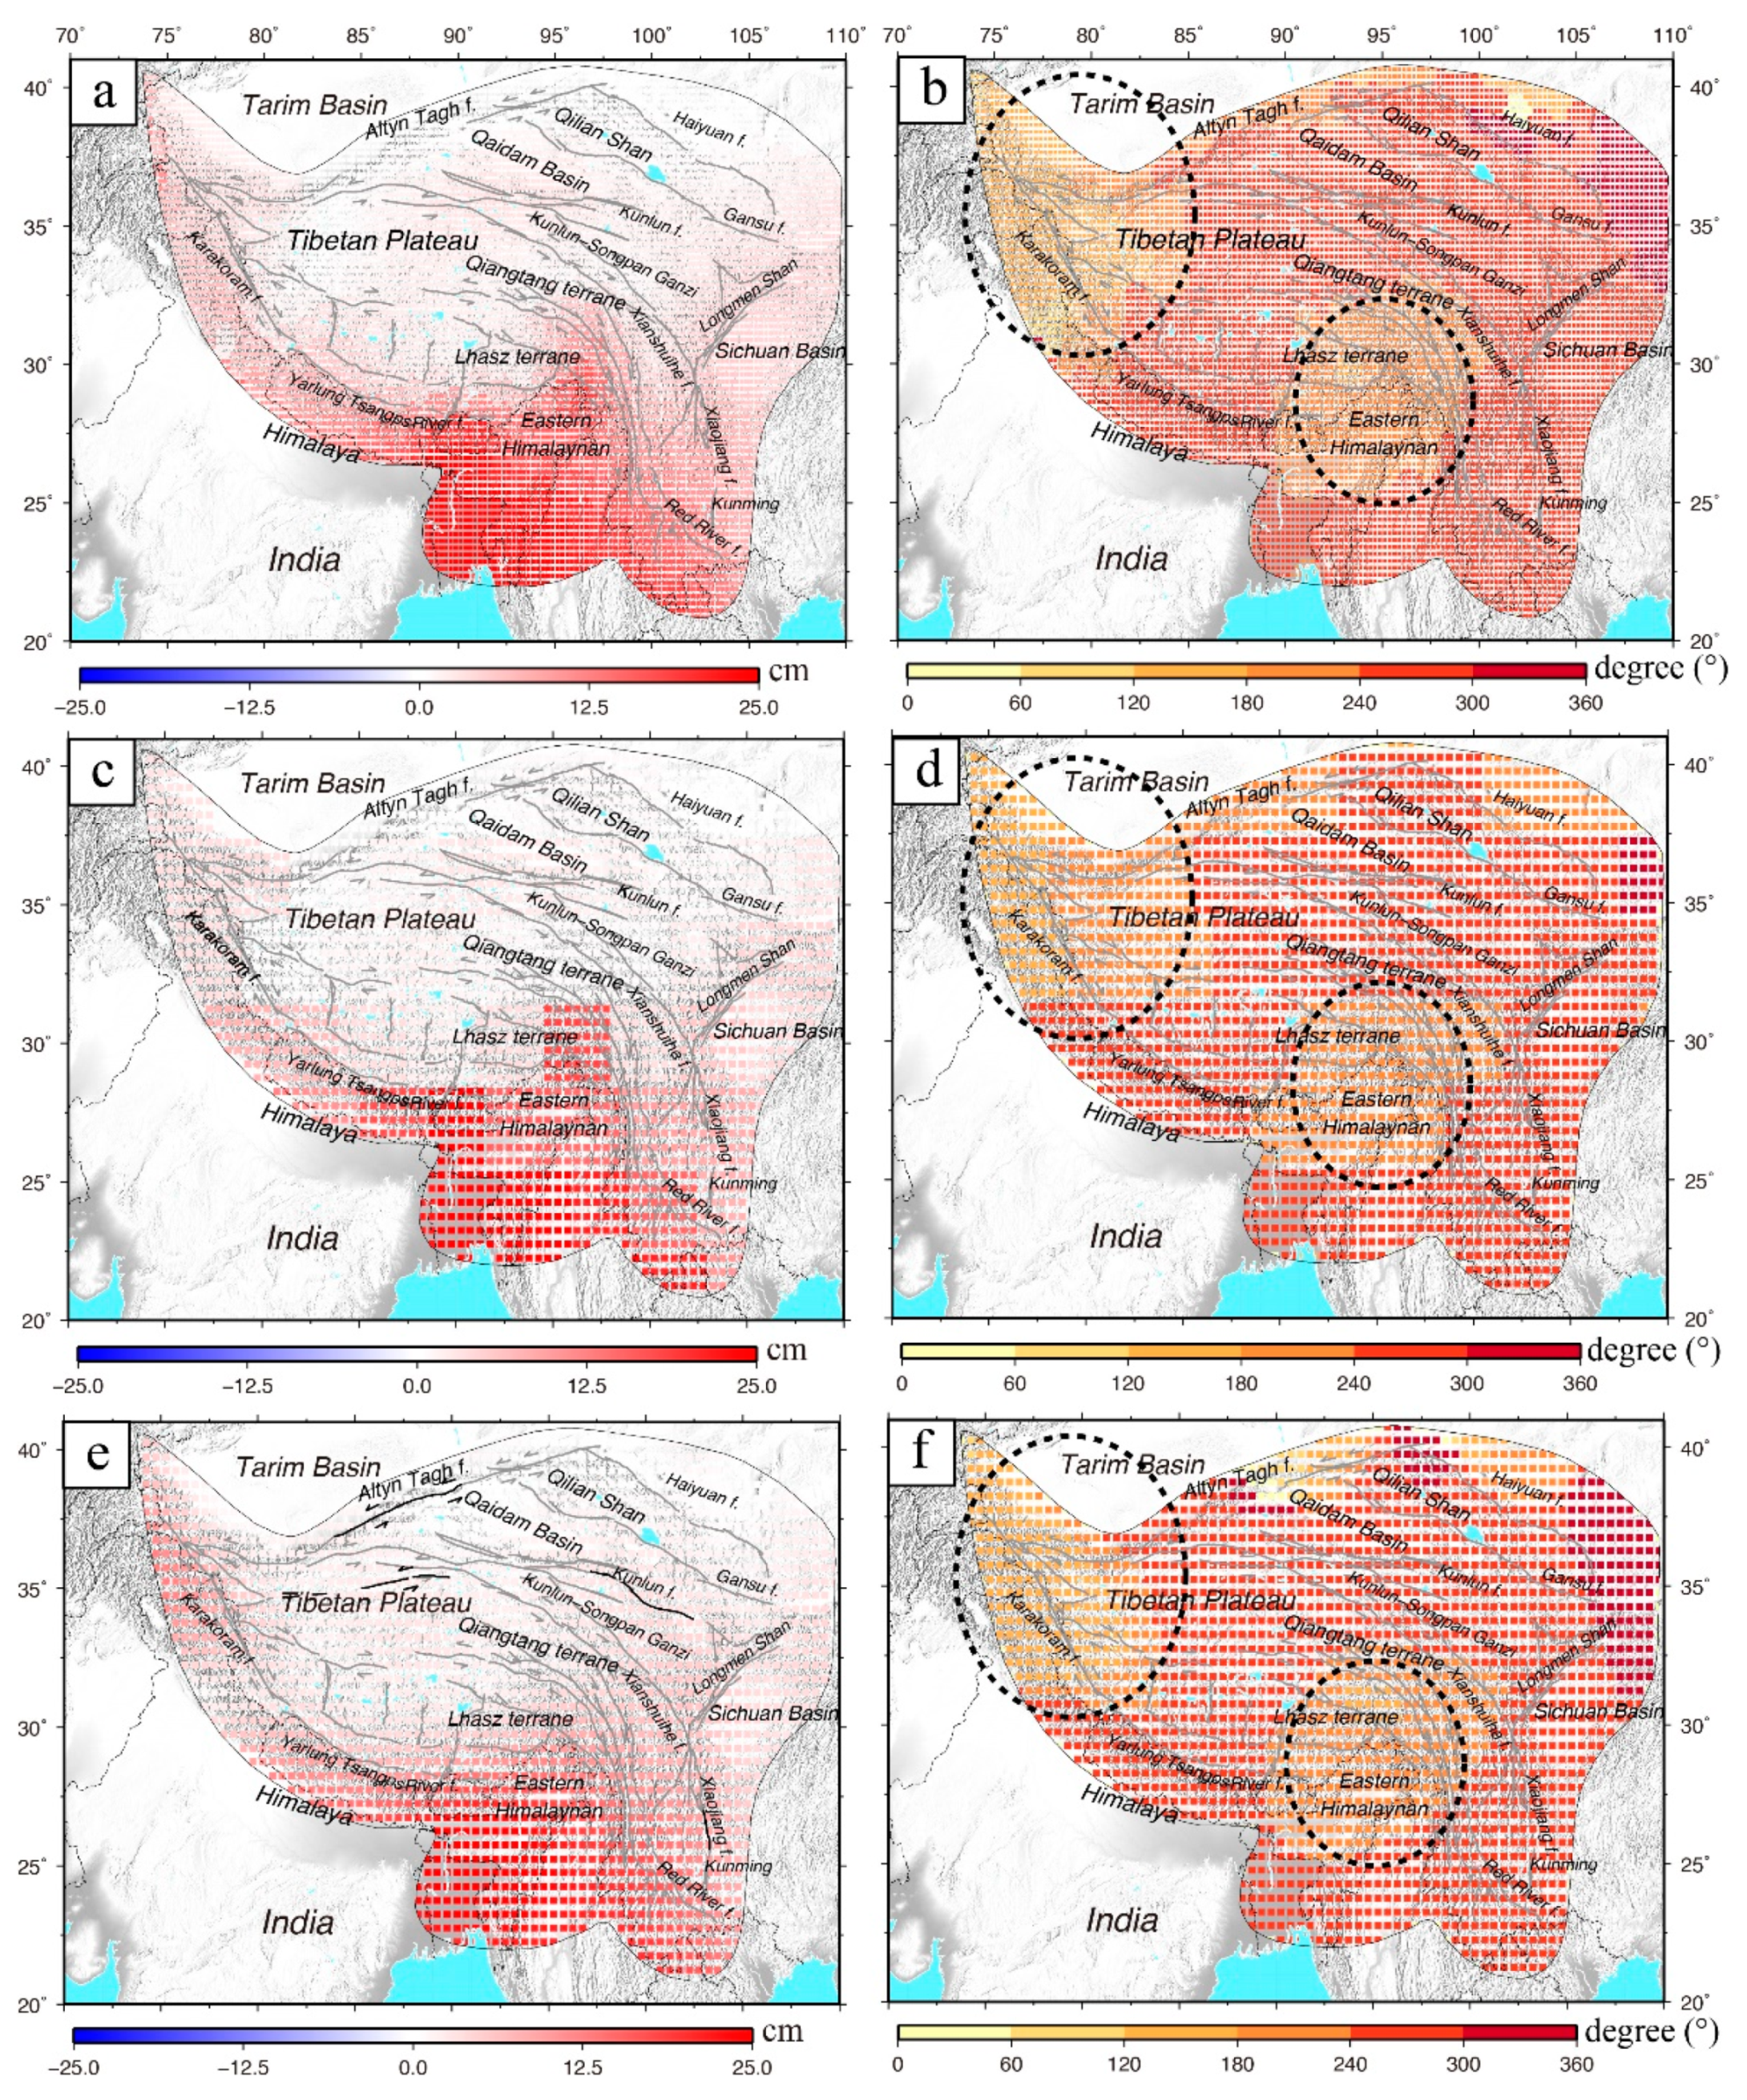
3.2. The Elastic Deformation from GPS and GRACE/GFO Observations in TP

The solid Earth deforms elastically in response to surface water, atmospheric and nontidal ocean mass redistributions. GPS-measured vertical displacements include the elastic response of the Earth to a combination of regional and local loading signals arising from mass transfers [48]. First, we removed the atmospheric and nontidal loads from the GPS coordinate series to identify the hydrological signals within the GPS time series. To account for the inherently different sampling intervals of the GPS and GRACE/GRACE-FO measurements, we processed these data by batching the daily GPS time series to form monthly averaged versions of the vertical coordinate time series for the 214 GPS stations. Subsequently, Green’s functions were performed to estimate the elastic loading displacement from the three GRACE/GRACE-FO solution products. A comparison between the GPS, GRACE/GRACE-FO (averages of the three solutions) observations is presented in Figure 7, showing consistent variations in the temporal domain. The interpolated hydrological loading displacement is significant during 2017–2018 based on SSA approach.
Furthermore, we evaluated the Pearson correlation between the 214 monthly GPS time series and GRACE/GRACE-FO-modeled elastic displacements over the TP. The spatial patterns of the consistencies between the GPS-observed and GRACE/GRACE-FO-derived elastic loading displacements are presented in Figure 8. The average value of the Pearson correlation coefficients over all stations was 0.70. For the 214 long-term continuous GPS monitoring stations, the percentages of Pearson correlation coefficients that vary between 0 and 0.4, vary between 0.4 and 0.7, and exceed 0.7 are 6%, 35.1% and 58.9%, respectively. In addition, we found that the stations on the southern TP have higher correlations, and these correlations are mainly associated with the stronger seasonal TWS mass changes, as presented in Figure 4.
As suggested by previous studies [44], the common-mode component (CMC) within a dense GPS network is associated with interannual signals that could be related to the climate responses and inner dynamic processes of the Earth. Therefore, we decomposed the CMC from the 214 GPS time series throughout the TP. Here, the annual and semi-annual signals, as well as the long-term trends, were removed at each GPS time series before applying principal component analysis (PCA). We selected the scaled first PC as the common mode in TP due to the inconsistent spatial response of other modes [44]. The normalized spatial eigenvectors and time series of the common-mode components of the scaled first PC are shown in Figure 9a,b. Figure 9c shows the wavelet time-frequency spectra of the first PC; this PC involves interdecadal oscillations with periods of ~2–6 years. A periodic signal of ~6 years is also found within the first PC, which could be related to mantle-inner core gravity coupling (MICG), as suggested by Ding and Chao (2018b). The signals with periodic ~2–5 years interdecadal oscillations are mainly elastic loads associated with hydrological mass changes on the TP (see Figure 5c).

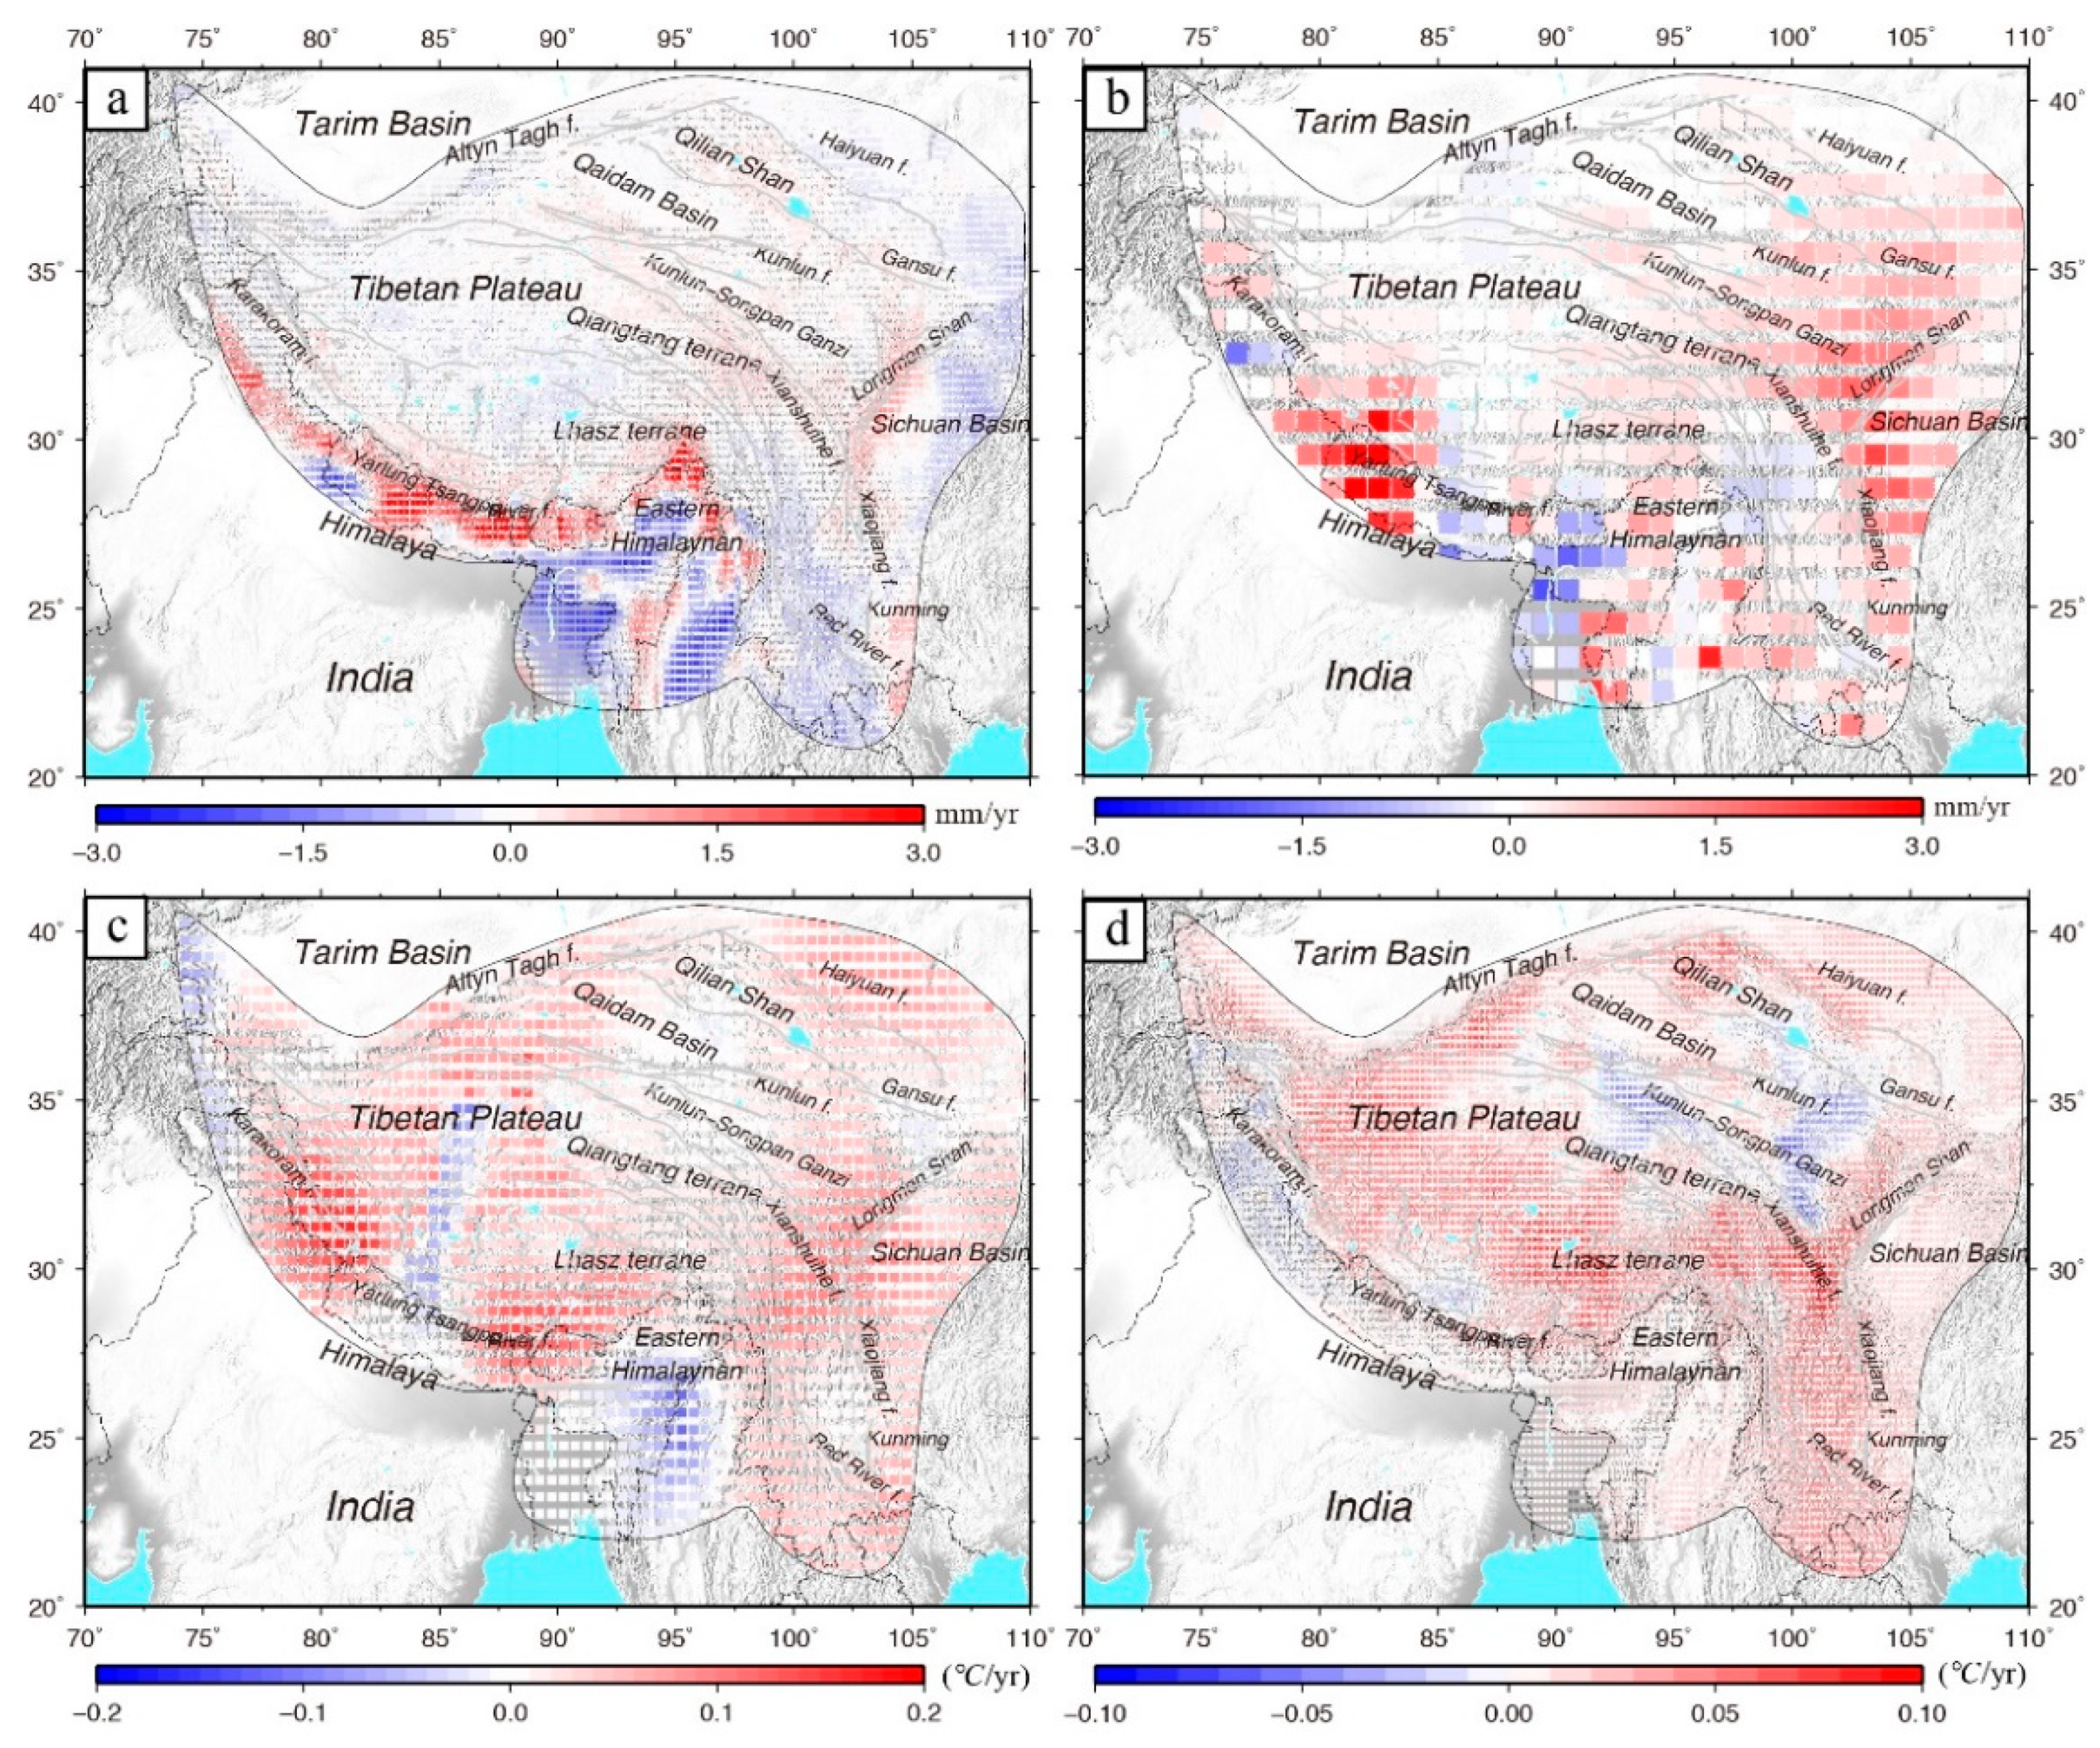
3.3. Spatial Long-Term and Interannual Climate Changes on the TP during 2002–2020

(1)
The long-term precipitation and surface temperature trends
The water mass balance in high mountains is especially sensitive to climate change, particularly with regard to the dynamic processes of glaciers [49,50]. The long-term trend of TWS identified by GRACE/GRACE-FO shows significant glacier mass losses around the Himalayas that are mainly induced by the present-day climate conditions on the TP. Therefore, we examined changes in precipitation and temperature in the study area over the past two decades (see Figure 10). Figure 10a,b present the long-term trend of precipitation from two models, which are increasing in most glacial areas on the high mountain of TP. Among these regions, the increasing trend of precipitation on the southern edge of the TP is the largest, and the precipitation trends in other glacial areas are relatively weak, at approximately zero (Figure 10). Meanwhile, the increasing trend of precipitation is inducing the growth of TWS in the northeast TP, as shown in Figure 3.
The spatial differences between the two solutions of surface air temperatures from GHCN_CAMS and ERA5 models are mainly distributed on the Himalaya mountains, as shown in Figure 10c,d. Overall, the surface air temperatures in most areas on and around the TP showed increasing trends, indicating warming conditions during 2002–2020. Among them, the temperature in the Himalayas increased the fastest, with approximately 0.1 °C/year to 0.2 °C/year, while the temperature in the inner TP decreased slightly (Figure 10c,d). Precipitation is a direct source of replenishment for glacier quantity, while temperature directly affects changes in glacier quantity by directly affecting changes in evaporation [51]. The rapid melting of glaciers on the periphery of the TP can be attributed to the rising temperatures. The glacier changes in the Nyainqentanglha Mountains are relatively complex and are likely the results of a combination of reduced precipitation and rising temperatures [52]. The stable rising of temperature in the inner TP is also one of the important factors in the expansion of lake volumes [51].
(2)
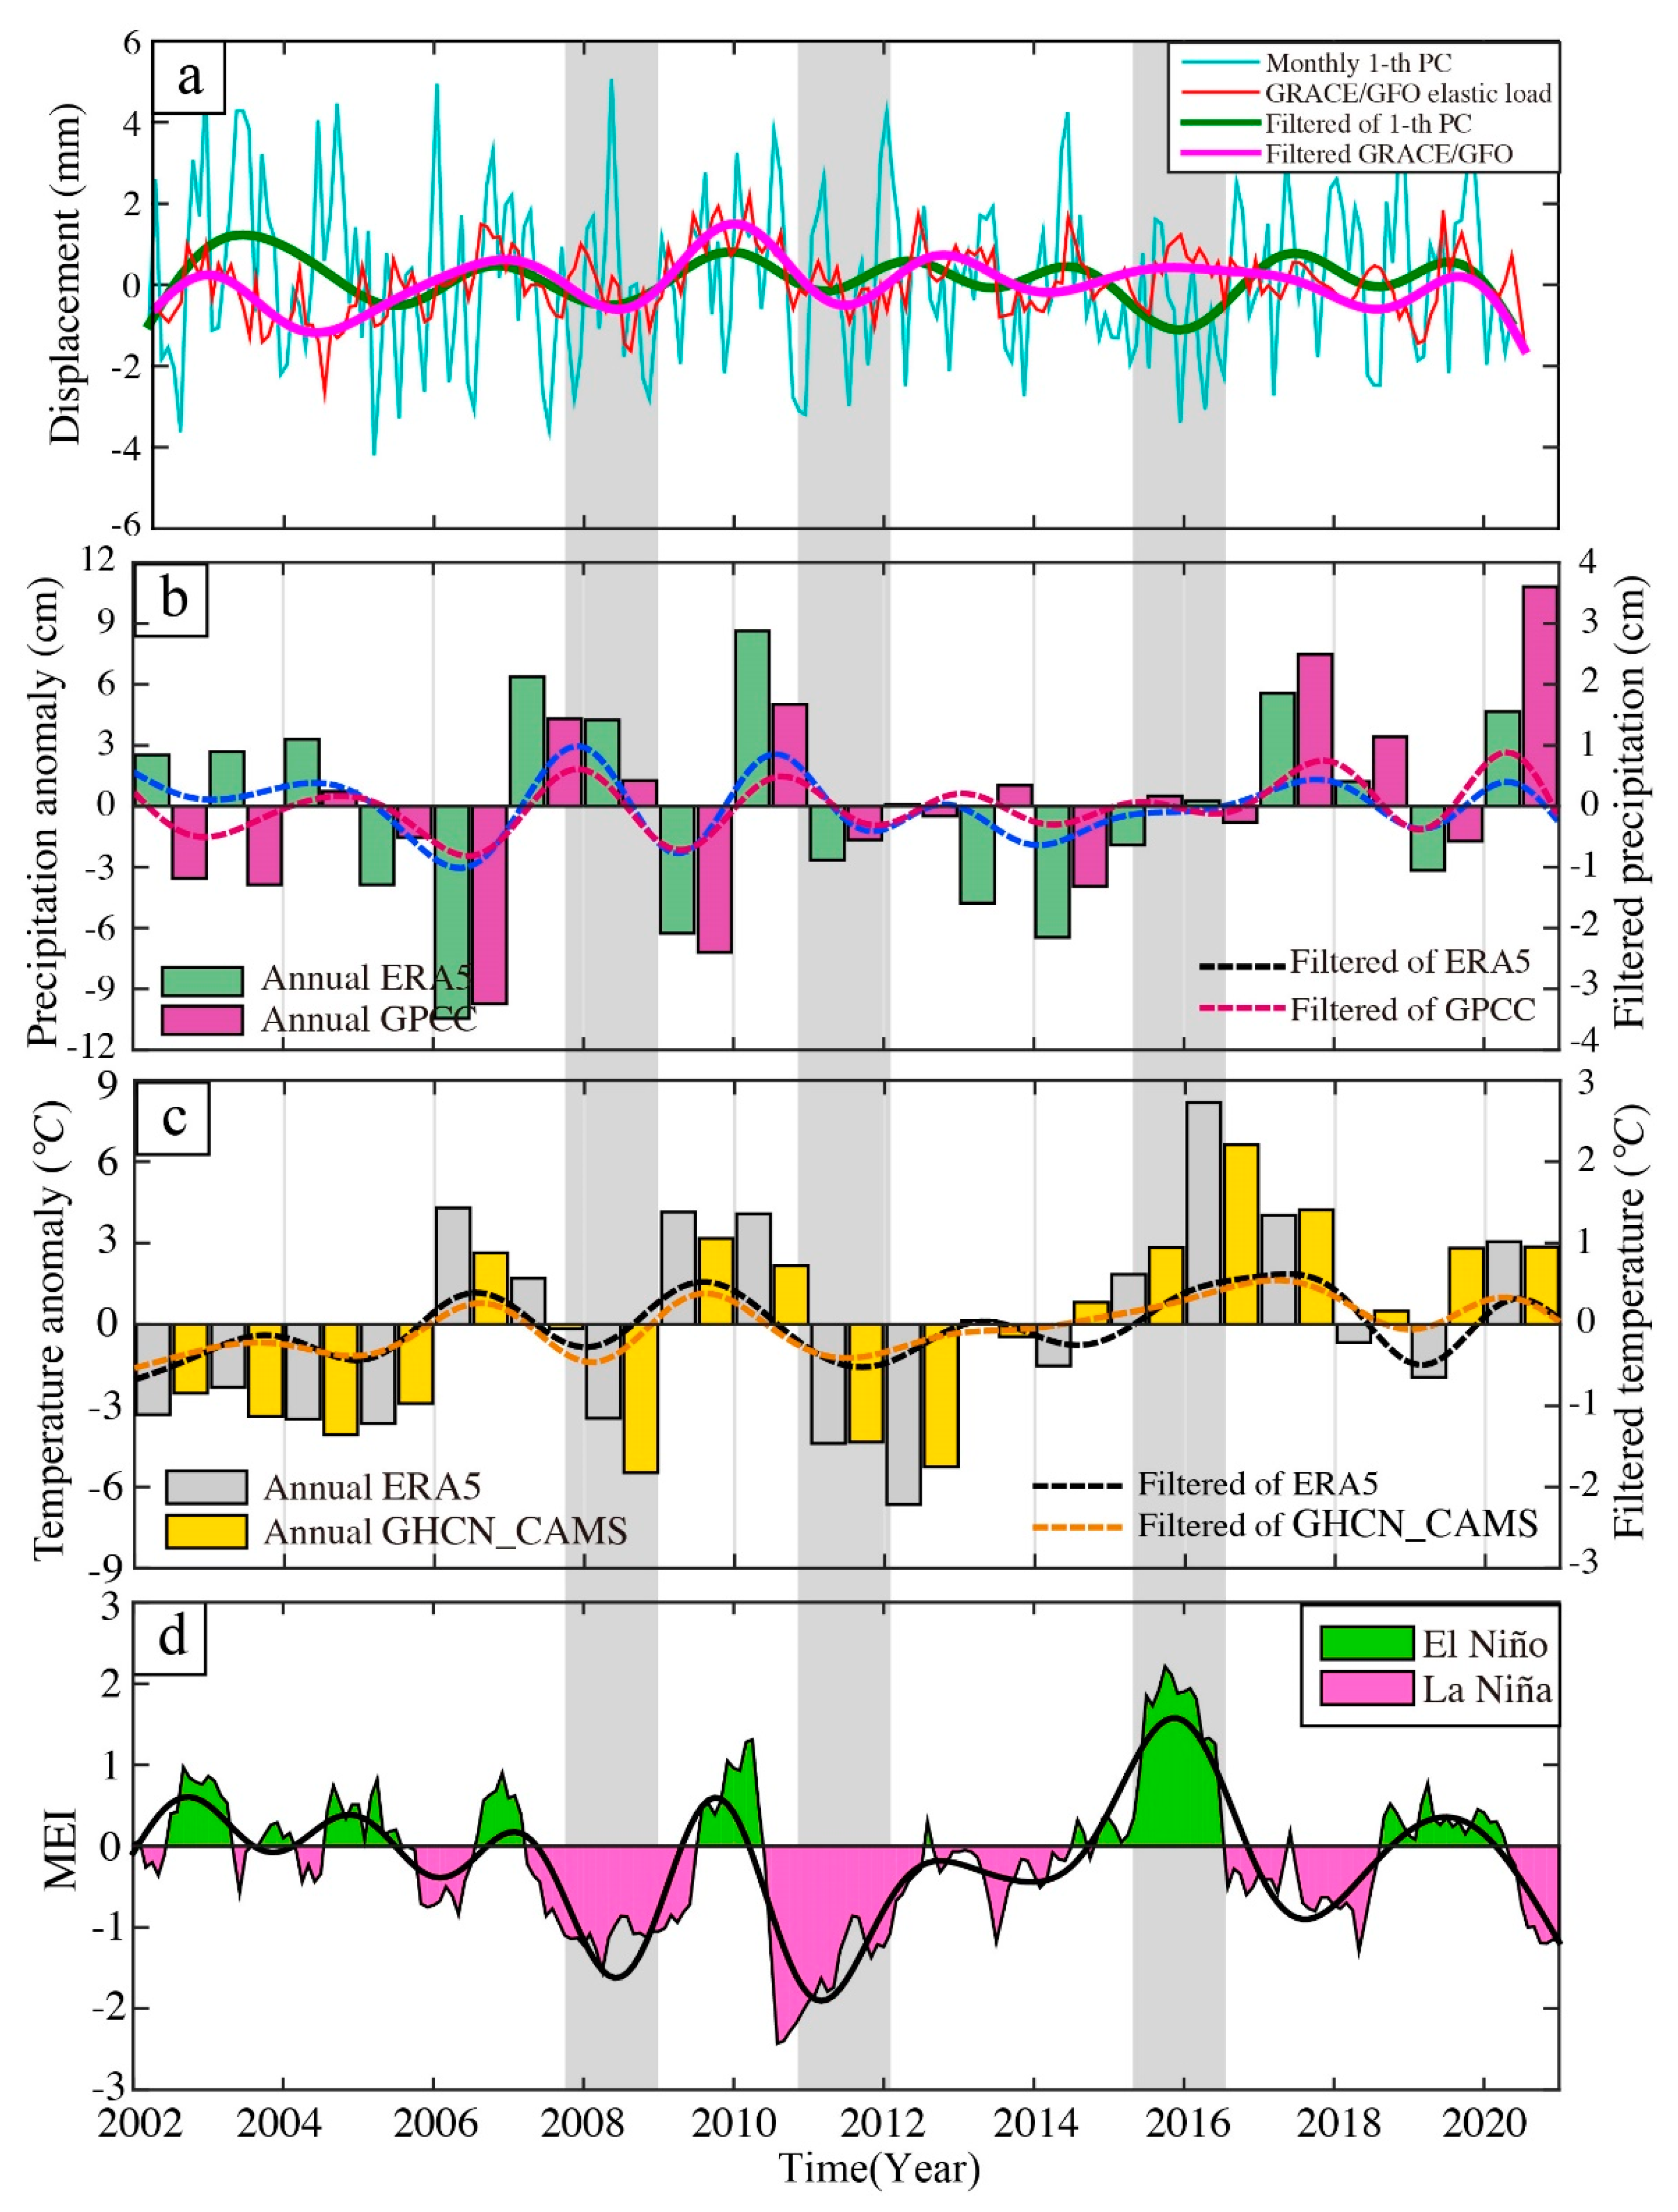
The interannual oscillations of precipitation and surface air temperatures
The ~6-year period signal is involved in GPS-decomposed first PC, which may be not associated with hydrological signal. Therefore, we removed it from the interannual oscillations of first PC as shown in Figure 11a. To further confirm the interannual oscillations of hydrological signals within the GPS-decomposed first PC and GRACE/GRACE-FO-modeled elastic load over the TP, we made a detailed comparison using the interannual variations in precipitation and surface air temperature, as shown in Figure 11b,c. The interannual variations of the corresponding climate models are consistent. The highlighted shades during 2008–2009, 2011–2012 and 2015–2016, showing the three extreme climate events (i.e., El Niño and La Niña) over the past two-decades (Figure 11d). We find that the transient variations within the GPS and GRACE/GRACE-FO observations more or less correspond to the fluctuations in precipitation and temperature. The mass changes indicated by the GPS, GRACE/GRACE-FO and climate conditions approached flat trends during 2012–2015. However, no fluctuation is obvious for the GRACE/GRACE-FO-modeled elastic load during 2015–2016.
The mean annual temperature anomaly was at its maximum in 2016, which should have generated a huge amount of glacier melting and lakes expansion [51], then inducing the transient increase of water mass over the TP. The accumulated water storage likely deformed the surface land, as presented in GPS-decomposed first PC (Figure 11a). Based on the interannual variation in the derived TWS (see Figure 5) and owing to the significant precipitation and temperature fluctuations during the same period, we conclude that the bias of fluctuations during 2015–2016 was mainly induced by a data gap within the GRACE/GRACE-FO product. Although we used the SSA method to interpolate the data gap within GRACE/GRACE-FO, the interannual fluctuations have not been well resolved. Therefore, the interannual dynamics of the hydrological signals identified by the GPS time series densities could be more scientific than those indicated by GRACE/GRACE-FO after 2015 on the TP.
Based on the TWS and hydrological elastic load fluctuations obtained from the GPS and GRACE/GRACE-FO observations, we conclude that during periods of high precipitation and low temperature, the GPS- and GRACE/GRACE-FO-derived loads are mainly elastic and are supercharged by the inevitably increasing TWS on the TP. In addition, the climate index (MEI) revealed interannual fluctuations over the past two decades, as shown in Figure 11. The features of the composite positive phase of the MEI correspond to El Niño events, while the opposite phase corresponds to La Niña events. We observed a significant El Niño event during 2014–2016 and two significant La Niña events during 2008–2009 and 2010–2012. La Niña events occur more frequently than El Niño events, and their intensities have been stronger than those of El Niño events over the past 20 years. In a year when an El Niño event occurs, warm winters often occur on the TP. In contrast, when La Niña events occur, the temperature fluctuation drops and is accompanied by a cold winter on the TP, as presented in Figure 9. Therefore, ENSO is a strong signal affecting climate anomaly but is only one of the main factors influencing variation of water storage on the TP.

4. Discussion

Accelerated global warming has led to imbalances in the water cycle and glacier mass balance on the TP since 2000. Under this climate background, the melting of glaciers in high-mountain areas has accelerated, lakes have expanded significantly, glacier runoff has increased and the water cycle system on the TP has shown an overall imbalance [10]. Moreover, the monsoon from India carries warm and humid airflows across the Himalayan barrier; these airflows encounter cold airflows during their ascent, resulting in variable rainfall and snowfall while maintaining the dynamic balance of plateau glaciers [15,46,53]. Geodetic-observed hydrological dynamic processes bring us a deeper understanding of the present-day changes of the water cycles on the TP [54,55,56]. The spatial patterns of the long-term TWS obtained from GRACE/GRACE-FO reveal that glacial mass loss has become a major concern on high mountains covered by glaciers over the past two decades, as shown in Figure 3. Meanwhile, the spatial differences of annual cycle and its phase are mainly climate responses to multi-monsoons over the TP.
Moreover, the increased precipitation on the inner TP has led to increases in both lake water and groundwater storage, thereby inducing increased TWS throughout TP [46,57]. In addition, the TP is getting warmer and wetter, and the air temperature has increased significantly, particularly since 2002 (in Figure 9). Slight increases in precipitation have occurred over the entire TP with clear spatial variability. The intensification of the surface air temperature is associated with variations in precipitation and decreased snow cover depths, spatial extents and persistence [58].
Researching the seasonal and interannual fluctuations in water storage changes is of great significance, as this information can help us obtain new insights into hydrological processes and climate changes over TP [59,60]. We present the interannual oscillations contained within GPS and GRACE/GRACE-FO observations to reveal the variations of hydrological mass changes in the TP. GPS present high correlation with GRACE/GRACE-FO-modeled elastic loading, revealing the homologous seasonal and interannual fluctuation of hydrology over the TP. In addition, the observed interannual fluctuations in the GRACE/GRACE-FO-derived TWS and elastic loading displacements can be explained as interannual dynamic hydrological processes of the TP. The transient variations in the first common-mode component derived from the GPS coordinates not only involve hydrologic signals [61], but are also associated with an increasing number of ~6-year geophysical signals from the inner Earth [44,62,63]. In addition, the transient variations during different periods within precipitation and temperature are coupled with fluctuations in the climate responses leading to GPS and GRACE/GRACE-FO-observed hydrologic elastic deformation over the TP.

5. Conclusions

Hydrological mass changes are complicated dynamic processes on the TP and are involved in present-day climate responses. In this study, we utilized GRACE/GRACE-FO and GPS data to evaluate seasonal and interannual hydrological mass changes on the TP from April 2002 to December 2020. The spatial pattern of the long-term trend of TWS reveals sustained glacier mass losses in the southern TP, and mass increases (primarily derived from the lakes’ expansion) in the inner TP. A high correlation was found between the GPS- and GRACE/GRACE-FO-modeled hydrologic elastic loading displacements, especially on the southern TP. We decomposed the first common-mode component within the dense GPS network on the TP and found a signal with a ~6-year period that could be related to the inner oscillation of the Earth. In addition, the interannual oscillations within the GPS and GRACE/GRACE-FO data during ~2–5-year periods are mainly induced by hydrologic elastic loads, which could be related to climate responses. We estimated the spatial patterns of the long-term trends in precipitation and surface air temperature, as well as their interannual variations, and found that the interannual fluctuations were coupled with climate anomalies on the TP since 2002. The transient fluctuations of GPS and GRACE/GRACE-FO modeled elastic displacements are mainly associated with anomalous variations of precipitation and temperature over TP. Overall, the geodetic-measured hydrological mass changes on the TP, including the corresponding seasonal and interannual characteristics, were also coupled with the global climate changes associated with ENSO events.

Author Contributions

Conceptualization, M.H., W.S. and Y.P.; methodology, M.H., J.J. and W.S.; data analyses and field investigation, M.H. and Y.P.; formal analysis, M.H., J.J. and W.S.; investigation, M.H., W.S. and Y.P.; writing—original draft preparation, M.H., J.J. and Y.P.; writing—review and editing, W.S. and Y.P.; visualization, M.H., J.J. and W.S.; supervision, W.S. and Y.P.; project administration, W.S. and Y.P. All authors have read and agreed to the published version of the manuscript.

Funding

The project is funded by the NSFCs (Grant Nos. 41904012, 41774024, 41974022 and 41525014), China Postdoctoral Science Foundation (2020T130482, 2018M630879), the Fundamental Research Funds for Central Universities (2042020kf0008) and LIESMARS Special Research Funding.

Institutional Review Board Statement

Not applicable.

Informed Consent Statement

Not applicable.

Data Availability Statement

The GPS data presented in this study are available on request from the corresponding author.

Acknowledgments

We are most grateful to National Key Scientific Projects “Tectonic and Environmental Observation Network of Mainland China” (CMONOC I and II) for supplying the GPS data. We thank the International GNSS Service (IGS) for providing global GPS data products, and Jet Propulsion Laboratory (JPL) for providing the GIPSY software. The authors would like to thank editors and three anonymous reviewers for the many insightful comments to improve the manuscript.

Conflicts of Interest

The authors declare no conflict of interest.

References

  1. Yao, T.; Wu, F.; Ding, L.; Sun, J.; Zhu, L.; Piao, S.; Ouyang, H. Multispherical interactions and their effects on the Tibetan Plateau’s earth system: A review of the recent researches. Natl. Sci. Rev. 2015, 2, 468–488. [Google Scholar] [CrossRef] [Green Version]
  2. Zhang, G.; Yao, T.; Xie, H.; Kang, S.; Lei, Y. Increased mass over the Tibetan Plateau: From lakes or glaciers? Geophys. Res. Lett. 2013, 40, 2125–2130. [Google Scholar] [CrossRef]
  3. Zou, D.; Zhao, L.; Sheng, Y.; Chen, J.; Hu, G.; Wu, T.; Wu, J.; Xie, C.; Wu, X.; Pang, Q.; et al. A new map of permafrost distribution on the Tibetan Plateau. Cryosphere 2017, 11, 2527–2542. [Google Scholar] [CrossRef] [Green Version]
  4. Sun, J.; Zhou, T.; Liu, M.; Chen, Y.; Shang, H.; Zhu, L.; Shedayi, A.A.; Yu, H.; Cheng, G.; Liu, G.; et al. Linkages of the dynamics of glaciers and lakes with the climate elements over the Tibetan Plateau. Earth-Sci. Rev. 2018, 185, 308–324. [Google Scholar] [CrossRef]
  5. Zhang, L.; Xia, X.; Liu, S.; Zhang, S.; Li, S.; Wang, J.; Wang, G.; Gao, H.; Zhang, Z.; Wang, Q.; et al. Significant methane ebullition from alpine permafrost rivers on the East Qinghai–Tibet Plateau. Nat. Geosci. 2020, 13, 349–354. [Google Scholar] [CrossRef]
  6. Kang, S.; Xu, Y.; You, Q.; Flügel, W.-A.; Pepin, N.; Yao, T. Review of climate and cryospheric change in the Tibetan Plateau. Environ. Res. Lett. 2010, 5, 015101. [Google Scholar] [CrossRef]
  7. Pepin, N.; Bradley, R.S.; Diaz, H.F.; Baraer, M.; Caceres, E.B.; Forsythe, N.; Fowler, H.; Greenwood, G.; Hashmi, M.Z.; Liu, X.D.; et al. Elevation-dependent warming in mountain regions of the world. Nat. Clim. Chang. 2015, 5, 424–430. [Google Scholar] [CrossRef] [Green Version]
  8. Yao, T.; Xue, Y.; Chen, D.; Chen, F.; Thompson, L.; Cui, P.; Koike, T.; Lau, W.K.-M.; Lettenmaier, D.; Mosbrugger, V.; et al. Recent Third Pole’s Rapid Warming Accompanies Cryospheric Melt and Water Cycle Intensification and Interactions between Monsoon and Environment: Multidisciplinary Approach with Observations, Modeling, and Analysis. Bull. Am. Meteorol. Soc. 2019, 100, 423–444. [Google Scholar] [CrossRef]
  9. Lei, Y.; Shi, J.; Xiong, C.; Ji, D. Tracking the atmospheric-terrestrial water cycle over the Tibetan Plateau based on ERA5 and GRACE. J. Clim. 2021, 34, 6459–6471. [Google Scholar] [CrossRef]
  10. Zhang, G.; Chen, W.; Xie, H. Tibetan Plateau’s lake level and volume changes from NASA’s ICESat/ICESat-2 and Landsat Missions. Geophys. Res. Lett. 2019, 46, 13107–13118. [Google Scholar] [CrossRef]
  11. Yang, M.; Nelson, F.E.; Shiklomanov, N.I.; Guo, D.; Wan, G. Permafrost degradation and its environmental effects on the Tibetan Plateau: A review of recent research. Earth-Sci. Rev. 2010, 103, 31–44. [Google Scholar] [CrossRef]
  12. Jacob, T.; Wahr, J.M.; Pfeffer, W.T.; Swenson, S.C. Recent contributions of glaciers and ice caps to sea level rise. Nat. Cell Biol. 2012, 482, 514–518. [Google Scholar] [CrossRef]
  13. Song, C.; Huang, B.; Richards, K.; Ke, L.; Phan, V.H. Accelerated lake expansion on the Tibetan Plateau in the 2000s: Induced by glacial melting or other processes? Water Resour. Res. 2014, 50, 3170–3186. [Google Scholar] [CrossRef] [Green Version]
  14. Ma, R.; Duan, H.; Hu, C.; Feng, X.; Li, A.; Ju, W.; Yang, G. A half-century of changes in China’s lakes: Global warming or human influence? Geophys. Res. Lett. 2010, 37. [Google Scholar] [CrossRef]
  15. Yao, T.; Thompson, L.; Yang, W.; Yu, W.; Gao, Y.; Guo, X.; Yang, X.; Duan, K.; Zhao, H.; Xu, B.; et al. Different glacier status with atmospheric circulations in Tibetan Plateau and surroundings. Nat. Clim. Chang. 2012, 2, 663–667. [Google Scholar] [CrossRef]
  16. Gardelle, J.; Berthier, E.; Arnaud, Y. Slight mass gain of Karakoram glaciers in the early twenty-first century. Nat. Geosci. 2012, 5, 322–325. [Google Scholar] [CrossRef]
  17. Gardner, A.; Moholdt, G.; Cogley, J.G.; Wouters, B.; Arendt, A.; Wahr, J.; Berthier, E.; Hock, R.; Pfeffer, W.T.; Kaser, G.; et al. A Reconciled Estimate of Glacier Contributions to Sea Level Rise: 2003 to 2009. Science 2013, 340, 852–857. [Google Scholar] [CrossRef] [PubMed] [Green Version]
  18. Matsuo, K.; Heki, K. Time-variable ice loss in Asian high mountains from satellite gravimetry. Earth Planet. Sci. Lett. 2010, 290, 30–36. [Google Scholar] [CrossRef]
  19. Yi, S.; Sun, W. Evaluation of glacier changes in high-mountain Asia based on 10 year GRACE RL05 models. J. Geophys. Res. Solid Earth 2014, 119, 2504–2517. [Google Scholar] [CrossRef]
  20. Wang, Q.; Yi, S.; Sun, W. Continuous Estimates of Glacier Mass Balance in High Mountain Asia Based on ICESat-1,2 and GRACE/GRACE Follow-On Data. Geophys. Res. Lett. 2021, 48, e2020GL090954. [Google Scholar] [CrossRef]
  21. Blewitt, G.; Hammond, W.C.; Kreemer, C. Harnessing the GPS Data Explosion for Interdisciplinary Science. Eos 2018, 99, 485. [Google Scholar] [CrossRef]
  22. Mallick, R.; Lindsey, E.O.; Feng, L.; Hubbard, J.; Banerjee, P.; Hill, E.M. Active convergence of the India-Burma-Sunda plates revealed by a new continuous GPS network. J. Geophys. Res. Solid Earth 2019, 124, 3155–3171. [Google Scholar] [CrossRef]
  23. Altamimi, Z.; Rebischung, P.; Métivier, L.; Collilieux, X. ITRF2014: A new release of the International Terrestrial Reference Frame modeling nonlinear station motions. J. Geophys. Res. Solid Earth 2016, 121, 6109–6131. [Google Scholar] [CrossRef] [Green Version]
  24. Bevis, M.; Businger, S.; Chiswell, S.; Herring, T.A.; Anthes, R.A.; Rocken, C.; Ware, R.H. GPS meteorology: Mapping zenith wet delays onto precipitable water. J. Appl. Meteorol. 1994, 33, 379–386. [Google Scholar] [CrossRef]
  25. Kedar, S.; Hajj, G.A.; Wilson, B.D.; Heflin, M.B. The effect of the second order GPS ionospheric correction on receiver positions. Geophys. Res. Lett. 2003, 30. [Google Scholar] [CrossRef]
  26. McCarthy, D.D.; Petit, G. IERS Conventions (2003); International Earth Rotation and Reference Systems Service (IERS): Frankfurt am Main, Germany, 2004. [Google Scholar]
  27. Lyard, F.; Lefevre, F.; Letellier, T.; Francis, O. Modelling the global ocean tides: Modern insights from FES2004. Ocean Dyn. 2006, 56, 394–415. [Google Scholar] [CrossRef]
  28. Dill, R.; Dobslaw, H. Numerical simulations of global-scale high-resolution hydrological crustal deformations. J. Geophys. Res. Solid Earth 2013, 118, 5008–5017. [Google Scholar] [CrossRef]
  29. Tapley, B.D.; Watkins, M.M.; Flechtner, F.; Reigber, C.; Bettadpur, S.; Rodell, M.; Sasgen, I.; Famiglietti, J.S.; Landerer, F.W.; Chambers, D.P.; et al. Contributions of GRACE to understanding climate change. Nat. Clim. Chang. 2019, 9, 358–369. [Google Scholar] [CrossRef]
  30. Swenson, S.; Yeh, P.J.-F.; Wahr, J.; Famiglietti, J. A comparison of terrestrial water storage variations from GRACE with in situ measurements from Illinois. Geophys. Res. Lett. 2006, 33. [Google Scholar] [CrossRef] [Green Version]
  31. Kusche, J. Approximate decorrelation and non-isotropic smoothing of time-variable GRACE-type gravity field models. J. Geod. 2007, 81, 733–749. [Google Scholar] [CrossRef] [Green Version]
  32. Duan, X.J.; Guo, J.Y.; Shum, C.K.; van der Wal, W. On the postprocessing removal of correlated errors in GRACE temporal gravity field solutions. J. Geod. 2009, 83, 1095–1106. [Google Scholar] [CrossRef] [Green Version]
  33. Chen, J.L.; Wilson, C.R.; Li, J.; Zhang, Z. Reducing leakage error in GRACE-observed long-term ice mass change: A case study in West Antarctica. J. Geod. 2015, 89, 925–940. [Google Scholar] [CrossRef]
  34. Jiao, J.; Zhang, Y.; Bilker-Koivula, M.; Poutanen, M.; Yin, P.; Zhang, Y. Interannual glacier and lake mass changes over Scandinavia from GRACE. Geophys. J. Int. 2020, 221, 2126–2141. [Google Scholar] [CrossRef]
  35. Wang, H.; Xiang, L.; Jia, L.; Jiang, L.; Wang, Z.; Hu, B.; Gao, P. Load Love numbers and Green’s functions for elastic Earth models PREM, iasp91, ak135, and modified models with refined crustal structure from crust 2.0. Comput. Geosci. 2012, 49, 190–199. [Google Scholar] [CrossRef]
  36. Dziewonski, A.M.; Anderson, D.L. Preliminary reference Earth model. Phys. Earth Planet. Inter. 1981, 25, 297–356. [Google Scholar] [CrossRef]
  37. Schneider, U.; Becker, A.; Finger, P.; Meyer-Christoffer, A.; Rudolf, B.; Ziese, M.; Ziese, M. GPCC Monitoring Product: Near Real-Time Monthly Land-Surface Precipitation from Rain-Gauges Based on SYNOP and CLIMAT Data; Global Precipitation Climatology Centre at Deutscher Wetterdienst: Offenbach am Main, Germany, 2015; p. 10. [Google Scholar]
  38. Fan, Y.; van den Dool, H. A global monthly land surface air temperature analysis for 1948–present. J. Geophys. Res. Atmos. 2008, 113, 01103. [Google Scholar] [CrossRef]
  39. Yi, S.; Sneeuw, N. Filling the Data Gaps within GRACE Missions Using Singular Spectrum Analysis. J. Geophys. Res. Solid Earth 2021, 126, e2020JB021227. [Google Scholar] [CrossRef]
  40. Bond, G.; Kromer, B.; Beer, J.; Muscheler, R.; Evans, M.N.; Showers, W.; Hoffmann, S.; Lotti-Bond, R.; Hajdas, I.; Bonani, G. Persistent Solar Influence on North Atlantic Climate during the Holocene. Science 2001, 294, 2130–2136. [Google Scholar] [CrossRef] [Green Version]
  41. Ghil, M.; Allen, M.R.; Dettinger, M.D.; Ide, K.; Kondrashov, D.; Mann, M.E.; Robertson, A.W.; Saunders, A.; Tian, Y.; Varadi, F.; et al. Advanced spectral methods for climatic time series. Rev. Geophys. 2002, 40, 3-1–3-42. [Google Scholar] [CrossRef] [Green Version]
  42. Kondrashov, D.; Ghil, M. Spatio-temporal filling of missing points in geophysical data sets. Nonlinear Process. Geophys. 2006, 13, 151–159. [Google Scholar] [CrossRef] [Green Version]
  43. Schoellhamer, D.H. Singular spectrum analysis for time series with missing data. Geophys. Res. Lett. 2001, 28, 3187–3190. [Google Scholar] [CrossRef] [Green Version]
  44. Pan, Y.; Chen, R.; Ding, H.; Xu, X.; Zheng, G.; Shen, W.; Xiao, Y.; Li, S. Common Mode Component and Its Potential Effect on GPS-Inferred Three-Dimensional Crustal Deformations in the Eastern Tibetan Plateau. Remote Sens. 2019, 11, 1975. [Google Scholar] [CrossRef] [Green Version]
  45. Cazenave, A.; Chen, J. Time-variable gravity from space and present-day mass redistribution in the Earth system. Earth Planet. Sci. Lett. 2010, 298, 263–274. [Google Scholar] [CrossRef]
  46. Zhang, G.; Chen, W.; Li, G.; Yang, W.; Yi, S.; Luo, W. Lake water and glacier mass gains in the northwestern Tibetan Plateau observed from multi-sensor remote sensing data: Implication of an enhanced hydrological cycle. Remote Sens. Environ. 2020, 237, 111554. [Google Scholar] [CrossRef]
  47. Sha, Y.; Shi, Z.; Liu, X.; An, Z. Distinct impacts of the Mongolian and Tibetan Plateaus on the evolution of the East Asian monsoon. J. Geophys. Res. Atmos. 2015, 120, 4764–4782. [Google Scholar] [CrossRef]
  48. Argus, D.F.; Ratliff, B.; DeMets, C.; Borsa, A.A.; Wiese, D.N.; Blewitt, G.; Crowley, J.W.; Martens, H.R.; Kreemer, C.; Landerer, F.W. Rise of Great Lakes Surface Water, Sinking of the Upper Midwest of the United States, and Viscous Collapse of the Forebulge of the Former Laurentide Ice Sheet. J. Geophys. Res. Solid Earth 2020, 125, e2020JB019739. [Google Scholar] [CrossRef]
  49. Sakai, A.; Fujita, K. Contrasting glacier responses to recent climate change in high-mountain Asia. Sci. Rep. 2017, 7, 13717. [Google Scholar] [CrossRef]
  50. Bhattacharya, A.; Bolch, T.; Mukherjee, K.; King, O.; Menounos, B.; Kapitsa, V.; Neckel, N.; Yang, W.; Yao, T. High Mountain Asian glacier response to climate revealed by multi-temporal satellite observations since the 1960s. Nat. Commun. 2021, 12, 4133. [Google Scholar] [CrossRef]
  51. Zhang, G.; Yao, T.; Xie, H.; Yang, K.; Zhu, L.; Shum, C.K.; Bolch, T.; Yi, S.; Allen, S.; Jiang, L.; et al. Response of Tibetan Plateau’s lakes to climate changes: Trend, pattern, and mechanisms. Earth-Sci. Rev. 2020, 208, 103269. [Google Scholar] [CrossRef]
  52. Yi, S.; Song, C.; Heki, K.; Kang, S.; Wang, Q.; Chang, L. Satellite-observed monthly glacier and snow mass changes in southeast Tibet: Implication for substantial meltwater contribution to the Brahmaputra. Cryosphere 2020, 14, 2267–2281. [Google Scholar] [CrossRef]
  53. Wang, Q.; Yi, S.; Chang, L.; Sun, W. Large-Scale Seasonal Changes in Glacier Thickness Across High Mountain Asia. Geophys. Res. Lett. 2017, 44, 10427–10435. [Google Scholar] [CrossRef]
  54. Chen, X.; Long, D.; Hong, Y.; Zeng, C.; Yan, D. Improved modeling of snow and glacier melting by a progressive two-stage calibration strategy with GRACE and multisource data: How snow and glacier meltwater contributes to the runoff of the U pper B rahmaputra R iver basin? Water Resour. Res. 2017, 53, 2431–2466. [Google Scholar] [CrossRef]
  55. Yang, Y.; Long, D.; Guan, H.; Scanlon, B.R.; Simmons, C.T.; Jiang, L.; Xu, X. GRACE satellite observed hydrological controls on interannual and seasonal variability in surface greenness over mainland Australia. J. Geophys. Res. Biogeosci. 2014, 119, 2245–2260. [Google Scholar] [CrossRef]
  56. Zhang, G.; Yao, T.; Shum, C.K.; Yi, S.; Yang, K.; Xie, H.; Yu, J. Lake volume and groundwater storage variations in Tibetan Plateau’s endorheic basin. Geophys. Res. Lett. 2017, 44, 5550–5560. [Google Scholar] [CrossRef]
  57. Deng, H.; Pepin, N.C.; Liu, Q.; Chen, Y. Understanding the spatial differences in terrestrial water storage variations in the Tibetan Plateau from 2002 to 2016. Clim. Chang. 2018, 151, 379–393. [Google Scholar] [CrossRef] [Green Version]
  58. Bibi, S.; Wang, L.; Li, X.; Zhou, J.; Chen, D.; Yao, T. Climatic and associated cryospheric, biospheric, and hydrological changes on the Tibetan Plateau: A review. Int. J. Clim. 2018, 38, e1–e17. [Google Scholar] [CrossRef] [Green Version]
  59. Medina, C.E.; Enri, J.G.; Alonso, J.J.; Villares, P. Water level fluctuations derived from ENVISAT Radar Altimeter (RA-2) and in-situ measurements in a subtropical waterbody: Lake Izabal (Guatemala). Remote Sens. Environ. 2008, 112, 3604–3617. [Google Scholar] [CrossRef]
  60. Song, C.; Huang, B.; Ke, L. Modeling and analysis of lake water storage changes on the Tibetan Plateau using multi-mission satellite data. Remote Sens. Environ. 2013, 135, 25–35. [Google Scholar] [CrossRef]
  61. Adusumilli, S.; Borsa, A.A.; Fish, M.A.; McMillan, H.K.; Silverii, F. A Decade of Water Storage Changes Across the Contiguous United States from GPS and Satellite Gravity. Geophys. Res. Lett. 2019, 46, 13006–13015. [Google Scholar] [CrossRef]
  62. Ding, H. Attenuation and excitation of the ∼6 year oscillation in the length-of-day variation. Earth Planet. Sci. Lett. 2019, 507, 131–139. [Google Scholar] [CrossRef]
  63. Ding, H.; Xu, X.; Pan, Y.; Jiang, W.; Van Dam, T. A time-varying 3-D displacement model of the ~5.9-year westward motion and its applications for the global navigation satellite system positions and velocities. J. Geophys. Res. Solid Earth 2020, 125, e2019JB018804. [Google Scholar] [CrossRef]
Figure 1. The research frame of the hydrological interannual fluctuation on the Tibetan Plateau (TP) in this study. AN denotes the atmospheric and nontidal ocean loads.
Remotesensing 13 04277 g001
Figure 2. The distribution of the continuous GPS sites in the Tibetan Plateau (TP) and surroundings. The blue squares denote the CGPS from Crustal Movement Observation Network of China (CMONOC I and II), and red squares denote CGPS from Nevada Geodetic Laboratory (NGL), USA, via web server of http://geodesy.unr.edu/ (last access on 21 October 2021), and green squares are CGPS from Myanmar-India-Bangladesh-Bhutan (MIBB) GPS network at ftp://datacollection.earthobservatory.sg/ (last access on 21 October 2021). The dashed pink and black curves are focus areas in this study.
Remotesensing 13 04277 g002
Figure 3. The long-term trend of TWS (in cm/year of equivalent water height) in the TP over the period of April 2002–December 2020. (a,b) are the mascon solutions from CSR and JPL, respectively. (c) is the SHCs constrained TWS using the forward model.
Remotesensing 13 04277 g003
Figure 4. The GRACE/GRACE-FO derived seasonal mass changes of TWS over the TP. (a,b) are the CSR mascon-derived annual amplitude and its phase of TWS. (c,d) are the JPL mascon-derived annual cycle and its phase of TWS. (e,f) are the CSR-SHC-derived annual cycle and its corresponding phase of TWS.
Remotesensing 13 04277 g004
Figure 5. (a) The averaged time series of TWS over TP spanning 2002–2020 and its filtered >0.5 cpy. (b) The mean annual cycle of original and SSA-based TWS. (c) The Fourier amplitude spectra of GRACE/GFO solutions.
Remotesensing 13 04277 g005
Figure 6. (a,b) are the wavelet time-frequency of original and SSA-based TWS, respectively.
Remotesensing 13 04277 g006
Figure 7. The gray lines denote the detrended daily GPS vertical displacement observations, and the green lines are the corresponding GPS observations with monthly averaging. The red lines are the monthly de-trended GRACE mass loading deformation. The locations of the five GPS time series are marked in Figure 2.
Remotesensing 13 04277 g007
Figure 8. The colored squares denote the Pearson correlation coefficients that reflect the consistencies of the monthly GPS-observed coordinate displacement and corresponding GRACE/GRACE-FO-derived surface mass loading.
Remotesensing 13 04277 g008
Figure 9. Spatial patterns of the scaled principal components (PCs) in the TP. Symbols represent positive responses to the scaled PC. (a) is the normalized spatial eigenvectors from PC1 on the vertical component. (b) Time series of the common mode components of scaled PC1. (c) Spectrum analysis of PC1.
Remotesensing 13 04277 g009
Figure 10. Spatial long-term trend of precipitation based on ERA5 (a) and GPCC (b) models, and surface air temperature based on GHCN_CAMS (c) and ERA5 (d) over the TP during 2002 to 2020, respectively.
Remotesensing 13 04277 g010
Figure 11. (a) the interannual fluctuations identified by GPS-decomposed 1st PC (with ~6-year signal removed) and GRACE/GRACE-FO. (b,c) are the annual and interannual variations of precipitation and surface air temperature in TP during 2002–2020, respectively. (d) the climate index of the multivariate ENSO index (MEI version 2).
Remotesensing 13 04277 g011
Publisher’s Note: MDPI stays neutral with regard to jurisdictional claims in published maps and institutional affiliations.

