Article

A Fusion Method of Optical Image and SAR Image Based on Dense-UGAN and Gram–Schmidt Transformation

1
College of Electronic and Information Engineering, Nanjing University of Aeronautics and Astronautics, Nanjing 210016, China
2
Department of Electronic and Computer Engineering, University of Calgary, Calgary, AB T2P 2M5, Canada
3
Nanjing Research Institute of Electronics Engineering, Nanjing 210007, China
*
Author to whom correspondence should be addressed.
Remote Sens. 2021, 13(21), 4274; https://doi.org/10.3390/rs13214274
Submission received: 23 September 2021 / Revised: 18 October 2021 / Accepted: 22 October 2021 / Published: 24 October 2021

Abstract

:
To solve the problems such as obvious speckle noise and serious spectral distortion when existing fusion methods are applied to the fusion of optical and SAR images, this paper proposes a fusion method for optical and SAR images based on Dense-UGAN and Gram–Schmidt transformation. Firstly, dense connection with U-shaped network (Dense-UGAN) are used in GAN generator to deepen the network structure and obtain deeper source image information. Secondly, according to the particularity of SAR imaging mechanism, SGLCM loss for preserving SAR texture features and PSNR loss for reducing SAR speckle noise are introduced into the generator loss function. Meanwhile in order to keep more SAR image structure, SSIM loss is introduced to discriminator loss function to make the generated image retain more spatial features. In this way, the generated high-resolution image has both optical contour characteristics and SAR texture characteristics. Finally, the GS transformation of optical and generated image retains the necessary spectral properties. Experimental results show that the proposed method can well preserve the spectral information of optical images and texture information of SAR images, and also reduce the generation of speckle noise at the same time. The metrics are superior to other algorithms that currently perform well.

Graphical Abstract

1. Introduction

With the development of remote sensing imaging technology, the advantages of various remote sensing images, such as resolution and readability, have been greatly improved. However, images from a single source will inevitably encounter problems such as single imaging mode and narrow applicable scenes, which are difficult to be well utilized [1]. The Synthetic Aperture Radar (SAR) is an active side-looking radar system [2] which has high spatial resolution, can image all day and all weather, and is sensitive to target ground objects, especially land, water, buildings, etc. The SAR images contain rich texture characteristics and detailed information [3]. Optical depends on the reflection imaging of sunlight on the surface of ground objects, which can directly reflect the spectral information and contour features, and has excellent visual effects. Therefore, fused optical and SAR images can obtain their effective information, so as to accurately depict the scene and display the ground features from multiple angles. It has important applications in military reconnaissance and target detection [4].
At present, the fusion method of optical and SAR image can be roughly classified into two categories: transform domain method and spatial domain method [5]. Transform domain method is an image fusion method based on the traditional multi-scale transformation theory. Firstly, the source image was decomposed and then the decomposed sub-images were fused with appropriate fusion rules; finally, the sub-images were reconstructed to obtain the final fused image. Common methods include wavelet [6], Contourlet [7], and NSCT transform [8], etc. The spatial domain method is to regard the whole image or part of it as the image’s own characteristics, and then merge it with the rules, finally reconstructing the fused image [9]. Common methods include IHS, principal component analysis (PCA), and B r o v e y transform [10]. However, these traditional methods have high requirements for the design of fusion rules, which are difficult to adapt to the characteristics of different source images, and the calculation time is relatively long.
In recent years, with the development of deep learning, its powerful image feature extraction capabilities have attracted wide attention from researchers. Among them, the generative adversarial network (GAN), because it can generate clearer images, stands out in the depth model, and is gradually applied to the field of image processing. For example, Li proposed a learning deep semantic segmentation network under multiple weak supervision constraints to achieve cross-domain semantic segmentation of remote sensing images [11], which solves the problems of less labeled data and severe similarities between test data and training data. Bilel uses generative adversarial networks (GAN) to perform unsupervised adaptation to the semantic segmentation of aerial images, reducing the impact of domain transfer [12]; Liu proposed a multi-focus image fusion method based on deep convolutional neural networks [13]; Ma applied generated adversarial network (GAN) to fuse the infrared and optical images, which achieved good fusion results [14]. However, the above-mentioned GAN-based methods are effective for other types of source images, but are not obvious enough for SAR remote sensing images. Additionally, in practical applications, most existing remote sensing image fusion methods based on deep learning need to learn from a large number of sample sets with labeled images, and the acquisition of labeled images is a major difficulty, which limits its application to a certain extent.
To solve the above problems, this paper proposes a semi-supervised remote sensing image fusion method based on improved generative adversarial network and Gram–Schmidt transform [15]. Among them, in terms of GAN network structure, the generator network adopts the combination of dense connection [16] and U-shaped network [17] to deepen the depth of the network and obtain deeper source image information. Moreover, feature reuse is used to improve the performance and potential of the network. Thus produce a compression model that is easy to train and has high parameter efficiency. In terms of GAN loss function, we introduce SGLCM and PSNR loss into the generator, and introduce SSIM loss into the discriminator to generate a fused image with rich details. In the experiment, firstly, the registered optical and SAR image pairs in the source domain are connected in the channel dimension, and then the cascaded images are input into the generator of the Dense-UGAN to obtain feature information, the output of the generator is the generated image. After that, we input the generated image, optical image and SAR image into the discriminator (the purpose is to distinguish the generated image from the label image), through the confrontation game between the generator and the discriminator, the generated image contains more and more useful information. Finally, when the network reaches the maximum number of training times, we only need to supply the cascade images of optical and SAR to the trained generator, and perform GS transformation between the output images and optical images [18], the final fusion result can be obtained.

2. Background

2.1. GAN

In 2014, Goodfellow et al. [19] proposed a confrontational generation model based on two-person zero-sum game. The original GANs consists of two parts: generator G and discriminator D . The generator is used to capture the distributed data and describe how the data is generated. The discriminator is used to distinguish the data generated by the generator from the real data. The model is widely used in image generation, style transfer, data enhancement and other fields. In this network, the input of the generator is random noise z , after being processed by the generator, the output data G ( z ) is input into the discriminator D for judgment, and D will output a true or false judgment result, namely D ( G ( z ) ) , which is used to indicate the probability that G ( z ) is close to real data. When the output probability is close to 1, it means that the generated data G ( z ) is close to real data. Otherwise, G ( z ) is false data. Therefore, in the training process, the goal of the generator is to generate as close to the real data as possible, while the discriminator is as accurate as possible to discriminate that the data generated by the generator is a fake data. The generator and the discriminator constantly play games. When the data generated by the generator can be “faked”, that is, it cannot be discriminated by the discriminator, the network reaches “Nash equilibrium“. Among them, the target loss function can be expressed as:
min G max D V ( G , D ) = E x ~ P d a t a [ log D ( x ) ] + E z ~ P z [ log ( 1 D ( G ( z ) ) ) ] = E x ~ P d a t a [ log D ( x ) ] + E x ~ P g [ log ( 1 D ( x ) ) ]
where E ( · ) represents the mathematical expectation of the distribution function; P d a t a represents the distribution of real data; z represents random noise, that is, the input of generator G ; P z represents the distribution of random noise z ; P g represents the data distribution generated by the generator; G represents the generator; D stands for discriminator.

2.2. Gram–Schmidt (GS) Transformation
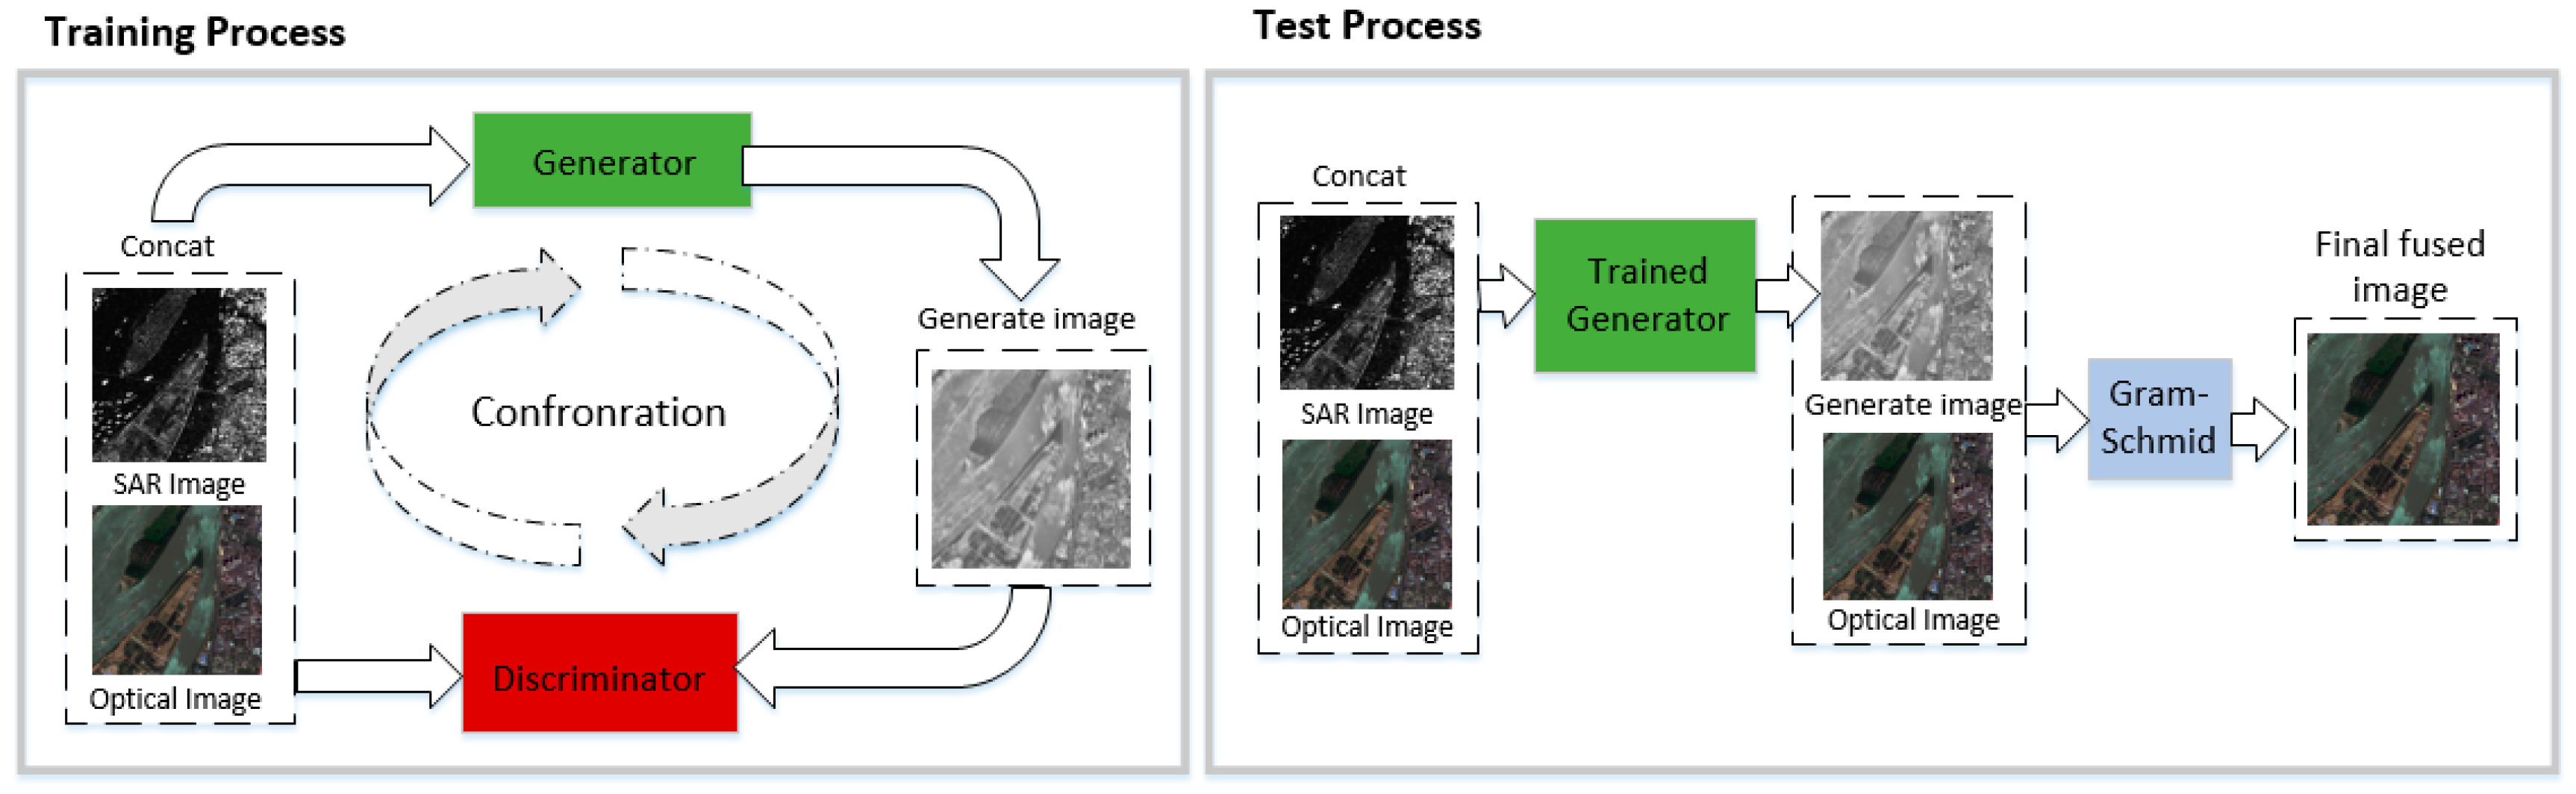
GS transform is a common method in linear algebra and multivariate statistics. It eliminates redundant information by orthogonalizing matrix or multidimensional images, which is similar to PCA transform. Figure 1 is the flow chart of GS fusion. The method first calculates the multi-spectral bands according to a certain weight to obtain a gray image, which is regarded as G S 1 [20]. Additionally, then using G S 1 to perform GS positive transformation with multi-spectral bands. Next, calculating the mean and standard deviation of G S 1 and the generated image, respectively, perform histogram matching on the generated image to simulate G S 1 [18]. Finally, the matched generated image is used to replace G S 1 for GS inverse transformation, and the fused image is obtained.

3. Methods

3.1. Overall Structure

The Dense-UGAN network structure proposed in this paper includes a generator and a discriminator. When training the network, supply the registered optical and SAR images into the generation network in the form of one image with multiple channels. Then, introduce the generated single image and label image (optical image and SAR image) into discrimination model to complete the two-classification task. Finally, the high-quality generated image is output. After the network training is completed, we only need to import the registered optical and SAR cascade images into the trained generator, and then perform GS transformation on the output images and optical images to obtain the final fusion result. Figure 2 is the framework of proposed fusion method.

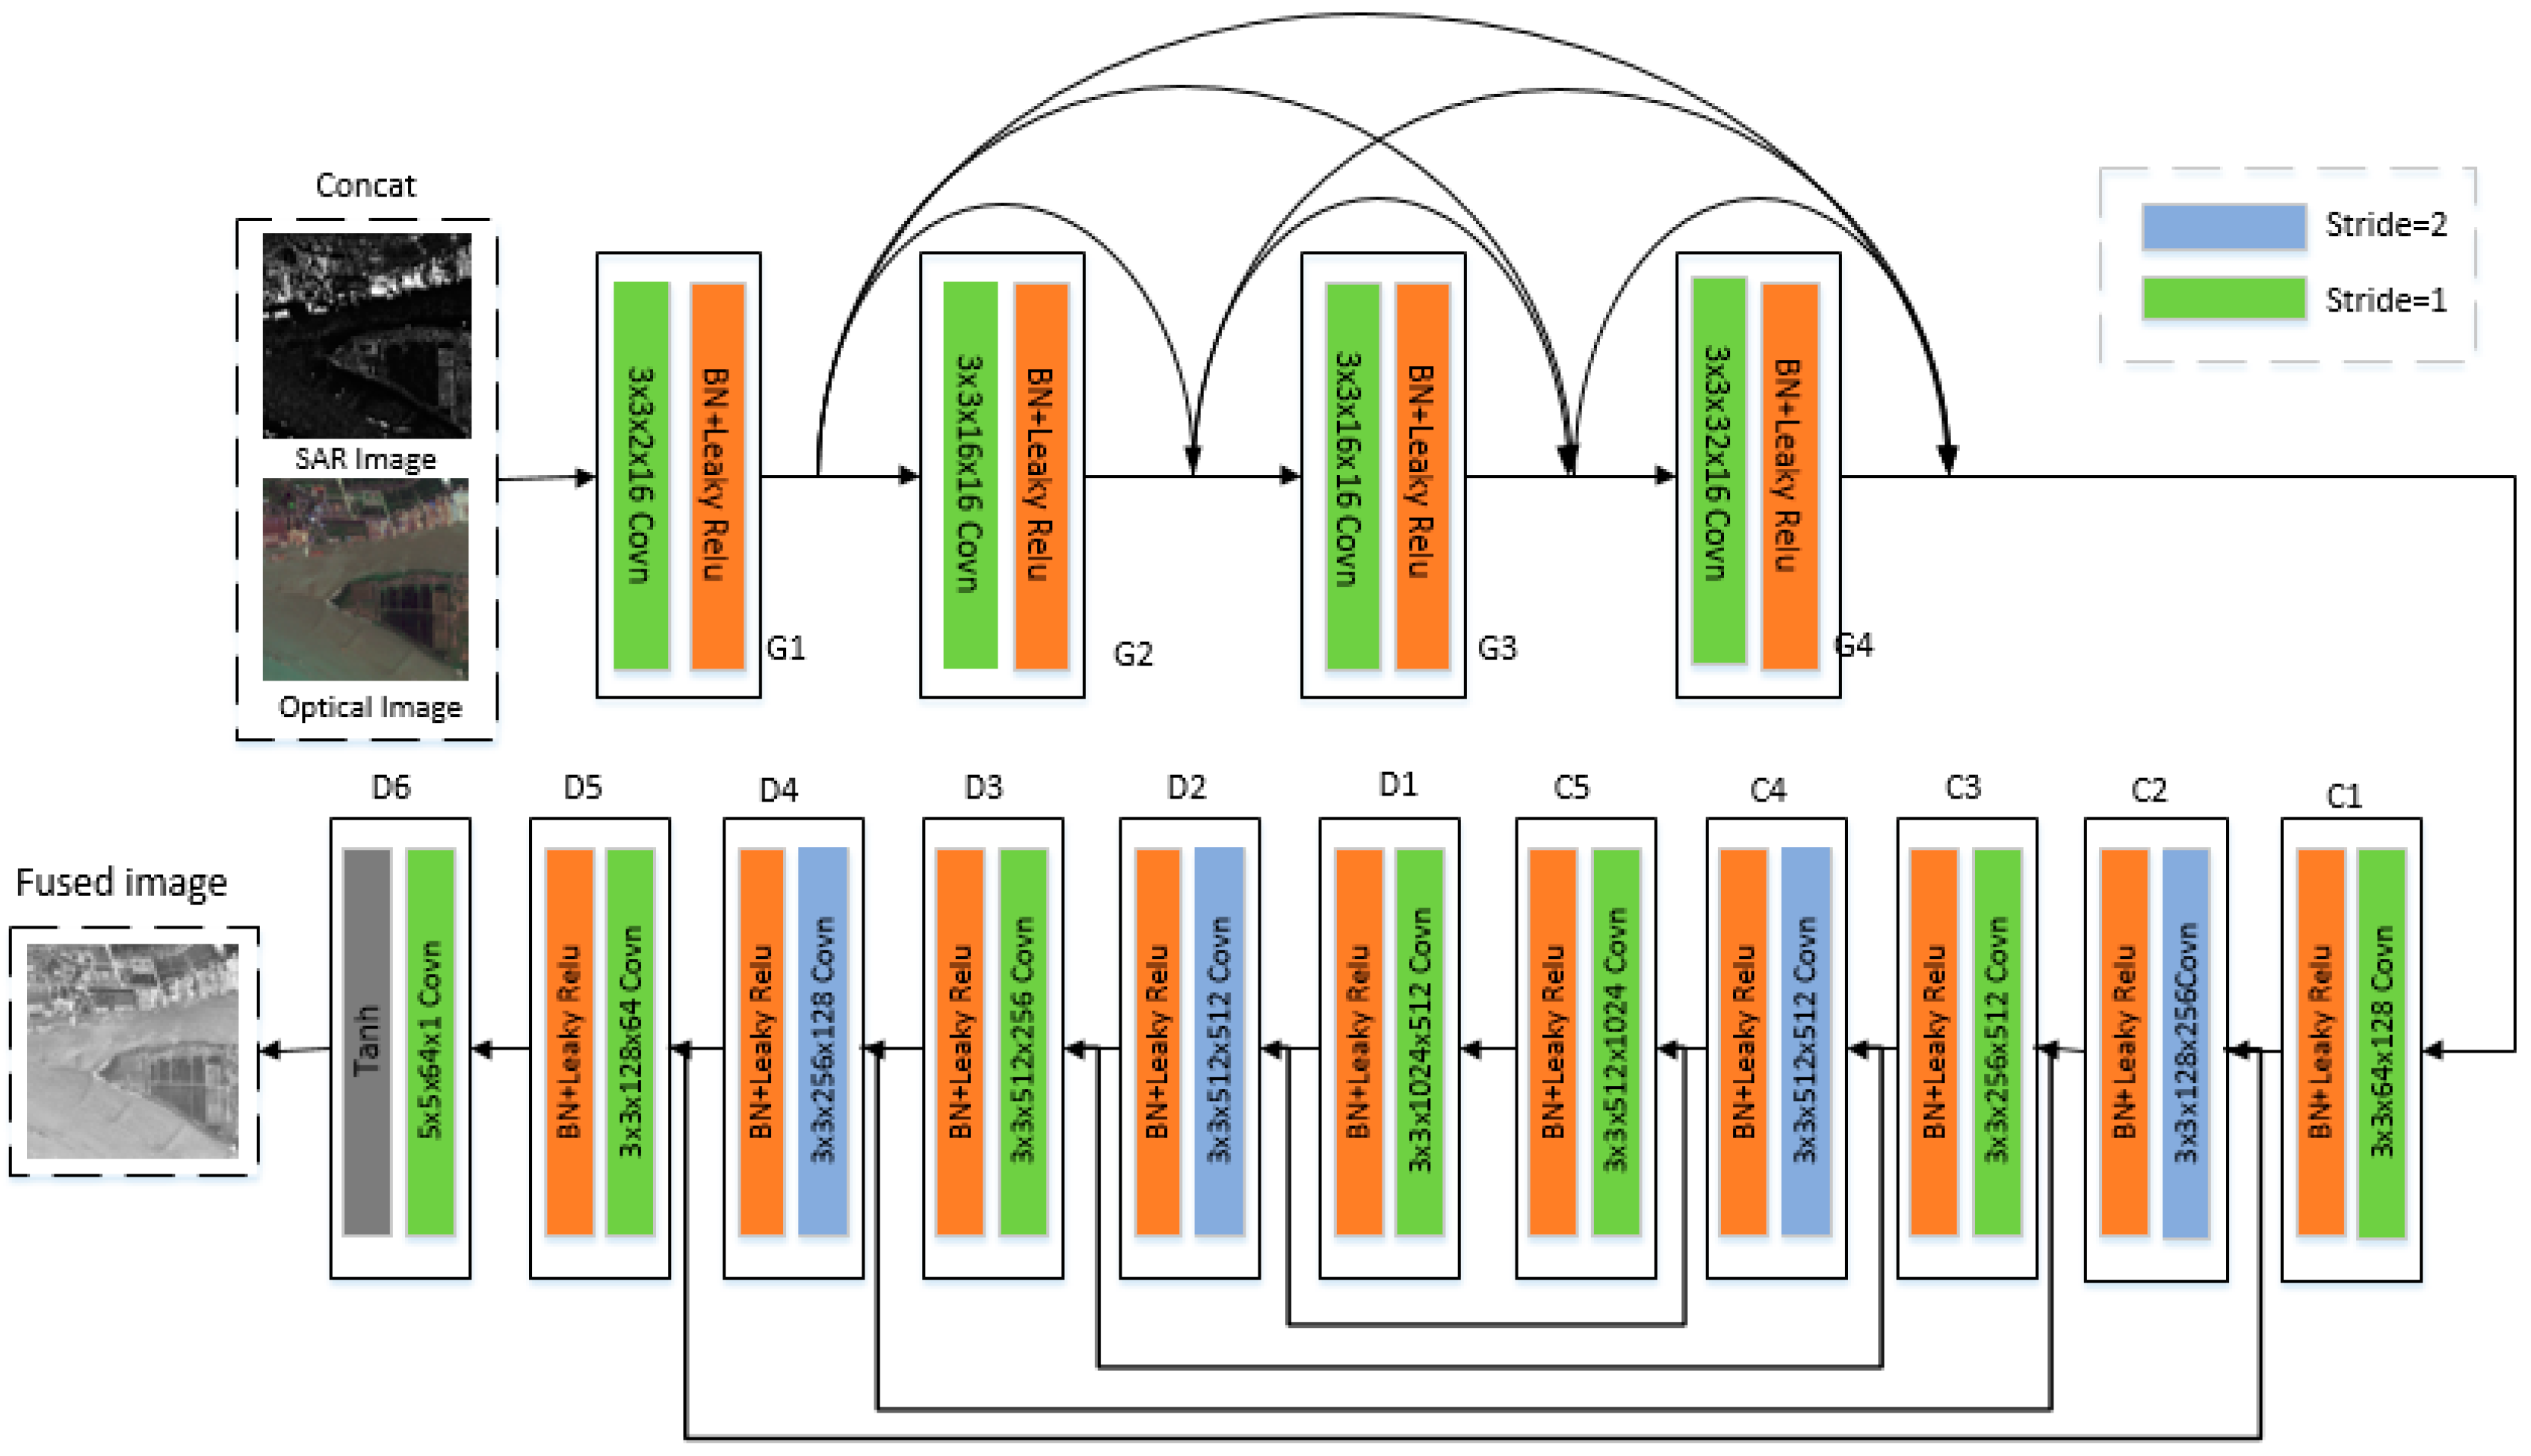
3.2. Network Architecture of Generator

The purpose of the generator is to extract more and deeper image features to generate a new fused image. However, the traditional convolution network or fully connected network will inevitably have problems such as information loss and wastage when transmitting information. At the same time, when there are too many layers, problems such as gradient disappearance or gradient explosion will occur, resulting in the network being unable to train. Therefore, based on the traditional GAN model, this paper uses the combination of dense connection and U-shaped network to reconstruct the generator network structure. As shown in Figure 3, it can be seen that the generator is composed of dense connection network modules mainly composed of four convolution layers and U-shaped network modules mainly composed of six convolution layers with five deconvolution layers. The dense connection network establishes a cross-layer connection between the front convolution layer and the back layer, which improves the network performance and potential through feature reuse, generates a compression model with easy training and high parameter efficiency, mines deep features efficiently. In the U-shaped network module, set the kernel sliding step size of C2 and C4 convolutional layers to 2, so as to realize the downsampling of the input, and at the same time, the size of the feature graph is correspondingly halved. In the decoding process, used two deconvolution modules to upsample and recover the feature image. In addition, the U-shaped network in this paper uses 6 convolution layers with step length of 1 and 4 convolution layers with step length of 2 alternately, which reduces the compression degree of the feature graph and preserves the feature completeness of the supplied image.
Each convolution layer and deconvolution layer in the generator has a BatchNorm layer [21] and the activation function LeakyRelu [22]. The last layer of the deconvolution layer uses Tanh as the activation function to normalize the results to the interval of (-1,1), thus realizing the output normalization.
For the feature map obtained from each layer in the U-shaped network decoder, we used skip connection, which is equivalent to sequentially introducing the feature maps of the original images with the same resolution and containing intuitive low-level semantic information during the upsampling process. The feature map is superimposed with the feature map obtained by upsampling and then convolved to perform cross-channel information integration, which can help the decoder part of the network recover the image information with the lowest cost.

3.3. Network Architecture of Discriminator

The purpose of the discriminator is to distinguish whether the target image is an image generated by the generator or a real image, and then classify the target image by feature extraction. Its network structure is shown in Figure 4. It can be seen that the discriminator is a 5-layer convolutional neural network, which is a 3×3 filter from the first layer to the fourth layer, and the stride is set to 2. The first four layers all use BatchNorm to normalize the data, and use LeakyRelu as the activation function. The last layer is a linear layer for classification.

3.4. Loss Function

Loss function can be used to measure the gap between network output results and data labels. The loss function in this method consists of two parts: the loss function L G of the generator and the loss function L D of the discriminator; the ultimate goal is to minimize the loss function and obtain the best training model.

3.4.1. Generator Loss Function

In the fusion process of optical and SAR images, it is desirable to preserve the contour information of optical and the texture details of SAR images. Therefore, the loss function of the generator is mainly considered in four parts, which can be expressed as:
L G = L G A N ( G ) + λ L L 1 ( G ) + μ L S G L C M ( G ) + η L P S N R ( G )
In which L G A N ( G ) is the adversarial loss, L L 1 ( G ) is the content loss, L S G L C M ( G ) is the texture feature loss, and L P S N R ( G ) is the peak signal-to-noise ratio loss, which will be described in detail below. λ, μ, and η are the weight coefficient for balancing the four loss functions.
  • Adversarial loss
L G A N ( G ) is the adversarial loss between the generator and the discriminator, which can be expressed as:
L G A N ( G ) = 1 N n 1 N ( D θ d ( I f ) c ) 2
In which I f represents the generated image, N represents the number of fused images, D θ d ( I f ) represents the result of classification, and c is the value that the generator wants the discriminator to believe for fake data.
  • Content loss
The luminance information of optical image is characterized by its pixel intensity, while the texture detail information of the SAR image can be partially characterized by gradient. Therefore, in order to obtain a fused image with similar intensity of optical image and similar gradient of the SAR image, we can use   L L 1 ( G ) to express the content loss of the image in the generation process.
L L 1 ( G ) = 1 H W ( I f I v F 2 + ξ I f I s F 2 )
where H and W represent the height and width of the input image, respectively, · F represents the F r o b e n i u s norm of the matrix, representing the gradient operator and ξ controlling the weight between the two items [12].
  • Texture feature loss
SAR images do not contain spectral color information, so texture feature analysis is particularly important. Texture essence of SAR image is a phenomenon that specific gray level appears repeatedly in spatial position. The gray level correlation between two pixels at a certain distance in image space represents the correlation characteristics of image texture. The gray level co-occurrence matrix is defined as the joint distribution probability of pixel pairs, which reflects the relevant indexes of the image by counting the frequency distribution of two gray levels in the specified spatial distribution. It not only reflects the comprehensive information of image gray level in adjacent direction, adjacent interval and change amplitude, but also reflects the position distribution characteristics among pixels with the same gray level. It is the basis of calculating texture features. Therefore, in order to make the generated image and the supplied SAR image have similar texture features, this paper introduces the generated image and SAR image’s L 1 norm of the gray level co-occurrence matrix as a measure of texture similarity.
L S G L C M ( G ) = E P z ( Z ) [ G L C M ( I f ) G L C M ( I s ) ]
where G L C M ( · ) represents the gray level co-occurrence matrix of the image. In addition, contrast measures the distribution of matrix value and the amount of local changes in the image, reflecting the clarity of the image and the depth of the texture; energy measures the stability degree of gray-scale change of image texture, reflecting the uniform degree of image gray scale distribution and texture thickness; variance measures the local variation of image texture, reflecting the degree of dispersion between image pixel value and mean value; homogeneity measures the similarity of image gray levels in the row and column direction, reflecting the local gray correlation. Therefore, in order to make full use of the texture features of SAR images, this method mainly introduces four texture features: contrast, energy, variance and homogeneity.
  • Peak signal-to-noise ratio loss
In order to minimize the loss of texture details and edges of SAR images, it is easy to produce speckle noise when fusing optical and SAR images. The peak signal-to-noise ratio is based on the error between corresponding pixels, which can be used to measure the noise level in the image. Therefore, to make the generated image contain less noise and reduce the image distortion, this paper introduces the loss of peak signal-to-noise ratio to improve the image quality. The final calculation formula is
L P S N R ( G ) = 1 N n = 1 N { 1 [ v s + v * P S N R ( I f , I v ) + s s + v * P S N R ( I f , I s ) ] }
Within,
P S N R ( x , y ) = 10 · log 10 ( M A X 2 M S E )
M S E is the mean square deviation M S E = 1 m n i = 0 m 1 j = 0 n 1 x ( i , j ) y ( i , j ) 2 , M A X represents the maximum value of image point color, and it is 255 for the 8-bit sampling point.
For the weight between P S N R ( I f , I v ) and P S N R ( I f , I s ) , we use the pixel normalization method. In this paper, the pixel points v and s in the pixel histograms of optical image and SAR image, where the area difference between the highest pixel intensity value in optical image and SAR image histogram is 0.5 (frequent and continuous). Additionally, the weight ratio between them is obtained. The specific results are shown in the following Figure 5.

3.4.2. Discriminator Loss Function

In actuality, in the absence of a discriminator, the fusion image with some information about the optical and SAR image can be obtained by using this method. However, the result is not particularly good. Therefore, in order to improve the image generated by the generator, we introduce the discriminator. Additionally, we establish a confrontation game between the generator and discriminator to adjust the generated image. Formally, the loss function of the discriminator includes two parts: one is the adversarial loss L G A N ( D ) between the generator and discriminator; the other is the structural similarity loss L S S I M ( D ) , which will be described in detail below. This can be expressed as:
L D = L G A N ( D ) + δ L S S I M ( D )
Among them, δ is the weight coefficient.
  • Adversarial loss
L G A N ( D ) = 1 N n = 1 N ( D θ d ( I v ) b ) 2 + 1 N n = 1 N ( D θ d ( I f ) a ) 2
a and b respectively represent labels of generated image I f and optical image I v , D θ d ( I f ) and D θ d ( I v ) ,   respectively , represent classification results of generated image and optical image.
  • SSIM loss
When eyes observe the image, it actually extracts the structural information of the image, not the error between image pixels [23]. The peak signal-to-noise ratio loss function is based on error sensitivity to improve image quality, and does not take into account the visual characteristics of the human eye. Structural similarity is an evaluation criterion based on structural information to measure the degree of similarity between images, which can overcome the influence of texture changes caused by light changes, and is more suitable for human subjective visual effects. By calculating the structural similarity loss between the generated image and SAR image, the generated image can retain more rich texture features of the SAR image, and generate edge details consistent with the human visual system.
L S S I M ( D ) = 1 N n = 1 N [ 1 S S I M ( I f , I s ) ]
where S S I M ( I f , I s ) represents the structural similarity (SSIM) index of image blocks in the generated image and SAR image, which can be calculated as:
S S I M ( x , y ) = ( 2 μ x μ y + C 1 ) ( 2 σ x y + C 2 ) ( μ x 2 + μ y 2 + C 1 ) ( σ x 2 + σ y 2 + C 2 )
In the formula, μ x represents the average gray level of image x , μ x = 1 N i = 1 N x i ; σ x represents the standard deviation of image x , σ x = ( 1 N 1 i = 1 N ( x i μ x ) 2 ) 1 2 ; σ x y represents the covariance between image x and image y , σ x y = 1 N 1 i = 1 N ( x i μ x ) ( y i μ y ) ; C 1 and C 2 are non-zero constants introduced to avoid the system instability when μ x 2 + μ y 2 and σ x 2 + σ y 2 are close to 0. The value range of SSIM function is [0,1]. The larger the value, the smaller the image distortion and the more similar the two images are.

4. Result

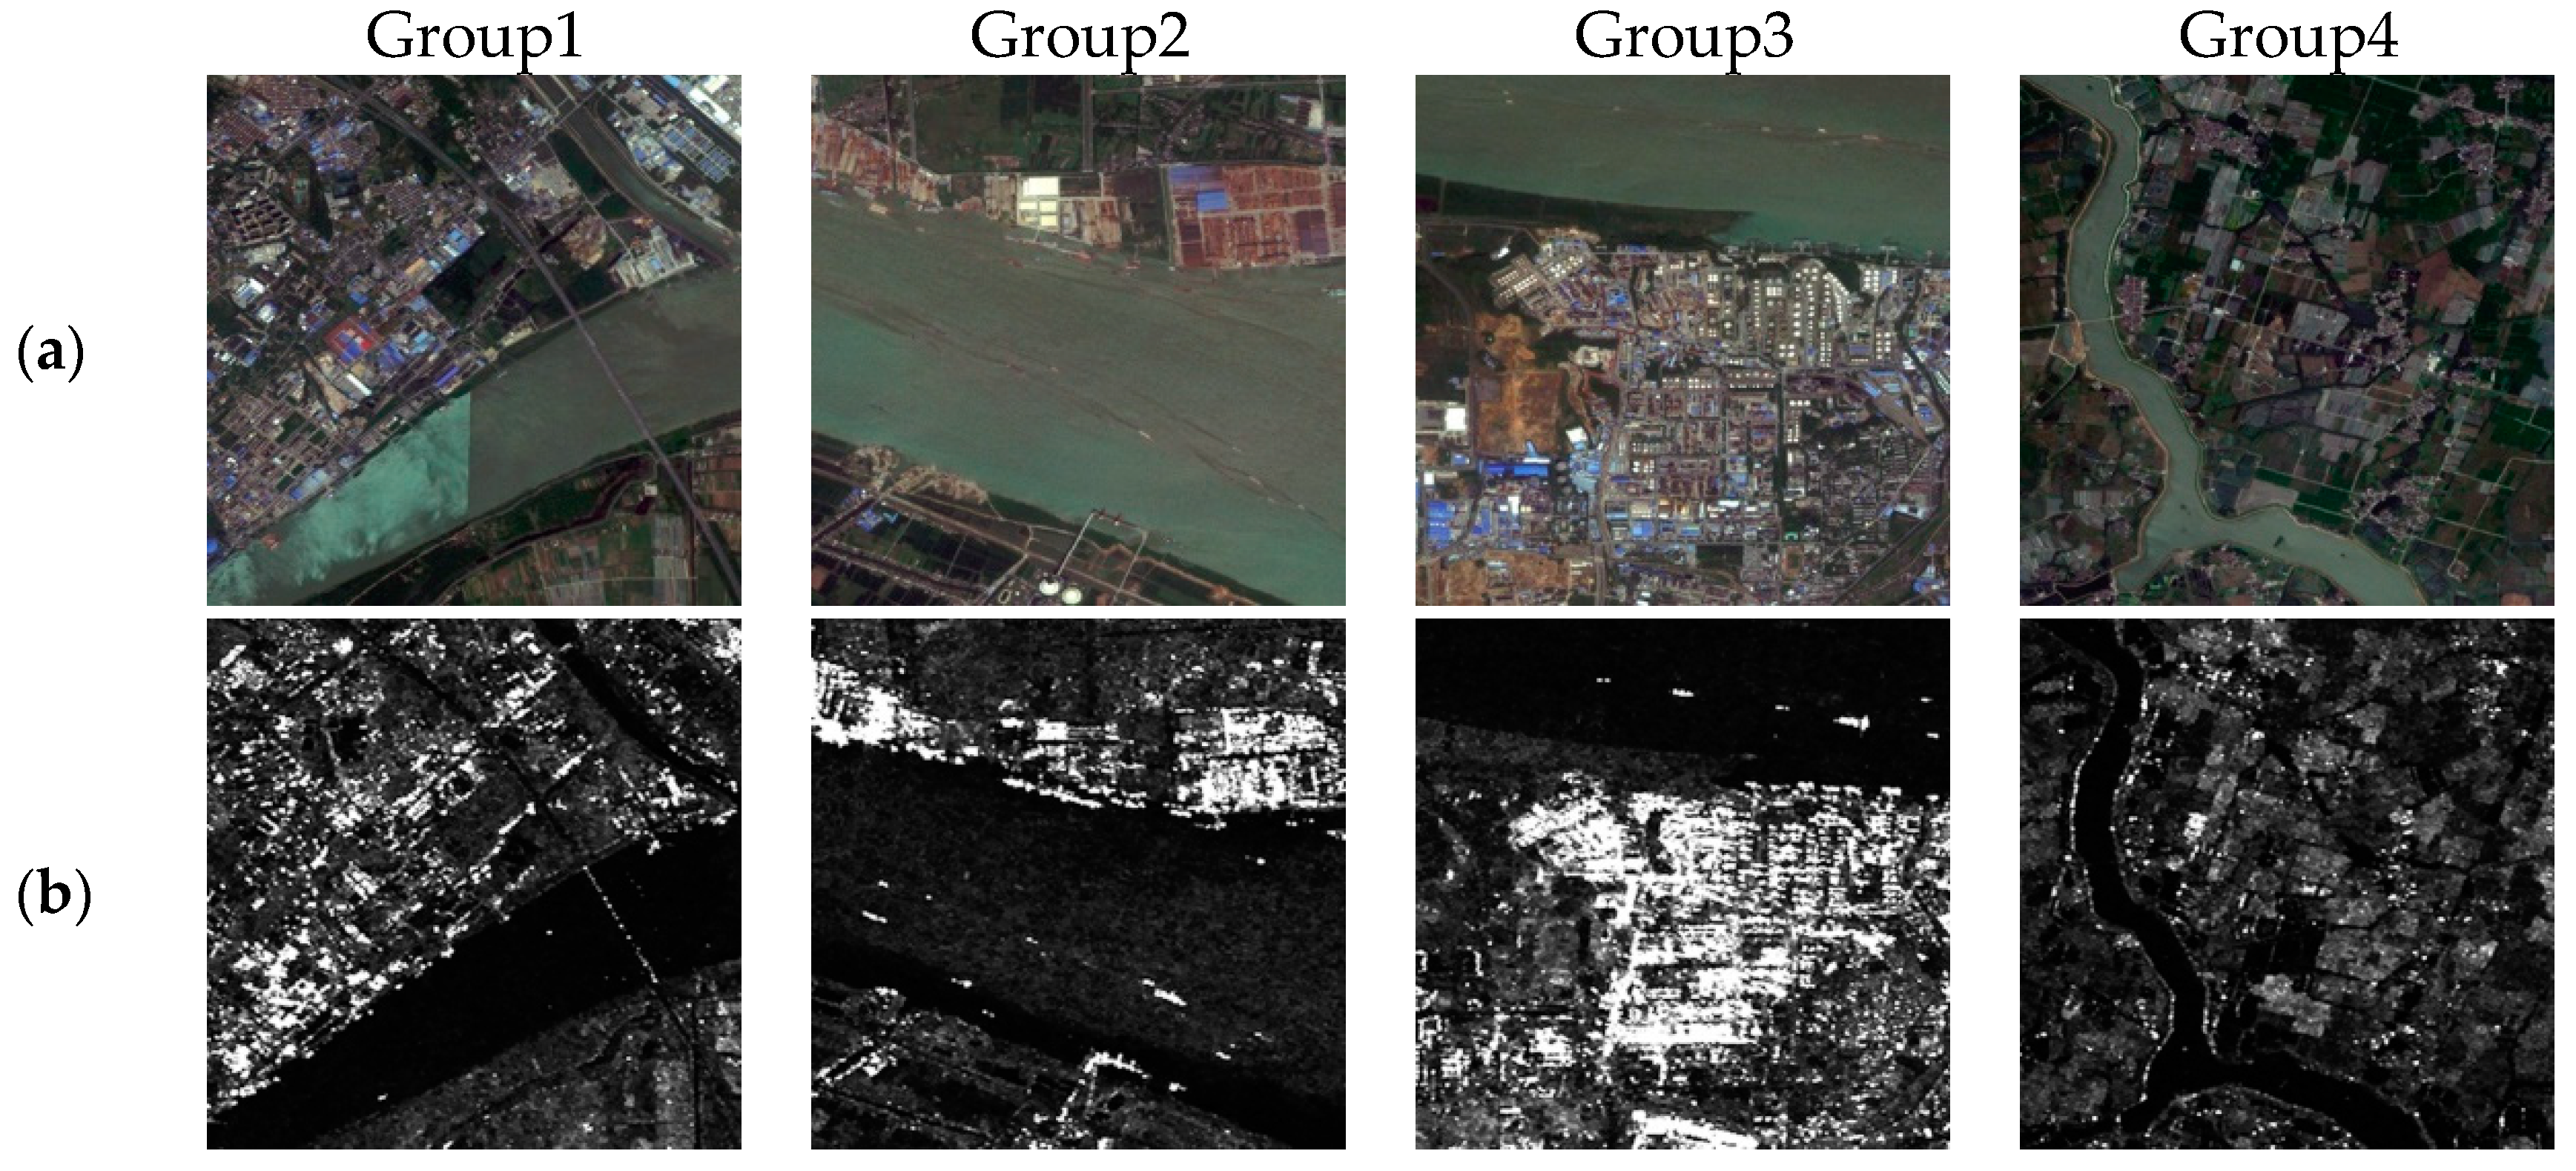
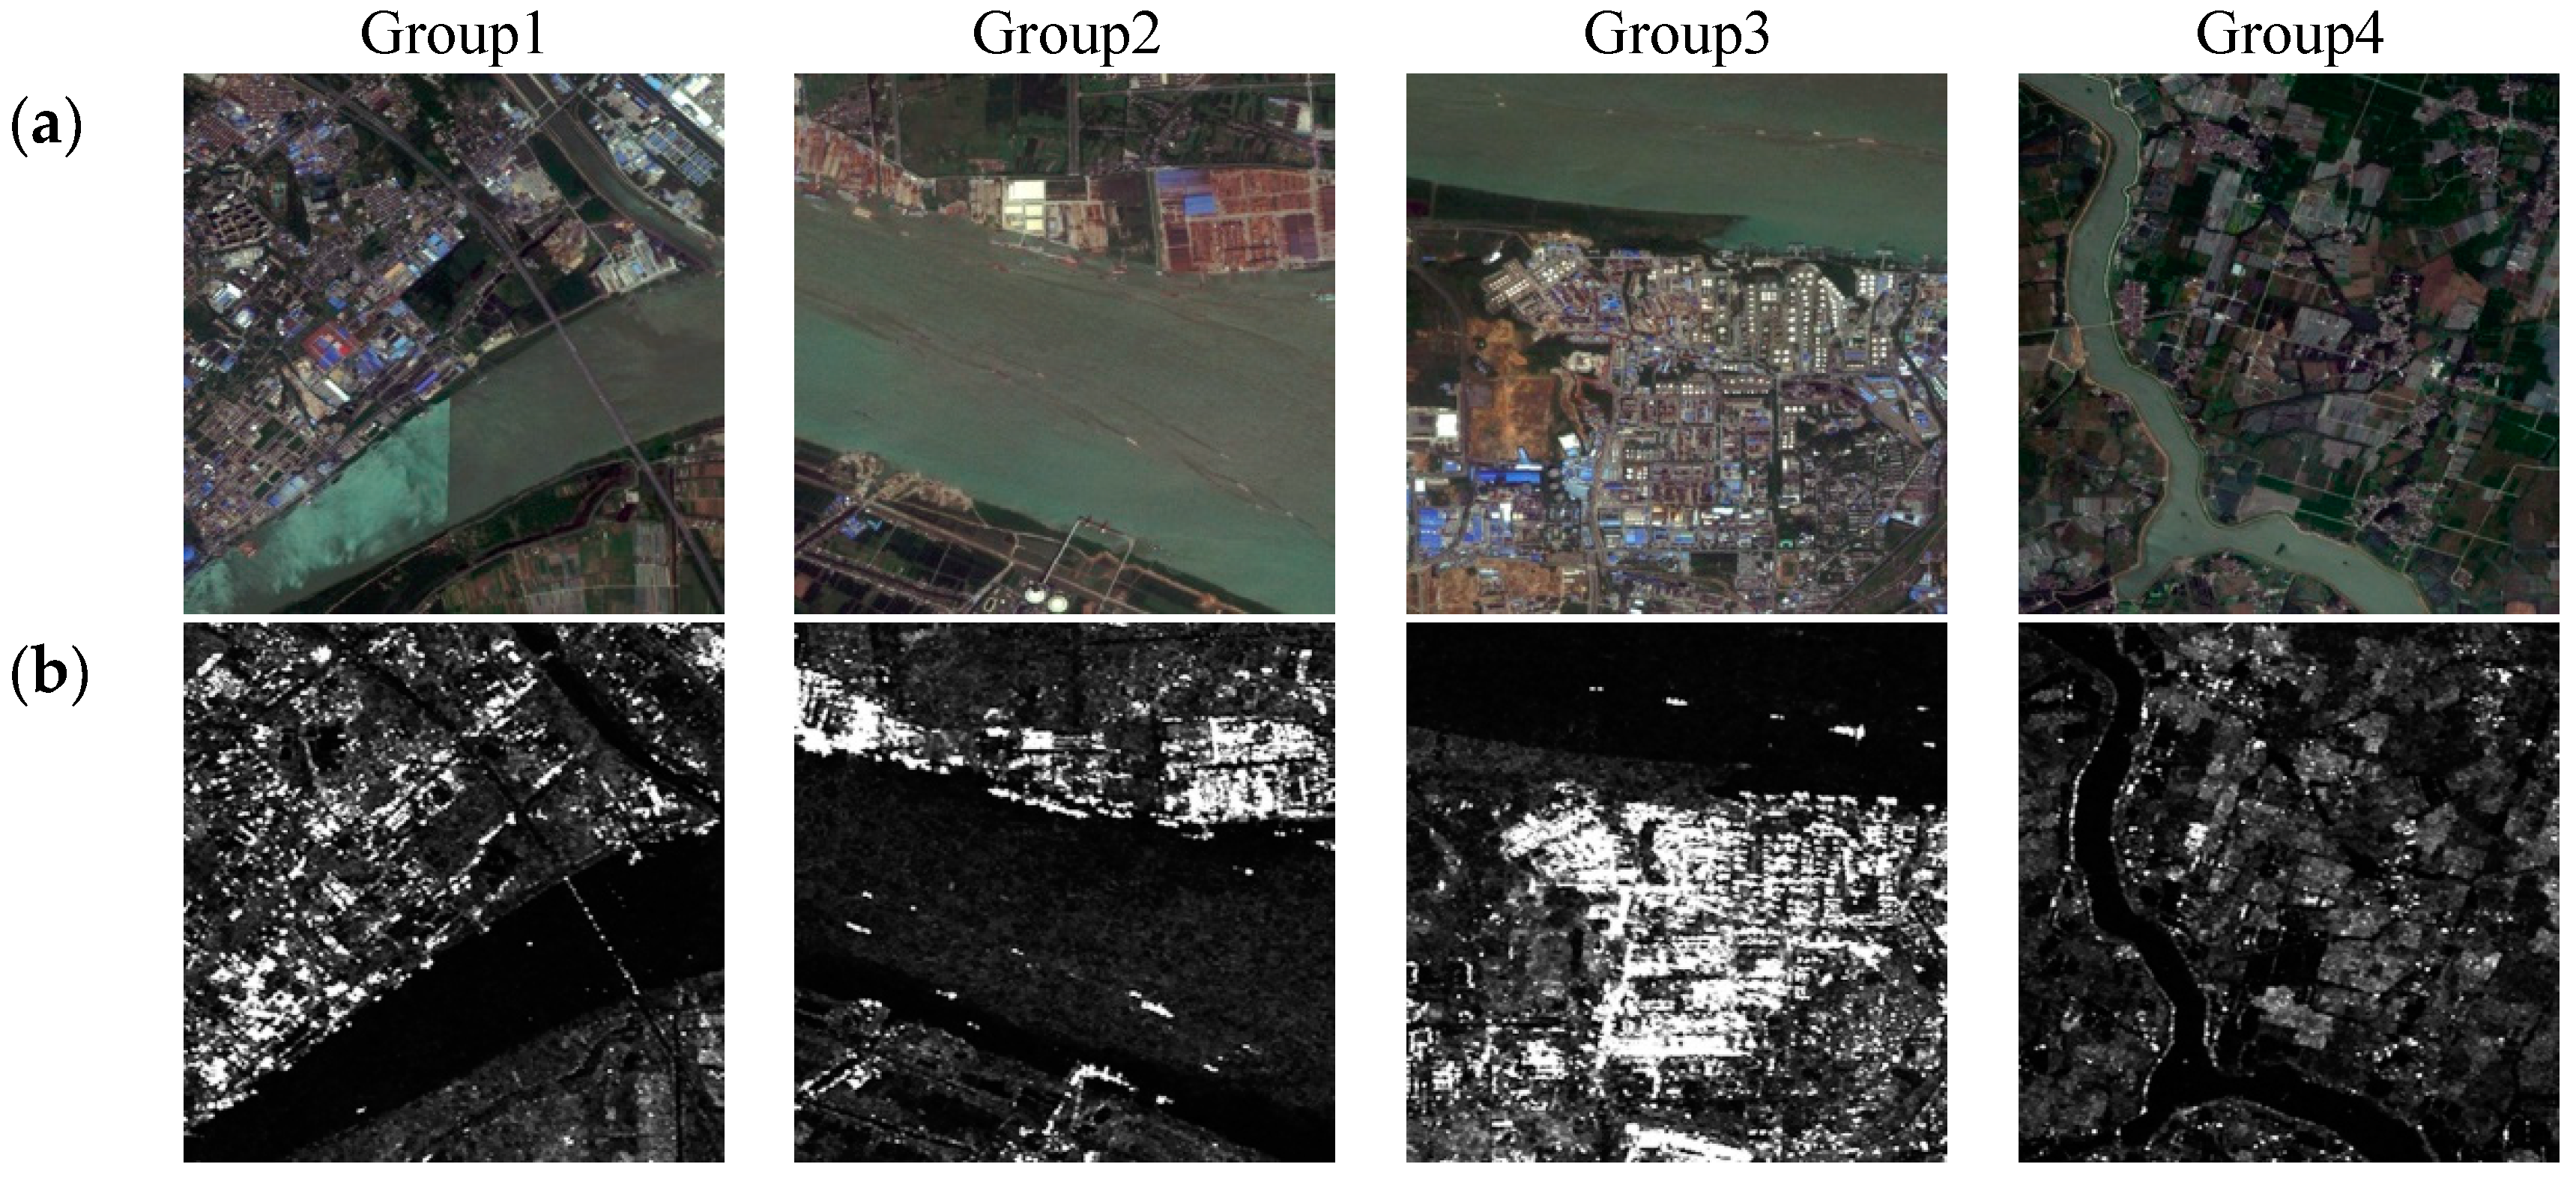
4.1. Dataset and Parameter Settings

The research site is located in Nanjing, Jiangsu Province and its vicinity. SAR images was collected by Canada’s RADARSAT-2 satellite with a resolution of 5 m and the collection time was 11 April 2017. Optical images are several 5 m-resolution images taken by the R a p i d e y e satellite in Germany in April 2017.
First, we randomly select 60 pairs of optical and SAR images with a resolution of 256 × 256 from the dataset as the experimental training set to train the network. In order to get a better model, we set the sliding window step to 14 to clip each image [13], fill the cut sub-block size into 132 × 132 and then input them into generator. After that, the size of generated image is 128 × 128. Next, we introduce the generated image, optical, and SAR pairs into the discriminator and use Adam optimizer [24] to continuously improve the network performance until reached the maximum training times. Finally, we select another four pairs of images in the dataset for qualitative and quantitative analysis.
Our training parameters are set as follows: the size of batch images is set to 64, the number of training iterations is set to 10, and the training step k of the discriminator is set to 2. λ is set to 100, η is set to 100, μ is set to 2000, δ is set to 0.1 (the parameter setting will be discussed in the later), ξ is set to 5, and the learning rate is set to 10 4 . Label a of the generated image is a random number ranging from 0 to 0.3, label b of the optical image is a random number ranging from 0.7 to 1.2, and label c is also a random number ranging from 0.7 to 1.2. Because labels a , b , and c are not specific numbers, they are called soft labels [25].

4.2. Valuable Metrics

To avoid the inaccuracy in subjective evaluation, we use some objective measures to calculate the corresponding values of fused images. Such as information entropy [26], average gradient [27], peak signal-to-noise ratio [28], structural similarity [29], spatial frequency [30], and spectral distortion. These evaluation indexes can calculate the fused image from the aspects of energy, spectrum, texture, and contour, reflecting the quality of the fused image with specific values.
  • Entropy (EN)
The entropy of the image can reflect the amount of information contained in the image. The greater the entropy, the better the image fusion effect.
E N = i = 0 L 1 p i log 2 p i
p i is the probability of the i -th grayscale value. L represents the total number of pixels in the image.
  • Average Gradient (AG)
Assuming that the size of the image is M × N , G ( m , n ) represents the gray value of the image at point ( m , n ) . The value of AG can reflect the performance ability of the image in local details. The larger the value, the clearer the image.
A G = 1 ( M 1 ) ( N 1 ) m = 1 M 1 n = 1 N 1 ( G ( m , n ) m ) 2 + ( G ( m , n ) n ) 2 2
  • Peak signal-to-noise ratio (PSNR)
(See formula 7.)
  • Structural Similarity (SSIM)
(See formula 11.)
  • Spatial Frequency (SF)
SF can be used to detect the total activity of fused images in spatial domain, and indicate the ability to contrast small details. The larger SF is, the richer the edges and textures the fused image has.
S F = ( R F ) 2 + ( C F ) 2
In which R F = 1 M × N i = 1 M j = 2 N [ f ( x , y ) f ( x , y 1 ) ] 2 represents the line frequency. C F = 1 M × N i = 2 M j = 1 N [ f ( x , y ) f ( x 1 , y ) ] 2 represents the column frequency.
  • Spectral Distortion (SD)
Spectral distortion mainly reflects the loss of spectral information between the fused image and the source image.
S D = m = 1 M n = 1 N | G X ( m , n ) G Y ( m , n ) | M × N
Because the spectral characteristics of optical images are more consistent with the visual observation of human eyes on ground objects in remote sensing images, the spectral distortion in this paper is calculated between fused images and optical images. The smaller the SD, the better the spectral features remain.

4.3. Results and Analysis

In this experiment, we compare the fusion performance of different methods for different scene images from subjective and objective evaluation. Figure 6 shows the selected images. These images come from the optical and SAR image pairs of different scenes in the dataset, including the scenes such as land, water, and buildings which are mainly considered in the process of image fusion.

4.3.1. Network Structure Analysis

In order to avoid the problems of gradient disappearance and gradient explosion in the GAN, this paper uses Dense-UGAN network as the main structure of the generator to realize image feature extraction. Additionally, we compare the fusion results with the generative adversarial network based on DCGAN, U-Net, and skip connection [31] to illustrate the effectiveness of the Dense-UGAN in the fusion of optical and SAR images. Use the original GAN loss function for training [13], and the results are shown in Table 1.
It can be seen from Table 1 that no matter which network is used for image fusion, the final result is better than the original GAN network; that is, all objective evaluation parameters are generally improved. Secondly, according to the above table, when the Dense-UGAN network is used as the main structure of the generator for image fusion, the EN, AG, SSIM, and SF are increased by 7.13%, 43.77%, 0.62%, and 67.79%, respectively, than the original GAN. Among them, the SF is 13.636, which is 26.69% higher than SC-GAN, indicating that the structure of this paper performs better for fusion performance than other excellent networks.
Therefore, we combine the generative adversarial network based on Dense-UGAN and Gram–Schmidt transform to achieve optical and SAR image fusion.

4.3.2. Loss Function Analysis

In this part, we first evaluate the fusion effect of networks with different loss functions. Then, the weight parameters λ, μ, η, and δ in the loss function of generator and discriminator are discussed, so as to fine-tune the model to the best setting.
The second row of Table 2 is the experimental results of the Dense-UNet network using the original loss function in [13]. We will use it to conduct ablation experiments with the experimental results of introducing different loss functions. It can be seen that compared with the original loss function, after introducing the texture feature loss L S G L C M ( G ) into the generator loss function, the objective evaluation indicators EN and STD increased by 5.88% and 34.77%, respectively, indicating that the texture feature loss is beneficial to improve the performance of the image in local details. Additionally, after introducing structural similarity loss L S S I M ( D ) into the discriminator loss function, several texture feature indexes are also improved. Finally, we compare the complete loss function of this article with the original loss function results; we can see that EN, STD, PSNR, SSIM, and SD have increased by 5.15%, 25.41%, 2.06%, 31.64%, and 49.9%, respectively. It shows that the loss item proposed in this paper is an effective function for optical and SAR image fusion tasks, which can achieve the purpose of urging the fusion image to contain more and more spectral and spatial characteristics.
For the discussion of weight parameters, there are four parameters and coupling might exist between different loss functions, so the strategy is to increase the loss items one by one in the order of magnitude [32]. Firstly, we fix the weight λ of content loss L L 1 in the generator loss function as 100 [33], then determine the weight parameter η of peak signal-to-noise ratio loss L P S N R , and finally determine the weight μ of texture feature loss L S G L C M . Similarly, the weight coefficient δ of structural similarity loss L S S I M in the discriminator loss function is also discussed in the same way. To quantitatively evaluate the results, we use the average value of each objective evaluation index of the selected four groups of source image pairs to compare different weight models. The experimental results are shown in Figure 7.
It can be seen from the experimental result that when the weight parameter η of L P S N R is set to 1 (×100), the weight μ of L S G L C M is set to 20 (×100), and the weight coefficient δ of L S S I M is set to 0.1, the objective index results of the fused image are relatively the best, and the amount of information is the largest.

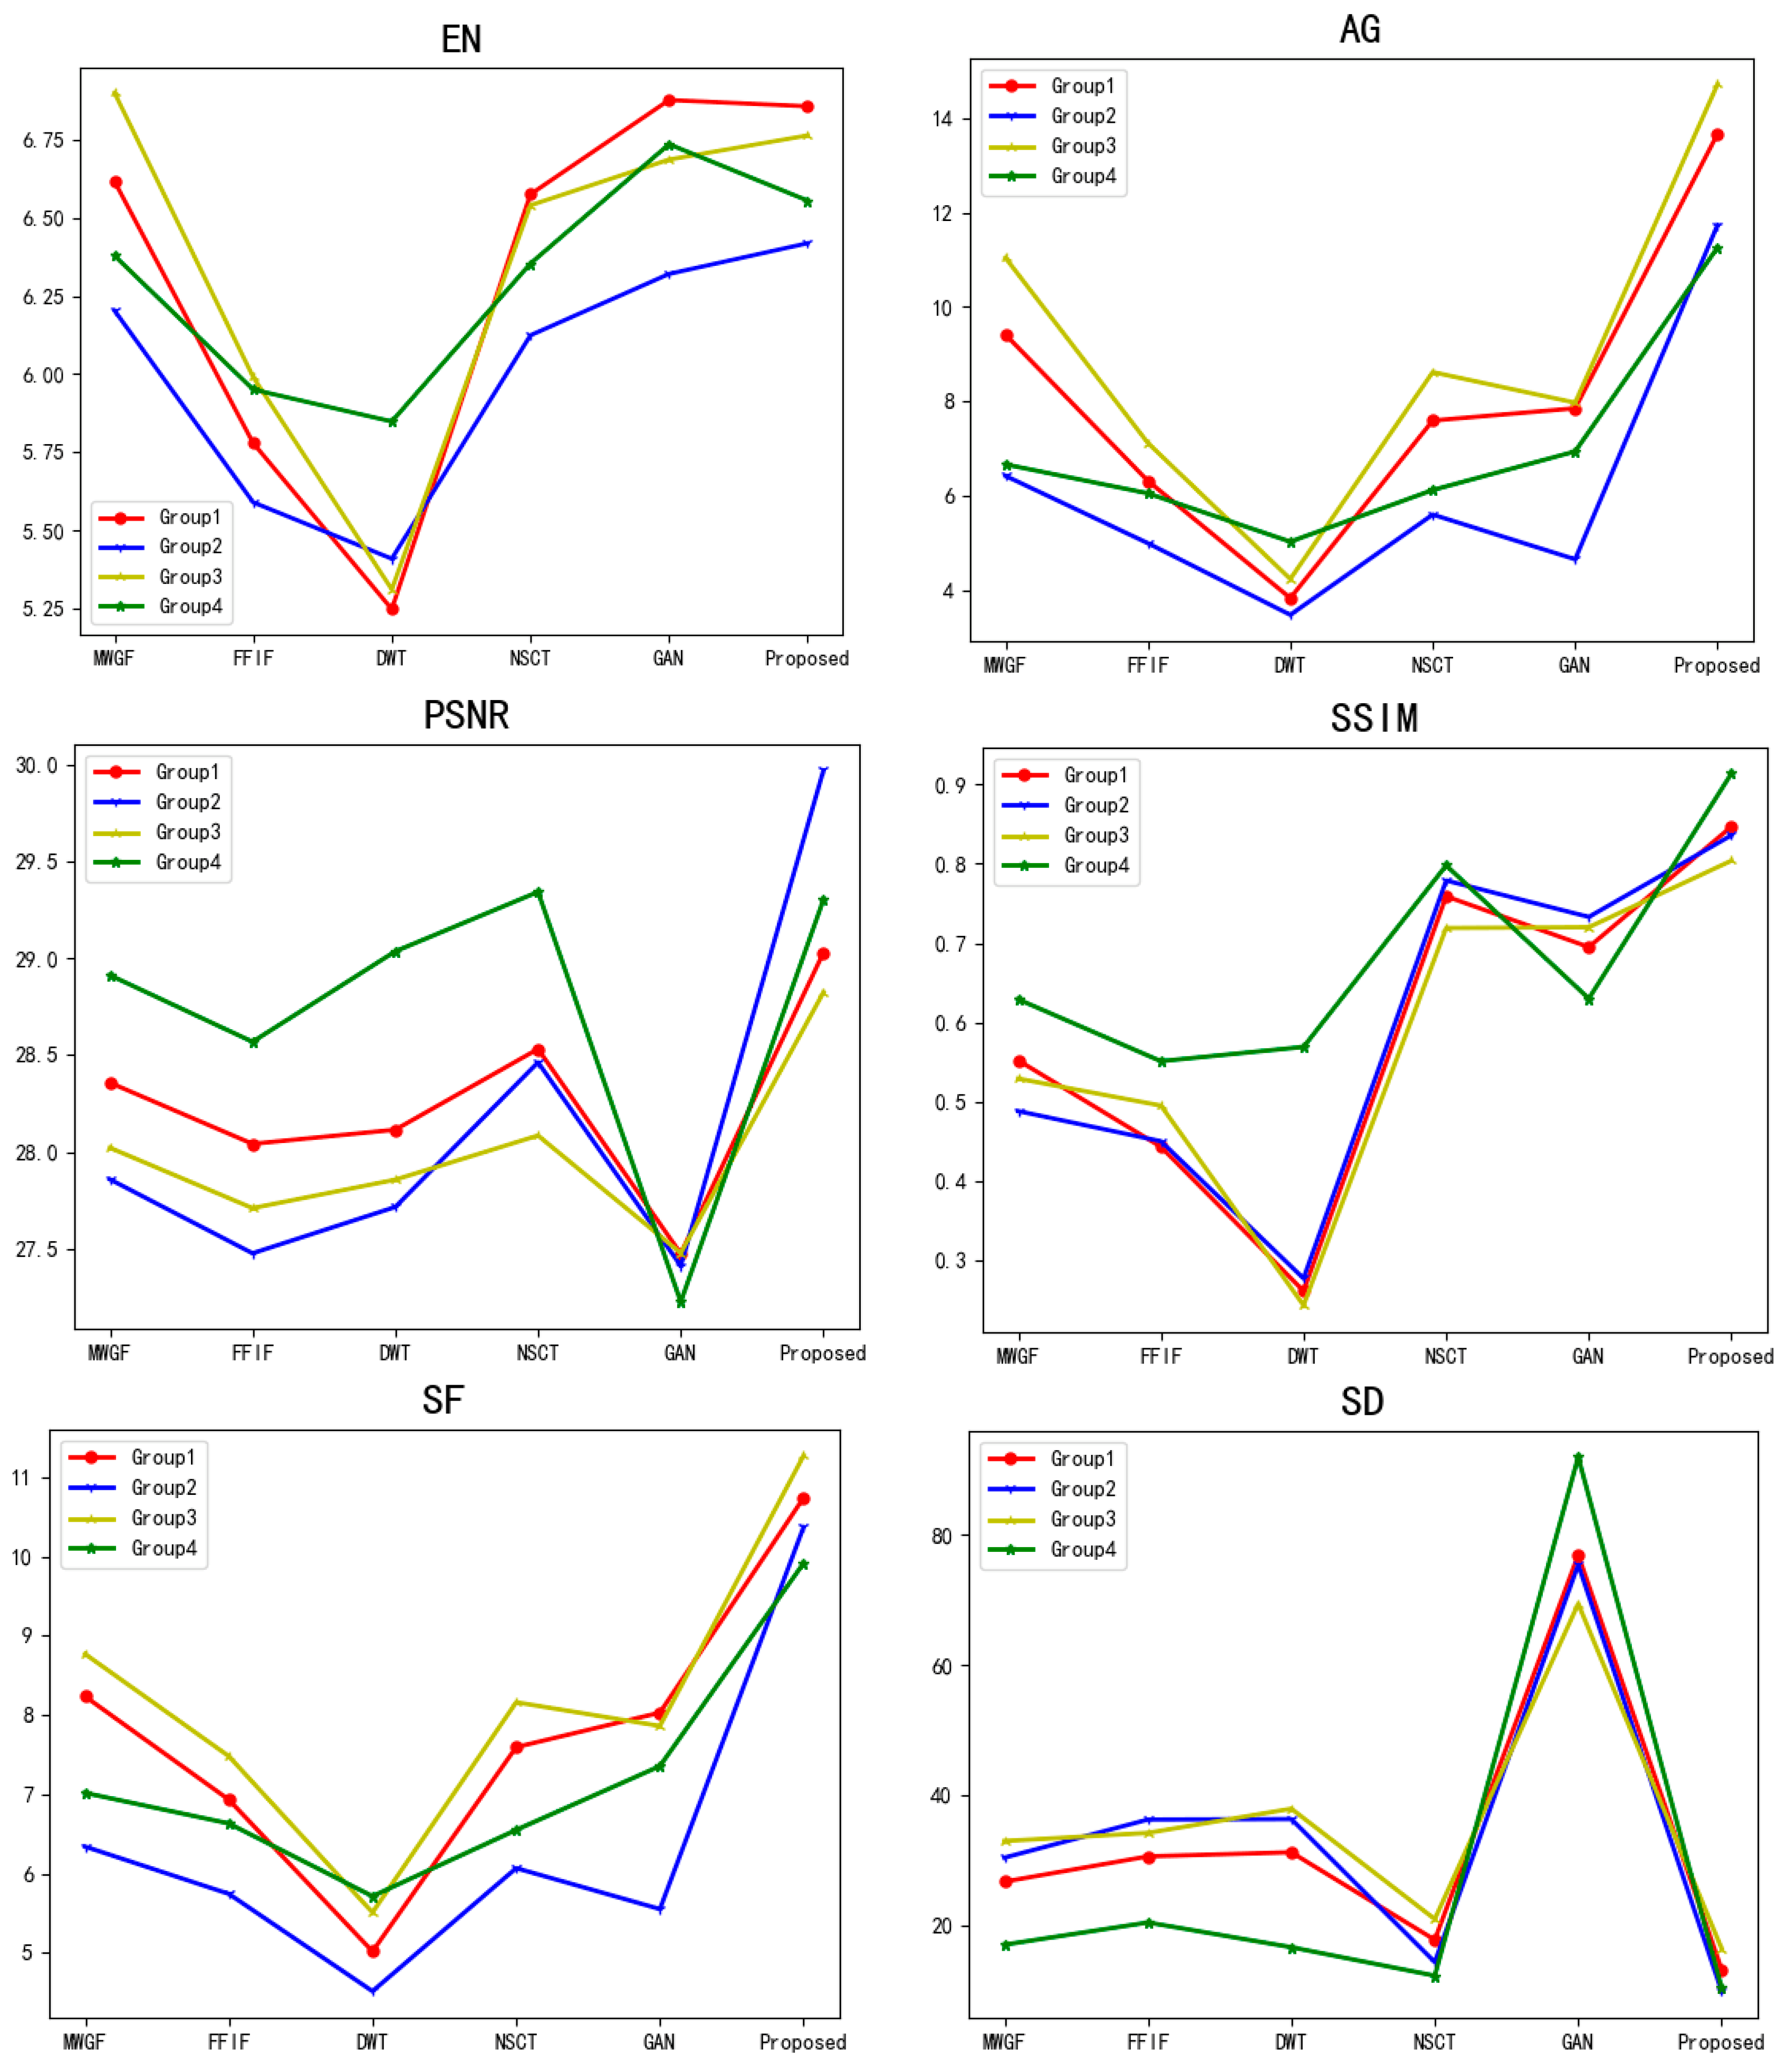
4.3.3. Different Algorithms Comparison

To effectively evaluate the proposed optical and SAR image fusion method, this paper compares it with other five representative image fusion methods, including multi-scale weighted gradient fusion method (MWGF) [34], wavelet transform-based fusion method (DWT) [35], fast filter-based fusion method (FFIF) [36], non-subsampled contourlet transform domain-based fusion method (NSCT) [18], and the Fusion-GAN fusion method [13]. Among them, MWGF and FFIF belong to the spatial domain. DWT and NSCT are representative methods based on transform domain, and the fusion rule adopted for NSCT is “Select-Max”. Fusion-GAN is a method based on deep learning. Different methods have different fusion effects. The results of the four scenes selected in the experiment are shown in Figure 8.
From the subjective fusion results, it can be seen that the fused images obtained by FFIF, DWT, and MWGF methods inherit the spatial characteristics of SAR images, but the spectral characteristics do not inherit the optical images well. The spectral features of the fusion image using NSCT transform are inherited from the optical image, and the spatial features of SAR image are retained, but the image has more speckle noise. The fusion image obtained by the original GAN method is not suitable for the normal perception of human eyes because only the lightness component of optical image is considered in the fusion process. However, the spectral features of the fusion results obtained by the method in this paper are obviously well inherited; the gap between the fusion results and optical images is smaller, the image definition is higher, and the loss of texture details and contour is less.
In addition, in order to further compare the performance of the fused image and optical image in detail, we intercepted a part of area from the experimental results, which includes water and residential. Then, we used the Canny algorithm to simply detect the edge of the optical image and the fused image. The experimental results are shown in Figure 9.
As shown in Figure 9, the edge of the middle building is well reflected in the fusion results, and other places also show more texture details, which means that the proposed method performs well in keeping the details of the source image, and the fused image contains more content.
Further data processing the fusion results of Group1 image under the different methods. The image objective evaluation results are obtained and showed in Table 3.
It can be seen from Table 3 that the performance of this method is better than other methods regarding AG, PSNR, SSIM, SF, and SD. For AG and SF, compared with the MWGF method with better performance, it is improved by 45.2% and 30.42%, respectively. Additionally, compared with the NSCT method with better performance for PSNR, SSIM, and SD, it is improved by 1.74%, 11.59%, and 34.83%, respectively. In a word, although the proposed method cannot achieve the best in every index, the spectral distortion of the fused image has been improved, and the objective index has a good effect.
Moreover, we have also conducted fusion experiments on the other three groups of original image pairs in the selected dataset. Figure 10 is the line charts of objective results. From the objective data, it can be seen that the method proposed in this paper can be well applied in heterogeneous image fusion.

5. Discussion and Conclusions

Firstly, this paper presents the theory of generative adversarial network and Gram–Schmidt transform, then introduces the Dense-U network into the GAN generator to obtain deeper semantic information and comprehensive features of optical and SAR images. At the same time, the loss function of the generative adversarial network is constructed. The PSNR and SGLCM loss are introduced into the generator loss function, and the SSIM loss is introduced into the discriminator to optimize the network parameters and obtain the best network model. Finally, the cascaded source image pairs are input into the trained generator to obtain a generated image, and the generated image is GS-transformed with the optical image to obtain the final fusion result. The experimental results show that the fusion image obtained by this method can well retain spectral characteristics of the optical image and texture details of the SAR image, while reducing the generation of coherent speckle noise, and can be well applied in the pixel-level fusion of heterogeneous images.

Author Contributions

All the authors made significant contribution to the work. Conceptualization, Y.K. and F.H.; methodology, Y.K. and F.H.; software, F.H.; validation, Y.K. and F.H.; formal analysis, F.H.; writing—original draft preparation, F.H.; writing—review and editing, Y.K.; supervision, H.L.; project administration, X.P. All authors have read and agreed to the published version of the manuscript.

Funding

This research was funded by National Natural Science Foundation of China (No. 61501228); Natural Science Foundation of Jiangsu (No. BK20140825); Aeronautical Science Foundation of China (No.20152052029, No.20182052012); Basic Research (No. NS2015040, No. NS2021030); and National Science and Technology Major Project (2017-II-0001-0017).

Institutional Review Board Statement

Not applicable.

Informed Consent Statement

Not applicable.

Data Availability Statement

No new data were created or analyzed in this study. Data sharing is not applicable to this article.

Conflicts of Interest

The authors declare no conflict of interest.

References

  1. Jia, Y.H.; Li, D.R.; Sun, J.B. Data fusion techniques for multi-sources remotely sensed imagery. Remote Sens. Technol. Appl. 2000, 15, 41–44. [Google Scholar]
  2. Byun, Y. A texture-based fusion scheme to integrate high-resolution satellite SAR and optical images. Remote Sens. Lett. 2014, 5, 103–111. [Google Scholar] [CrossRef]
  3. Walessa, M.; Datcu, M. Model-based despeckling and information extraction from SAR images. IEEE Trans. Geosci. Remote Sens. 2000, 5, 2258–2269. [Google Scholar] [CrossRef]
  4. Yang, J.; Ren, G.; Ma, Y.; Fan, Y. Coastal wetland classification based on high resolution SAR and optical image fusion. In Proceedings of the Geoscience and Remote Sensing Symposium, Beijing, China, 10–15 July 2016; IEEE Press: New York, NY, USA, 2016; pp. 886–889. [Google Scholar]
  5. Hua, C.; Zhiguo, T.; Kai, Z.; Jiang, W.; Hui, W. Study on infrared camouflage of landing craft and camouflage effect evaluation. Infrared Technol. 2008, 30, 379–383. [Google Scholar]
  6. Do, M.N.; Vetterli, M. The contourlet transform: An efficient directional multiresolution image representation. IEEE Trans. Image Process. 2005, 14, 2091–2106. [Google Scholar] [CrossRef] [Green Version]
  7. Xiao-Bo, Q.; Jing-Wen, Y.; Hong-Zhi, X.; Zi-Qian, Z. Image Fusion Algorithm Based on Spatial Frequency-Motivated Pulse Coupled Neural Networks in Nonsubsampled Contourlet Transform Domain. Acta Autom. Sin. 2008, 34, 1508–1514. [Google Scholar]
  8. Da Cunha, A.L.; Zhou, J.P.; Do, M.N. The nonsubsampled contourlet transform: Theory, design, and applications. IEEE Trans. Image Process. 2006, 15, 3089–3101. [Google Scholar] [CrossRef] [PubMed] [Green Version]
  9. Hao, F.; Aihua, L.; Yulong, P.; Xuejin, W.; Ke, J.; Hua, W. The effect evaluation of infrared camouflage simulation system based on visual similarity. Acta Armamentarii 2017, 38, 251–257. [Google Scholar]
  10. Limpitlaw, D.; Gens, R. Dambo mapping for environmental monitoring using Landsat TM and SAR imagery: Case study in the Zambian Copperbelt. Int. J. Remote Sens. 2006, 27, 4839–4845. [Google Scholar] [CrossRef]
  11. Li, Y.; Shi, T.; Zhang, Y.; Chen, W.; Wang, Z.; Li, H. Learning deep semantic segmentation network under multiple weakly-supervised constraints for cross-domain remote sensing image semantic segmentation. ISPRS J. Photogramm. Remote Sens. 2021, 175, 20–33. [Google Scholar] [CrossRef]
  12. Benjdira, B.; Bazi, Y.; Koubaa, A.; Ouni, K. Unsupervised domain adaptation using generative adversarial networks for semantic segmentation of aerial images. Remote Sens. 2019, 11, 1369. [Google Scholar] [CrossRef] [Green Version]
  13. Liu, Y.; Chen, X.; Peng, H.; Wang, Z.F. Multi-focus image fusion with a deep convolutional neural network. Inf. Fusion 2017, 36, 191–207. [Google Scholar] [CrossRef]
  14. Ma, J.; Yu, W.; Liang, P. FusionGAN: A generative adversarial network for infrared and visible image fusion. Inf. Fusion 2019, 48, 11–26. [Google Scholar] [CrossRef]
  15. Liping, Y.; Dunsheng, X.; Fahu, C. Comparison of Landsat 7 ETM+ Panchromatic and Multispectral Data Fusion Algorithms. J. Lanzhou Univ. (Nat. Sci. Ed.) 2007, 7-11+17. [Google Scholar]
  16. Li, H.; Wu, X.J. DenseFuse: A fusion approach to infrared and visible images. IEEE Trans. Image Process. 2019, 28, 2614–2623. [Google Scholar] [CrossRef] [PubMed] [Green Version]
  17. Ronneberger, O.; Fischer, P.; Brox, T. U-net: Convolutional net-works for biomedical image segmentation. In Proceedings of the International Conference on Medical Image Computing and Computer-Assisted Intervention, Munich, Germany, 5–9 October 2015; Springer: Berlin/Heidelberg, Germany, 2015. [Google Scholar]
  18. Yan, B.; Kong, Y. A Fusion Method of SAR Image and Optical Image Based on NSCT and Gram-Schmidt Transform. In Proceedings of the IEEE International Conference on Geoscience & Remote Sensing Symposium, Waikoloa, HI, USA, 26 September 2020. [Google Scholar]
  19. Goodfellow, I.; Pouget-Abadie, J.; Mirza, M.; Xu, B.; Warde-Farley, D.; Ozair, S.; Courville, A.; Bengio, Y. Generative adversarial nets. Adv. Neural Inf. Process. Syst. 2014, 27, 2672–2680. [Google Scholar]
  20. Maurer, T. How to pan-sharpen images using the gram-schmidt pan-sharpen method–A recipe. ISPRS Int. Arch. Photogramm. Remote Sens. Spat. Inf. Sci. 2013, XL-1/W1, 239–244. [Google Scholar] [CrossRef] [Green Version]
  21. Ioffe, S.; Szegedy, C. Batch normalization: Accelerating deep net-work training by reducing internal covariate shift. In Proceedings of the International Conference on Machine Learning, Lille, France, 7–9 July 2015. [Google Scholar]
  22. Maas, A.L.; Hannun, A.Y.; Ng, A.Y. Rectifier nonlinearities improve neural network acoustic models. In Proceedings of the International Conference on Machine Learning, Atlanta, GA, USA, 16–21 June 2013; Volume 28, p. 6. [Google Scholar]
  23. Ye, S.N.; Su, K.N.; Xiao, C.B.; Duan, J. Image quality evaluation based on structure information extraction. Acta Electron. Sin. 2008, 5, 856–861. [Google Scholar]
  24. Kingma, D.P.; Ba, J. Adam: A method for stochastic optimization. arXiv 2015, arXiv:1412.6980. [Google Scholar]
  25. Mao, X.; Li, Q.; Xie, H.; Lau, R.Y.; Wang, Z.; Paul Smolley, S. Least squares generative adversarial networks. In Proceedings of the IEEE International Conference on Computer Vision, Venice, Italy, 22–29 October 2017; pp. 2813–2821. [Google Scholar]
  26. Roberts, J.W.; Van Aardt, J.A.; Ahmed, F.B. Assessment of image fusion procedures using entropy, image quality, and multispectral classification. J. Appl. Remote Sens. 2008, 2, 023522. [Google Scholar]
  27. Rao, Y.J. In-fibre bragg grating sensors. Meas. Sci. Technol. 1997, 8, 355. [Google Scholar] [CrossRef]
  28. Setiadi, D.R.I.M. PSNR vs SSIM: Imperceptibility quality assessment for image steganography. Multimed. Tools Appl. 2020, 80, 8423–8444. [Google Scholar] [CrossRef]
  29. Wang, Z.; Bovik, A.C. A universal image quality index. IEEE Signal Process. Lett. 2002, 9, 81–84. [Google Scholar] [CrossRef]
  30. Eskicioglu, A.M.; Fisher, P.S. Image quality measures and their performance. IEEE Trans. Commun. 1995, 43, 2959–2965. [Google Scholar] [CrossRef] [Green Version]
  31. Shanshan, H.; Qian, J.; Xin, J.; Xinjie, L.; Jianan, F.; Shaowen, Y. Semi-supervised remote sensing image fusion combining twin structure and generative confrontation network. J. Comput. Aided Des. Graph. 2021, 33, 92–105. [Google Scholar]
  32. Gao, J.; Yuan, Q.; Li, J.; Zhang, H.; Su, X. Cloud Removal with Fusion of High Resolution Optical and SAR Images Using Generative Adversarial Networks. Remote Sens. 2020, 12, 191. [Google Scholar] [CrossRef] [Green Version]
  33. Isola, P.; Zhu, J.Y.; Zhou, T.; Efros, A.A. Image-to-image translation with conditional adversarial networks. In Proceedings of the IEEE Conference on Computer Vision and Pattern Recognition, Las Vegas, NV, USA, 27–30 June 2016. [Google Scholar]
  34. Zhou, Z.; Li, S.; Wang, B. Multi-scale weighted gradient-based fusion for multi-focus images. Inf. Fusion 2014, 20, 60–72. [Google Scholar] [CrossRef]
  35. Pajares, G.; de la Cruz, J.M. A wavelet-based image fusion tutorial. Pattern Recognit. 2004, 37, 1855–1872. [Google Scholar] [CrossRef]
  36. Zhan, K.; Xie, Y.; Wang, H.; Min, Y. Fast filtering image fusion. J. Electron. Imaging 2017, 26, 063004. [Google Scholar] [CrossRef] [Green Version]
Figure 1. Gram–Schmidt transformation flowchart.
Remotesensing 13 04274 g001
Figure 2. Framework of proposed fusion method.
Remotesensing 13 04274 g002
Figure 3. Network architecture of generator.
Remotesensing 13 04274 g003
Figure 4. Network architecture of discriminator.
Remotesensing 13 04274 g004
Figure 5. Pixel normalization method. (a) Optical pixel histogram; (b) SAR pixel histogram.
Remotesensing 13 04274 g005
Figure 6. Four groups of original images. (a) Optical image; (b) SAR image
Remotesensing 13 04274 g006
Figure 7. Weight parameter analysis. (a) Parameter η analysis result; (b) parameter μ analysis result; (c) parameter δ analysis result.
Remotesensing 13 04274 g007
Figure 8. Effect comparison of the different fusion algorithms. (a) Optical image; (b) SAR image; (c) MWGF; (d) FFIF; (e) DWT; (f) NSCT; (g) Fusion-GAN; (h) the proposed method.
Remotesensing 13 04274 g008aRemotesensing 13 04274 g008b
Figure 9. Edge detection of optical image and fused image. (a) Optical image; (b) fused image; (c) edge detection of optical image; (d) edge detection of fused image.
Remotesensing 13 04274 g009
Figure 10. Fusion image objective evaluation results.
Remotesensing 13 04274 g010
Table 1. Various network test results using the original loss function.
ENAGPSNRSSIMSFSD
GAN6.87517.85127.4740.6458.03176.886
DCGAN7.01213.41227.5980.46110.09270.832
U-net7.01216.44227.4350.6177.12881.224
SC-GAN7.23215.32427.610.64110.76358.497
Dense-UGAN7.36525.66527.560.64913.63665.767
Table 2. Fusion effect of different loss functions.
ENSTDAGPSNRSSIMSD
L G A N ( G ) + λ L L 1 ( G ) 6.32420.5614.2428.7270.64818.435
L G A N ( G ) + λ L L 1 ( G ) + μ L S G L C M ( G ) 6.69627.70811.87328.2510.83417.343
L G A N ( G ) + λ L L 1 ( G ) + η L P S N R ( G ) 6.51523.78810.97329.0490.78114.341
L G A N ( G ) + λ L L 1 ( G ) + μ L S G L C M ( G ) + η L P S N R ( G ) 6.61825.64610.92829.220.84812.745
L G A N ( D ) + δ L S S I M ( D ) 6.55124.9239.20328.2940.81616.415
P r o p o s e d 6.6525.78512.8729.320.85312.298
Table 3. Group1 objective evaluation result.
ENAGPSNRSSIMSFSD
MWGF6.6159.41428.3570.5528.23626.633
DWT5.786.31328.0410.4436.93430.525
FFIF5.253.82828.1140.2615.0231.151
NSCT6.5747.59128.5310.7597.59617.683
Fusion-GAN6.8757.85127.4740.6958.03176.886
Proposed6.85513.66929.0290.84710.74113.115
Publisher’s Note: MDPI stays neutral with regard to jurisdictional claims in published maps and institutional affiliations.

