1. Introduction
Pacific walruses (
Odobenus rosmarus divergens) haulout on the coast to rest when sea ice is unavailable over continental-shelf waters. When hauled out on land, walruses are at risk from human activities including disturbances that can result in death from stampeding [
1] or potentially by contaminants from marine spill events [
2]. Mitigating disturbance or pollution risks requires near-real-time information about the presence and relative size of coastal haulouts during ice-free periods. Large aggregations at coastal haulout sites contrast with small, dispersed walrus groups that rest on ice floes when sea ice is present over their offshore feeding grounds [
3,
4]. Large aggregations at terrestrial haulouts present an opportunity to survey and enumerate walruses with greater precision than may be achieved with offshore surveys [
5]. Nevertheless, coastal haulout locations themselves are typically remote and challenging to access, making on-site survey efforts costly and sporadic at best [
6].
The periods of ice-free conditions during late summer and autumn in the Arctic are lengthening due to warming [
7], especially in the Chukchi Sea where Pacific walruses seasonally range. Since 2007, during most years, sea ice has retreated northward beyond the continental shelf in the late summer and autumn, leaving Pacific walruses with no ice on which to rest between foraging bouts. This fundamental change in the distribution of sea ice across the summer and autumn range of Pacific walruses has resulted in larger numbers coming ashore for longer periods on both the U.S. and Russian coasts of the Chukchi Sea [
8]. In the U.S., large haulouts have formed on the barrier islands near Point Lay, Alaska [
6], in nearly all years since 2007 (except 2008 and 2012), when sea ice retreated beyond the continental shelf.
When walruses haulout on land, they group tightly together in herds that may extend over hundreds or even thousands of meters of shoreline and up to one hundred meters inland. Large walrus aggregations are visually distinct from surrounding coastal features due to their color and texture, even when viewed at great distances or with relatively course resolution imagery. As such, some types of satellite imagery have been used successfully to distinguish walruses. Burn and Cody [
9] pioneered detection of walrus haulouts with the use of high-resolution optical imagery from the QuickBird satellite (0.6 m panchromatic and 2.4 m multispectral). They identified walrus groups with as few as two animals and related walrus groups identifiable in the satellite imagery to on-site observer counts. Atlantic walruses on the shores of the Barents Sea were apparent in EROS-B panchromatic 0.7 m imagery [
10], and Pacific walruses were detectable in GeoEye 0.5 m panchromatic imagery near Wrangel Island, Russia [
11]. The Greenland Institute of Natural Resources examined the capability of detecting small walrus groups through statistical processing of high-resolution imagery from Worldview, Pléiades, and SPOT [
12]. Despite these successes visualizing walruses with satellite sensors, systematic reconnaissance of haulouts has been hampered by infrequent data collections, cloud cover, timely access, and cost. High-resolution optical satellite imagery has also proved useful for enumerating other pinniped species such as Weddell seals (
Leptonychotes weddellii) [
13], elephant seals (
Mirounga leonina) [
14], and gray seals (
Halichoerus grypus) [
15], and such applications will likely expand as the number of high-resolution satellite systems increases [
15]. No study to date has evaluated the repeatability and validity of interpreting walrus haulouts from imagery that spans a breadth of Earth observing satellite sensors that have recently become operational.
Over the past decade, civil access to both optical and SAR imagery increased qualitatively for research and applied purposes. New satellite constellations have increased collection periodicity and improved resolution capability. These constellations support imagery acquired with reduced revisit intervals on the scale of days to hours, moderate (10 to 40 m) or high (0.4 m to 4 m) image resolutions, and some with active radar instruments that can discriminate ground features through clouds and at night.
Under clear-sky daytime conditions, walrus haulouts can be imaged with several optical sensors operating in the visible to infra-red spectrum. The joint National Aeronautics and Space Administration (NASA) and U.S. Geological Survey (USGS) Landsat program [
16] has collected multispectral imagery continuously since 1972. The recently launched Landsat-8 satellite collects multi-band imagery worldwide every 16 days at the equator with 30 m resolution. The European Space Agency operates the Sentinel-2 mission [
17] with two satellites launched in 2015 and 2017 into complimentary polar orbits that together can collect 10 m resolution multispectral imagery worldwide every 5 days at the equator. Both Landsat and Sentinel imagery are publicly available without cost. Commercial satellites began collecting very-high resolution (1 m or less) optical images with the launch of IKONOS in 1999. Archives of commercial imagery from IKONOS, Quickbird, WorldView, and GeoEye are available for purchase through Maxar’s DigitalGlobe [
18]. Several other optical satellite missions collect very-high resolution imagery, for example, Pléiades [
19] and SkySat [
20]. With prior coordination, opportunities exist to leverage commercial missions to acquire imagery of specific areas at specific times.
Traditional earth observing satellite missions have relied on customized engineering to build individual satellites and sensors requiring dedicated heavy-lift launch capabilities. In 2003, a new satellite remote sensing paradigm debuted based on deploying a constellation of small satellites built from commercial components and assembled into a standardized form called a CubeSat weighing ≤ 1.3 kg each [
20,
21]. Their small size allowed CubeSats to be sent into orbit opportunistically with other missions or carried by rockets configured to deploy dozens in a single launch [
22]. In 2010, Planet Labs [
20] formed to create an earth observing constellation of CubeSats, each with a consumer-grade optical telescope and a 4-band (red, green, blue, and near infra-red) digital sensor. Planet put the first CubeSat into orbit in 2013. By 2018, 140 had become operational in its PlanetScope constellation which is capable of imaging the Earth’s entire landmass at 4 m resolution every day [
23,
24].
Optical ground imaging in Arctic coastal areas during the walrus haulout season is often impossible due to persistent clouds, fog, and the rapid loss of daylight in autumn. However, active radar instruments can acquire unobscured day/night images of walrus haulouts because the wavelengths are unaffected by atmospheric water-vapor or darkness. In April 2014, the European Space Agency launched the Sentinel-1 mission to collect C-band synthetic aperture radar (SAR) imagery of the Earth’s land masses in dual polarization imaging modes, processed to 10-m resolution and available to the public in near-real-time [
17]. Several other SAR data archives and acquisition capabilities exist (see
Section 4), but none maintain free, near-real-time global archives like Sentinel-1.
In this study, we evaluate the repeatability of interpreting the occurrence, aerial extent, and location of walrus haulouts from a representative sampling of available Earth observing satellite imagery. We acquired data from a variety of satellite imagery sources (public and commercial) to evaluate their effectiveness in revealing walrus aggregations at the Point Lay haulout. We recognize that our comparisons do not include all possible satellite missions, rather we selected a representative subset of optical and SAR missions that span a range of spatial and temporal resolutions. To inform the validity of our imagery interpretations, we utilized very high-resolution imagery (~2 cm) that was collected at the Point Lay haulout during the late summers of 2018 and 2019 using a small unoccupied aerial system (UAS) [
25]. Because none of the Earth observing satellite imagery available to this study enabled the counting of walruses when gathered closely together in a haulout, and because walrus density varies substantially at coastal haulouts, we did not seek to estimate abundance [
25]. Prior to initiating the study, we consulted with the Eskimo Walrus Commission [
26], an Alaska Native co-management group that represents coastal communities with cultures that rely on walruses, to ensure that our methods would not adversely affect conservation efforts nor infringe on the privacy of local residents.
3. Results
We examined a total of 562 satellite images collected over our study area during 25 July–15 November 2018, 2019, and 2020 [
31], among which 207 images had clear views (all 80 SAR images and 127 of the 482 optical images). Of the 207 clear view images, we obtained full-resolution digital data for 195 (DigitalGlobe = 3, LandSat-8 = 11, PlanetScope = 54, Sentinel-1 EW = 18, Sentinel-1 IW = 46, Sentinel-2 = 47, TerraSAR-X staring spotlight = 12, and TerraSAR-X stripmap = 4).
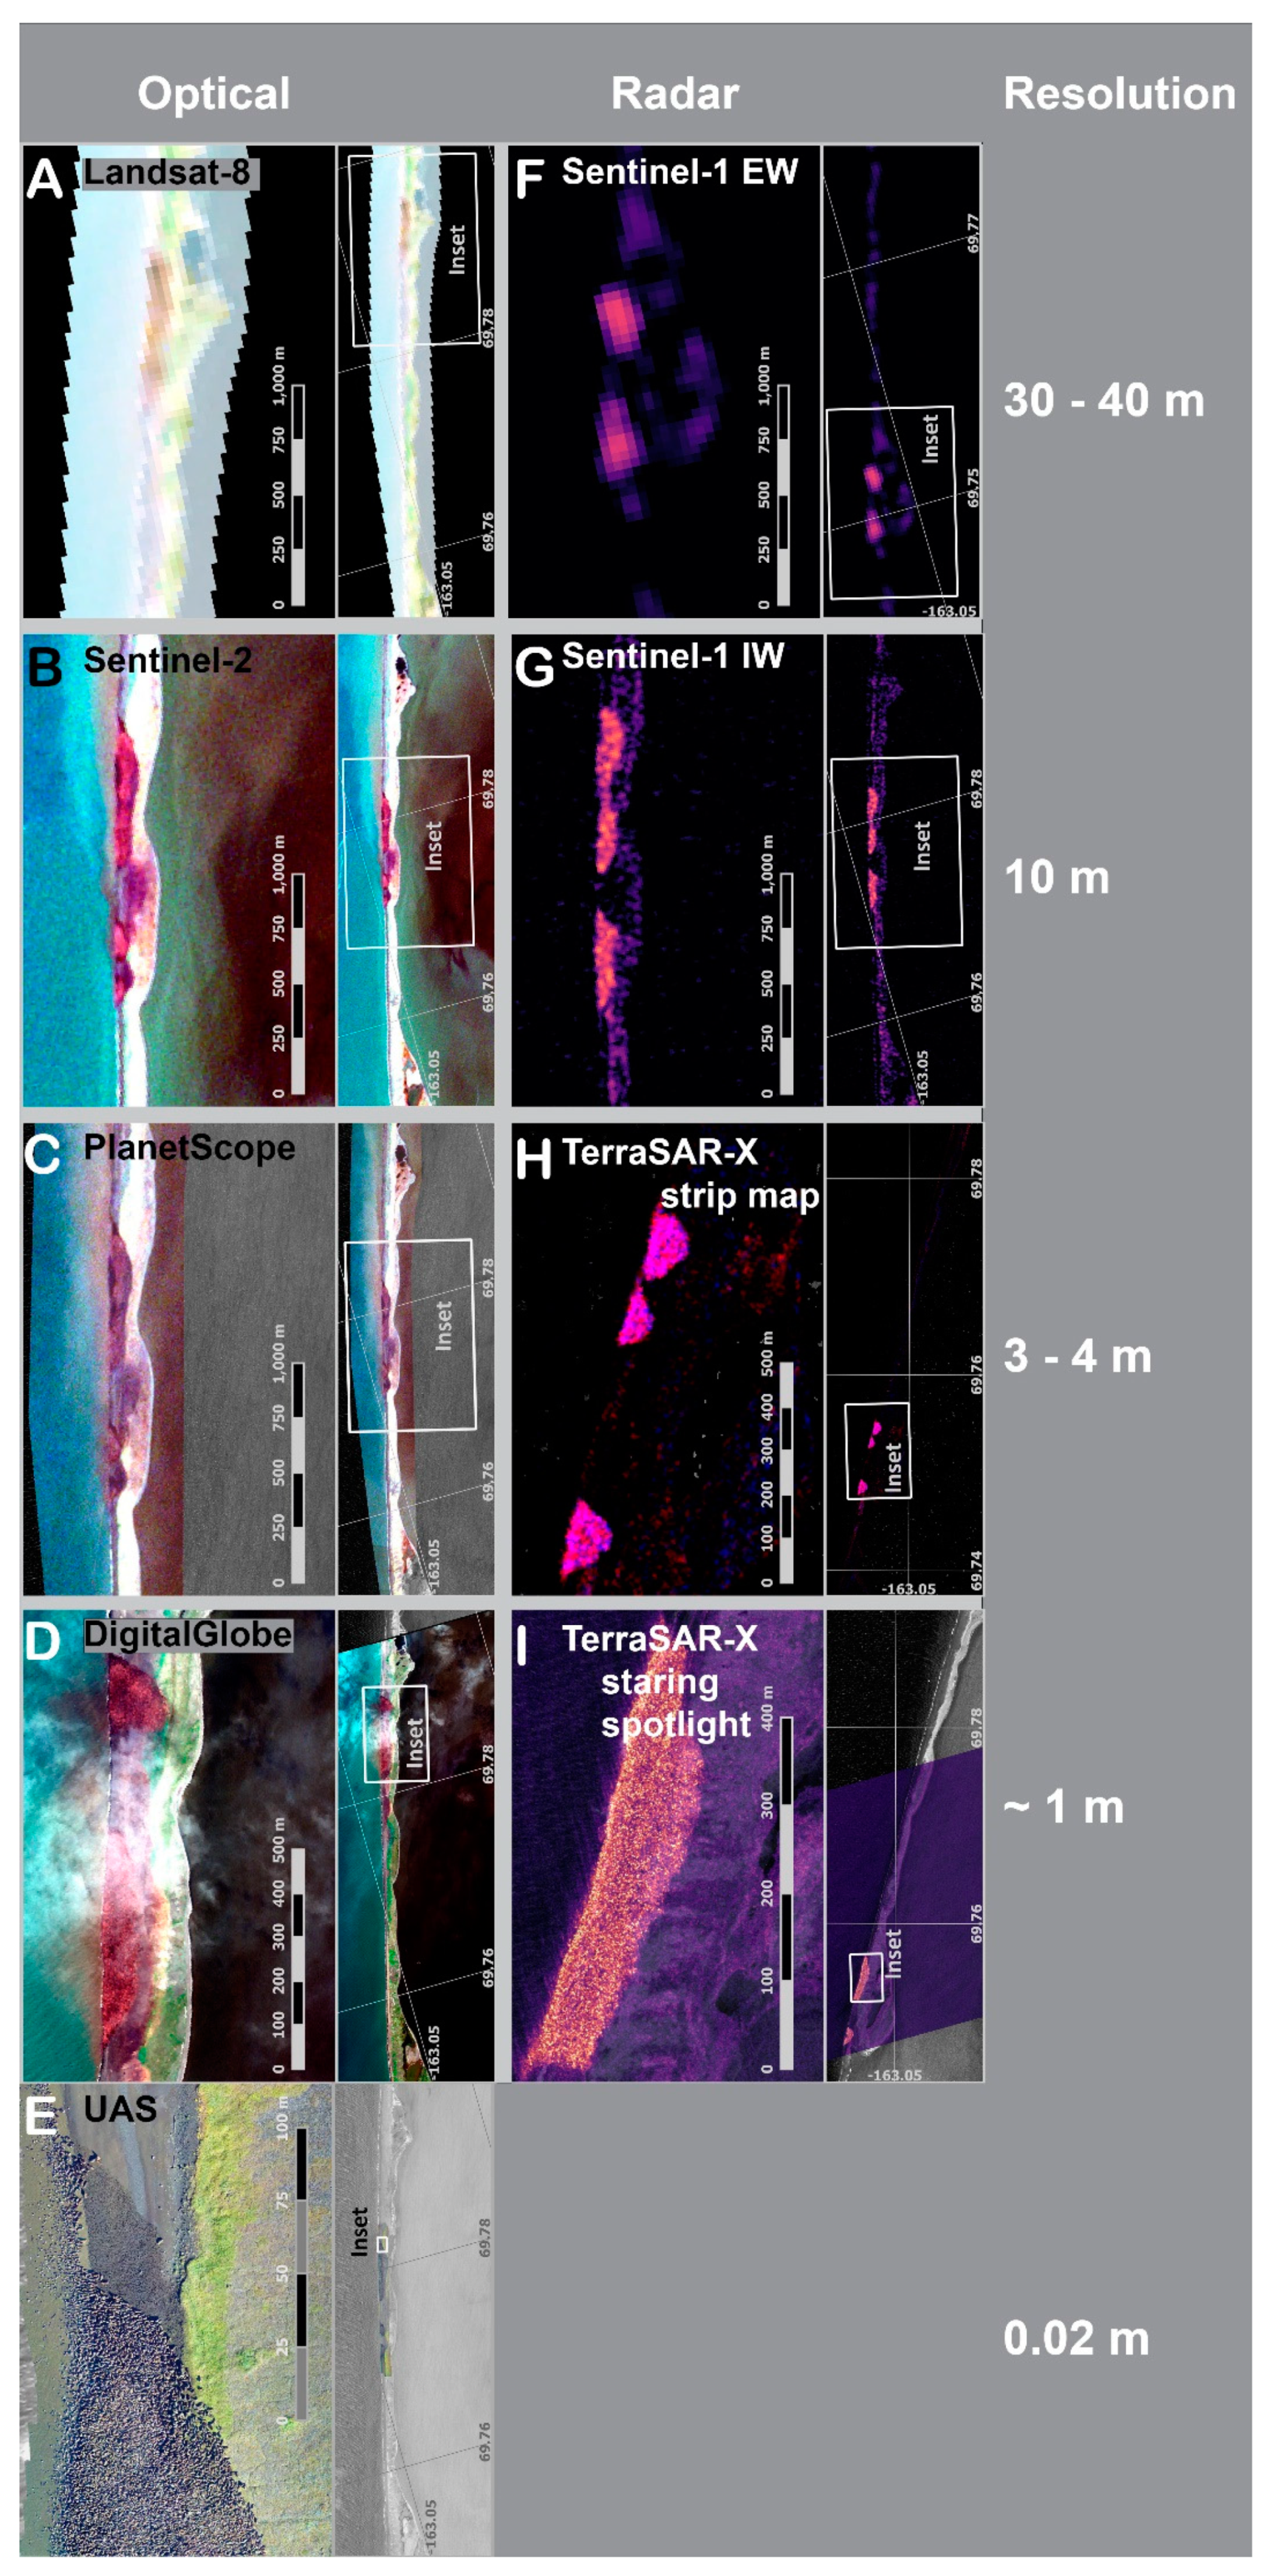
Examples of each imagery type when walruses were present are shown in
Figure 1. Most of the clear view optical images were obtained by PlanetScope and Sentinel-2. Although both of these missions collected imagery every 1–2 days over the study area, the median clear view revisit rate for each mission was 3 days (
Table 1), and with considerable variability (PlanetScope IQR, 4.7 day and Sentinel-2 IQR, 5.0 day) resulting in an irregular time series for both imagery types. Few clear view images were collected by the Landsat-8 mission due to the long 16-day revisit time and variable cloud conditions. During the 2020 haulout season PlanetScope browse images documented only 12 clear view days. Although we had not prearranged for image collections by DigitalGlobe, three clear view images were available in the archives: one each from GeoEye-1, WorldView-1, and WorldView-2. Regardless of the mission, no optical images were available after October 23, presumably because solar illumination failed to meet data collection or processing thresholds.
Archived Sentinel-1 SAR images of the study area were available during 2018, 2019 and 2020 in both the IW (n = 46) and the EW (n = 18) imaging modes [
31]. Limited daylight in November did not impede the collection of Sentinel-1 imagery. Sentinel-1 IW images were available for Point Lay every 12 days in 2018 (collected by Sentinel-1A only), and in 2019 and 2020 (with collections by both Sentinel-1A and Sentinel-1B) with a revisit rate of roughly 10 days. Sentinel-1 EW images were only available in 2019 and 2020, with mostly a 12-day revisit interval, but occasionally a 4 or 8 day. For TerraSAR-X, we obtained data from two imaging modes, staring spotlight (n = 12) and dual-polarized stripmap (n = 4).
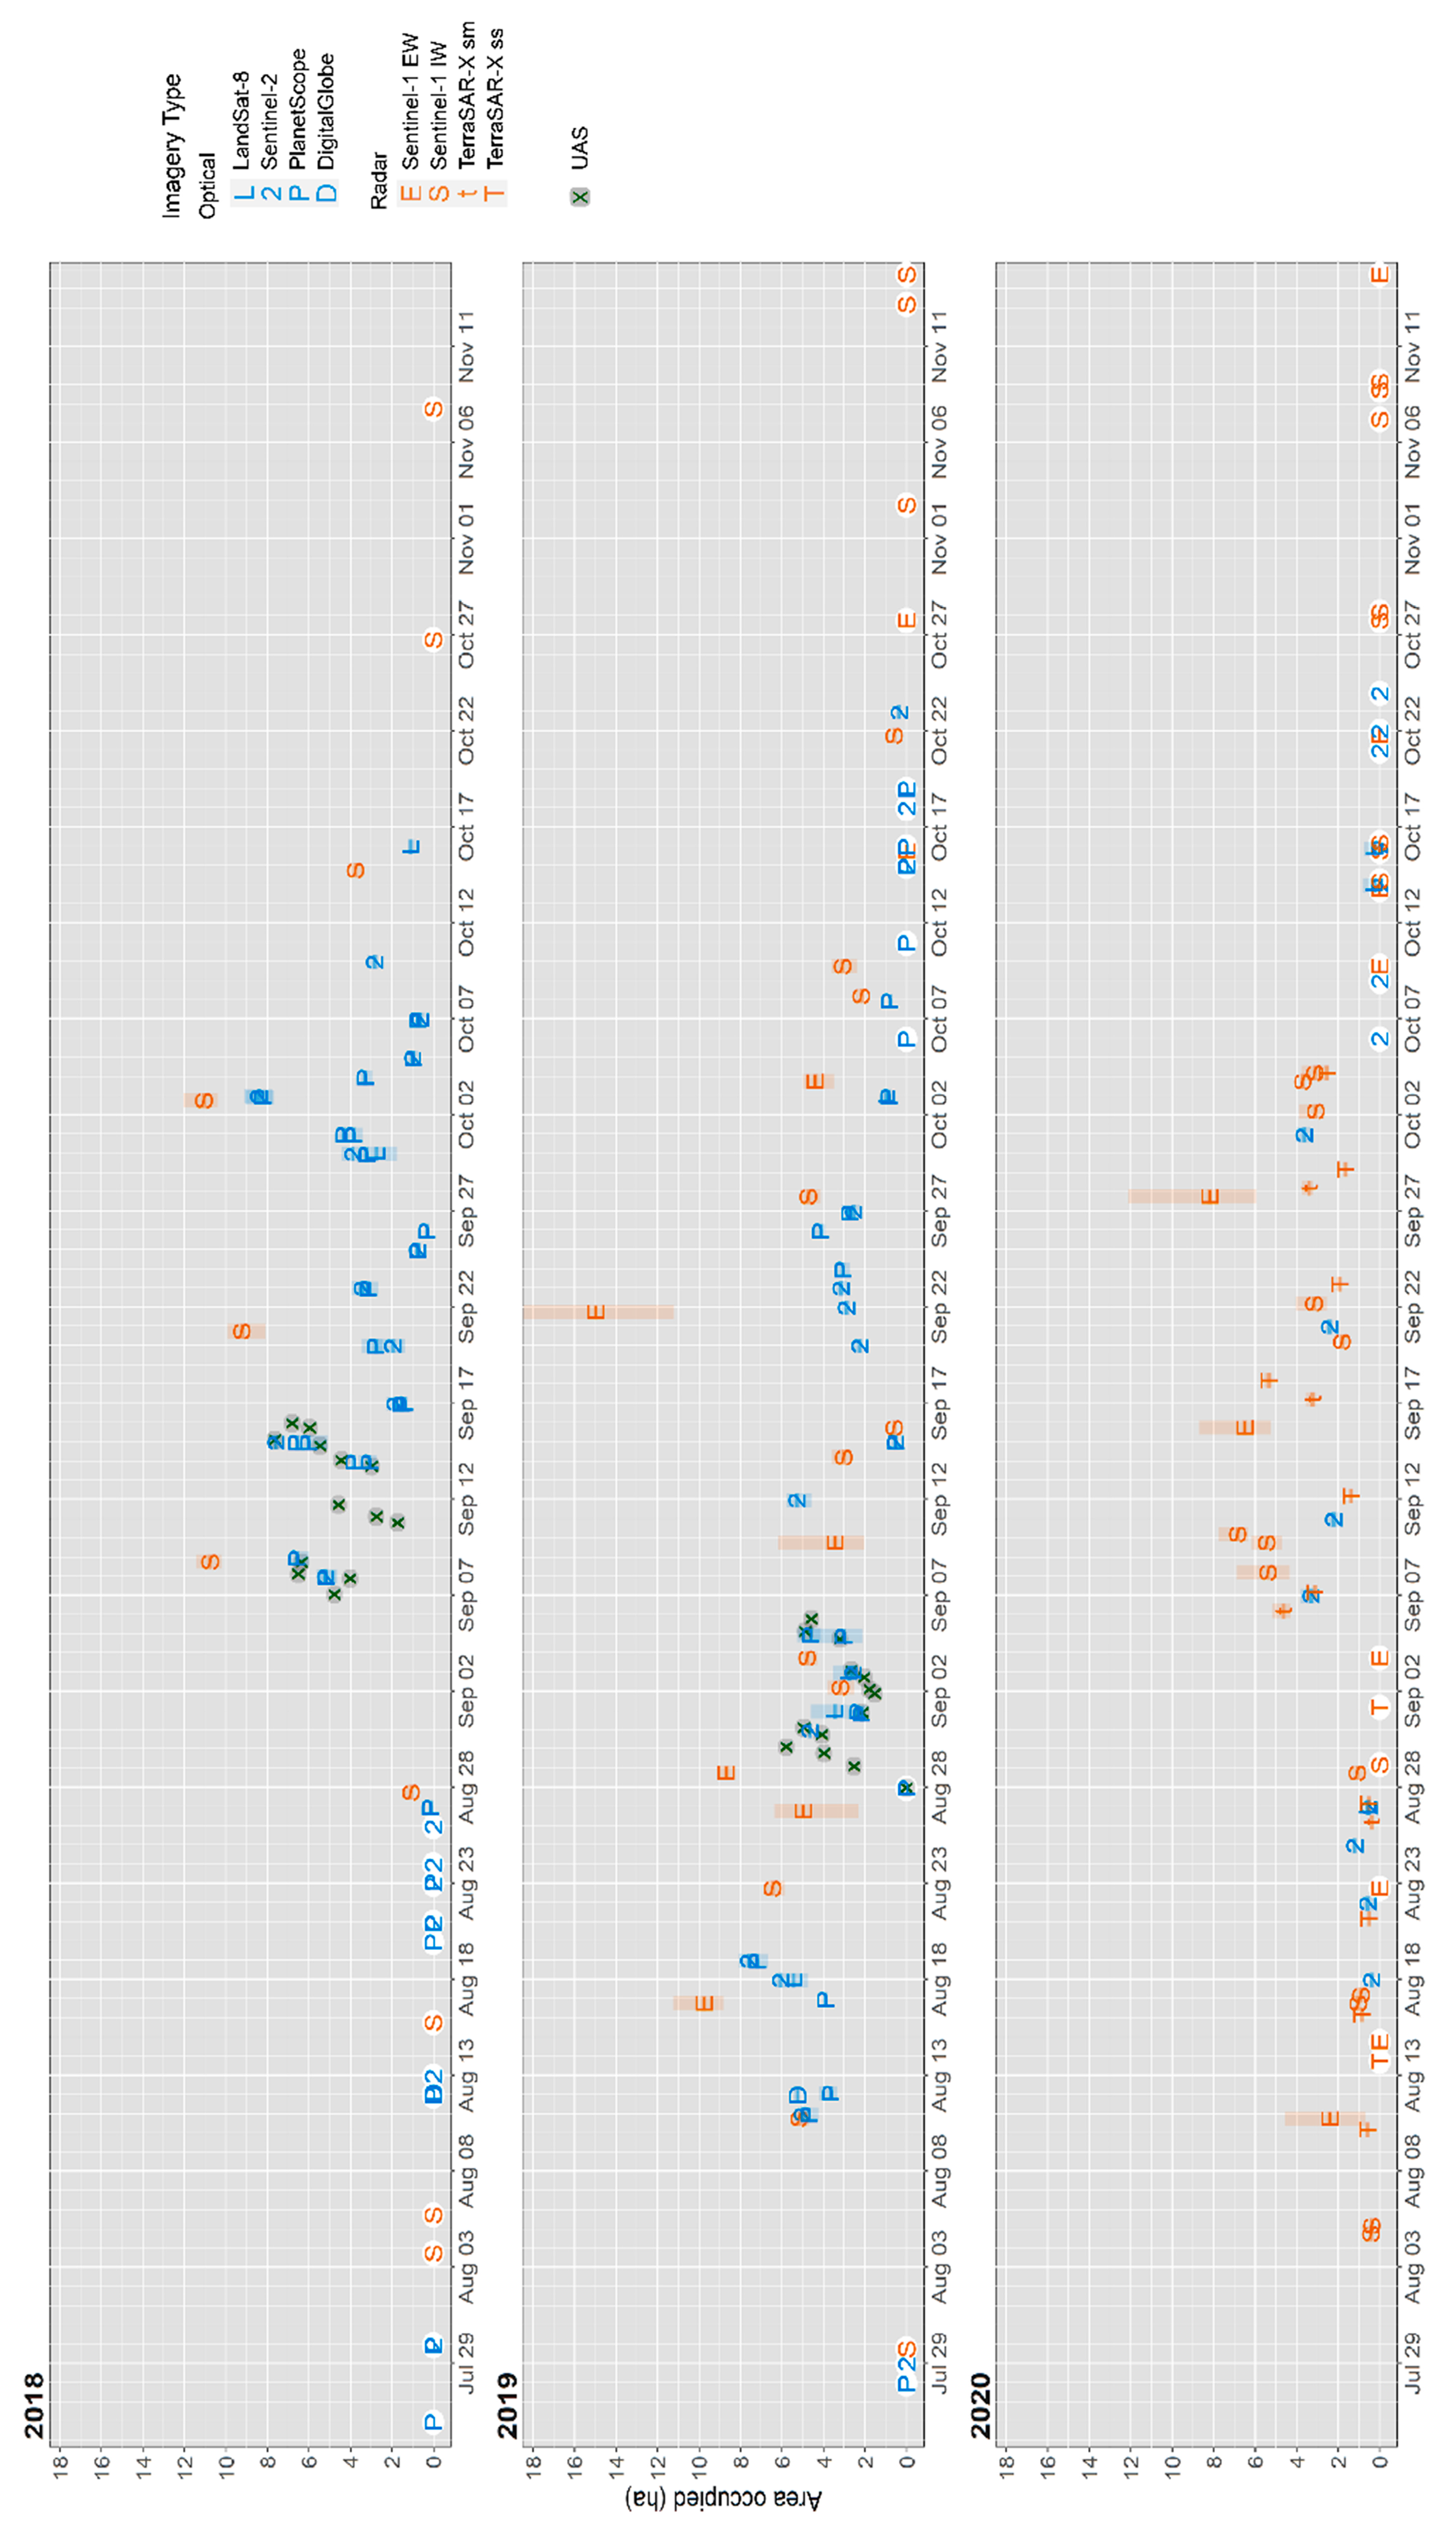
Pooling the walrus detections across all image types conveyed information about the seasonal timing and within-season dynamics of occupancy at the Point Lay haulout (
Figure 2). During the three study years, we could estimate the start and end dates of the walrus haulout season based on the first and last detections of walrus aggregations: 26 August–16 October 2018, 10 August–21 October 2019, and 2 August–4 October 2020. Periods of persistent cloudiness introduced temporal gaps into the haulout area estimates from optical imagery, but those gaps would often be filled with estimates from SAR imagery.
Excluding data from the coarse Sentinel-1 EW images, we detected walrus aggregations that ranged in size from 0.14 to 11 ha. The vertical bars in
Figure 2 represent the full range of areas occupied by walruses, as delineated by the three observers. Variability among the observer interpretations was typically small relative to the mean area occupied across all imagery types, except for those from the coarse Sentinel-1 EW. The area occupied by walruses, as interpreted from satellite imagery, qualitatively agreed with the UAS surveys (
Figure 2). The magnitude of day-to-day fluctuations in the area occupied, as documented by UAS surveys, emulated estimates obtained from satellite imagery. The size of the area occupied varied from zero to as much as eight or more hectares in each study year (
Figure 2), excluding the Sentinel-1 EW estimates. Reasonable agreement between satellite imagery types was often evident when images were collected within a day of one another (again, disregarding the Sentinel-1 EW estimates).
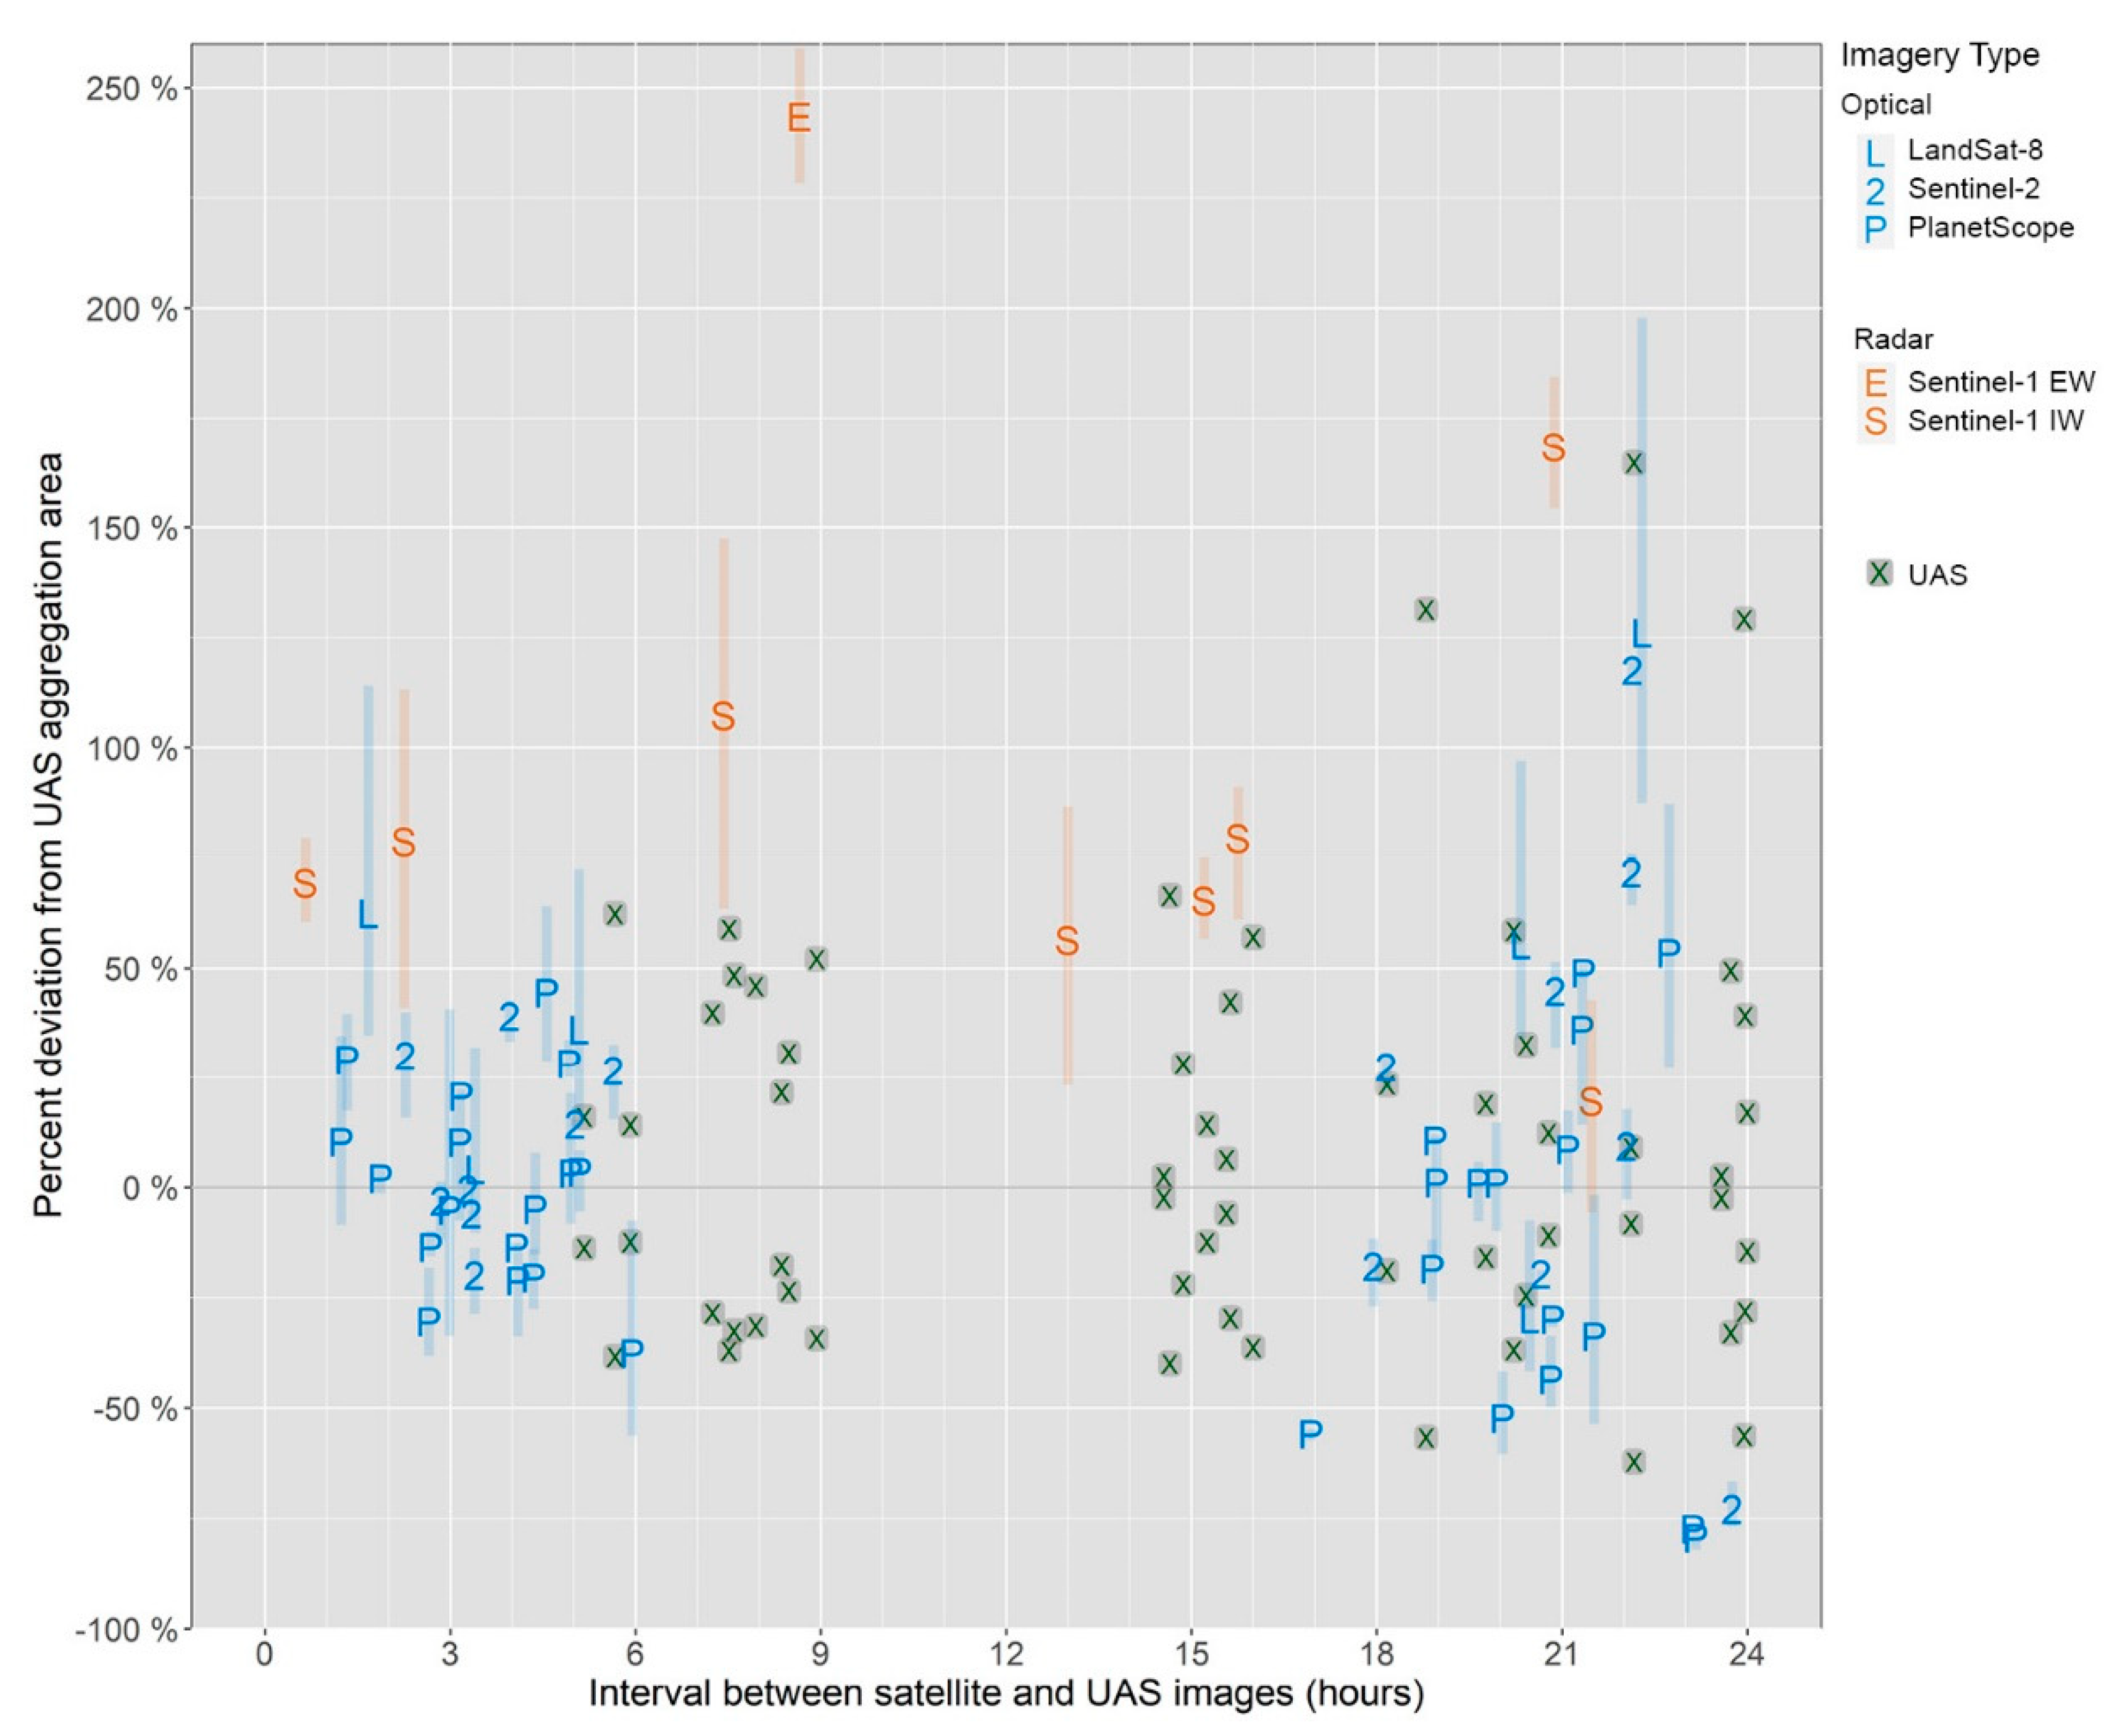
Eighteen satellite images were collected within 24 h of a UAS survey, and because UAS surveys were often conducted in both the morning and afternoon of the same or consecutive days, 26 UAS surveys were collected within 24 h of another UAS survey (
Figure 3). All walrus aggregations apparent in the satellite images were also present at similar locales in the matched UAS imagery, and vice-versa. However, we found substantial differences in walrus aggregation size, even between pairs of UAS images collected < 9 h apart, revealing just how dynamic the walrus aggregations can be over short time intervals. UAS surveys of walrus aggregations collected within 5–9 h of another UAS survey documented proportional changes in the area occupied by as much as 50% (
Figure 3). That magnitude of deviation between paired UAS surveys was evident and somewhat greater when survey times differed by 12–24 h. Notably among the optical satellite imagery types, the range of deviations between the satellite-derived and UAS-derived estimates followed the same pattern as that between the UAS surveys themselves, indicating that the former deviations (those between optical satellite and UAS imagery) could be entirely due to the dynamics of walruses shifting on and off the haulout and/or shifts in haulout density during the relatively short intervening time between data collections.
Four SAR images were collected within 24 h of a UAS survey (three Sentinel-1 IW images matched to 8 UAS surveys, and one Sentinel-1 EW image matched to a single UAS survey), and all produced mean area estimates of walrus occupancy that exceeded the estimates from paired UAS images. The three Sentinel-1 IW images matched to UAS surveys on the same day (<8 h) had deviations ranging from 69% to 107%, and a single same-day Sentinel-1 EW image produced a deviation exceeding 240%.
Observers were unanimous in classifying whether each clear view satellite image (n = 195) had detectable walruses present (n = 129), with the exception of two Landsat-8 images (2020–10–13 22:38Z and 2020–10–15 20:00Z) in which only one observer identified walruses on shore. The digitized extent of aggregations varied among observers, and that variability differed substantially between the satellite missions and imaging modes, as evidenced by the increase in between-observer CV-RMSE that accompanied increasing image resolution (
Table 1). Not surprisingly, the average CV-RMSE of the estimated area occupied by walruses was small for the higher resolution imagery (TerraSAR-X staring spotlight and DigitalGlobe), and large for the low-resolution imagery (Sentinel-1 EW and Landsat-8). Observer differences in aggregation size exceeded 50% of the mean size for coarse-resolution imagery types, ~20% of the mean for moderate-resolution types, and ~10% or less among the higher resolution types (
Table 1).
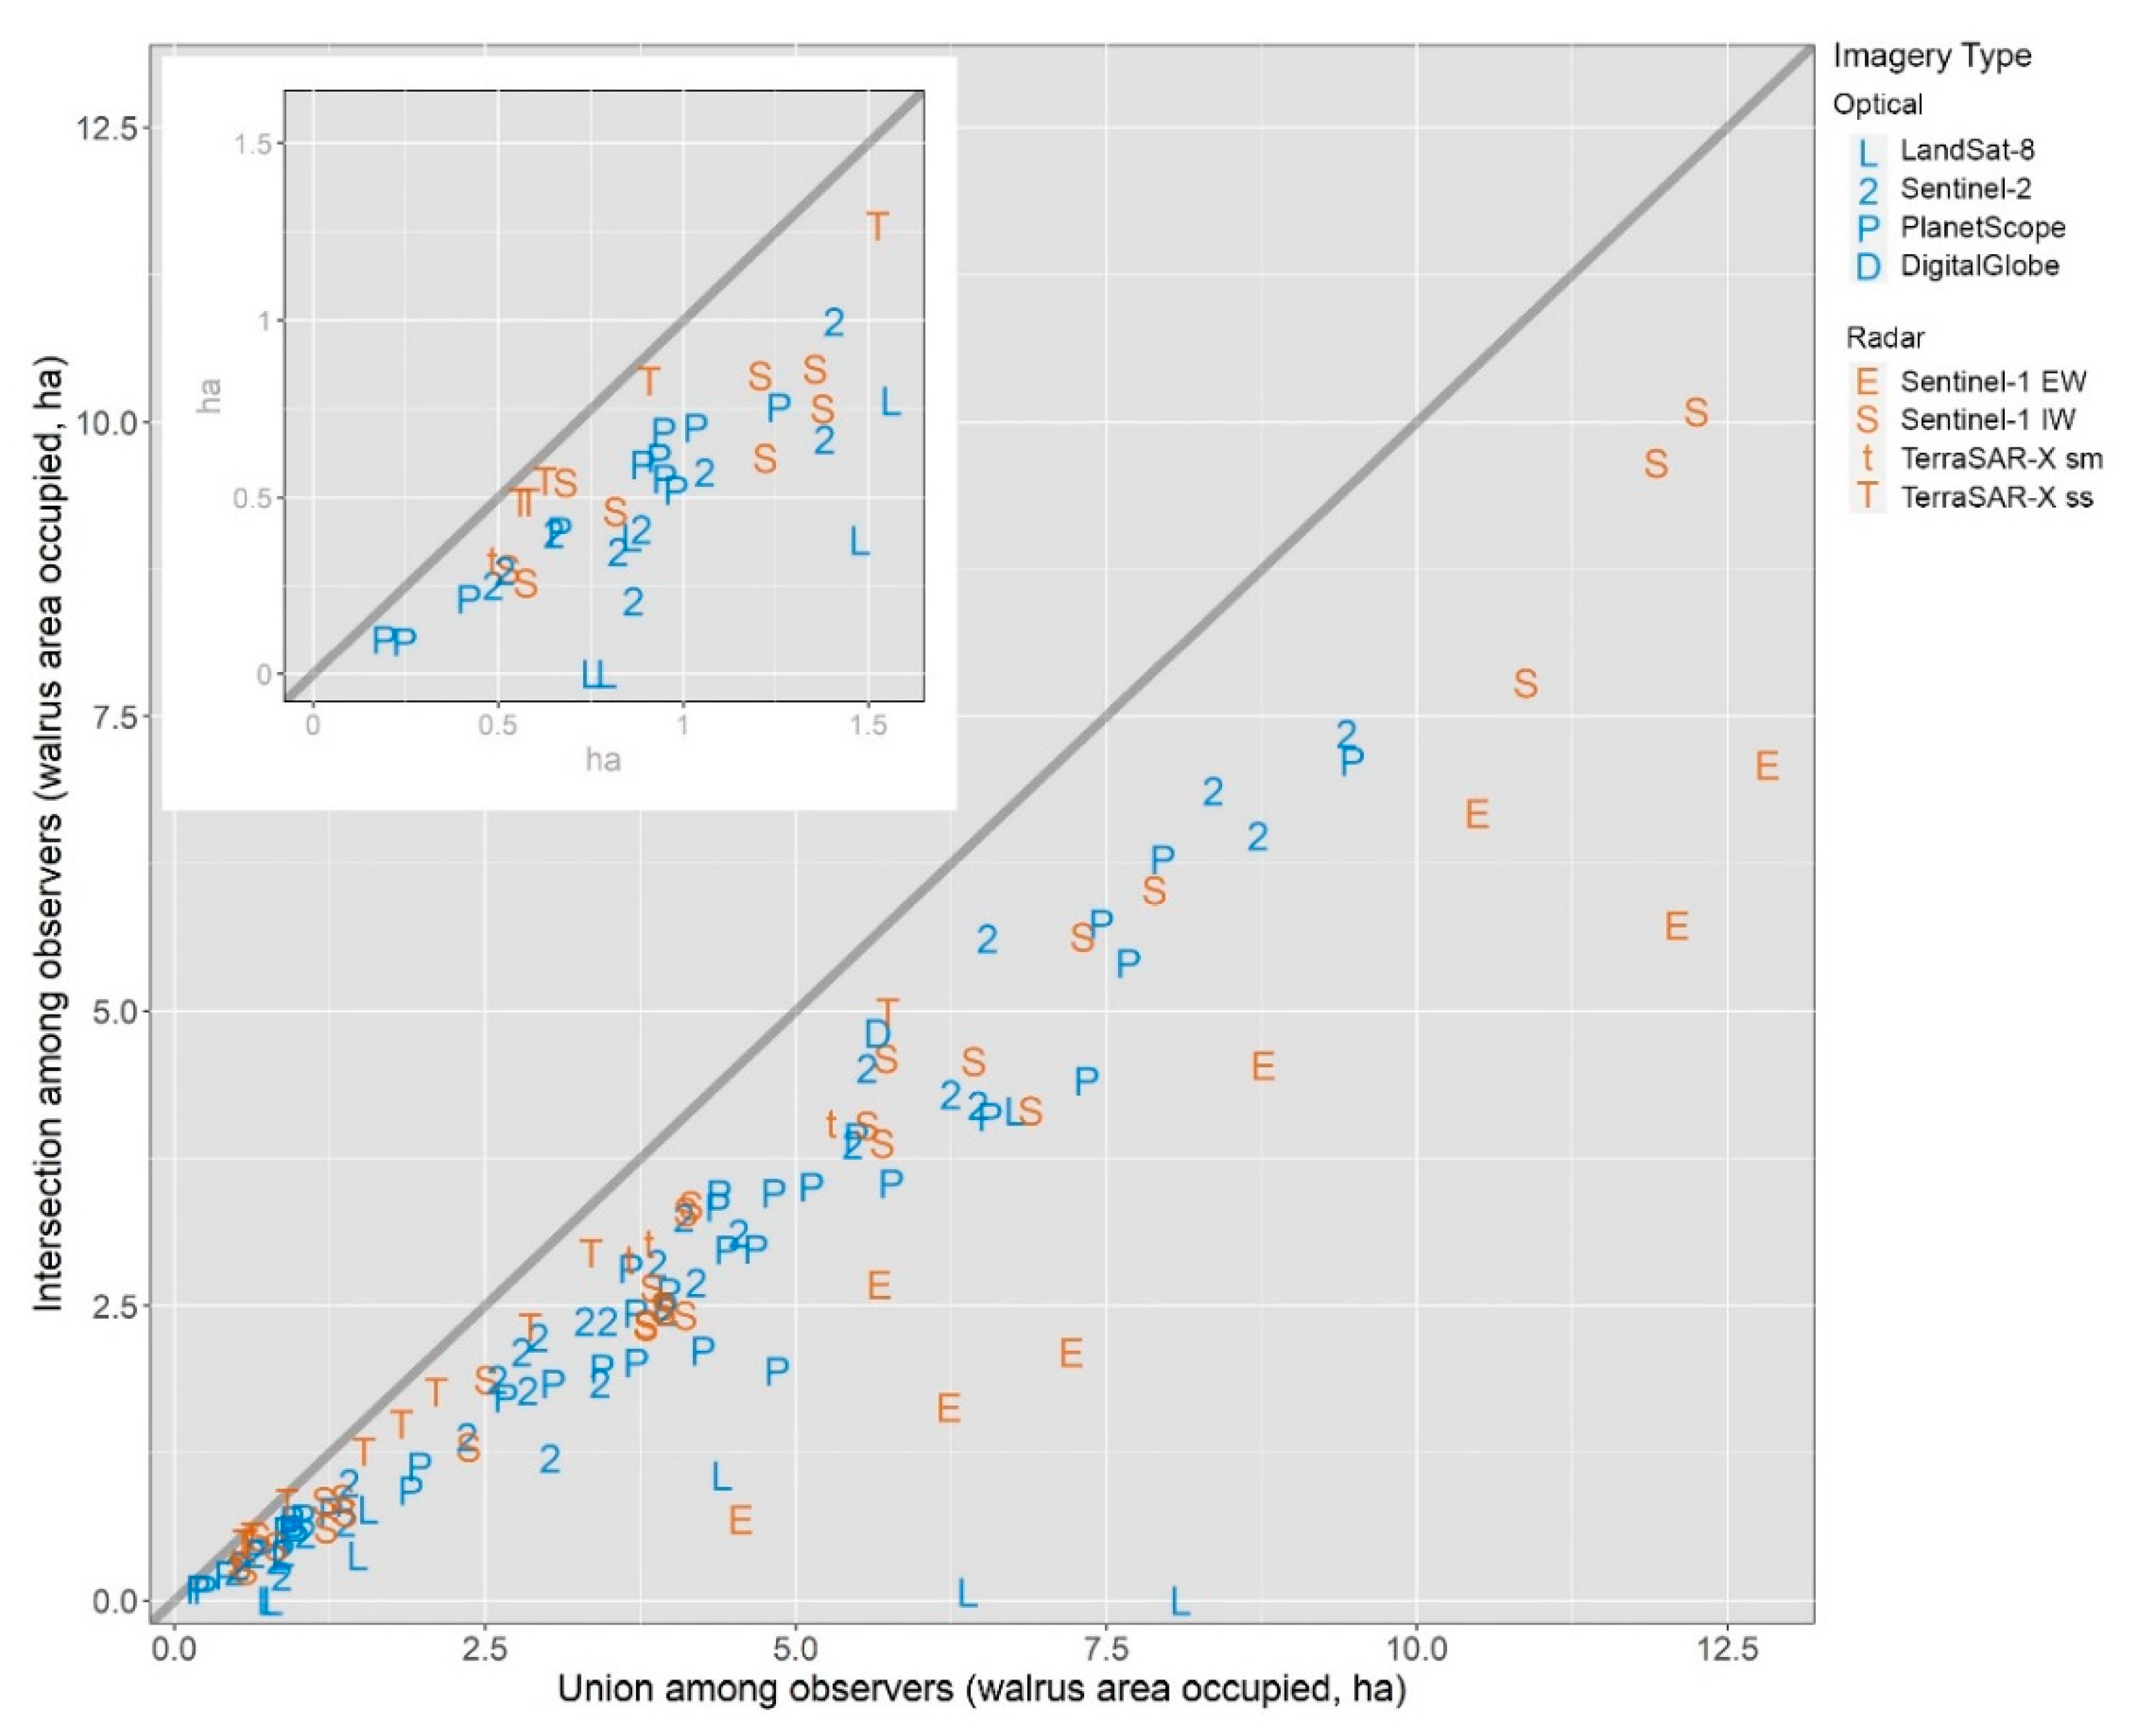
Not only did observers differ in estimating the area occupied by walruses, but they also differed in precisely where they delineated the aggregation boundaries. The digitized area of overlap (intersection) common to all three observers, expressed as a fraction of the total (union) area, ranged from 0.25 to 0.85 and was inversely related to image resolution (
Table 1). Higher-resolution imagery types, such as TerraSAR-X and DigitalGlobe, more consistently approached a 1-to-1 intersection:union relationship (i.e., perfect 3-way spatial agreement) between observers (
Figure 4). For any given imagery type, the degree of spatial consistency achieved among the observers is reflected in how closely the intersection:union values adhere to the 1:1 reference line displayed in
Figure 4, and by the regression slopes presented in
Table 1. Lower-resolution imagery types (Landsat and Sentinel-1 EW) had the greatest spatial disparity among observer delineations of aggregations. In fact, some Landsat images produced complete or near-complete disparity in the locations (or even presence) of walruses, and overall had the lowest spatial correspondence among observers. Although the Sentinel-1 EW images had coarser resolution (40 m), observers were unanimous in identifying images with walruses and had slightly better spatial agreement than Landsat in delineating the aggregations. Among the moderate resolution image types (PlanetScope, Sentinel-2, Sentinel-1 IW, and TerraSAR-X stripmap), the spatial agreement among observers was markedly better, with regression slopes ranging between 0.68–0.78. As expected, observers attained the highest levels of 3-way spatial agreement when delineating walrus aggregations with the ~1-m-resolution TerraSAR-X staring spotlight, which resulted in an intersection:union slope of 0.85, and with DigitalGlobe, which had an average observer overlap of 0.85 for the one clear view image we obtained with walruses present (
Table 1).
4. Discussion
We found that publicly and commercially available satellite imagery can be used to detect the presence, areal size, and geographic position of walrus aggregations at a terrestrial haulout near Point Lay, Alaska. Not only were observers able to consistently determine when walruses were present, they also were able to delineate the extent of aggregations with considerable agreement and consistency with aerial surveys. These findings suggest that satellite reconnaissance may provide a tool for monitoring walrus haulout occupancy and dynamics, as may be required by resource managers. Both the reliability and precision of detecting walruses with satellite imagery are important criteria for monitoring, and both varied among the different types of imagery we evaluated. For optical imaging, reliability was limited by (1) the mission’s revisitation frequency, a predictable factor (i.e., a factor that may be predicted at the start of a study), (2) adequate solar illumination, a predictable factor, and (3) clear-sky conditions, an unpredictable factor. For SAR imaging, reliability was limited by (1) the mission’s revisitation frequency and (2) mission-controlled acquisition scheduling. Below, we discuss technical advantages and disadvantages of the different imagery types for monitoring walrus haulouts. Monitoring efforts can achieve increased temporal resolution by combining interpreted data from various imagery types, as evidenced by the temporal resolution of the haulout occupancy across the three study seasons (
Figure 2). However, we do not attempt cost assessments of commercial imagery because pricing can vary widely, depending on factors like volume, latency, institutional licensing, and contractual arrangements.
Coastal walrus haulout sizes can change substantially over short time intervals. During less than five hours, [
32] reported a 46% reduction in the number of walruses hauled out at Point Lay. During the 2018 and 2019 UAS surveys, fluctuations of up to 60% in the area occupied were documented between UAS surveys collected 5 to 9 h apart (
Figure 3, [
25]). These fluctuations were not only due to changes in the peripheral extent of walrus aggregations on shore, but also due to the formation of holes within aggregations which may not be evident in some satellite imagery, depending on resolution. Among UAS surveys conducted within 9 h of a prior survey (n = 10), the estimated number of walrus individuals ranged from 1900 to 14,780 [
25]. Such dynamics over the course of only a few hours confounded our attempts to directly compare haulout area estimates from satellite and UAS imagery because most were not collected near-coincidently (on the order of minutes, not hours).
4.1. Optical Imagery
Clouds were the most prevalent obstacle for detecting walruses with optical imagery at the Point Lay haulout during the haulout season. Although aggregations could sometimes be delineated through thin clouds using a near-infrared band, opaque cloud cover was common and often persistent. Even the PlanetScope constellation with near-daily revisitations was precluded from collecting clear view imagery for periods lasting upwards of ten days during each year. Cloud cover varied across the study years, but it is reasonable to expect that on-average roughly two-thirds of optical images at Point Lay could be contaminated by clouds, resulting in data gaps of variable duration (
Table 1 and
Figure 2). The Sentinel-2 and PlanetScope time series, taken together, had gaps lasting >10 days in both 2019 and 2020, and 2 such gaps in 2018. Periods of persistent clouds were also reflected in a 2005–2020 record of weather station data from the nearby Point Lay airport [
33]. Annually during 25 July to 23 October, at times suitable for optical remote sensing (10:00–16:00 local), the fraction of hourly sky-condition records classified as being ‘clear’ or with ‘few clouds’ averaged 35% (sd 13%, n 14 years), consistent with the roughly two-thirds fraction of cloud-contaminated satellite images that we had obtained for 2018–2020.
Nighttime also prevents use of optical imagery for detecting walruses, a limitation that rapidly establishes during autumn at high latitudes. For example, at Point Lay’s latitude (~69.7°N) in mid-October, the maximum sun elevation is ~12°, and by late-October it drops to <6° [
34]. No Sentinel-2 or PlanetScope images of Point Lay were available in the archives after ~23 October, presumably due to insufficient solar illumination. Although walruses appeared to have vacated the haulout by mid-October during the years of our study (
Figure 2), haulouts on the northern Russian coast of Chukotka are commonly used throughout November, including the largest known haulout at Cape Serdtse Kamen’ [
35], so objectives to monitor haulouts range-wide with optical sensors would face late-autumn limitations.
Given previously published accounts of detecting walruses with ~1-m resolution satellite imagery [
9,
10,
11,
12], it was not surprising that the DigitalGlobe image of our study area rendered very close observer agreement on both the location and area occupied by the large walrus aggregation present (
Figure 4, [
31]). Monitoring a walrus haulout with commercial high-resolution imagery, such as that collected by the DigitalGlobe satellites (currently Geoeye-1 and WorldView-1, 2, and 3), requires prearranged scheduling to ensure data collections. DigitalGlobe will also soon deploy “WorldView Legion”, a constellation of six satellites (first launch planned for 2021) that will be capable of imaging most places in the world multiple times a day, and Planet Labs is now operating the SkySat constellation of 21 satellites capable of imaging targeted sites with 0.5 m resolution imagery collected up to 7 times daily [
20].
In comparison, Planet Labs operationally collects and archives imagery worldwide every day with its PlanetScope constellation, and Sentinel-2 does the same every 2–3 days at Arctic latitudes, so prearranged acquisitions are not necessary and the broad swath width of these imagery types better enables detection of walrus aggregations that may sometimes move several kilometers within a haulout area. We found that both PlanetScope and Sentinel-2 imagery yielded reasonable agreement among observers on the location and area occupied by walruses (
Figure 4). Although PlanetScope images have higher resolution (4 m) than Sentinel-2 (10 m), the latter’s superior radiometric quality seemed to help compensate its coarser spatial resolution. For a retrospective study like this one aimed at detecting and delineating walrus aggregations, the combined efficacy of PlanetScope’s daily archive and Sentinel-2’s public archive provided an informative time series of optical imagery, but it was often compromised by periods of persistent cloud cover.
Landsat imagery yielded considerable disagreement among observers in estimating the area occupied by walruses. In 2 of 9 Landsat images classified as having walruses present, observers delineated walrus aggregations at dissimilar locations, resulting in near-zero 3-way overlap among digitized areas (
Figure 4). The discrepancies apparently arose in images that had discolorations along the beach, which some observers interpreted to be walruses while others considered the coloration to reflect previous walrus occupancy. This ambiguity of observer interpretation, combined with the sensor’s coarse spatial resolution, long revisit interval, and more than two-week latency between image collection and availability (which was generally one day or less for all other imagery sources), indicates Landsat imagery to have limited value for walrus monitoring.
4.2. SAR Imagery
Walrus aggregations at the Point Lay haulout produced unambiguous radar backscatter signatures that yielded unanimous detection agreement and high spatial agreement among observers, except for the 40-m resolution Sentinel-1 EW imagery (
Figure 2). Adult Pacific walruses are 2.3–3.6 m in length and beneath their ~2 cm thick skin they have a 2–6 cm thick blubber layer comprised mostly of lipids [
2]. When gathered at coastal haulouts, Pacific walruses crowd together forming a near continuous mat of irregularly arranged biomass 1–2 m thick that extends over hundreds to tens of thousands of square meters [
31]. We found that walrus aggregations produced strong backscatter when imaged with either C-band (Sentinel-1) or X-band (TerraSAR-X) radar, and irrespective of co- (VV, HH) or cross-polarization (VH). It is important to note, however, that the fine-grained beach sediments and negligible terrain at the Point Lay haulout provided ideal conditions for minimizing radar returns that might have otherwise been confused for walruses (
Figure 1).
Deviations between the estimated area occupied by walruses determined from Sentinel-1 imagery and that of matched UAS surveys were almost always greater than zero (
Figure 3). The differences were typically greater in magnitude than those between pairs of near-contemporary UAS surveys (
Figure 3), and the positive bias was persistent across all three observers and contrasts with the positive and negative pattern of deviations among optical imagery matched to UAS surveys (
Figure 3). The prevalence of the Sentinel-1 bias suggests one or more factors had consistently contributed to observers inflating the peripheries of walrus aggregations. One factor may stem from the multi-look processing that is applied during SAR image synthesis, which tends to blur edges [
36]. The positive bias might have been tempered had observers applied a more conservative backscatter threshold for discriminating the edges of aggregations. Also, visually delineating edges becomes more ambiguous as pixel size increases, which likely added to the high observer variability among the Sentinel-1 EW interpretations (
Figure 2).
The most precise SAR imagery type for determining the location and areal size of walrus aggregations was the ~1-m resolution staring spotlight mode from TerraSAR-X, which yielded high observer agreements (
Table 1 and
Figure 4); however, even when operating in the lower-resolution (3.5 m) stripmap mode, TerraSAR-X produced unambiguous detections of walruses with notable spatial agreement among observers. Compared to the constrained footprint of staring spotlight (4.6–7.5 km × 2.5–4.6 km), stripmap mode is more capable of imaging larger study sites in a single pass because it collects data over a broader swath (30 km wide with single polarization).
For monitoring at the Point Lay haulout, we found Sentinel-1 IW to be compromised by long revisit intervals, and Sentinel-1 EW to be compromised by low spatial resolution. Sentinel-1 is presently dedicated to collecting and archiving SAR imagery globally, prioritizing IW mode over land areas and EW mode over oceans [
37]. Each of the two Sentinel-1 satellites has a revisit interval of 12 days for the IW mode, however, because the 2 satellites operate in complimentary orbits, their theoretical combined revisit rate is 6 days at the equator and more frequently with increasing latitude. Nevertheless, we only realized a combined ~10-day median revisit rate for the IW mode at our study area (
Table 1). It appeared that scheduling nuances for IW and EW acquisitions may have influenced what mode was prioritized for our coastal study site, and the site was unfortunately located at an extreme edge of IW’s acquisition grid (data frames along orbital paths), which caused missed opportunities for data collections that would have otherwise yielded a higher revisit rate.
There are several other existing and expanding SAR satellite missions that significantly increase potential revisit rates worldwide. While we acquired only a sample of TerraSAR-X imagery to assess the backscatter of walrus aggregations with a higher resolution X-band instrument, operationally, TerraSAR-X is capable of collecting stripmap imagery of any locale in the Arctic with revisit rates as often as 1–3 days. Furthermore, several other SAR missions have launched multi-satellite constellations capable of imaging high-latitude areas every day, or potentially multiple times a day. In 2019, Canada launched the RADARSAT Constellation [
38] comprised of three C-band SAR instruments. RADARSAT data are freely available to approved Canadian users, and possibly to approved international users in the future. Italy’s COSMO-SkyMed [
39] is a 4-satellite X-band SAR constellation that is currently being upgraded with second generation instruments. Among several modes of operation, COSMO-SkyMed has a 3 m resolution stripmap product that may be well-suited for walrus haulout monitoring. Finland’s ICEYE [
40] is an X-band SAR constellation presently comprised of 10 satellites with plans to launch 8 more in 2022. ICEYE also has a 3-m resolution stripmap mode. In the United States, two commercial SAR companies have recently been established: Capella Space [
41] and Umbra Labs Inc. [
42]. Capella has launched three X-band SAR satellites with plans to launch four more by late 2021, and Umbra may begin launching its X-band constellation in late 2021. Both Capella and Umbra are designed to acquire high-resolution imagery (~1-m and finer), and similar to TerraSAR-X, both have developed automated interfaces to give customers the ability to schedule data acquisitions themselves on-demand. Collectively, the many existing and emerging sources of SAR imagery suggest that daily or near-daily all-weather monitoring of walrus haulouts may soon be attainable, given advanced scheduling arrangements.
4.3. Future Research
Automated algorithms for detecting and delineating walrus aggregations might provide faster and more objective ways to implement broad-scale haulout monitoring than the manual interpretation methods used in this study. Automated walrus detection based on spectral and change detection algorithms have been explored with high-resolution imagery [
12]. The multiple bands of a multispectral sensor like DigitalGlobe’s lend rigor to development of automated detection algorithms. Assessments of lower resolution and less spectrally diverse optical imagery like PlanetScope and Sentinel-2 also warrant a review to ascertain if algorithms could provide reliable and repeatable methods for haulout monitoring objectives. Similarly, the high contrast of walrus aggregations in C-band and X-band SAR imagery relative to non-occupied areas at Point Lay suggests that automated algorithms might offer a repeatable and reliable alternative (or complement) to manual interpretation.
Compared to other haulout sites across the Pacific walrus range [
6], the local topography at Point Lay is exceptionally flat and comprised of relatively uniform fine-grained sandy sediments, lending to ideal conditions for minimizing SAR backscatter from non-occupied areas. In contrast, some of the other large and regularly used walrus haulouts abut bluffs and cliffs, and some beaches have variable sediment sizes including large cobbles or boulders. Such features would likely add several complications to the interpretation of SAR imagery and possibly compromise the ability to detect and discriminate walrus aggregations from non-occupied areas. At haulouts next to cliffs or bluffs, walruses could be rendered undetectable if they occurred within ‘shadows’ cast by oblique radar look angles. On the other hand, for SAR look angles facing into cliffs, double-bounced backscatter could produce confounding spatial anomalies, while rocky beaches could return backscatter sufficient to make walrus discrimination entirely ambiguous. Research is needed to evaluate SAR at haulouts with different types of terrain and substrates. Acquiring reference images of vacant beaches may provide baselines for detecting backscatter changes (including interferometry) produced by walrus occupancy. Field observations of walrus aggregations collected at the same time as SAR acquisitions are necessary to robustly evaluate methods designed to discriminate walruses at topographically complex haulout areas.
The positive bias of aggregation areas created from visual interpretation of Sentinel-1 imagery, as well as the variability among observers, was largely driven by differences in deciding how many pixels to include in an aggregation and not by disagreements in the presence or general locations of aggregations. Visual interpretations of the Sentinel-1 imagery could be improved through simultaneous collections of aerial imagery to quantify more precise backscatter thresholds for the delineation of aggregation peripheries.
In this study, we estimated the area occupied by walruses by outlining walrus aggregations apparent in satellite imagery. Knowledge of the occurrence and location of these aggregations can help managers mitigate potential disturbances in near-real time; yet, managers also need estimates of the number of walruses present on shore. We could not address abundance directly in this study because none of the satellite imagery types that we evaluated enabled counting individual walruses when they were gathered closely together onshore, and we could not address abundance indirectly because the densities of walruses when hauled out on shore are known to vary. Aggregation densities at the Point Lay haulout averaged 0.87 walruses per square meter (sd 0.17, n 26), and ranged from 0.67 to 1.5 [
25]. If we were to estimate walrus abundance based on the product of area occupied and the published densities (mean and variance), confidence intervals would likely be broad. If it were possible to estimate density with minimal variance from satellite imagery, then walrus abundance could be more precisely estimated using satellite imagery alone. Further research is needed to assess whether high resolution (<1 m) optical or SAR images contain sufficient information to accurately estimate walrus densities across fine spatial scales. Given that haulouts can shift in size over the course of just hours, field validation data (such as UAS survey imagery) collected coincident with prearranged satellite acquisitions would be required to robustly quantify relationships between the in-situ densities and those estimated with satellite data.


