Article

Spatial and Temporal Distribution of Geologic Hazards in Shaanxi Province

1
Key Laboratory of Water Cycle and Related Land Surface Processes, Institute of Geographic Sciences and Natural Resources Research, Chinese Academy of Sciences, Beijing 100101, China
2
College of Resources and Environment, University of Chinese Academy of Sciences, Beijing 100049, China
*
Author to whom correspondence should be addressed.
Remote Sens. 2021, 13(21), 4259; https://doi.org/10.3390/rs13214259
Submission received: 10 September 2021 / Revised: 16 October 2021 / Accepted: 18 October 2021 / Published: 23 October 2021

Abstract

:
The spatio-temporal distribution of geological hazards, including collapses, landslides, and debris flows, in Shaanxi province, China was studied based on data from 1951 to 2018. The potential impact factors, including the geomorphologic types, rivers, roads, rainfall, and earthquakes, were analyzed using Random Forests. The results indicated that most hazards occurred in summer (i.e., July–September) and were triggered by rainstorms. The freeze–thaw effect had a considerable contribution to hazards in the north. Spatially, most hazards in the north occurred in valley terraces of the Loess Plateau, while medium-relief terrane (relief ranged from 500 to 1000 m) in the southern Qinling Mountains were hazard-prone areas. The collapses and landslides were mainly affected by human factors in Northern Shaanxi, whereas in Southern Shaanxi geomorphology was the primary factor. Permeability was a dominant factor for debris flows. In addition, the 2008 Wenchuan earthquake had a remarkable influence on the spatial distribution of hazards. In contrast, for the situation in the Sichuan province, which was close to the earthquake epicenter, the Wenchuan earthquake triggered many collapse and landslide events in the southwest regions of Shaanxi province only on 12 May 2008. The thresholds for the three hazard types in the north and south regions were almost the same despite their distinctly different geologic characteristics. Through a sensitivity analysis, we found an appropriate dry period of 12 h for the area.

1. Introduction

Geological hazards such as landslides, rock falls, debris flows, ground fissures, and subsidence, often threaten the safety of human life and property [1]. As one of the countries with some of the most damaging geological hazards in the world [2], China has reported an economic loss of USD 981.29 million and a total of 4718 deaths caused by 463 fatal landslide events during the period from 2004–2016 [3]. In the Loess Plateau region of China, 14,161 geological hazard events were recorded from 2005–2015 [4].
Petley (2012) [5] studied the spatio-temporal distribution of fatal landslides on a global scale in the period from 2004–2010. They identified the high hazards within China, South Asia, Southeast Asia, Latin America and the Caribbean. Kirschbaum et al. (2015) [2] obtained a similar conclusion based on a global landslide dataset from 2007–2013. Lin and Wang (2018) [6] studied the spatio-temporal distribution of landslides in China from 1950 to 2016. They found the most vulnerable provinces were located in the southeastern and southwestern areas of China.
In order to predict the susceptibility of geological hazards, it is important to study the potential impact factors such as rainfall, geology and geomorphological conditions, and anthropogenic activities [7,8,9]. Through field observation and simulation, Qiu et al. (2018) [10] found that slope length was the controlling factor for loess slides. Wei et al. (2008) [11] analyzed debris flows in Southwest China and found the debris flows followed a normal distribution with most earth surface factors, except for the fault density. Chen and Yu (2010) [12] derived the topographic features from DEM before and after debris flows in Taiwan, and concluded that the topographic wetness and stream power were the most relative parameters. By analyzing an extreme event in 1993 on Lantau Island, Hong Kong, Zhou et al. (2002) [13] concluded that the rainfall intensity and the migration of the rainstorm center could greatly influence the occurrence of landslides. Using logistic regression, Ayalew and Yamagishi (2005) [14] found that the road network was an important determinant of landslide occurrence around Kakuda-Yahiko Mountain in central Japan. Based on the geographic detectors, Lin and Wang (2018) [6] concluded that the spatial distribution of fatal landslides was more closely related to interrelated factors such as the precipitation, topography, soil, lithology, vegetation, and population density, than to any individual factor. Feng et al. (2020) [15] employed machine learning methods to quantify the importance of different geomorphology factors. Because rainfall played a decisive role, the rainfall threshold model was extensively applied to understand the characteristics of rainfall-triggered hazards [16]. For instance, Guzzetti et al. (2007) [17] discovered that a lower average rainfall intensity was required to initiate landslides in Italy by establishing a rainfall threshold model. Zhuang et al. (2015) [18] analyzed the rainfall threshold, which triggered debris flow events in Jiangjia Ravine, Sichuan Province, China. Ali et al. (2021) [19] found that the most important factor for the rainfall-triggered landslides in Taiwan was the distance to the rivers, whereas the geological conditions dominated the earthquake-triggered landslides in Pakistan. In this study we used Random Forest techniques to quantify the contribution of various factors to the geological hazards.
In Shaanxi province of China, the population growth and rapid economic development, as well as the complicated geomorphology, rainfall events and strong fault movements have resulted in an increasing number of geological hazards [1,8,10]. So far, only a few researchers have examined the spatio-temporal distribution of geological hazards in the entirety of Shaanxi Province. Our study indicated that most landslides in Shaanxi Province were triggered by long-term antecedent and high-intensity intraday rainfall. The Wenchuan earthquake (12 May 2008) also triggered geological hazards in the Shaanxi Province, whereas most previous studies focused on the region of Sichuan province close to the earthquake epicenter.
The previously cited research motivated the present study. First, we divided the Shaanxi province into the north region (part of the Loess plateau) and the south region (part of the Qinba Mountain area). Next, we analyzed the spatio-temporal distribution characteristics of three types of geological hazards (collapses, landslides and debris flows) in these two regions. Afterwards, the potential impact factors involving rainfall, geomorphology, and earthquakes were investigated. Finally, we estimated the rainfall thresholds for the three hazard types, with a sensitivity analysis on the key parameter of dry period.

2. Materials and Methods
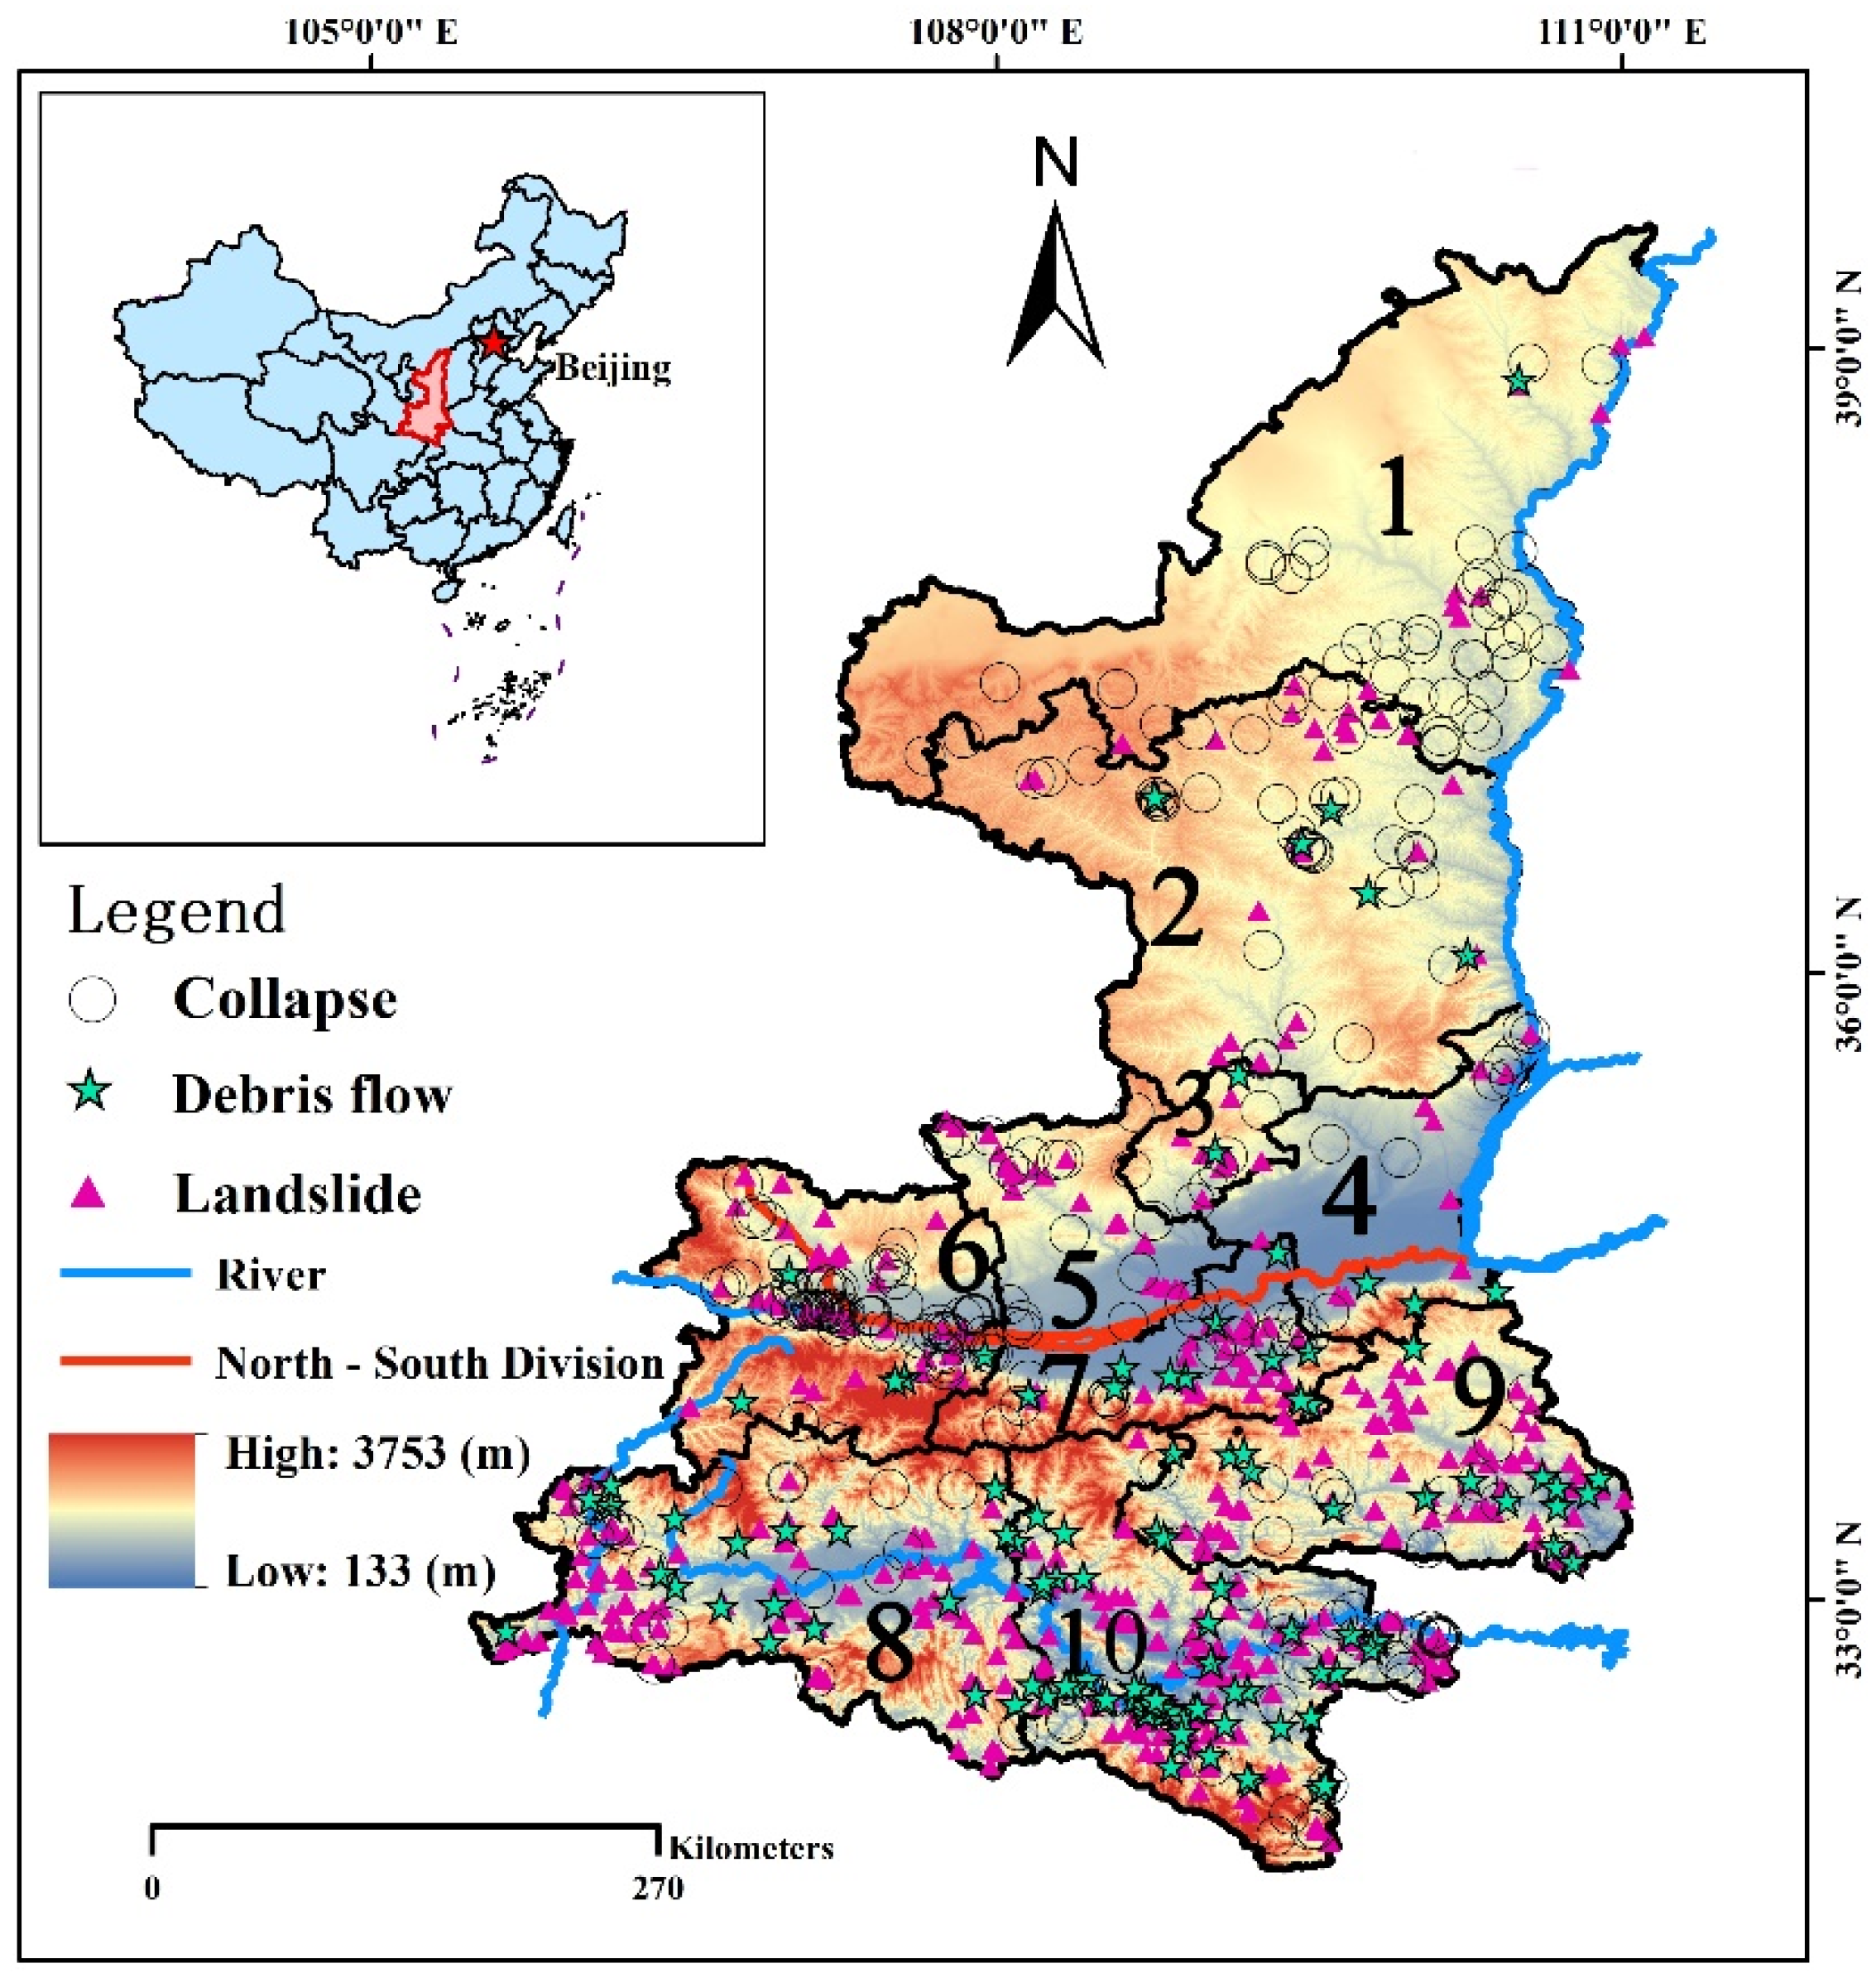
2.1. Study Area

Shaanxi province (105°29′–111°15′ E, 31°42′–39°35′ N) is located in northwestern China. The annual mean temperature varies from 6.5 °C to 16.6 °C, with a mean annual rainfall of 576.9 mm and with approximately 70% of the total rainfall occurring from July to September.
The elevation of Shaanxi province ranges between 133 and 3753 m (Figure 1), and its elevated regions are mainly composed of the Loess Plateau, Weihe River Plain, and Qinba mountain area. The Loess Plateau in Northern Shaanxi is covered by thick loess and has a mid-temperate monsoon climate. The central part of Shaanxi is the Weihe River Plain, and has a warm temperate monsoon climate. This area is the most major region of industry, agriculture and commerce in Shaanxi, and is heavily disturbed by human activities. The Qinba mountain area in southern Shaanxi has a north subtropical monsoon climate and is much more humid than the Loess Plateau and Weihe River Plain. Thus, the intensive rainfall and steep slopes lead to many hazards in this area.
Considering the different climate and geomorphology conditions between Southern Shaanxi and Northern Shaanxi as mentioned above, we divided Shaanxi province into two parts, with the Weihe River as the north–south dividing boundary (marked as red curve in Figure 1).

2.2. Data Sources and Methodology

The dataset of geological hazards from 1951 to 2018 was obtained from Shaanxi Meteorological Bureau, including the date and location of occurrence. The elevation from the Digital Elevation Model with a spatial resolution (RES) of 30 m was retrieved from the geospatial data cloud platform of the Computer Network Information Center of the Chinese Academy of Sciences (http://www.gscloud.cn, last accessed on 17 September 2020). The satellite rainfall data (GPM IMERG) with a temporal resolution of a half-hour was downloaded from the National Aeronautics and Space Administration (NASA). Tang et al. (2020) comprehensively evaluated the performance of the IMERG product in China with nine satellites and reanalysis products (TRMM3B42, CMORPH, PERSIANN-CDR, CHIRPS, SM2RAIN, ERA5, ERA-Interim, and MERRA2). Results show that the IMERG product outperforms other datasets. Meanwhile, the average amount of monthly rainfall from 1981 to 2010 was download from China Meteorological Data Service Center (http://data.cma.cn, last accessed on 19 September 2020). The road network was accessible on Open Street Map. The fault data were download from Geoscientific Data and Discovery Publishing system (http://dc.ngac.org.cn/Home, last accessed on 22 June 2021). Finally, the land use in 2010 (RES: 30 m), permeability coefficient (RES: 100 m) and soil erodibility factor (RES: 30 m) were derived from the National Earth System Science Data Sharing Service Platform (http://www.geodata.cn, last accessed on 21 September 2020).
Random Forests, an ensemble of substantial decision trees developed by Breiman et al. (1984) [20] and Breiman (2001) [21], are widely used in many fields. First, each decision tree used a bagging method to generate a sub-dataset from original dataset and then randomly chose the different variables at each node of the tree. Bagging is a method of repeated sampling from the original dataset according to the uniform probability distribution. The size of the sub-dataset was the same as that of the original dataset. We could obtain n sampling sub-datasets after n times of random sampling. Then, n decision trees were trained independently. Finally, the classification results were decided by the n decision trees through voting. The result with the largest number of votes is the final result (i.e., whether geological hazards occurred). As the results of each decision tree were trained by different samples, the Random Forests with low variance could ensure the stability of model and generalization ability.
The relative importance of various impact factors (VIM) could be calculated by Gini index. Gini index represents the reduction in sample purity after classifying the sample according to a potential impact factor. As the Gini index approaches 0, the results of classification are better. Each factor can be calculated by all of decision trees, and the relative importance of the factors can be obtained by averaging:
G i n i c ( D ) = 1 i = 1 a P i 2
where G i n i c ( D ) is the Gini index of sample D in node c; D is a sub-dataset sampling from original dataset; a is the number of results in sample D (in this paper a = 2; e.g., whether debris flow is occurred or not is two categories); and Pi is the probability of factor i in sample D:
V I M j G i n i = G i n i c ( D ) ( G i n i l ( D ) + G i n i r ( D ) )
where V I M j G i n i is the importance of the j factor; G i n i l ( D ) and G i n i r ( D ) is Gini index of two new nodes after node c branching downward:
V I M j i G i n i = V I M j G i n i c = 1 x V I M c G i n i
where V I M j i G i n i is the importance of j-th factor in i-th tree; V I M c G i n i is the importance in node c; and x is the number of nodes in i-th tree:
V I M j = i = 1 n V I M j i G i n i i = 1 m V I M i
where V I M j is the importance of j-th factor; V I M i is the importance of i-th factor; n is the number of trees in the Random Forests; and m is the number of factors (in this paper m = 9).
In this study, the original dataset was randomly split into 90% train data and 10% test data. The parameter of Random Forests was validated using grid search method with ten-fold cross-validation. In the process of classification, when the threshold of the classifier considered a sample to be positive (or negative) was adjusted, each threshold corresponded to a set of True Positive Rate (TPR) and False Positive Rate (FPR):
T P R = T P T P + F N
F P R = F P F P + T N
where TPR and FPR are the True Positive Rate and False Positive Rate, respectively; TP, FN, FP and TN are the True Positive, False Negative, False Positive and True Negative, respectively.
Receiver Operating Characteristics (ROC) formed a curve with TPR as the vertical axis and FPR as the horizontal axis. The Area Under the ROC Curve (AUC) was widely used to evaluate performance of the model and ranged from 0 to 1. As the value of AUC approaches 1, one obtains a better classifier or a higher model accuracy.
Rainfall is one of the main external driving forces for these three geological hazards. The ED rainfall threshold method, which is widely used over the world [22], was applied to reflect the minimum rainfall conditions of occurrences of geological hazards:
E = α D β
or
ln E = β ln D + ln α
where E is the cumulated rainfall amount of the rainfall event (mm), D is the duration of rainfall event (h), and α and β are the fitting parameters ranging from 0 to 1, respectively.
Here, the relationship between cumulative rainfall amount and duration was drawn on a logarithmic axis. Then, 5% quantile regression equation was applied to determine the α and β.
Given that rainfall data are usually continuous, the original rainfall data cannot be directly used to build the rainfall threshold model. Thus, a method for objective reconstruction of rainfall events developed by Melillo et al. (2015) [23] was applied to define the rainfall process responsible for geological hazards. The algorithm reconstructed individual rainfall events from a record of rainfall data through a series of “dry periods”. Melillo et al. (2018) [24] demonstrated that the “dry period” mainly depended on evapotranspiration. Thus, through comparing the differences of evapotranspiration between the Mediterranean area and Shaanxi province [24,25], we empirically evaluated the parameters to reconstruct rainfall events (Table 1).

3. Results

Understanding the spatio-temporal distribution of geological hazards is of key importance for the risk assessment and prediction of future occurrences. First, we analyzed the spatio-temporal distribution of geological hazards in Shaanxi province. Then, the distribution was explained and a rainfall threshold model was constructed. Finally, we discussed the sensitivity of the rainfall threshold model to the key parameters, i.e., dry periods.

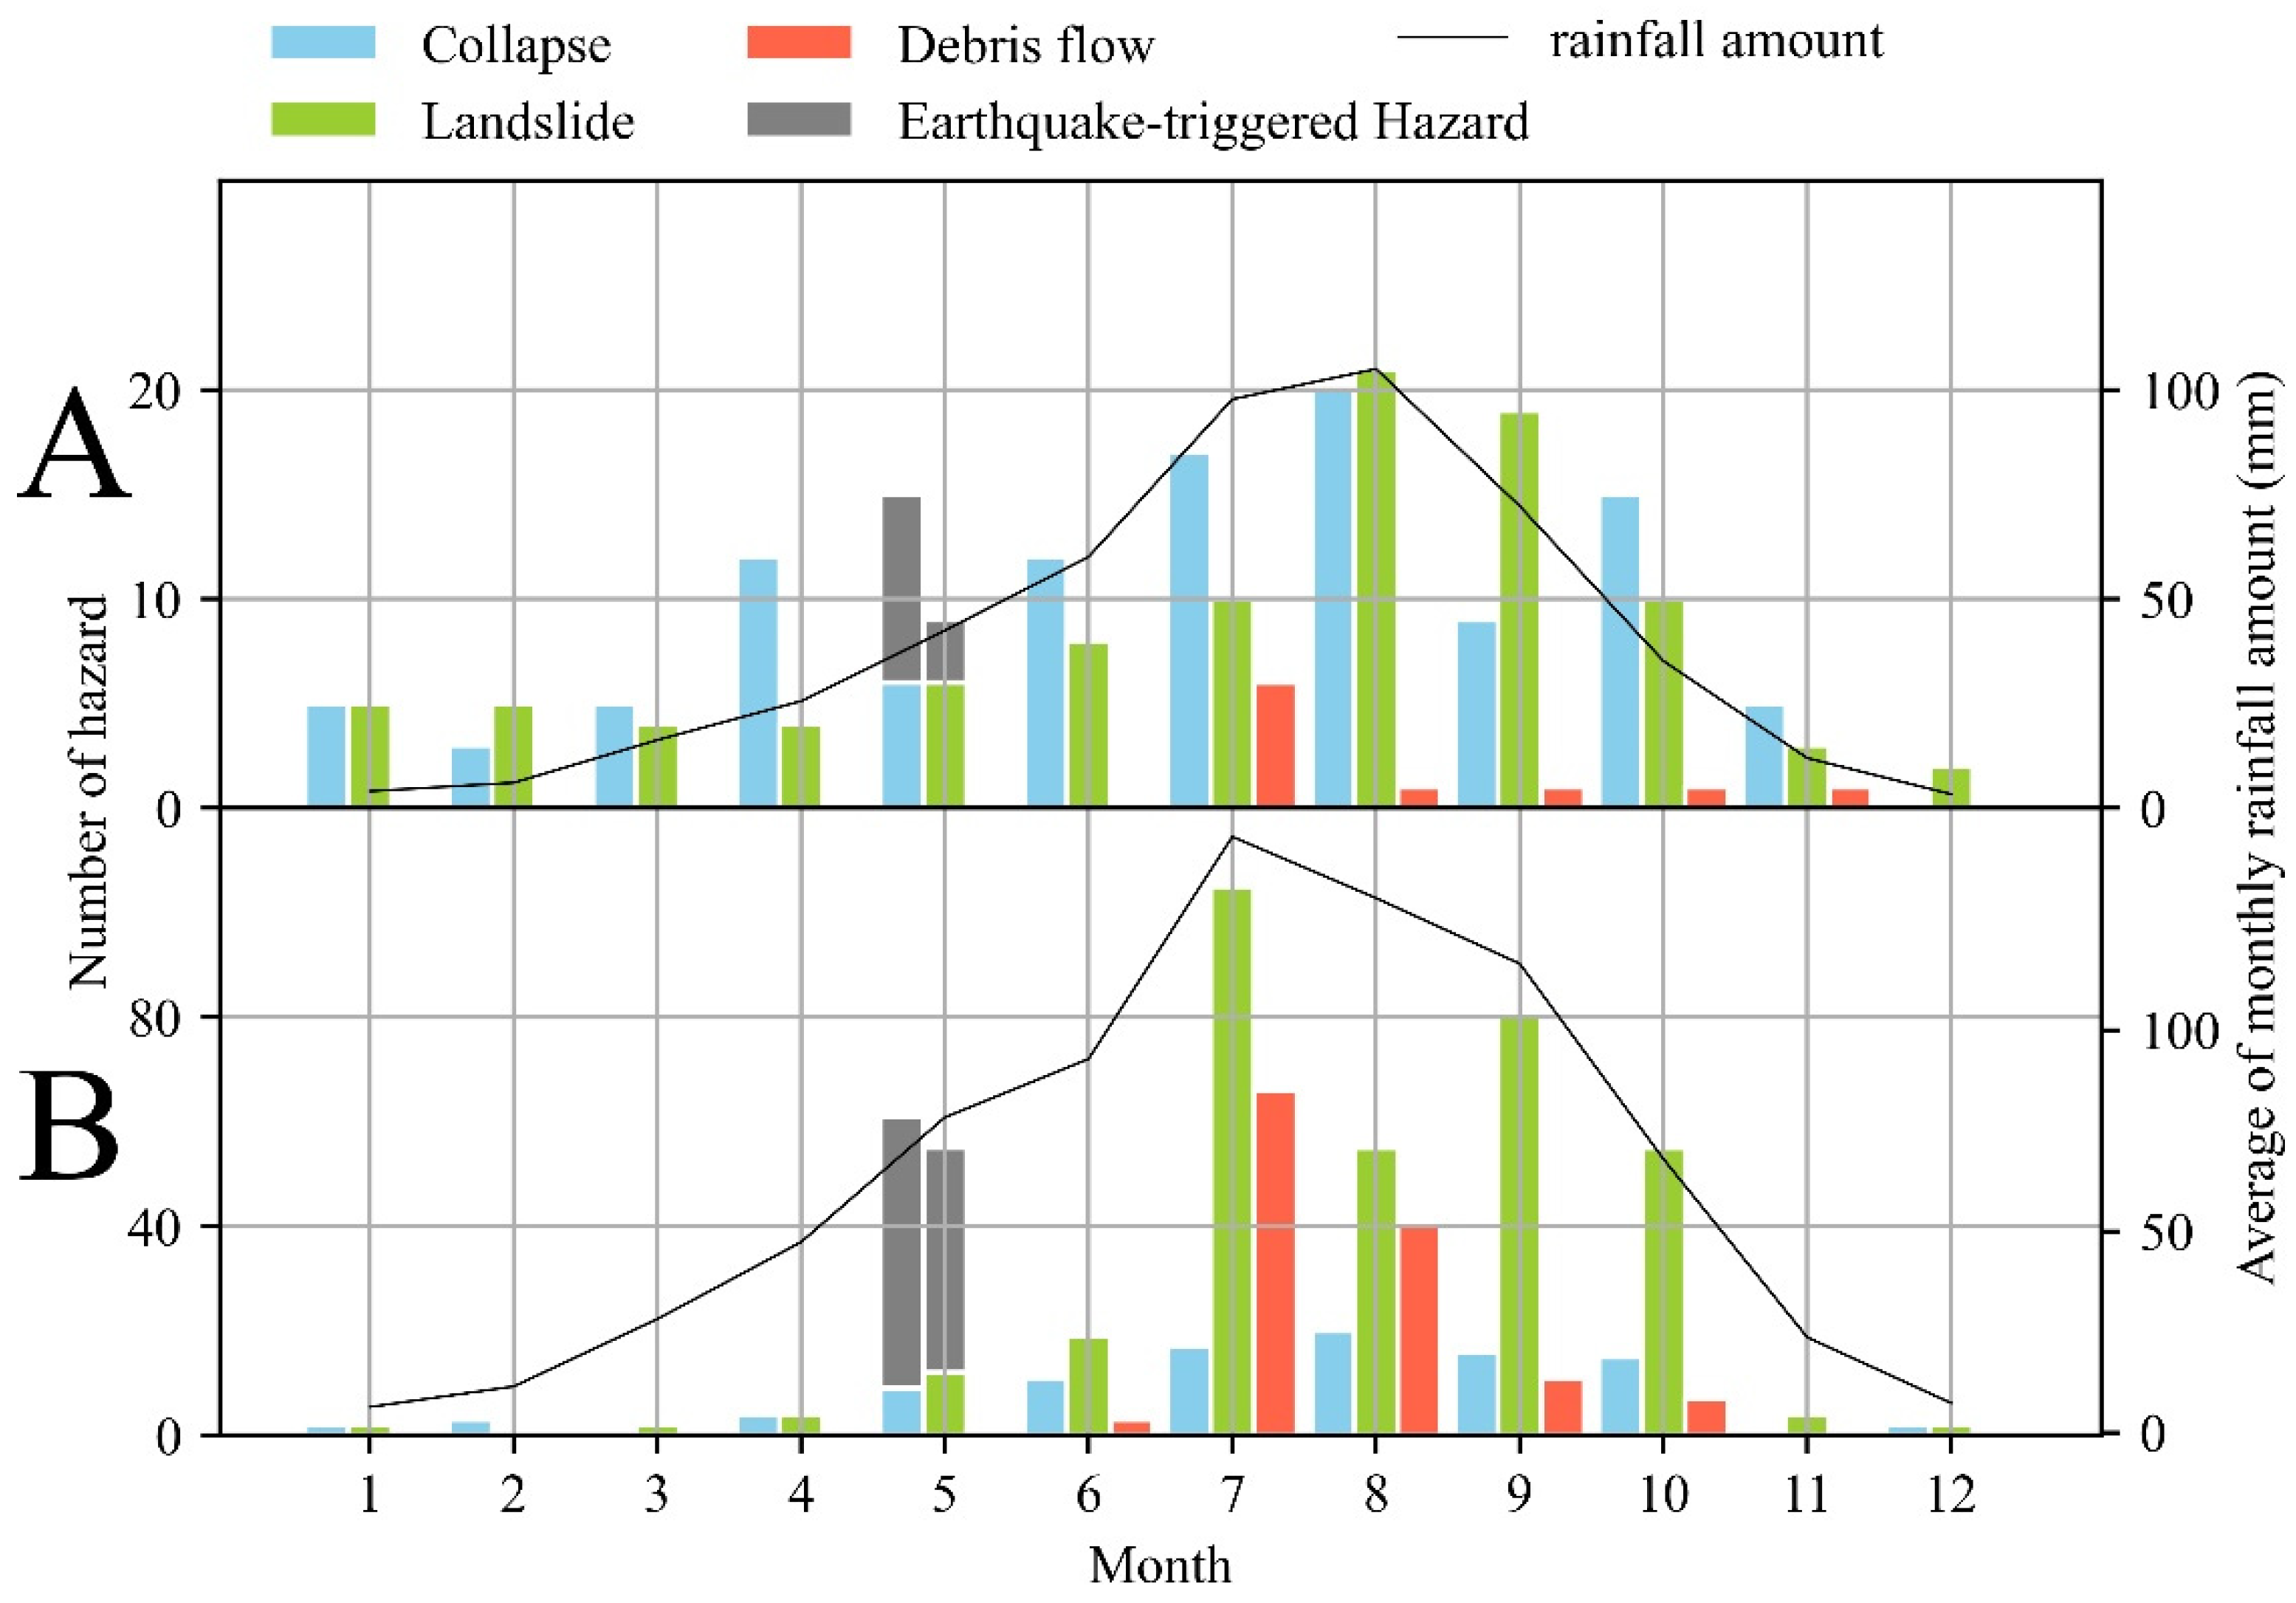
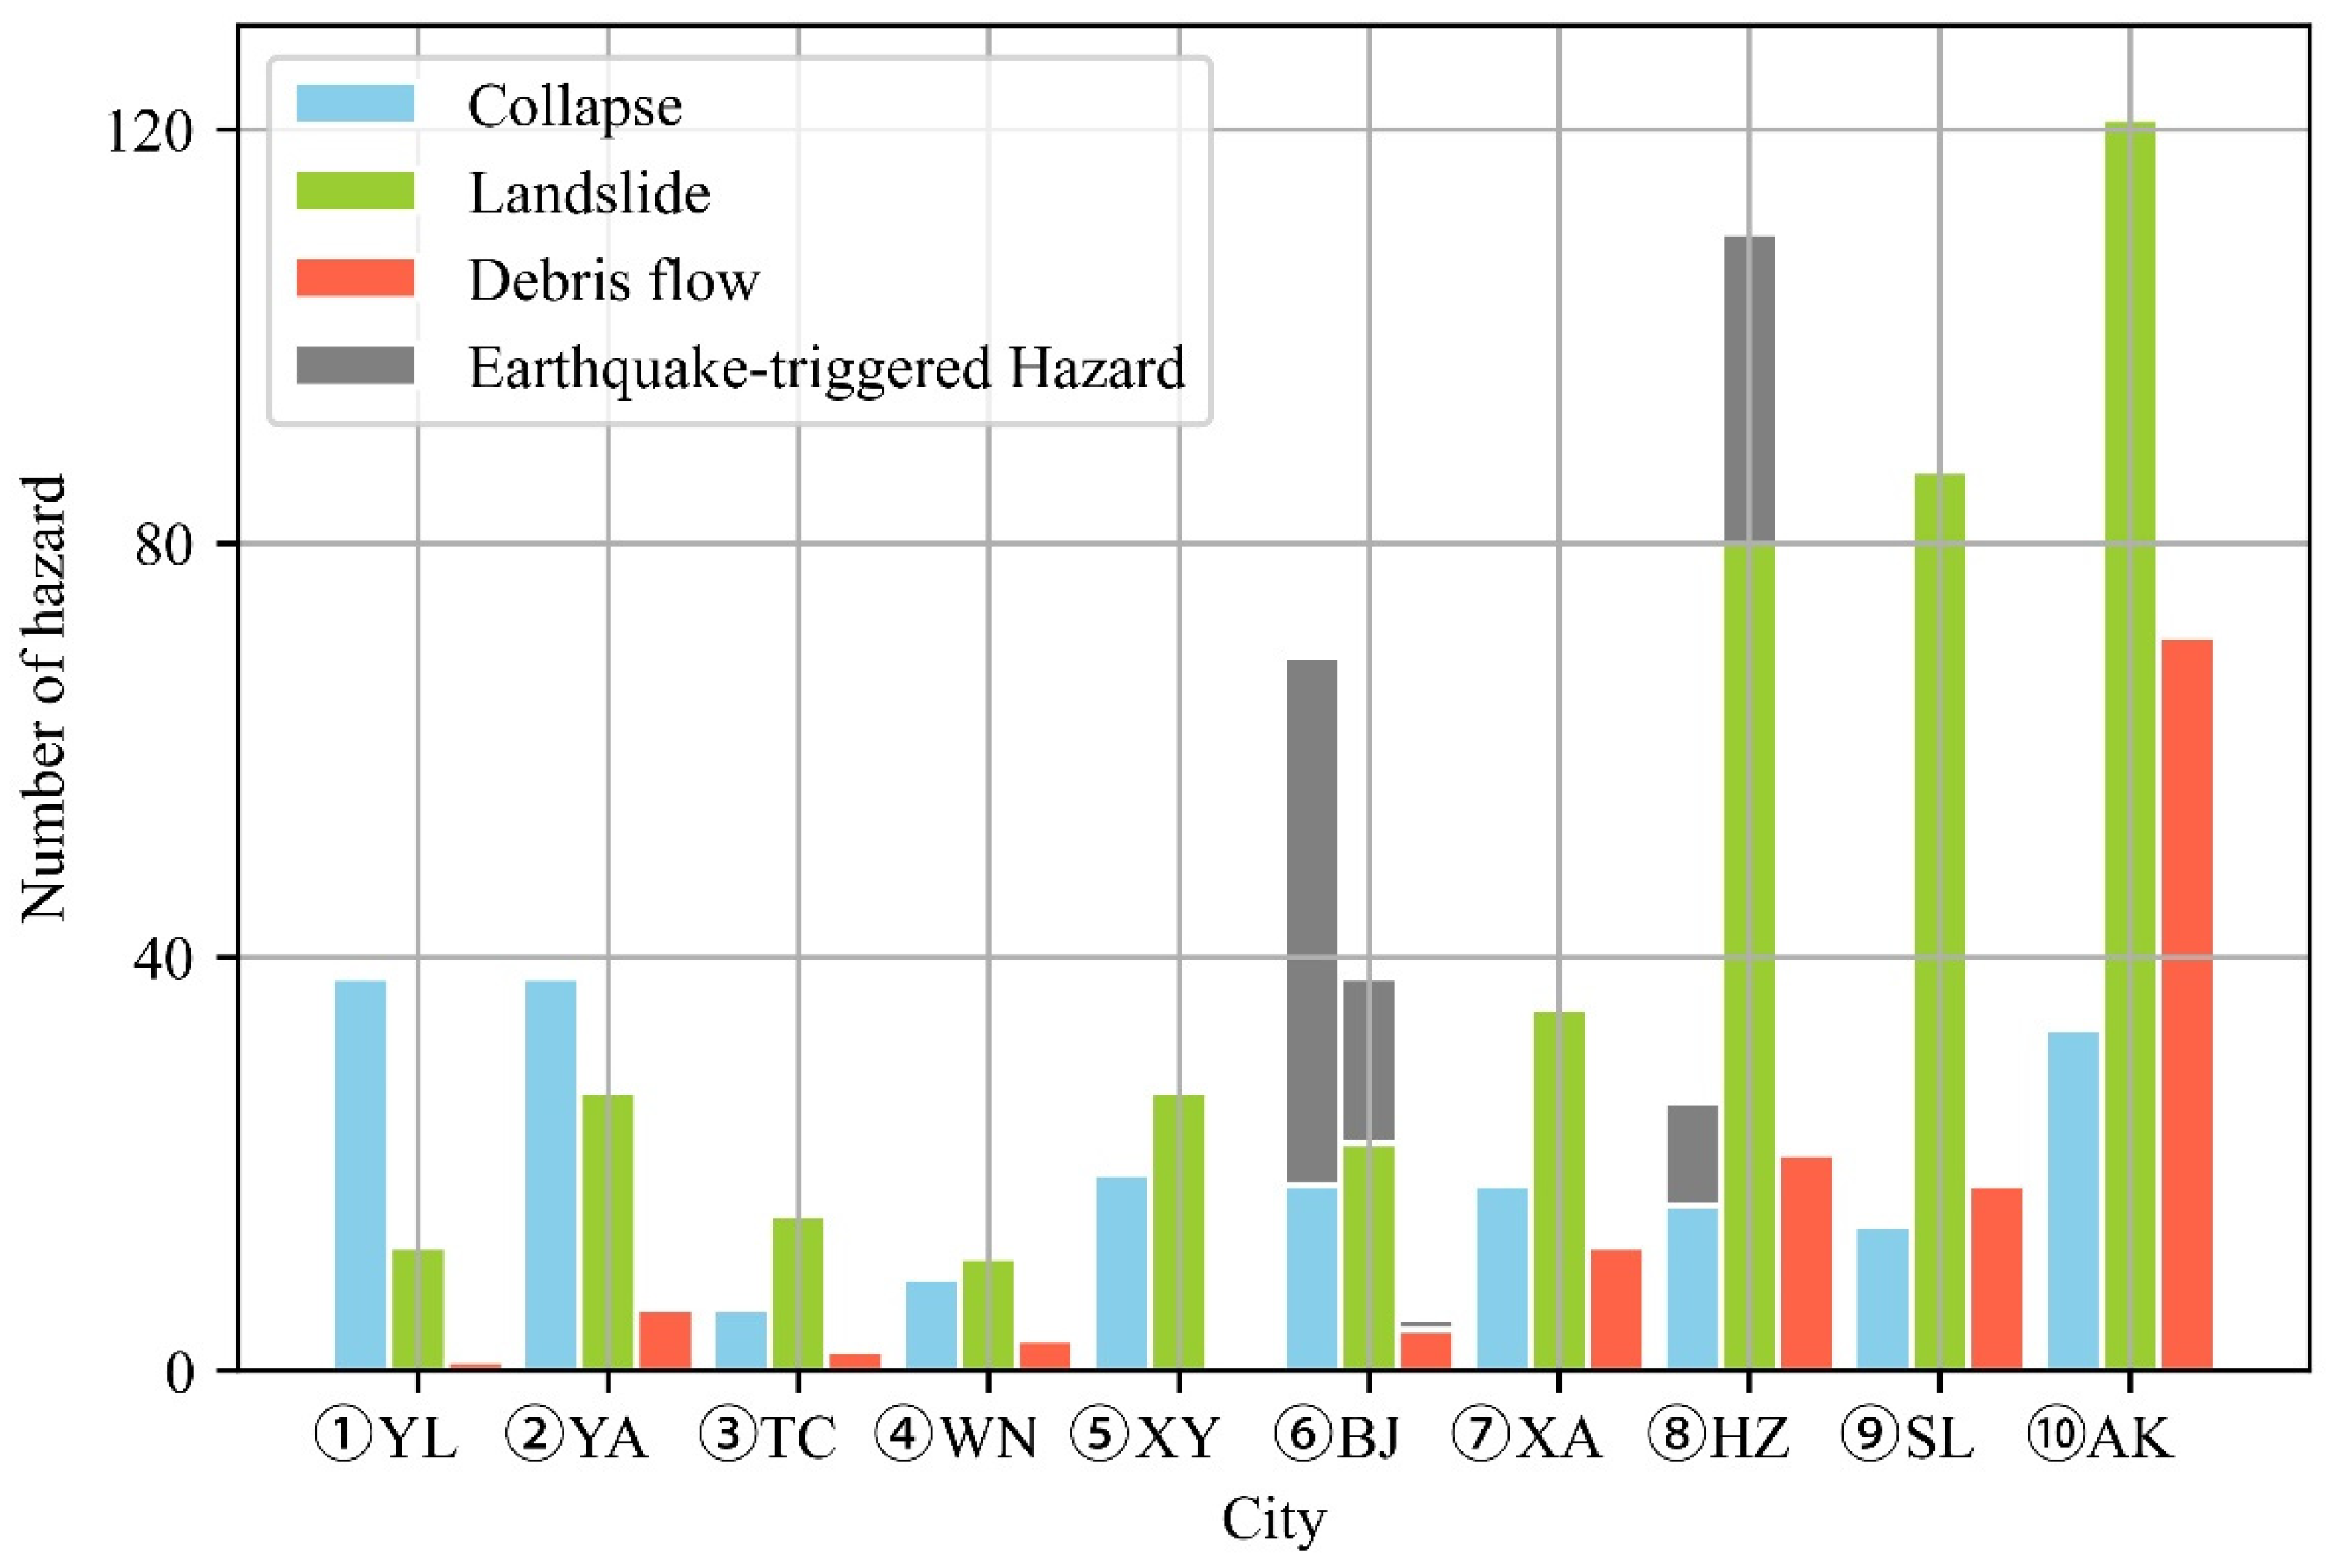
3.1. Spatio-Temporal Distribution of Geological Hazards

The geological hazards inventory we collected included 270 collapses, 485 landslides and 139 debris flows. There were 118 collapses, 100 landslides and 10 debris flow in Northern Shaanxi (NS) and 152 collapses, 385 landslides and 129 debris flows in Southern Shaanxi (SS). Temporally, there were some differences between NS and SS (Figure 2). The monthly variation of geological hazards in SS showed that the debris flows mainly occurred (90.78%) during the rainy season from July to September (Figure 2A). Furthermore, collapses and landslides were also significantly related to the average amount of monthly rainfall, excluding the month of May. This was because the influence of the magnitude 8.0 Wenchuan earthquake (12 May 2008) generated numerous collapses and landslides. On the other hand, the trend of debris flows in NS was similar to that in SS, whereas the collapse and landslide showed a flatter trend in NS than that in SS (Figure 2B). In NS, many collapses and landslide events arose in spring due to the freeze–thaw effect.
The spatial distribution of geological hazards exhibited a strong heterogeneity among 10 cities in Shaanxi province (Figure 3). The Loess Plateau was a vulnerable region for collapses, which were mostly distributed in Northern YA (18.6%) and Southern YL (19.1%). The numbers of landslide and debris flow events in different cities increased significantly with the decreasing latitude. The mountain area of NS was a serious hazard region, with landslides and debris flows in AK reaching 28.2% and 53.0%, respectively.

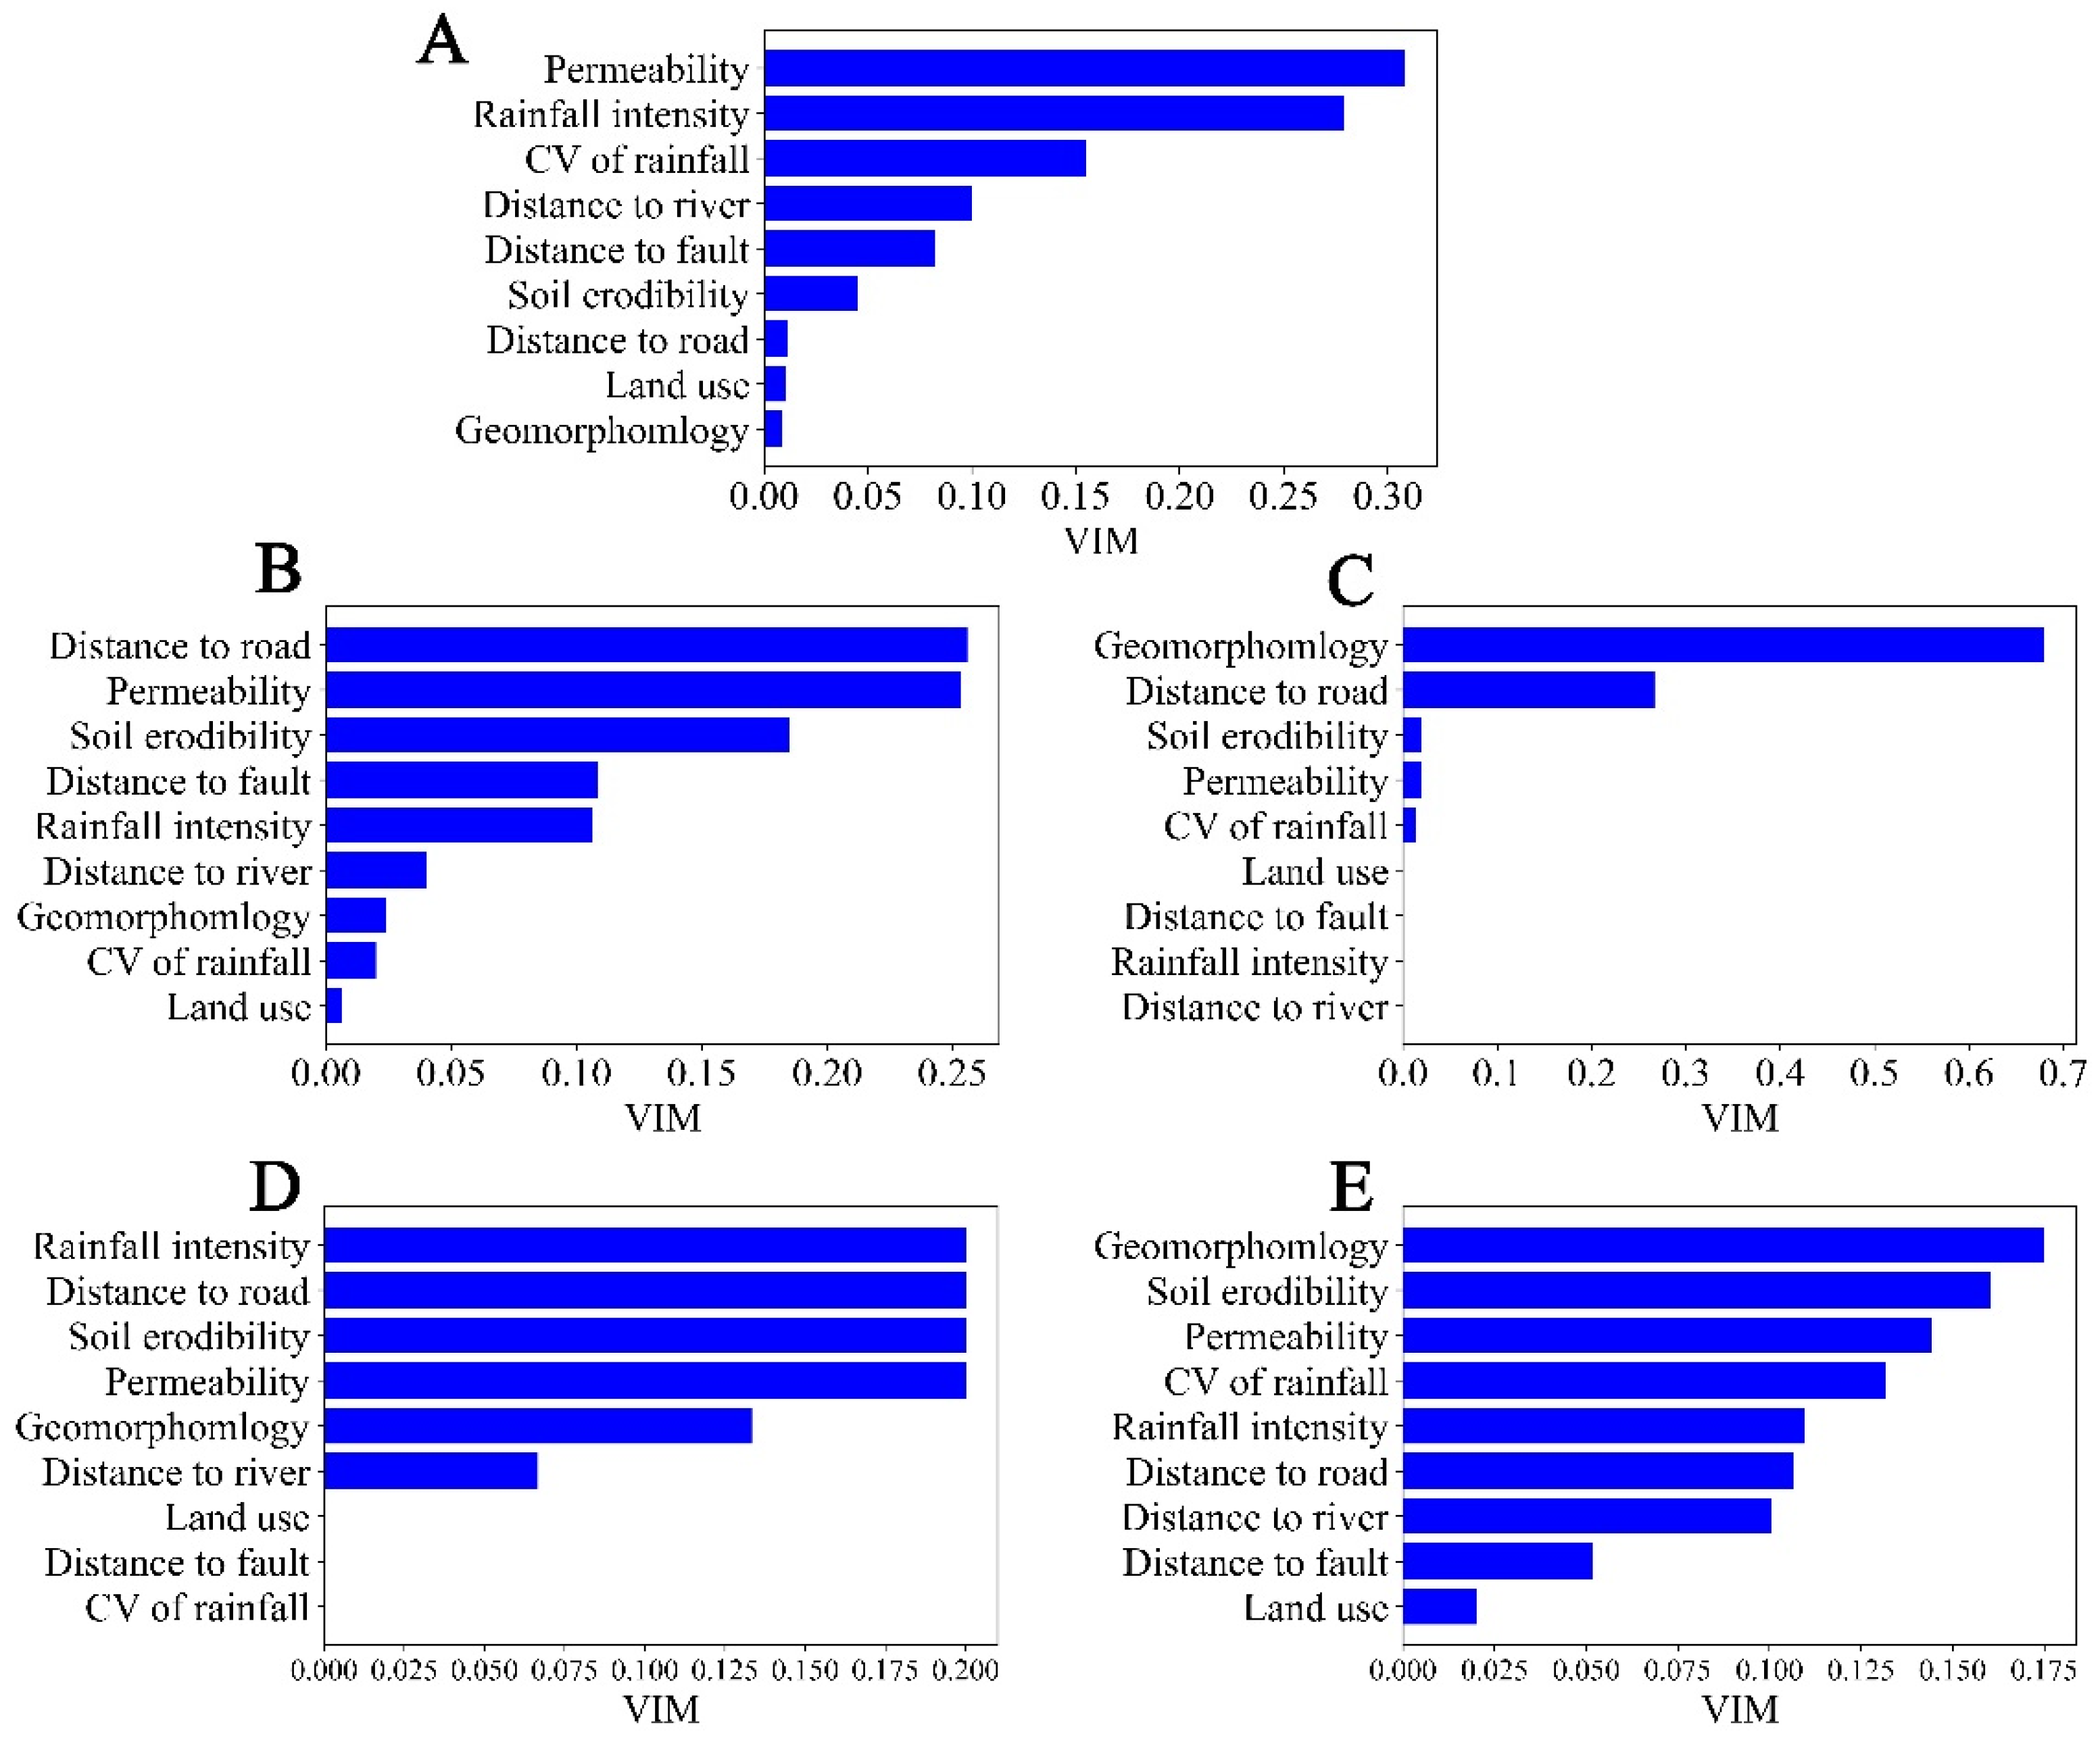
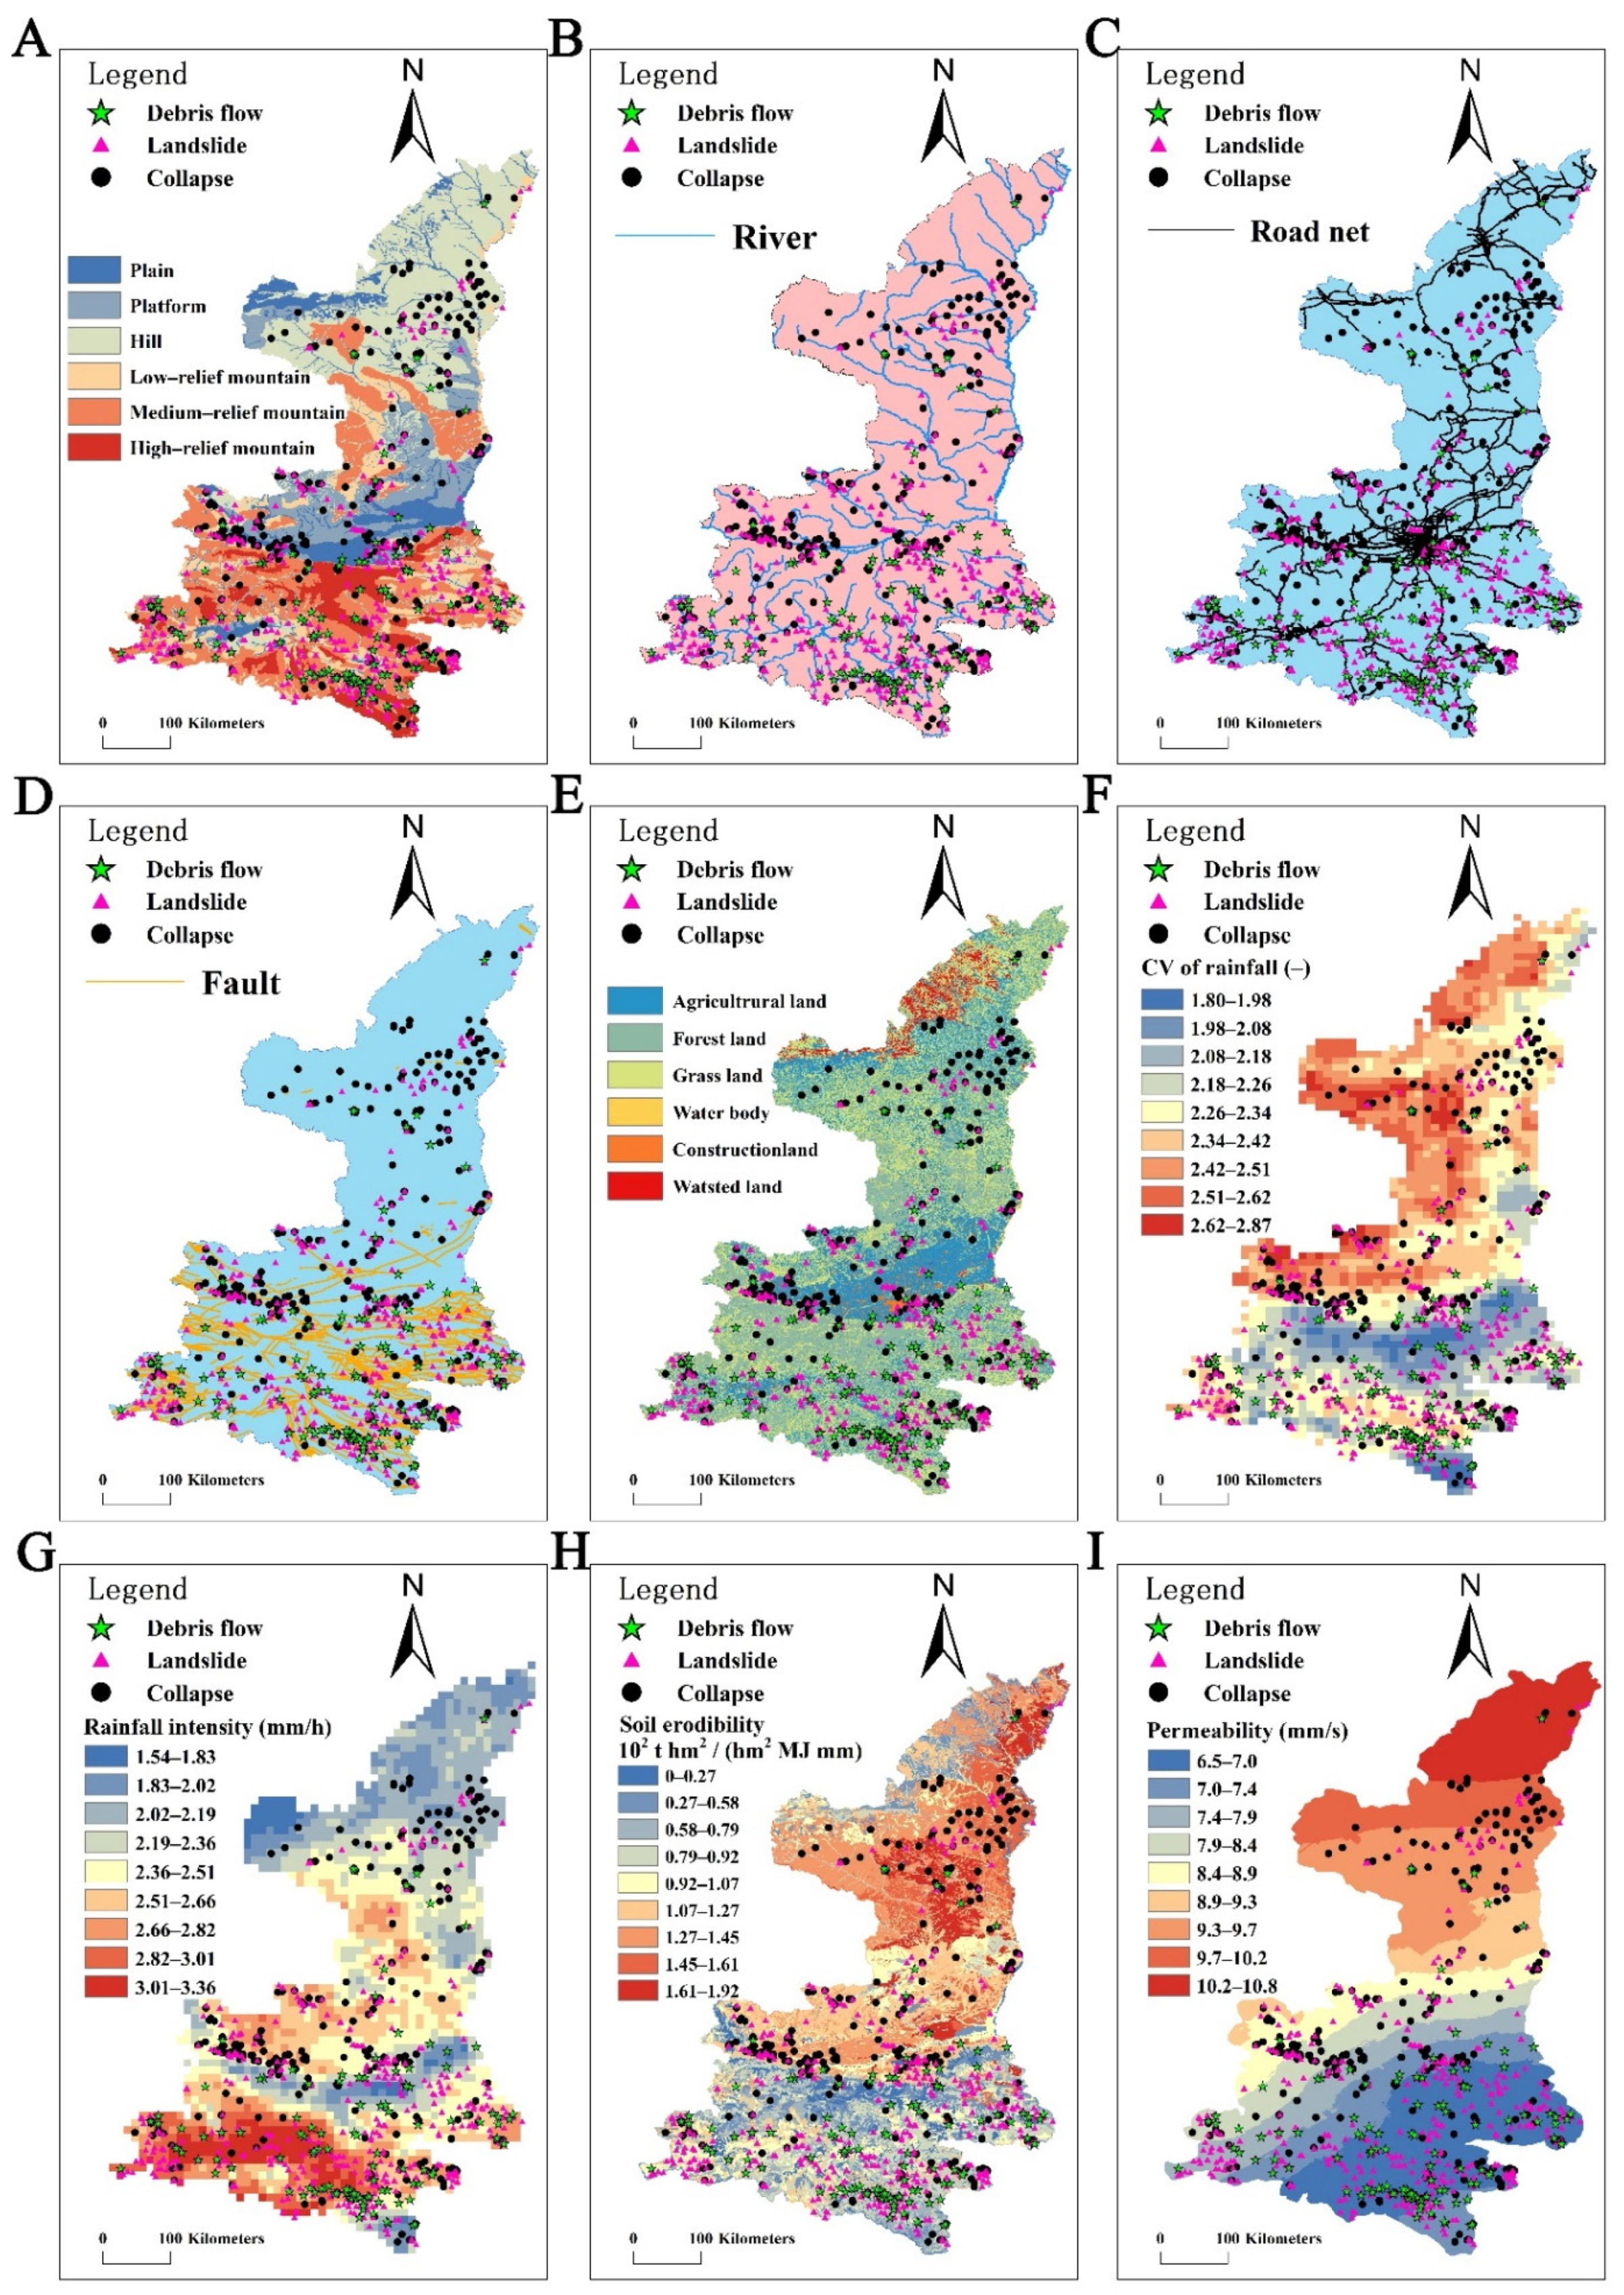
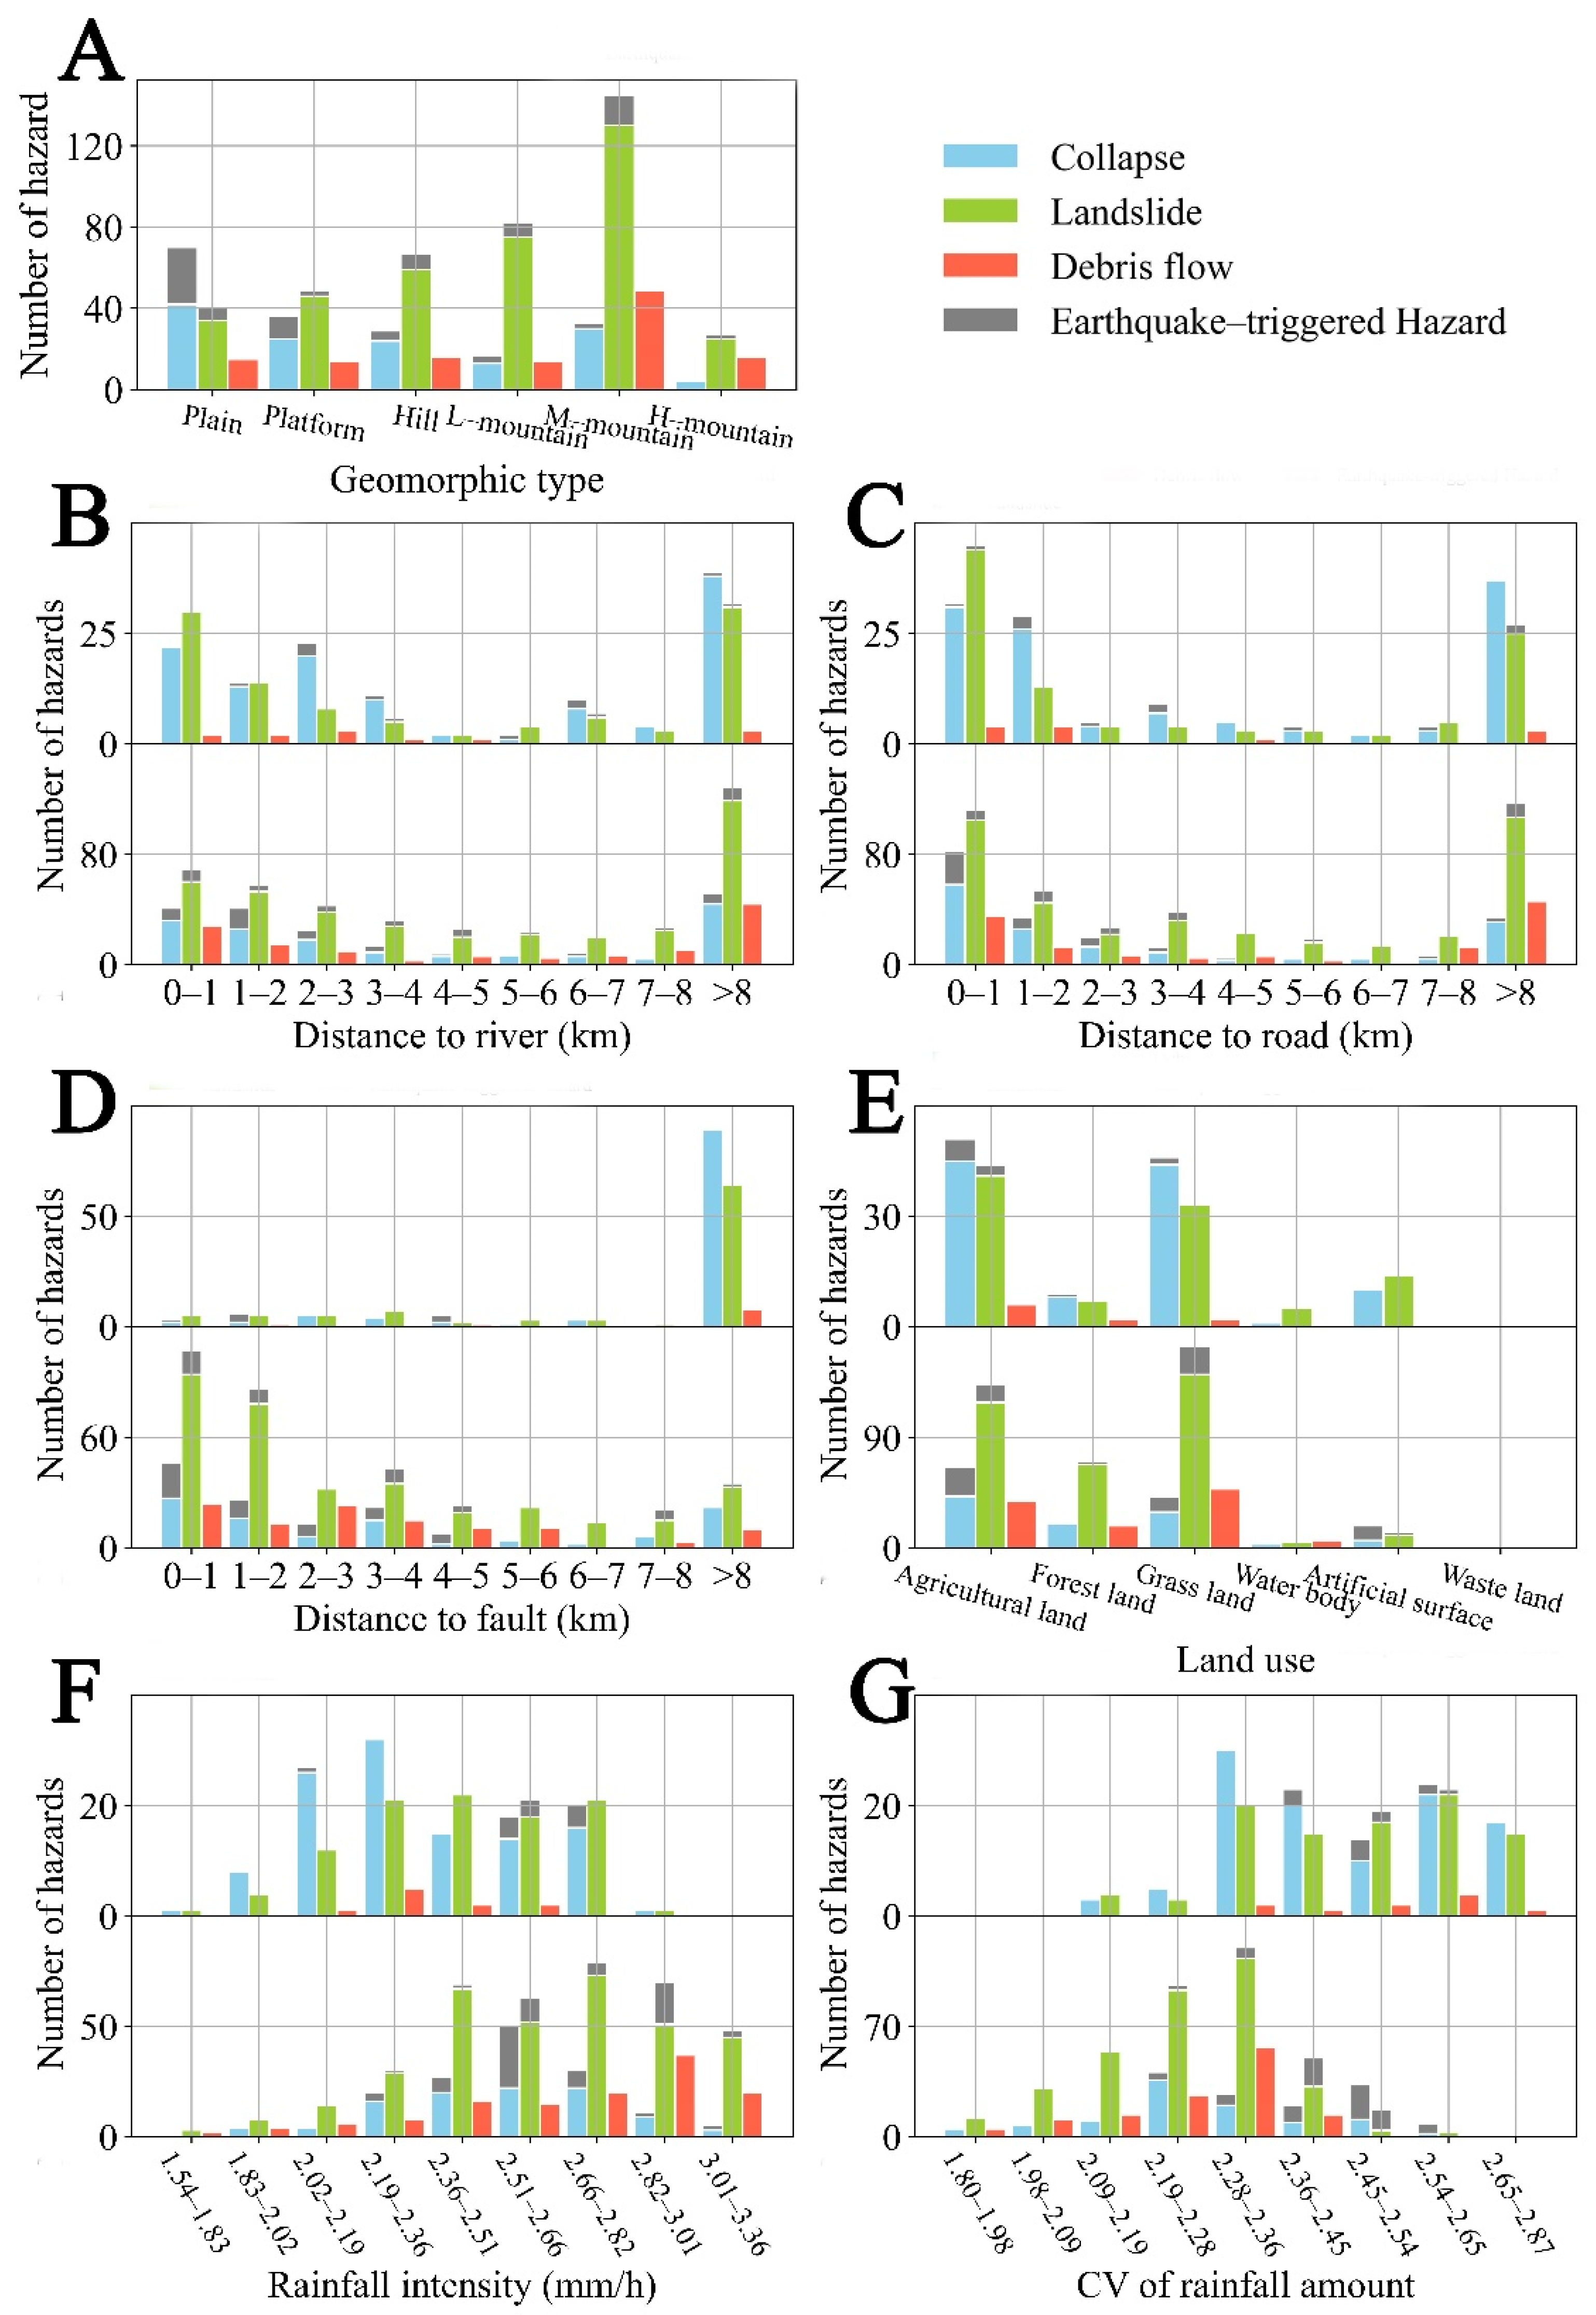
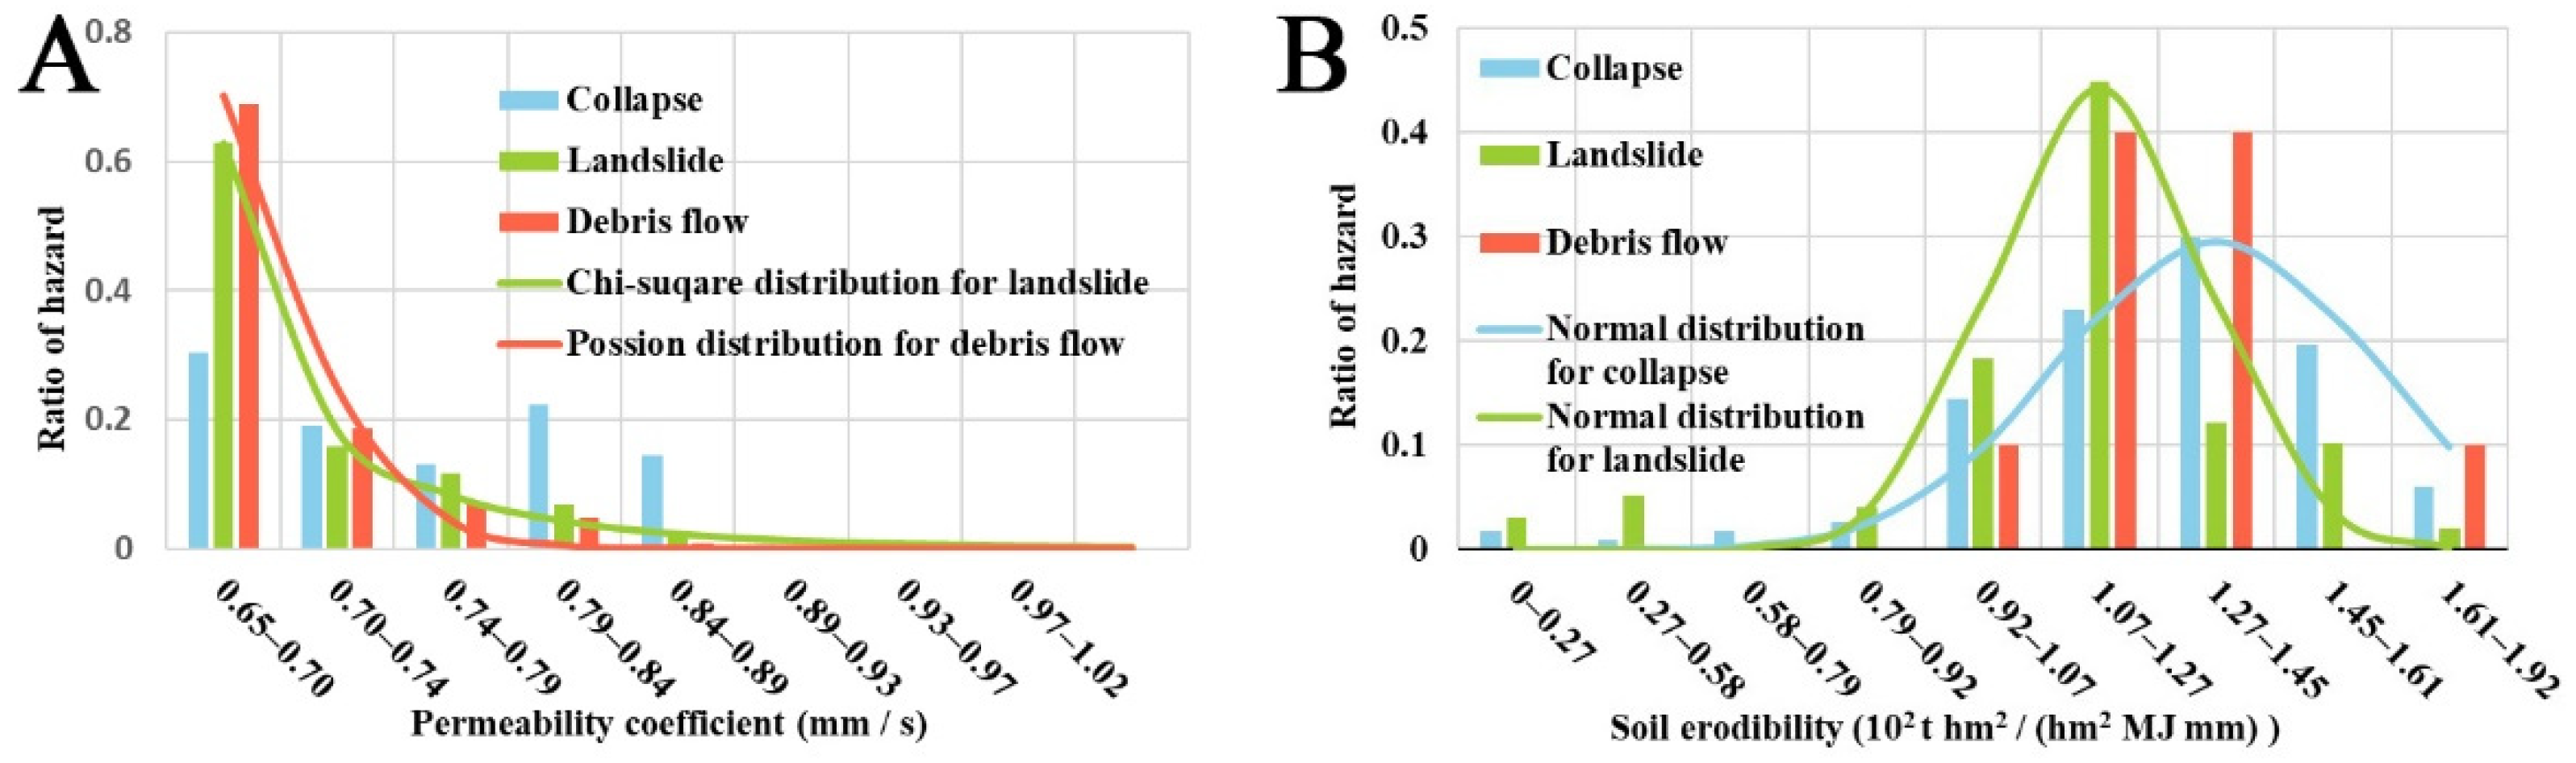
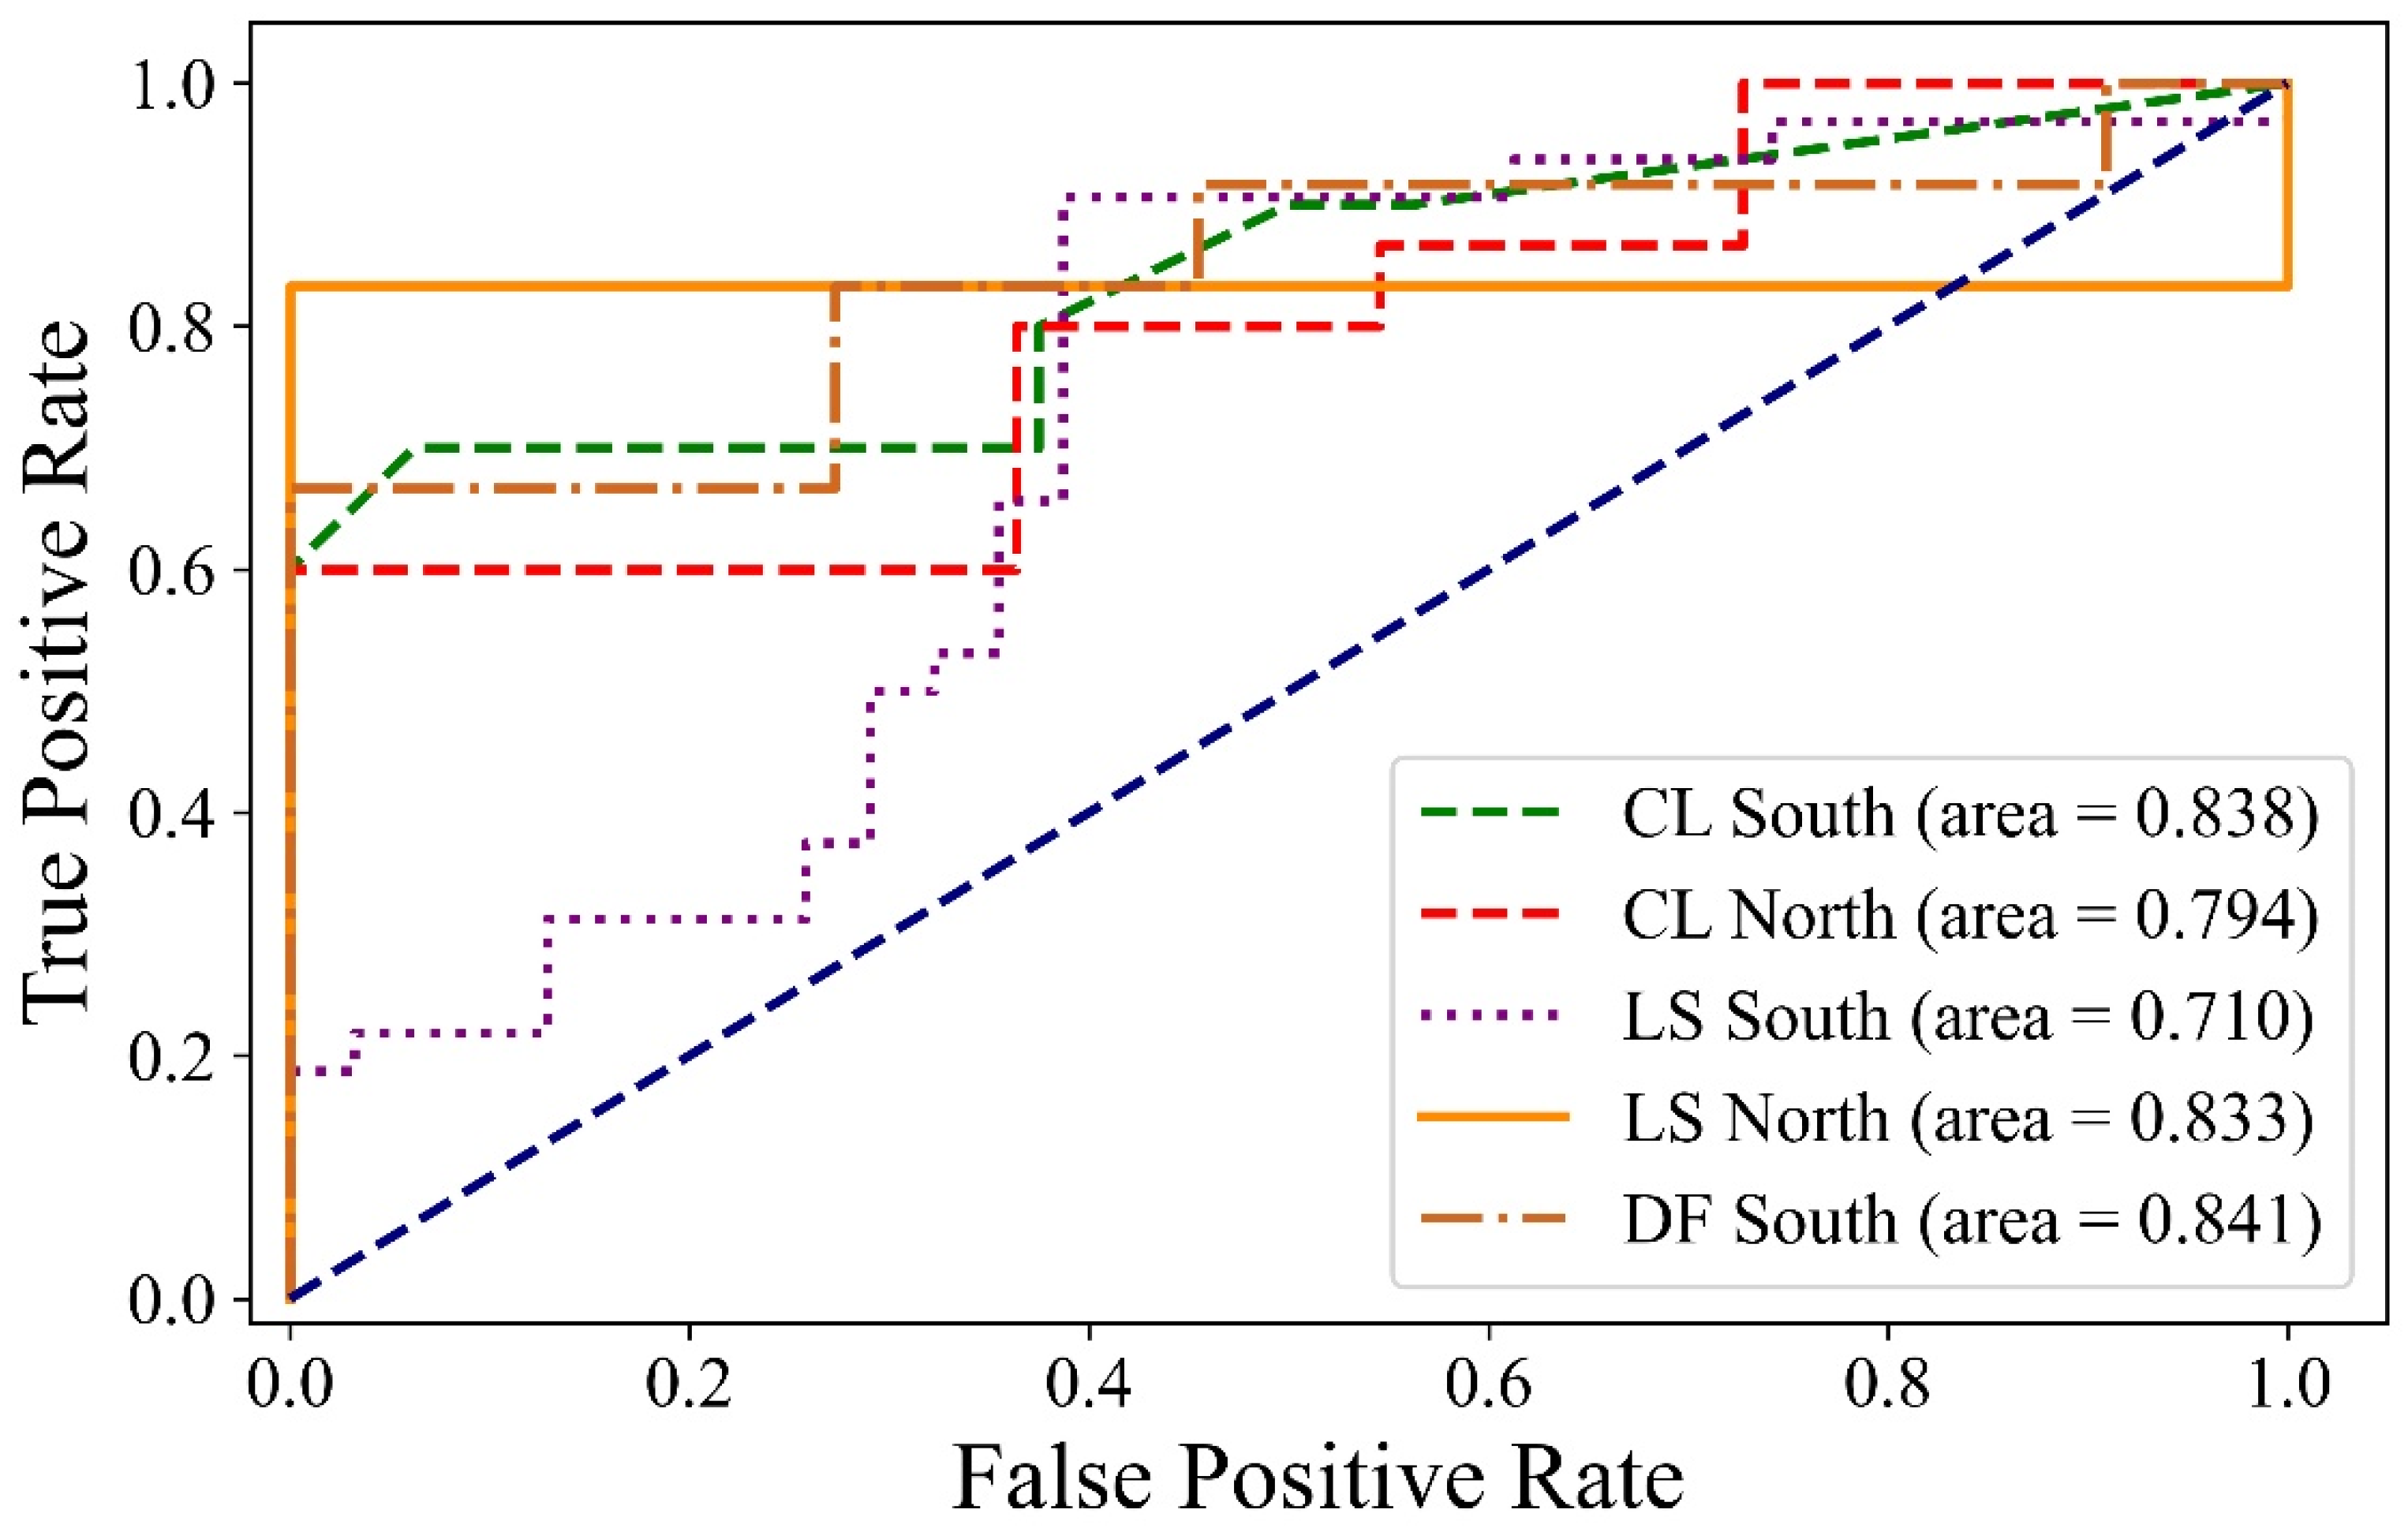
3.2. The Potential Impact Factors of Geological Hazards

To detect the potential impact factors of geological hazards, the relationship between the distribution of geological hazards and potential influencing factors was mapped (Figure 4). First, for the different geomorphologies, the hazards in SS mainly occurred in river terraces and medium-relief mountain areas (relief ranged from 500 to 1000 m) where the gradients and altitude were medium (Figure 5A). Furthermore, we studied the relationships between the distribution of geological hazards and rivers as well as roads (Figure 5B,C). With the increase in the distance to the rivers, the number of hazards decreased in NS. However, these were weakly related to the distance to the rivers in SS. Moreover, there was a strong correlation between the number of hazards and the distance to the roads (Figure 5B). In general, 32.96% of collapses and 30.53% of landslides occurred less than 1 km away from the roads. Especially, 42.71% of landslides in NS and 38.15% of collapses in SS occurred within 1 km of roads (Figure 5C). Distinct from SS (Figure 5D), there was no obvious relationship between the three hazards and faults in NS due to a few large faults. Especially for landslides, the closer to the fault line, the more frequent the landslides (Figure 5D). The relationships between the geological hazards and land use were similar in SS and NS. Most hazards occurred in agricultural land and grassland (Figure 5E).
To evaluate the influence of rainfall, we calculated the rainfall characteristics from July to September, i.e., CV of rainfall amount, the average of maximum 1 h rainfall intensity. Because the hazards induced by earthquakes were unrelated to the amount of rainfall, the analysis of rainfall excluded the hazard points of the Wenchuan earthquake. Figure 5F,G indicates both the average of the maximum 1 h rainfall intensity and the CV of rainfall amount shows a stronger relationship with the hazards in SS. In SS, most hazards were triggered by a rainfall intensity from 2.36–3.36 mm/h or a CV from 2.09–2.36. In NS, however, the number of hazards does not vary greatly provided that the rainfall intensity > 2.02 mm/h or CV > 2.28.
Based on the influence of the underlying surfaces in SS and NS on the hazards, we concluded that the permeability coefficient and soil erodibility could reflect the influence of the underlying surface on the hazards in SS and NS, respectively (Figure 6). For landslide and debris flow in SS, the coefficient could be well fitted by the Poisson distribution and the Chi-square distribution. Although the stable permeability coefficient increased, the number of geological hazards decreased (Figure 6A). On the other hand, both the collapse and landslide events in NS and the soil erodibility factor could be well correlated with the normal distribution (Figure 6B).
We adopted the Random Forests technique to quantify the contribution of potential impact factors. AUC < 0.7 indicates a poor performance for predictions, 0.7 < AUC < 0.8 represents medium, 0.8 < AUC < 0.9 and AUC > 0.9 represents good and excellent performances, respectively [26]. In general, the Random Forests technique was applicable in Shaanxi province (Figure 7). For instance, the AUC values for collapses in SS and NS were 0.838 and 0.794, respectively. The AUC value for landslides in NS was 0.833 but was relatively low in SS (0.71). The AUC values for debris flows in SS reached 0.841; however, this method was not appliable to NS due to the low number of debris flows.
The main controlling factors for geological hazards were quite different between SS and NS. For the debris flow in SS, the permeability coefficient and rainfall intensity were the absolute dominant factors (Figure 8A). In NS, the main influencing factors of collapse were the distances to the roads and permeability, whereas the main influencing factors in SS were geomorphology and the distances to the roads (Figure 8B,C). Rainfall intensity, the distances to the roads, soil erodibility and the permeability coefficient had the same influence on landslides in NS, while they were affected by geomorphology and soil erodibility in SS (Figure 8D,E).

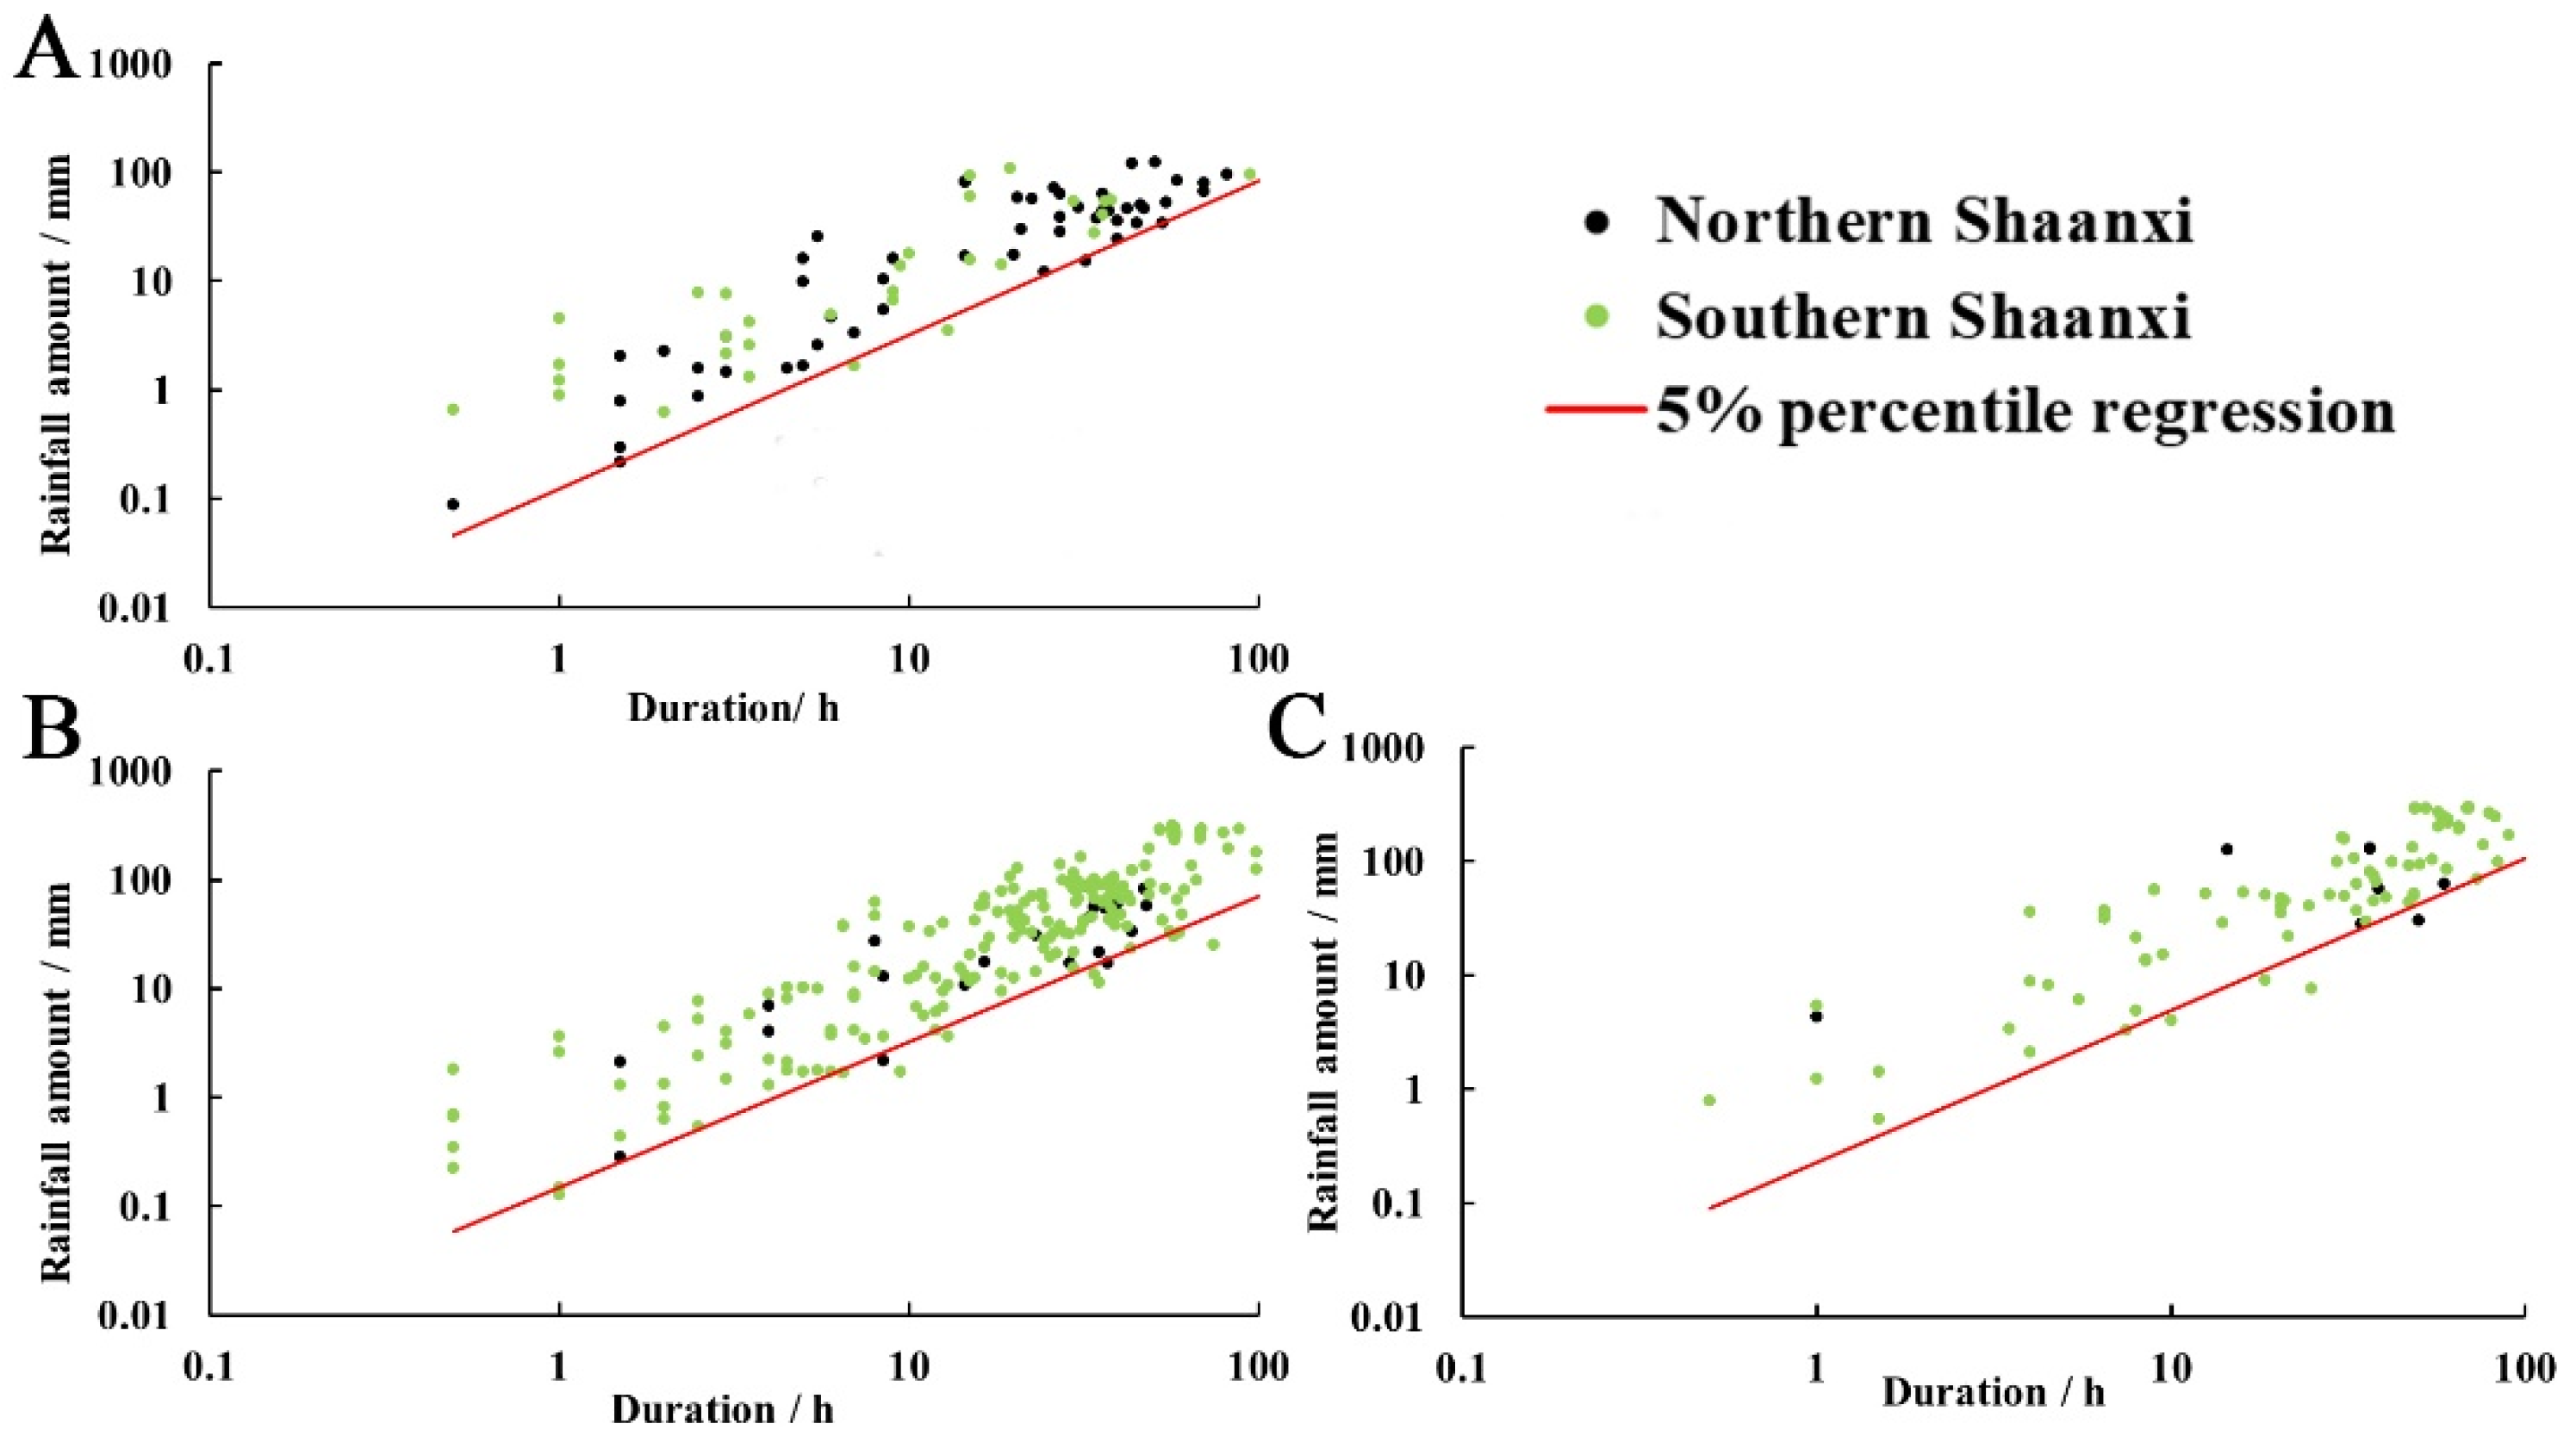
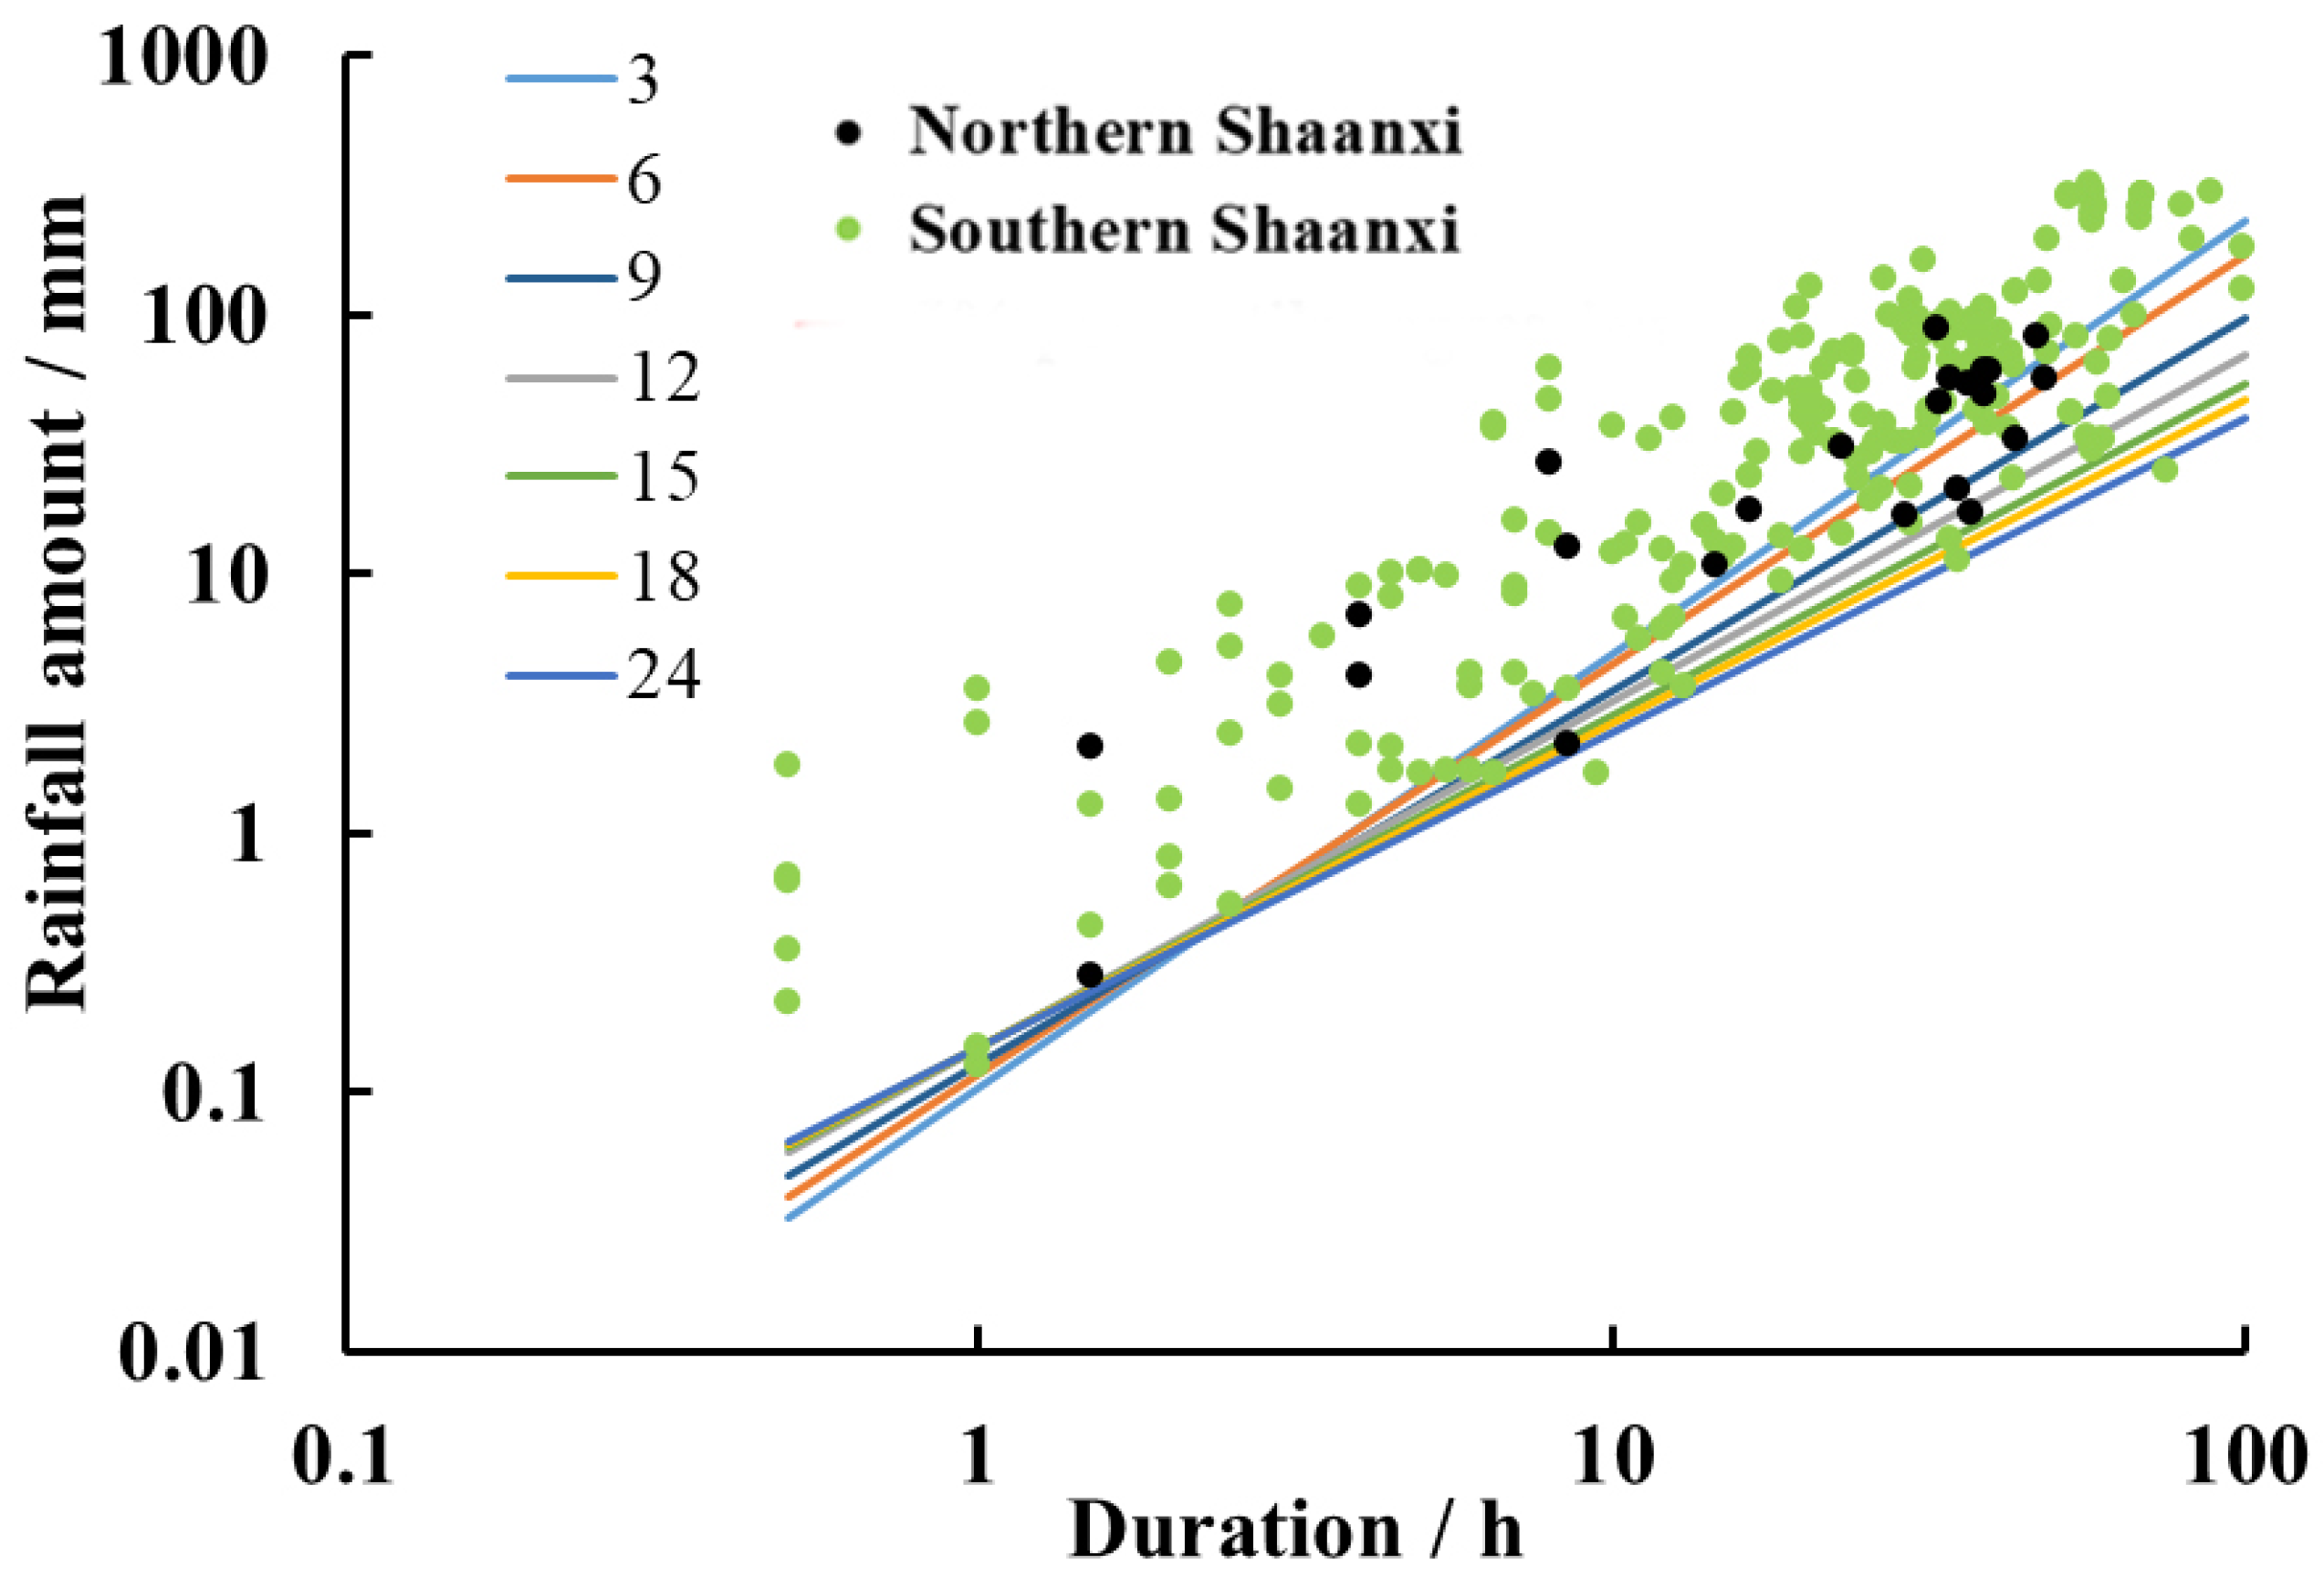
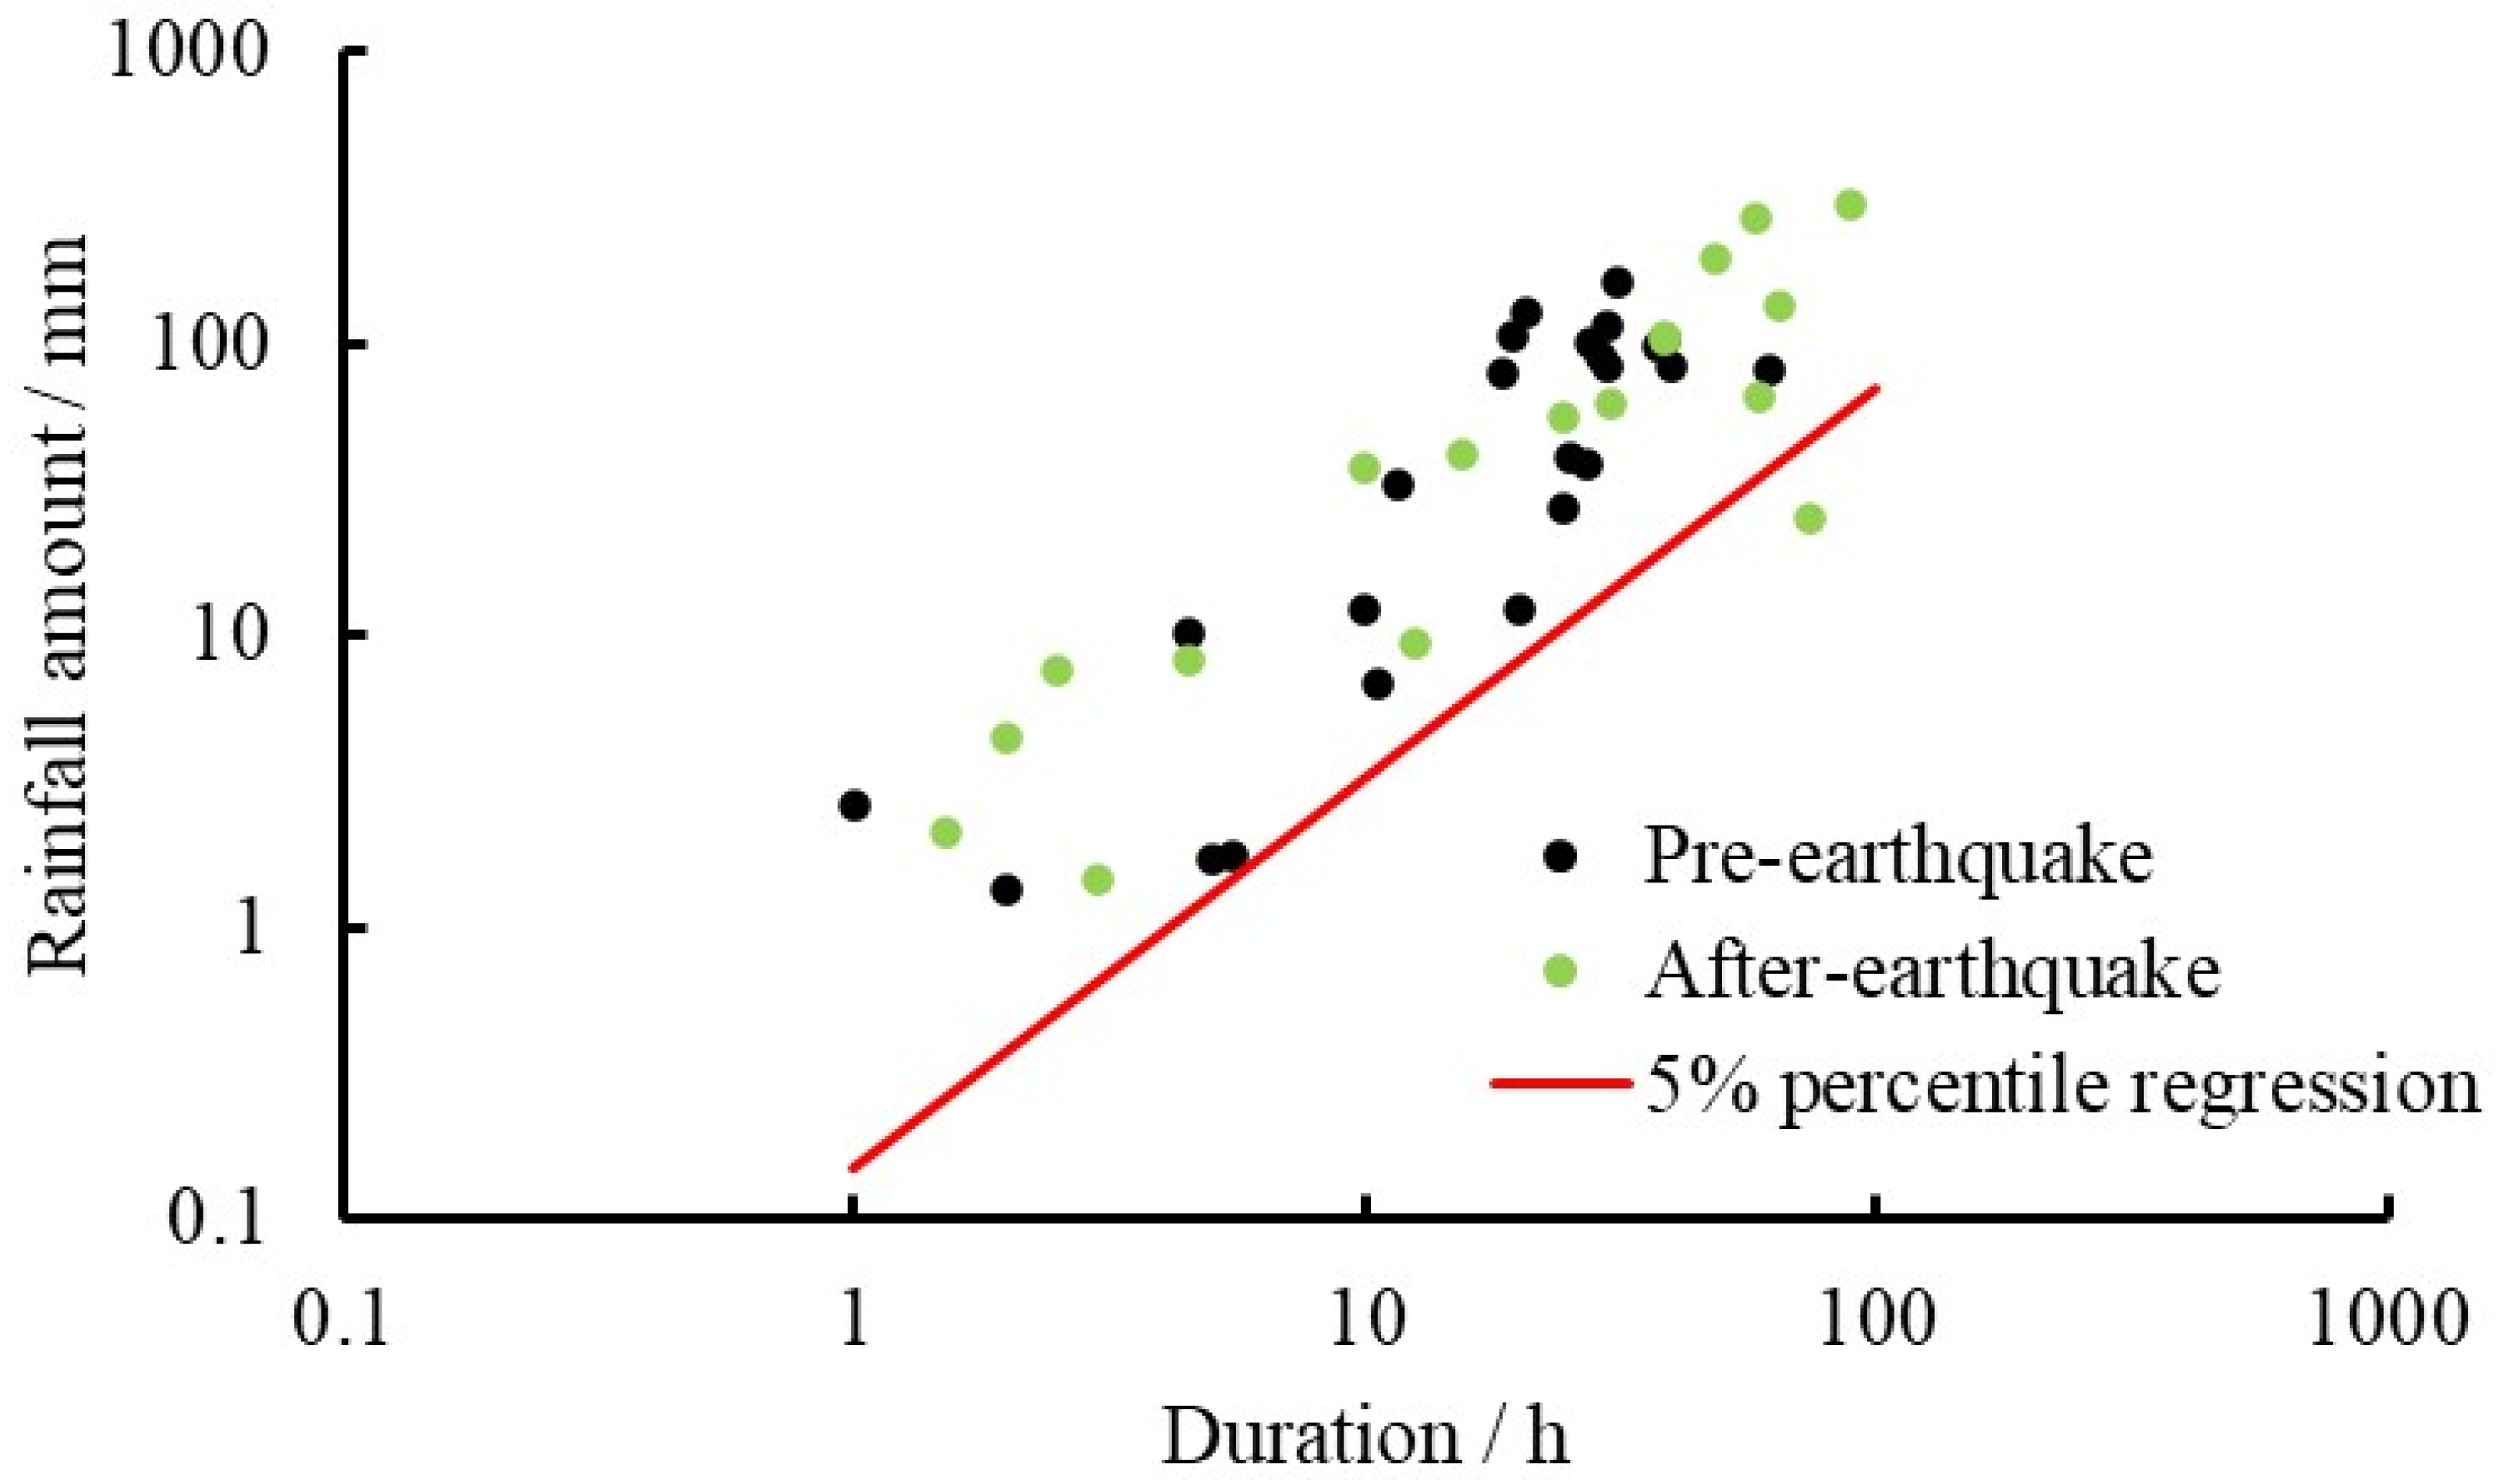
3.3. Rainfall Threshold of Rainfall-Triggered Geological Hazards

We plotted the relationship between the cumulated rainfall amount and the rainfall duration of a single event by reconstructing the rainfall events (Figure 9). Generally, the rainfall thresholds of the three geological hazards in SS were similar to the values in NS. Thus, we only fitted the rainfall threshold line of the entire Shaanxi province. The duration of rainfall-generated collapses was between 0.5–100 h, and the cumulated rainfall amount was between 0.1 and 123.6 mm (Figure 9A). The durations of rainfall triggering landslides and debris flows were 0.5–99 h and 0.5–90 h, respectively (Figure 9B). The amount of the cumulated rainfall affecting landslides and debris flows, which were was different from collapses, reached 295.1 mm and 291.2 mm, respectively (Figure 9C).
Additionally, we compared the change in rainfall thresholds before and after the Wenchuan earthquake in HZ and BJ. Due to data limitations, we only established the rainfall threshold curve for landslide events. As shown in Figure 10, the pre- and post-earthquake data shared the same 5% percentile regression line, which indicated that the Wenchuan earthquake had no clear effect on the hazards of Shaanxi province except for the date of 12 May 2018 (Figure 10).

4. Discussion

4.1. Spatio-Temporal Distribution of Geological Hazards and Their Impact Factors

The spatio-temporal distribution of geological hazards in Shaanxi province showed a strong heterogeneity. The number of geological hazards in October implied a lag effect of rainfall factors on the hazards both in NS and SS (Figure 2). Although rainfall was reduced, the number of hazards was still large. This was because the antecedent rainfall reduced soil cohesion and increased pore pressure [8]. Furthermore, there were spring-thaw processes in NS from March to April (Figure 2A). Freezing began from October to November every year, and ended from March to April the following year. Although the thickness of the frozen layer was not large, spring thaw caused many serious geological hazards [27]. Additionally, the Wenchuan earthquake also had an impact on the number of collapses in NS, triggering eight collapse events.
The relative importance (VIM) showed that geomorphology was the controlling factor for the collapses and landslides in SS (Figure 8C,E). Numerous hazards occurred in the middle-relief mountain area (Figure 5A), and this result was consistent with Wei et al. (2008) [11]. This may be because the occurrences of geological hazards usually depended on local lithology. For example, landslides or debris flows rarely happened in the Huashan mountain area, which had a steep slope and a high elevation but consisted of granite. Similarly, Sun et al. [4] reported that the hazards in NS mainly occurred in the river terraces. In contrast, less hazards occurred in the steep and high-altitude areas. This was because the evolution of gully erosion is related to collapse and landslide in NS [4]. In NS, the collapse and landslide were mainly influenced by the distance to road, permeability, and soil erodibility (Figure 8B,D). Sun et al. [4] investigated the geological hazards in NS and found that a few geological hazards were induced by natural factors, and most of them were caused by engineering activities. This showed that the human disturbance of the roads was serious, and hazards (i.e., collapses and landslides) were mostly caused by anthropogenic activities (Figure 5C). Moreover, the rainfall intensity also plays an important role in landslide events. The uniform loess has a poor permeability and low saturated permeability coefficient [28]. With the increase in rainfall, the pore water pressure in the shallow layer of sloping loess rises and a sliding failure occurs under gravity. For debris flows, the most important factor was permeability and rainfall intensity. Using the small strain theory, Klubertanz et al. (2009) [29] showed the importance of permeability in debris flow initiation. In addition, this result was similar to Qiu et al. (2019) [26], who found that landslides in Shaanxi were triggered by high-intensity daily rainfall. This implied that through the construction of the debris flow drainage ditch and other engineering measures, we could effectively reduce the probability of landslides and debris flows in SS.
By comparing the rainfall threshold before and after the Wenchuan earthquake in the Sichuan province, the influence of this earthquake on the geological hazards in Shaanxi province was analyzed. Shen et al. (2015) [30] concluded that the rainfall threshold in Sichuan province was significantly reduced by the earthquake. However, there were no obvious differences in the rainfall threshold before and after the earthquake (Figure 10). Tang (2011) [31] pointed out that the Wenchuan earthquake could affect the geological hazards in Sichuan province for 5–10 years, while other studies stated that it could affect the geological hazards in Sichuan province for about 20 years [32,33]. However, for Shaanxi province, the aftershocks of the Wenchuan earthquake were not significant, which may be due to the spatial attenuation of the earthquake intensity (Figure 11). With the decreasing seismic intensity, the number of hazards also decreased. However, the cluster of hazards in BJ was due to the local fault. Ground shaking usually affected the hazards near a fault zone. The rock breakage in the fault zone was conducive to the accumulation and discharge of groundwater, and colluvial wedges were easily disturbed by ground shaking when they were saturated with water.

4.2. Sensitivity Analysis of Rainfall Threshold Model

Melillo et al. (2015) [23] developed a method to reconstruct rainfall events. However, the specific parameters tended to be empirically evaluated by evapotranspiration. To estimate the influence of dry periods on the rainfall threshold, the different rainfall threshold models corresponding to different dry periods were built (Figure 12). The result showed that the rainfall threshold might be clearly underestimated when the dry period was less than 12 h. With the decreasing dry period, the slope of the rainfall threshold model also decreased. This was because the durations and amounts of reconstructed rainfall events tended to be shorter and less frequent.

5. Conclusions

Based on the GIS analyses and the rainfall threshold model, the spatio-temporal distribution characteristics and causes of geological hazards were analyzed for Shaanxi province. The major conclusions were:
(1)
The geological hazards in SS mainly occurred in rainy season from July to September and October. In contrast, the seasonal distribution of geological hazards in NS was relatively smoother, and the hazards in spring were mainly affected by the freeze–thaw processes.
(2)
Spatially, there were great differences in the physical geography and climate conditions between NS and SS, as well as the distribution of geological hazards, but there was no difference in the rainfall threshold.
(3)
The collapse and landslide events were mainly affected by human factors in NS and by geomorphology in SS. Permeability was a dominant factor for debris flows. Thus, the construction of drainage ditches and other engineering measures could effectively reduce the debris flow events.
(4)
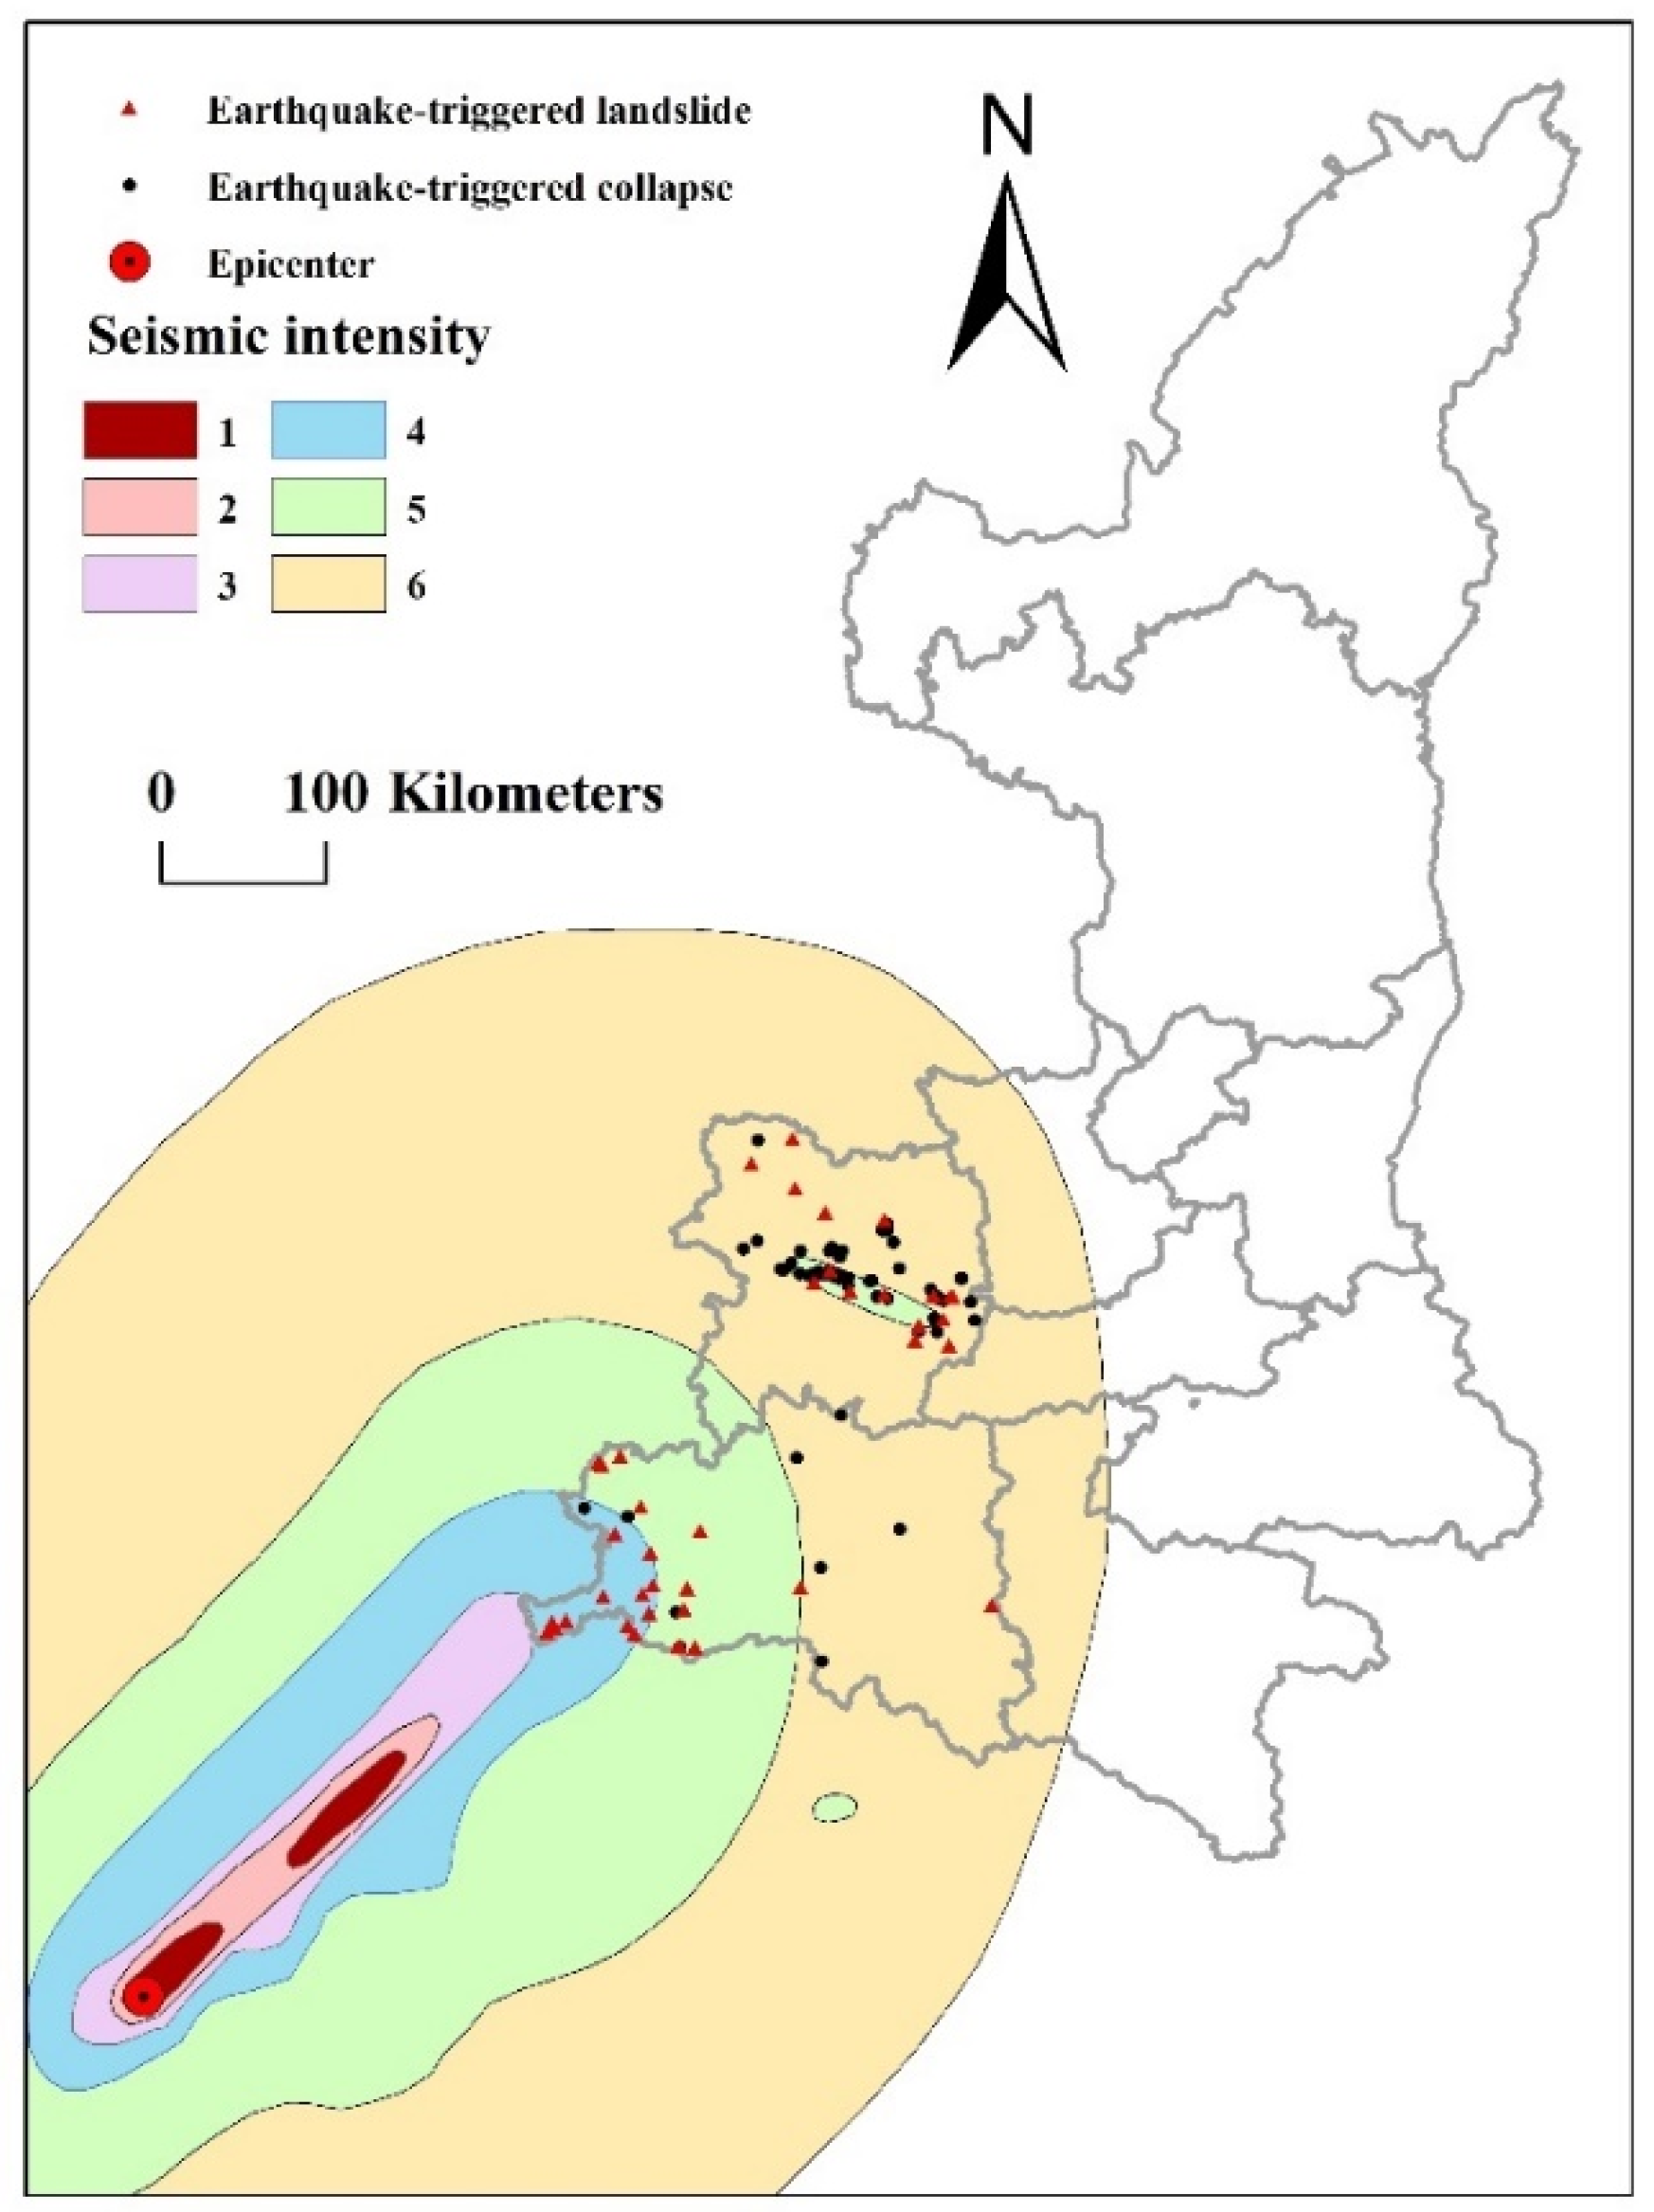
The earthquake mainly triggered landslides and collapses in HZ and BJ areas on the day of 12 May 2008 but had no effect on the rainfall threshold of subsequent geological hazards.

Author Contributions

Conceptualization, D.C. and Y.Q.; methodology, S.L. and D.L.; software, S.L.; validation, D.C., and Y.Q.; formal analysis, S.L.; investigation, D.L.; resources, Y.Q.; data curation, Y.Q.; writing—original draft preparation, S.L.; writing—review and editing, S.L., Z.Z. and D.C.; visualization, S.L.; supervision, D.C.; project administration, Y.Q.; funding acquisition, Y.Q. All authors have read and agreed to the published version of the manuscript.

Funding

This work is funded by the National Key Research and Development Project (2018YFC1507505).

Conflicts of Interest

The authors declare no conflict of interest.

References

  1. Zhuang, J.; Peng, J.; Zhu, X.; Li, W.; Ma, P.; Liu, T. Spatial distribution and susceptibility zoning of geohazards along the Silk Road, Xian-Lanzhou. Environ. Earth Sci. 2016, 75, 711. [Google Scholar] [CrossRef]
  2. Kirschbaum, D.; Stanley, T.; Zhou, Y. Spatial and temporal analysis of a global landslide catalog. Geomorphology 2015, 249, 4–15. [Google Scholar] [CrossRef]
  3. Zhang, F.; Huang, X. Trend and spatiotemporal distribution of fatal landslides triggered by non-seismic effects in China. Landslides 2018, 15, 1663–1674. [Google Scholar] [CrossRef]
  4. Sun, P.; Zhang, M.; Cheng, X. On the regularity of Geological hazards on the Loess Plateau in China. Mt. Res. 2019, 37, 737–746. [Google Scholar]
  5. Petley, D.N. Global patterns of loss of life from landslides. Geology 2012, 40, 927–930. [Google Scholar] [CrossRef]
  6. Lin, Q.; Wang, Y. Spatial and temporal analysis of a fatal landslide inventory in China from 1950 to 2016. Landslides 2018, 15, 2357–2372. [Google Scholar] [CrossRef]
  7. Li, Y.; Hu, K.; Cui, P. Morphology of basin of debris flow. J. Mt. Sci. 2002, 20, 1–11. [Google Scholar]
  8. Qiu, H.; Cui, Y.; Pei, Y.; Yang, D.; Hu, S.; Wang, X.; Ma, S. Temporal patterns of nonseismically triggered landslides in Shaanxi Province, China. Catena 2020, 187, 104356. [Google Scholar] [CrossRef]
  9. Xiong, K.; Adhikari, B.R.; Stamatopoulos, C.A.; Zhan, Y.; Wu, S.; Dong, Z.; Di, B. Comparison of Different Machine Learning Methods for Debris Flow Susceptibility Mapping: A Case Study in the Sichuan Province, China. Remote Sens. 2020, 12, 295. [Google Scholar] [CrossRef] [Green Version]
  10. Qiu, H.; Cui, P.; Regmi, A.D.; Hu, S.; Wang, X.; Zhang, Y. The effects of slope length and slope gradient on the size distributions of loess slides: Field observations and simulations. Geomorphology 2018, 300, 69–76. [Google Scholar] [CrossRef]
  11. Wei, F.Q.; Gao, K.C.; Hu, K.h.; Li, Y.; Gardner, J.S. Relationships between debris flows and earth surface factors in Southwest China. Environ. Geol. 2008, 55, 619–627. [Google Scholar] [CrossRef]
  12. Chen, C.; Yu, F. Morphometric analysis of debris flows and their source areas using GIS. Geomorphology 2011, 129, 387–397. [Google Scholar] [CrossRef]
  13. Zhou, C.; Lee, C.; Li, J.; Xu, Z. On the spatial relationship between landslides and causative factors on Lantau Island, Hong Kong. Geomorphology 2002, 43, 197–207. [Google Scholar] [CrossRef]
  14. Ayalew, L.; Yamagishi, H. The application of GIS- based logistic regression for landslide susceptibility mapping in the Kakuda-Yahiko Mountains, central Japan. Geomorphology 2005, 65, 15–31. [Google Scholar] [CrossRef]
  15. Qing, F.; Zhao, Y.; Meng, X.; Su, X.; Qi, T.; Yue, D. Application of Machine Learning to Debris Flow Susceptibility Mapping along the China-Pakistan Karakoram Highway. Remote Sens. 2020, 12, 2933. [Google Scholar] [CrossRef]
  16. Guo, X.; Cui, P.; Li, Y. Debris flow warning threshold based on antecedent rainfall: A case study in Jiangjia Ravine, Yunnan, China. J. Mt. Sci. 2013, 10, 305–314. [Google Scholar] [CrossRef]
  17. Guzzetti, F.; Peruccacci, S.M.; Rossi, M. Rainfall thresholds for the initiation of landslides in Central and Southern Europe. Meteorol. Atmos. Phys. 2007, 98, 239–267. [Google Scholar] [CrossRef]
  18. Zhuang, J.; Peng, C.; Wang, G.; Chen, X.; Iqbal, J.; Guo, X. Rainfall thresholds for the occurrence of debris flows in the Jiangjia Gully, Yunnan Province, China. Eng. Geol. 2015, 195, 335–346. [Google Scholar] [CrossRef]
  19. Ali, M.Z.; Chu, H.; Chen, Y.; Ullah, S. Machine learning in earthquake- and typhoon-triggered landslide susceptibility mapping and critical factor identification. Environ. Earth Sci. 2021, 80, 233. [Google Scholar] [CrossRef]
  20. Breiman, L.; Friedman, J.H.; Olshen, R.A.; Stone, C.J. Classification and regression trees. Belmont, CA: Wadsworth. Int. Group 1984, 432, 151–166. [Google Scholar]
  21. Breiman, L. Random Forests. Mach. Learn. 2001, 45, 5–32. [Google Scholar] [CrossRef] [Green Version]
  22. Jia, G.; Tang, Q.; Xu, X. Evaluating the performances of satellite-based rainfall data for global rainfall-induced landslide warnings. Landslides 2020, 17, 283–299. [Google Scholar] [CrossRef]
  23. Melillo, M.; Brunetti, M.T.; Peruccacci, S.; Garianl, S.; Guzzetti, F. An algorithm for the objective reconstruction of rainfall events responsible for landslides. Landslides 2015, 12, 311–320. [Google Scholar] [CrossRef]
  24. Melillo, M.; Brunetti, M.T.; Peruccacci, S.; Garianl, S.; Roccati, A.; Guzzetti, F. A tool for the automatic calculation of rainfall thresholds for landslide occurrence. Environ. Modell. Softw. 2018, 105, 230–243. [Google Scholar] [CrossRef]
  25. Gao, B.; Fan, J.; Wei, H.; Dong, J. The Spatial and Temporal Distribution of Pan Evaporation Characteristics in Shaanxi. Chin. Agric. Sci. Bull. 2015, 31, 225–233. [Google Scholar]
  26. Swets, J. Measuring the accuracy of diagnostic systems. Science 1988, 240, 1285–1293. [Google Scholar] [CrossRef] [Green Version]
  27. Zhang, M.; Li, T. Triggering factors and forming mechanism of loess landslides. J. Eng. Geol. 2011, 19, 530–540. [Google Scholar]
  28. Tu, X.; Kwong, A.K.L.; Dai, F.; Tham, L.G.; Min, H. Field monitoring of rainfall infiltration in a loess slope and analysis of failure mechanism of rainfall-induced landslides. Eng. Geol. 2009, 105, 134–150. [Google Scholar] [CrossRef]
  29. Klubertanz, G.; Laloui, L.; Vulliet, L. Identification of mechanisms for landslide type initiation of debris flows. Eng. Geol. 2009, 109, 114–123. [Google Scholar] [CrossRef]
  30. Shen, L.; Liu, L.; Yang, W.; Xu, C.; Wang, J. Rainfall threshold analysis for the initiation of geological disasters in Sichuan province based on TRMM data. J. Catastrophol. 2015, 30, 220–227. [Google Scholar]
  31. Tang, C.; Li, W.; Ding, J.; Huang, X. Field Investigation and Research on Giant Debris flow on August 14, 2010 in Yingxiu Town, Epicenter of Wenchuan Earrthquake. Earth Sci.—J. China Univ. Geosci. 2011, 36, 172–180. [Google Scholar]
  32. Huang, R. After Effect of Geohazards Induced by the Wenchuan Earthquake. J. Eng. Geol. 2011, 19, 145–151. [Google Scholar]
  33. Peng, C.; Chen, X.; Zhu, Y.; Su, F.; Wei, F.; Han, Y.; Liu, H.; Zhuang, J. The wenchuan earthquake (may 12, 2008), sichuan province, china, and resulting geohazards. Nat. Hazards 2011, 56, 19–36. [Google Scholar]
Figure 1. Study area and locations of geological hazards (0–10 represent the big cities and their suburbs and their names and abbreviations are listed as follows: 1 Yulin (YL) 2 Yanan (YA) 3 Tongchuan (TC) 4 Weinan (WN) 5 Xianyang (XY) 6 Baoji (BJ) 7 Xian (XA) 8 Hanzhong (HZ) 9 Shangluo (SL) 10 Ankang (AK)).
Remotesensing 13 04259 g001
Figure 2. The temporal variation of geological hazards and rainfall amount in Northern Shaanxi (A) and Southern Shaanxi (B).
Remotesensing 13 04259 g002
Figure 3. The frequency of geological hazards within each city region in Shaanxi province (the abbreviations of x coordinate referred to the title of Figure 1).
Remotesensing 13 04259 g003
Figure 4. The spatial distribution of potential impact factors (i.e., geomorphic types (A), river (B), road (C), fault (D), land use (E), CV of rainfall amount (F), the maximum 1 h intensity (G), soil erodibility (H) and permeability coefficient (I).
Remotesensing 13 04259 g004
Figure 5. The relationships between hazards and potential impact factors (i.e., geographic types in Southern Shaanxi (A), distance to river (B), distance to road (C), fault (D), land use (E), the maximum 1 h rainfall intensity (F) and CV of rainfall amount (G)). Note: The top of the figure represents Northern Shaanxi and the bottom represents Southern Shaanxi; The L-, M- and H- mountain in (A) means low-relief mountain, medium-relief mountain and high-relief mountain.
Remotesensing 13 04259 g005
Figure 6. The relationship between permeability coefficient and number of hazards in Northern Shaanxi (A) and soil erodibility factor and number of hazards in Southern Shaanxi (B).
Remotesensing 13 04259 g006
Figure 7. Comparison of ROC curves of Random Forests with collapse (CL), landslide (LS) and debris flow (DF) in Southern and Northern Shaanxi, respectively.
Remotesensing 13 04259 g007
Figure 8. Relative importance (VIM) of debris flow in Southern Shaanxi (A) and collapse (B,C) and landslide (D,E) in Northern and Southern Shaanxi, respectively.
Remotesensing 13 04259 g008
Figure 9. E-D Rainfall threshold for collapse (A), landslide (B) and debris flow(C).
Remotesensing 13 04259 g009
Figure 10. The rainfall threshold before and after the Wenchuan earthquake for landslides.
Remotesensing 13 04259 g010
Figure 11. Spatial distribution of landslides triggered by the Wenchuan earthquake on 12 May 2008.
Remotesensing 13 04259 g011
Figure 12. The influence of different dry periods on rainfall threshold.
Remotesensing 13 04259 g012
Table 1. The parameter values to reconstruct rainfall events.
StepParameter NameParameter ValueUnit
S0GS0.2mm
S1ER0.2mm
S1P11h
S2P21.5h
S3P31mm
S4P412h
The detailed methodology can be found in Melillo et al. (2015).
Publisher’s Note: MDPI stays neutral with regard to jurisdictional claims in published maps and institutional affiliations.

