Abstract
Global Satellite Mapping of Precipitation (GSMaP) products, as important satellite-based precipitation products (SPPs) of Global Precipitation Measurement (GPM) mission, have provided hydrologists with critical precipitation data sources for hydrological applications in gauge-sparse or ungauged basins. This study statistically and hydrologically evaluated the latest GPM-era GSMaP SPPs in real-, near-real- and post-real-time versions at daily and hourly temporal scales in the sparsely gauged Yellow River source region (YRSR) in China. It includes the five latest GSMaP SPPs, namely, gauge-adjusted product (GSMaP-Gauge), microwave-infrared reanalyzed product (GSMaP-MVK), near-real-time product (GSMaP-NRT), near-real-time product with gauge-based adjustment (GSMaP-NRT-Gauge), and real-time product (GSMaP-Now). The statistical assessment showed that among all five GSMaP SPPs, GSMaP-Gauge presented the best overall performance in daily and hourly precipitation detections in YRSR, followed by GSMaP-Now. GSMaP-NRT-Gauge was ranked the third, whereas GSMaP-MVK and GSMaP-NRT had relatively inferior performance. Given that GSMaP-Gauge demonstrated the best quality among all evaluated GSMaP SPPs, GSMaP-Gauge displayed the best hydrological feasibility in daily streamflow simulation. Both GSMaP-MVK and GSMaP-NRT presented inferior hydrological capability, with a considerable overestimation of the total streamflow. In contrast, GSMaP-Now and GSMaP-NRT-Gauge displayed basically acceptable hydrological performance in daily discharge simulations. In terms of hourly flood simulations, the performance of GSMaP-Gauge slightly worsened but was comparable to the rain-gauge-based precipitation data set. Following GSMaP-Gauge, GSMaP-Now and GSMaP-NRT-Gauge obtained certain predictability of flood events. In general, GSMaP-MVK and GSMaP-NRT barely had hydrological utility for flood-event simulations.
1. Introduction
Precipitation is one of the critical factors controlling terrestrial hydrological processes, and the accuracy of precipitation data, to a large extent, affects the performance of watershed hydrological simulations and the effectiveness of flood forecasts. Currently, there are three methods to measure precipitation, namely, rain gauges, weather radar, and satellite-based sensors [1], of which rain gauge networks are most accurate and intuitive precipitation observations. Owing to the complex terrain and high cost, rain gauge networks in many remote and mountainous regions are usually sparse. As a result, the conventional ground precipitation observations cannot fully capture the spatiotemporal variation of precipitation, which restricts their hydrometeorological applications. The surface weather radar can detect cloud and precipitation processes in the atmosphere in real time with high spatiotemporal resolution, which has irreplaceable advantages in the observation of small and medium-sized precipitation. However, the radar is limited by various sources of errors and the density of radar networks is insufficient over most parts of the world. In contrast, satellite-based precipitation products (SPPs) are able to provide quasi-global precipitation estimates on high spatiotemporal resolutions, which can be an alternative precipitation data source for hydrological simulations and forecasts in remote regions or ungauged basins.
As the first dedicated global satellite-based precipitation measurement mission, the Tropical Rainfall Measuring Mission (TRMM) was launched in 1997 by the US National Aeronautics and Space Administration (NASA) and the Japan Aerospace Exploration Agency (JAXA) [2], from which the first generation of SPPs was produced. The TRMM-era SPPs include the TRMM Multi-satellite Precipitation Analysis (TMPA) [2], Climate Precipitation Center morphing method (CMORPH) [3], Precipitation Estimation from Remotely Sensed Information using Artificial Neural Network (PERSIANN) [4], and the Global Satellite Mapping of Precipitation (GSMaP) [5], etc. In February 2014, the Global Precipitation Measurement (GPM) satellite was officially launched to ensure the continuity of the TRMM mission, signifying that satellite-based precipitation retrieving techniques have developed from the TRMM era to the GPM era [6]. The GPM-based SPPs includes the Integrated Multi-satellite Retrievals for GPM (IMERG) [7] developed by NASA and a new version of GSMaP developed by JAXA [5].
Many previous studies have been conducted to statistically evaluate the accuracy of IMERG in comparison with TMPA in many regions of the world, such as the conterminous USA [8,9], North Pakistan [10], the Mekong River basin [11,12], Mainland China [13,14], the Qinghai–Tibet Plateau [15], the Mishui basin [16], and the Yellow River source region [17] of China. These studies indicated that the IMERG SPPs generally outperforms the TMPA SPPs. Meanwhile, several previous studies [11,13,18,19,20] have assessed the performance of IMERG SPPs in hydrological simulations at the basin scale. Most of these studies demonstrated that IMERG has enhanced hydrological utilities over the TMPA standard products in basins or regions such as the Mishui basin [16], the Yellow River source region [17], the upper Mekong River basin [11], and the Peruvian−Ecuadorian Amazon basin [19], owing to its improved precipitation retrieving techniques. This indicates that the GPM-era IMERG are a reliable replacement for the TRMM-era TMPA SPPs.
Since the beginning of the GPM-era, the JAXA Precipitation Measuring Mission science team has updated the GSMaP algorithm by merging passive microwave (PMW) radiometer data from GPM-Core GPM microwave imager (GMI) to produce global precipitation products [5]. As the latest GPM-era SPPs, GSMaP version 7 (V7) was released to the public in January 2017 and provides a series of precipitation estimates on high resolution (0.1° × 0.1°, 1-hourly time interval) over the 60°N–60°S domain with different latencies, such as the post-real-time product with microwave-infrared reanalysis (GSMaP-MVK), the gauge-corrected post-real-time product (GSMaP-Gauge), the near-real-time product (GSMaP-NRT), and the gauge-corrected near-real-time product (GSMaP-NRT-gauge). Additionally, as the first real-time version of GSMaP, GSMaP-Now was released on 29 March 2017, which provides real-time global precipitation maps every half hour on 0.1° × 0.1° spatial resolution. Several previous studies have evaluated the performance of the GPM-era GSMaP SPPs in several regions of the world. In Mainland China, Ning et al. [21] found that GSMaP-Gauge version 6 (V6) performs better and has more stable quality results than IMERG final run (IMERG-F) version 4 (V4) on daily and monthly scales. Zhao et al. [22] demonstrated that IMERG-F V4 slightly outperforms GSMaP-Gauge V6 in most regions of China but tends to provide overestimated precipitation estimates in four regions of China in the case of rainfall intensity exceeding 20 mm/d. Tang et al. [23] found that GSMaP-NRT and IMERG late run (IMERG-L) SPPs provide more accurate near-real-time precipitation estimates than PERSIANN and TMPA version 7 (V7) near-real-time product (3B42RT) in South China. Tan et al. [24] found that GSMaP-Gauge shows much better error stability than GSMaP-MVK and GSMaP-NRT in nine major basins of China, and GSMaP-MVK effectively detects most rainfall events. Over diverse topographic and meteorological regions of Pakistan, Satgé et al. [25] concluded that GSMaP-Gauge V7 precipitation estimates are more accurate than the previous version, GSMaP-Gauge V6.
The TRMM-era GSMaP SPPs (versions 4 and 5) have been widely employed for hydrological applications, such as flash flood modeling in the Karpuz River basin in Turkey [26], the Huong River basin in Vietnam [27], the Nile River basin in Egypt [28], and the Chenab, Jhelum, and upper Indus River basins in Pakistan [29,30]; flood inundation simulations in the Thua Thien Hue Province in Vietnam [31]; daily discharge simulations in the Tocantins–Araguaia basin in Brazil [32], the Upper Hanjiang River basin [33], the Huaihe River basin [34], and the Biliu basin in China [35]. These studies proved that the earlier versions of GSMaP SPPs have acceptable or even satisfactory hydrological utilities in many regions of the world. However, only several previous studies [20,36,37] have evaluated the hydrological performance of the GPM-era GSMaP SPPs, in particular for the state-of-the-art GSMaP version (V7), because they were released three years ago. For instance, Lu et al. [36] evaluated the hydrological performance of GSMaP-MVK V7, GSMaP-Gauge V7, and uncalibrated and gauge-calibrated IMERG final run V5 SPPs (IMERG-UC and IMERG-C, respectively) over the Tibetan Plateau. They indicated that GSMaP-Gauge shows comparable performance with gauge reference data, whereas IMERG-UC and GSMaP-MVK demonstrate unsatisfactory hydrological feasibility. In the Lake Titicaca region of Bolivia, Satgé et al. [37] found that GSMaP-Gauge V6 largely underestimates precipitation by 25%, and it is not suitable for hydrological simulations. In the Chindwin River basin of Myanmar, Yuan et al. [20] assessed the feasibility of IMERG V5 and GSMaP V7 SPPs in both post- and near-real-time versions in three-hourly flood simulations and demonstrated that GSMaP-Gauge, GSMaP-MVK, and GSMaP-NRT show relatively poorer hydrological performance than IMERG and TMPA V7 SPPs. These relevant studies [36,37] mainly investigated the GPM-era GSMaP SPPs at daily scales, whereas assessments at sub-daily scales are rare [38]. Among the several real-time SPPs released to the public, GSMaP-Now is expected to be an alternative precipitation data source for real-time flash flood forecasting in ungauged regions. However, according to our knowledge, hydrological evaluations of GSMaP-NRT-Gauge V7 and GSMaP-Now have not been reported. Therefore, it is necessary to quantitatively evaluate the hydrological utility of the latest GPM-era GSMaP SPPs in all real-time, near-real-time, and post-real-time versions at shorter-than-daily time scales.
This study statistically and hydrologically evaluates the latest GPM-era GSMaP SPPs in the sparsely gauged Yellow River source region in China. Given that previous studies seldom focused on the statistical and hydrological evaluations of GSMaP SPPs in real-time, near-real-time and post-real-time versions at sub-daily time scales, the main objectives of the present work are as follows: (1) statistically evaluate the quality of the five latest GSMaP (GSMaP-Gauge, GSMaP-MVK, GSMaP-NRT, GSMaP-NRT-Gauge, and GSMaP-Now) SPPs against the ground precipitation measurements at daily and hourly time scales in the study area; and (2) quantitatively assess the hydrological performance of the real-time, near-real-time, and post-real-time versions of GSMaP SPPs in simulating historical daily streamflow processes and hourly flood events. We expect that the findings reported in this manuscript could provide SPP researchers and users with useful feedbacks on hydrological feasibility of the latest GPM-era GSMaP in the study area and promote to improve the GSMaP algorithms in future versions.
2. Study Area and Data Processing
2.1. Study Area
In this study, the Yellow River source region (YRSR) was selected as the study area, which is located on northeast Qinghai–Tibet Plateau of China (Figure 1). YRSR has a drainage area of 1.22 × 10⁵ km2 upstream the Tangnaihai hydrological station, representing 15% of the entire Yellow River basin. Topography of YRSR is complicated with high elevation, and the altitude is in an overall descending trend from southwest to northeast (Figure 1). The study area is featured by the typical Qinghai–Tibet Plateau climate system, with the southwest monsoon and East Asian monsoon influenced by subtropical high pressure in the summer and westerlies in the winter. Influenced by complex topography, the monsoon-induced precipitation varies remarkably in space with a distinct decreasing trend from southeast to northwest, and annual mean precipitation ranges from over 800 mm to less than 200 mm [39]. In summer, the southwest monsoon from the Bay of Bengal brings heavy precipitation, in particular, in the southeastern part of YRSR, and in winter the westerly winds produce snow throughout YRSR. Snowfall accounts for about 20% of total precipitation in YRSR. The study area is low in mean annual air temperature, ranging between –4 and 2 °C, and July is the warmest month. YRSR is the “water tower” of the Yellow River. Its annual mean runoff is 168 mm, occupying 35% of the total runoff of the Yellow River basin [40]. Thus, obtaining accurate precipitation data sets is essential for hydrological and ecological research and sustainable water resources management in this region. The spatiotemporal distribution of runoff is similar to that of precipitation, and in the wet season (June–October), runoff accounts for 70% of the annual total runoff [40]. The local predominant land covers are temperate and Alpine grasslands and meadows, and there are permanent snowpack and glaciers in the western mountainous regions. YRSR was selected for hydrological evaluations of SPPs because of less impacts of human activities with a low population density and no large reservoirs and irrigation projects [17,39].

Figure 1.
Location of the Yellow River source region.
2.2. Ground Weather Data
Meteorological data at 13 ground weather stations (Figure 1) in YRSR were acquired from China Meteorological Administration. These data consist of hourly records of precipitation, air temperature, and wind speed for the period of 1 January 2014–31 December 2018. They also include daily precipitation, maximum and minimum air temperature, and wind speed for the period of 1 January 2000–31 December 2018. All the gauge-based precipitation data were automatically recorded by siphoning or tipping-bucket rain gauges and underwent a strict quality control procedure [41]. Among these 13 weather stations, 11 stations are not included in the Climate Prediction Center (CPC) Unified Gauge-based Analysis of Global Daily Precipitation data set, except for the Dari and Maduo stations. These ground precipitation data were used as the benchmark for statistical evaluations of GSMaP SPPs. The inverse-distance weighting method was adopted to produce the atmospheric forcing data set for distributed hydrological modeling, which interpolated the gauge-based precipitation, air temperature, and wind speed data to the 0.1° resolution. We used 13 ground weather stations in YRSR for interpolation, excluding those outside the study area.
Satellite Precipitation Products
Five GSMaP SPPs were selected for assessment in this study (Table 1). Among them, GSMaP-MVK, GSMaP-Gauge, GSMaP-NRT, and GSMaP-NRT-Gauge are the GSMaP version 07 (V07) products using the latest algorithm for GPM. The GSMaP V07 algorithm first retrieves the instantaneous precipitation intensity estimates based on the PMW radiometers from various satellite platforms such as GMI, TRMM Microwave Imager (TMI), advanced microwave scanning radiometer 2 (AMSR2), special sensor microwave imager/sounder (SSMIS), microwave humidity sounder (MHS), and advanced microwave sounding unit-A (AMSU-A). Subsequently, the cloud motion vectors derived from geo-IR images are adopted to propagate the gaps between PMW-based estimates, and a Kalman filter method is used to adjust the precipitation rate. After that, the GSMaP-MVK SPP is generated by weighting and combining the forward and backward propagated precipitation estimates, and the GSMaP-Gauge SPP is produced by refining the GSMaP-MVK precipitation estimates based on CPC data set provided by the National Oceanic and Atmospheric Administration [42].

Table 1.
Basic information of the GSMaP SPPs used in this study.
Both GSMaP-MVK and GSMaP-Gauge belong to the post-real-time SPPs and have a data latency of 3 days. Different from GSMaP-MVK, the near-real-time SPP (GSMaP-NRT) is generated via a simplified algorithm that merely considers temporary forward cloud movement to maintain data latency in near real time (4 h) [36]. GSMaP-NRT-Gauge is a near-real-time version of GSMaP-Gauge. However, it does not use gauge measurement directly because the gauge data are not available in near real time. Therefore, GSMaP-NRT-Gauge only adopts the error parameters derived from GSMaP-Gauge to adjust the GSMaP-NRT precipitation estimates. Furthermore, GSMaP-Now is a real-time SPP. It uses passive microwave observations that are available within a half-hour after observation (GMI, AMSR2 near Japan, and AMSU direct receiving data) and applies a half-hour extrapolation of rainfall map toward future direction by using cloud moving vector from the geostationary satellite. All the five GSMaP SPPs provide precipitation estimates on a spatial resolution of 0.1° covering the latitude belt of 60°N–60°S. GSMaP-MVK, GSMaP-Gauge, GSMaP-NRT, and GSMaP-NRT-Gauge are in an hourly time interval and GSMaP-Now in a half-hour time step. These data can be downloaded from the JAXA Global Rainfall Watch website (https://sharaku.eorc.jaxa.jp/GSMaP (accessed on 15 March 2019)). In this study, GSMaP-MVK and GSMaP-Gauge were evaluated for the period of 1 March 2014–31 December 2018, and GSMaP-NRT and GSMaP-NRT-Gauge were assessed from 17 January 2017 to 31 December 2018. The evaluation period for GSMaP-Now is 29 March 2017–31 December 2018. This study set the resolution of satellite-based precipitation to that of ground rain gauges (0.1 mm). Additionally, this study defined 0.1 mm/d as the threshold to distinguish the precipitation and no-rain events because that the local ground rain gauges could only measure precipitation above 0.1 mm/d. Thus, satellite-derived precipitation below 0.1 mm/d was set to zero to eliminate the effect of drizzles.
2.3. Discharge Data
In this study, the observed discharge data at the Tangnaihai hydrological station (Figure 1) were provided by the Yellow River Conservancy Commission of China. These discharge data include daily streamflow observations from 1 January 2000 to 31 December 2018 and the discharge records of eight major flood events in 2014–2018. The time interval of the flood data varies from 6 min to 12 h and were linearly transformed into hourly temporal intervals. These observed discharge data were used for model calibration and hydrological evaluation of SPPs.
2.4. Geographical Data
The geographic data used in this study include topography, land cover, and soil texture, which are required by the variable infiltration capacity (VIC) hydrological model. The Shuttle Radar Topographic Mission 90 m global digital elevation model data were downloaded from the US Geological Survey website (http://srtm.csi.cgiar.org/ (accessed on 10 July 2018)). The global land cover classification data were obtained from the University of Maryland, which have 14 land use/cover classifications with a 1 km spatial resolution [43]. The adopted soil texture information is the Food and Agriculture Organization soil texture dataset with a 5 min resolution [44].
3. Methodology
In this study, the five GSMaP SPPs (GSMaP-Gauge, GSMaP-MVK, GSMaP-NRT, GSMaP-NRT-Gauge, and GSMaP-Now) were statistically evaluated versus ground precipitation observations at daily and hourly time scales. Afterward, these SPPs and the gridded observed weather data set were used to drive the VIC hydrological model for daily streamflow simulations and hourly flood-event simulations, and the hydrological performance of SPPs were assessed by comparing the SPP-based simulated hydrographs with the observations. This section briefly introduces the diagnostic indices for statistical and hydrological evaluations of SPPs, the VIC hydrological model, and the hydrological simulation schemes.
3.1. Diagnostic Indices
To quantify the quality of GSMaP SPPs versus ground precipitation measurements, the relative bias of total precipitation (RBP), Pearson correlation coefficient (CC), relative root-mean-squared error (RRMSE), probability of detection (POD), false alarm ratio (FAR), and critical success index (CSI) were adopted (Table 2). RBP denotes the systematic deviation rate between the satellite- and gauge-based precipitation data sets. CC represents the agreement between the satellite precipitation estimates and gauge observations. Please note that the calculation of CC values included zero precipitation events in both gauge and GSMaP data. RRMSE measures the average relative error of the satellite precipitation. POD denotes the proportion of precipitation events correctly identified by the satellites among all real events. FAR represents the fraction of false precipitation events among all events detected by the satellites. CSI denotes the overall fraction of precipitation events correctly detected by the satellites.
Table 2.
Diagnostic indices for statistical and hydrological evaluations of SPPs.
To evaluate the feasibility of SPPs in daily streamflow simulations and hourly flood-event simulations, the relative bias of total runoff (RBR) and the Nash–Sutcliffe model efficiency coefficient (NSE) were used (Table 2). In addition, two more indices were adopted to evaluate the performance of SPPs in hourly flood-event simulations, which are the relative bias of flood peak flow (RBFP) and the error of flood peak time (EPT) (Table 2).
3.2. Hydrological Model
In this study, the VIC model version 4.0.4 was employed for hydrological simulations, which is a physically-based large-scale hydrological model [45,46]. It defines each land grid cell as a single vertical column of vegetation, snow, and soil and simulates evapotranspiration, sensible heat, radiative fluxes, and turbulent fluxes of momentum at each time step. In the vertical soil column, the VIC model simulates the physical processes such as heat diffusion, unsaturated liquid water transport, saturated gravitational drainage, overland flow, bottom drainage, uptake of liquid water by plant roots for transpiration, and freezing and thawing of frozen soil. The model simulates baseflow from the deepest soil layer using the baseflow parameterization scheme of the ARNO model [47] and calculates surface runoff via a conceptual surface runoff parameterization developed by [48,49] that combines both the saturation excess runoff and infiltration excess runoff mechanisms. In terms of the routing scheme, a gravitational water reservoir method is used to separate the calculated total runoff at each grid cell into overland, interflow, and groundwater runoffs, and three linear reservoirs are employed for hillslope concentration of these three runoff components at each grid cell. Finally, the Muskingum routing method is adopted to simulate the routing effect of the channel system connecting each grid cell.
The VIC model has three categories of parameters. The values of vegetation-related parameters such as leaf area index, albedo, architectural resistance, minimum stomata resistance, zero-plane displacement roughness length, and fraction of root depth at each soil layer are defined according to the Global Land Data Assimilation Systems developed by the National Aeronautics and Space Administration (https://ldas.gsfc.nasa.gov/gldas/ (accessed on 15 March 2019)). The parameters related to soil characteristics such as porosity, saturated soil potential, saturated hydraulic conductivity, and the exponent of the unsaturated hydraulic conductivity curve are estimated according to the work by [50,51]. The third category is empirical parameters that are subject to calibration. These include the infiltration curve exponent, the three soil-layer thicknesses, the three parameters in the base flow scheme including the maximum velocity of base flow, the fraction of maximum base flow, the fraction of maximum soil moisture content at the third layer at which a nonlinear base flow response is initiated, and the parameters in the routing scheme such as the free water storage, the two outflow coefficient for interflow and groundwater runoffs, the three recession constants for surface, interflow, and groundwater runoffs, and the Muskingum storage-time and proportionality constants.
3.3. Discharge Simulation Schemes
In this study, YRSR was decomposed into 1354 grid cells on a 0.1° spatial resolution. Six precipitation data sets were evaluated with respects to their hydrological performance, and they are the gauge-based gridded, GSMaP-MVK, GSMaP-Gauge, GSMaP-NRT, GSMaP-NRT-Gauge, and GSMaP-Now data sets on a 0.1° spatial resolution. These six precipitation data sets were used to drive the VIC model to perform historical daily discharge simulations and hourly flood-event simulations at the Tangnaihai hydrological station.
As mentioned in Section 3.2, several empirical parameters in the VIC model and routing scheme require calibration. In this study, these parameters were calibrated by fitting the simulated hydrograph against the observed one with the gauge-based precipitation data as the model input. For daily discharge simulations, the first two years (2000 and 2001) were selected as the warming-up period, and the calibration and validation periods were defined as 1 January 2002–31 December 2010 and 1 January 2011–31 December 2013, respectively. For hourly flood-event simulations, the time periods of one flood event in 2014, two events in 2015, and one event in 2016 were adopted as the calibration period, and the time spans of two events in 2017 and two events in 2018 were selected as the validation period. The model parameters were optimized by the shuffled complex evolution automatic optimization method [52,53], and the maximum of NSE was selected as the objective function for hydrological model optimization.
After model calibration, the VIC model was driven by the five GSMaP SPPs to perform daily streamflow and hourly flood-event simulations using the gauge-precipitation-benchmarked model parameters. Notably, flood-event simulations are sensitive to certain initial conditions such as initial soil water contents at three soil layers, free water storage depth, surface runoff, interflow, and groundwater runoff in the three linear reservoirs. To minimize the uncertainty of arbitrarily adjusting initial conditions on flood-event simulations, we derived the VIC model state variables in daily streamflow simulations on the date when the flood events began and used these values of state variables as the initial conditions for flood-event simulations.
4. Results
4.1. Statistical Assessment of GSMaP SPPs Versus Ground Precipitation Observations
Before the hydrological utility of various GSMaP SPPs was evaluated, the qualities of the GSMaP SPPs were assessed against the ground precipitation measurements. Such investigations were performed with respect to the spatial distribution of precipitation and SPP-based precipitation estimates at daily and hourly time scales.
4.1.1. Spatial Distribution
Given that the acquired five GSMaP SPPs in this study have different time periods, the spatial distribution of mean daily precipitation depth derived from the five GSMaP SPPs over the overlapped time span (29 March 2017–31 December 2018) was compared with that of the gauge-based gridded precipitation data set (Figure 2). As shown in Figure 2, the gauge-based gridded precipitation data demonstrate that precipitation in YRSR tends to increase from the northwest to the southeast with the minimum precipitation rate of 1.0 mm/d and the maximum of 2.3 mm/d. All GSMaP SPPs present the precipitation distribution pattern that is similar to that of the gauge-based gridded precipitation data set (Figure 2b–f). However, all SPPs generally estimate a drier condition in the northwestern region and a wetter situation in the southeastern part than the gauge-based precipitation data, and GSMaP-Gauge demonstrates the precipitation spatial pattern that is closest to that of the gauge-based data. The basin-averaged precipitation rate from the gauge-based data set is 1.9 mm/d, and all post- and near-real-time SPPs (GSMaP-MVK, GSMaP-Gauge, GSMaP-NRT, and GSMaP-Gauge-NRT) overestimate the mean precipitation rate by 0.6, 0.2, 0.6, and 0.1 mm/d, respectively. The real-time SPP, GSMaP-Now, largely underestimates the basin-averaged precipitation by 0.6 mm/d.
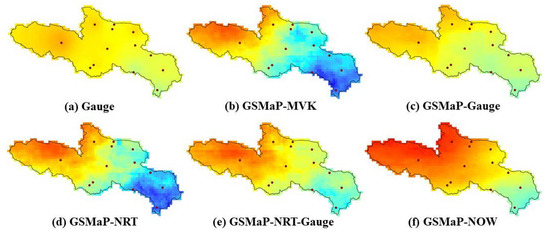
Figure 2.
Spatial distribution of mean daily precipitation rates estimated from the gauge-based gridded precipitation data set and five GSMaP SPPs from 29 March 2017 to 31 December 2018.
4.1.2. Satellite Precipitation Estimates at Daily Scales
The daily precipitation estimates from the five GSMaP SPPs at the locations of the 13 rain gauges were statistically evaluated against the ground precipitation measurements from 29 March 2017 to 31 December 2018. Figure 3a demonstrates that GSMaP-MVK largely overestimates daily precipitation at 12 out of the 13 rain gauges with a mean RBP value of 55.2%. Owing to bias-correction using the CPC gauge-analysis global daily precipitation data set, GSMaP-Gauge effectively reduces the systematic errors of GSMaP-MVK with an averaged RBP value of 3.0%. GSMaP-NRT is generally inclined to considerably overestimate daily precipitation by 41.2%. In contrast, GSMaP-NRT-Gauge presents much lower systematic errors (averaged RBP = 9.3%) than GSMaP-NRT, because GSMaP-NRT-Gauge uses the error parameters derived from GSMaP-Gauge to adjust GSMaP-NRT precipitation estimates. Different from the post- and near-real-time GSMaP SPPs, GSMaP-Now gives an overall precipitation underestimation with an averaged RBP of –26.8%. As shown in Figure 3b, GSMaP-Gauge achieves the highest CC among all five GSMaP SPPs (averaged CC = 0.751), and GSMaP-MVK, GSMaP-NRT, GSMaP-NRT-Gauge, and GSMaP-Now display similar magnitudes of CC (averaged CC = 0.545, 0.500, 0.535, and 0.522, respectively). Concerning RRMSE, GSMaP-Gauge has the lowest relative errors (averaged RRMSE = 147.3%), followed by GSMaP-Now (217.3%) and GSMaP-NRT-Gauge (273.5%), and GSMaP-MVK and GSMaP-NRT demonstrate much higher relative errors (321.1% and 356.2%, respectively) (Figure 3c). In terms of the capability of SPPs in detecting precipitation events, the two post-real-time SPPs have relatively higher PODs (averaged POD = 0.778 and 0.817 for GSMaP-MVK and GSMaP-Gauge, respectively) than the near-real-time and real-time SPPs (0.670, 0.670, and 0.582 for GSMaP-NRT, GSMaP-NRT-Gauge, and GSMaP-Now, respectively), and GSMaP-Gauge obtains the highest PODs among all five GSMaP SPPs (Figure 3d). Figure 3e demonstrates that GSMaP-Gauge generally provides the lowest FARs (averaged FAR = 0.192), and GSMaP-MVK obtains the highest FARs (averaged FAR = 0.278). The three near-real-time and real-time SPPs have the similar magnitudes of FARs with mean FAR values of 0.246, 0.242, and 0.246 for GSMaP-NRT, GSMaP-NRT-Gauge, and GSMaP-Now, respectively. With respects to CSI, GSMaP-Gauge has the best performance (averaged CSI = 0.682), followed by GSMaP-MVK (averaged CSI = 0.598) (Figure 3f). The three near-real-time and real-time SPPs have inferior performance. Both GSMaP-NRT and GSMaP-NRT-Gauge obtain an averaged CSI value of 0.550, and GSMaP-Now has the lowest averaged CSI (0.486) but with much higher variability of CSI than other SPPs (Figure 3f).
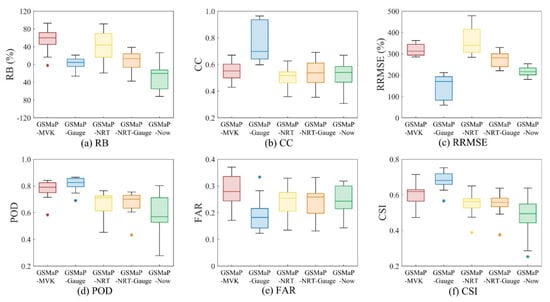
Figure 3.
Box plot of the statistical indices of daily precipitation estimates from the five GSMaP SPPs at the 13 weather stations in YRSR (29 March 2017–31 December 2018).
The frequency distributions of daily precipitation estimates from the five GSMaP SPPs at the locations of the 13 rain gauges were compared with that of the ground observations. Figure 4a displays that approximately 58.6% of the observed daily precipitation data samples are under 0.1 mm. GSMaP-Gauge and GSMaP-MVK SPPs underestimate this frequency by 2.7% and 5.7%, respectively. In contrast, the three near-real-time and real-time GSMaP SPPs tend to overestimate the occurrence of drizzle events by 2.4–7.2%. For daily precipitation ranging from 0.1 to 10 mm, GSMaP-Gauge and GSMaP-MVK mildly overestimate this frequency by 2.4% and 1.7%, respectively, and GSMaP-NRT, GSMaP-NRT-Gauge, and GSMaP-Now give an underestimation of 3.4–6.0%. GSMaP-Gauge consistently underestimates the rainfall events with daily precipitation exceeding 20 mm, whereas GSMaP-NRT, GSMaP-NRT-Gauge, and GSMaP-MVK give evident overestimations of these events. GSMaP-Now presents a noticeable underestimation of daily rainfall events ranging from 20 to 30 mm and a slight overestimation of events exceeding 40 mm/d.
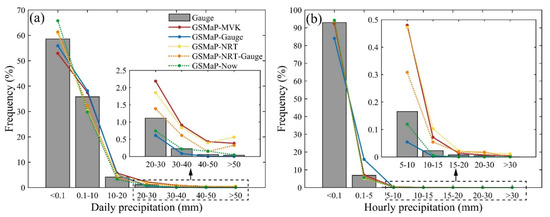
Figure 4.
Histograms of the five GSMaP satellite precipitation estimates at thirteen stations in YRSR in comparison with the ground observations (29 March 2017–31 December 2018): (a) daily precipitation estimates and (b) hourly precipitation estimates.
In this study, the Taylor diagrams were used to visualize the concise statistical summary on how well each GSMaP SPP agrees with the ground precipitation observations in YRSR (Figure 5). Figure 5a indicates that among all five SPPs, GSMaP-Gauge demonstrates the best overall performance in capturing daytime precipitation dynamics, followed by GSMaP-Now and GSMaP-NRT-Gauge. GSMaP-MVK and GSMaP-NRT have inferior performance. The better quality of GSMaP-Gauge and GSMaP-NRT-Gauge implies that gauge-based bias-correction effectively reduces the precipitation errors in GSMaP-MVK and GSMaP-NRT in YRSR. Meanwhile, as a real-time SPP, GSMaP-Now presents an acceptable performance in daily precipitation detections in YRSR.
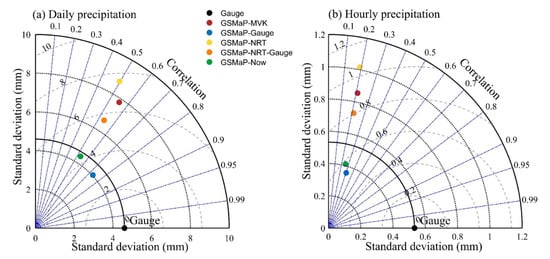
Figure 5.
Taylor diagrams for comparing the five GSMaP SPPs at the locations of the 13 weather stations in YRSR with respect to the gauge observations (29 March 2017–31 December 2018): (a) daily precipitation estimates and (b) hourly precipitation estimates.
4.1.3. Satellite Precipitation Estimates at Hourly Scales
Figure 6 displays the box plot of the statistical indices of hourly precipitation estimates from the five GSMaP SPPs in the period of 29 March 2017–31 December 2018. In each box plot, the box corresponds to the interquartile range (25% and 75%, respectively) and the line inside the box corresponds to the median value. One whisker connects the upper quartile to the non-outlier maximum, and the other connects the lower quartile to the non-outlier minimum. Figure 6a shows that the SPP-based hourly precipitation estimates are at the same magnitudes of RBP as the daily precipitation estimates (Figure 3a), which overall presents a mild overestimation by GSMaP-Gauge and GSMaP-NRT-Gauge, a significant overestimation by GSMaP-MVK and GSMaP-NRT, and a considerable underestimation by GSMaP-Now. The CC values at hourly scale are evidently lower than those at daily scale (Figure 6b). GSMaP-Gauge provides the highest averaged CC (0.295) among all five SPPs, followed by GSMaP-Now (0.243) and GSMaP-NRT-Gauge (0.207). The GSMaP-MVK- and GSMaP-NRT-based hourly precipitation estimates are in the lowest correlation with the ground observations. As time scale decreases, the SPP-based hourly precipitation estimates give much higher RRMSE values than the daily precipitation estimates (Figure 6c). GSMaP-Gauge and GSMaP-Now obtain an averaged RRMSE of 656.2% and 699.4%, respectively. GSMaP-NRT-Gauge, GSMaP-MVK, and GSMaP-NRT contain much larger errors (averaged RRMSE = 956.9%, 1069.8%, and 1214.2%, respectively). Moreover, compared with the SPP-based daily precipitation estimates, the hourly satellite products demonstrate evidently lower POD and CSI values and clearly higher FAR values (Figure 6e,f). This result indicates that at hourly temporal scale, the precipitation detection capability of all the GSMaP SPPs is reduced with considerably higher false alarm ratios. Among all five GSMaP SPPs, GSMaP-Gauge has the highest detection capability and the three real-time and near-real-time SPPs have inferior performances, which is similar to the situation of the SPP-based daily precipitation estimates.
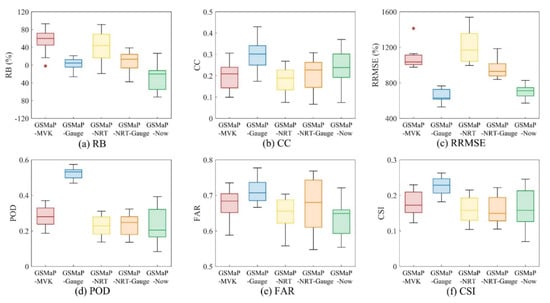
Figure 6.
Box plot of the statistical indices of hourly precipitation estimates from the five GSMaP SPPs at the 13 weather stations in YRSR (29 March 2017–31 December 2018).
Figure 4b shows that GSMaP-Gauge considerably underestimates the occurrence of the hourly precipitation less than 0.1 mm by 8.9%, and GSMaP-MVK demonstrates a slight underestimation by 0.6%. In contrast, GSMaP-NRT, GSMaP-NRT-Gauge, and GSMaP-Now present a mild overestimation of this rainfall event by 1.4%, 0.5%, and 0.3%, respectively. For the precipitation level ranging from 0.1 to 5 mm/h, GSMaP-MVK shows a negligible overestimation of 0.2%, and GSMaP-Gauge considerably overestimates this frequency by 9.1%. The three near-real-time and real-time SPPs give a minor underestimation of 0.7–1.7%. Figure 4b also shows that GSMaP-MVK, GSMaP-NRT, and GSMaP-NRT-Gauge consistently overestimate the frequency of the events with precipitation intensity exceeding 5 mm/h, whereas GSMaP-Gauge and GSMaP-Now demonstrate a noticeable underestimation.
As shown in Figure 5b, GSMaP-Gauge presents the best performance, followed by GSMaP-Now. GSMaP-NRT-Gauge is ranked third, and GSMaP-MVK and GSMaP-NRT are unsatisfying due to their relatively long distance from “Gauge” point. Although the pattern of overall performance of the five GSMaP SPPs in retrieving hourly precipitation is similar to that of the SPP-based daily precipitation estimates (Figure 5a), the quality of the SPP-based hourly precipitation estimates is much lower than that of the SPP-based daily estimates. Given that precipitation tends to be more reliable at finer temporal scales, all five GSMaP SPPs are poorer in retrieving hourly precipitation dynamics than in detecting daily processes.
4.2. Hydrological Assessment of GSMaP SPPs
Fed with the gauge-based gridded precipitation and the five GSMaP SPPs, the VIC model was used to conduct daily discharge simulations and to simulate the eight historical flood events at hourly scale at the Tangnaihai streamflow station. The simulated hydrographs using different precipitation inputs were compared with the observations to investigate the hydrological feasibility of the five GSMaP SPPs in YRSR.
4.2.1. Daily Discharge Simulations
As shown in Figure 7, the simulated daily hydrograph at the Tangnaihai station using the rain-gauge-based precipitation data agrees well with the measurements. In the calibration period (1 January 2002–31 December 2010), a negligible RBR of −0.3% and a high NSE of 0.845 were obtained. In the validation period (1 January 2011–31 December 2013), the VIC model moderately underestimates total streamflow by 13.2%, with an NSE value of 0.800. This finding indicates that the VIC-model with the rain-gauge-based precipitation data as its input can accurately reproduce the historical daily streamflow processes in YRSR.

Figure 7.
The VIC-based simulated daily hydrograph at the Tangnaihai hydrological station using the rain-gauge-based precipitation data in the calibration period (1 January 2002–31 December 2010) and validation period (1 January 2011–31 December 2013) (Q_obs denotes the observed discharge; Q_Gauge represents the simulated discharge using the gauge-based precipitation data; and P_Gauge is the rain-gauge-based basin-averaged precipitation).
To evaluate the hydrological utility of GSMaP SPPs, the VIC model using the rain-gauge-benchmarked model parameters was firstly driven by the rain-gauge-based data, GSMaP-MVK, and GSMaP-Gauge SPPs for daily streamflow simulations for the period of 1 March 2014–31 December 2018. Figure 8 and Table 3 show that, in this period, the simulated hydrograph using the rain-gauge-based precipitation data is fairly in line with the observed hydrograph, with the RBR and NSE values of 8.0% and 0.760, respectively. Given that GSMaP-MVK largely overestimates the basin-averaged precipitation by 53.1%, the GSMaP-MVK-forced simulation significantly overestimates the total streamflow by 169.1%, with a negative NSE (−6.316) (Table 3). This indicates that GSMaP-MVK has inferior performance in daily streamflow simulation in YRSR. Owing to the better quality of GSMaP-Gauge arising from the bias-correction using the CPC precipitation data set, the GSMaP-Gauge-based model run demonstrates much better hydrological performance than the GSMaP-MVK-based simulation, which is comparable to the rain-gauge-driven model run. The GSMaP-Gauge-forced VIC model obtains an NSE of 0.613 but gives a considerable streamflow overestimation of 24.0%, mostly due to the situation that GSMaP-Gauge slightly overestimates the basin-averaged precipitation by 8.7% (Table 3 and Figure 8).

Figure 8.
Observed and simulated daily hydrographs at the Tangnaihai hydrological station using the rain-gauge-, GSMaP-MVK-, and GSMaP-Gauge-based precipitation data inputs in the period of 1 March 2014–31 December 2018 (Q_obs denotes the observed discharge; Q_Gauge represents the simulated discharge using the rain-gauge-based precipitation data; Q_GSMaP-MVK and Q_GSMaP-Gauge are the simulated streamflow using GSMaP-MVK and GSMaP-Gauge SPPs, respectively; P_Gauge denotes the rain-gauge-based basin-averaged precipitation; and P_GSMaP-MVK and P_GSMaP-Gauge represent the GSMaP-MVK- and GSMaP-Gauge-based basin-averaged precipitation, respectively).
Table 3.
Statistical indices of daily discharge simulations at the Tangnaihai hydrological station using the rain-gauge-based precipitation data and the five GSMaP SPPs.
In addition, the rain-gauge-based precipitation data and the five GSMaP SPPs were used to drive the rain-gauge-benchmarked VIC model to simulate daily streamflow processes in the period of 29 March 2017–31 December 2018. As indicated in Figure 9 and Table 3, among all GSMaP SPPs, GSMaP-Gauge displays the best hydrological feasibility with the RBR and NSE values of 25.9% and 0.630, respectively, which is basically comparable to rain-gauge-based data. GSMaP-Now demonstrates basically acceptable hydrological performance (NSE = 0.380) but considerably underestimates total streamflow by 21.5%, which is largely attributed to the underestimation of basin-averaged precipitation by 29.8%. Although GSMaP-NRT-Gauge slightly overestimates the basin-averaged precipitation by 2.3%, the GSMaP-NRT-Gauge-forced model run provides a streamflow overestimation (RBR = 36.1% and NSE = 0.104). This phenomenon might result from the situation where GSMaP-NRT-Gauge tends to considerably overestimate the occurrence frequency of the precipitation events exceeding 20 mm/d (Figure 4a), thereby likely promoting more runoff to be produced. Both GSMaP-MVK and GSMaP-NRT almost have no streamflow predictability (NSE = −5.053 and −3.307, respectively), and the corresponding two model runs both largely overestimate total streamflow (RBR = 153.5% and 111.2%, respectively) because GSMaP-MVK and GSMaP-NRT apparently overestimate the basin-averaged precipitation.

Figure 9.
Observed and simulated daily hydrographs at the Tangnaihai hydrological station using the rain-gauge-, GSMaP-MVK-, GSMaP-Gauge-, GSMaP-NRT-, GSMaP-NRT-Gauge-, and GSMaP-Now-based precipitation data inputs in the period of March 29, 2017–December 31, 2018 (Q_obs denotes the observed discharge; Q_Gauge represents the simulated discharge using the rain-gauge-based precipitation data; Q_GSMaP-MVK, Q_GSMaP-Gauge, Q_GSMaP-NRT, Q_GSMaP-NRT-Gauge, and Q_GSMaP-Now are the simulated streamflow using GSMaP-MVK, GSMaP-Gauge, GSMaP-NRT, GSMaP-NRT-Gauge, and GSMaP-Now SPPs, respectively; P_Gauge denotes the rain-gauge-based basin-averaged precipitation; and P_GSMaP-MVK, P_GSMaP-Gauge, P_GSMaP-NRT, P_GSMaP-NRT-Gauge, and P_GSMaP-Now represent the GSMaP-MVK-, GSMaP-Gauge-, GSMaP-NRT-, GSMaP-NRT-Gauge-, and GSMaP-Now-based basin-averaged precipitation, respectively).
This study compared the simulated high and low flows at the Tangnaihai hydrological station using the rain-gauge-based precipitation data and the five GSMaP SPPs with the observations. As shown in Figure 10, the rain-gauge-forced model run accurately simulates the 90% daily streamflow quantile (Q90), slightly underestimates the 95% quantile (Q95) by 5.2%, and moderately overestimates the 80% quantile (Q80) by 14.7%. Figure 10 also shows that the 20%, 10%, and 5% daily streamflow quantiles (Q20, Q10, and Q5) simulated by the VIC model using the rain gauge data are in a mild underestimation of 11.5–13.9%. This finding implies that the rain-gauge-driven model run is able to capture both high and low flows at the Tangnaihai station. In the case of GSMaP-Gauge, the VIC model tends to consistently overestimate these high- and low-flow quantiles by 14.8–24.2% and 24.4–33.0%, respectively. The model runs using GSMaP-MVK, GSMaP-NRT, and GSMaP-NRT-Gauge SPPs are inclined to systematically overestimate high and low flows as well, but with much higher magnitudes than the GSMaP-Gauge-based model run. In particular, a high-flow overestimation up to 106.5–154.6% and 98.0–114.2% is found in the GSMaP-MVK- and GSMaP-NRT-forced simulations, and the low-flow overestimation reaches 200.9–114.2% and 89.9–135.1%, respectively. In contrast, the GSMaP-Now-based model run systematically underestimates the Q95, Q90, and Q80 quantiles by 15.8–18.1% and significantly underestimates Q20, Q10, and Q5 by 33.7–41.9%.
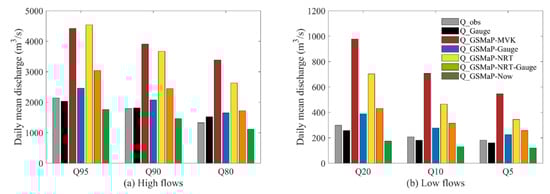
Figure 10.
The simulated high and low flows at the Tangnaihai hydrological station using the rain-gauge-based precipitation data and the five GSMaP SPPs in comparison with the observations in the period of 29 March 2017–31 December 2018 (Q95, Q90, Q80, Q20, Q10, and Q5 denote the 95%, 90%, 80%, 20%, 10%, and 5% daily discharge quantiles, respectively).
Furthermore, the Taylor diagram was plotted to assess the overall performance of the rain-gauge-based precipitation data set and the five GSMaP SPPs in daily streamflow simulations from 29 March 2017 to 31 December 2018 at the Tangnaihai hydrological station in contrast with the observed discharge data. As shown in Figure 11, the rain-gauge-based model run demonstrates the best approximation to the observed daily discharge time series. The GSMaP-Gauge-driven simulation run presents satisfactory performance, which is comparable to the rain-gauge-based model run. GSMaP-Now and GSMaP-NRT-Gauge achieve acceptable hydrological feasibility in daily streamflow simulations. The GSMaP-MVK- and GSMaP-NRT-based model runs demonstrate inferior capability in daily discharge simulations. The pattern of the overall hydrological performance of the five GSMaP SPPs is similar to that in daily precipitation retrieving (Figure 5a). This indicates that the quality of SPPs, to a great degree, determines the performance of hydrological simulations because the errors of precipitation data are able to propagate in streamflow simulations.
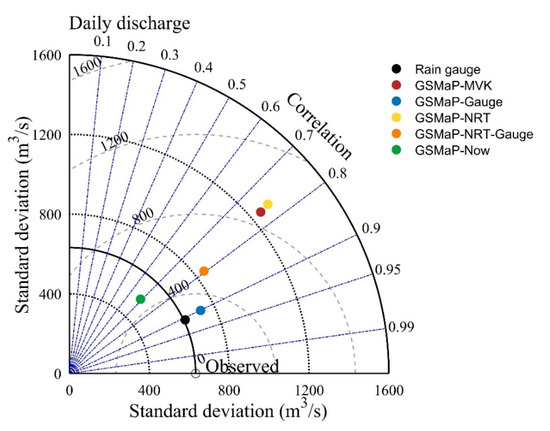
Figure 11.
Taylor diagrams showing the overall performance of daily streamflow simulation from 29 March 2017 to 31 December 2018 at the Tangnaihai hydrological station using the rain-gauge-based precipitation data set and the five GSMaP SPPs based on the observed discharge data.
4.2.2. Hourly Flood-Event Simulations
Forced by the rain-gauge-based precipitation data, the VIC model was calibrated for the four flood events in 2014–2016 and was validated for the four events in 2017 and 2018 at hourly time intervals. Figure 12 and Table 4 show that the rain-gauge-driven VIC model basically replicates three out of the four flood events (Events 20140907, 20150622, and 20161011) in the calibration period with the NSE values ranging from 0.551 to 0.590, but the performance for Event 20150921 is not satisfying with a negative NSE (−0.168). For the validation period, the calibrated model only effectively simulates one out of the four events (Event 20180625) with an NSE value of 0.607 but gives unqualified results for the other three events (Events 20170527, 20170821, and 20180829) with negative NSEs (Figure 13 and Table 4). All historical flood-event simulations using the rain-gauge-based precipitation data contain considerable errors in total runoff and flood peak flow (Table 4). This finding implies that the current sparse rain-gauge network in YRSR may not fully capture the spatial variation of precipitation at hourly time scales, and the underlying errors in the rain-gauge-based gridded precipitation data likely lead to non-negligible biases in flood-event simulations. Additionally, the estimated initial conditions such as initial soil moisture, to some degree, affect the performance of flood-event simulations. Tuning initial soil moisture content may enhance the simulated hydrographs. However, this arbitrary manner might further increase the uncertainty of flood simulations. To lessen this uncertainty, this work defined the initial conditions for flood-event simulations as the computed state variable values in daily discharge simulations at the starting date of a flood event. Furthermore, the uncertainty of hydrological model structure and parameters might, to a certain extent, impact flood simulations.
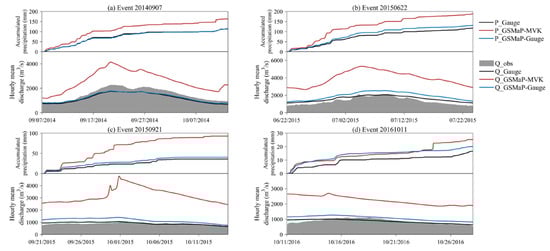
Figure 12.
Observed and simulated hourly hydrographs of the four historical flood events in 2014–2016 at the Tangnaihai hydrological station using the rain-gauge-, GSMaP-MVK-, and GSMaP-Gauge-based precipitation data inputs (the variables shown in this figure are as same as those in Figure 8).
Table 4.
Performance of flood event simulations at the Tangnaihai streamflow station using the rain-gauge-based precipitation data and the five GSMaP SPPs as model inputs.
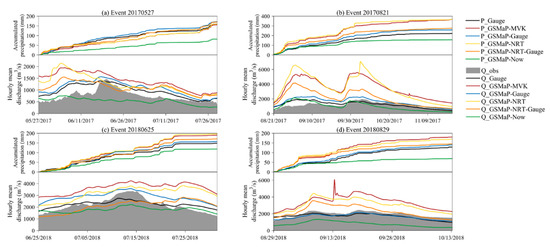
Figure 13.
Observed and simulated hourly hydrographs of the four historical flood events in 2017 and 2018 at the Tangnaihai hydrological station using the rain-gauge-based precipitation data and the five GSMaP SPPs (the variables shown in this figure are as same as those in Figure 9).
Driven by GSMaP-MVK and GSMaP-Gauge, the VIC model with the rain-gauge-benchmarked parameters was used to perform hourly simulations of the eight historical flood events at the Tangnaihai Hydrological stations. As shown in Figure 12 and Figure 13 and Table 4, the GSMaP-MVK-forced VIC model tremendously overestimates total runoff and peak flows for all events (RBR = 65.8–260.9% and RBFP = 25.8–348.0%) mainly because GSMaP-MVK tends to largely overestimates precipitation for seven out of the eight flood events (RBP = 28.5–156.8%), except for Event 20170527, in which there is a slight precipitation underestimation of 2.8%. The GSMaP-MVK-based model run obtains extremely low and negative NSE values of for all events and large peak time errors for most of the events. This finding suggests that GSMaP-MVK barely has hydrological feasibility in streamflow simulations at sub-daily scales. In contrast, GSMaP-Gauge outperforms GSMaP-MVK in hourly flood-event simulations with evidently improved RBR, NSE, and RBFP for all events. In Events 20140907 and 20180829, the GSMaP-Gauge-forced model, in particular, gains slightly higher values of NSE (0.641 and 0.04, respectively) than the rain-gauge-driven model (NSE = 0.551 and −0.038, respectively). This indicates that GSMaP-Gauge has plausible hydrological performance in simulating these flood events. However, the GSMaP-Gauge-based model considerably overestimates the flood processes for the other five events with positive RBR and RBFP values (23.1–43.2% and 6.3–30.7%, respectively), mainly resulting from the situation where GSMaP-Gauge tends to overestimate precipitation during these flood events by 6.2–20.9% (Figure 12 and Figure 13 and Table 4).
Forced by the GSMaP-NRT, GSMaP-NRT-Gauge, and GSMaP-Now SPPs, the VIC model was employed for hourly simulations of the four flood events in 2017 and 2018. Figure 13 and Table 4 demonstrate that the GSMaP-NRT- and GSMaP-NRT-Gauge-driven model runs significantly magnify the observed flood processes and flood peaks in most of events, mainly because GSMaP-NRT and GSMaP-NRT-Gauge largely overestimate precipitation by 31.7–64.2% and 12.7–23.8%, respectively, in Events 20170821, 20180625, and 20180829. For Event 20170527, GSMaP-NRT gives a negligible precipitation underestimation (RBP = −0.4%), and GSMaP-NRT-Gauge provides a slight overestimation of 5.9%. However, the GSMaP-NRT- and GSMaP-NRT-Gauge-based model runs still largely overestimate the total runoff volume by 65.8% and 46.1%, respectively (Table 4). This runoff overestimation is likely attributed to the situation that the GSMaP-NRT- and GSMaP-NRT-Gauge-forced VIC model might compute much wetter soil moisture content at the beginning day of this flood event in daily streamflow simulations. Owing to the considerable precipitation underestimation (RBP = −49.0–−20.1%), the GSMaP-Now-forced model run generally underestimates total run volumes and flood peak flows (RBR= −14.3–−59.4% and RBFP= −48.0–−34.2%), except for Event 20170821 in which the simulated flood peak flow is 8.5% exceeding the observed value. All the near-real-time and real-time SPPs obtained unsatisfactory flood simulation performance with negative NSE values for all four events. In particular, GSMaP-NRT demonstrates inferior hydrological utility for flood simulations.
Figure 14 displays the overall performance of hourly simulations of the four flood events in 2017 and 2018 at the Tangnaihai hydrological station using the rain-gauge-based precipitation data set and the five GSMaP SPPs in comparison with the observed discharge data. Similar to the overall performance of daily streamflow simulations (Figure 11), the rain-gauge-based precipitation data set present the best hydrological feasibility in hourly flood simulations, and the performance of the GSMaP-Gauge-driven simulation run slightly worsens but is comparable to that of the rain-gauge-based model run. Following GSMaP-Gauge, GSMaP-Now and GSMaP-NRT-Gauge obtain certain flood-event predictability. GSMaP-MVK- and GSMaP-NRT-based barely have hydrological utility for flood-event simulations.
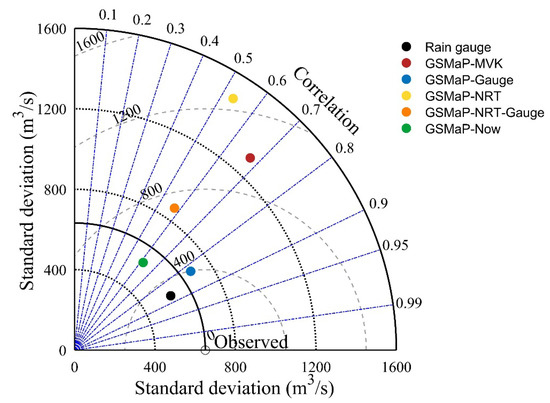
Figure 14.
Taylor diagrams showing the overall performance of hourly simulations of the four flood events in 2017 and 2018 at the Tangnaihai hydrological station using the rain-gauge-based precipitation data set and the five GSMaP SPPs based on the observed discharge data.
5. Discussion
As the co-partner of the GPM mission, JAXA is continuously updating the algorithms for GSMaP. This study evaluated the accuracy and hydrological utility of five state-of-the-art GSMaP SPPs in near-real-time, post-real-time, and real-time versions at daily and hourly temporal scales in YRSR. Based on the statistical evaluation against ground precipitation observations, this study found that GSMaP-Gauge presents the best performance, followed by GSMaP-Now. GSMaP-NRT-Gauge is ranked third, and GSMaP-MVK and GSMaP-NRT are unsatisfying. Although the pattern of overall performance of the five GSMaP SPPs in retrieving hourly precipitation is similar to that of the SPP-based daily precipitation estimates (Figure 5a), the quality of the SPP-based hourly precipitation estimates is much lower than that of the SPP-based daily estimates. Given that precipitation tends to be more variable at finer temporal scales, all five GSMaP SPPs are poorer in retrieving hourly precipitation dynamics than detecting daily processes. Many previous studies have revealed this phenomenon in many regions of the world, such as Myanmar [38], northeast of Austria [54], Mainland China [55], the Upper Blue Nile basin [56], South Korea [57], the western branch of the East African Rift [58], and the Guangdong Province of China [59].
Post-real-time SPPs generally show better performance than their near-time-time versions because of the gauge-based adjustment in several regions of the world [16,60,61,62,63]. However, the post-real-time product GSMaP-MVK significantly overestimates precipitation with higher overestimation magnitudes than the near-real-time product GSMaP-NRT-Gauge (Figure 3 and Figure 6), and GSMaP-MVK presents the lower overall score than GSMaP-NRT-Gauge (Figure 6). Considering that few studies have been conducted on the evaluation of GSMaP-NRT-Gauge that presents excellent accuracy in real- and near-real-time SPPs, more efforts should be exerted to explore the quality of GSMaP-NRT-Gauge in different parts of the world. Lu et al. [36] comprehensively assessed the performance of uncalibrated IMERG V5, gauge-calibrated IMERG V5, GSMaP-MVK V7, GSMaP-Gauge V7, and their hydrological utilities over the Tibetan Plateau where YRSR is located. The results indicate that GSMaP-Gauge presented the best performance in almost all statistical indices with higher correlation, lower bias, and better detection capability (POD, FAR, and CSI), while GSMaP-MVK had the worst performance. Their findings are consistent with the results of this study. GSMaP-Gauge demonstrates higher quality than GSMaP-MVK owing to the gauge-based calibration with the CPC data set, but the quality of GSMaP-Gauge largely depends on the rain gage density and data quality of CPC. Yuan et al. [38] proposed an assessment framework to statistically and hydrologically evaluate three IMERG V5 SPPs (IMERG-E, IMERG-L, and IMERG-F), three GSMaP V7 SPPs (GSMaP-NRT, GSMaP-MVK, and GSMaP-Gauge), and two TRMM SPPs (3B42RT and 3B42V7) in the Chindwin River basin in Myanmar and found that GSMaP-Gauge greatly underestimates precipitation and has the lower overall score than GSMaP-MVK. By checking the CPC data set, Yuan et al. [38] demonstrated that no gauges in the Chindwin River basin are included in the CPC data and, the rainfall records at several gauges outside the basin are mainly used to infer the rainfall situation in the investigated basin. These factors explained the low accuracy of the GSMaP-Gauge precipitation estimates in the Chindwin River basin. These factors controlling the errors of precipitation estimates require the attention from algorithm developers. GSMaP-Now shows an acceptable performance in daily precipitation detections in YRSR. However, Kubota et al. [64] found that GSMAP-Now V6 exhibits the highest RMSE value among the four GSMaP SPPs (GSMaP-Now, GSMaP-NRT, GSMaP-MVK, and GSMaP-Gauge) and pointed out that GSMAP-Now is estimated by extrapolating the cloud movement vector for half an hour, which often leads to a decrease in the accuracy of GSMaP-Now. Therefore, more efforts should be exerted to comprehensively evaluate the accuracy of GSMaP-Now in different parts of the world. The SPP evaluation in this study was performed by comparing the pixel precipitation values of SPPs with the point precipitation observations at rain gauges.
Several previous studies have been conducted to evaluate the hydrological utilities of GSMaP products in several basins in the world. In the Qaraqash River basin in China, Wang et al. [65] conducted hydrological assessment of GSMaP-Gauge V7 and TRMM 3B42V7 by the Soil and Water Assessment Tool hydrological model. The results indicated that GSMaP-Gauge V7 fits well with the observed runoff in monthly simulations and presents better ability to reproduce runoff changes than 3B42V7 does. Most of previous studies demonstrated that GSMaP-Gauge presents a better hydrological ability than GSMaP-MVK at daily and sub-daily time scales whether in the rain-gauge-based benchmarked parameter scheme or the input-specific recalibration scheme [63,66]. Similarly, this study found that GSMaP-Gauge demonstrates prominently better performance in capturing daytime precipitation dynamics in YRSR than GSMaP-MVK does. Bui et al. [66] evaluated the hydrological utilities of GSMaP-Gauge V5 and GSMaP-MVK V5 by selecting basins under different climatic conditions in three different Asian countries (Japan, Vietnam, and South Korea). They found that GSMaP-Gauge V5 presents superior performance in daily streamflow simulation in both temperate and subtropical basins but demonstrates worse simulation results than GSMaP-MVK V5 in the Upper-Cau basin in Vietnam. This is probably because that the unsatisfactory accuracy of GSMaP-Gauge precipitation estimates results in the inferior performance of streamflow simulations. Therefore, SPP users need to pay attention to the quality of the CPC data in their study domain and select the suitable GSMaP products for daily and hourly discharge simulations. Only using YRSR as the study area will cause certain uncertainty to the quality assessment of GSMaP SPPs. In future works, the study area should be expanded to more comprehensively evaluate the accuracy of GSMaP SPPs. Many previous studies have demonstrated that precipitation errors significantly propagate in streamflow simulations [67,68,69,70]. Owing to the acceptable quality of GSMaP-Gauge precipitation estimates, GSMaP-Gauge-based daily discharge simulation reveals comparable capability to the rain-gauge-driven model run in this study. In contrast, GSMaP-MVK and GSMaP-NRT present noticeable overestimation of total runoff and high flow in daily streamflow simulations (Figure 8 and Figure 9). This is, to a large extent, because of their significant overestimation of total precipitation and heavy precipitation estimates (Figure 3 and Figure 4). The interpolated precipitation data based on rain gauges still have considerable errors, which might significantly impact the accuracy of flood simulation (Figure 12 and Figure 13). The possible reason is that the local sparse rain-gauge network that is unevenly distributed with merely 13 national weather stations may not fully characterize the spatial variation of precipitation at hourly time scales. A denser rainfall observation network is recommended to be established in YRSR as soon as possible, and the density and distribution pattern of rain gauges should be comprehensively considered.
The hydrological utility of SPPs is subject to large uncertainties from precipitation input, parameter estimations, and model structures. In this study, the inverse-distance weighting method was adopted to produce the spatial distribution of precipitation on a 0.1° resolution. There are considerable uncertainties in estimating the spatial distribution of precipitation that is represented by a limited number of rain gauges (13 stations) in such a large basin (1.22 × 10⁵ km2). Model parameters calibrated by biased input precipitation data may not adequately characterize the hydrological features of a catchment [38,68,70]. However, this study demonstrates the acceptable hydrological performance of SPPs. This is mainly because hydrological models are, to some extent, tolerant of the errors of precipitation inputs. In this study, the time period of the available GSMaP SPPs is short and not sufficient for model calibration, and using biased precipitation inputs for model calibration might lead to the biased parameter sets. Thus, the strategy of using the rain-gauge-based benchmarked parameters was adopted for hydrological simulations. Xue et al. [71] analyzed the parameter compensation effect in hydrological simulations and indicated that the recalibrated model parameter values may not represent the actual features of the basin, which further reduces the model’s predictive capability in ungauged basins. The uncertainty of hydrological model structures and parameters should be thoroughly quantified when the performance of SPPs is evaluated. Sun et al. [34] proposed a Bayesian uncertainty analysis framework to evaluate satellite precipitation data with the consideration of the parameter uncertainty and model structural uncertainty. In future works, these uncertainties should be accounted for in satellite precipitation assessment. Ma et al. [72] stressed that local strong convectional weather and complex terrain seriously affect the accuracy of satellite precipitation retrieval and result in unpredictable errors between satellite estimates and gauge observations. The effect of convectional systems and topography on the accuracy of SPPs was not analyzed in detail in this study owing to the limited number of rain gauges in YRSR, and this issue will be investigated in the future.
To the best of our knowledge, this study is the earliest attempt to statistically and hydrologically evaluate the performance of GSMaP-Now. This study shows that GSMaP-Now demonstrates comparable precipitation monitoring capabilities to the evaluated near-real-time SPPs (Figure 5) and basically acceptable hydrological performance (Figure 11) in YRSR. This finding reflects that GSMaP-Now has the potential for flash flood monitoring and real-time flood forecasting in remote regions where a sufficiently dense gauge network is unavailable. It is recommended that the GSMaP developers and SPP users to conduct the GSMaP-Now evaluation in more regions.
6. Conclusions
As the co-partner of the GPM mission, JAXA is continuously updating the precipitation retrieving algorithms for GSMaP. This study statistically evaluated the quality of the latest GPM-era GSMaP SPPs in real-, near-real-, and post-real-time versions at daily and hourly temporal scales against the ground precipitation observations in the poorly gauged YRSR of China. Afterward, the hydrological feasibility of these SPPs in daily streamflow and hourly flood-event simulations was investigated through the VIC hydrological model. Based on the above analyses, the main conclusions of this study are summarized as follows:
- (1)
- The statistical evaluation of the five GSMaP SPPs against the ground precipitation observations demonstrates that GSMaP-Gauge obtains the best overall performance in capturing daily and hourly precipitation dynamics in YRSR, followed by GSMaP-Now and GSMaP-NRT-Gauge, whereas GSMaP-MVK and GSMaP-NRT have inferior performance. All five GSMaP SPPs are less accurate in retrieving hourly precipitation dynamics than in detecting daily processes, indicating that the performance of GSMaP to some extent depends on the accumulation interval of precipitation.
- (2)
- GSMaP-Gauge displays the best hydrological feasibility, which is comparable to the rain-gauge-based data. GSMaP-Now and GSMaP-NRT-Gauge demonstrate basically acceptable hydrological performance in daily streamflow simulations. Both GSMaP-MVK and GSMaP-NRT present inferior capability in daily discharge simulations, with a considerable overestimation of the total streamflow.
- (3)
- The rain-gauge-based precipitation data set presents the best hydrological feasibility in hourly flood simulations but contains considerable errors in total runoff and flood peak flow. The performance of the GSMaP-Gauge-driven flood-event simulation run slightly worsens but is comparable to that of the rain-gauge-based model run. Following GSMaP-Gauge, GSMaP-Now and GSMaP-NRT-Gauge obtain certain predictability of flood events. Overall, GSMaP-MVK and GSMaP-NRT barely have hydrological utility for flood-event simulations.
The above findings are expected to provide SPP users with valuable guidelines for the choices of GSMaP products in YRSR and offer users and researchers a better understanding of the characteristics of the latest GSMaP SPPs. Overall, GSMaP-Gauge is recommended to simulate historical daily streamflow processes and hourly flood events in YRSR. GSMaP-Now, which is one of the limited real-time SPPs released to the public, presents a great potential for applications in real-time flood forecasting. Moreover, this study is associated with large uncertainties from precipitation interpolation, parameter estimations, and hydrological modeling. Future work should thoughtfully consider these uncertainties in satellite precipitation assessment.
Author Contributions
Conceptualization, B.W.; methodology, B.W.; writing—original draft preparation, J.S.; funding acquisition, G.W.; investigation, G.W., F.Y. and B.W.; data curation, C.S. and X.Z.; visualization, J.S. and F.Y.; writing—review and editing, F.Y., L.Z. and C.Z. All authors have read and agreed to the published version of the manuscript.
Funding
This research was financially supported by National Key Research and Development Programs of China (Grants: 2016YFA0601500, 2017YFA0605002, 2017YFC0404602), and the National Natural Science Foundation of China (grant nos. 41830863, 51879162, 51609242, 51779146, 41601025), and the State Key Laboratory of Hydrology-Water Resources and Hydraulic Engineering (grant no. 2019nkzd02).
Data Availability Statement
Not applicable.
Acknowledgments
We extend our sincere gratitude to the GSMaP research communities for making the satellite rainfall data available for this work. The authors extend their appreciation to the reviewers for their thoughtful comments and valuable advice.
Conflicts of Interest
The authors declare no conflict of interest.
References
- Li, Z.; Yang, D.; Hong, Y. Multi-scale evaluation of high-resolution multi-sensor blended global precipitation products over the Yangtze River. J. Hydrol. 2013, 500, 157–169. [Google Scholar] [CrossRef]
- Huffman, G.J.; Bolvin, D.T.; Nelkin, E.J.; Wolff, D.B.; Adler, R.F.; Gu, G.; Hong, Y.; Bowman, K.P.; Stocker, E.F. The TRMM Multisatellite Precipitation Analysis (TMPA): Quasi-global, multiyear, combined-sensor precipitation estimates at fine scales. J. Hydrometeorol. 2007, 8, 38–55. [Google Scholar] [CrossRef]
- Joyce, R.J.; Janowiak, J.E.; Arkin, P.A.; Xie, P. CMORPH: A method that produces global precipitation estimates from passive microwave and infrared data at high spatial and temporal resolution. J. Hydrometeorol. 2004, 5, 487–503. [Google Scholar] [CrossRef]
- Hsu, K.; Gao, X.; Sorooshian, S.; Gupta, H.V. Precipitation estimation from remotely sensed information using artificial neural networks. J. Appl. Meteorol. 1997, 36, 1176–1190. [Google Scholar] [CrossRef]
- Kubota, T.; Shige, S.; Hashizume, H.; Aonashi, K.; Takahashi, N.; Seto, S.; Hirose, M.; Takayabu, Y.N.; Ushio, T.; Nakagawa, K. Global precipitation map using satellite-borne microwave radiometers by the GSMaP project: Production and validation. IEEE Trans. Geosci. Remote Sens. 2007, 45, 2259–2275. [Google Scholar] [CrossRef]
- Hou, A.Y.; Kakar, R.K.; Neeck, S.; Azarbarzin, A.A.; Kummerow, C.D.; Kojima, M.; Oki, R.; Nakamura, K.; Iguchi, T. The global precipitation measurement mission. Bull. Am. Meteorol. Soc. 2014, 95, 701–722. [Google Scholar] [CrossRef]
- Huffman, G.J.; Bolvin, D.T. Real-Time TRMM Multi-Satellite Precipitation Analysis Data Set Documentation. NASA Tech. Doc. 2015; p. 10. Available online: https://docserver.gesdisc.eosdis.nasa.gov/public/project/GPM/3B4XRT_doc_V7.pdf (accessed on 21 July 2020).
- Tan, J.; Petersen, W.A.; Kirstetter, P.; Tian, Y. Performance of IMERG as a function of spatiotemporal scale. J. Hydrometeorol. 2017, 18, 307–319. [Google Scholar] [CrossRef]
- Gebregiorgis, A.S.; Kirstetter, P.E.; Hong, Y.E.; Gourley, J.J.; Huffman, G.J.; Petersen, W.A.; Xue, X.; Schwaller, M.R. To what extent is the day 1 GPM IMERG satellite precipitation estimate improved as compared to TRMM TMPA-RT? J. Geophys. Res. Atmos. 2018, 123, 1694–1707. [Google Scholar] [CrossRef]
- Anjum, M.N.; Ding, Y.; Shangguan, D.; Ahmad, I.; Ijaz, M.W.; Farid, H.U.; Yagoub, Y.E.; Zaman, M.; Adnan, M. Performance evaluation of latest integrated multi-satellite retrievals for Global Precipitation Measurement (IMERG) over the northern highlands of Pakistan. Atmos. Res. 2018, 205, 134–146. [Google Scholar] [CrossRef]
- He, Z.; Yang, L.; Tian, F.; Ni, G.; Hou, A.; Lu, H. Intercomparisons of rainfall estimates from TRMM and GPM multisatellite products over the Upper Mekong River Basin. J. Hydrometeorol. 2017, 18, 413–430. [Google Scholar] [CrossRef]
- Wang, W.; Lu, H.; Zhao, T.; Jiang, L.; Shi, J. Evaluation and Comparison of Daily Rainfall From Latest GPM and TRMM Products Over the Mekong River Basin. IEEE J. Sel. Top. Appl. Earth Obs. Remote. Sens. 2017, 10, 2540–2549. [Google Scholar] [CrossRef]
- Tang, G.; Ma, Y.; Long, D.; Zhong, L.; Hong, Y. Evaluation of GPM Day-1 IMERG and TMPA Version-7 legacy products over Mainland China at multiple spatiotemporal scales. J. Hydrol. 2016, 533, 152–167. [Google Scholar] [CrossRef]
- Guo, H.; Chen, S.; Bao, A.; Behrangi, A.; Hong, Y.; Ndayisaba, F.; Hu, J.; Stepanian, P.M. Early assessment of integrated multi-satellite retrievals for global precipitation measurement over China. Atmos. Res. 2016, 176, 121–133. [Google Scholar] [CrossRef]
- Xu, R.; Tian, F.; Yang, L.; Hu, H.; Lu, H.; Hou, A. Ground validation of GPM IMERG and TRMM 3B42V7 rainfall products over southern Tibetan Plateau based on a high-density rain gauge network. J. Geophys. Res. Atmos. 2017, 122, 910–924. [Google Scholar] [CrossRef]
- Jiang, S.; Ren, L.; Xu, C.; Yong, B.; Yuan, F.; Liu, Y.; Yang, X.; Zeng, X. Statistical and hydrological evaluation of the latest Integrated Multi-satellitE Retrievals for GPM (IMERG) over a midlatitude humid basin in South China. Atmos. Res. 2018, 214, 418–429. [Google Scholar] [CrossRef]
- Yuan, F.; Wang, B.; Shi, C.; Cui, W.; Zhao, C.; Liu, Y.; Ren, L.; Zhang, L.; Zhu, Y.; Chen, T. Evaluation of hydrological utility of IMERG Final run V05 and TMPA 3B42V7 satellite precipitation products in the Yellow River source region, China. J. Hydrol. 2018, 567, 696–711. [Google Scholar] [CrossRef]
- Li, N.; Tang, G.; Zhao, P.; Hong, Y.; Gou, Y.; Yang, K. Statistical assessment and hydrological utility of the latest multi-satellite precipitation analysis IMERG in Ganjiang River basin. Atmos. Res. 2017, 183, 212–223. [Google Scholar] [CrossRef]
- Zubieta, R.; Getirana, A.; Espinoza, J.C.; Lavado-Casimiro, W.; Aragon, L. Hydrological modeling of the Peruvian–Ecuadorian Amazon Basin using GPM-IMERG satellite-based precipitation dataset. Hydrol. Earth Syst. Sci. 2017, 21, 3543–3555. [Google Scholar] [CrossRef] [Green Version]
- Yuan, F.; Zhang, L.; Win, K.W.W.; Ren, L.; Zhao, C.; Zhu, Y.; Jiang, S.; Liu, Y. Assessment of GPM and TRMM multi-satellite precipitation products in streamflow simulations in a data-sparse mountainous watershed in Myanmar. Remote Sens. 2017, 9, 302. [Google Scholar] [CrossRef] [Green Version]
- Ning, S.; Wang, J.; Jin, J.; Ishidaira, H. Assessment of the latest GPM-Era high-resolution satellite precipitation products by comparison with observation gauge data over the Chinese mainland. Water 2016, 8, 481. [Google Scholar] [CrossRef]
- Zhao, H.; Yang, B.; Yang, S.; Huang, Y.; Dong, G.; Bai, J.; Wang, Z. Systematical estimation of GPM-based global satellite mapping of precipitation products over China. Atmos. Res. 2018, 201, 206–217. [Google Scholar] [CrossRef]
- Tang, G.; Zeng, Z.; Ma, M.; Liu, R.; Wen, Y.; Hong, Y. Can near-real-time satellite precipitation products capture rainstorms and guide flood warning for the 2016 summer in South China? IEEE Geosci. Remote Sens. 2017, 14, 1208–1212. [Google Scholar] [CrossRef]
- Tan, X.; Yong, B.; Ren, L. Error features of the hourly GSMaP multi-satellite precipitation estimates over nine major basins of China. Hydrol. Res. 2018, 49, 761–779. [Google Scholar] [CrossRef]
- Satgé, F.; Hussain, Y.; Bonnet, M.; Hussain, B.M.; Martinez-Carvajal, H.; Akhter, G.; Uagoda, R. Benefits of the successive GPM based satellite precipitation estimates IMERG–V03,–V04,–V05 and GSMaP–V06,–V07 over diverse geomorphic and meteorological regions of Pakistan. Remote Sens. 2018, 10, 1373. [Google Scholar] [CrossRef] [Green Version]
- Saber, M.; Yilmaz, K.K. Evaluation and bias correction of satellite-based rainfall estimates for modelling flash floods over the Mediterranean region: Application to Karpuz River Basin, Turkey. Water 2018, 10, 657. [Google Scholar] [CrossRef] [Green Version]
- Ryo, M.; Saavedra Valeriano, O.C.; Kanae, S.; Ngoc, T.D. Temporal downscaling of daily gauged precipitation by application of a satellite product for flood simulation in a poorly gauged basin and its evaluation with multiple regression analysis. J. Hydrometeorol. 2014, 15, 563–580. [Google Scholar] [CrossRef]
- Saber, M.; Hamaguchi, T.; Kojiri, T.; Tanaka, K.; Sumi, T. A physically based distributed hydrological model of wadi system to simulate flash floods in arid regions. Arab. J. Geosci. 2015, 8, 143–160. [Google Scholar] [CrossRef]
- Sugiura, A.; Fujioka, S.; Nabesaka, S.; Tsuda, M.; Iwami, Y. Development of a flood forecasting system on the upper Indus catchment using IFAS. J. Flood Risk Manag. 2016, 9, 265–277. [Google Scholar] [CrossRef]
- Shahzad, A.; Gabriel, H.F.; Haider, S.; Mubeen, A.; Siddiqui, M.J. Development of a flood forecasting system using IFAS: A case study of scarcely gauged Jhelum and Chenab river basins. Arab. J. Geosci. 2018, 11, 1–18. [Google Scholar] [CrossRef]
- Pham, N.T.T.; Nguyen, Q.H.; Ngo, A.D.; Le, H.T.T.; Nguyen, C.T. Investigating the impacts of typhoon-induced floods on the agriculture in the central region of Vietnam by using hydrological models and satellite data. Nat. Hazards 2018, 92, 189–204. [Google Scholar] [CrossRef]
- Falck, A.S.; Maggioni, V.; Tomasella, J.; Vila, D.A.; Diniz, F.L. Propagation of satellite precipitation uncertainties through a distributed hydrologic model: A case study in the Tocantins–Araguaia basin in Brazil. J. Hydrol. 2015, 527, 943–957. [Google Scholar] [CrossRef]
- Deng, P.; Zhang, M.; Bing, J.; Jia, J.; Zhang, D. Evaluation of the GSMaP_Gauge products using rain gauge observations and SWAT model in the Upper Hanjiang River Basin. Atmos. Res. 2019, 219, 153–165. [Google Scholar] [CrossRef]
- Sun, R.; Yuan, H.; Yang, Y. Using multiple satellite-gauge merged precipitation products ensemble for hydrologic uncertainty analysis over the Huaihe River basin. J. Hydrol. 2018, 566, 406–420. [Google Scholar] [CrossRef] [Green Version]
- Qi, W.; Zhang, C.; Fu, G.; Zhou, H.; Liu, J. Quantifying uncertainties in extreme flood predictions under climate change for a medium-sized basin in northeastern China. J. Hydrometeorol. 2016, 17, 3099–3112. [Google Scholar] [CrossRef]
- Lu, D.; Yong, B. Evaluation and hydrological utility of the latest GPM IMERG V5 and GSMaP V7 precipitation products over the Tibetan Plateau. Remote Sens. 2018, 10, 2022. [Google Scholar] [CrossRef] [Green Version]
- Satgé, F.; Ruelland, D.; Bonnet, M.; Molina, J.; Pillco, R. Consistency of satellite-based precipitation products in space and over time compared with gauge observations and snow-hydrological modelling in the Lake Titicaca region. Hydrol. Earth Syst. Sci. 2019, 23, 595–619. [Google Scholar] [CrossRef] [Green Version]
- Yuan, F.; Zhang, L.; Soe, K.; Ren, L.; Zhao, C.; Zhu, Y.; Jiang, S.; Liu, Y. Applications of TRMM- and GPM-Era Multiple-Satellite Precipitation Products for Flood Simulations at Sub-Daily Scales in a Sparsely Gauged Watershed in Myanmar. Remote Sens. 2019, 11, 140. [Google Scholar] [CrossRef] [Green Version]
- Hu, Y.; Maskey, S.; Uhlenbrook, S. Trends in temperature and rainfall extremes in the Yellow River source region, China. Clim. Chang. 2012, 110, 403–429. [Google Scholar] [CrossRef] [Green Version]
- Ma, X.; Fukushima, Y.; Yasunari, T.; Matsuoka, M.; Sato, Y.; Kimura, F.; Zheng, H. Examination of the water budget in upstream and midstream regions of the Yellow River, China. Hydrol. Process. 2010, 24, 618–630. [Google Scholar] [CrossRef]
- Ren, L.; Jiang, S.; Yuan, F.; Yong, B.; Gong, L.; Yuan, S. Evolution of methodology in hydrology and its explanation. Adv. Water Sci. 2011, 22, 586–592. [Google Scholar]
- Mega, T.; Ushio, T.; Matsuda, T.; Kubota, T.; Kachi, M.; Oki, R. Gauge-Adjusted Global Satellite Mapping of Precipitation. IEEE Trans. Geosci. Remote. Sens. 2019, 57, 1928–1935. [Google Scholar] [CrossRef]
- Hansen, M.C.; DeFries, R.S.; Townshend, J.R.; Sohlberg, R. Global land cover classification at 1 km spatial resolution using a classification tree approach. Int. J. Remote Sens. 2000, 21, 1331–1364. [Google Scholar] [CrossRef]
- Sanchez, P.A.; Ahamed, S.; Carré, F.; Hartemink, A.E.; Zhang, G.L. Digital Soil Map of the World (DSMW); FAO: Rome, Italy, 2003. [Google Scholar]
- Liang, X.; Lettenmaier, D.P.; Wood, E.F.; Burges, S.J. A simple hydrologically based model of land surface water and energy fluxes for general circulation models. J. Geophys. Res. Atmos. 1994, 99, 14415–14428. [Google Scholar] [CrossRef]
- Liang, X.; Wood, E.F.; Lettenmaier, D.P. Surface soil moisture parameterization of the VIC-2L model: Evaluation and modification. Glob. Planet. Chang. 1996, 13, 195–206. [Google Scholar] [CrossRef]
- Todini, E. The ARNO rainfall—Runoff model. J. Hydrol. 1996, 175, 339–382. [Google Scholar] [CrossRef]
- Liang, X.; Xie, Z. A new surface runoff parameterization with subgrid-scale soil heterogeneity for land surface models. Adv. Water Resour. 2001, 24, 1173–1193. [Google Scholar] [CrossRef]
- Liang, X.; Xie, Z. Important factors in land–atmosphere interactions: Surface runoff generations and interactions between surface and groundwater. Glob. Planet. Chang. 2003, 38, 101–114. [Google Scholar] [CrossRef]
- Cosby, B.J.; Hornberger, G.M.; Clapp, R.B.; Ginn, T. A statistical exploration of the relationships of soil moisture characteristics to the physical properties of soils. Water Resour. Res. 1984, 20, 682–690. [Google Scholar] [CrossRef] [Green Version]
- Rawls, W.J.; Brakensiek, D.L. Prediction of soil water properties for hydrologic modeling. Am. Soc. Civ. Eng. 2015, 293–299. [Google Scholar]
- Duan, Q.; Sorooshian, S.; Gupta, V. Effective and efficient global optimization for conceptual rainfall-runoff models. Water Resour. Res. 1992, 28, 1015–1031. [Google Scholar] [CrossRef]
- Duan, Q.Y.; Gupta, V.K.; Sorooshian, S. Shuffled complex evolution approach for effective and efficient global minimization. J. Optimiz. Theory Appl. 1993, 76, 501–521. [Google Scholar] [CrossRef]
- Sharifi, E.; Steinacker, R.; Saghafian, B. Multi time-scale evaluation of high-resolution satellite-based precipitation products over northeast of Austria. Atmos. Res. 2018, 206, 46–63. [Google Scholar] [CrossRef]
- Wang, C.; Tang, G.; Han, Z.; Guo, X.; Hong, Y. Global intercomparison and regional evaluation of GPM IMERG Version-03, Version-04 and its latest Version-05 precipitation products: Similarity, difference and improvements. J. Hydrol. 2018, 564, 342–356. [Google Scholar] [CrossRef]
- Lazin, R.; Shen, X.; Koukoula, M.; Anagnostou, E. Evaluation of the hyper-resolution model-derived water cycle components over the upper Blue Nile Basin. J. Hydrol. 2020, 590, 125231. [Google Scholar] [CrossRef]
- Kim, J.; Han, H. Evaluation of the CMORPH high-resolution precipitation product for hydrological applications over South Korea. Atmos. Res. 2021, 258, 105650. [Google Scholar] [CrossRef]
- Monsieurs, E.; Kirschbaum, D.B.; Tan, J.; Mateso, J.M.; Jacobs, L.; Plisnier, P.; Thiery, W.; Umutoni, A.; Musoni, D.; Bibentyo, T.M. Evaluating TMPA rainfall over the sparsely gauged East African Rift. J. Hydrometeorol. 2018, 19, 1507–1528. [Google Scholar] [CrossRef]
- Wang, D.; Wang, X.; Liu, L.; Wang, D.; Huang, H.; Pan, C. Evaluation of TMPA 3B42V7, GPM IMERG and CMPA precipitation estimates in Guangdong Province, China. Int. J. Climatol. 2019, 39, 738–755. [Google Scholar] [CrossRef]
- Nodzu, M.I.; Matsumoto, J.; Trinh-Tuan, L.; Ngo-Duc, T. Precipitation estimation performance by Global Satellite Mapping and its dependence on wind over northern Vietnam. Progress Earth Planet. Sci. 2019, 6, 1–15. [Google Scholar] [CrossRef] [Green Version]
- Huang, W.; Chang, Y.; Liu, P. Assessment of IMERG precipitation over Taiwan at multiple timescales. Atmos. Res. 2018, 214, 239–249. [Google Scholar] [CrossRef]
- Shi, J.; Yuan, F.; Shi, C.; Zhao, C.; Zhang, L.; Ren, L.; Zhu, Y.; Jiang, S.; Liu, Y. Statistical Evaluation of the Latest GPM-Era IMERG and GSMaP Satellite Precipitation Products in the Yellow River Source Region. Water 2020, 12, 1006. [Google Scholar] [CrossRef] [Green Version]
- Zhao, C.; Ren, L.; Yuan, F.; Zhang, L.; Jiang, S.; Shi, J.; Chen, T.; Liu, S.; Yang, X.; Liu, Y.; et al. Statistical and Hydrological Evaluations of Multiple Satellite Precipitation Products in the Yellow River Source Region of China. Water 2020, 12, 3082. [Google Scholar] [CrossRef]
- Kubota, T.; Aonashi, K.; Ushio, T.; Shige, S.; Oki, R. Recent progress in global satellite mapping of precipitation (GSMAP) product. In Proceedings of the IGARSS 2017-2017 IEEE International Geoscience and Remote Sensing Symposium, Fort Worth, TX, USA, 23–28 July 2017. [Google Scholar]
- Wang, X.; Li, B.; Chen, Y.; Guo, H.; Wang, Y.; Lian, L. Applicability Evaluation of Multisource Satellite Precipitation Data for Hydrological Research in Arid Mountainous Areas. Remote Sens. 2020, 12, 2886. [Google Scholar] [CrossRef]
- Bui, H.T.; Ishidaira, H.; Shaowei, N. Evaluation of the use of global satellite–gauge and satellite-only precipitation products in stream flow simulations. Appl. Water Sci. 2019, 9, 1–15. [Google Scholar] [CrossRef] [Green Version]
- Moulin, L.; Gaume, E.; Obled, C. Uncertainties on mean areal precipitation: Assessment and impact on streamflow simulations. Hydrol. Earth Syst. Sci. 2009, 13, 99–114. [Google Scholar] [CrossRef] [Green Version]
- Habib, E.; Aduvala, A.V.; Meselhe, E.A. Analysis of radar-rainfall error characteristics and implications for streamflow simulation uncertainty. Hydrol. Sci. J. 2008, 53, 568–587. [Google Scholar] [CrossRef]
- Nikolopoulos, E.I.; Anagnostou, E.N.; Borga, M. Using high-resolution satellite rainfall products to simulate a major flash flood event in northern Italy. J. Hydrometeorol. 2013, 14, 171–185. [Google Scholar] [CrossRef]
- David, C.H.; Hobbs, J.M.; Turmon, M.J.; Emery, C.M.; Reager, J.T.; Famiglietti, J.S. Analytical propagation of runoff uncertainty into discharge uncertainty through a large river network. Geophys. Res. Lett. 2019, 46, 8102–8113. [Google Scholar] [CrossRef]
- Xue, X.; Hong, Y.; Limaye, A.S.; Gourley, J.J.; Huffman, G.J.; Khan, S.I.; Dorji, C.; Chen, S. Statistical and hydrological evaluation of TRMM-based Multi-satellite Precipitation Analysis over the Wangchu Basin of Bhutan: Are the latest satellite precipitation products 3B42V7 ready for use in ungauged basins? J. Hydrol. 2013, 499, 91–99. [Google Scholar] [CrossRef]
- Ma, Y.; Tang, G.; Long, D.; Yong, B.; Zhong, L.; Wan, W.; Hong, Y. Similarity and error intercomparison of the GPM and its predecessor-TRMM multisatellite precipitation analysis using the best available hourly gauge network over the Tibetan Plateau. Remote Sens. 2016, 8, 569. [Google Scholar] [CrossRef] [Green Version]
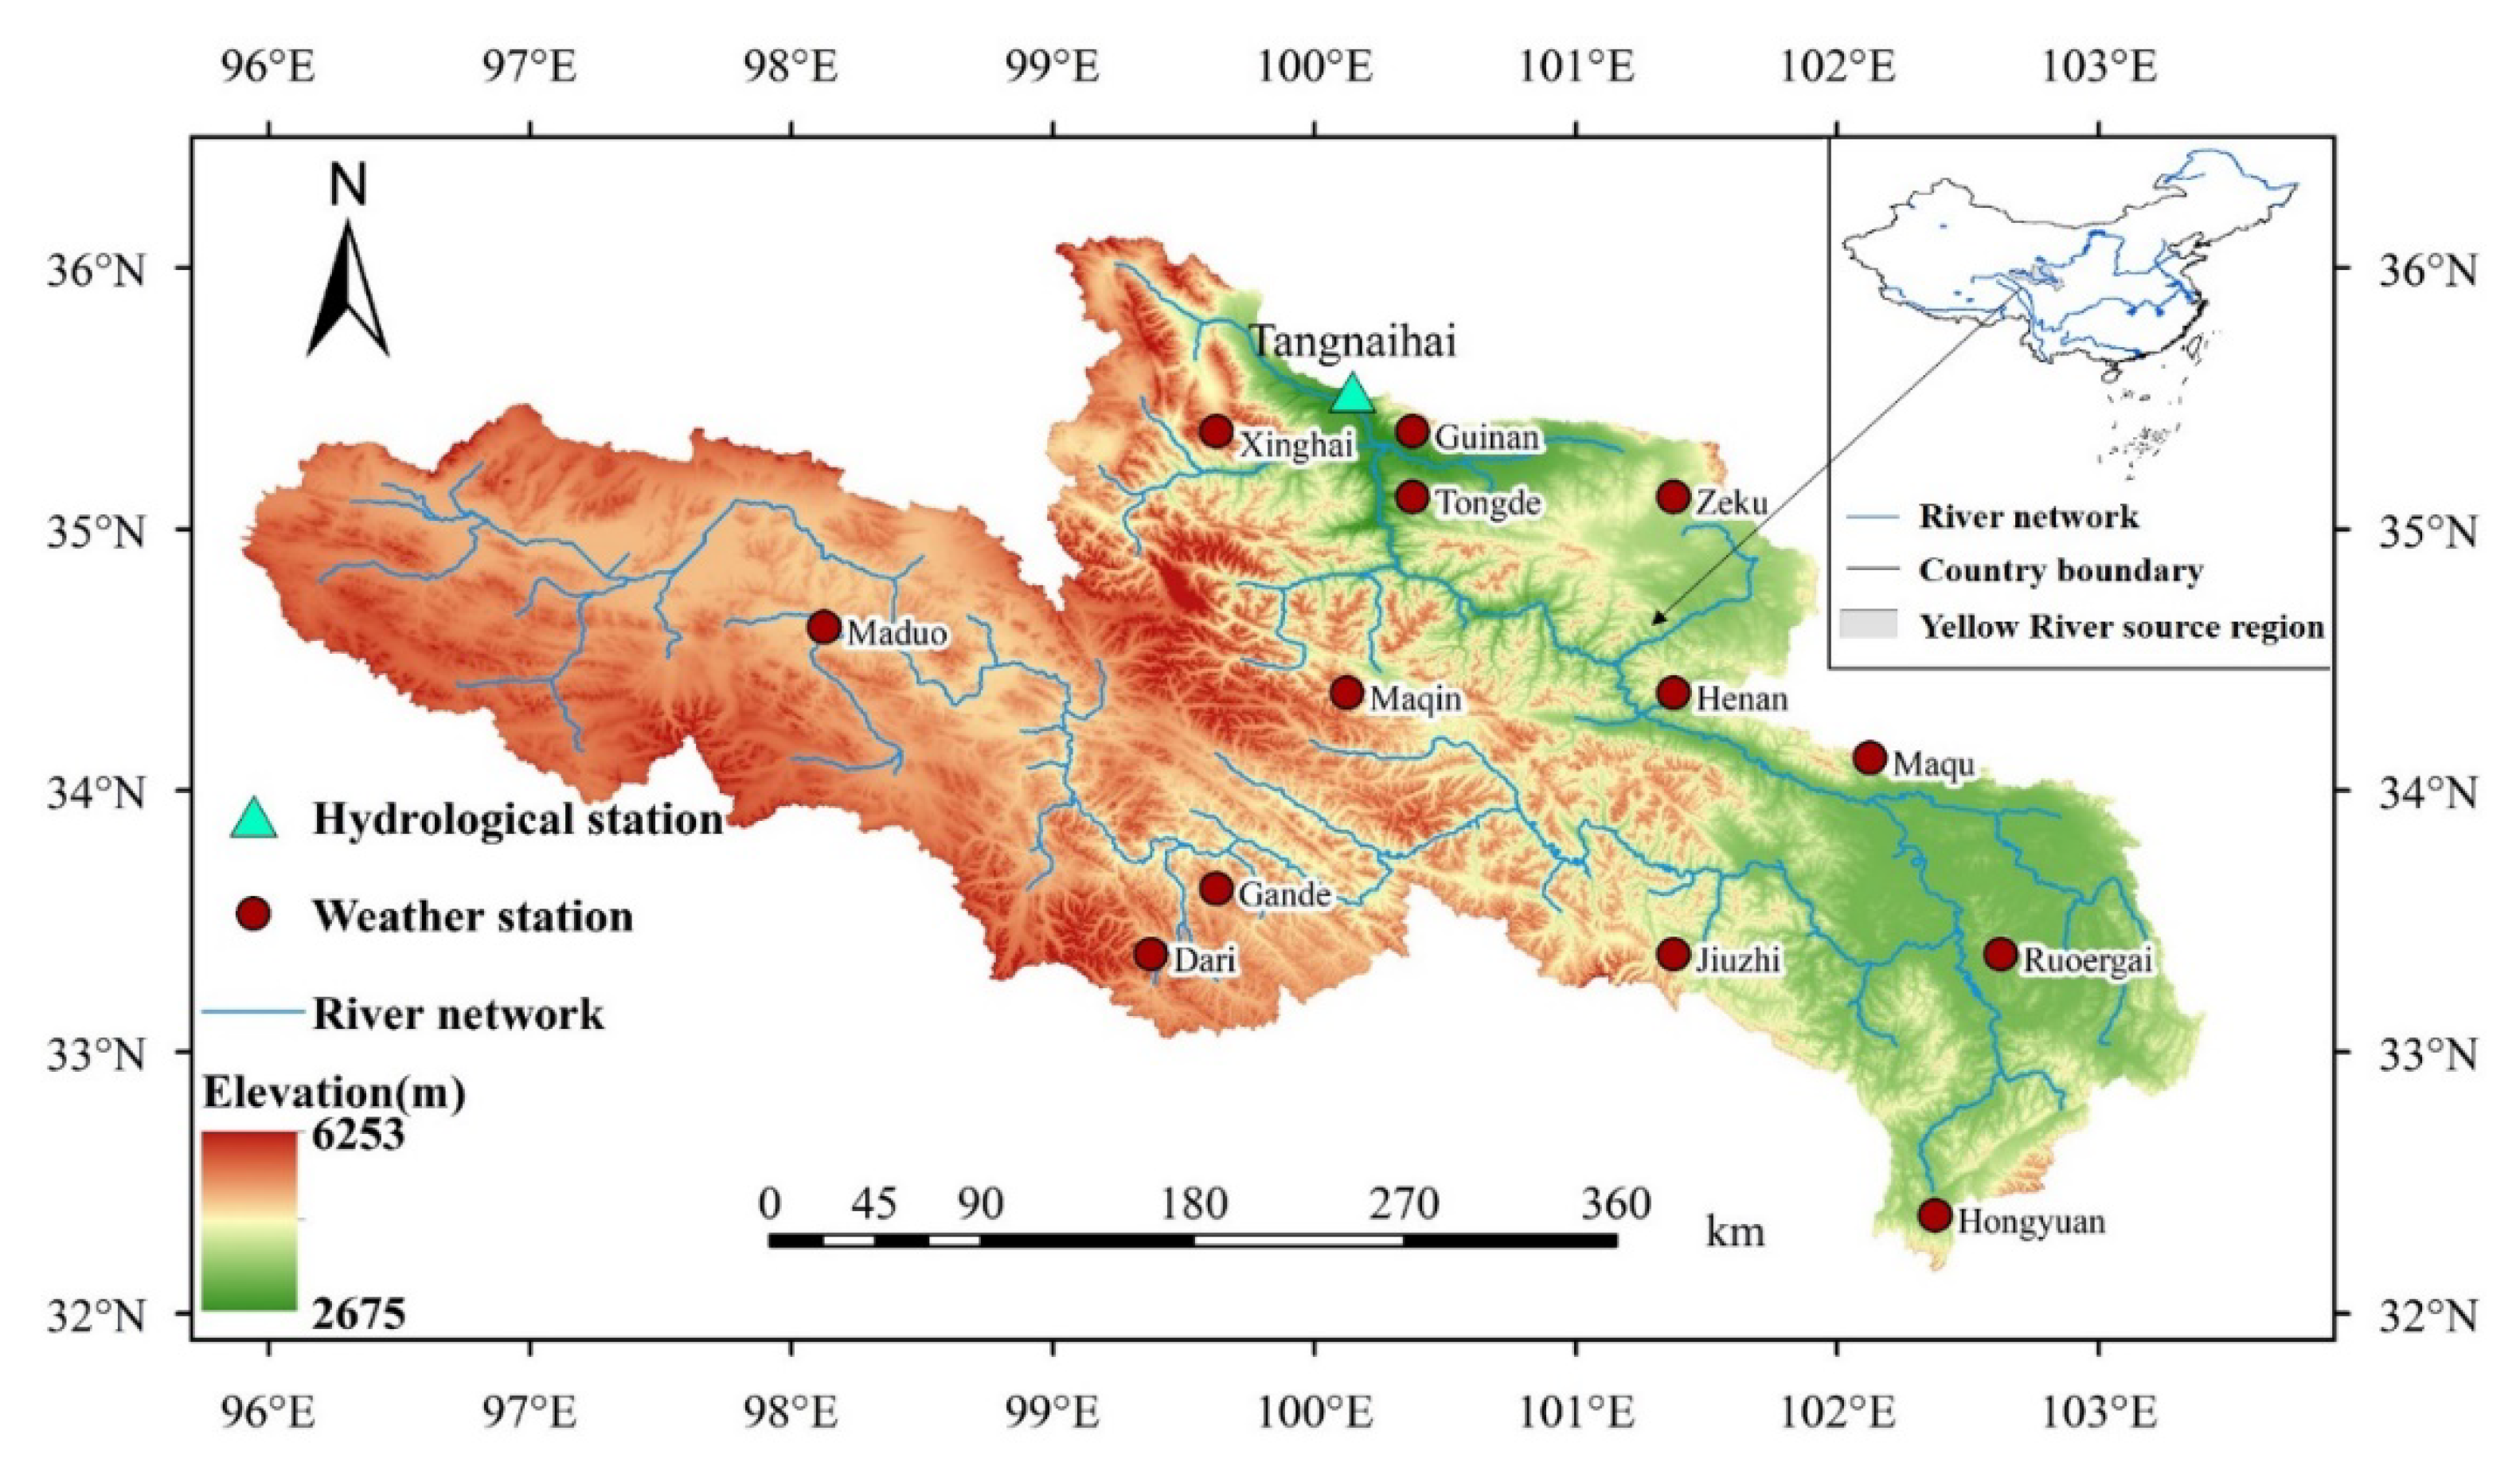

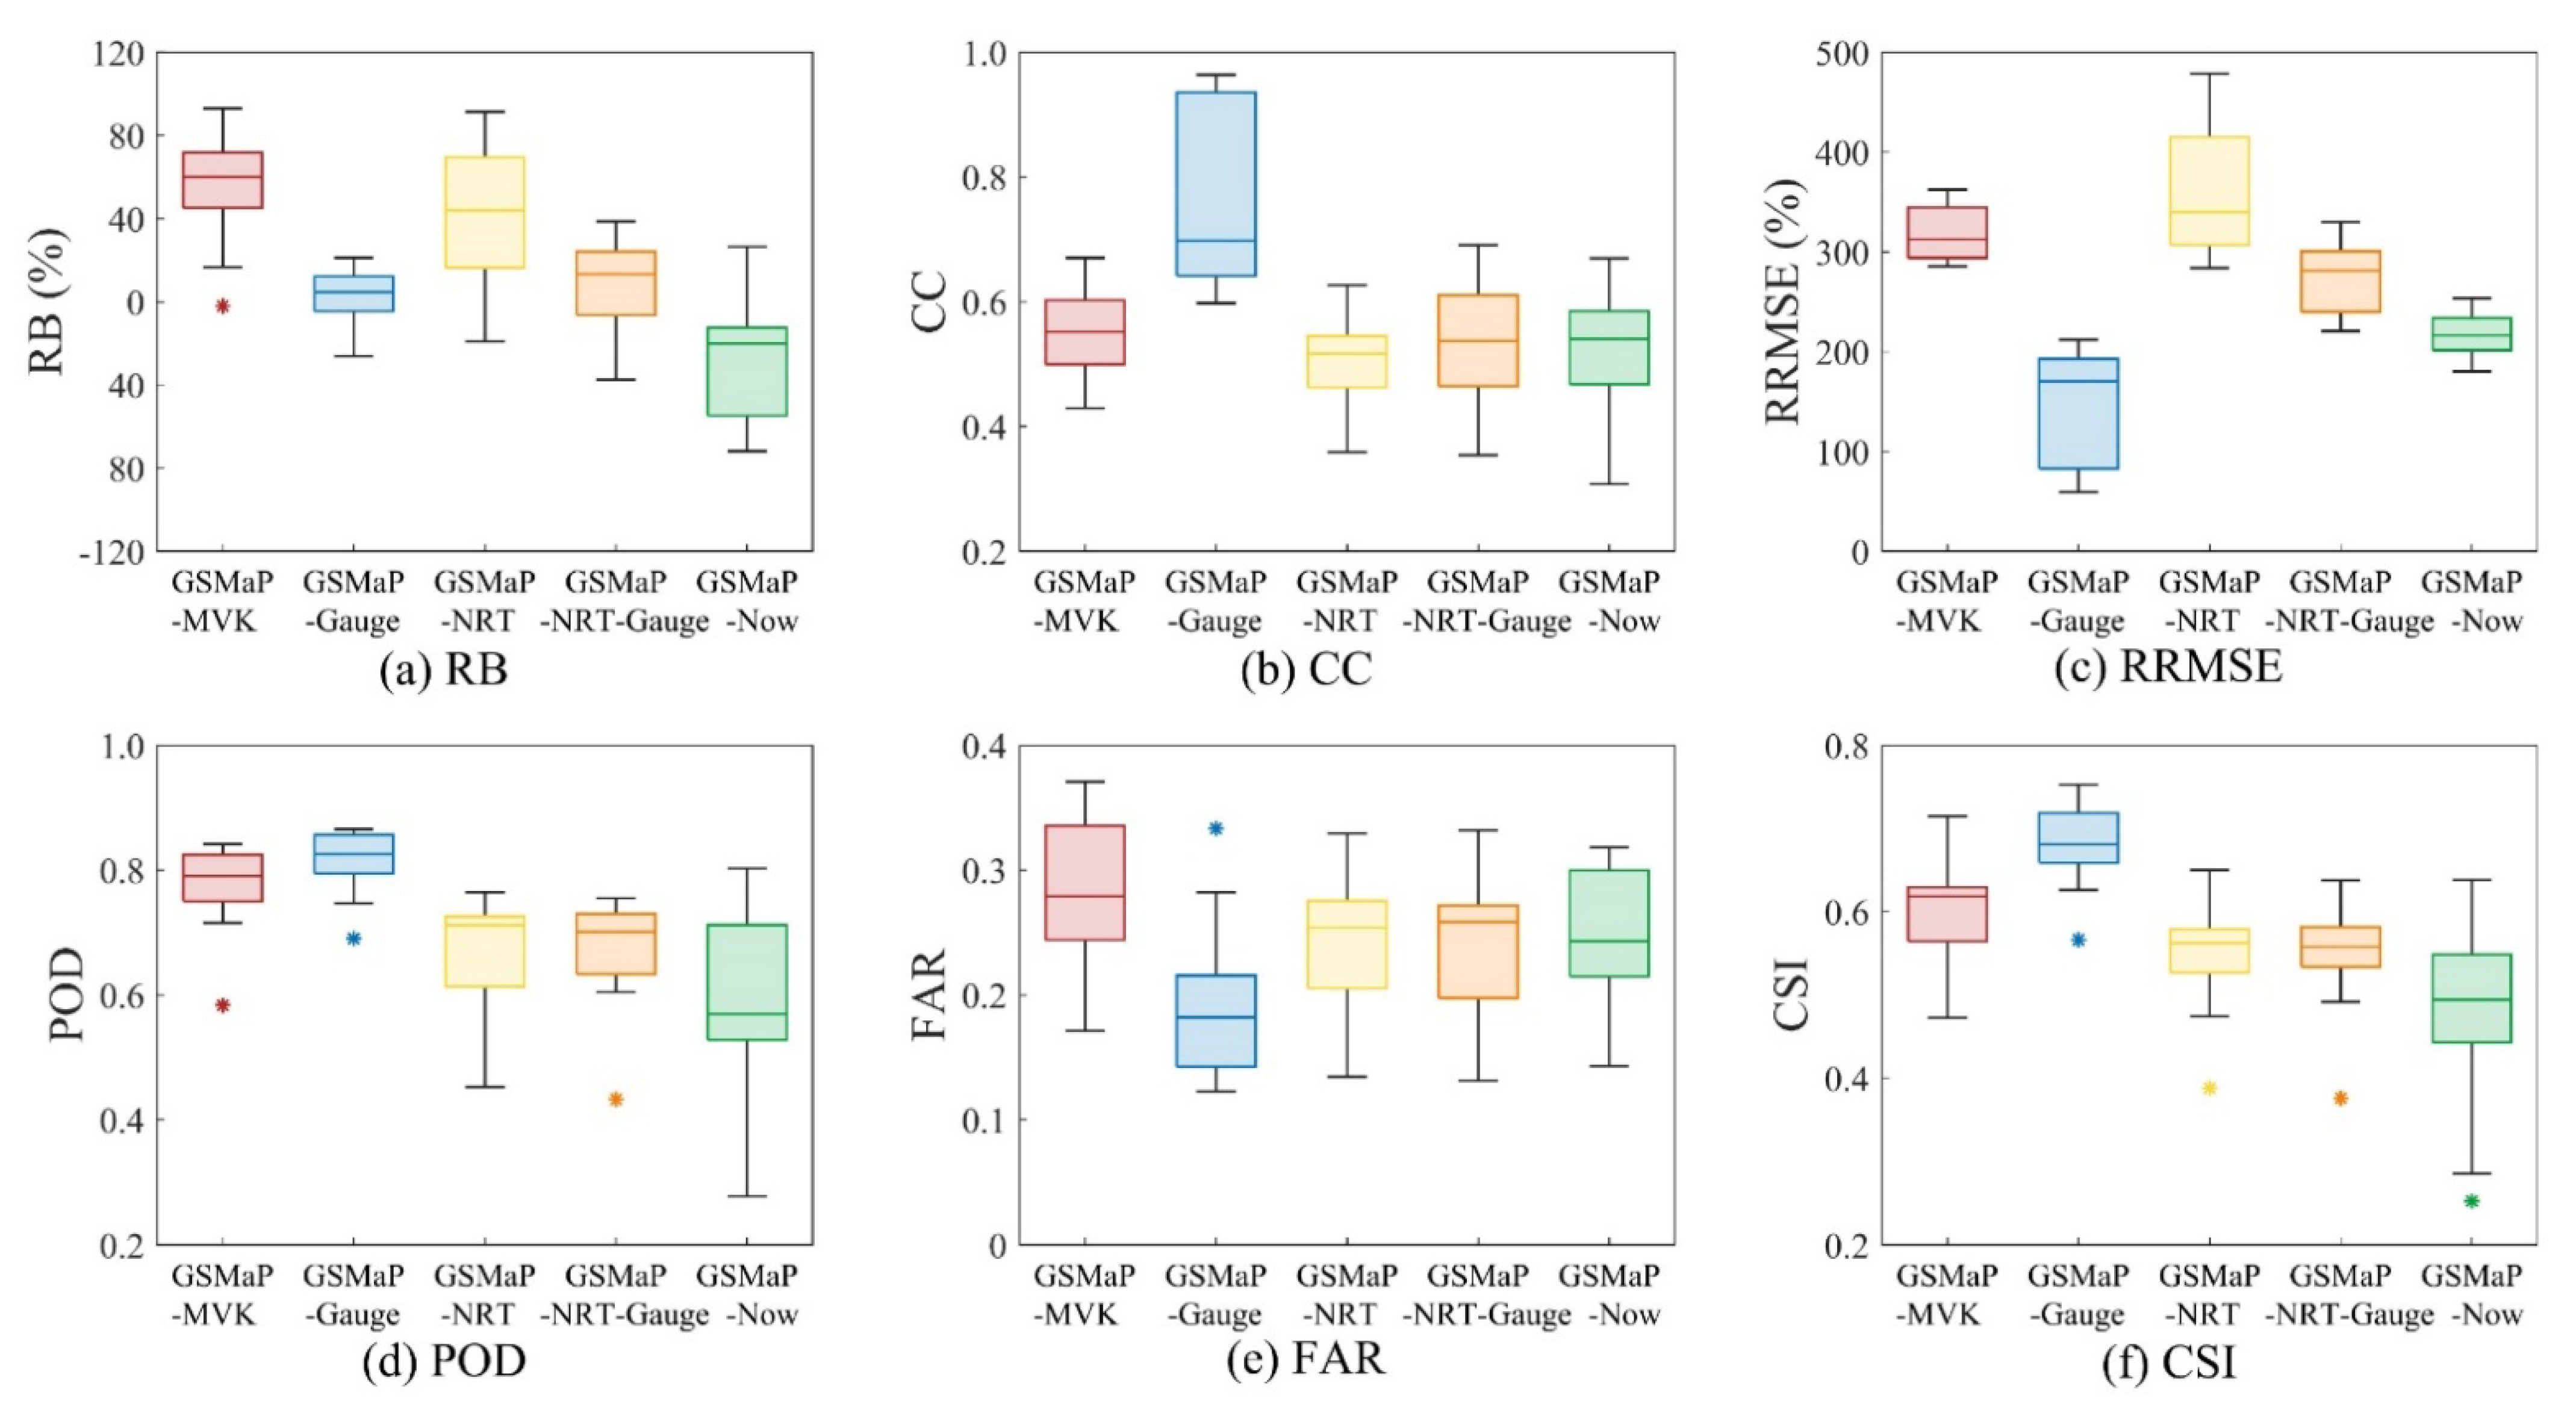
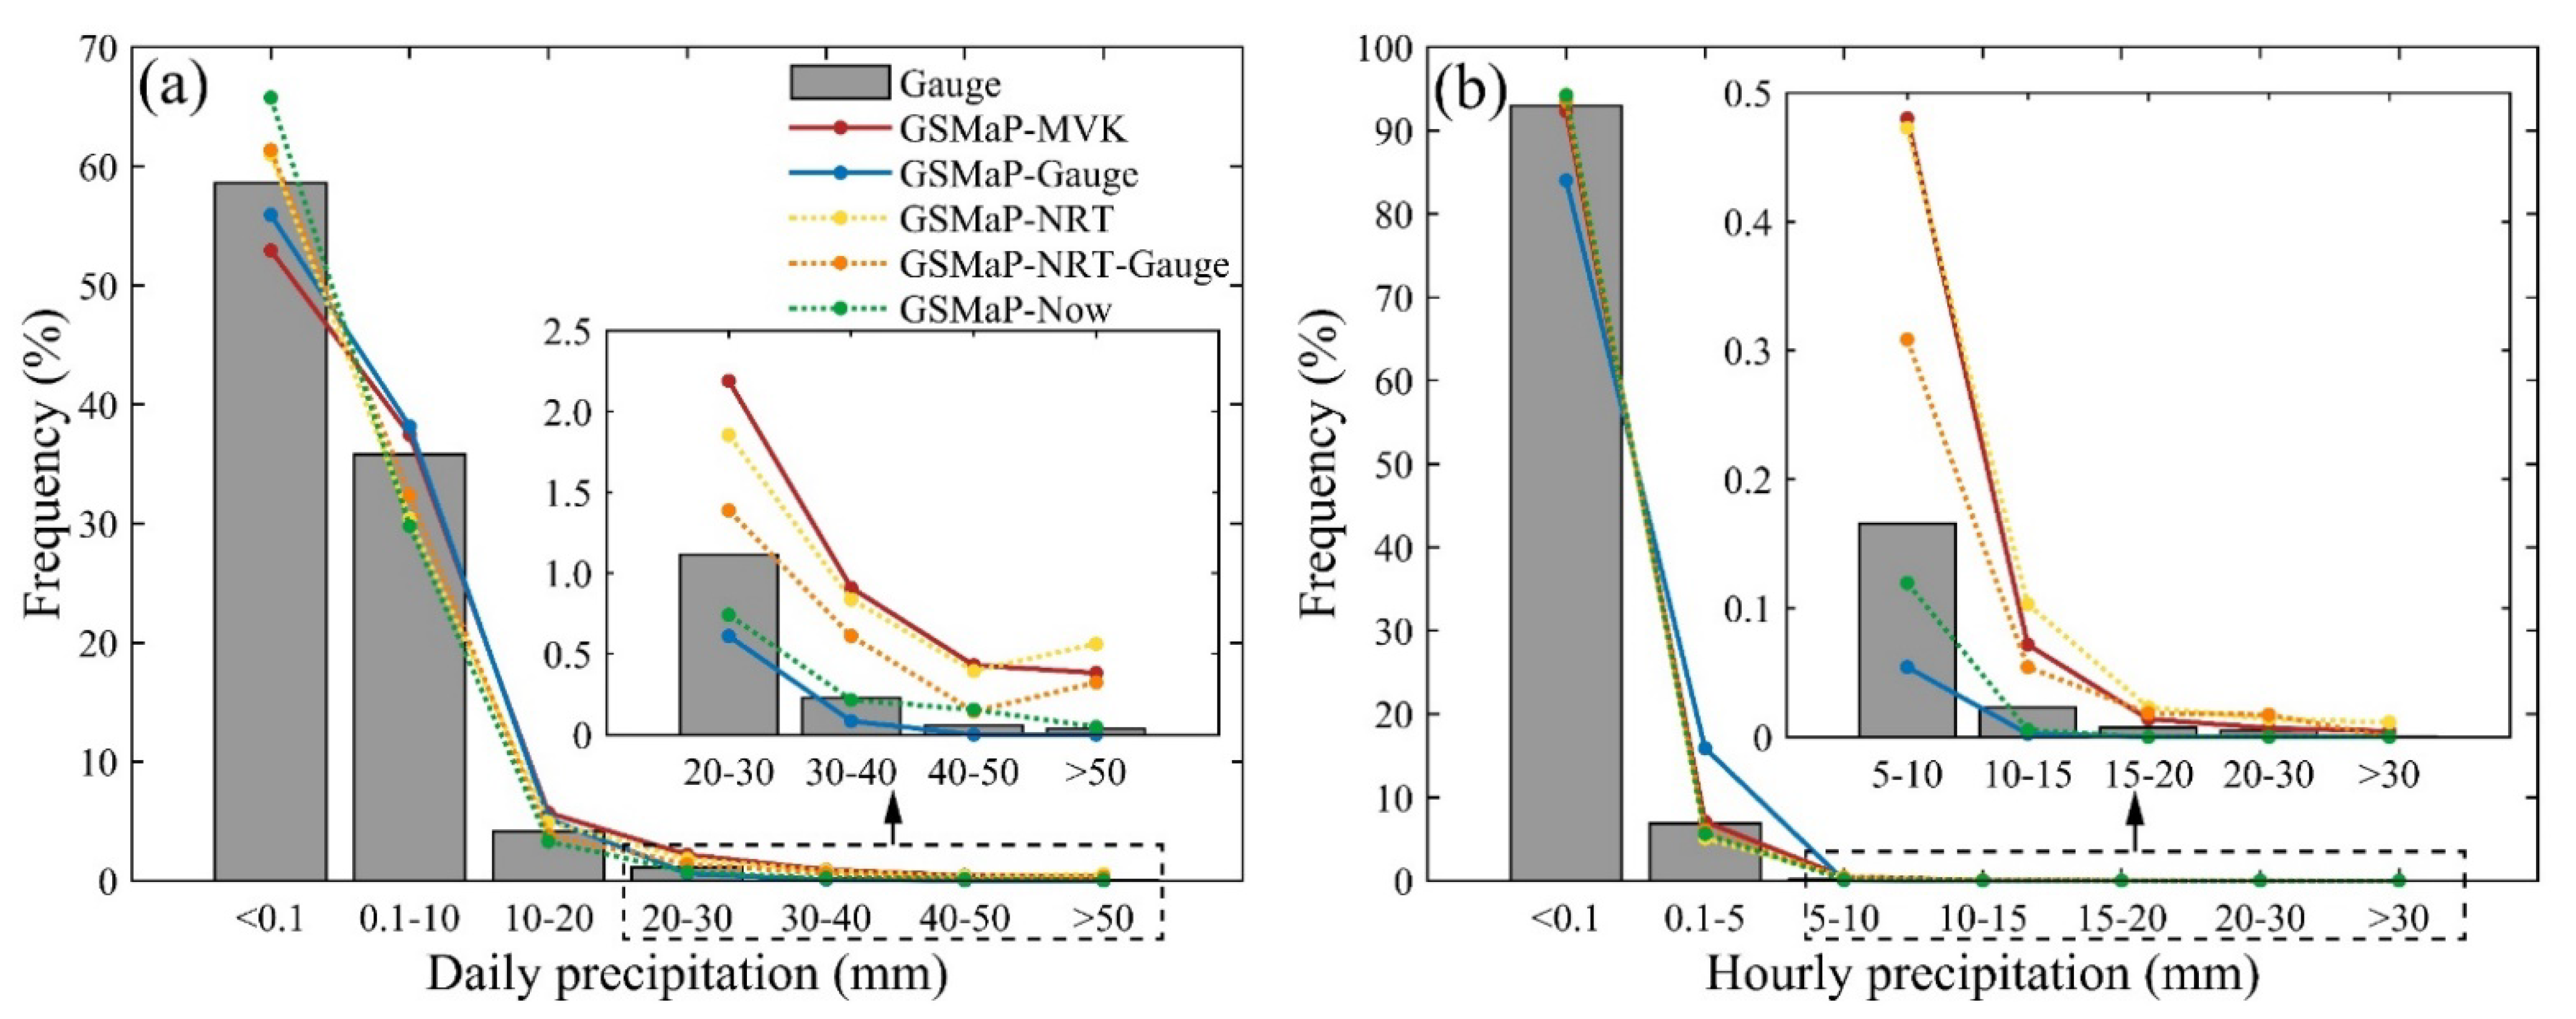
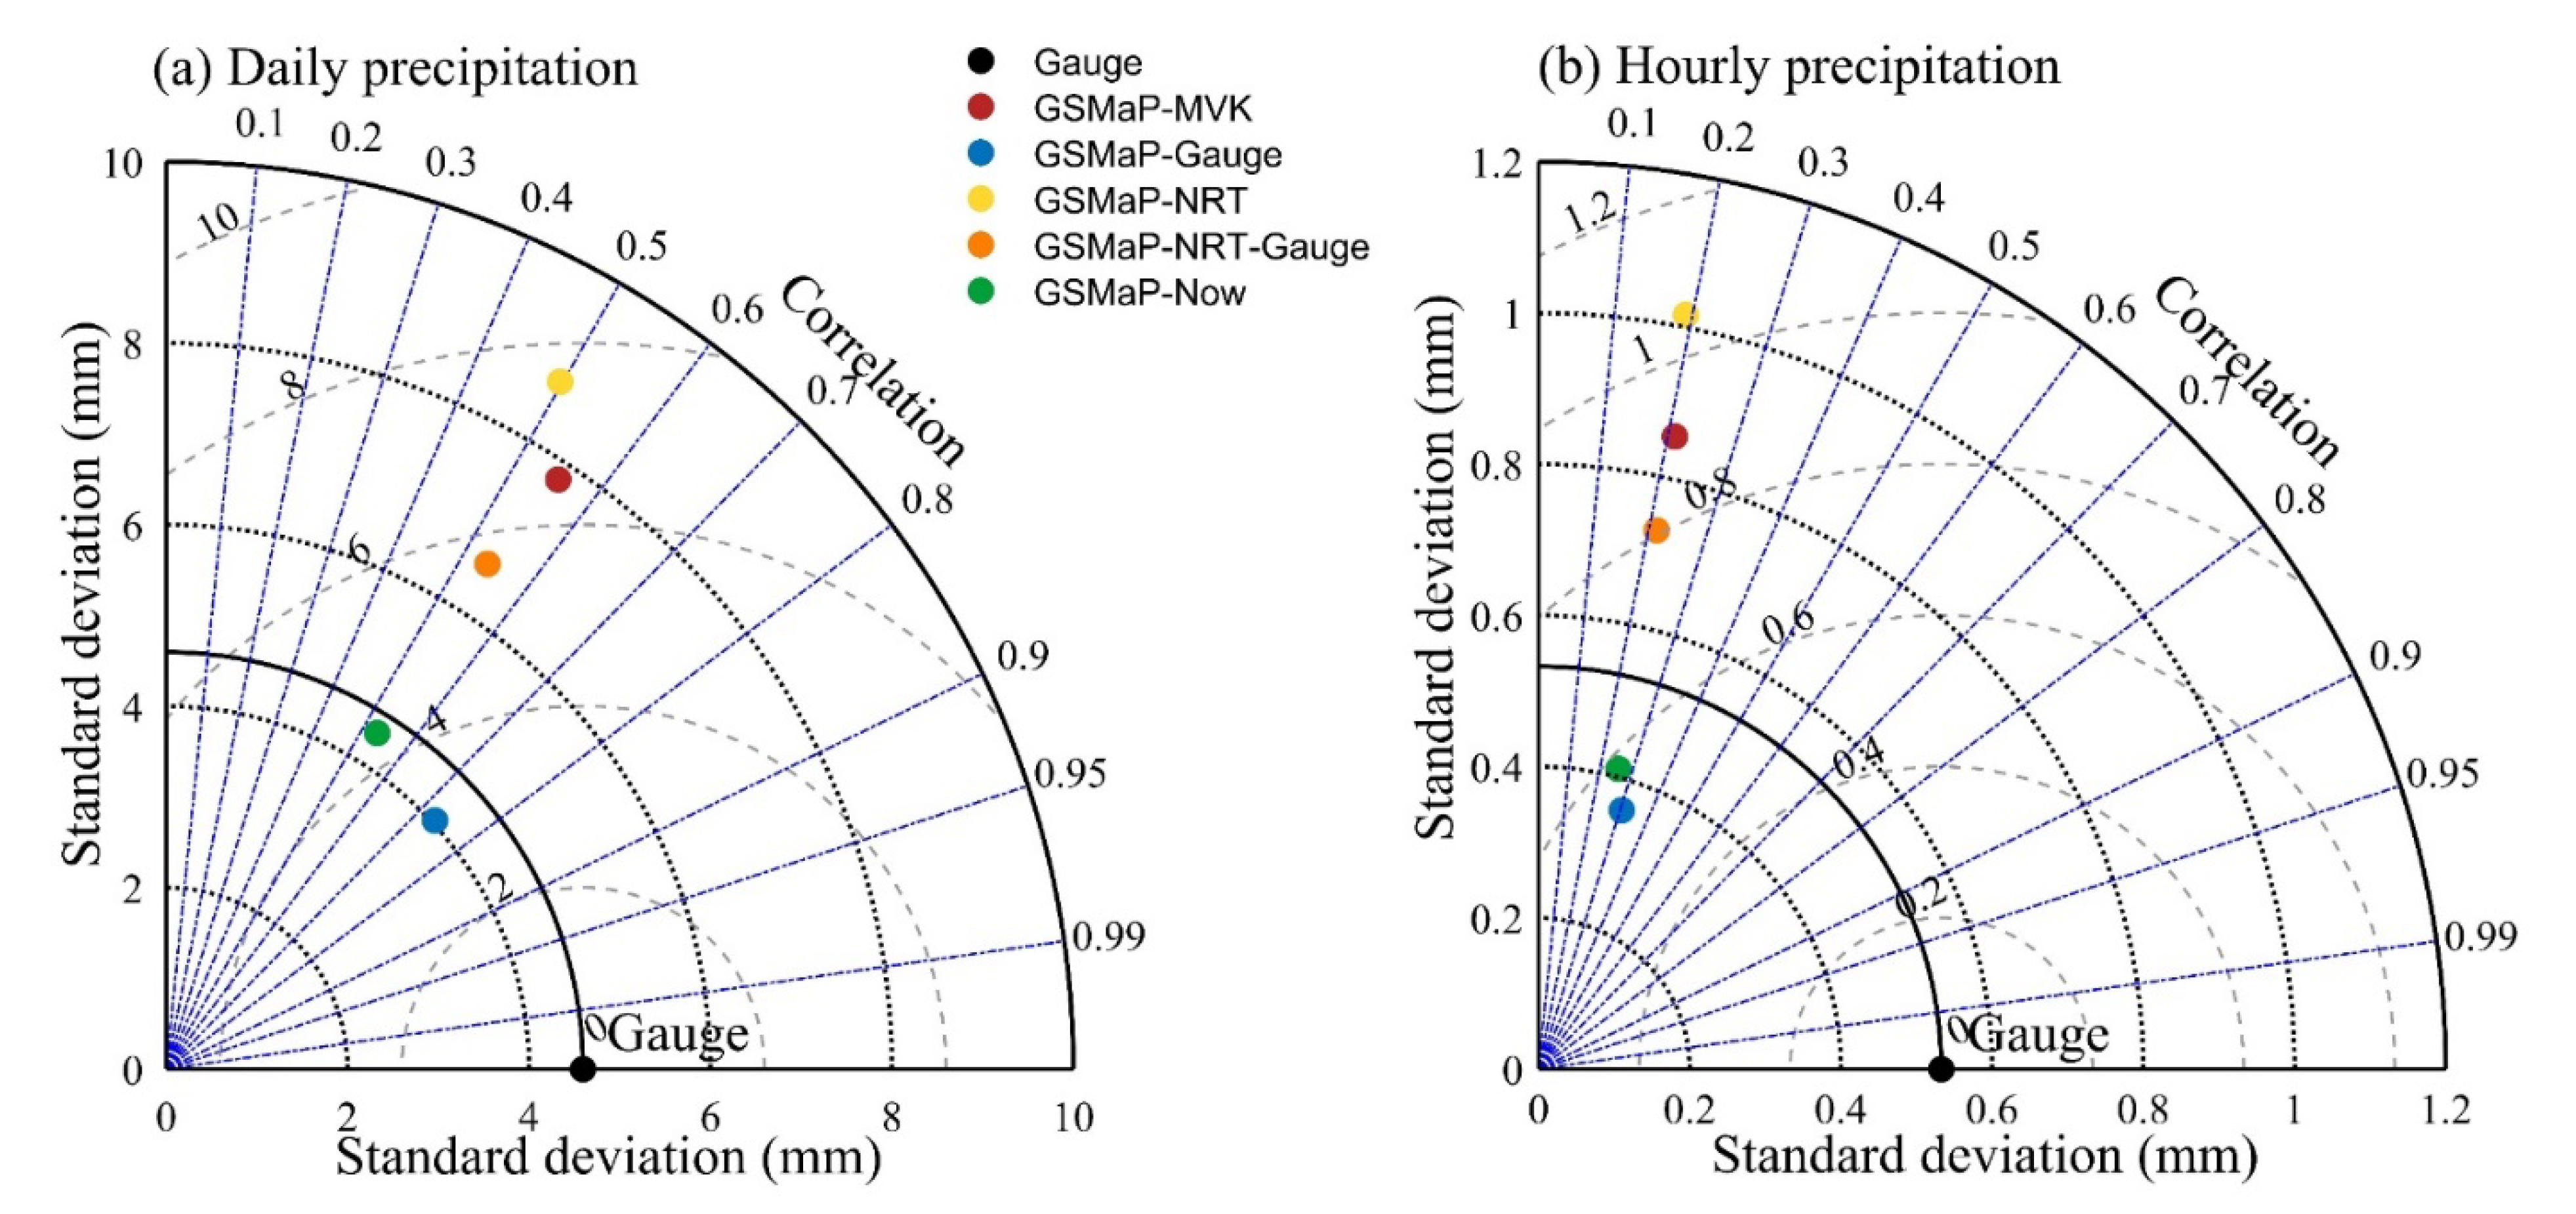
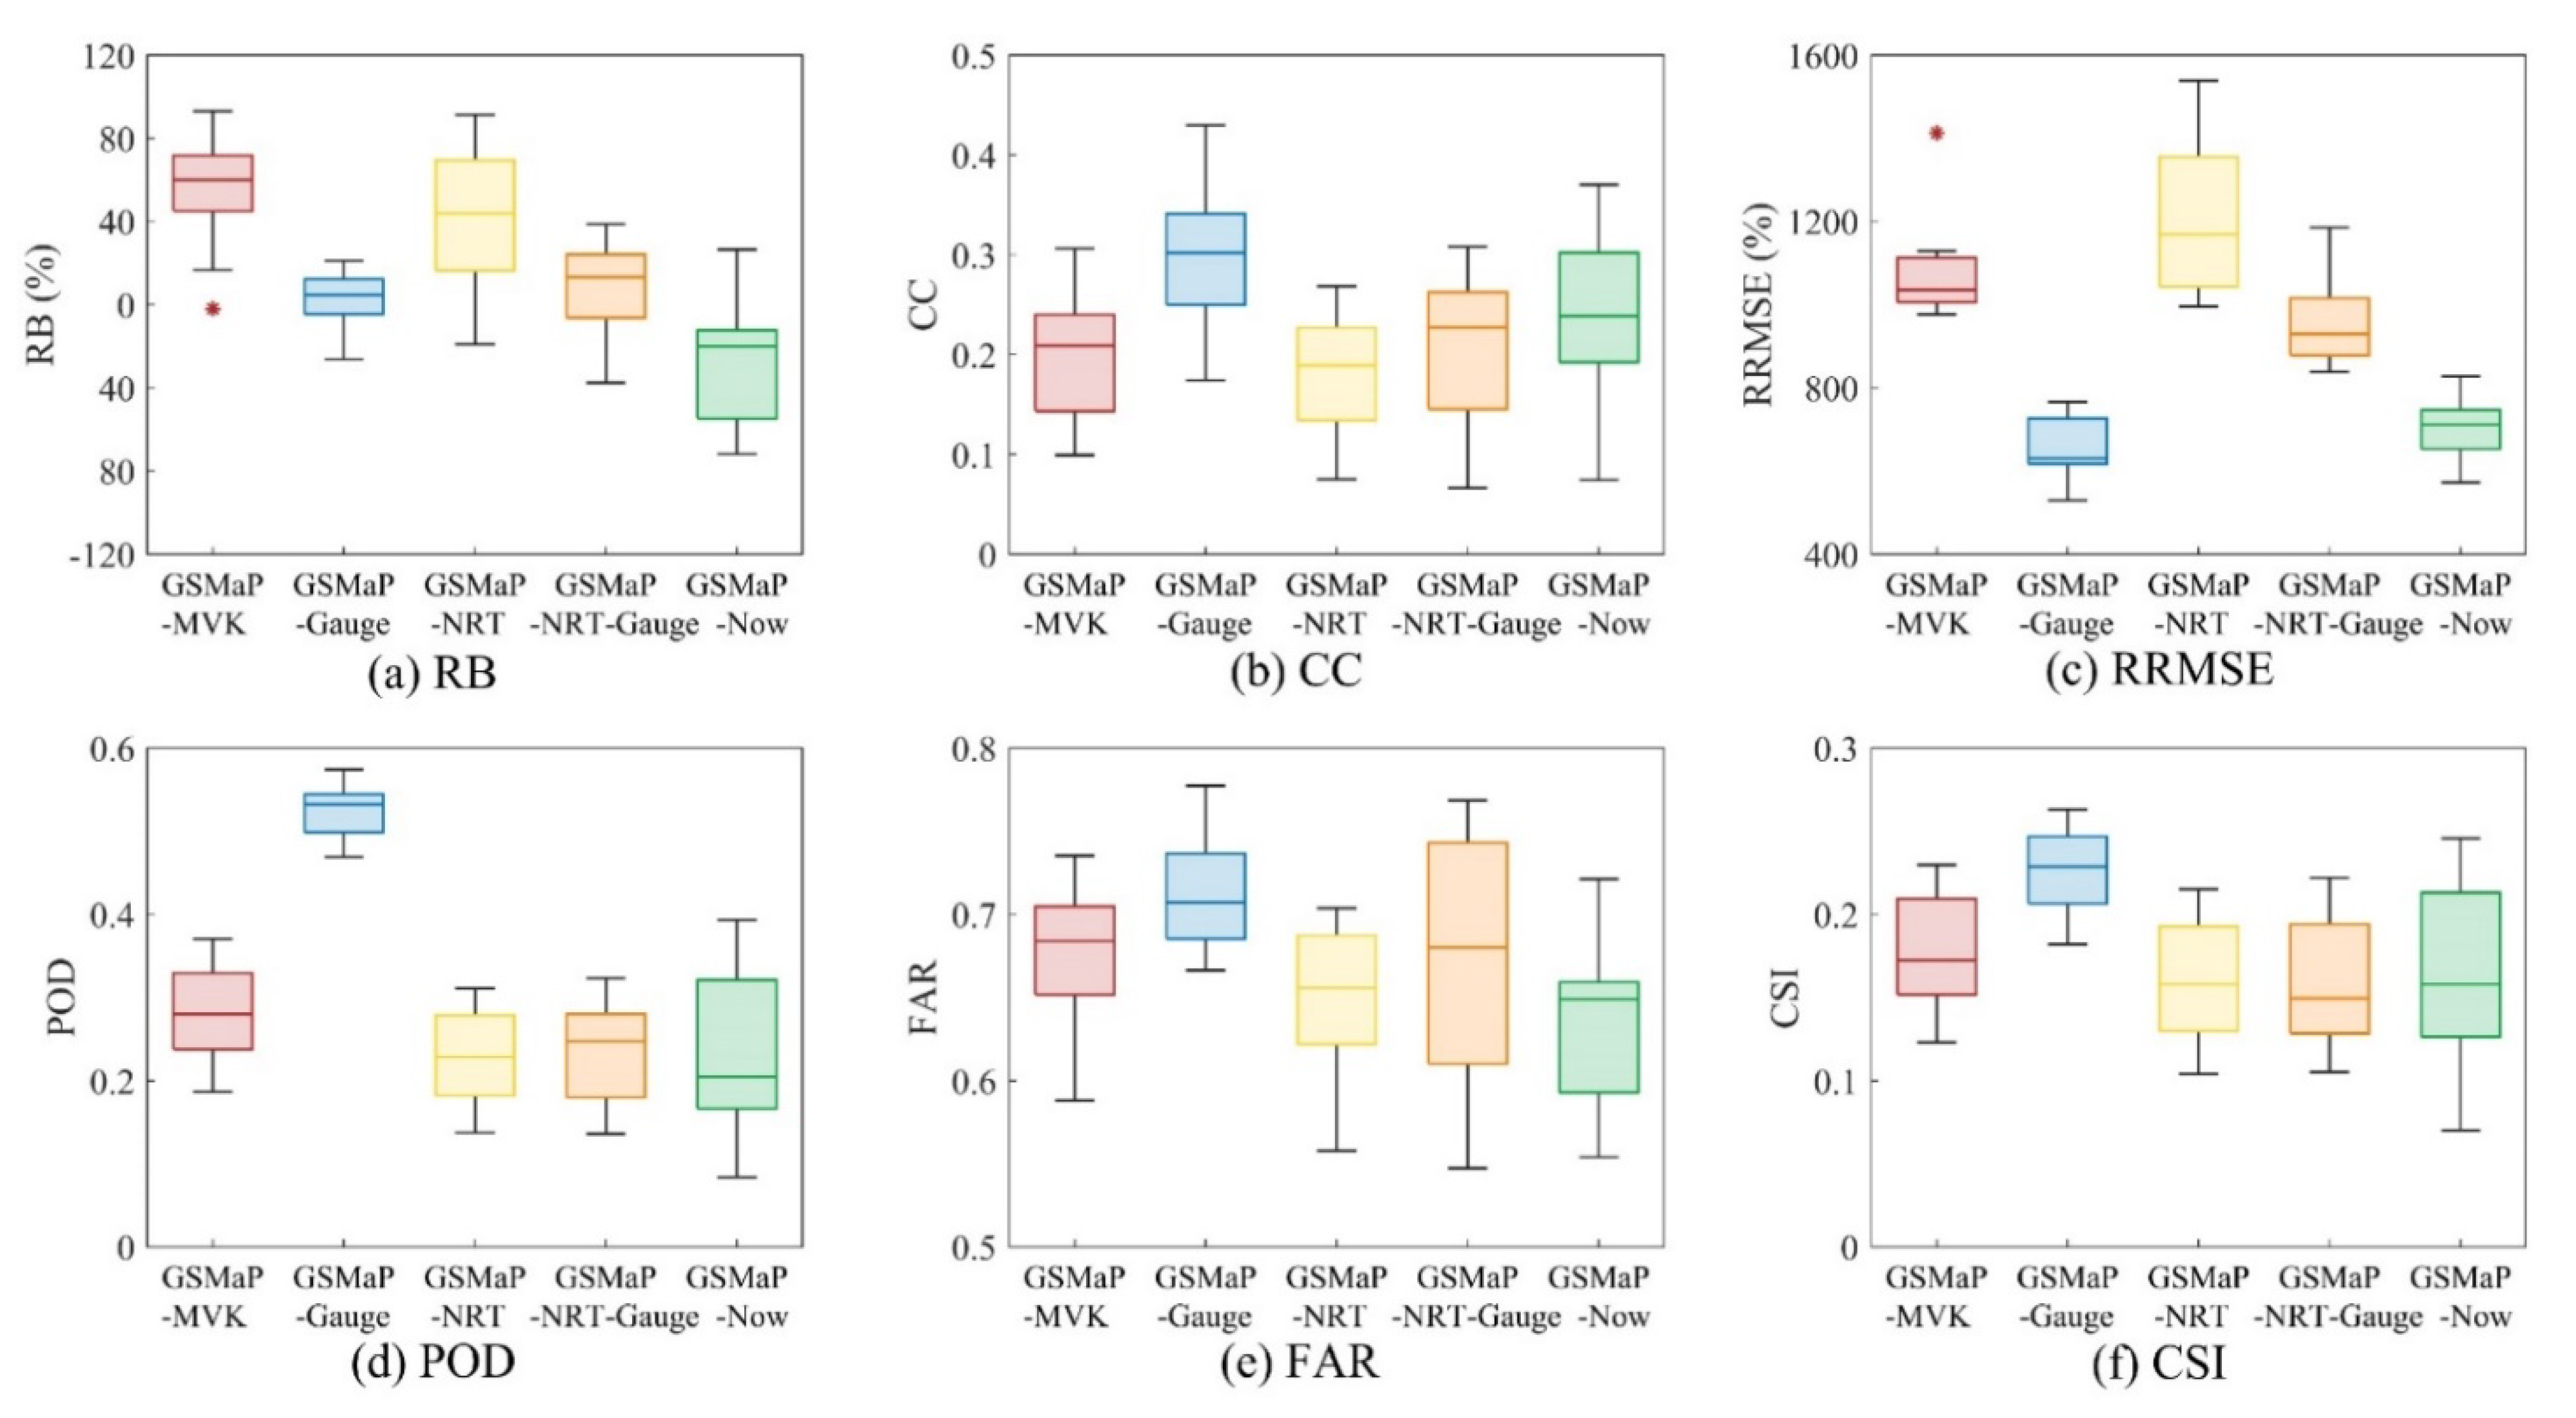
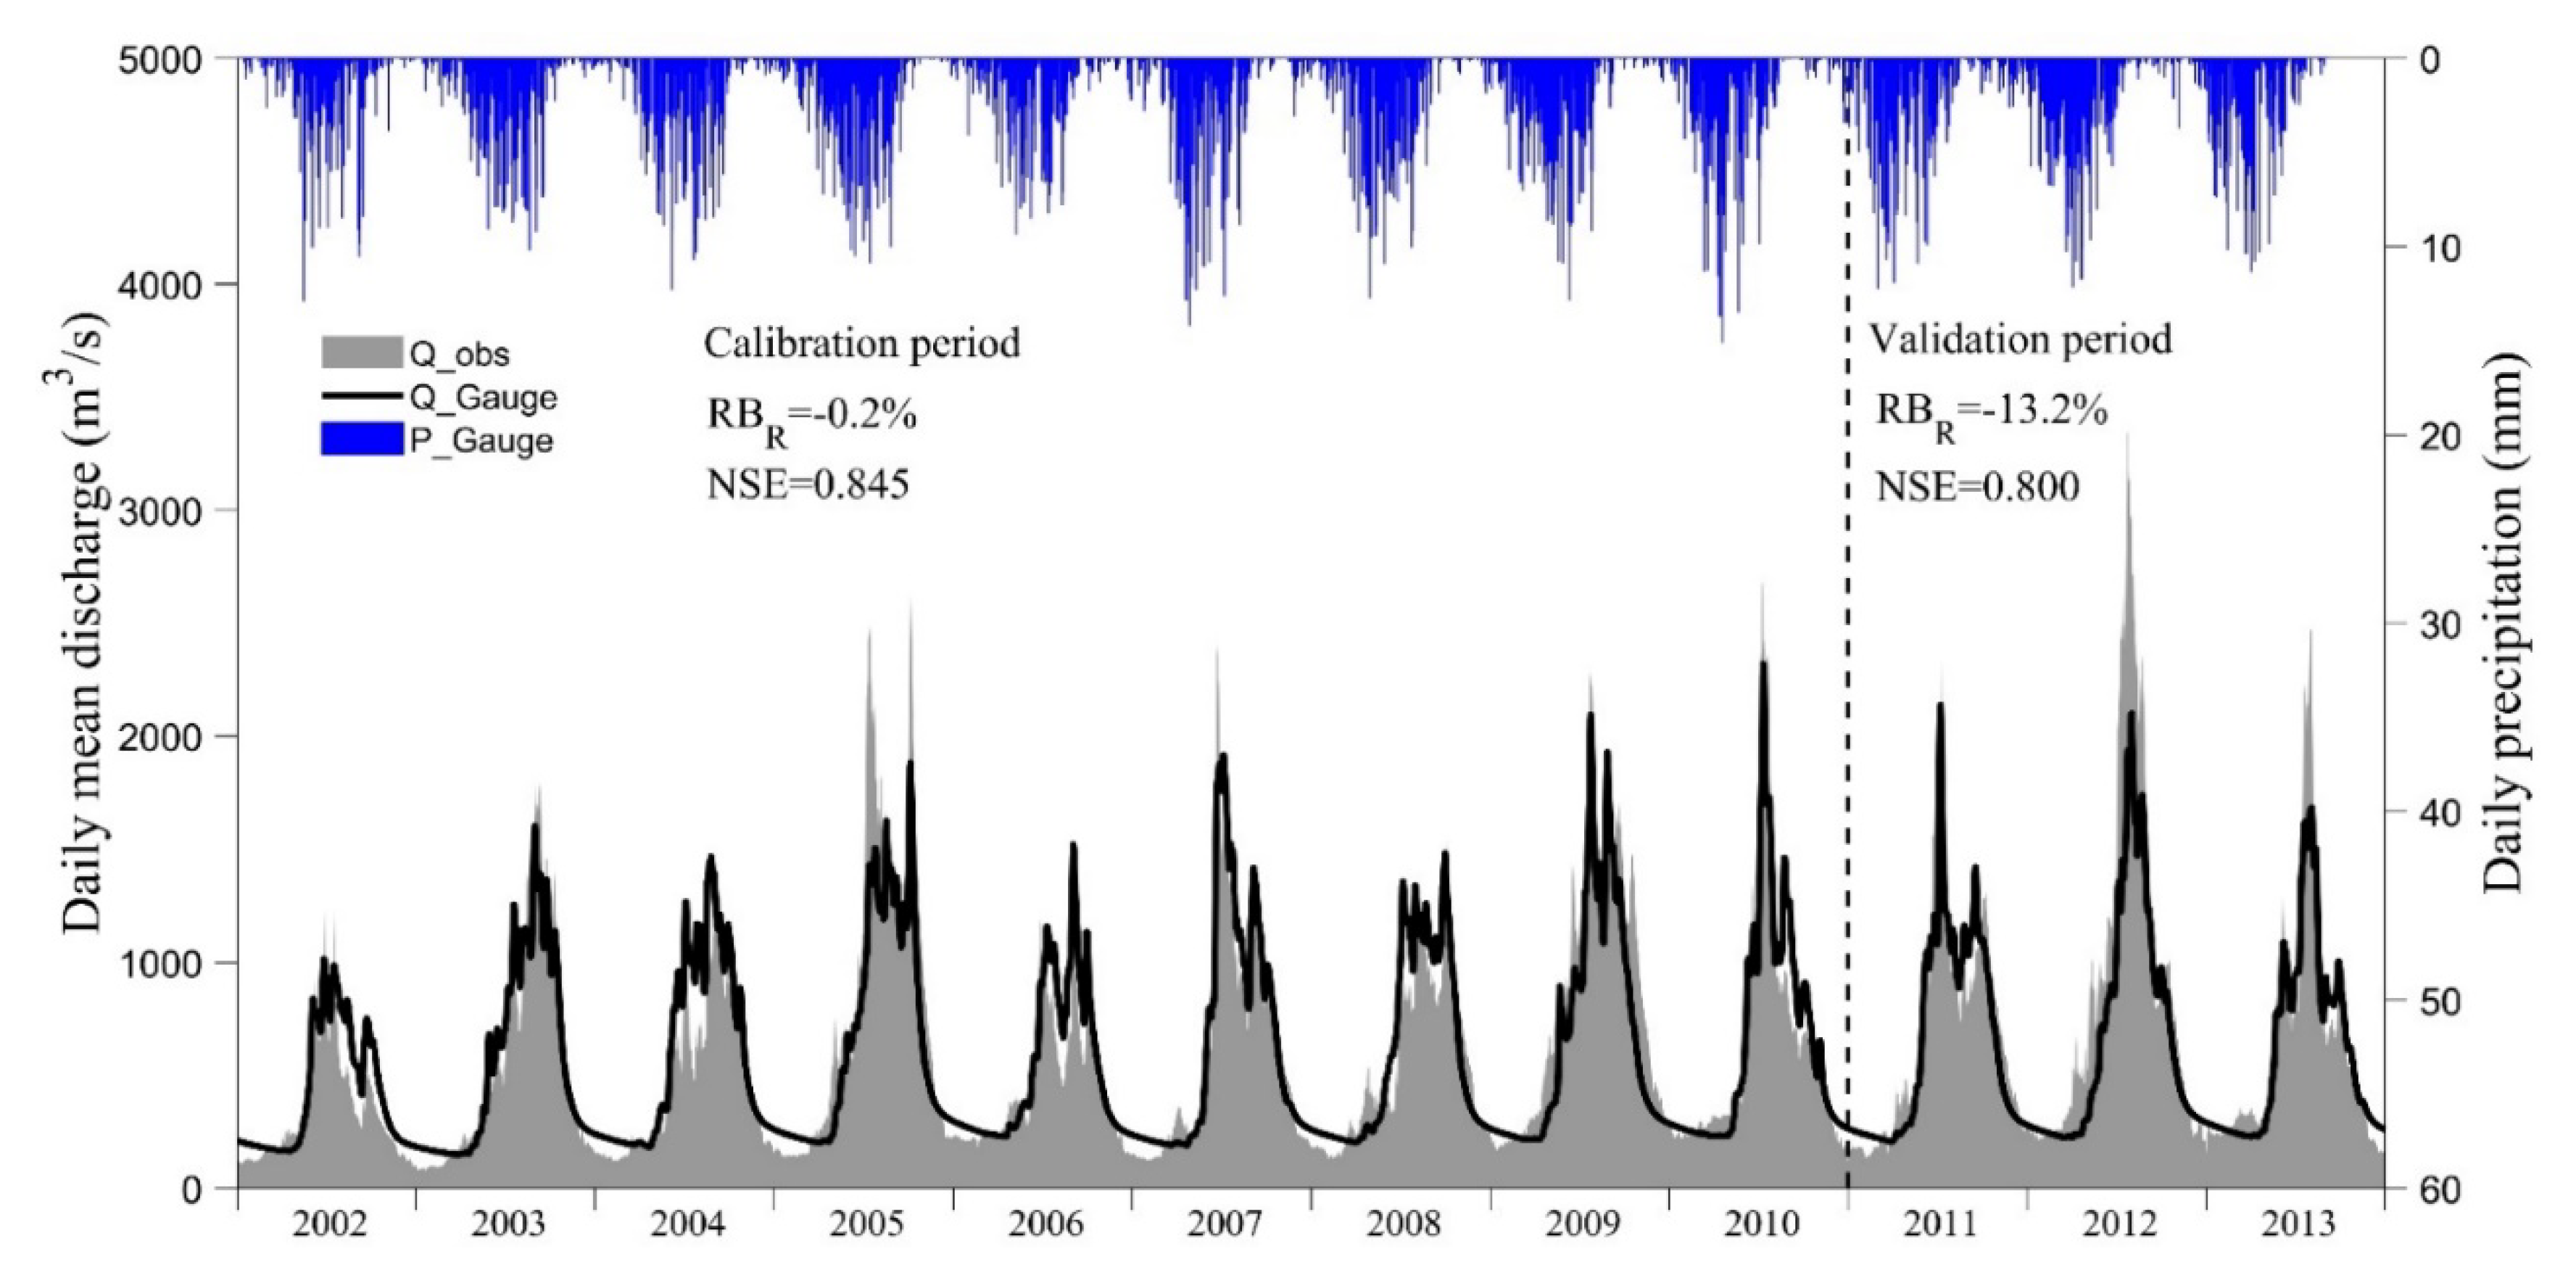
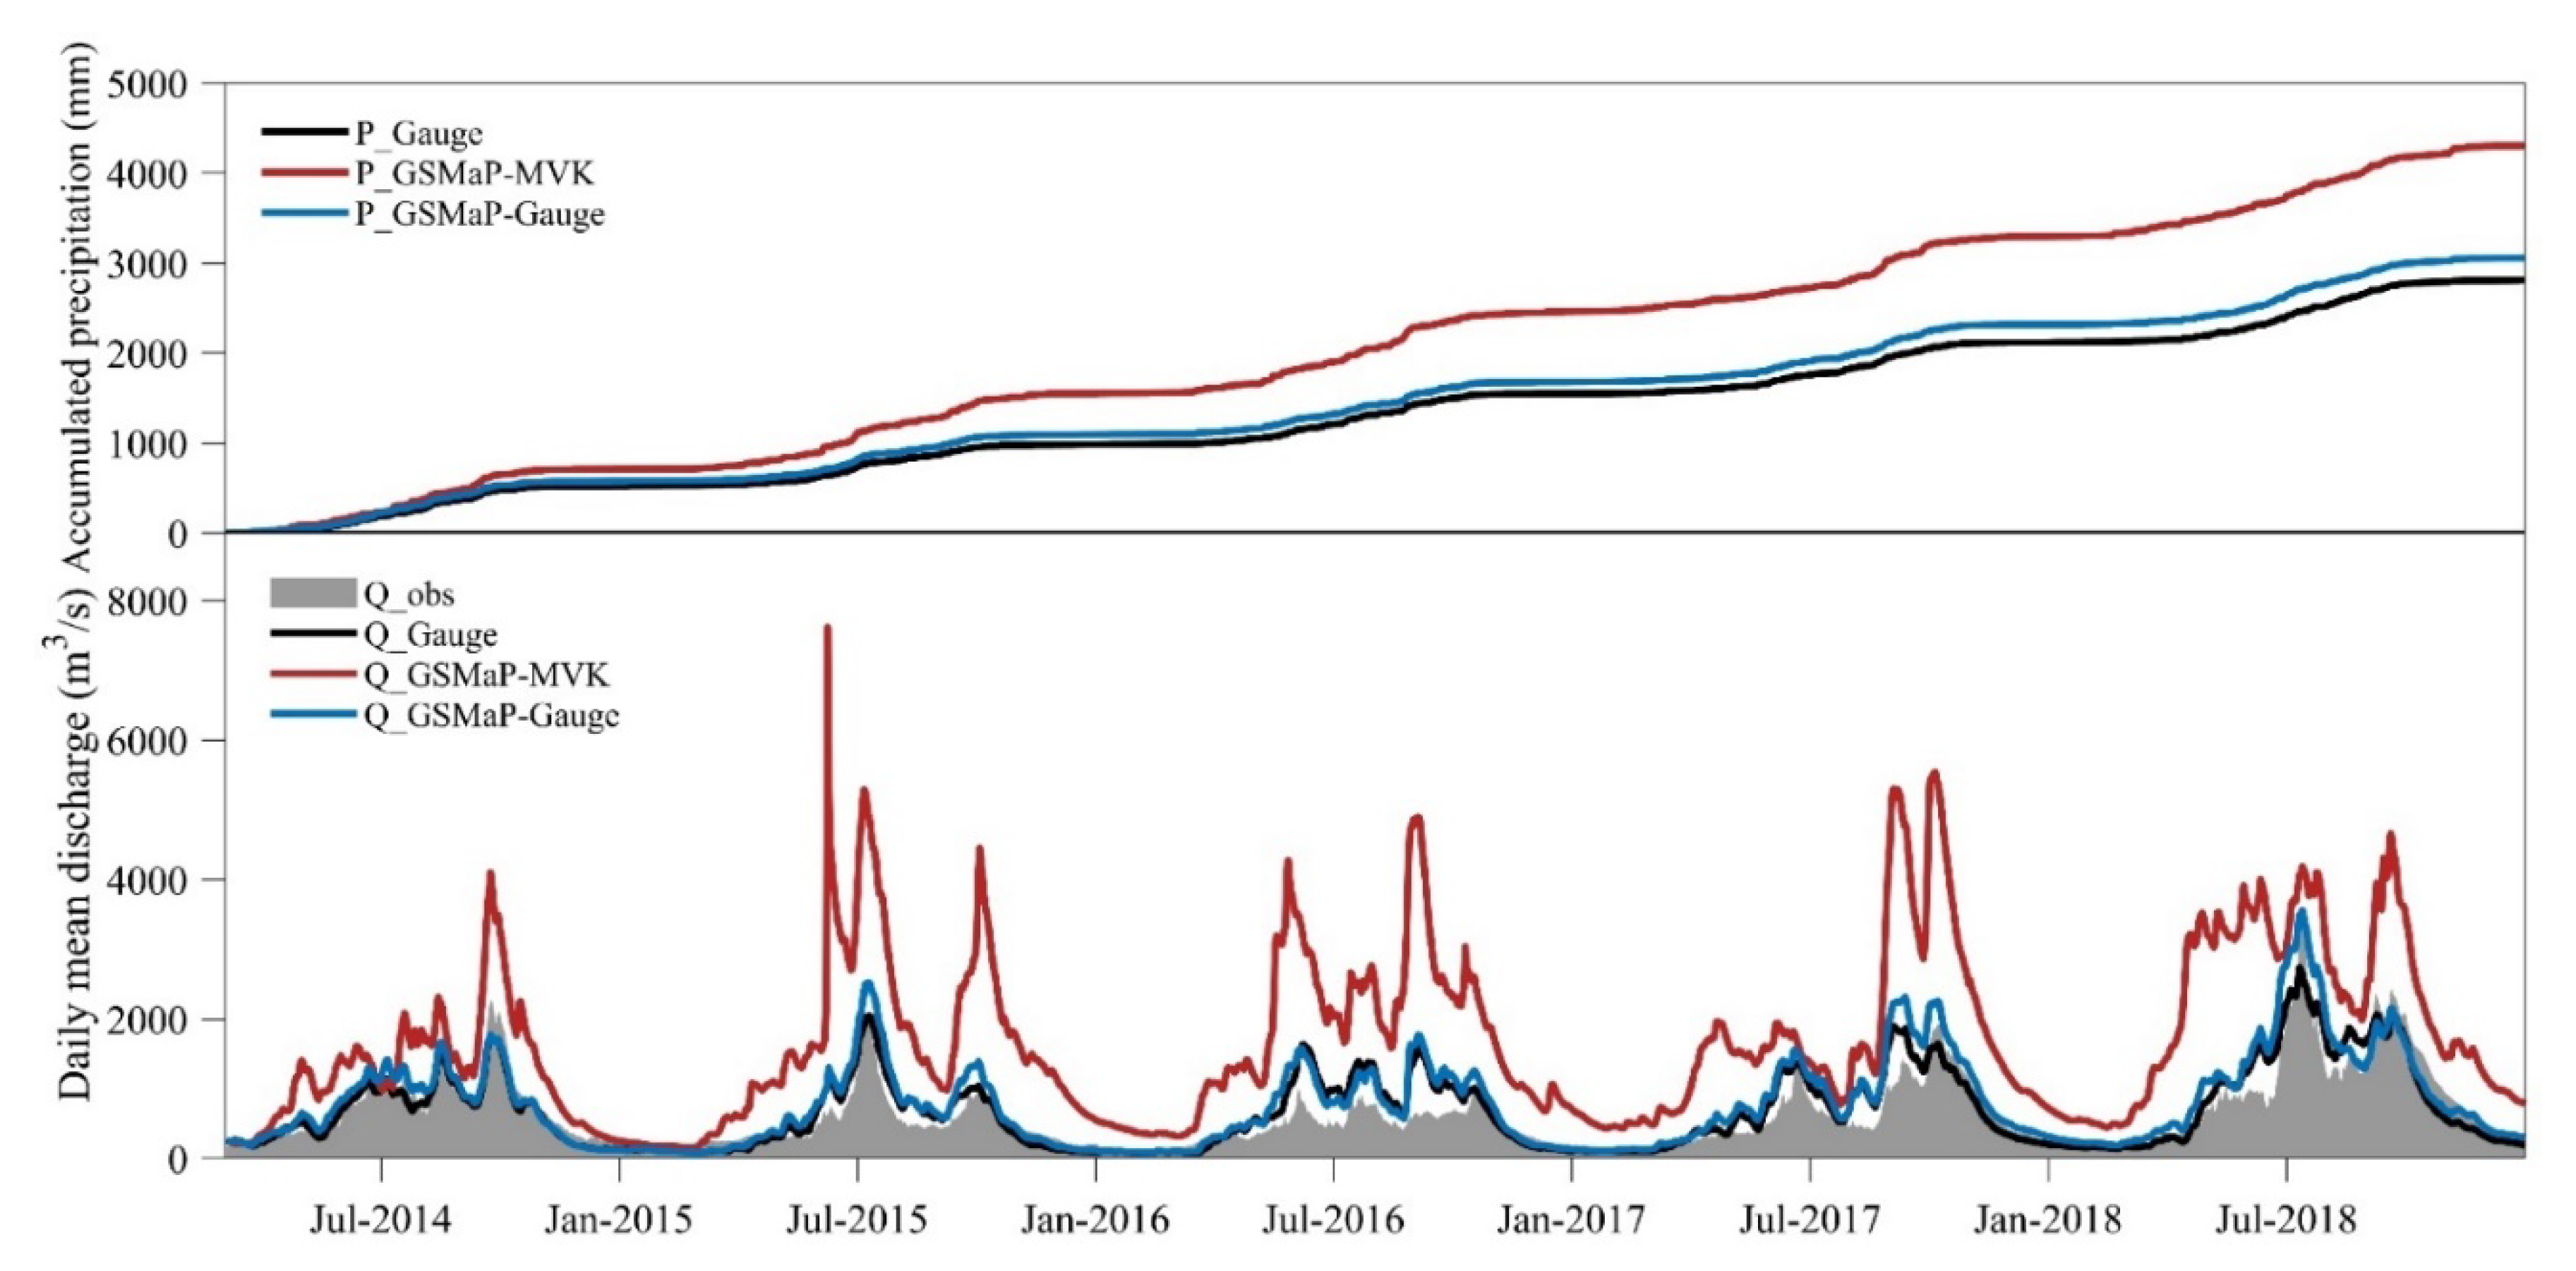
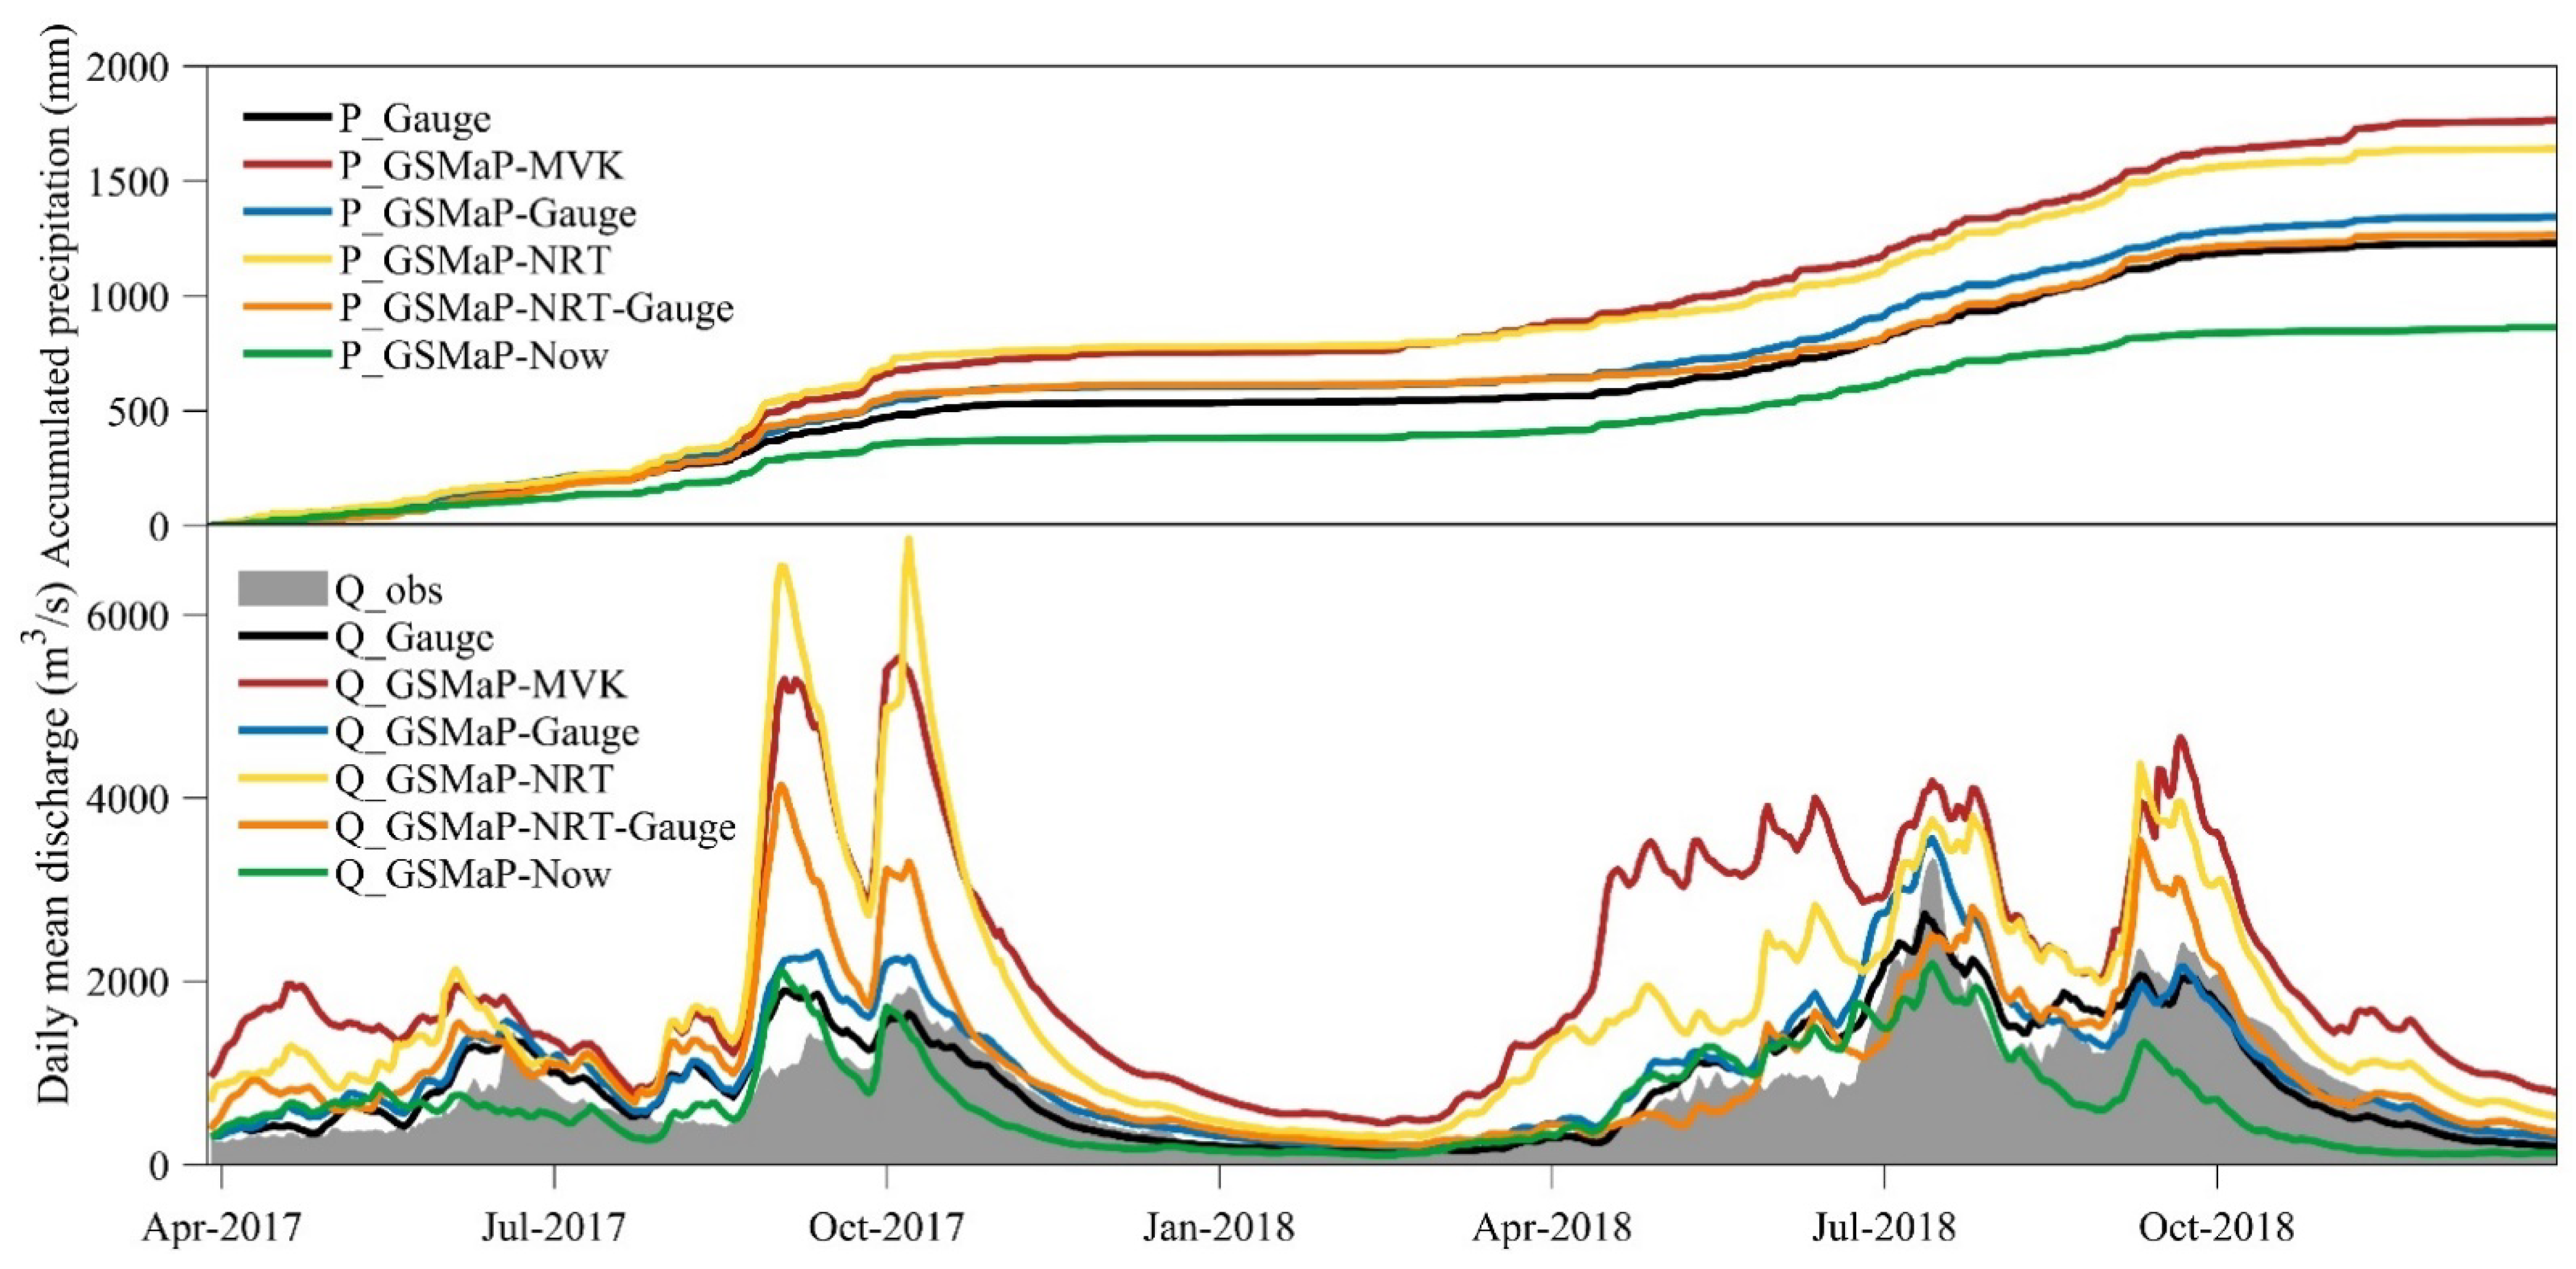

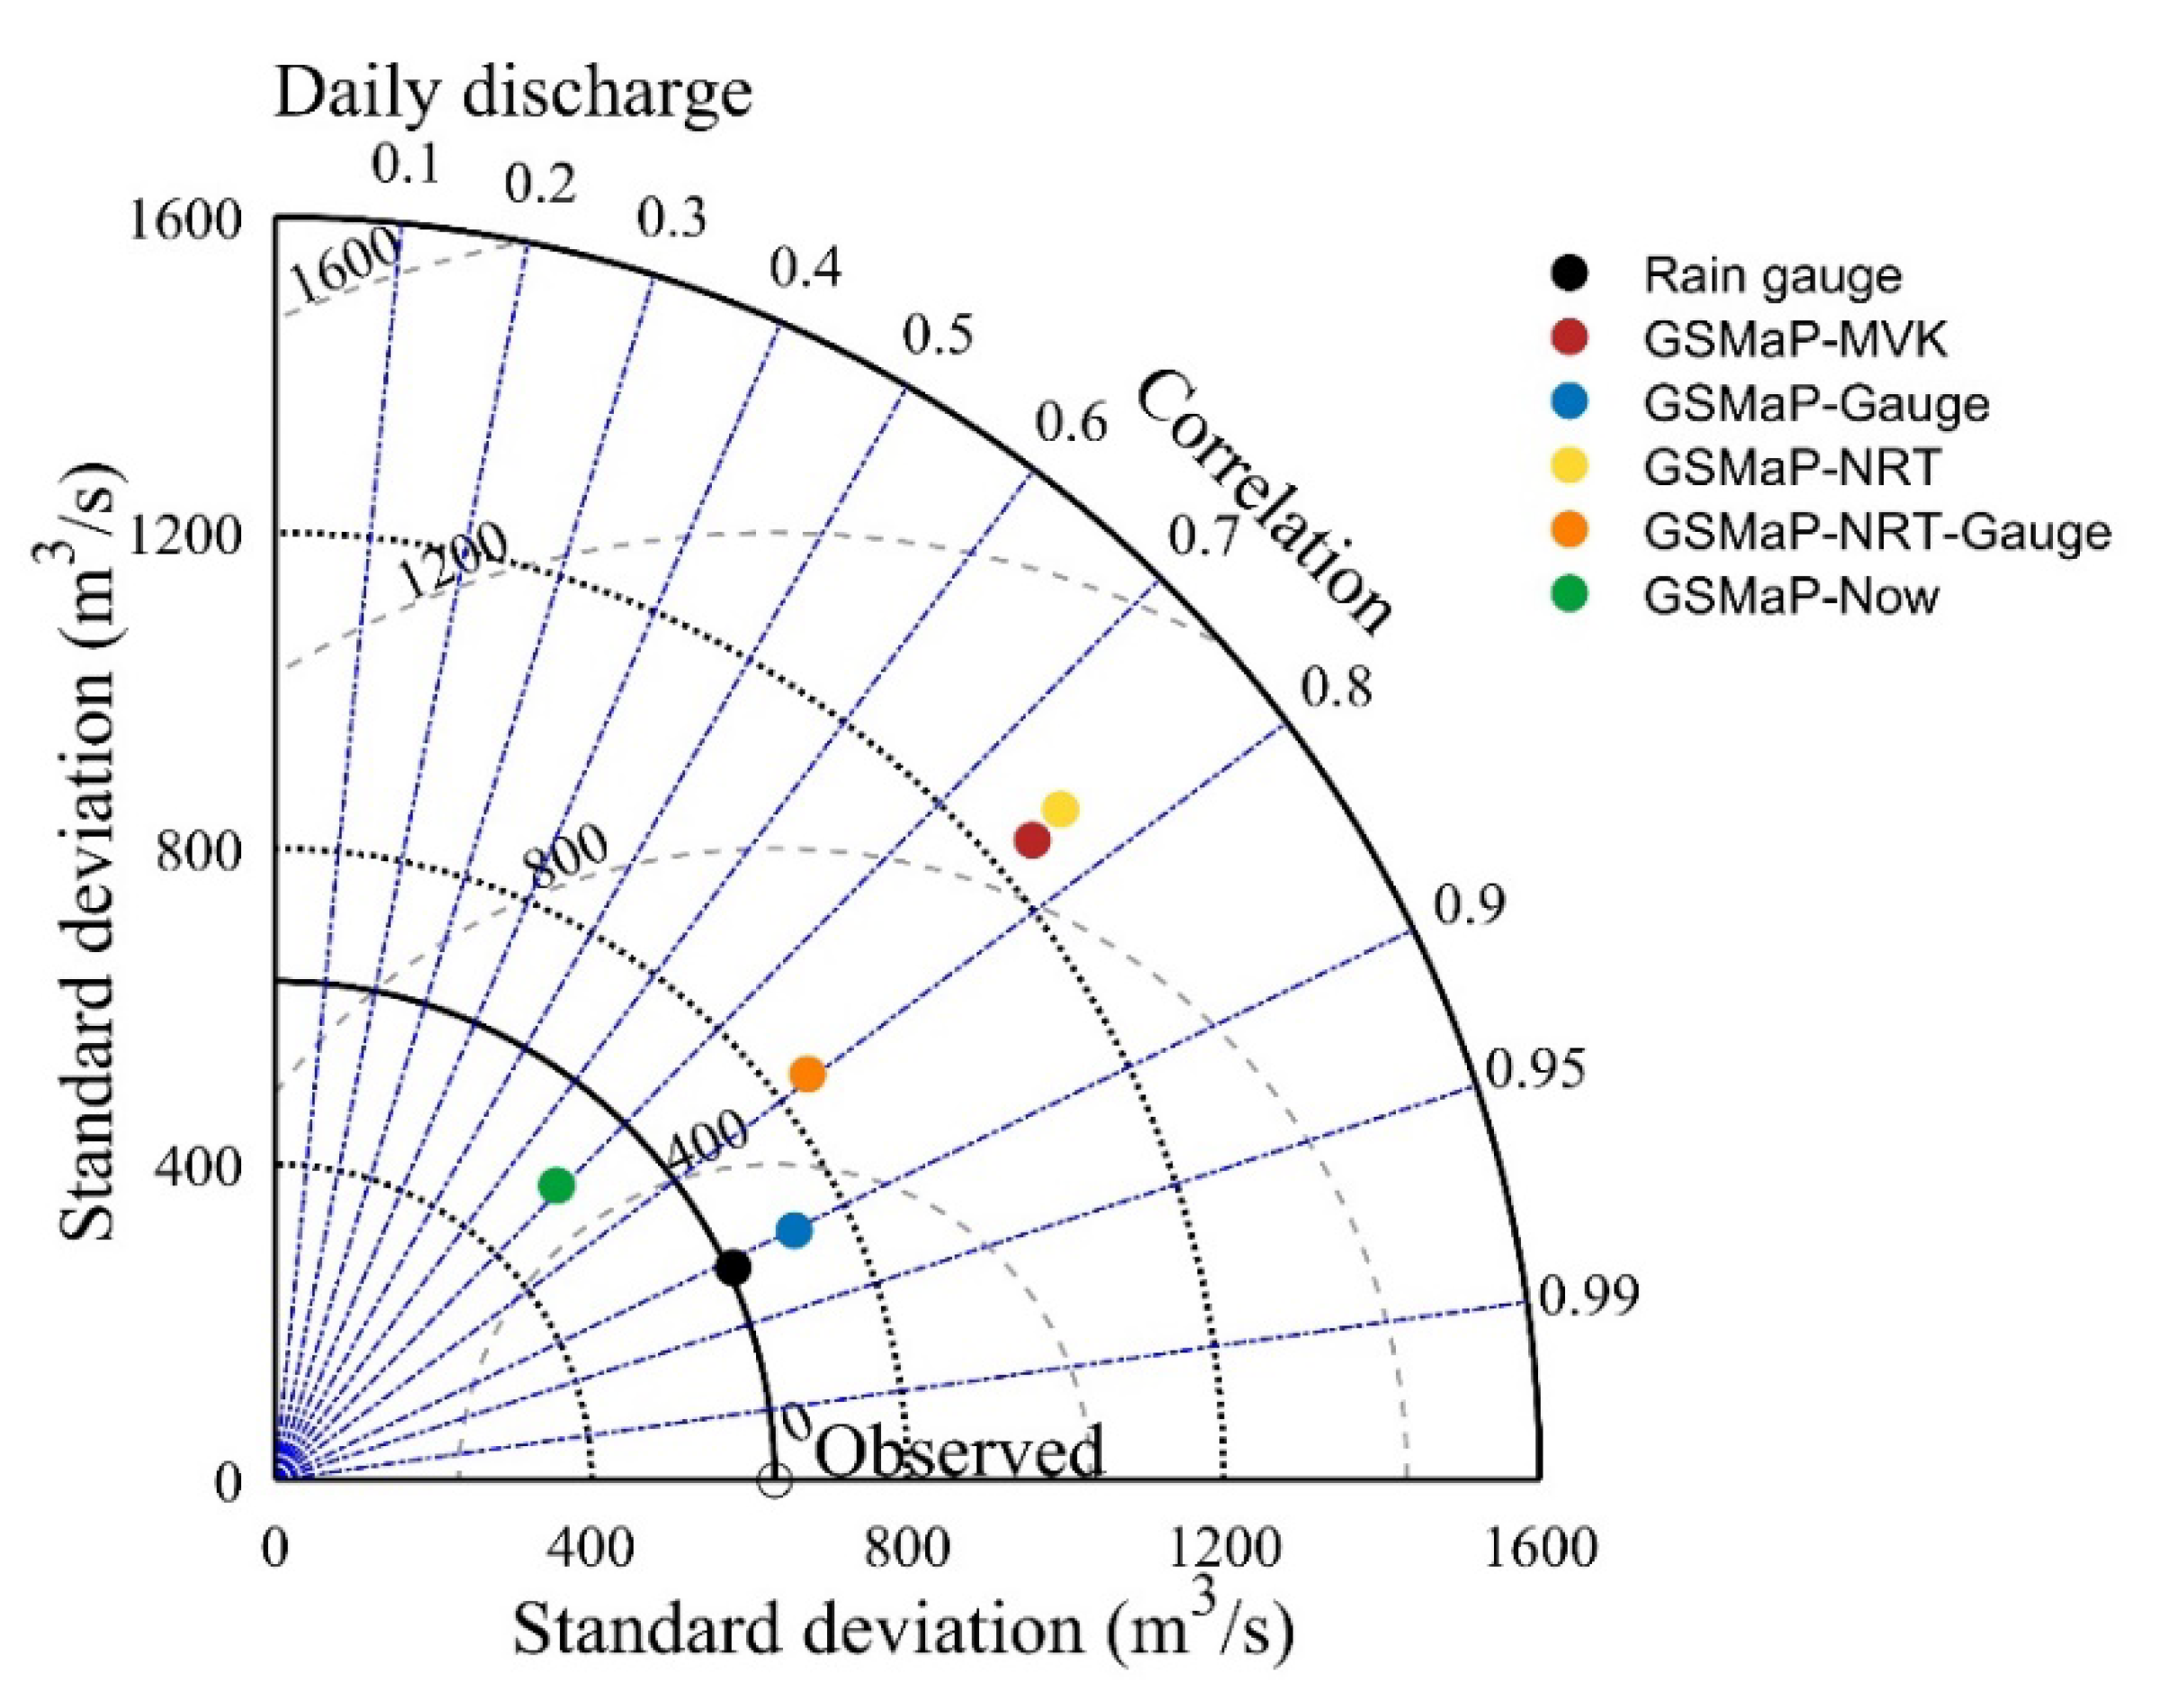
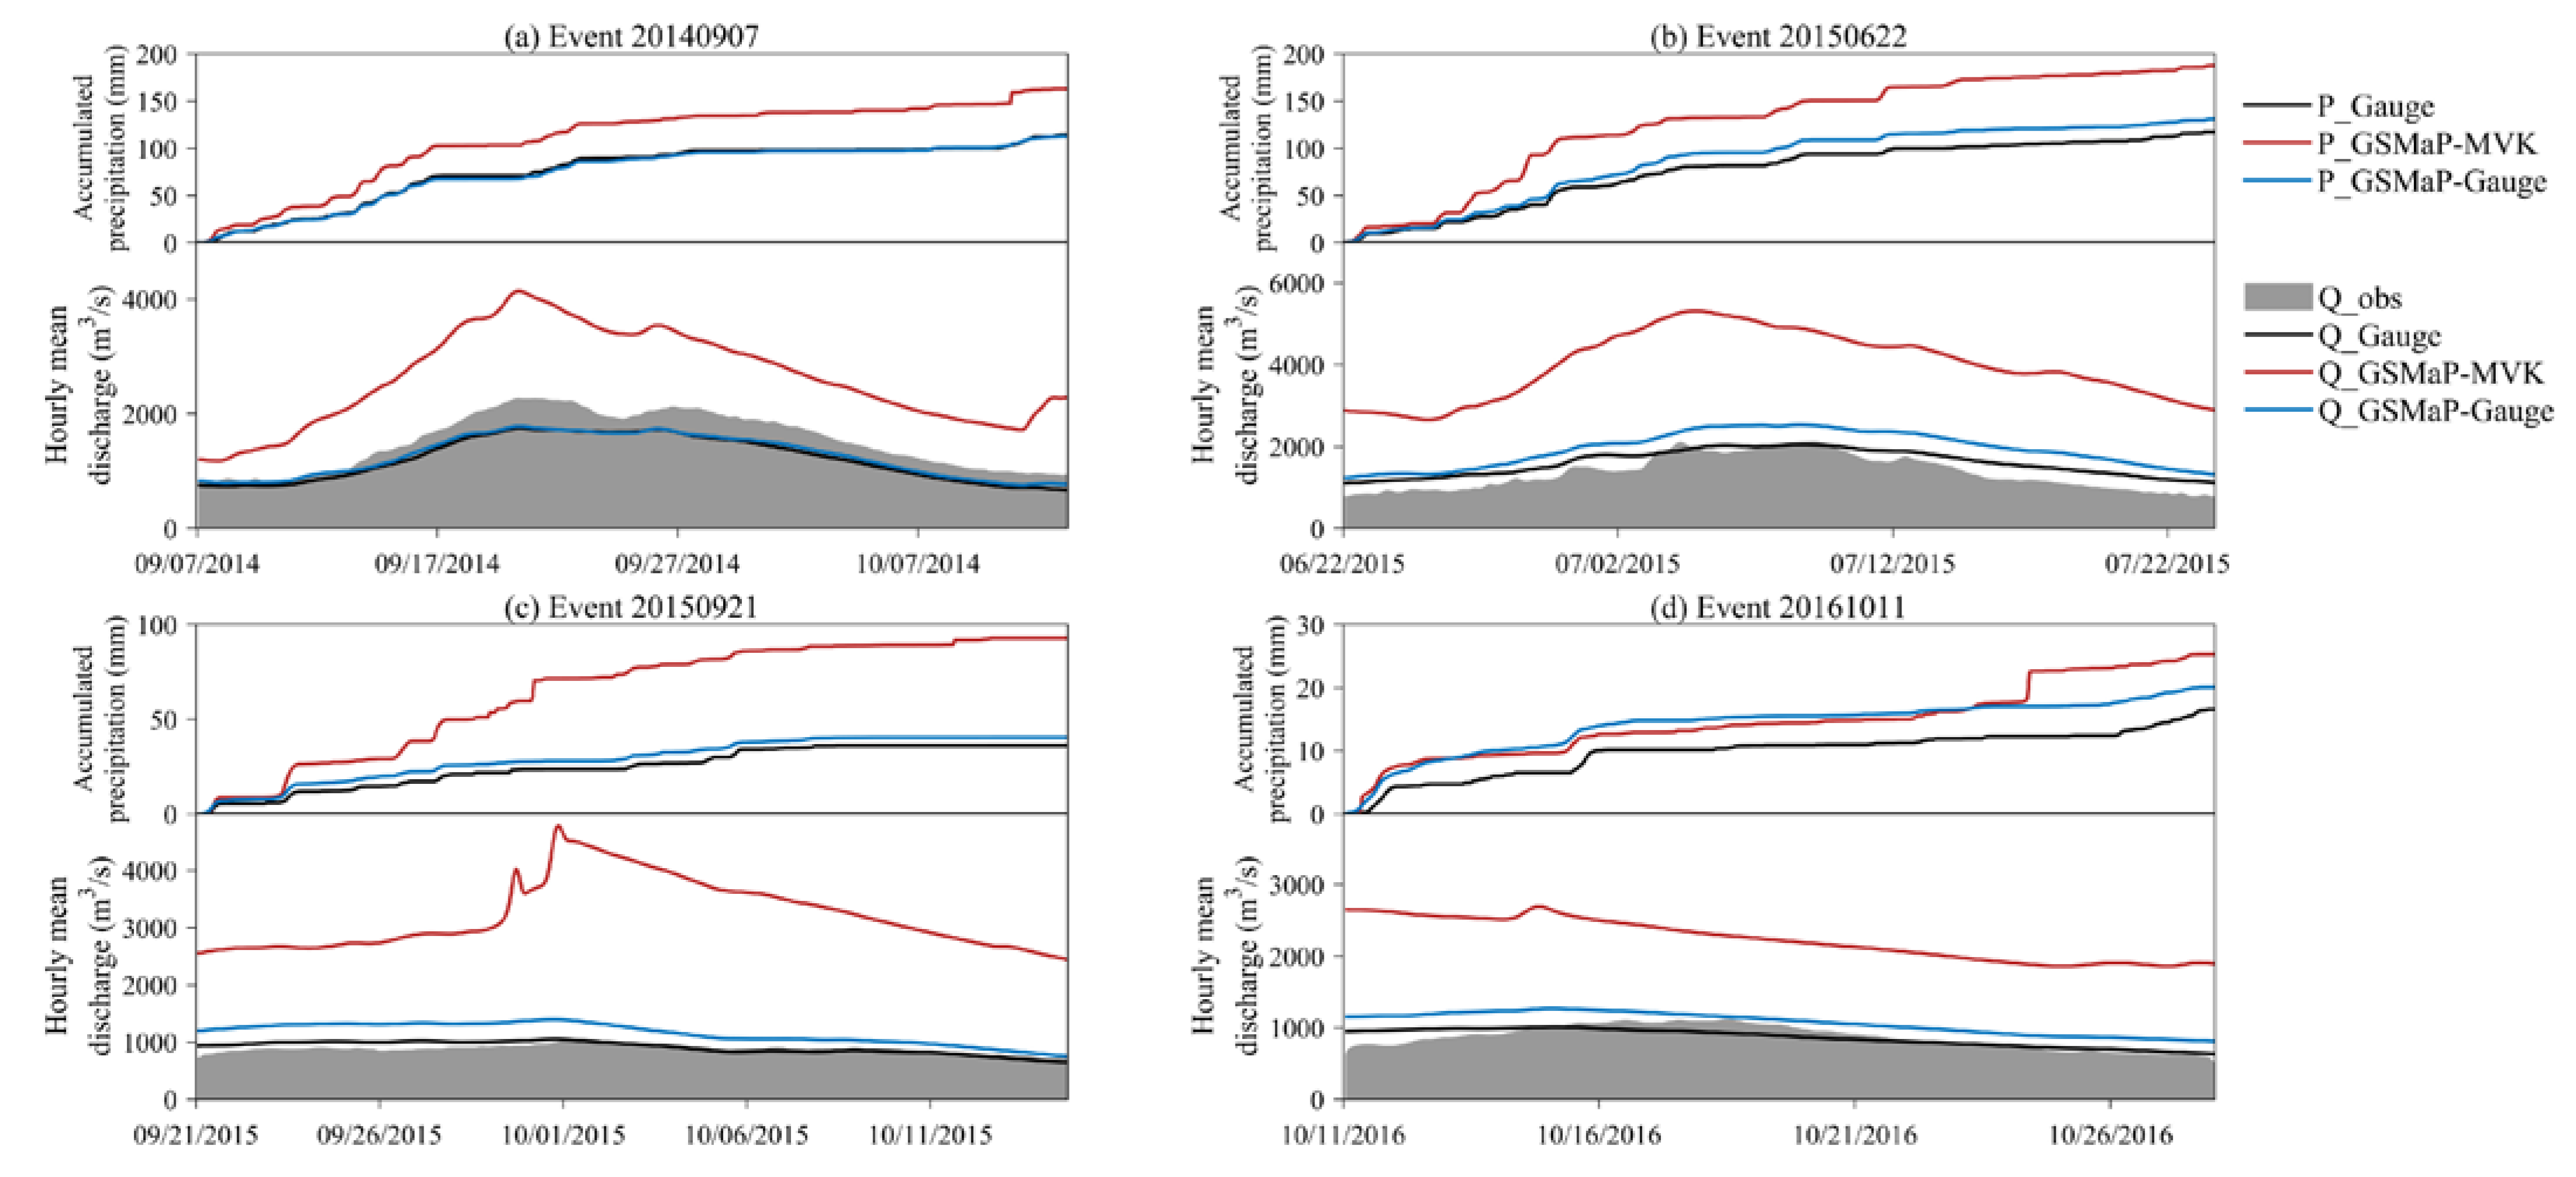
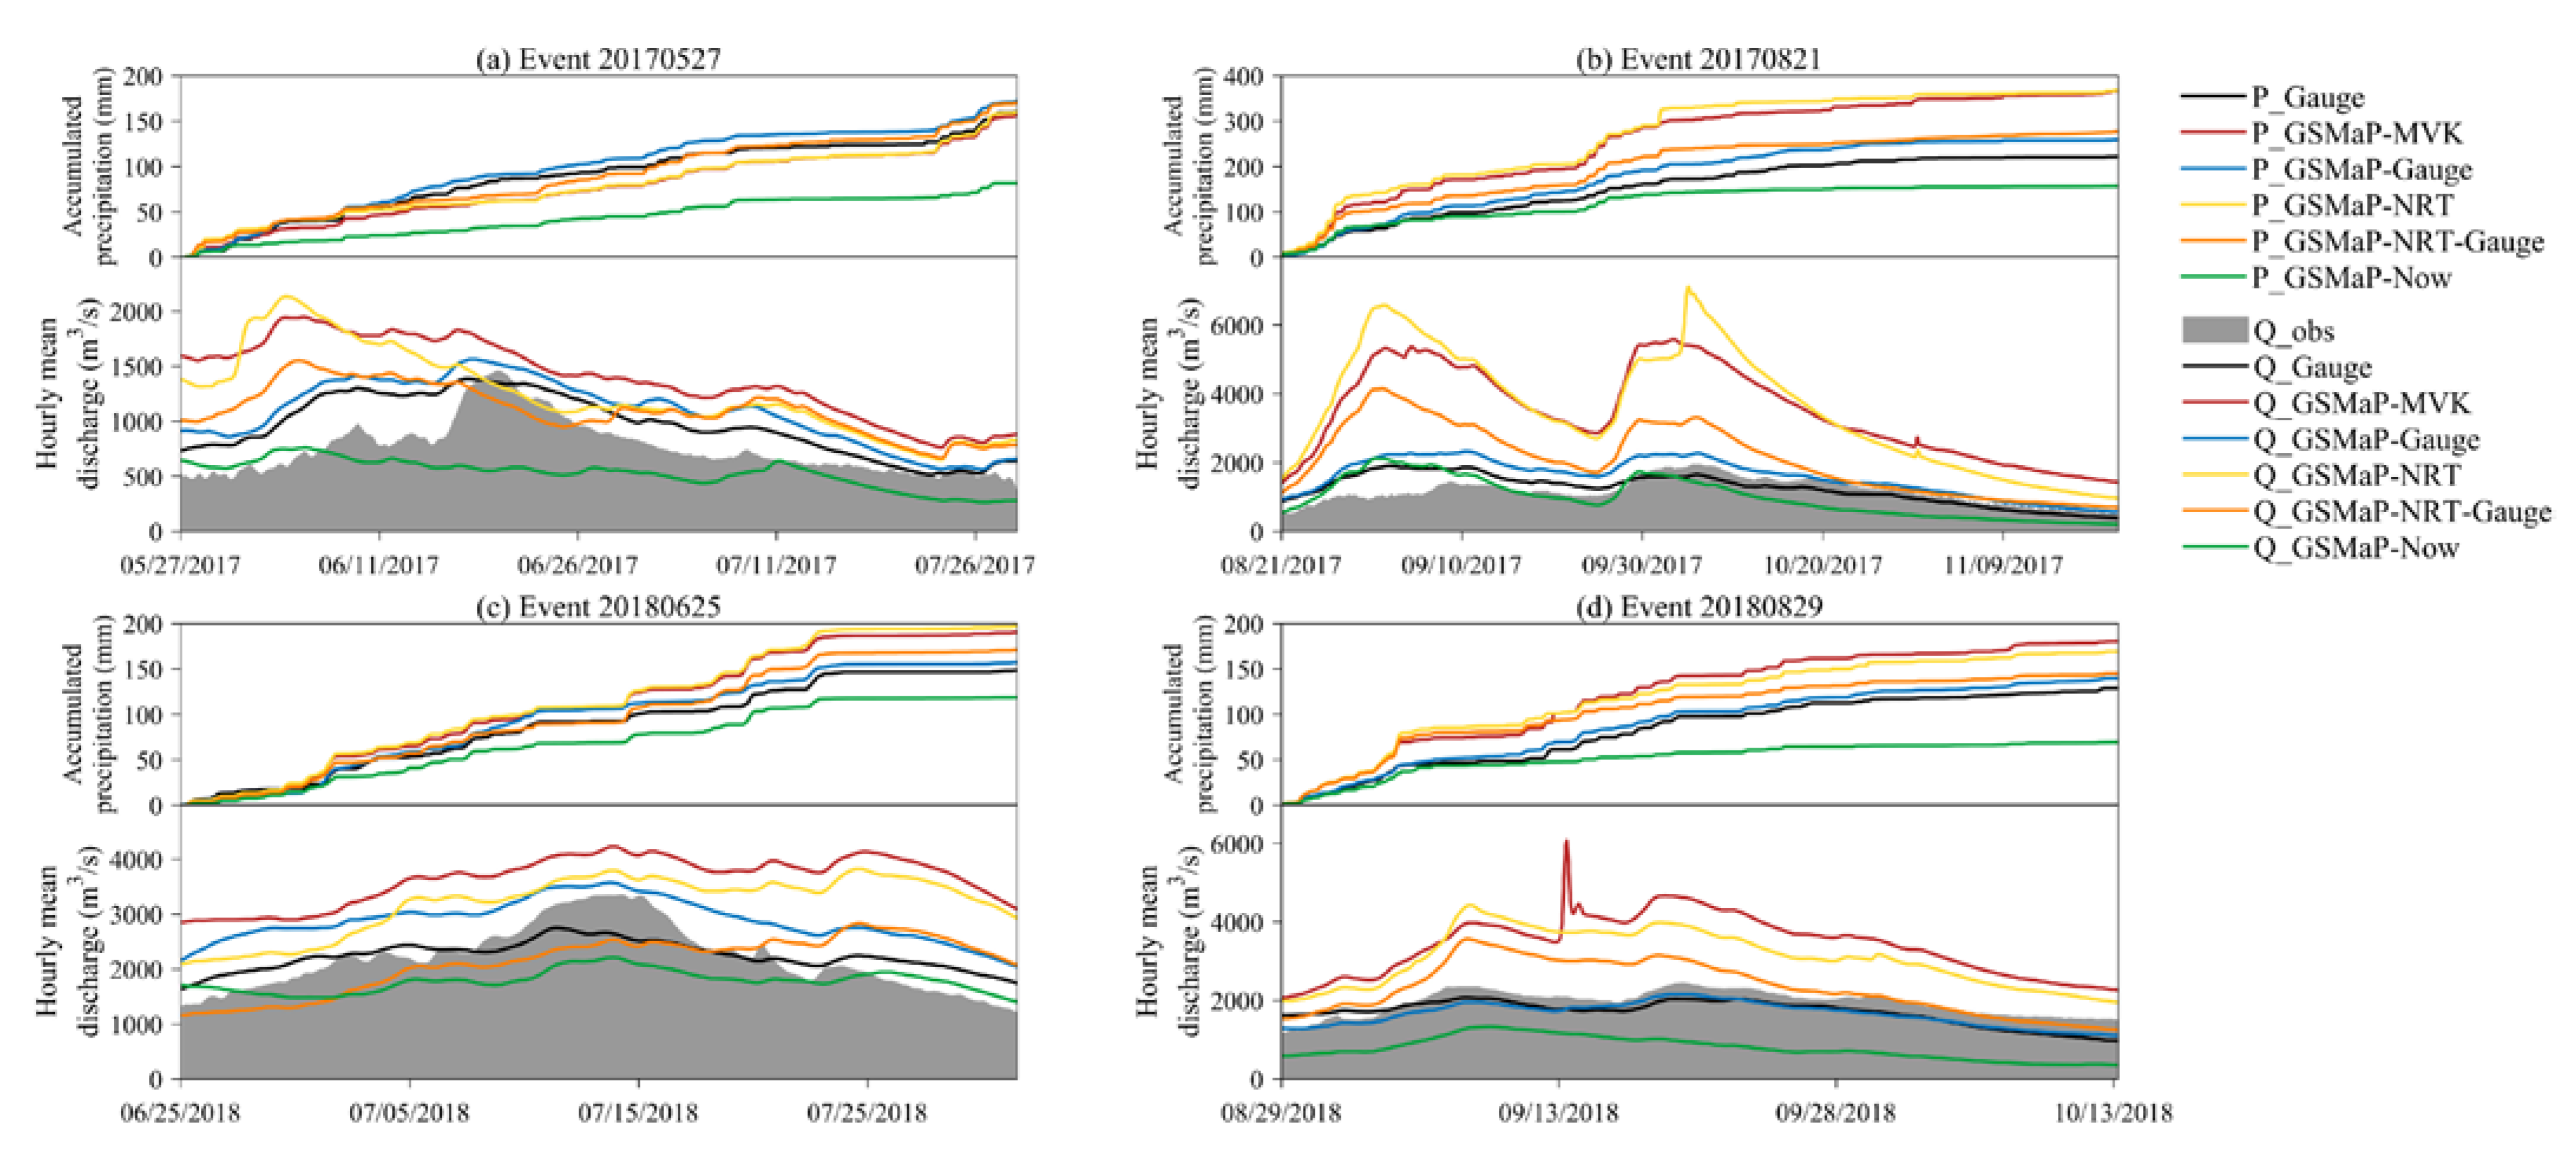

Publisher’s Note: MDPI stays neutral with regard to jurisdictional claims in published maps and institutional affiliations. |
© 2021 by the authors. Licensee MDPI, Basel, Switzerland. This article is an open access article distributed under the terms and conditions of the Creative Commons Attribution (CC BY) license (https://creativecommons.org/licenses/by/4.0/).